
Submitted:
12 August 2025
Posted:
13 August 2025
You are already at the latest version
Abstract
Change of land use and intensification of human activity significantly influence the sur-face temperature of the land, which is a basic parameter in climate change and balance of ecosystems. This study uses Landsat-9 data to analyze spatial and temporal distribution in Laut Tawar Sub watershed Surface Temperature Patterns and discuss major factors influencing surface temperature patterns. Integration of remote sensing data with geospatial analyses leads this study to establish that variations in LST are strongly controlled by topography, vegetation cover, degree of urbanization, and agricultural land conversion. The mapped results show that densely vegetated and water areas are relatively cool with temperature ranging from 9.5–17°C, whereas urbanized and converted areas demonstrate an obvious temperature increase as high as 25–32°C, supporting an important role of elevation, slope aspect, and vegetation in mitigating heat accumulation. The present study has implications for UHI mitigation measures, nature-based spatial planning and sustainable water resources management. Landsat-9 thermal data has a good potential to quantify the thermal pattern in detail, and this shall provide a great contribution to the climate adaptation strategies, including the local and regional habitat conservation efforts.
Keywords:
land use and land cover
; land surface temperature
; urban heat island
; Landsat-9
; Laut Tawar Sub Watershed
1. Introduction
Within the last decades its increased influence due to global climate change and the frequent alteration of land use and land cover (LULC) are serious challenges in e.g. environmental science and resource management. Because urbanization, deforestation, and agricultural expansion are becoming more prevalent across the world, the dynamics of land surface energy could substantially change [1]. Land Surface Temperature (LST) is an immediate response to these changes, characterizing the heat exchange between the land surface and the atmosphere. It is important to monitor LST for studying local and regional climate variation, the impact of urban heat island (UHI) and observing the general well-being of ecosystems [2]. Climate anomalies increasingly more severe and frequent due to human factors, A thorough analysis of LST supports the practice of effective plans in mitigation and adaptation to guarantee sustainable environmental management [3].
New achievements in satellite remote sensing have turned over our ability to observe ecological factors at a worldwide level. Late journeys like Landsat-9 give never seen before possibilities for top-notch, multicolored checking of the Earth’s surface. With better heat infrared sensors, it lets scientists catch small changes in surface warmth over time and across mixed land areas. Its clearer space and time detail plus trusted tuning ways help guess LST with much better exactness than earlier forms of satellite systems[4,5]. Such abilities are of huge advantage in those areas where rapid LULC changes occur and then relating such activities to measurable variations in the surface thermal characteristics. Integration of Landsat-9 data with state-of-the-art algorithms has lately been utilized by many studies to lessen the dependence of LST retrieval on external atmospheric profiles which were hitherto assumed to be more robust as well as cost-effective methodologies [2,5].
The Laut Tawar Sub Watershed, located in a region that is currently experiencing accelerated anthropogenic development, is an ideal natural laboratory for investigating LST dynamics. Encompassing a mosaic of LULC—from extensive agricultural fields and fruit plantations to emerging urban settlements and remnant natural vegetation—the area is subject to significant modifications from both natural and human-induced factors [6]. Over the past few years, local communities in the Laut Tawar region have experienced challenges related to water quality degradation, habitat fragmentation, and changing hydrological patterns. These issues are compounded by increasing demands on water resources and potential environmental disturbances stemming from industrial expansion [6,7]. Despite its ecological and socio-economic importance, comprehensive studies investigating the thermal regime in the Laut Tawar Sub watershed remain limited. Addressing this gap is critical in our current era of rapid environmental change, where understanding the drivers of LST variation can support both local management plans and broader climate adaptation strategies [8].
Multiple environmental factors are known to influence LST, ranging from natural components such as topography, vegetation cover, and meteorological conditions to anthropogenic elements like land conversion, urban sprawl, and industrial activity [9]. The process of urbanization normally encourages surface temperature because the natural covers are replaced with impervious heat-retaining surfaces [10]. In general, temperatures are lower in well-vegetated areas due to evapotranspiration and shading effects [11].
In the Laut Tawar Sub watershed, the interaction between traditional agricultural activities and the new pattern of urban growth makes a complex thermal mosaic that cannot be computed by conventional modeling techniques [12]. Recent research has underscored the need to integrate both natural and anthropogenic variables to fully articulate LST variation over such heterogeneous landscapes [13]. This requires high-resolution remote sensing data in combination with detailed information collected on the ground.
Recent global sustainable and environmental resilience has also led to heightened interest in monitoring LST as a proxy of ecosystem stress, on the impacts of climate change. Policymakers require spatially and temporally explicit data to guide their decisions on land management and urban planning because extreme weather events and thermal anomalies are nowadays observed, e.g., precipitation fluctuations or increased droughts [14]. The high-resolution, continuous, and near real-time thermal data from Landsat-9 enable records of slight temperature differences that may offer early-warning signals for environmental degradation [5]. Establishing baseline temperature distributions and long-term trend analyses assists in evaluating how effectively specific forms of local adaptation strategies – green infrastructure development and appropriate modifications of land-use policies meant to ameliorate the effect of urban heat islands work [15].
This study was designed to investigate the spatial and temporal patterns of LST in the Laut Tawar watershed and to identify the most significant natural and anthropogenic factors influencing these patterns. In this regard, the study aimed to map the distribution of LST among different land cover types within the sub-watershed using Landsat-9 thermal data (where we can quantify the influence of land cover changes—such as the conversion of forest or vegetation areas to agricultural or urban areas—on temperature variations) [6,16]. By achieving this goal, this study seeks to fill a critical gap in the current literature, providing a detailed assessment and integrating remote sensing data with geospatial analysis [17].
This investigation makes use of a multidisciplinary technique involving both remote sensing and Geographic Information Systems (GIS) in order to fulfill its research purposes. Thermal infrared images of Landsat-9 will be gathered and then preprocessed to extract the radiance values at the top-of-atmosphere, which will later be changed into brightness temperature using the standardized calibration coefficients. Furthermore, the normalized difference vegetation index (NDVI) will be obtained during the process to be used as the green cover proxy and the emissivity calculation will help to correct the brightness temperature to the surface temperature of the earth. Combining these datasets will allow for the creation of a thematic map of LST which will display not only the spatial distribution of the area but also the time intervals within which the phenomena of concern have been observed across the sub watershed [2,5,18,19].
On top of this, the changing states of the Laut Tawar Sub watershed also emphasize the importance of new and local studies. After increased climate uncertainties and fast socio-economic growth, frequent observations of surface temperature tendencies are a must for sustainable regional planning [19]. Local government and various environmental groups look in particular at how space changes through fire may alter thermal shapes, since they see the direct and indirect consequences of water and heat resources, agriculture, and urban comfort [20]. The knowledge from this study will help in drawing up the right use of land policy and the setting of the right adaptive procedures that can solve problems of heat and still ensure a good life for the words of the given organisms and human beings [21]. The generated LST charts and the forecast are intended to be a main resource for regional planners intending to maximize the good effect on the environment and at the same time be able to take in the future [22].
This study's importance goes even further than the Laut Tawar Sub watershed. Through the use of Landsat-9 data in complex, multi-use landscapes, the study confirms the broader thermal remote sensing domain [5]. In addition, the methodological framework crafted here could be used to other places with similar difficulties, which would provide space for the future study that could also take into account the integration of additional variables such as urban meteorological measurements or finer-scale LULC classifications [23]. Meanwhile, this research offers a holistic evaluation of both the spatial and temporal dimensions of LST, thereby, it can be used to better gauge the effects of climate change, LULC and ecosystem resilience not only locally but also globally [24]. Thus, it aids in the global conversation regarding sustainable development and climate change adaptation, which further indicates the importance of remote sensing technology in present-day environmental monitoring [25].
In a nutshell, in the present study, we wish to discuss the patterns and determine the land surface temperature in the ecologically and socio-economically important Laut Tawar Sub watershed using the newly launched Landsat-9 data. By comprehensive analysis involving multi-spectral thermal imagery and advanced geospatial techniques, this research not only contributes to scientific understanding of LST dynamics, but offers policy implications for implementation of effective measures to address environmental consequences of rapid LULC change. With ongoing climate variability that challenges traditional planning paradigms, this sort of study is necessary for building resilient and sustainable communities in the face of changing climate [26].
2. Materials and Methods
2.1. Research Location
The sub-watershed of Laut Tawar is situated in the Central Aceh District, Aceh, Indonesia, shown in Figure 1. This system of ecosystem is composed with lake waters, forests, agriculture lands and ever increasing human settlements. Laut Tawar Lake is the main water supply for the local population and is used for various economic purposes apart from being a habitat for native fish species and aquatic plants.
Laut Tawar Sub-Watershed is located at about 1,200 m above sea level with hill and valley topography that affect the flow of water and LST pattern. Climate and vegetation The region has a tropical highland climate with heavy precipitation, which is one of the key factors that affect the soil temperature and moisture. Moreover, LULC in the sub-watershed includes: protected forests (designated for conservation), coffee plantations (main economic activity), rice fields (which support local food security), and residential areas (which are increasing with socio-economic development).
Interaction between nature ecosystem and human activities take place within the Laut Tawar Sub-Watershed, therefore it has its own characteristic ecosystem. The ecosystem equilibrium and surface temperature pattern may be influenced by land covers variation driven by urban expansion and agriculture intensification. As a result, continuous surveillance of land-use change in this area is vital in maintaining ecological balance and sustainable development of the local residents. Studies on LST changes in this region can offer essential information for LULC and response to environmental change.
Interaction between nature ecosystem and human activities take place within the Laut Tawar Sub-Watershed, therefore it has its own characteristic ecosystem. The ecosystem equilibrium and surface temperature pattern may be influenced by land covers variation driven by urban expansion and agriculture intensification. As a result, continuous surveillance of land-use change in this area is vital in maintaining ecological balance and sustainable development of the local residents. Studies on LST changes in this region can offer essential information for LULC planning and response to environmental change.
The Laut Tawar Sub-Watershed natural and environment features has a significant impact on LST distribution in entire areas. The district is located in an elevated region with altitude of around 1,200 M above mean sea level, and the climate is cooler with regard to that of the low land regions. Yet within the sub-watershed there are local contrasts in heat, produced by differences in land cover, weather, and human practices.
2.1. Source of Data
The main data source in this study is satellite imagery acquired by the Landsat 9 satellite. Landsat 9 data for year 2024 are examined for the purpose of showing LST changes in this research. The time period is intentionally adopted as a reference date frame to be based on to analyze the change of present environmental condition of the Laut Tawar Sub Watershed. The satellite data can be freely accessed and downloaded from official repositories like USGS Earth Explorer and NASA Landsat Science for environmental monitoring or scientific use.
2.2.1. Data Characteristics
Landsat 9 is the most recent satellite in the Landsat program, and it lifted off on Sept. 27, 2021, as a joint mission between NASA and the U.S. Geological Survey (USGS). The satellite is a follow-on to Landsat 8, offering higher-resolution remote sensing for a variety of environmental applications - including LULC research and climate studies.
Landsat 9 acquires data at 30-meter spatial resolution (for multispectral bands) and 100 meter (for the thermal infrared bands) to support detailed Earth surface mapping. Device mixes 11 bands from visible and near-infrared, shortwave infrared and thermal infrared, thus enabling to make a functional land cover classification and to analyze temperature variance.
Landsat 9 carries two major instruments:
- Operational Land Imager 2 (OLI-2) – The OLI-2 captures images for the visible, near-infrared, and shortwave infrared ranges, and is used for vegetation studies, water quality tests and land monitoring.
- Thermal Infrared Sensor 2 (TIRS-2) – This sensor receives thermal emissions data which are used to report LST, heat anomalies and urban heat island effects.
Landsat 9 has a 16-day re-visit cycle, which means the same geolocation has a measurement every 16 days. This uniformity enables environmental change to be monitored over time and long term climatic adaptation studies. Landsat 9 has a higher (radiometric) resolution, meaning that it can differentiate between 16,000 shades of color for each pixel, and better identify subtle variations in the land and temperature compared to earlier satellites. This characteristic would be useful for studying thermal patterns in varied landscape, such as Laut Tawar Sub watershed. Using Landsat 9 measurements, researchers can obtain high-resolution land surface information, which can be a useful tool for land planning, resource management, and climate adaptation applications.
2.2.1. Data Processing and Analysis
The downloaded satellite images are preprocessed including radiometric calibration, atmospheric correction, and the cloud mask to improve quality of data and elimination of distortion. Afterward, supervised categorization methods are used to classify land cover into classes such as built-up lands, agriculture areas, water bodies, and greenery. These constructs provide a structure for examining the dynamic interaction between land cover change and surface temperature. LST is obtained by processing thermal bands of the remote sensing imagery with algorithms such as split-window algorithm after radiance values of the digital numbers of the bands is obtained before converting the temperature from Kelvin to Celsius.
2.1. LST Retrieval
The Methodology of the algorithm to be perform during LST estimation using TIRS Band 10 and 11 and OLI sensor Band 4-5. Process of estimating land surface temperature following six steps in ArcGIS [2,27].
First step: Conversion to TOA Radiance. Thermal infrared remote sensor (TIRS) data converted to spectral radiance (Lλ) using the radiance rescaling factors provided in the metadata file by using the given formula as:
Lλ=MLQcal+AL
Where: Lλ = TOA spectral radiance (Watts/(m2 * srad * μm)), ML = Band-specific multiplicative rescaling factor from the metadata (RADIANCE_MULT_BAND_x, where x is the band number), AL = Band-specific additive rescaling factor from the metadata (RADIANCE_ADD_BAND_x, where x is the band number), Qcal = Quantized and calibrated standard product pixel values (DN)
Second step: Conversion to At-Satellite Brightness Temperature. Top of Atmospheric Spectral radiance(Lλ) data converted to brightness temperature (TB) using the thermal constants (K1 AND K2) provided in the metadata file.
TB= K2/ (Ln (K1/Lλ+1))
Where: TB = At-satellite brightness temperature (K), Lλ = TOA spectral radiance (Watts/ (m2 * srad * μm)), K1 = Band-specific thermal conversion constant from the metadata (K1_CONSTANT_BAND_x, where x is the thermal band number), K2 = Band-specific thermal conversion constant from the metadata (K2_CONSTANT_BAND_x, where x is the thermal band number).
Third step: Calculation of NDVI value. Estimation of Normalized Difference Vegetation Index (NDVI) using OLI sensor optical Band after layer stacking of Band 4,5 using algorithm shown in equation-3 (Range: -1 < NDVI < + 1).
NDVI=(NIR-RED)/(NIR+RED)
Where NIR (Near-Infrared) refers to Band 5, representing reflectance in the near-infrared wavelength, while RED corresponds to Band 4.
Fourth step: Calculation of Pv. Pv represents the proportion of vegetation was estimated using NDVI Threshold method, using the following equation:
Pv=((NVDI-NVDImin))/(NVDImax-NVDImin)2
Where: NDVI represents the NDVI value at a specific location. NDVI_min is the minimum NDVI value, typically indicating bare soil or non-vegetated areas, while NDVI_max represents areas with dense vegetation.
Fifth step: Calculation of Emissivity value. To obtain LST, the brightness temperature must be adjusted using a scale that incorporates the surface material emissivity (ε) [2], using the following equation.
∈ =m Pv+n
Where: m = (εv − εs) − (1 − εs) Fεv and n = εs + (1 − εs) Fεv, where εs and εv are soil emissivity and vegetation emissivity. This study used a value of n and m 0.004 and 0.986, respectively [28].
Sixth Step: Estimation of LST. The calculation of LST is performed using the corrected image emissivity, as described in Equation 6.
LST=TB/ (1+( ℷx TB/(ρ)) ln(ε))
Where: TB = at-sensor brightness temperature effective in degrees Kelvin, TB = represents the satellite brightness temperature in Kelvin, obtained from satellite imagery data, λ = The central wavelength of the satellite sensor (for Landsat, the thermal infrared wavelength value is used), ρ = The thermal radiation constant (h.c/σ), where ℎ is Planck's constant, c = is the speed of light, and σ = is the Boltzmann constant. After this calculation, the LST values are converted from degrees Kelvin to degrees Celsius (°C).
3. Results
3.1. LST Distribution in the Laut Tawar Sub Watershed
Presents an image of the LST distribution throughout the Laut Tawar Sub watershed, as extracted from the Landsat 9 imagery acquired in 2024 is presented in Figure 2. This number is fundamental for the comprehension of the complexity of the thermal dynamics in the region that are driven by a convoluted combination of natural features and human made interferences.
The spatial pattern of LST of the Laut Tawar Sub watershed was presented in Figure 2 that was retrieved from Landsat 9 scene, passed 2024. This image provides an integrated view of the thermal behavior of the region due to natural and anthropogenic influences. According to the map presented in this study LST has different color bands which means it's distribution has a significant variation in the study area. Regions displayed in green (9.5–17°C) delineate locations with relatively constant cooling conditions—probably due to the presence of heavy cooling vegetation or water bodies that are behaved as cooling sources. Light green (18–19°C points) instead reveals moderate increases in temperature, as may be occurring in areas where land cover is transforming.
The yellow (20–21°C) and orange (22–24°C) regions represent warmer temperature zones, probably affected by anthropic influence (e.g., urbanization or intensive agriculture), leading to a decrease in green cover and shielding potential and an increase in solar radiation absorption. The red (25–32 °C) map units indicate areas inferring high thermal conditions which may potentially feel the effects of urban heat island (UHI witness) especially in fast growth residential centers.
Furthermore, the rivers connected to the map are all colored blue. These bodies of water can have a dilation cooling effect that helps to dole out the various temperatures over the region. Topography—hills and valleys—is a significant factor in the temperature distribution, as the terrain affects both air movement and the amount of direct exposure to the sun. In general, this LST map offers a complete understanding of the relationship between LULC, natural factor, and human activities in controlling LST variation in the Laut Tawar Sub-Watershed.
3.1. Spatial Patterns of Land Surface Temperature and Factors That Influence It
The LST spatial distribution of the Laut Tawar Sub watershed is determined mostly by different environmental conditions, namely, topographic and land cover factors. Here, we explore how the region's distinctive topographic features, such as hills and valleys and elevation differences, shape local air movement and sun exposure to modulate thermal conditions. At the same time, varying land cover from densely planted surfaces to urban development plays an important role in temperature response as a result of changes in albedo, evapotranspiration, and shading. Taken together these factors establish a highly complicated thermal mosaic that is a mixture of the natural landscape as well as the human input [29].
3.2.1. Tofography
Dispersion of LST in the Laut Tawar Sub watershed appears to be topographically controlled, where happen valley down to lowland areas with vegetation (high moisture) and water bodies have cooler temperature except in hill and open slopes as seen in Figure 3.2, where ample solar gain resulting in warmer condition. Figure 3 shows the topographic map of the Laut Tawar Sub-Watershed which possibly presented with variation of elevation, slope aspect, and landform are the primary factors affecting the LST distribution in the study area. Topographic features also strongly influence the spatial distribution of LST in the Laut Tawar Sub watershed. The map makes it clear that the darkest green shaded areas (apparently cooler from 9.5–17°C), are generally places on flatter land mass (valley) or areas shadowed by dense forest and close proximity to bodies of water where natural cooling occurs. These pits offer shade and humidity, and exhibit lower surface temperatures even when temperature is higher in the direct surroundings.
On the other hand, light green (18–19 °C), yellow (20–21 °C), orange (22–24 °C) and red (25–32 °C) colorizations reflect less shaded and high-elevated zones, namely peaks and steep slopes. Such positions are subject to increased incident solar radiation simply due to limited obstructions/shading and more open exposure, resulting in higher ground temperature records. The map’s blue lines indicating rivers also highlight the cooling effect of water, which moderates warming, particularly in low-lying neighbors.
Thus, the elevation, slope exposure, and land relief play important roles in determining the spatial patterns of LST distribution in the Sub watershed as shown in the topographic map. It is this acute spatial relationship between topography and temperature variation that plays a key role in driving LST dynamics in the region. Drawing from these observations, the temperature ranges within the sub watershed are detailed in the table below, connecting each zoned color to a unique and targeted topographic and land cover context, see Table 1.
Full information on the distribution of temperature gradient in the Laut Tawar Sub-Watershed has been presented in Table 1. This table seems to give ranges of temperatures at different elevations for every 100 meters off the ground, perhaps to display over that particular range in elevation how the earth’s temperature will vary.
Temperatures near the surface are higher in regions with lower terrain elevations, i.e., 900–1200 m MSL, during 20–21 to 22–24 temperature ranges. This state results from the high degree of solar radiation and lower vegetation cover found in lowland areas. It is also the elevation range when temperature falls to 18–19°C or 20–21°C as they may gradually become affected by a more natural-dominated landscape, with denser vegetation and water bodies increasingly contributing to reduce the temperature reaching the ground (e.g., through evapotranspiration).
In localities with higher altitudes (1600–2000 meters above sea level), temperatures are lower and vary between 9.5–17 up to 18–19 °C, conditions typical of high-altitude valleys that have dense trees and numerous water features, which are a natural cooling factor. However, at altitudes of 2100–2400 m, the surface temperature between 9.5°C and 17°C tends to be a steady stable microclimate with minimal fluctuation of extreme temperature. This may be due to the presence of factors such as high humidity and long-lasting vegetation cover, that prevent natural cooling from occurring quickly.
The data shown in Table 1 offer compelling evidence for the influence of elevation on surface temperature distribution and highlight the role of topography as a determinant of the temperature patterns in the domain.
3.2.1. LULC
This visual framework is necessary for visualizing the complicated symbiotic relationship between LULC milieu of Laut Tawar Sub-Watershed, and serves as a precursor to the examination of how different landscape elements contribute to thermal responses at the local level (see Figure 4).
And from Figure 4, it can be seen that there is a positive difference in LULC from Laut Tawar Sub-Watershed. This map provides a classification of land use that includes multiple classifications such as primary forest and vegetation, agriculture land, settlement or urban, and water. Certain areas of forests and thickets, usually in upland and valley landscapes, act as natural coolants via such physical mechanisms as evapotranspiration and the retention of moisture. This situation explains the fairly low temperature range, and is supported by the behavior of LST as related to topography in the area.
On the other hand, LULC categories included high intensive agricultural activities and urban, which show a marked decline in vegetation coverage. This change leads to more solar radiation absorption and higher surface temperatures. Take urban areas, for instance, which tend to experience the heat island effect because surfaces are dominated by materials, like concrete and asphalt, that are not equipped for natural cooling. What’s more, the prominent water presence (revealed by LULC map) servers as cooling corridors, and water bodies, such as rivers, and lakes, can bring down local temperature with the cortical behavior of hydrodynamics.
The LULC type from this map benefiting from the high-resolution satellite imagery and fundamental topographic data was classified and accurate for each class. Therefore, the LULC map not only presents land-use pattern but also serves as an effective base of data for the study of the relationship between human-disturbance factors and physical environment, especially in terms of surface temperature variations in this region. According to this classification, the LULC area is described in details, and this database gives the classification of LULC into each spatial unit classification (Table 2).
The data in Table 2 offer important information for understanding the impacts of changes in LULC on patterns of surface temperature and regional ecology. From Table 2, the proportion of different LULC patterns in the study area can be enumerated, reflecting an apparent correlation between LULC and the thermal environment in the region. Thick clouds on the table and another large chunk of the Amazon clouds on the Chart play a major role in controlling the surface temperature, especially on the humid highlands. Vegetation helps with the evapotranspiration process naturally reduces temperature and cools the environment thus making it cooler than very exposed regions. The close acquaintance between forests and temperature, means that for areas that are densely covered with vegetation, the temperatures are usually lower in contrast to the more open areas.
In contrast Agricultural land use in particular does show an increase in surface temperatures, especially over different altitudes. Conversion of natural vegetation into agricultural land reduces the capacity to retain moisture and enhances exposure to solar radiation, resulting in higher temperatures. Larger agricultural lands display higher thermal impacts than forested area indicating that land cover plays an important role in moderating surface temperature.
Urban and settlement have a smaller share than natural zones as shown in the table but have an important influence as to temperature. Urban heat island effect is more evident in the urban areas of the world, where concrete and asphalt surfaces dominate and capture excessive heat. The transformation of land for infrastructure and for housing means the Manaus area is rapidly heating up – significantly hotter than zones of forest or wetland.
The table also shows the function of water bodies in adjusting the temperature. Rivers and lakes provide natural cooling veins that help to stem dramatic fluctuations in temperature. The T distribution data suggest that the areas around the water bodies would have a relatively high heat stability, compared to the dry, exposed parts. The hydrologic effect of these water bodies have a profound influence on local microclimates. Based on this appreciation, Fig. 5 presents a breakdown of the proportional share of the various LULC classifications in the Laut Tawar Sub-Watershed.
Percentage of area coverage by land cover types is tabulated in Table 2 and presented in Figure 5 The LULC distribution in the Laut Tawar Sub-watershed indicates different LULC are driven by a process of ecotypes interacting with LST dynamics. This distribution reveals how varied land cover properties influence the surface temperature variation, where water bodies, as well as vegetation, have significant impact on the thermal balance.
Lakes are the biggest class in the map, accounting for 39%. LST is mainly stabilized by temperature memory and heat distribution capacity of water bodies including lake (river) water in regions with abundant water. At the same time, the 15% of coverage forest is a carbon sink and has the characteristic of surface cooling with evapotranspiration. Thick vegetation plays an important role in preserving thermal steadiness of a region.
Grasslands, which account for 11% of the sum area, are transitional landscapes that can experience larger temperature variations than forests and at the same time contribute to the LST mitigating functioning. Residential and business sections of the city account for 10% of the surface and display raised temperatures compared with the surrounding, less developed areas of LA. These higher temperatures are a result of the built surfaces; concrete and asphalt, which absorb and release heat, increasing the urban heat island effect.
The second largest coverage of moderate forests (8%) represents an open forest in temperature regulation as a more diverse surface and less influence of the temperature moderated dense state (dense forests) with a more open structure and, the sparse forest (6%), due to its more scattered vegetation covers has a more reduced effect on temperature mitigation. Plantations, contributing 6% as well, may exhibit diverse LST patterns according to the present crops and the management systems. Finally, rice fields (with the lowest fraction at 5%) bring the largest cooling effect relative to the other land categories, given that the presence of water influences the surface energy partition.
4. Discussion
4.1. LST Distribution Patterns
The LST from Laut Tawar Sub watershed showed stark contrast between the area of lower temperature (9.5–17°C) which cover vegetation as well as water body and the area of higher temperature (25–32°C) areas influenced by urbanization and agricultural intensification. Figure 2, was constructed at a scale of 1: 200,000, and represents the classification of temperature boundaries while looking at classes to show how the surface temperatures are geographically distributed throughout the Laut Tawar Sub watershed. This characterization highlights the differences in LULC, that comprise areas dominated by natural vegetation and water bodies, as well as areas affected by human actions – urban expansion and intensification of agriculture.
The distribution of LST in the same area is the analysis of the value. In areas with low LST values (9.5–17°C), the significance of vegetation and water dominates the cooling effect naturally [30]. Vegetation and water bodies with their high heat capacity, enable gradual dissipation of heat, resulting to micro-climatically cool environment and favorable condition for ecosystem structure and function. The presence of the phenomenon has been well-documented in the international literature with green cover causing the stabilization of variations in the surface temperature [3].
However, such human impacts are indicated for the higher temperature (25–32°C) regimes. Urbanization, itself typically associated with building materials (e.g. concrete and asphalt) use, and agricultural intensification both usually lead to a decrease in vegetation cover and higher heat-retention. This results in the creation of UHIs, in which higher surface temperatures dysregulate the local microclimate equilibrium and extend their impact on environmental quality and public health [31]. The study by Kowe et al. (2022) and others that assessed the spatial arrangement of built-up areas), which found that land transformation had a considerable impact on LST by diminishing natural cooling mechanisms and increasing heat radiation [32].
In addition, the observed temperature gap, such as 18–19 °C, 20–21 °C, and 22–24 °C, reflects the spatial pattern of transitions in LULC. Such transitions mirror the peri-urban, where there is a blending of natural and built in sign, a potentiality of modify and change over time in a sustainable spatial planning [33]. This pinpoints the significance of the Urban planning solutions integrating green solutions to reduce thermal effects which have been the focus of Urban Microclimates study indicating the impact of LST with NDVI [3].
The spatial distribution of LST in the Laut Tawar Sub watershed not only reflects the thermal environment of this region, but also reflects the influence of natural and human factors. Cold spots highlight the importance of vegetation and water bodies as natural cooling factors of the local environment, while hot spots reflect the influences of urbanization and agricultural intensification, leading to higher surface temperature [34].
4.2. Topography and LST Variations
Topographical map combined with the distribution of LST is shown in Figure 3, which profiled the temperature changes with the different elevation in study area. From the quantitative data of Table 1, it can be seen that in the lowest areas (about 900-1200 m a.s.l.) LST values are relatively higher (20 to 24°C), while higher areas (1600‒2400 m) demonstrate a remarkable decrease of LST (9.5 to 17°C) and in some intermediate elevation bands, LST are around 18‒19°C, indicating a significant temperature decrease with increasing altitude that can be attributed to what the environmental lapse rate principle illustrates, where the air temperature systematically decreases with increasing height as it becomes above sea level [35,36].
It can be observed from Figure 3 that elevation differences do not fully determine the distribution of LST; it is also affected by a series of topographic factors, such as the direction of slope, gradient, and the distribution of some natural elements (e.g., vegetation and water body). Low altitude areas are mostly open areas with direct solar radiation exposure, and are therefore warmer than high-altitude areas on LST maps [27]. On the other hand, more elevated zones are mainly covered with dense vegetation and water masses that act as cooling agents due to evapotranspiration and heat storage, leading to lower surface temperatures. This is in agreement with the results of the study carried out by Navarro-Serrano et al. (2020) by pointing out that shading and local air circulation would counteract temperature increments at steep slopes in complex topographical settings [37].
The addition of data derived from Figure 3 and Table 1 is crucial to an understanding of the microclimatic tendencies associated with altitude differences. The warm thermal environments on flat terrain (20–24°C) might enhance urban UHI effects, even if associated with heavy anthropogenic load; whilst cold noises on high terrain (9.5–17°C), in response to altitude ascent, serve as natural responses of increasing elevation [27]. A study by McGuire et al. (2012) in the Rocky Mountain Front Range illustrates that cooling trends with increasing elevation have tangible implications for climate adaptation planning, including precipitation that can be used for water management and microclimate-informed spatial planning [36].
Results from Figs. 3 and Table 1 do not only confirm the decrease of LST as elevation increases, but also provide evidence that a multi-dimensional view is needed for modeling the dynamics of the land surface temperature. Combining remote sensing with topographic data makes it also possible to produce more accurate predictive models, predicting the temperature distribution in heterogeneous topographic areas [38]. This approach has become common in recent studies which have used elevation adjustments to regional temperature trends and shown that dynamic lapse rate models improve climate risk estimates for adaptation or planning efforts [35,39].
Therefore, the LST pattern in the Laut Tawar Sub watershed is significantly controlled by the topographic features, which also determine LULC. Higher elevation areas are also play an important role because they contain water bodies and thick vegetation cover would have lower values of LST while the flat or valley topographic urban and agriculture sectors can have temperatures increase [40].
4.3. LULC and LST Distribution
Comparing the spatial distributions, as illustrated by the LULC classes maps in Figure 4, Table 2 and Figure 5, reveal a spatial variability throughout the study area. Water is prominent (39.5%), followed by dense forests (15.2%), open land features: grasslands (10.6%) and built up areas (10%). physio graphically, lowland and valley locations are favorable for the existence of water bodies and dense vegetation, while flat terrains and low slope areas are generally urbanized or developed as agriculture land [41]. These environments suggest that the topography directly controls the land cover types and these land cover types in turn affect the distribution of LST through shading effect, evapotranspiration, and heat storage [42].
Physically, topography has a quasi-two roles in inducing the LST distribution. In the first stage, directly, we have variables such as elevation, slope, and aspect that in this way control how the surface will receive the sun radiation. Sun-facing slopes (e.g., south-facing in the Northern Hemisphere) typically receive greater radiation intensity, leading to higher LST values [43]. Second, the land cover patterns are influenced by topography. Valley floors, where both water flow and dense vegetation are found, can have a cooling effect due to evapotranspiration, while urban and agricultural land, located in flatland, where deforestation is also a common practice, leads to higher heat storage, increasing the UHI effects [44].
Observation of Table 2 and Figure 5 confirms this interpretation. Areas with high proportion of water bodies and forests (about 55% in total) have a relatively low LST values, mainly because of the more capacity for heat storage and natural cooling effect. On the other hand, even though developed land occupies about 10% of the study area, impervious surfaces, such as concrete and asphalt, possess a high heat-storage capability and a low albedo, which can induce local surface temperature elevations. The results are in accordance with those of Navarro-Serrano et al. (2020) [37] which reveals that topography and land cover types play a vital role in temperature across mountain valleys, and the work of Feng et al. (2025), which emphasize topographic effect offsetting anthropogenic contributions on LST warming [45].
The association of LULC and topographic variables can provide important information on LST distribution, which has important implications for spatial planning and climate adaptation action [39,46]. According to the analysis, the areas with the topographical condition of support water bodies and forest ecosystems have lower LST, inducing thermal buffer effects in order to stabilize the microclimatic environment. Thus, conservation and enhancements of green cover in these sites need to be promoted through mitigation strategies for UHIs and extreme temperature increase [46,47].
The LULC classification findings are supported by LULC analysis based on the LULC classification results, that the topography directly and indirectly influences the LST distribution in the Laut Tawar Sub-watershed. Elevation, slope and direction contribute in the exchange of solar radiation, in LULC changes that disturb natural cooling mechanisms and accumulated heat [40,48].
4.4. Landsat-9 Data in LST Measurement
Landsat-9 represents a substantial processing upgrade from the previous Landsat generation, due primarily to improvements in calibration and sensor performance. Landsat-9’s TIRS-2 sensor is able to detect 16,000 shades of colors for each pixel, and can thus produce very sensitive thermal images that show the subtlest temperature differences. Improved calibration methods reduce the systematic errors usually present in LST measurements [49].
The disadvantage of the traditional LST inversion methods is that they rely on the input atmospheric profiles and external emissivity values which often are not available for real time processing. Such studies as described by Ye et al. (2023), focus on the application of ensemble learning-based algorithms to on the external parameters. By using high-level products owning advanced products such as atmospheric water vapor indices, direct brightness temperature, the bias of LST is decreased and the accuracy and consistency of LST retrieval are enhanced by this method, and this will be more suitable for long-term continuous monitoring [5].
Comparative analyses with LST products of Landsat-7/8 reveal that the accuracy of the LST retrieval is improved for Landsat-9, such that the RMSE with the compared products is reduced. User testing and field validation demonstrate that Landsat-9 LST products are consistent with in situ measurements and thus strengthen the reliability of the latest sensor in the detection thermal variation over urban and natural areas [49,50]. Cross-validation from the radiative transfer model and split-window algorithm also shows that Landsat-9 produces reliable results under different atmospheric conditions.
This advanced Landsat-9 approach for LST estimation is highly relevant for climate research and LULC purposes. With good sensitivity to temperature change, this data can be used for in-depth research on urban heat island effect and land-use conversion, and can also be used to establish ensemble learning-based forecasting models that combine spatial information with meteorological factors, which will reduce the reliance on various complex external input [51]. Applications also have practical significance such as Land-Use Planning and Climate Adaptation Policy using real LST for energy efficient infrastructure and green urban solutions; Environmental Monitoring and Ecosystem Resilience through the provisioning of hotspots [47] as well as Scientific Advancements by using the Landsat-9 in coupling with numerical models and developing novel algorithms for long-term spatial mapping [52].
4.5. Implications for Spatial Management and Climate Adaptation
The resulting LST map from Landsat-9 images, its spatial analysis and mapping technique are indeed useful for spatial planning and management of water resources. Utilizing a more specific description of temperature distribution, the LST map is able to reveal surface UHI effects (portions of the landscape surface with increased temperature as a result of impervious surface materials such as concrete and asphalt) and cooling zones related to water bodies and vegetation [53]. Such information can be used by planners to decide on zoning where green park and water body conservation as thermal buffers can be maintained and water to decision to be taken on water supply the street that are susceptible to heat stress need protection of water [54]. This is consistent with the results of Navarro-Serrano et al. (2020) [37], in which the relevance of combining remote data for decision making in urban planning and water management were emphasized.
Additionally, the results of this research form a basis for undertaking adaptation and mitigation measures and reducing heat stress effects in cities. Possible measures include creating green infrastructure (urban green spaces, green corridors, green roofs, natural drainage), which acts as a heat sink and increases evapotranspiration. Use of land management policies that favor vegetation conservation and eco-friendly materials can contribute to reduce heat buildup in the urban context as well [55]. Such approaches can help reduce the temperature at the surface, and also improve the environmental quality and reduce energy demand for cooling buildings. This is in line with the findings of Al-Shaar et al. (2022). [56] that also emphasize the positive role of green infrastructure on reducing UHI effects and enhancing well-being condition of an urban environment.
This study also greatly improves the ability of the ecosystem to tolerate and recover from satellite fragmentation. The detection of the high thermal stress areas enhances the rationality of ecosystem rehabilitation measures, such as reforesting, water body rehabilitating, and greening. "The joint research by Germany and India on biodiversity covers an entire range in the subject matter of ecosystem services in which it simulates sustainable development and the adaptation to climate change. The data retrieved from Landsat 9 will be helpful for modeling and numerical mapping, and when incorporated into predictive models and numerical analyses, will act as an assessment for planning of environmental intervention at local and regional levels. These results are consistent with those of Wang et al. [57] and Kustura et al. (2025) [25] that highlight the key role of remote sensing data for strengthening climate adaptation potential and for increasing ecosystem resistance in response to global climate change pressures.
5. Conclusions
This study indicates that the distribution of LST in the Laut Tawar Sub watershed is mainly dominated by the interaction of topographic factors, LULC, and environmental conditions. The relationship between variations in elevation, slope aspect, and land cover, including water bodies, dense vegetation, and urban and intensive agriculture areas, also causes complex thermal patterns in the study area. In valleys and in areas with wide vegetation and water-body coverage lower LST are apparent, while developing urban and agriculture land conversed areas (urban heat islands) are characterized by high temperatures, which is an indication for lack of natural cooling processes.
The applications are numerous, especially for local and regional environmental management t and spatial planning. The LST estimated from Landsat-9 data can be seamlessly used for zoning regulation, thermal stressed area identification, and highly efficient resources allocation, especially for water resource management and GI construction. Accurate thermal information will enable policymakers to formulate adaptive policies and interventions to reduce the impacts of climate change, whilst improving overall living standards in cities.
These findings suggest that LST should be systematically considered as a component of land management and spatial planning policies. Data-driven policies are indispensable: they can spur climate-friendly and sustainable urban development that includes more green spaces, the protection of bodies of water, the use of materials and infrastructure that do not absorb heat, and more. As a result, how we use remote sensing, including from Landsat-9, can be a key mechanism for mitigating and adapting to climate change and promoting sustainable development at the local and regional scales.
Abbreviations
The following abbreviations are used in this manuscript:
| LST | land surface temperature |
| LULC | land use and land cover |
| UHI | urban heat island |
References
- Pongratz, J.; Schwingshackl, C.; Bultan, S.; Obermeier, W.; Havermann, F.; Guo, S. Land Use Effects on Climate: Current State, Recent Progress, and Emerging Topics. Curr Clim Chang Reports 2021, 7, 99–120. [Google Scholar] [CrossRef]
- Achmad, A.; Fadhly, N.; Deli, A.; Ramli, I. Urban growth and its impact on land surface temperature in an industrial city in Aceh, Indonesia. Lett Spat Resour Sci 2022, 15, 39–58. [Google Scholar] [CrossRef]
- Kara Y, Yavuz V (2025) Urban Microclimates in a Warming World: Land Surface Temperature (LST) Trends Across Ten Major Cities on Seven Continents. Urban Sci. [CrossRef]
- Ghasempour, F.; Sekertekin, A.; Kutoglu, S.H. How Landsat 9 Is Superior To Landsat 8: Comparative Assessment of Land Use Land Cover Classification and Land Surface Temperature. ISPRS Ann Photogramm Remote Sens Spat Inf Sci 2023, 10, 221–227. [Google Scholar] [CrossRef]
- Ye X, Liu R, Hui J, Zhu J (2023) Land Surface Temperature Estimation from Landsat-9 Thermal Infrared Data Using Ensemble Learning Method Considering the Physical Radiance Transfer Process. Land. [CrossRef]
- Adhar, S.; Barus, T.A.; Nababan, E.S.N.; Wahyuningsih, H. Trophic state index and spatio-temporal analysis of trophic parameters of Laut Tawar Lake, Aceh, Indonesia. AACL Bioflux 2023, 16, 342–355. [Google Scholar]
- Ramli I, Murthada S, Nasution Z, Achmad A (2019) Hydrograph separation method and baseflow separation using Chapman Method - A case study in Peusangan Watershed. IOP Conf Ser Earth Environ Sci. [CrossRef]
- Solanky V, Singh S, Katiyar SK (2018) Land Surface Temperature Estimation Using Remote Sensing Data. 343–351. [CrossRef]
- Ramli, I.; Achmad, A.; Anhar, A. Temporal changes in Land Use and Land Cover (LULC) and local climate in the Krueng Peusangan Watershed (KPW) area, Aceh, Indonesia. Bull Geogr Socio-economic Ser 2023, 59, 151–165. [Google Scholar] [CrossRef]
- Halefom A, He Y, Nemoto T, Feng L, Li R, Raghavan V, Jing G, Song X, Duan Z (2024) The Impact of Urbanization-Induced Land Use Change on Land Surface Temperature. Remote Sens. [CrossRef]
- Bonan, G.B. Forests and climate change: Forcings, feedbacks, and the climate benefits of forests. Science (80- ) 2008, 320, 1444–1449. [Google Scholar] [CrossRef]
- Tang, B.; Bi, Y.; Li, Z.A.; Xia, J. Generalized split-window algorithm for estimate of land surface temperature from Chinese geostationary FengYun meteorological satellite (FY-2C) data. Sensors 2008, 8, 933–951. [Google Scholar] [CrossRef]
- Hardiyanto, D.W.; Setianto, A.; Harijoko, A. Spatial Analysis to Determine the Geothermal Potential Index: The Case Study of Dieng Geothermal Complex. J Geosains dan Remote Sens 2024, 5, 81–90. [Google Scholar] [CrossRef]
- Yasin A, Ali A, Ahmed N (2024) Time-series analysis of Leaf Area Index and Land Surface Temperature Association using Sentinel-2 and Landsat OLI data. Environ Syst Res. [CrossRef]
- Cuce PM, Cuce E, Santamouris M (2025) Towards Sustainable and Climate-Resilient Cities: Mitigating Urban Heat Islands Through Green Infrastructure. Sustain. [CrossRef]
- Nurlina; Kadir, S.; Kurnain, A.; Ilham, W.; Ridwan, I. Impact of Land Cover Changing on Wetland Surface Temperature Based on Multitemporal Remote Sensing Data. Polish J Environ Stud 2023, 32, 2281–2291. [Google Scholar]
- Gupta, R.K. Geospatial and Statistical Analysis of Land Surface Temperature and Land Surface Characteristics of Jaipur and Ahmedabad Cities of India. J Geosci Environ Prot 2024, 12, 1–19. [Google Scholar] [CrossRef]
- Kocur-Bera, K.; Małek, A. Assessing the Feasibility of Using Remote Sensing Data and Vegetation Indices in the Estimation of Land Subject to Consolidation. Sensors 2024, 24, 1–18. [Google Scholar] [CrossRef] [PubMed]
- Achmad, A.; Sari, L.H.; Ramli, I. A study of urban heat island of Banda Aceh City, Indonesia based on land use/cover changes and land surface temperature. Aceh Int J Sci Technol 2019, 8, 41–51. [Google Scholar] [CrossRef]
- Jagtap, A.A.; Shedge, D.K.; Mane, P.B. Exploring the Effects of Land Use/Land Cover (LULC) Modifications and Land Surface Temperature (LST) in Pune, Maharashtra with Anticipated LULC for 2030. Int J Geoinformatics 2024, 20, 42–63. [Google Scholar] [CrossRef]
- Orlov A, De Hertog S, Havermann F, et al (2023) Changes in Land Cover and Management Affect Heat Stress and Labor Capacity. Earth’s Futur. [CrossRef]
- Gao Y, Li N, Gao M, Hao M, Liu X (2024) Modelling Future Land Surface Temperature: A Comparative Analysis between Parametric and Non-Parametric Methods. Sustain. [CrossRef]
- Maheng, D.; Pathirana, A.; Bhattacharya, B.; Zevenbergen, C.; Lauwaet, D.; Siswanto, S.; Suwondo, A. Impact of land use land cover changes on urban temperature in Jakarta: insights from an urban boundary layer climate model. Front Environ Sci 2024, 12, 1–13. [Google Scholar] [CrossRef]
- Achmad A, Ramli I, Nizamuddin N (2023) Impact of land use and land cover changes on carbon stock in Aceh Besar District, Aceh, Indonesia. J Water L Dev 159–166. [CrossRef]
- Kustura, K.; Conti, D.; Sammer, M.; Riffler, M. Harnessing Multi-Source Data and Deep Learning for High-Resolution Land Surface Temperature Gap-Filling Supporting Climate Change Adaptation Activities. Remote Sens 2025, 17, 1–30. [Google Scholar] [CrossRef]
- Achmad A, Ramli I, Irwansyah M (2020) The impacts of land use and cover changes on ecosystem services value in urban highland areas. IOP Conf Ser Earth Environ Sci. [CrossRef]
- Singh, V. Estimating land surface temperature in ArcGIS using Landsat-8, Hoshangabad district, (Madhya Pradesh). Int J Appl Res 2017, 3, 1374–1379. [Google Scholar] [CrossRef]
- Sobrino, J.A.; Jiménez-Muñoz, J.C.; Paolini, L. Land surface temperature retrieval from LANDSAT TM 5. Remote Sens Environ 2004, 90, 434–440. [Google Scholar] [CrossRef]
- Santos Orozco, D.L.; Ruiz Corral, J.A.; Villavicencio García, R.F.; Rodríguez Moreno, V.M. Deforestation and Its Effect on Surface Albedo and Weather Patterns. Sustain 2023, 15, 1–19. [Google Scholar] [CrossRef]
- M. Imran H, Issa Shammas M, Rahman A, J. Jacobs S, W. M. Ng A, Muthukumaran S (2021) Causes, Modeling and Mitigation of Urban Heat Island: A Review. Earth Sci 10:244. [CrossRef]
- Ullah N, Siddique MA, Ding M, Grigoryan S, Khan IA, Kang Z, Tsou S, Zhang T, Hu Y, Zhang Y (2023) The Impact of Urbanization on Urban Heat Island: Predictive Approach Using Google Earth Engine and CA-Markov Modelling (2005–2050) of Tianjin City, China. Int J Environ Res Public Health. [CrossRef]
- Kowe, P.; Dube, T.; Mushore, T.D.; Ncube, A.; Nyenda, T.; Mutowo, G.; Chinembiri, T.S.; Traore, M.; Kizilirmak, G. Impacts of the spatial configuration of built-up areas and urban vegetation on land surface temperature using spectral and local spatial autocorrelation indices. Remote Sens Lett 2022, 13, 1222–1235. [Google Scholar] [CrossRef]
- Komeh, Z.; Hamzeh, S.; Memarian, H.; Attarchi, S.; Alavipanah, S.K. A Remote Sensing Approach to Spatiotemporal Analysis of Land Surface Temperature in Response to Land Use/Land Cover Change via Cloud Base and Machine Learning Methods, Case Study: Sari Metropolis, Iran. Int J Environ Res 2025, 19, 98. [Google Scholar] [CrossRef]
- Achmad A, Ramli I, Nizamuddin N (2025) Monitoring Land Use and Land Cover Changes in Aceh Province-Indonesia for Sustainable Spatial Planning BT - Inclusive and Integrated Disaster Risk Reduction. In: Opdyke A, Pascua de Rivera L (eds). Springer Nature Switzerland, Cham, pp 82–94. [CrossRef]
- Zhao, P.; He, Z.; Ma, D.; Wang, W.; Qian, L. Temperature trends and its elevation-dependent warming over the Qilian Mountains. J Mt Sci 2024, 21, 500–510. [Google Scholar] [CrossRef]
- McGuire CR, Nufio CR, Bowers MD, Guralnick RP (2012) Elevation-Dependent Temperature Trends in the Rocky Mountain Front Range: Changes over a 56- and 20-Year Record. PLoS One. [CrossRef]
- Navarro-Serrano F, López-Moreno JI, Azorin-Molina C, Alonso-González E, Aznarez-Balta M, Buisán ST, Revuelto J (2020) Elevation effects on air temperature in a topographically complex mountain valley in the Spanish pyrenees. Atmosphere (Basel). [CrossRef]
- Xu L, Du J, Ren J, Hu Q, Qin F, Mu W, Hu J (2024) Improving the ERA5-Land Temperature Product through a Deep Spatiotemporal Model That Uses Fused Multi-Source Remote Sensing Data. Remote Sens. [CrossRef]
- Zhang, Y.; Shen, X.; Fan, G. Elevation-dependent trend in diurnal temperature range in the northeast china during 1961–2015. Atmosphere (Basel) 2021, 12, 1–11. [Google Scholar] [CrossRef]
- Achmad, A.; Ramli, I.; Sugiarto, S.; Irzaidi, I.; Izzaty, A. Assessing and Forecasting Carbon Stock Variations in Response to Land Use and Land Cover Changes in Central Aceh, Indonesia. Int J Des Nat Ecodynamics 2024, 19, 465–475. [Google Scholar] [CrossRef]
- Awasthi, M.P. Mapping and analyzing temporal variability of spectral indices in the lowland region of Far Western Nepal. Water Pract Technol 2023, 18, 2971–2988. [Google Scholar] [CrossRef]
- Peng, X.; Wu, W.; Zheng, Y.; Sun, J.; Hu, T.; Wang, P. Correlation analysis of land surface temperature and topographic elements in Hangzhou, China. Sci Rep 2020, 10, 1–16. [Google Scholar] [CrossRef] [PubMed]
- Taripanah, F.; Ranjbar, A. Quantitative analysis of spatial distribution of land surface temperature (LST) in relation Ecohydrological, terrain and socio- economic factors based on Landsat data in mountainous area. Adv Sp Res 2021, 68, 3622–3640. [Google Scholar] [CrossRef]
- Nitis, T.; Klaic, Z.B.; Moussiopoulos, N. Effects of topography on urban heat island. 10th Int Conf Harmon within Atmos Dispers Model Regul Purp 2005, 1, 5. [Google Scholar]
- Feng, Y.; Wang, H.; Wu, J.; Wang, Y.; Shi, H.; Zhao, J. Exploring the impact of urban spatial morphology on land surface temperature: A case study in Linyi City, China. PLoS One 2025, 20, 1–19. [Google Scholar] [CrossRef]
- Liu H, Zhou Z, Wen Q, Chen J, Kojima S (2024) Spatiotemporal Land Use/Land Cover Changes and Impact on Urban Thermal Environments: Analyzing Cool Island Intensity Variations. Sustain. [CrossRef]
- Achmad, A.; Ramli, I.; Nizamuddin, N.; Gunawan, A.; Fakhrana, S.Z.; Zhong, X. The impact of land use and land cover changes on ecosystem service value in Aceh Besar Regency, Aceh, Indonesia. Land 2024, 13, 69–76. [Google Scholar] [CrossRef]
- Basnet P, Grieger S, Putzenlechner B, Seidel D (2025) Forests with high structural complexity contribute more to land surface cooling: empirical support for management for complexity. J For Res. [CrossRef]
- Thammaboribal, P.; Tripathi, N.K.; Lipiloet, S. Comparative Analysis of Land Surface Temperature (LST) Retrieved from Landsat Level 1 and Level 2 Data: A Case Study in Pathumthani Province, Thailand. Int J Geoinformatics 2025, 21, 160–177. [Google Scholar] [CrossRef]
- Meng, X.; Cheng, J.; Guo, H.; Guo, Y.; Yao, B. Accuracy Evaluation of the Landsat 9 Land Surface Temperature Product. IEEE J Sel Top Appl Earth Obs Remote Sens 2022, 15, 8694–8703. [Google Scholar] [CrossRef]
- Cetin, M.; Ozenen Kavlak, M.; Senyel Kurkcuoglu, M.A.; Bilge Ozturk, G.; Cabuk, S.N.; Cabuk, A. Determination of land surface temperature and urban heat island effects with remote sensing capabilities: the case of Kayseri, Türkiye. Nat Hazards 2024, 120, 5509–5536. [Google Scholar] [CrossRef]
- Parvar Z (2024) PyLST : A Python-based application for retrieving. 0–18. [CrossRef]
- Mohiuddin G, Mund J-P (2024) Spatiotemporal Analysis of Land Surface Temperature in Response to Land Use and Land Cover Changes: A Remote Sensing Approach. 15. [CrossRef]
- Jiang Y, Li X, Huang J (2022) Zoning Optimization Method of a Riverfront Greenspace Service Function Oriented to the Cooling Effect: A Case Study in Shanghai. Int J Environ Res Public Health. [CrossRef]
- Balany, F.; Ng, A.W.M.; Muttil, N.; Muthukumaran, S.; Wong, M.S. Green infrastructure as an urban heat island mitigation strategy—a review. Water (Switzerland) 2020, 12, 1–22. [Google Scholar] [CrossRef]
- Al-Shaar W, Bonin O, de Gouvello B (2022) Scenario-Based Predictions of Urban Dynamics in Île-de-France Region: A New Combinatory Methodologic Approach of Variance Analysis and Frequency Ratio. Sustain. [CrossRef]
- Wang J, Tang BH, Zhu X, Fan D, Li M, Chen J (2024) A comparative analysis of five land surface temperature downscaling methods in plateau mountainous areas. Front Earth Sci. [CrossRef]
Figure 1.
the Laut Tawar Sub watershed In Central Aceh Province.
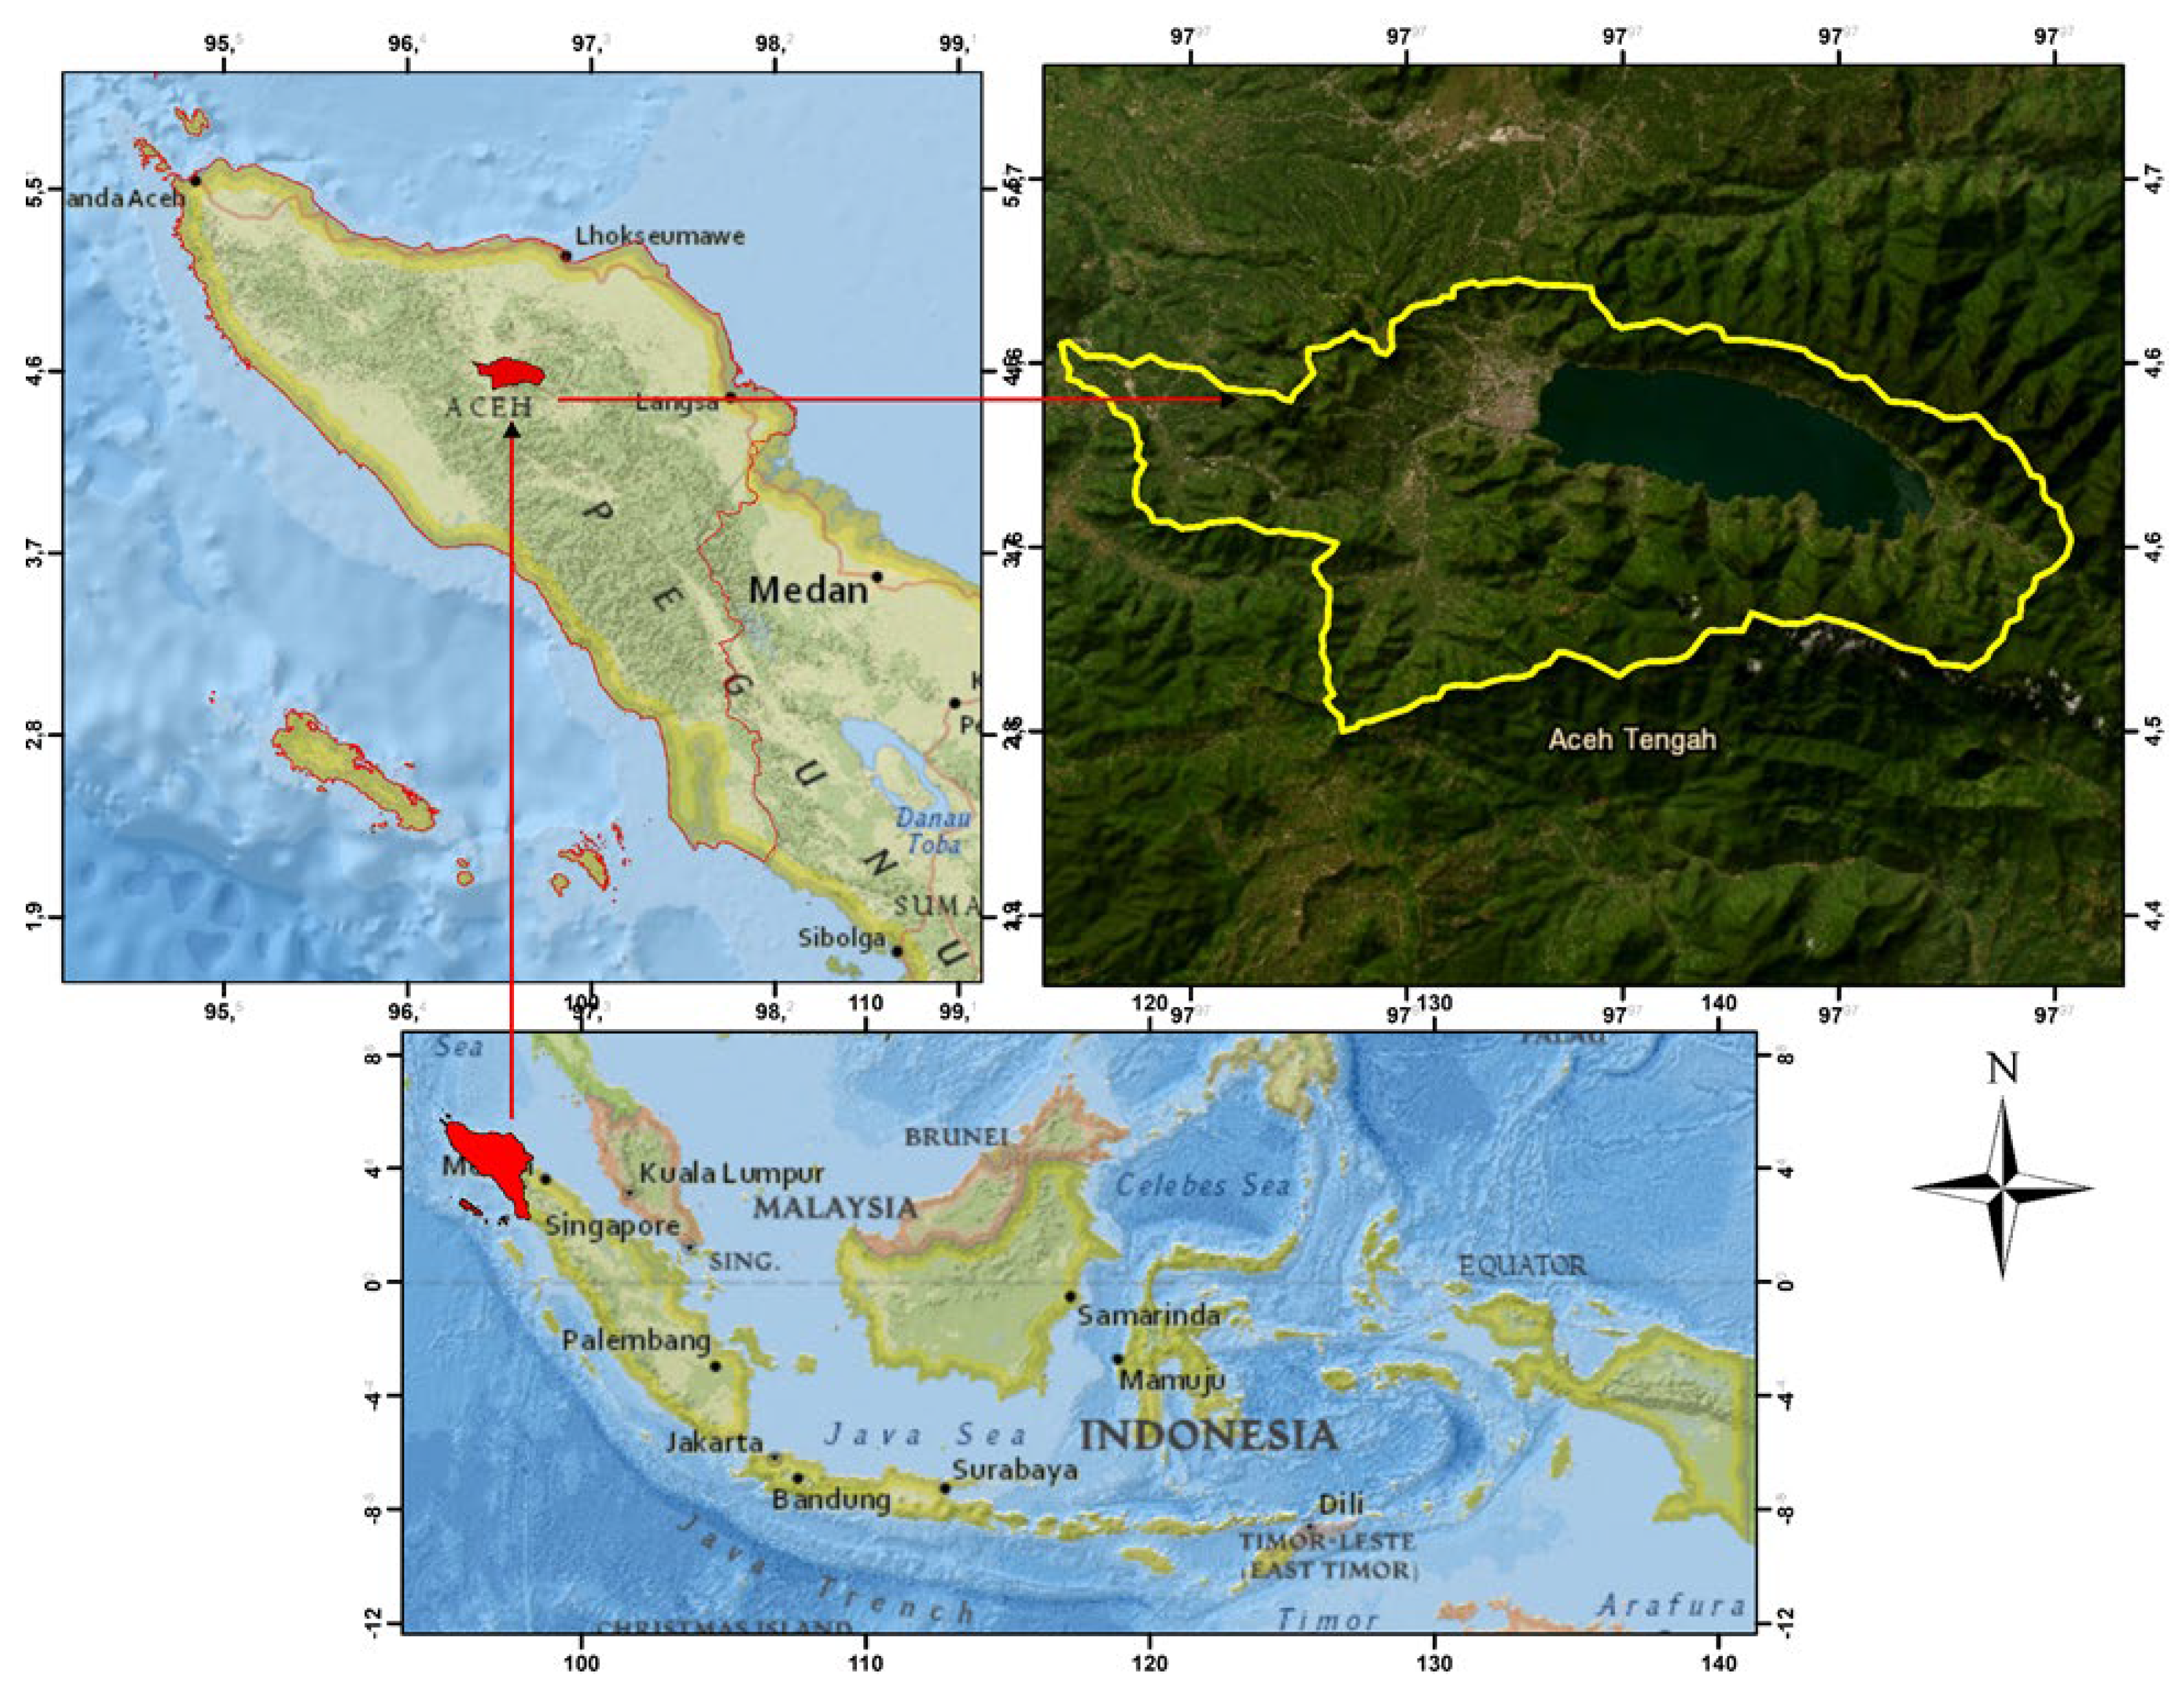
Figure 2.
LST Distribution based on Landsat 9 Imagery (2024).
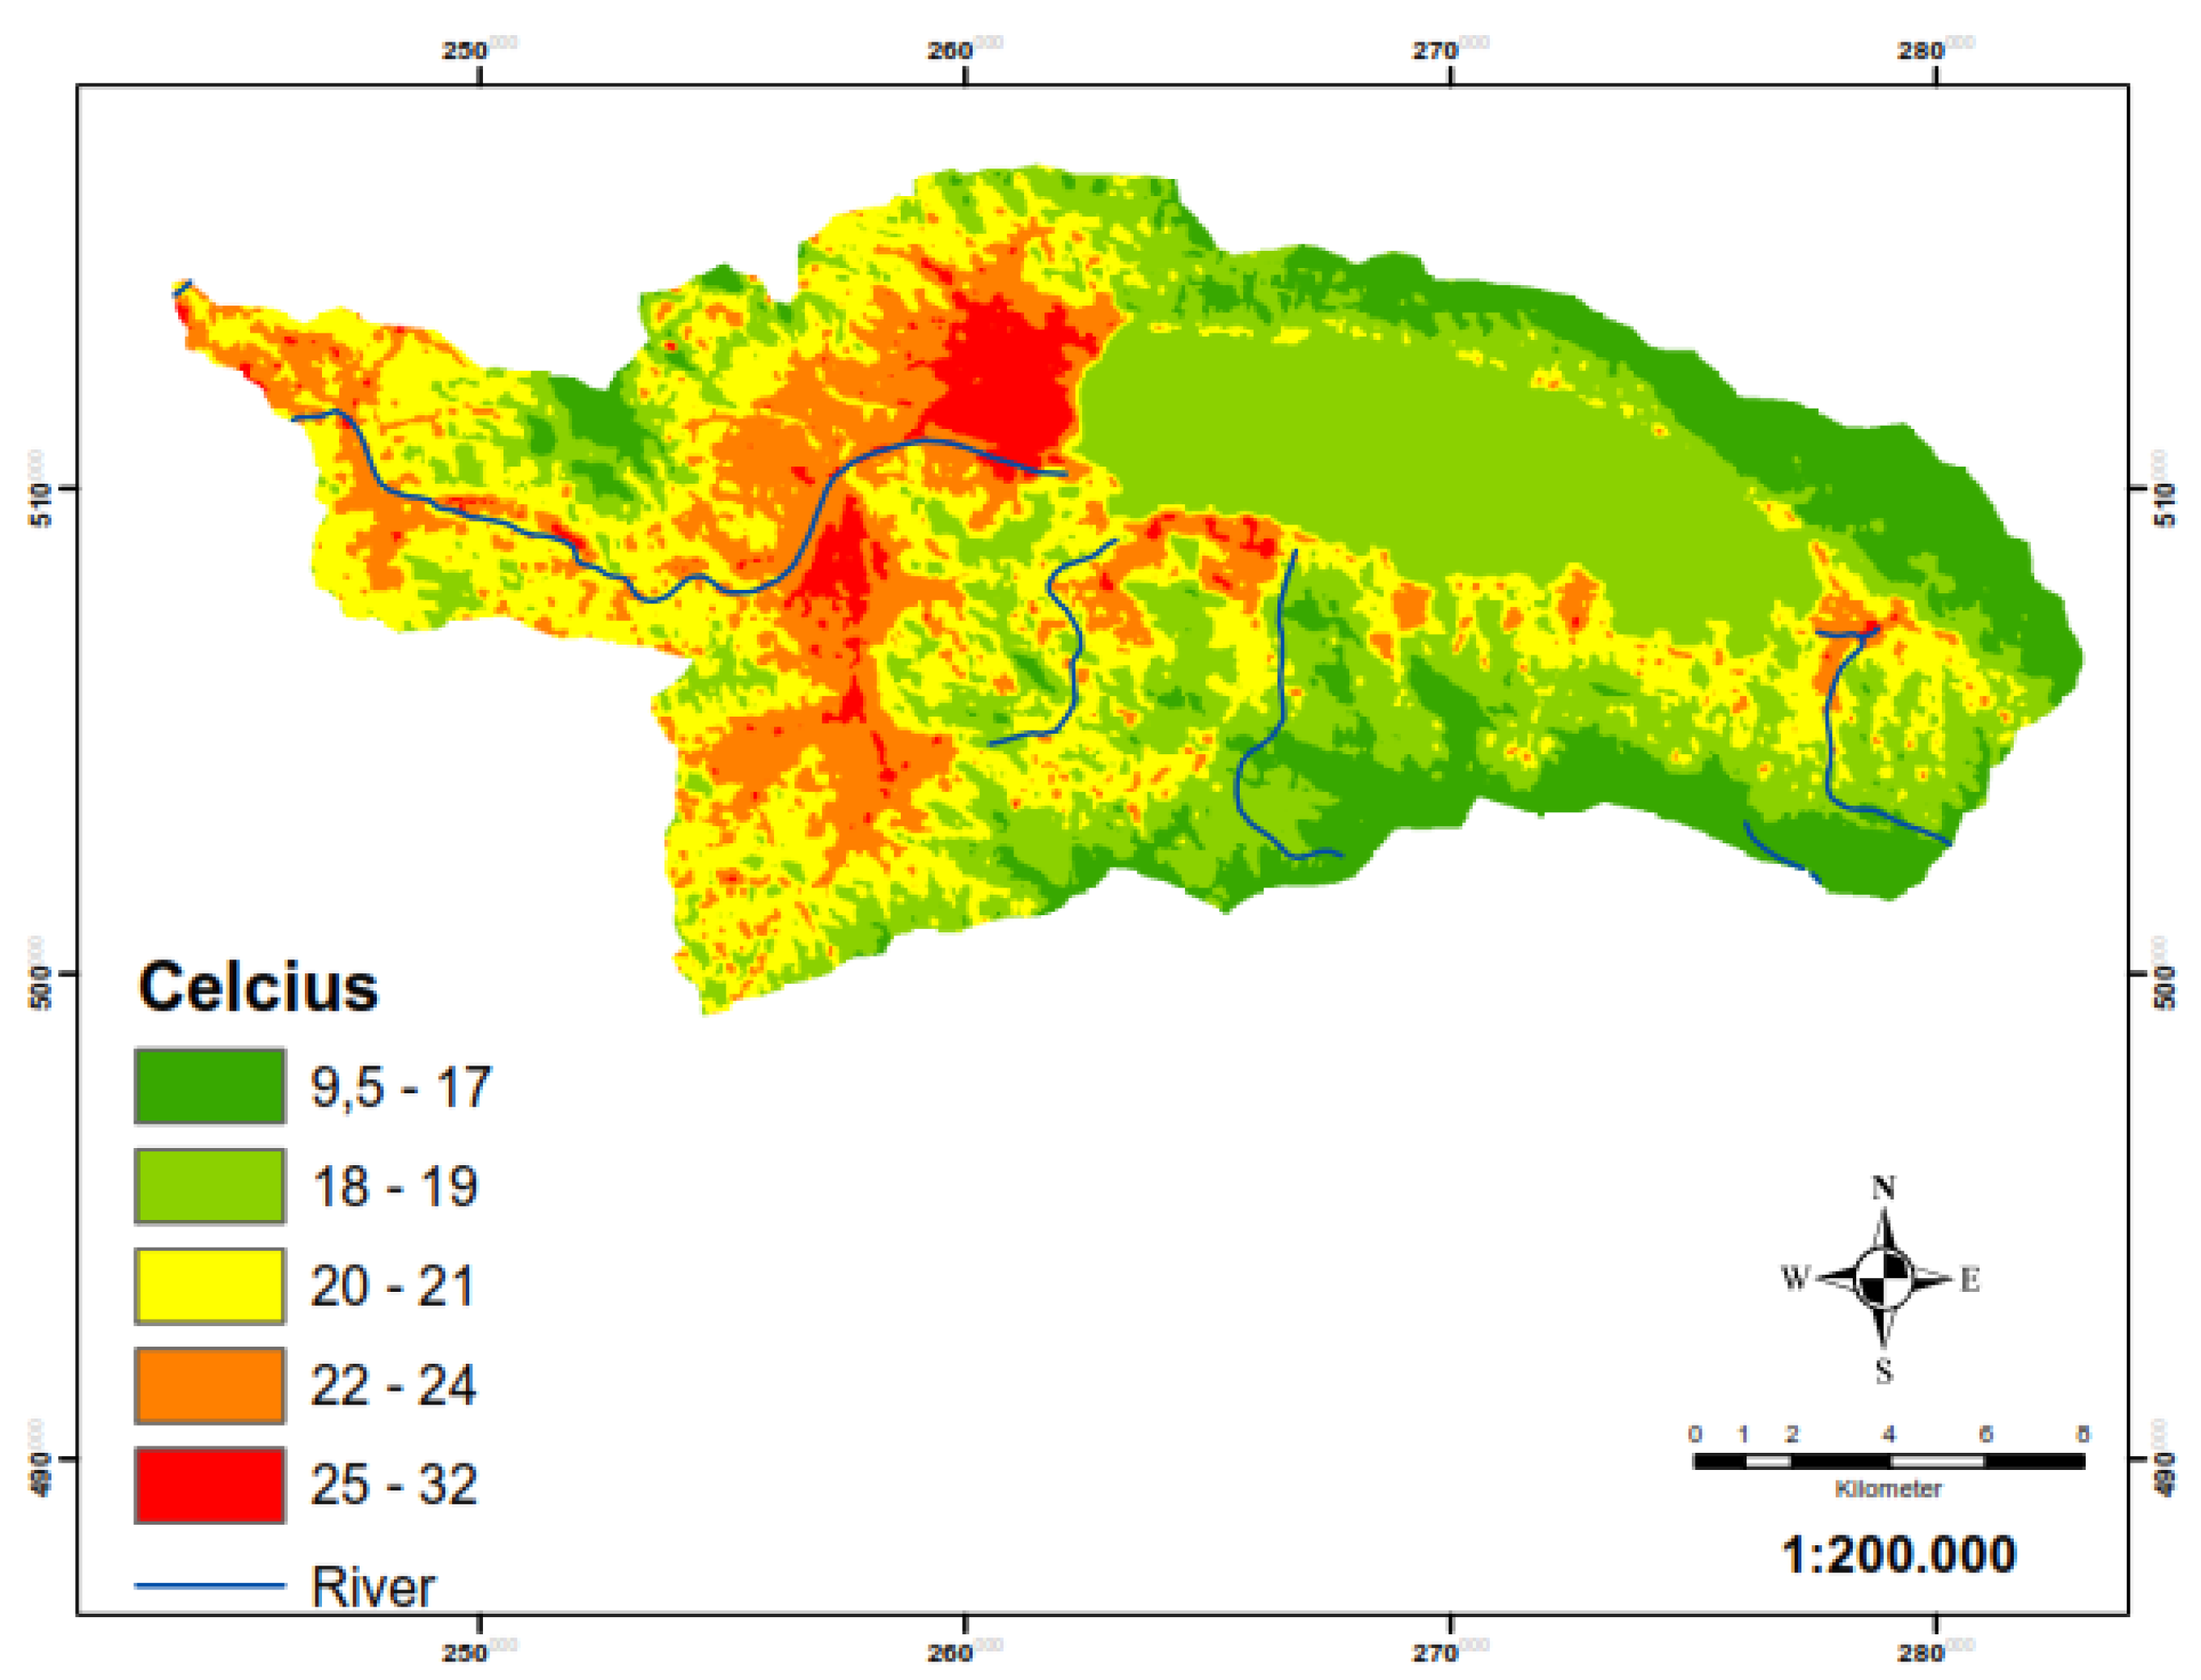
Figure 3.
Map of Surface Temperature Distribution with Topography in the Laut Tawar Sub-Watershed.
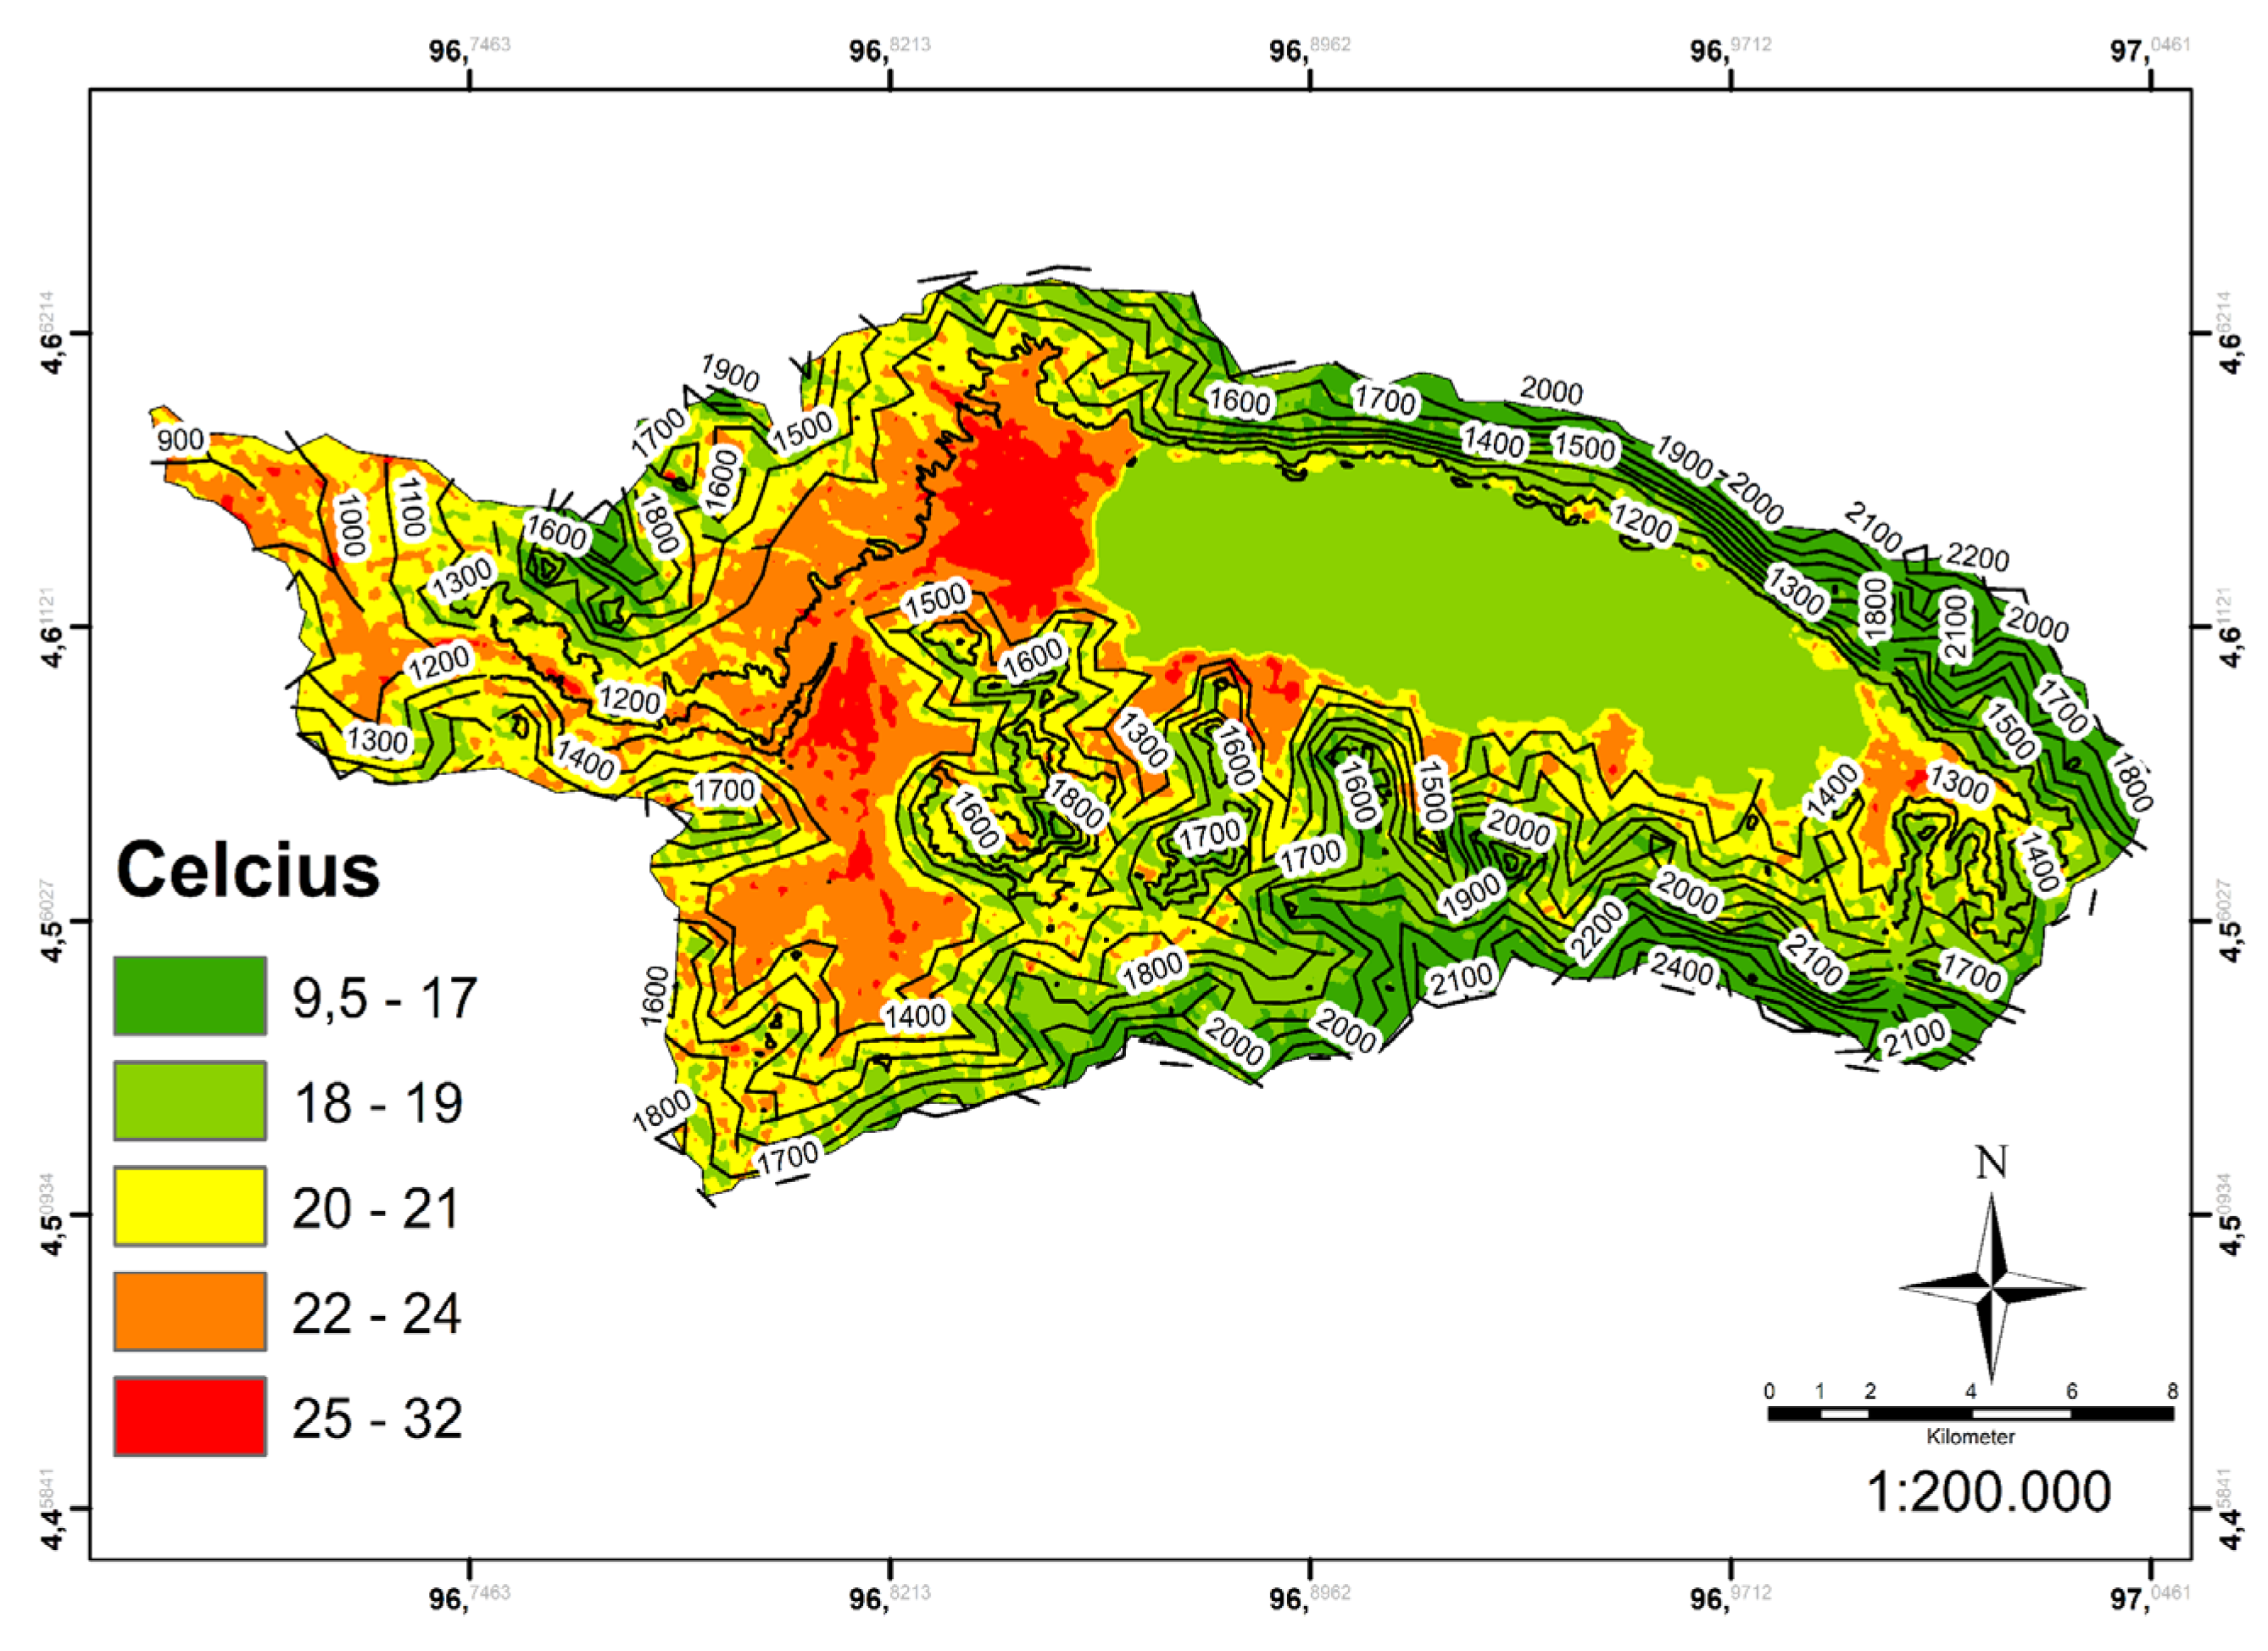
Figure 4.
LULC Classification in the Laut Tawar Sub watershed.
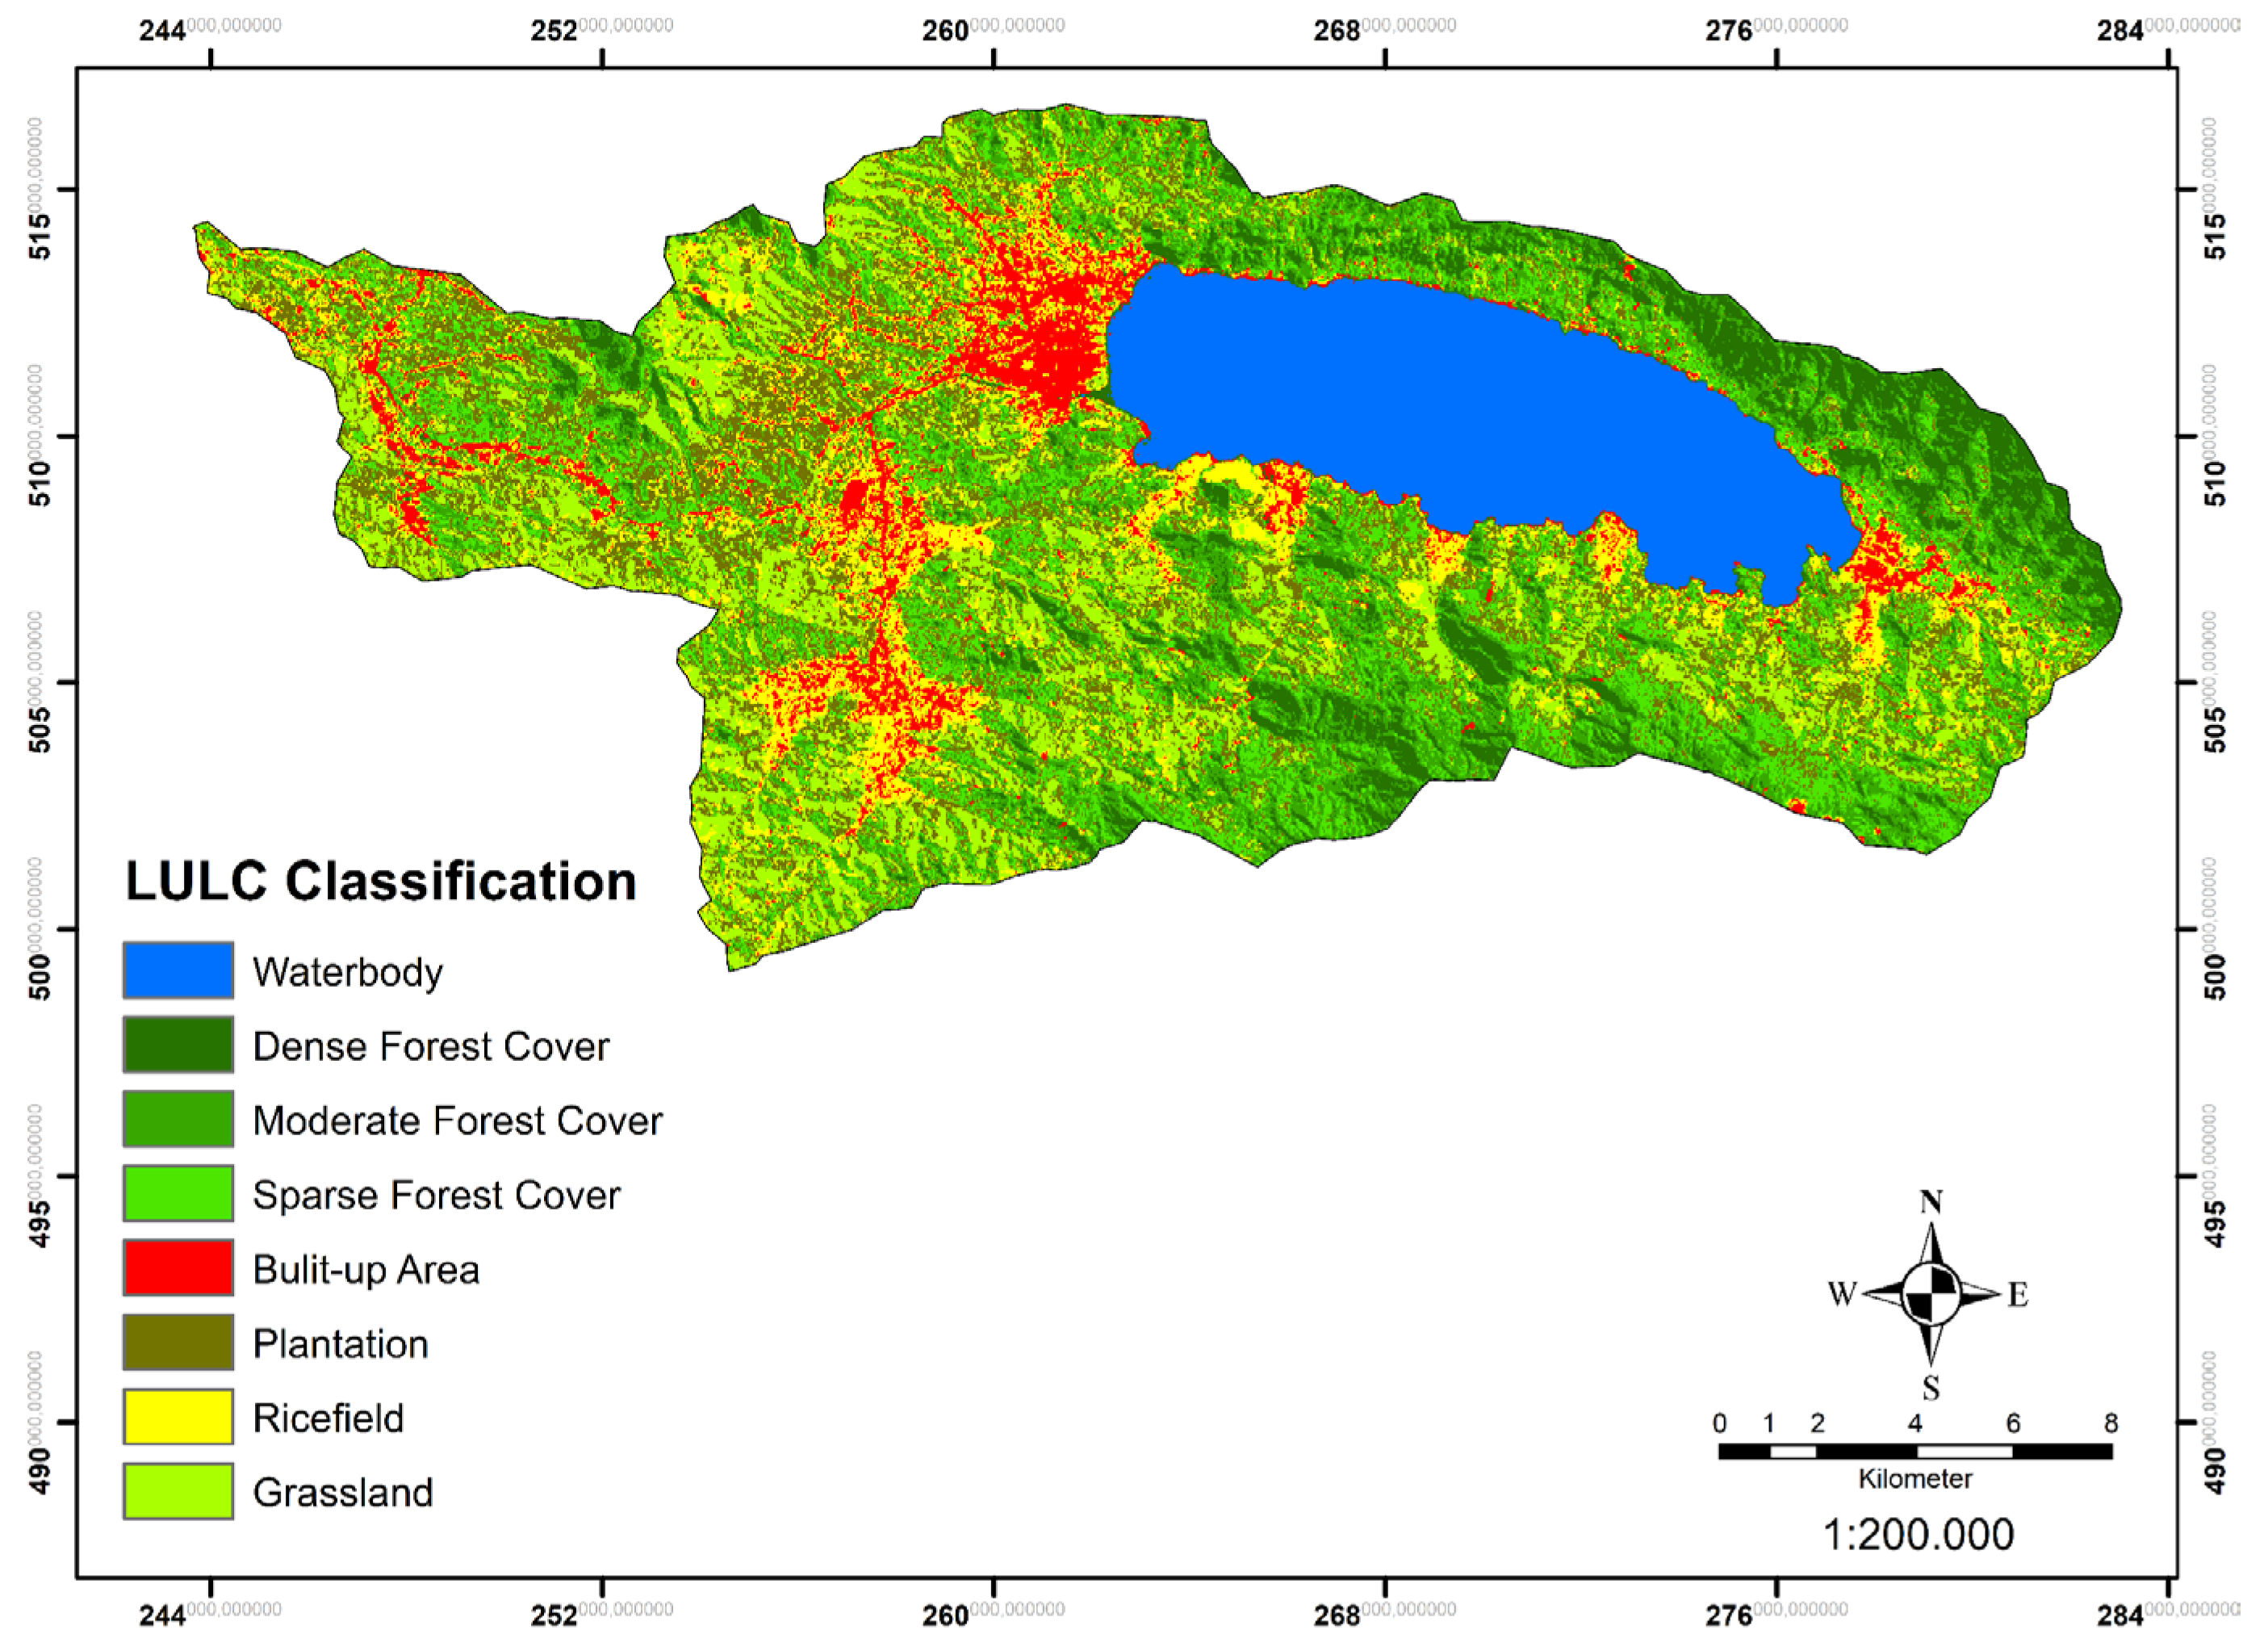
Figure 5.
Graph of percentage distribution of LULC area in the Laut Tawar Sub-Watershed.
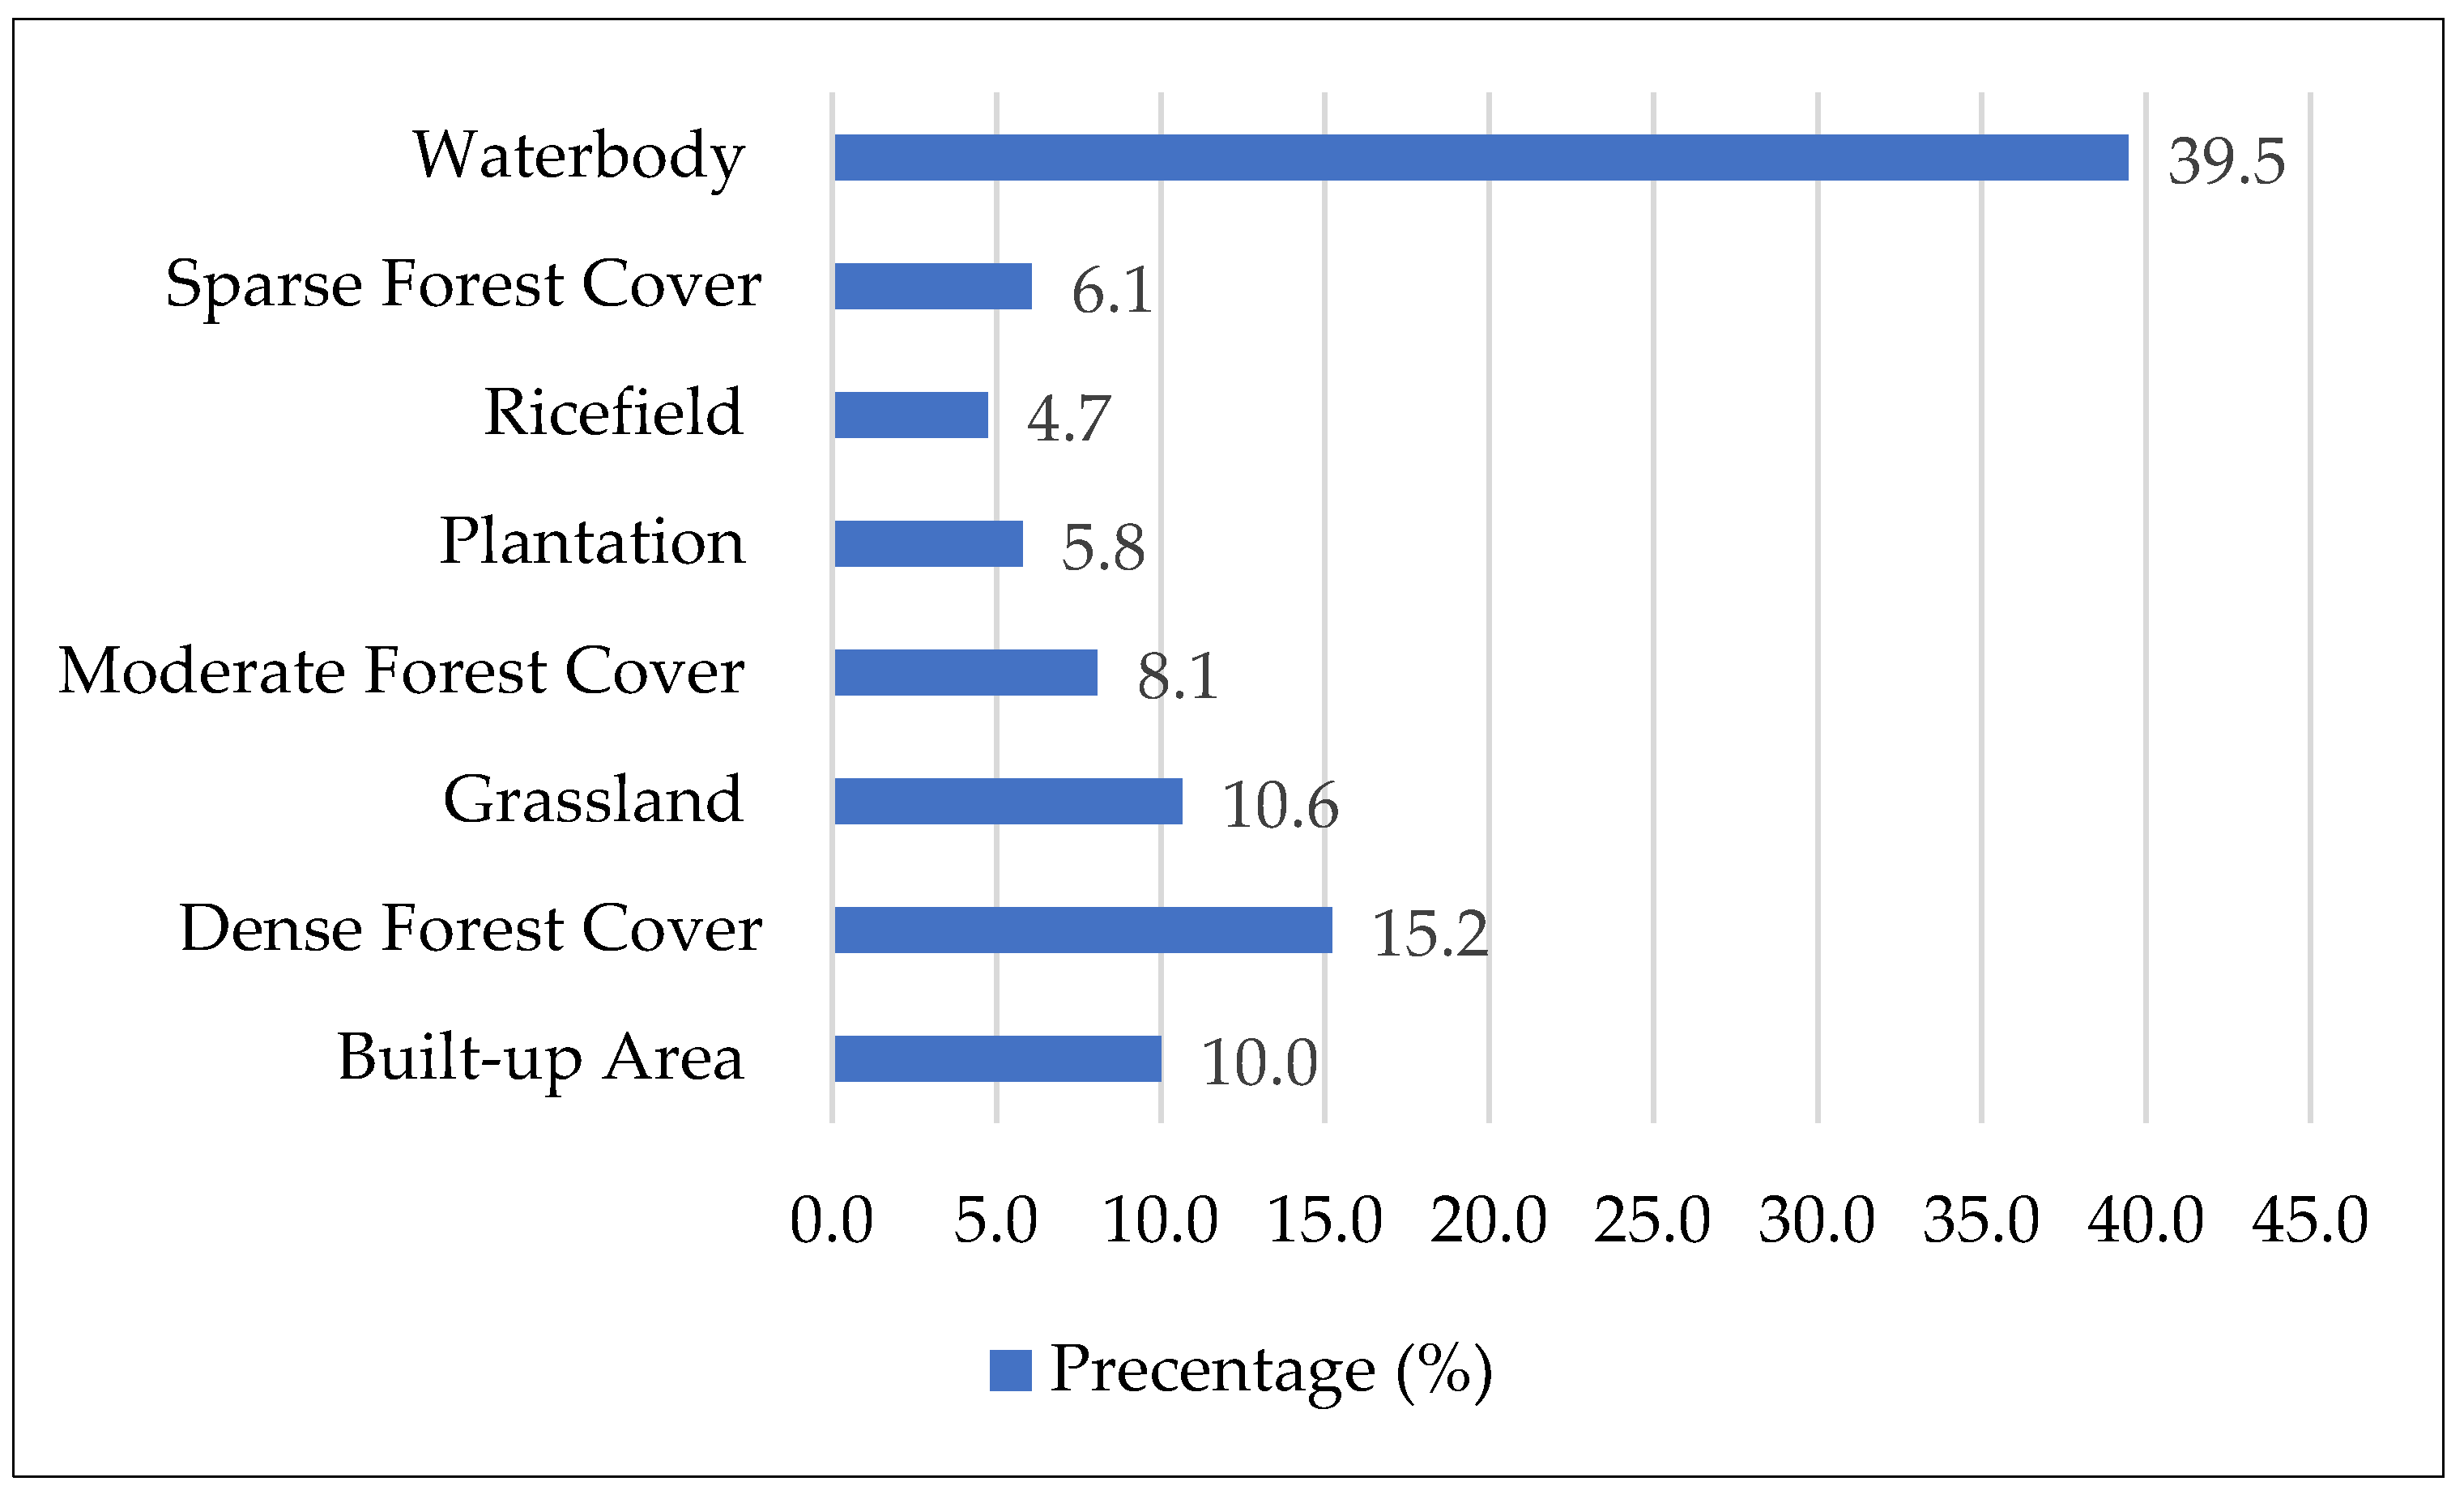

Table 1.
Elevation and Range Degree in Celcius.
| Elevation (meter above sea level) | Range on Degree in Celcius based on colour in the map | |
|---|---|---|
| 900 | 20 - 21 | 22 – 24 |
| 1,000 | 20 - 21 | 22 – 24 |
| 1,100 | 20 – 21 | 22 – 24 |
| 1,200 | 20 – 21 | 22 – 24 |
| 1,300 | 18 – 19 | 20 – 21 |
| 1,400 | 18 – 19 | 20 – 21 |
| 1,500 | 18 – 19 | 20 – 21 |
| 1,600 | 9,5 - 17 | 20 – 21 |
| 1,700 | 9,5 - 17 | 18 – 19 |
| 1,800 | 9,5 - 17 | 18 – 19 |
| 1,900 | 9,5 - 17 | 18 – 19 |
| 2,000 | 9,5 - 17 | 18 – 19 |
| 2,100 | 9,5 - 17 | 9,5 - 17 |
| 2,200 | 9,5 - 17 | 9,5 - 17 |
| 2,300 | 9,5 - 17 | 9,5 - 17 |
| 2,400 | 9,5 - 17 | 9,5 - 17 |
Table 2.
LULC Classification Area.
| Classification | Area (Ha) |
|---|---|
| Built-up Area | 1.438 |
| Dense Forest Cover | 2.187 |
| Grassland | 1.530 |
| Moderate Forest Cover | 1.159 |
| Plantation | 832 |
| Rice field | 679 |
| Sparse Forest Cover | 873 |
| Waterbody | 5.670 |
Disclaimer/Publisher’s Note: The statements, opinions and data contained in all publications are solely those of the individual author(s) and contributor(s) and not of MDPI and/or the editor(s). MDPI and/or the editor(s) disclaim responsibility for any injury to people or property resulting from any ideas, methods, instructions or products referred to in the content. |
© 2025 by the authors. Licensee MDPI, Basel, Switzerland. This article is an open access article distributed under the terms and conditions of the Creative Commons Attribution (CC BY) license (http://creativecommons.org/licenses/by/4.0/).
Copyright: This open access article is published under a Creative Commons CC BY 4.0 license, which permit the free download, distribution, and reuse, provided that the author and preprint are cited in any reuse.


