
Submitted:
08 August 2025
Posted:
12 August 2025
You are already at the latest version
Abstract
Soil moisture is a very important parameter influencing many hydrological and climatic processes. It is also a key factor in agriculture, determining crop yields and thus influencing food security. It is crucial to model this variable for large areas with high spatial and temporal resolution and good accuracy. The aim of this study is to develop a soil moisture model for bare soils from Sentinel-1 SAR data that would be characterized by high spatial resolution and would be universal enough to be applicable to large areas of various soil types, textures and large ranges of roughness. Over 800 soil moisture measurements from five study areas located in different parts of Poland were used. The work was performed on Sentinel-1 data registered between March 2024 and March 2025 using both backscattering and polarimetric analysis. The soil data were obtained from a 1:5000 scale soil map available online for Poland through the soil-agricultural geoportal. The results of Random Forest modeling of soil moisture based on backscattering were relatively poor with R2=0.46 and 7.15% soil moisture accuracy. In the case of polarimetric channels results were slightly better only. The best results were obtained taking into account the clay content (particles < 0.002mm) in the soil. The soil moisture accuracy of 5.16% with R2=0.71 was achieved.
Keywords:
soil moisture
; soil texture
; Sentinel-1
; SAR
; random forest
1. Introduction
Soil moisture is an extremely important parameter influencing many hydrological and climatic processes. It influences infiltration rates, surface runoff, flooding and evapotranspiration [1]. It is also a key factor in agriculture, determining crop yields and thus influencing food security.
The widespread importance of soil moisture in many processes makes it crucial to model this variable for large areas with high spatial and temporal resolution. There are a number of remote sensing methods for measuring soil moisture [2], primarily using passive radiometers [3,4] and active SAR sensors [5,6,7]. However there are also other solutions based e.g. on physics informed machine learning [8]. None of these methods alone is currently sufficient to address the challenges of providing soil moisture information for very large areas with good spatial resolution and satisfactory accuracy. Methods based on radiometers and scatterometers, such as SMOS [4,9,10] or ASCAT [3] are very sensitive to soil moisture and can provide information even on a global scale, but are characterized by poor spatial resolution, on the order of kilometers. Soil moisture obtained by these methods is a very important element of hydrological and climate models on a national, continental and global scale [11,12,13] however, it is completely insufficient for many other purposes related to e.g. agriculture, where obtaining accurate soil moisture with good spatial resolution at field scale is an extremely important factor.
This domain is primarily filled by methods based on active SAR data. However, they only provide information from the thin top layer of the soil. In the case of C-band data, this is only 1-2 cm [14]. The problem with measuring soil moisture using SAR data is also sensitivity of the signal to soil roughness and texture [15,16,17,18], as well as vegetation covering the soil [19,20,21,22]. The knowledge about these parameters is often insufficient. The high spatial variability of them causes that in many cases SAR-based models are only valid locally or applicable to a certain range of soil parameters. There are methods that attempt to combine all these challenges, such as the SSM Copernicus [23]. It combines data from the active Sentinel-1 SAR sensor and the ASCAT scatterometer. It results in a relatively high spatial resolution of 1 km. However, this is still far from the 10-meter resolution of Sentinel-1 SAR data. Another example of a globally available 1 km spatial resolution soil moisture model is the solution based on physics informed machine learning [8]. The best results regarding combining high spatial resolution of soil moisture products with a large coverage are presented in [24]. This solution combines high-resolution land surface modeling, radiative transfer modeling, machine learning, SMAP satellite microwave data, and in-situ observations. The resulting soil moisture dataset of 30 m resolution is available for the conterminous United States.
Many algorithms relating SAR backscattering to soil moisture, consider soil roughness as an additional parameter [5,25]. Various physical soil moisture and roughness models exist, such as Dubois and CIEM [26,27]. Soil roughness itself is a rather difficult parameter to measure in the field but can be parameterized using models. CIEM model uses relative height variability and correlation length to parametrize soil roughness. These studies have shown that soil roughness can reduce uncertainty in soil moisture modeling. However, these models often have very limited applicability due to their validation only for a limited roughness range or their reliance on very local studies. There are also many studies in which soil moisture is modeled using machine learning algorithm [28,29,30,31].
Most of SAR soil moisture studies is based on modeling of SAR backscattering coefficient, however, there are also solutions taking into account polarimetric signal decomposition methods [19,27,32,33,34]. The aim of them is to determine the scattering mechanisms dominating in the radar signal and thus provide additional information on the structure of the objects, including its roughness [35].
Relatively few soil moisture algorithms consider soil texture as an additional parameter. It has a significant impact on soil water retention and, therefore, the ability of SAR data to penetrate deeper into the soil. However, there are a number of studies that examine the relationship between soil texture and microwave radiation [16,17,36] or microwave and optical radiation [37]. Some of these also incorporate soil texture into moisture modeling [18,38].
The aim of this study is to develop a soil moisture model for bare soils from Sentinel-1 C-band SAR data that would be characterized by high spatial resolution at field scale and would be universal enough to be applicable to large areas characterized by various soil types and various roughness, from relatively smooth to very rough e.g. after ploughing. This goal can be achieved using Sentinel-1 SAR data by incorporating soil texture into soil moisture modeling. This study takes into account only the clay content (particles < 0.002 mm) of soils. The work also analyzes whether Sentinel-1 dual polarimetric decompositions can be helpful in determining soil roughness and texture.
2. Materials and Methods
2.1. Study Areas
This research was carried out in five study areas located in different parts of Poland. Three of them are located near Warsaw in central Poland, one in Wielkopolskie Voivodeship in the west, and one in southern Poland. The sites were selected in agricultural areas with the concentration of large fields within a relatively small area. This improved the logistics of field measurements and allowed for the location of measurement points, within each field, far from the field edges and from each other. This allowed the use of relatively large windows for speckle noise reduction of SAR data without affecting the backscatter by other land cover on field edges, like trees, etc. Areas were selected taking into account high variability in soil type and texture, their water retention capacity, and hydrographic conditions.
The areas were located in different parts of Poland, with varying rainfall amounts, to enable the collection of a large number of data characterized by the widest possible range of measured soil moisture for each soil type and varying soil roughness in a relatively short time.
Three areas located around Warsaw: OBORY, MŁOCHÓW, and BRWINÓW are completely flat. The slope of the terrain in the measured fields does not exceed 2-3°. The JECAM area in Wielkopolskie Voivodeship is mostly flat. Only the north-eastern part of the area is more hilly with slopes not exceeding 5°. The Kędzierzyn-Koźle area consists of two parts. One is located in the Oder River valley and is completely flat, while the other is located on the Głubczyce Plateau and is partly hilly, with slopes not exceeding 10°. The location and names of the study areas are presented in Figure 1.
2.2. Data Sets
2.2.1. Soil Moisture Measurements
Field soil moisture measurements were carried out using a handheld IMKO TRIME-PICO 64 probe measuring soil moisture at a depth of 0-16 cm [39]. In total, soil moisture measurements were taken at 595 points, in fields with bare soil of varying roughness, from relatively smooth to very rough e.g. after ploughing with roughness up to approximately 20 cm. Some examples are presented in Figure 2. At some points located around Warsaw, measurements were taken several times a year at different soil moisture and roughness conditions. Plots for soil moisture measurements were selected taking into account the diversity of soil types and species, as well as the observed soil surface roughness associated with the current phase of agricultural practices. Soil information was obtained from online soil and agricultural geoportal [40]. Each plot typically had 4 to 10 measurement points arranged in two rows, approximately 40 m apart. This design was modified if it made it possible to capture greater variability in soil moisture within a single field, resulting from variations in micro-relief, water conditions, or soil type and structure.
Five independent measurements were taken at each measurement point: one in the center and four approximately 4 meters away in four different directions. The results were averaged to a single value, which was then referenced to a single Sentinel-1 pixel of 10m x 10m resolution. This approach was aimed at achieving the best possible adequacy of field measurements with the information contained in SAR data, as in some fields (especially those with high roughness) significant variation in soil moisture measured within a 10x10 meter area were observed, resulting from varying soil structure, due to the for example agricultural practices. Table 1 presents measurement statistics for each study area.
Soil moisture measurements were performed only on the days of the Sentinel-1A satellite's pass over a given area and on the following day. Only evening passes (ascending orbit) were taken into account. No field measurements were carried out during these flights, as there could have been a significant discrepancy between moisture conditions while the satellite was flying over and during the field measurements. Such situations included rainfall during the satellite flyover or field measurements and very heavy rainfall directly prior to this period, which could have caused significant variability in soil moisture over a short period due to gravity water passing through the soil profile. Most measurements were taken at relatively low temperatures of +2 – +15°C, which limited evaporation and soil moisture variability during the measurement day.
Detailed soil roughness measurements were not performed. Soil roughness was only assessed visually, dividing it into three groups: relatively smooth, medium roughness, and very rough. The roughness and soil structure were also documented in each field using vertical and oblique photographs taken by hand.
2.2.2. Soil Data
The information about soil type, soil species (soil texture) and the category of soil agricultural suitability was obtained from a 1:5000 scale soil map available online for Poland through the soil-agricultural geoportal [40]. The basic information for this study was soil texture, as it determines the ability of individual soils to retain water. The texture of the upper layer of soil was especially taken into account due to the relatively weak capabilities of C-band SAR to penetrate the soil. Percentage ranges of clay content (particles < 0.002 mm) for particular species according to Polish classification of soils can be found in [41]. The category of soil agricultural suitability, which groups soils with similar agricultural properties and which can be used similarly [42] was also important because it also distinguishes soils according to their fertility. Due to this they can also be used to some extent, to differentiate soils in terms of their water retention capacity within the same soil species. Table A1 in Appendix A, shows the category of soil agricultural suitability, soil type and soil species (soil texture) which occur in the study areas. The ranges of clay content ( particles < 0.002 mm) corresponding to particular soil species are presented according to the [41].
2.2.3. Sentinel-1 SAR Data
Sentinel-1 dual-polarimetric VV/VH radar images from the beginning of March 2024 to the end of March 2025 were used for this study. Winter images when snow cover was present in the study areas were excluded from the dataset. Sentinel-1 Level-1 GRD products were used to generate backscattering coefficient and Sentinel-1 Level-1 SLC products were used for polarimetric analysis. Only evening data from the ascending orbit were used to avoid possible dew and its impact on the results. The local incidence angle variability due to the location of individual research areas in different parts of the radar scenes and due to local variability of the terrain varied from 28° to 47°. The table 2 lists the S-1 imagery acquired when field measurements were conducted.

Table 2.
Sentinel-1 images used in the study.
| Date | Sensor | Orbit | Mean incidence angle | Study area |
|---|---|---|---|---|
| 2024-03-24 | Sentinel-1A | A029 | 34.55 | Obory |
| 2024-04-05 | Sentinel-1A | A029 | 34.55 | Obory |
| 2024-04-17 | Sentinel-1A | A029 | 34.55 | Obory |
| 2024-04-22 | Sentinel-1A | A102 | 42.91 | Obory |
| 2024-04-29 | Sentinel-1A | A029 | 34.55 | Obory |
| 2024-05-11 | Sentinel-1A | A029 | 34.55 | Obory |
| 2024-08-27 | Sentinel-1A | A029 | 34.55 | Obory |
| 2024-09-01 | Sentinel-1A | A102 | 42.91 | Obory |
| 2024-09-08 | Sentinel-1A | A029 | 34.55 | Obory |
| 2024-09-13 | Sentinel-1A | A102 | 42.91 | Obory |
| 2024-10-05 | Sentinel-1A | A073 | 42.00 | JECAM |
| 2024-10-12 | Sentinel-1A | A175 | 36.95 | Kędzierzyn-Koźle |
| 2024-10-19 | Sentinel-1A | A102 | 41.14 | Brwinów |
| 2024-10-26 | Sentinel-1A | A029 | 32.56 | Brwinów |
| 2025-01-30 | Sentinel-1A | A029 | 32.72 | Młochów |
| 2025-03-19 | Sentinel-1A | A029 | 32.56 | Brwinów |
| 2025-03-24 | Sentinel-1A | A102 | 41.14 | Brwinów |
2.3. Methodology
2.3.1. Sentinel-1 Data Processing
Sentinel-1 radar data were processed using python scripts and ESA SNAP software. GRD data were standard processed. In the first step for each study area and each orbit 15 Sentinel-1 scenes were selected. The data were limited to the area of interest, orbital correction, thermal noise removal and calibration to the β0 was performed for each image. In the next step data were stacked and coregistered to enable multi-temporal filtering using LeeSigma 11x11 filter. Finally only scenes from the dates of terrain measurements were radiometrically and geometrically corrected to backscatter coefficient γ0 using SRTM 30m Digital Elevation Model.
The SLC data were processed in a separated processing chain. First appropriate Interferometric Wide swatch with the study areas were selected and then orbit correction was applied to improve the geolocation. After calibration and thermal noise removal, in the next step, deramping and demodulation of Doppler spectrum were performed. Next separated bursts were merged in the TOPSAR-Deburst process and images were multi-looked. The speckle noise removal using polarimetric Improved Lee Sigma Filter in 9x9 pixels window was performed separately for each image. Next polarimetric decompositions were used to provide additional information on different scattering mechanisms to link soil roughness with the radar signal. Available in SNAP 11.0 dual-polarimetric products of HAlpha Decomposition, Model Based Decomposition and Radar Vegetation Index in 3x3 window were generated. Finally data were geometrically corrected and resampled to 10m resolution.
The list of all channels from which the values were obtained for pixels corresponding to the coordinates of points measured in the field is provided in Table 3.
2.3.2. Soil Data Preparation
The soil data had to be processed into numerical values that contained physical meaning in order to be included as a separate variable in random forest modeling. It was decided to use the percentage of clay content (particles < 0.002) in a given soil type. There were no precise values measured in the field, only ranges taken from the literature [41] for a given soil species.
It was decided in the first approach to take the value from the middle of the range. In the second step they were slightly modified using the category of soil agricultural suitability and soil texture of the lower part of the soil profile. The final values taken for Random Forest modeling can be seen in Table A1 in Appendix A .
2.3.3. Random Forest Regression
Random forest regression model was trained using the scikit-learn package in Python. As the dataset is non-uniform across the soil moisture range (Figure 3), split for training (80%) and validation (20%) datasets was performed using the stratification for bins of 10% width.
For the same reason weights were applied at the model fitting stage, calculated as an inverse of the measurements count in the given bin. Random forest regressor model parameters were fine-tuned manually by minimizing the RMSE and maximizing the R2 parameter values while avoiding overfitting on the train dataset. Applied parameters are shown in Table 4.
3. Results
3.1. Analysis of Soil Roughness Using Polarimetric Decomposition
For soil roughness analysis, the fields characterized by visually differentiated soil roughness and more or less similar soil moisture measured in the field (19% - 25%) were selected, to minimize the impact of this factor on radar penetration depth, backscattering coefficient, and polarimetric signatures. Because soil roughness was assessed solely visually, divided into three classes, this study only provides a rough analysis of the correspondence of soil surface roughness with polarimetric signal decomposition channels. A more detailed analysis of relations between polarimetric channels and soil roughness using precise soil DTM derived from drones, taking into account also soil texture, is being prepared as a separate publication.
Visual analysis of soil roughness, based on images taken during field measurements, with polarimetric signal decomposition products revealed a lack of correspondence between soil surface roughness and polarimetric signal decomposition channels. In many cases, even very rough soil surfaces corresponded to polarimetric channel values characteristic for smooth surfaces (Bragg surfaces). Soils with a relatively smooth surface could also be rough to radar (high volume scattering values). Examples of such situations are shown in Figure 4.
Analysis of these inconsistencies, together with the knowledge about the study area acquired during field measurements and soil maps, shows that soils that were heavily loosened (e.g., prepared for sowing) or characterized by a lower clay fraction were considered rough by radar expressed by increase of volume scattering. This seems to indicate that radar soil roughness, expressed through polarimetric channels, is related more to the ability of microwave radiation to penetrate below the soil surface, than to the roughness of the soil surface itself. These are preliminary conclusions resulting from the initial data analysis and require further investigation, based on additional data on surface roughness, obtained, for example, from high resolution DTM from drones, and a more detailed analysis of soil parameters such as soil structure and texture, which is beyond the scope of this study.
3.2. Modeling Soil Moisture Without Soil Parameters
Figure 5 shows the results of soil moisture random forest modeling using only the backscatter coefficient values. The best results were achieved by considering only the VV and VH channels and the local incidence angle without SPAN channel and the VH/VV ratio. The results are relatively poor. Clearly, there is an overestimation of values for low soil moisture and an underestimation for high soil moisture. The accuracy of moisture determination decreases with increasing humidity, which is likely due to, among others, the significantly smaller number of measurements with higher soil moisture. Due to the frequent drought phenomena in Poland in recent years, such data are increasingly difficult to obtain. The accuracy of soil moisture determination compared to field measurements is 7.15% at R2 = 0.46.
The slightly better results were achieved when dual-polarimetric signal decomposition was added to the modeling (Figure 6). In this case, the best results were achieved using C11, C22 matrix elements and Volume_g, Surface_r, Ratio_b channels from the Dual-Pol Model Based Decomposition and Projected Local Incidence Angle. The improvement in results is visible in a slightly better correlation coefficient R2=0.50 against R2=0.46 for backscattering only and in a slightly smaller RMSE: 6.94% vs. 7.15%. The overestimation of low values and underestimation of high values are similar.
By far the greatest improvement occurred after including soil texture, expressed as the percentage of clay (particles < 0.002) in the soil, in the model. The modeling results are presented in Figure 7 for backscattering data and Figure 8 for polarimetric data.
It is clearly seen that the soil texture significantly improved modeling accuracy. The difference between data modeled with and without polarimetric channels also disappeared. The result obtained using the backscattering coefficient is even better. They are characterized by less overestimation of low values and underestimation of high values - the regression slope of y = 0.743x for backscattering compared to y = 0.695x for polarimetry. The final soil moisture accuracy was 5.16% with R2 = 0.71.
Finally, a correlation analysis was conducted between the clay content for selected points characterized by small diversity of soil moisture (19% < SM < 25%) and products of polarimetric decompositions. The analyses performed did not show any significant correlations between the content of clay particles and any of the dual-polarimetric products.
4. Discussion
The results of the study show that soil surface roughness cannot be simply related to “radar” terrain roughness expressed using polarimetric channels. Dual-polarimetric products rather reflect “radar soil roughness”, which is not identical to surface roughness due to the possibility of microwave radiation to penetrate into the soil, especially in highly loosened soils with low moisture content. In such cases, volume scattering increases due to the penetration of microwave radiation below the soil surface, which can occur in both smooth and rough soil surfaces. These results do not, of course, mean that knowledge of soil surface roughness is not an important parameter in modeling soil moisture from SAR data. Many authors point to improved accuracy in soil moisture modeling when roughness is taken into account in the case of various radar wavelengths [5,25,26,27]. It should also be noted that presented studies cover a much wider range of soil roughness variations than the soil roughness limits, which are the boundary conditions for models described in the literature [21].
Visual analysis of products of polarimetric decompositions also revealed that there can be quite significant differences e.g. of Alpha parameter from HAlpha Decomposition within a single field (Fig.). However, analysis of soil moisture differences from available points for such fields and visual assessment of the roughness of these fields during terrain campaigns do not allow for drawing clear conclusions about the causes of these differences. This is likely a result of various soil parameters, which, in addition to moisture, texture, and degree of loosening, probably also include differences in organic matter content and local differences in soil structure. Further detailed study is required based on precise field measurements of soil parameters and surface roughness using high-resolution DSM.
The results of the random forest modeling also showed that, in the absence of knowledge about soil parameters, the availability of dual-polarization polarimetric channels can improve the accuracy of soil moisture determinations. However, this improvement is not significant. It should be noted, however, that in these analyses, a relatively small number of points were available for wet soils compared to soils with low and medium moisture content. This is undoubtedly a significant factor, even though during the random forest analysis, points were weighted based on their number in specific moisture ranges. Significantly increasing the number of measurements from soils with high moisture content would be very beneficial for these analyses.
The fact that good soil moisture estimation can be achieved using texture rather than roughness is crucial for developing soil moisture models as surface roughness can vary over time due to agricultural practices. Soil texture is a much more stable property over time, and as these studies demonstrate, even relatively imprecise knowledge of clay content alone can significantly improve the results. It is clearly seen that radar data alone are insufficient to accurately determine soil moisture with good spatial resolution for areas characterized by high environmental variability. This is because soil moisture is only one of many factors influencing the radar signal. Adding additional input parameters to the model, such as soil texture, significantly improves the accuracy of the obtained results. There appears to be potential for further improvement of these results by incorporating more precise texture information from field measurements, which also take into account the silt and sand fractions in the soil. Other authors also point to the significant importance of texture in soil moisture modeling [18]. It is also essential to incorporate the influence of vegetation cover into analyses.
These conclusions are consistent with other studies, which indicate that incorporating high-resolution spatial information on various environmental parameters, including soil texture [16,18,36] and/or various advanced modeling methods [24] into the determination of soil moisture from satellite data is a very promising direction of development. This allows for combining high spatial resolution with extensive coverage. This applies not only to SAR data but also to radiometers and other sensors [8,24]. Direct comparison of the results of this study with these solutions is not possible due to differences in environmental conditions, factors considered, such as vegetation, or validation methods. Nevertheless, their combined analysis leads to the conclusion that obtaining a high-quality, broadly applicable soil moisture model requires high-resolution spatial information, preferably derived from satellite data, on other environmental parameters, including soil. Soil texture appears to be a key element, preferable to roughness because it does not change dramatically over time, especially in relatively flat areas. Therefore, developing methods for determining it from satellite data appears to be an important step toward better and more accurate soil moisture models.
5. Conclusions
The surface soil roughness has a very limited relationship with the soil roughness observed by the SAR system, expressed using polarimetric signal decompositions. It appears that "polarimetric" soil roughness is related more to the ease and depth of microwave penetration into the soil than to real soil surface roughness. The penetration depth of this radiation appears to be primarily determined by soil moisture, soil species (texture), as well as agricultural practices that influence the degree of soil loosening. Clay content in the soil is a more important driver that should be considered when modeling soil moisture with SAR than soil roughness. It is possible to obtain high accuracy soil moisture measurements using a single model for a wide variety of soil species and soil roughness, from very smooth to even very rough, without any knowledge of this parameter, provided at least approximate information about the clay content in the soil is available. This appears to be related to the significant impact of clay content in soil on the soil's ability to retain water, and thus on the observed moisture range for a given soil species under specific climatic conditions and water relations occurring in a given area, related to the topography and the amount and intensity of atmospheric precipitation. There is a need for further soil moisture studies using SAR, taking into account actual field measurements of soil texture, rather than just their approximate values obtained from soil maps based on soil species. It also seems important to explore remote sensing methods for determining soil texture.
Author Contributions
Conceptualization, D.Z.; methodology, D.Z. and S.J.; software, S.J.; validation, D.Z. and S.J.; formal analysis, D.Z. and S.J.; investigation, D.Z. and S.J.; resources, D.Z.; data curation, D.Z. and S.J.; writing—original draft preparation, D.Z. and S.J.; writing—review and editing, D.Z. and S.J.; visualization, D.Z. and S.J.; supervision, D.Z.; project administration, D.Z.; funding acquisition, D.Z. All authors have read and agreed to the published version of the manuscript.
Data Availability Statement
The original data presented in the study are openly available in rf_soil_moisture_prediction_2025 repository at https://github.com/Remote-Sensing-Centre/rf_soil_moisture_prediction_2025.
Conflicts of Interest
The authors declare no conflicts of interest.
Appendix A
Appendix A.1
Table A1.
The soils of the study areas. Abbreviations of Polish names of soil species (texture) are marked in brackets, because the Polish legend is more detailed than the English terms. Categories of soil agricultural suitability (soil complexes): 1. very good wheat complex; 2. good wheat complex; 3. defective wheat complex; 4. very good rye complex (wheat-rye); 5. good rye complex; 6. weak rye complex; 7. very weak rye complex (rye-lupin); 8. strong grain-fodder complex; 9. weak grain-fodder complex; 1z. very good and good grassland; 2z. medium grassland.
| Type | Texture | Soil complex | Number of fields | Number of measurements | Range of clay content [%] | Clay % value selected for modeling |
|---|---|---|---|---|---|---|
| Podzols | Clay loam | 8 | 1 | 6 | > 50 | 50 |
| Podzols | Loam | 2 | 1 | 6 | 35 - 50 | 42 |
| Podzols | Loamy sand (pgl) | 4 | 11 | 73 | 15-10 | 13 |
| Podzols | Loamy sand (pgl) | 5 | 8 | 31 | 15-10 | 13 |
| Podzols | Loamy sand (pglp) | 5 | 1 | 5 | 15-10 | 13 |
| Podzols | Sand (ps) | 5 | 3 | 13 | 10-5 | 7 |
| Podzols | Sand (ps) | 6 | 1 | 2 | 10-5 | 7 |
| Podzols | Silt | 4 | 2 | 8 | 0 - 35 | 30 |
| Podzols | Silt | 5 | 1 | 2 | 0 - 35 | 15 |
| Brown soils | Loess | 1 | 2 | 6 | > 35 | 42 |
| Brown soils | Loess | 2 | 4 | 11 | > 35 | 42 |
| Brown soils | Loess | 3 | 1 | 2 | > 35 | 42 |
| Brown soils | Sandy loam (pgmp) | 4 | 1 | 3 | 15 - 20 | 18 |
| Acid brown soils | Sandy loam (gl) | 2 | 1 | 4 | 25 - 35 | 30 |
| Acid brown soils | Loamy sand (pgl) | 4 | 1 | 3 | 15-10 | 13 |
| Acid brown soils | Loamy sand (pgl) | 6 | 1 | 6 | 15-10 | 11 |
| Acid brown soils | Loamy sand (pglp) | 5 | 2 | 6 | 15-10 | 12 |
| Acid brown soils | Loamy sand (pglp) | 6 | 1 | 2 | 15-10 | 11 |
| Acid brown soils | Loamy sand (pgm) | 2 | 1 | 4 | 15 - 20 | 18 |
| Acid brown soils | Sand (ps) | 6 | 6 | 24 | 10-5 | 7 |
| Acid brown soils | Loamy sand (psp) | 6 | 1 | 14 | 10-5 | 8 |
| Leached brown soils | Sandy loam (pgmp) | 2 | 1 | 4 | 15 - 20 | 18 |
| Leached brown soils | Silt | 2 | 1 | 3 | 0 - 35 | 30 |
| Leached brown soils | Silt | 4 | 1 | 2 | 0 - 35 | 30 |
| Black earths | Sandy loam (glp) | 2 | 1 | 4 | 25 - 35 | 30 |
| Black earths | Loamy sand (pgm) | 1 | 3 | 13 | 15 - 20 | 18 |
| Black earths | Loamy sand (pgm) | 2 | 3 | 9 | 15 - 20 | 18 |
| Black earths | Loamy sand (pgm) | 8 | 1 | 2 | 15 - 20 | 18 |
| Black earths | Silt | 8 | 1 | 10 | 25 - 35 | 32 |
| Degraded black soil | Sandy loam (glp) | 8 | 4 | 26 | 25 - 35 | 30 |
| Degraded black soil | Loamy sand (pglp) | 9 | 2 | 5 | 15-10 | 11 |
| Degraded black soil | Loamy sand (pgm) | 2 | 2 | 15 | 15 - 20 | 18 |
| Degraded black soil | Sandy loam (pgmp) | 2 | 1 | 2 | 15 - 20 | 18 |
| Degraded black soil | Sand (ps) | 6 | 2 | 38 | 10-5月 | 7 |
| Degraded black soil | Silt | 1 | 5 | 32 | 25 - 35 | 32 |
| Degraded black soil | Silt | 2 | 9 | 89 | 0 - 35 | 27 |
| Alluvial soils | Very heavy aluvium | 8 | 1 | 5 | > 50 | 50 |
| Alluvial soils | Heavy aluvium | 1 | 1 | 6 | 35 - 50 | 43 |
| Alluvial soils | Heavy aluvium | 2 | 4 | 17 | 35 - 50 | 43 |
| Alluvial soils | Heavy aluvium | 8 | 2 | 2 | 35 - 50 | 43 |
| Alluvial soils | Clay loam | 8 | 2 | 6 | > 50 | 50 |
| Alluvial soils | (gcp) | 8 | 1 | 3 | > 50 | 50 |
| Alluvial soils | Sandy loam (glp) | 1 | 2 | 6 | 25 - 35 | 30 |
| Alluvial soils | Sandy loam (glp) | 2 | 1 | 2 | 25 - 35 | 30 |
| Alluvial soils | Loam | 2 | 3 | 3 | 35 - 50 | 42 |
| Alluvial soils | Loam | 8 | 1 | 1 | 35 - 50 | 42 |
| Alluvial soils | Sandy clay | 2 | 1 | 6 | > 50 | 52 |
| Alluvial soils | Loamy sand (pgl) | 4 | 1 | 4 | 15-10 | 12 |
| Alluvial soils | Sandy loam (pgmp) | 2 | 2 | 12 | 15 - 20 | 18 |
| Alluvial soils | Sand (ps) | 5 | 2 | 16 | 10-5 | 7 |
| Alluvial soils | Sand (ps) | 6 | 1 | 17 | 10-5 | 7 |
| Alluvial soils | Silt | 1 | 5 | 74 | 0 - 35 | 33 |
| Alluvial soils | Silt | 2 | 4 | 11 | 25 - 35 | 30 |
| Alluvial soils | Medium aluvium | 2 | 1 | 3 | 21 - 35 | 28 |
| Alluvial soils | Medium aluvium | 4 | 1 | 2 | 21 - 35 | 28 |
| Alluvial soils | Medium aluvium | 8 | 1 | 1 | 21 - 35 | 28 |
| Black earths | Loamy sand (pgm) | 2z | 1 | 2 | 15 - 20 | 18 |
| Degraded black soil | Silt | 2z | 2 | 26 | 0 - 35 | 27 |
| Alluvial soils | Very heavy aluvium | 1z | 1 | 6 | > 50 | 50 |
| Alluvial soils | Very heavy aluvium | 2z | 1 | 3 | > 50 | 50 |
| Alluvial soils | Sandy loam (glp) | 2z | 1 | 4 | 25 - 35 | 30 |
| Alluvial soils | Silt loam (płi) | 2z | 2 | 6 | 35 - 50 | 43 |
| Alluvial soils | Silt | 2z | 3 | 77 | 0 - 35 | 25 |
| Gleyic Fluvisols | Very heavy aluvium | 2z | 2 | 6 | > 50 | 50 |
References
- Verhoest, N.E.C.; Lievens, H.; Wagner, W.; Álvarez-Mozos, J.; Moran, M.S.; Mattia, F. On the Soil Roughness Parameterization Problem in Soil Moisture Retrieval of Bare Surfaces from Synthetic Aperture Radar. Sensors 2008, 8, 4213–4248. [Google Scholar] [CrossRef]
- Beck, H.E.; Pan, M.; Miralles, D.G.; Reichle, R.H.; Dorigo, W.A.; Hahn, S.; Sheffield, J.; Karthikeyan, L.; Balsamo, G.; Parinussa, R.M.; et al. Evaluation of 18 Satellite- and Model-Based Soil Moisture Products Using in Situ Measurements from 826 Sensors. Hydrol. Earth Syst. Sci. 2021, 25, 17–40. [Google Scholar] [CrossRef]
- National Snow and Ice Data Center AMSR-E/Aqua Daily L3 Surface Soil Moisture, Interpretive Parameters, & QC EASE-Grids, Version 2 2023.
- Kerr, Y.H.; Waldteufel, P.; Wigneron, J.-P.; Delwart, S.; Cabot, F.; Boutin, J.; Escorihuela, M.-J.; Font, J.; Reul, N.; Gruhier, C.; et al. The SMOS Mission: New Tool for Monitoring Key Elements Ofthe Global Water Cycle. Proc. IEEE 2010, 98, 666–687. [Google Scholar] [CrossRef]
- Bai, X.; He, B.; Li, X. Optimum Surface Roughness to Parameterize Advanced Integral Equation Model for Soil Moisture Retrieval in Prairie Area Using Radarsat-2 Data. IEEE Trans. Geosci. Remote Sensing 2016, 54, 2437–2449. [Google Scholar] [CrossRef]
- Aubert, M.; Baghdadi, N.N.; Zribi, M.; Ose, K.; El Hajj, M.; Vaudour, E.; Gonzalez-Sosa, E. Toward an Operational Bare Soil Moisture Mapping Using TerraSAR-X Data Acquired Over Agricultural Areas. IEEE J. Sel. Top. Appl. Earth Observations Remote Sensing 2013, 6, 900–916. [Google Scholar] [CrossRef]
- El Hajj, M.; Baghdadi, N.; Zribi, M.; Bazzi, H. Synergic Use of Sentinel-1 and Sentinel-2 Images for Operational Soil Moisture Mapping at High Spatial Resolution over Agricultural Areas. Remote Sensing 2017, 9, 1292. [Google Scholar] [CrossRef]
- Han, Q.; Zeng, Y.; Zhang, L.; Wang, C.; Prikaziuk, E.; Niu, Z.; Su, B. Global Long Term Daily 1 Km Surface Soil Moisture Dataset with Physics Informed Machine Learning. Sci Data 2023, 10, 101. [Google Scholar] [CrossRef]
- Juglea, S.; Kerr, Y.; Mialon, A.; Wigneron, J.-P.; Lopez-Baeza, E.; Cano, A.; Albitar, A.; Millan-Scheiding, C.; Carmen Antolin, M.; Delwart, S. Modelling Soil Moisture at SMOS Scale by Use of a SVAT Model over the Valencia Anchor Station. Hydrol. Earth Syst. Sci. 2010, 14, 831–846. [Google Scholar] [CrossRef]
- Kerr, Y.H.; Waldteufel, P.; Richaume, P.; Wigneron, J.P.; Ferrazzoli, P.; Mahmoodi, A.; Al Bitar, A.; Cabot, F.; Gruhier, C.; Juglea, S.E.; et al. The SMOS Soil Moisture Retrieval Algorithm. IEEE Trans. Geosci. Remote Sensing 2012, 50, 1384–1403. [Google Scholar] [CrossRef]
- Lievens, H.; De Lannoy, G.J.M.; Al Bitar, A.; Drusch, M.; Dumedah, G.; Hendricks Franssen, H.-J.; Kerr, Y.H.; Tomer, S.K.; Martens, B.; Merlin, O.; et al. Assimilation of SMOS Soil Moisture and Brightness Temperature Products into a Land Surface Model. Remote Sensing of Environment 2016, 180, 292–304. [Google Scholar] [CrossRef]
- Ridler, M.; Madsen, H.; Stisen, S.; Bircher, S.; Fensholt, R. Assimilation of SMOS -derived Soil Moisture in a Fully Integrated Hydrological and Soil-vegetation-atmosphere Transfer Model in W Estern D Enmark. Water Resources Research 2014, 50, 8962–8981. [Google Scholar] [CrossRef]
- Rodríguez-Fernández, N.; De Rosnay, P.; Albergel, C.; Richaume, P.; Aires, F.; Prigent, C.; Kerr, Y. SMOS Neural Network Soil Moisture Data Assimilation in a Land Surface Model and Atmospheric Impact. Remote Sensing 2019, 11, 1334. [Google Scholar] [CrossRef]
- Beale, J.; Waine, T.; Evans, J.; Corstanje, R. A Method to Assess the Performance of SAR-Derived Surface Soil Moisture Products. IEEE J. Sel. Top. Appl. Earth Observations Remote Sensing 2021, 14, 4504–4516. [Google Scholar] [CrossRef]
- Baghdadi, N.; Zribi, M.; Paloscia, S.; Verhoest, N.; Lievens, H.; Baup, F.; Mattia, F. Semi-Empirical Calibration of the Integral Equation Model for Co-Polarized L-Band Backscattering. Remote Sensing 2015, 7, 13626–13640. [Google Scholar] [CrossRef]
- Gorrab, A.; Zribi, M.; Baghdadi, N.; Mougenot, B.; Fanise, P.; Chabaane, Z. Retrieval of Both Soil Moisture and Texture Using TerraSAR-X Images. Remote Sensing 2015, 7, 10098–10116. [Google Scholar] [CrossRef]
- Domenech, M.B.; Amiotti, N.M.; Costa, J.L.; Castro-Franco, M. Prediction of Topsoil Properties at Field-Scale by Using C-Band SAR Data. International Journal of Applied Earth Observation and Geoinformation 2020, 93, 102197. [Google Scholar] [CrossRef]
- Stanyer, C.; Seco-Rizo, I.; Atzberger, C.; Marti-Cardona, B. Soil Texture, Soil Moisture, and Sentinel-1 Backscattering: Towards the Retrieval of Field-Scale Soil Hydrological Properties. Remote Sensing 2025, 17, 542. [Google Scholar] [CrossRef]
- Hajnsek, I.; Jagdhuber, T.; Schon, H.; Papathanassiou, K.P. Potential of Estimating Soil Moisture Under Vegetation Cover by Means of PolSAR. IEEE Trans. Geosci. Remote Sensing 2009, 47, 442–454. [Google Scholar] [CrossRef]
- Dabrowska-Zielinska, K.; Musial, J.; Malinska, A.; Budzynska, M.; Gurdak, R.; Kiryla, W.; Bartold, M.; Grzybowski, P. Soil Moisture in the Biebrza Wetlands Retrieved from Sentinel-1 Imagery. Remote Sensing 2018, 10, 1979. [Google Scholar] [CrossRef]
- Chen, L.; Xing, M.; He, B.; Wang, J.; Xu, M.; Song, Y.; Huang, X. Estimating Soil Moisture over Winter Wheat Fields during Growing Season Using RADARSAT-2 Data. Remote Sensing 2022, 14, 2232. [Google Scholar] [CrossRef]
- Bhogapurapu, N.; Dey, S.; Homayouni, S.; Bhattacharya, A.; Rao, Y.S. Field-Scale Soil Moisture Estimation Using Sentinel-1 GRD SAR Data. Advances in Space Research 2022, 70, 3845–3858. [Google Scholar] [CrossRef]
- Bauer-Marschallinger, B.; Freeman, V.; Cao, S.; Paulik, C.; Schaufler, S.; Stachl, T.; Modanesi, S.; Massari, C.; Ciabatta, L.; Brocca, L.; et al. Toward Global Soil Moisture Monitoring With Sentinel-1: Harnessing Assets and Overcoming Obstacles. IEEE Trans. Geosci. Remote Sensing 2019, 57, 520–539. [Google Scholar] [CrossRef]
- Vergopolan, N.; Chaney, N.W.; Pan, M.; Sheffield, J.; Beck, H.E.; Ferguson, C.R.; Torres-Rojas, L.; Sadri, S.; Wood, E.F. SMAP-HydroBlocks, a 30-m Satellite-Based Soil Moisture Dataset for the Conterminous US. Sci Data 2021, 8, 264. [Google Scholar] [CrossRef] [PubMed]
- Zhang, X.; Chen, B.; Fan, H.; Huang, J.; Zhao, H. The Potential Use of Multi-Band SAR Data for Soil Moisture Retrieval over Bare Agricultural Areas: Hebei, China. Remote Sensing 2015, 8, 7. [Google Scholar] [CrossRef]
- Dubois, P.C.; Van Zyl, J.; Engman, T. Measuring Soil Moisture with Imaging Radars. IEEE Trans. Geosci. Remote Sensing 1995, 33, 915–926. [Google Scholar] [CrossRef]
- Baghdadi, N.; Choker, M.; Zribi, M.; Hajj, M.; Paloscia, S.; Verhoest, N.; Lievens, H.; Baup, F.; Mattia, F. A New Empirical Model for Radar Scattering from Bare Soil Surfaces. Remote Sensing 2016, 8, 920. [Google Scholar] [CrossRef]
- Akhavan, Z.; Hasanlou, M.; Hosseini, M.; McNairn, H. Decomposition-Based Soil Moisture Estimation Using UAVSAR Fully Polarimetric Images. Agronomy 2021, 11, 145. [Google Scholar] [CrossRef]
- Chung, J.; Lee, Y.; Kim, J.; Jung, C.; Kim, S. Soil Moisture Content Estimation Based on Sentinel-1 SAR Imagery Using an Artificial Neural Network and Hydrological Components. Remote Sensing 2022, 14, 465. [Google Scholar] [CrossRef]
- Dann, J.; Bennett, K.E.; Bolton, W.R.; Wilson, C.J. Factors Controlling a Synthetic Aperture Radar (SAR) Derived Root-Zone Soil Moisture Product over The Seward Peninsula of Alaska. Remote Sensing 2022, 14, 4927. [Google Scholar] [CrossRef]
- Bulut, Ü.; Mohammadi, B.; Duan, Z. Estimation of Surface Soil Moisture from Sentinel-1 Synthetic Aperture Radar Imagery Using Machine Learning Method. Remote Sensing Applications: Society and Environment 2024, 36, 101369. [Google Scholar] [CrossRef]
- Baghdadi, N.; Cresson, R.; El Hajj, M.; Ludwig, R.; La Jeunesse, I. Estimation of Soil Parameters over Bare Agriculture Areas from C-Band Polarimetric SAR Data Using Neural Networks. Hydrol. Earth Syst. Sci. 2012, 16, 1607–1621. [Google Scholar] [CrossRef]
- Baghdadi, N.; Cresson, R.; Pottier, E.; Aubert, M.; Mehrez, M.; Jacome, A.; Benabdallah, S. A Potential Use for the C-Band Polarimetric SAR Parameters to Characterize the Soil Surface Over Bare Agriculture Fields. IEEE Trans. Geosci. Remote Sensing 2012, 50, 3844–3858. [Google Scholar] [CrossRef]
- Baghdadi, N.; Dubois-Fernandez, P.; Dupuis, X.; Zribi, M. Sensitivity of Main Polarimetric Parameters of Multifrequency Polarimetric SAR Data to Soil Moisture and Surface Roughness Over Bare Agricultural Soils. IEEE Geosci. Remote Sensing Lett. 2013, 10, 731–735. [Google Scholar] [CrossRef]
- Cloude, S.R.; Pottier, E. A Review of Target Decomposition Theorems in Radar Polarimetry. IEEE Trans. Geosci. Remote Sensing 1996, 34, 498–518. [Google Scholar] [CrossRef]
- Zribi, M.; Kotti, F.; Lili-Chabaane, Z.; Baghdadi, N.; Ben Issa, N.; Amri, R. Analysis of Soil Texture Using TERRASAR X-Band SAR. In Proceedings of the 2012 IEEE International Geoscience and Remote Sensing Symposium; IEEE: Munich, Germany, July, 2012; pp. 7027–7030. [Google Scholar]
- Bousbih, S.; Zribi, M.; Pelletier, C.; Gorrab, A.; Lili-Chabaane, Z.; Baghdadi, N.; Ben Aissa, N.; Mougenot, B. Soil Texture Estimation Using Radar and Optical Data from Sentinel-1 and Sentinel-2. Remote Sensing 2019, 11, 1520. [Google Scholar] [CrossRef]
- Srivastava, H.S.; Patel, P.; Navalgund, R.R. Incorporating Soil Texture in Soil Moisture Estimation from Extended Low-1 Beam Mode RADARSAT-1 SAR Data. International Journal of Remote Sensing 2006, 27, 2587–2598. [Google Scholar] [CrossRef]
- https://www.imko.de Manual - TRIME PICO 64/32.
- Geoportal.gov.pl Agricultural Geoportal.
- Polskie Towarzystwo Gleboznawcze Klasyfikacja Uziarnienia Gleb i Utworów Mineralnych Polskiego Towarzystwa Gleboznawczego 2008, 2009. Soil Science Annual 60, 6–15.
- Gleboznawstwo: Praca Zbiorowa; Dobrzański, B. , Zawadzki, S., Eds.; Wyd. 2 popr. i uzup.; Państ. Wydaw. Rolnicze i Leśne: Warszawa, 1993; ISBN 978-83-09-01561-1. [Google Scholar]
Figure 1.
Location of study areas.
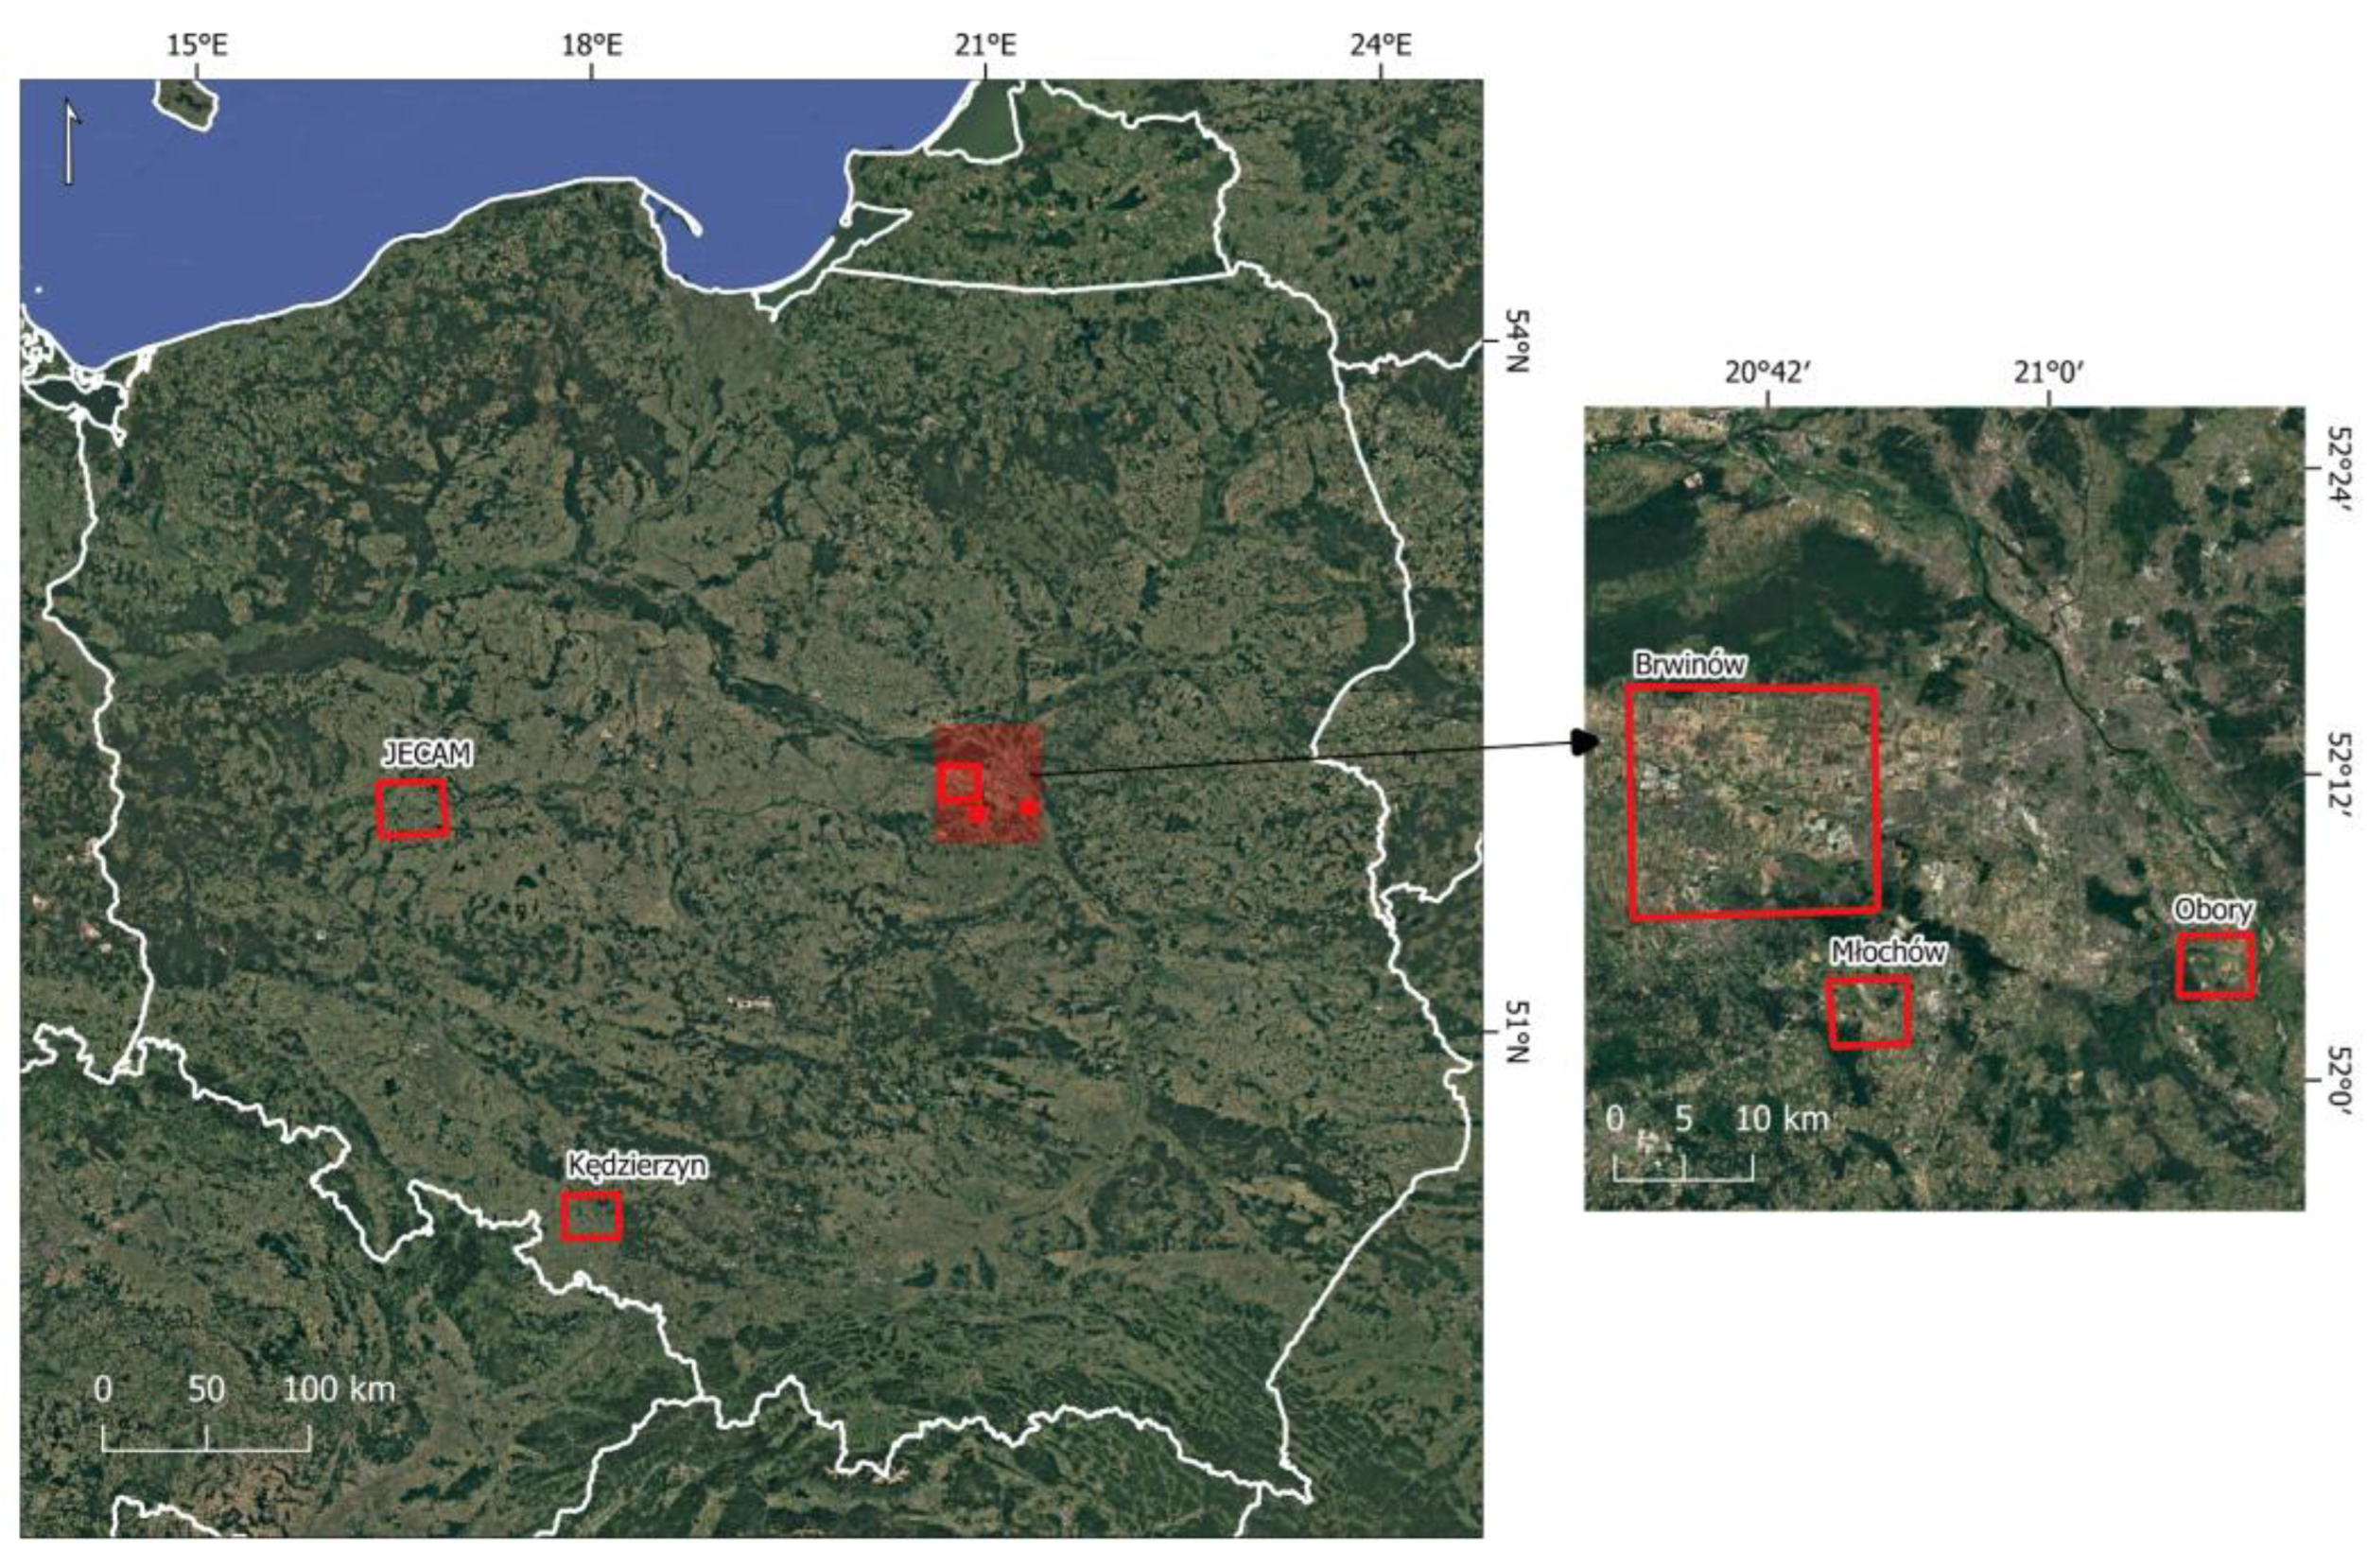
Figure 2.
Examples of the soil roughness variability.
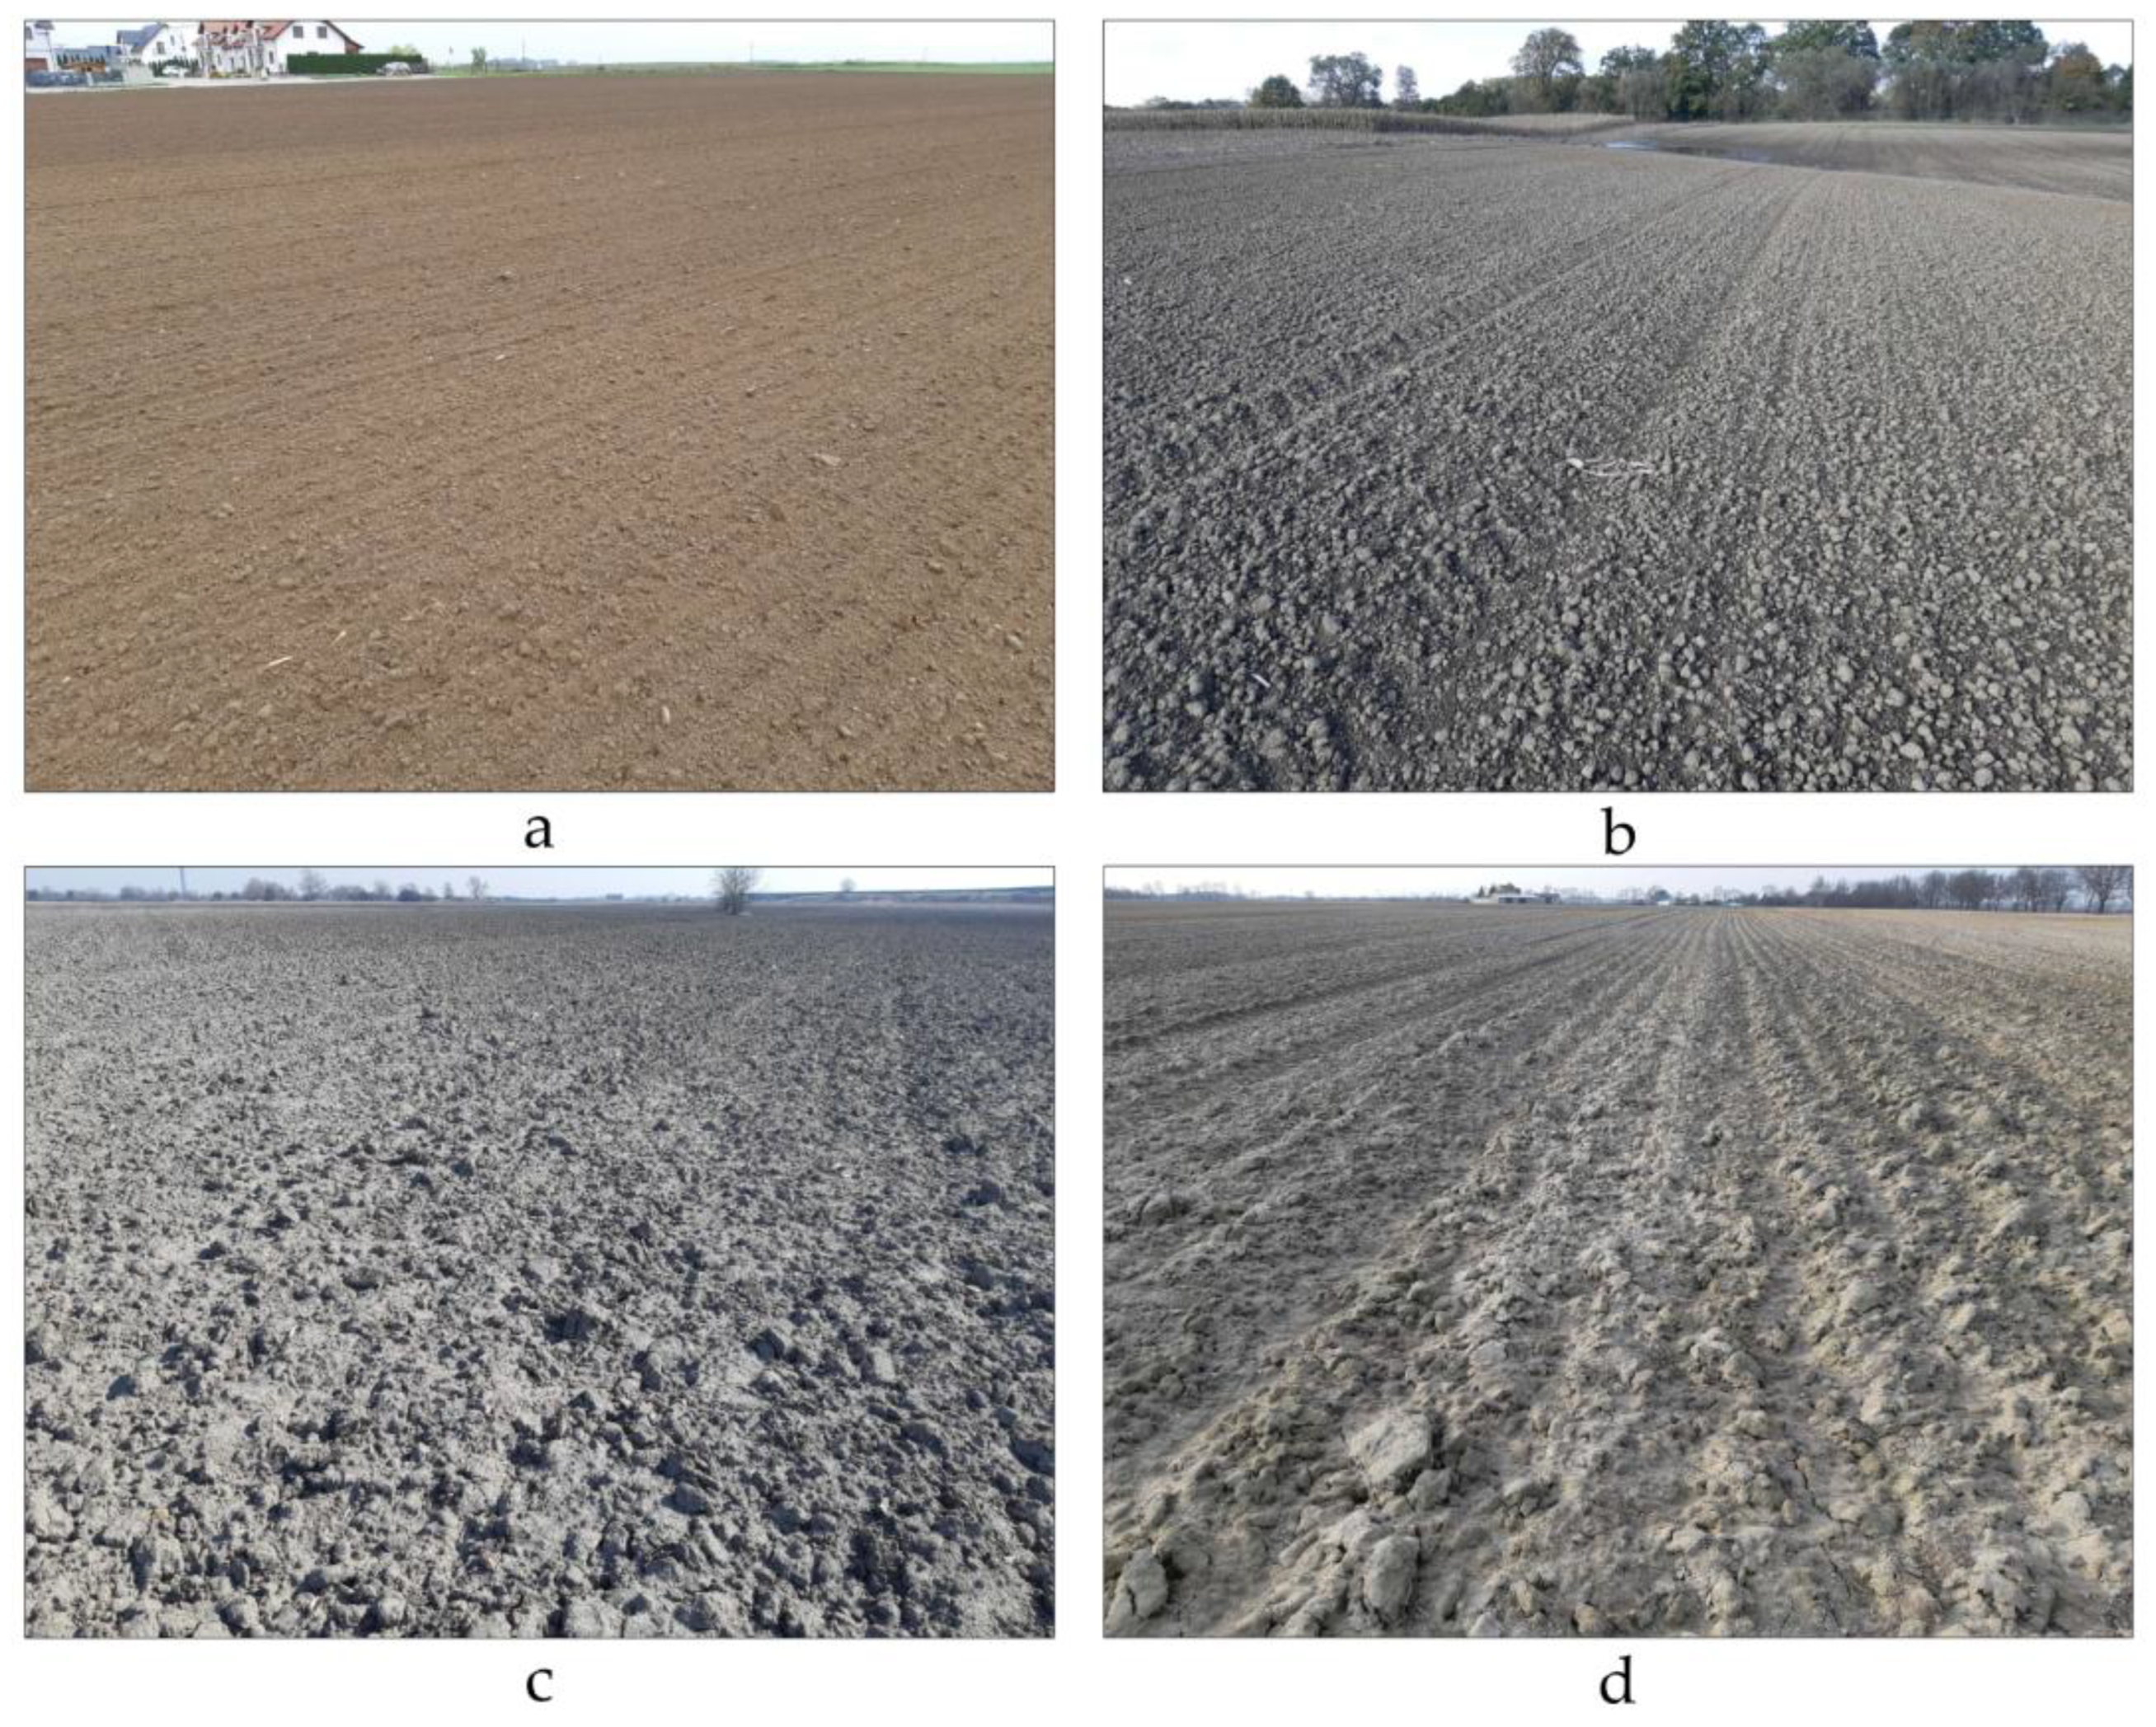
Figure 3.
Distribution of measured soil moisture values in bin used for data stratification.
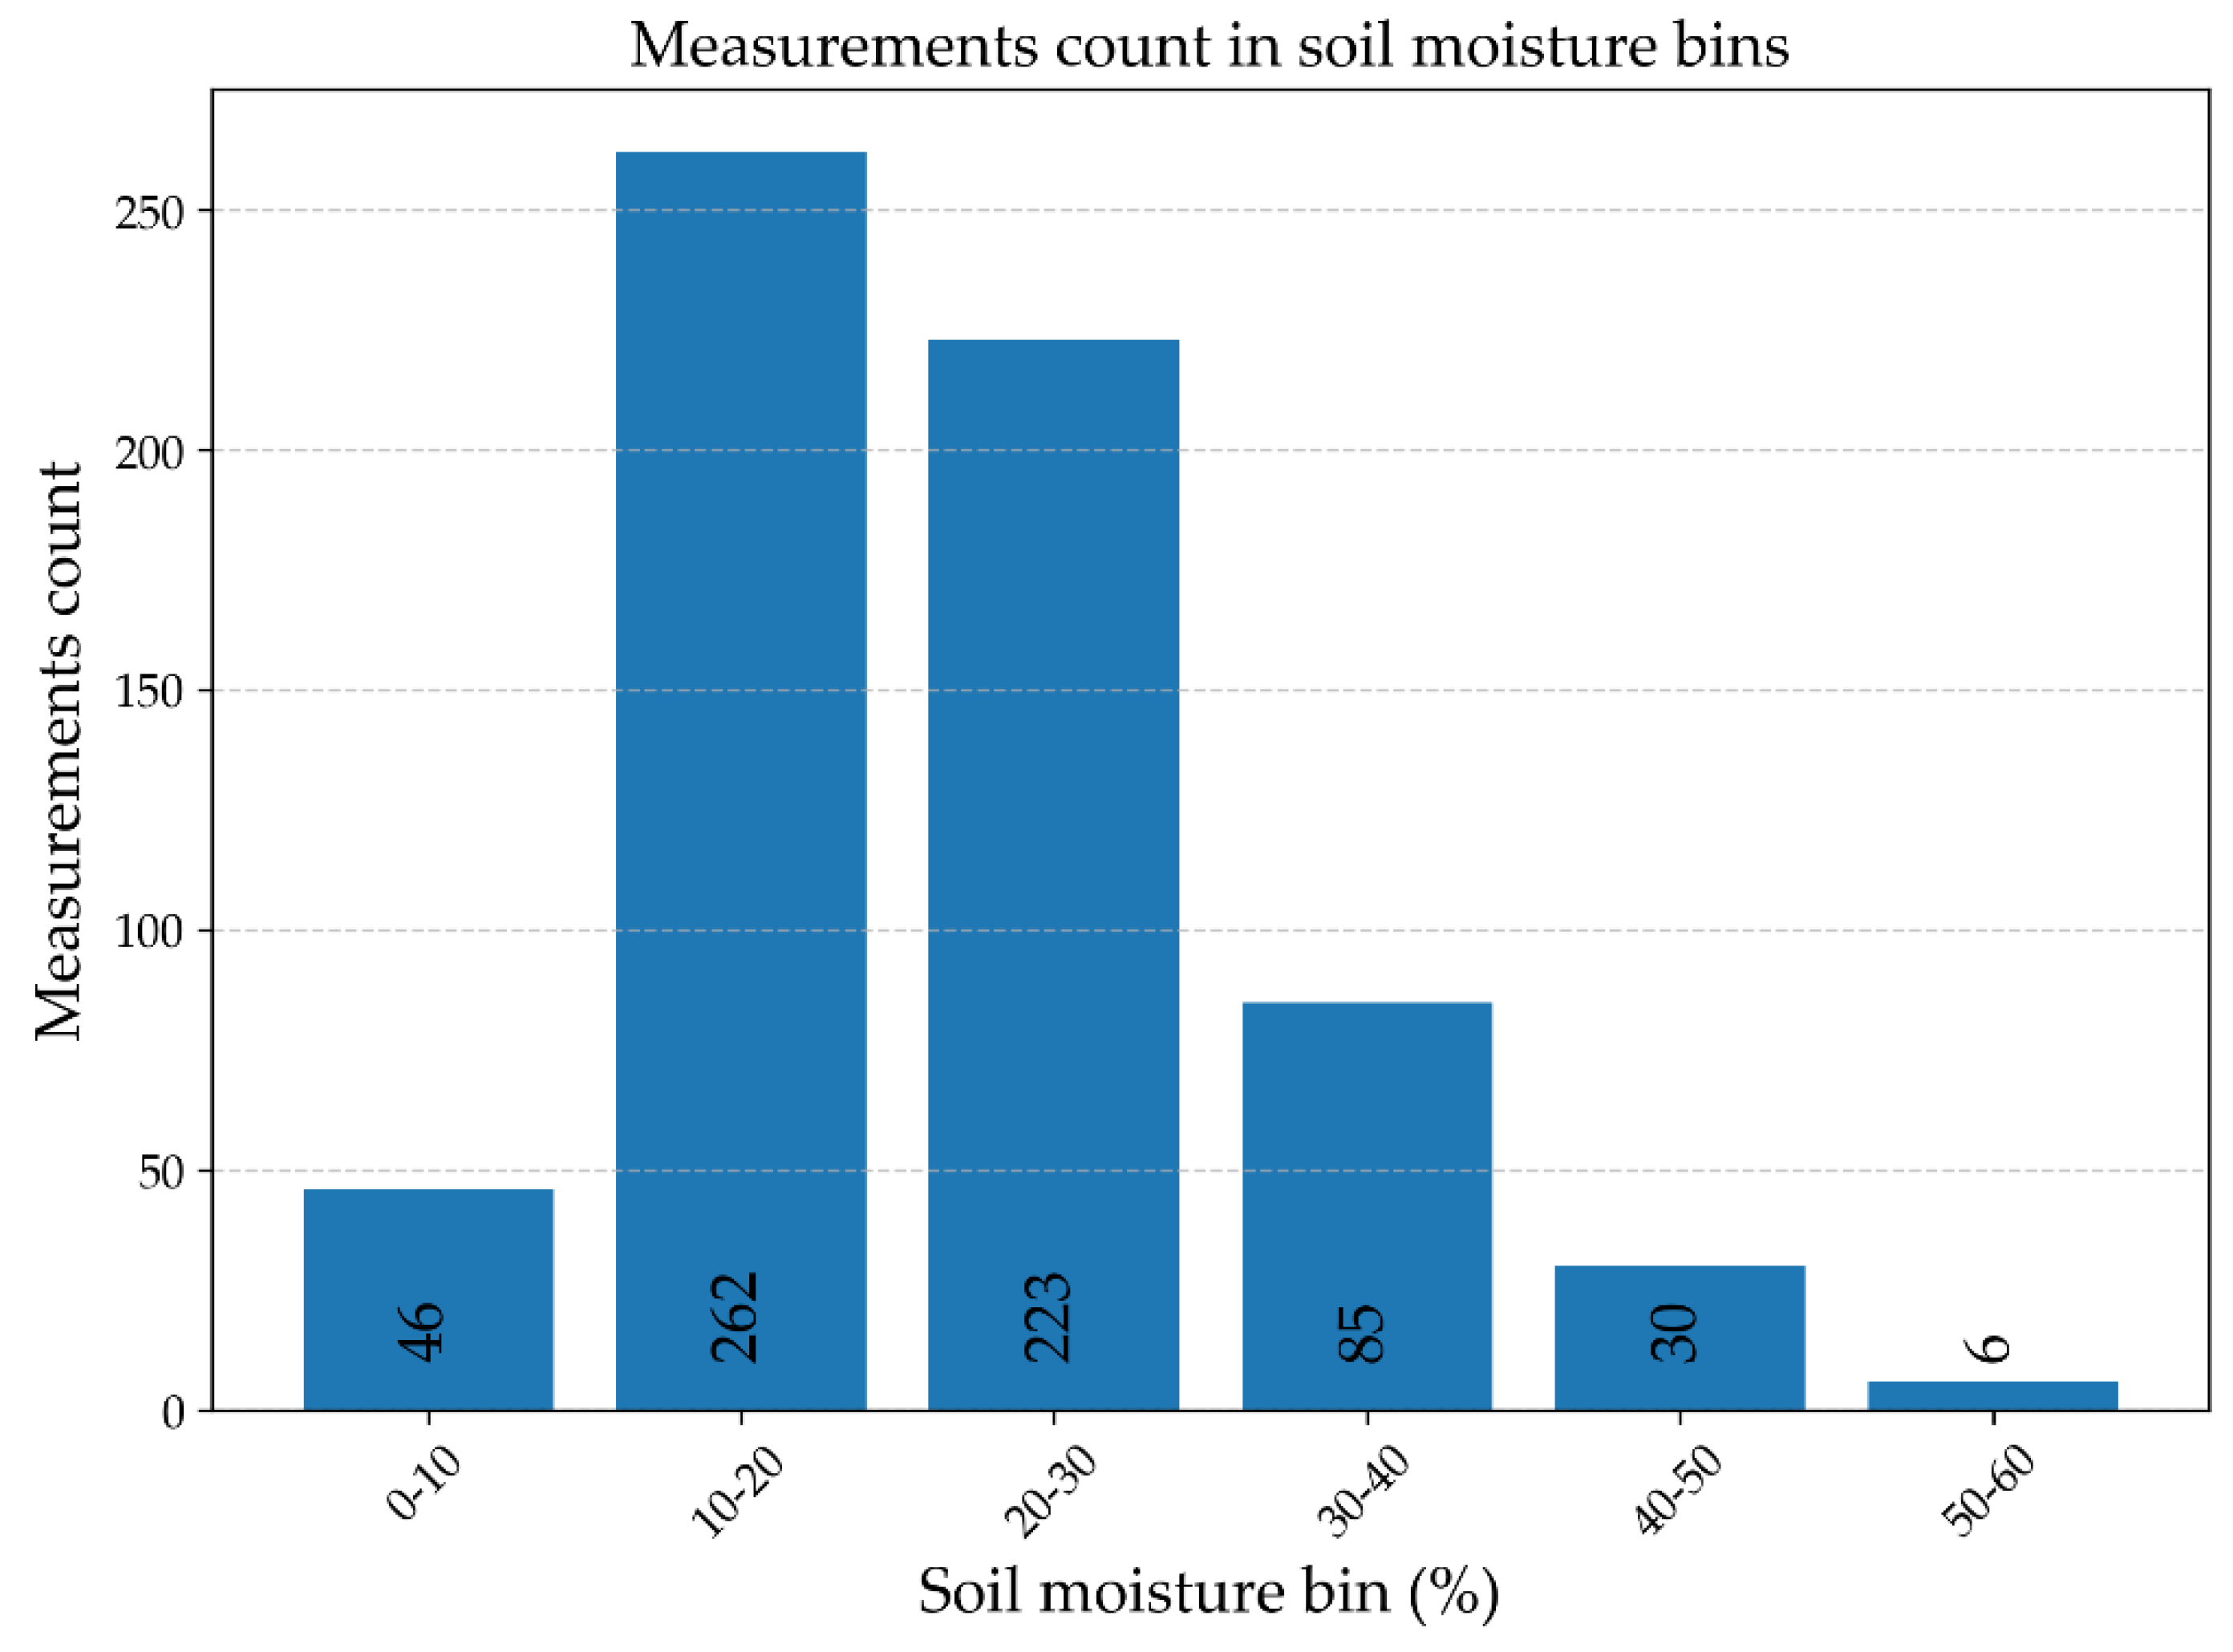
Figure 4.
The maps of Alpha parameter from H-Alpha Decomposition derived from Sentinel-1 image registered 21.03.2005. On the left side, for the plot with a very rough surface, the Alpha parameter values typical for very smooth (Bragg) surfaces can be observed. On the right side is a relatively smooth field with Alpha values typical for more rough surfaces. Both soils have similar texture but the one shown on the right is very well loosened.
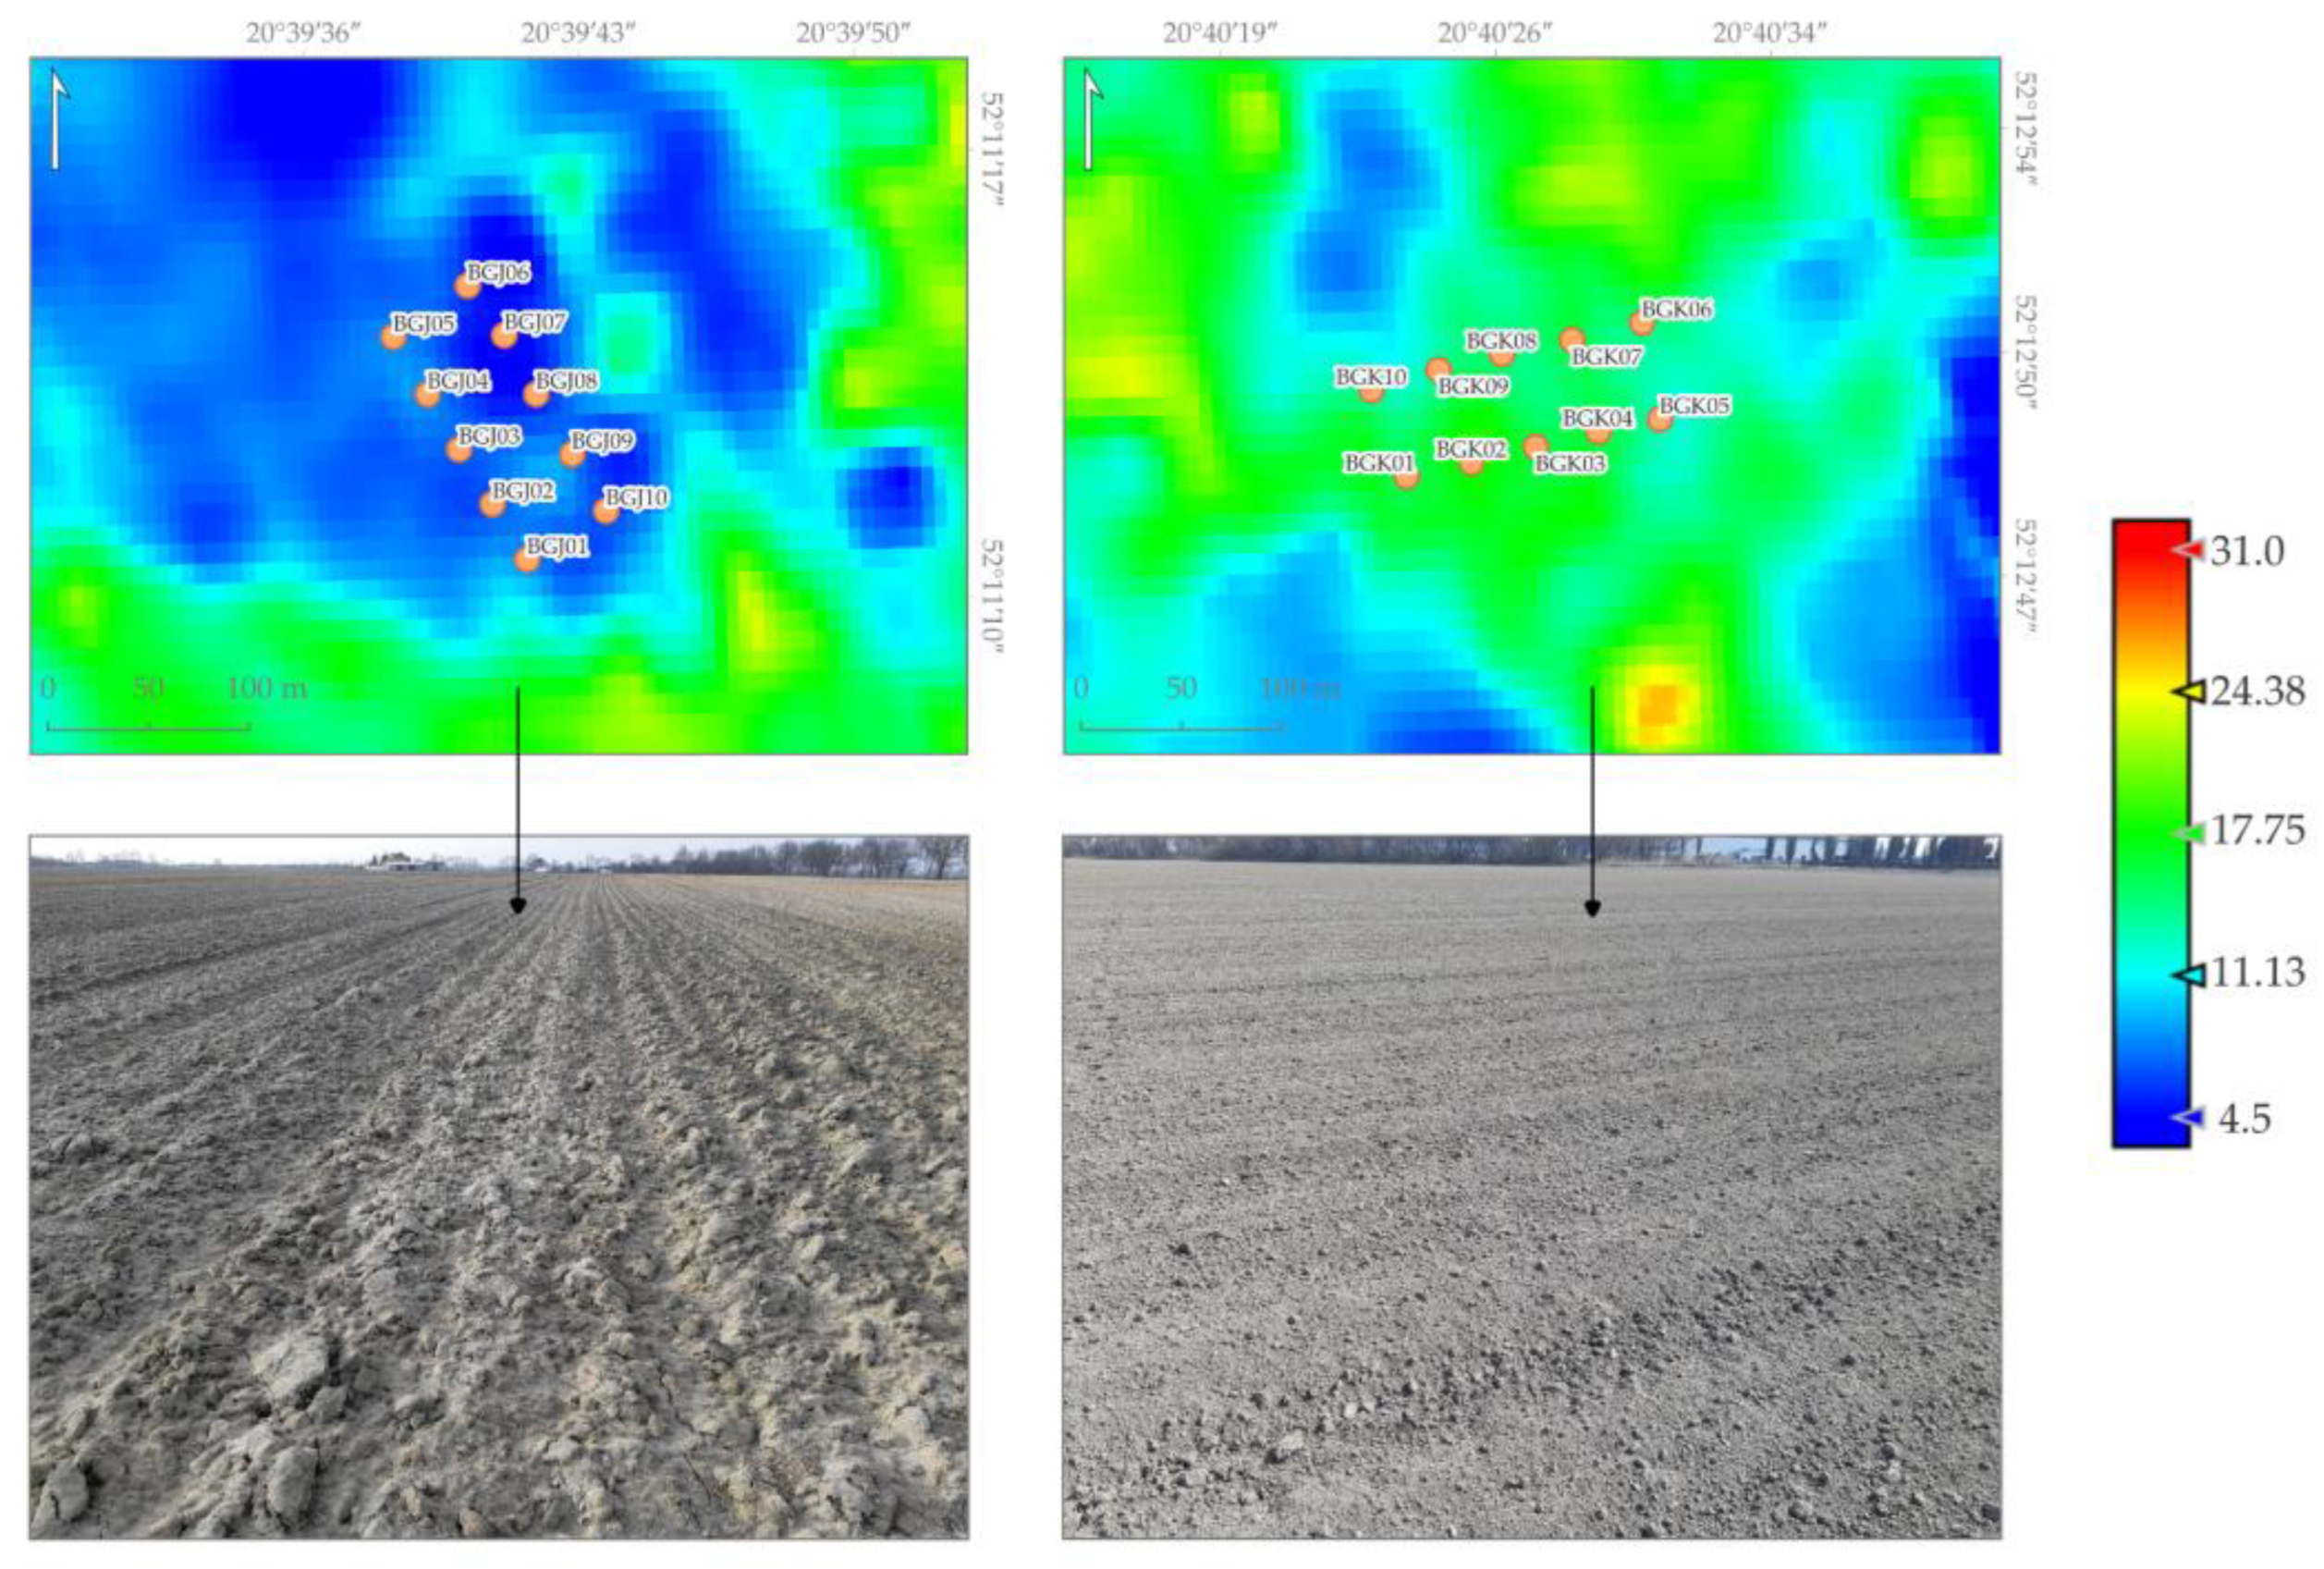
Figure 5.
The results of soil moisture modeling using Random Forest and backscattering coefficient from Sentinel-1 data.
Figure 5.
The results of soil moisture modeling using Random Forest and backscattering coefficient from Sentinel-1 data.
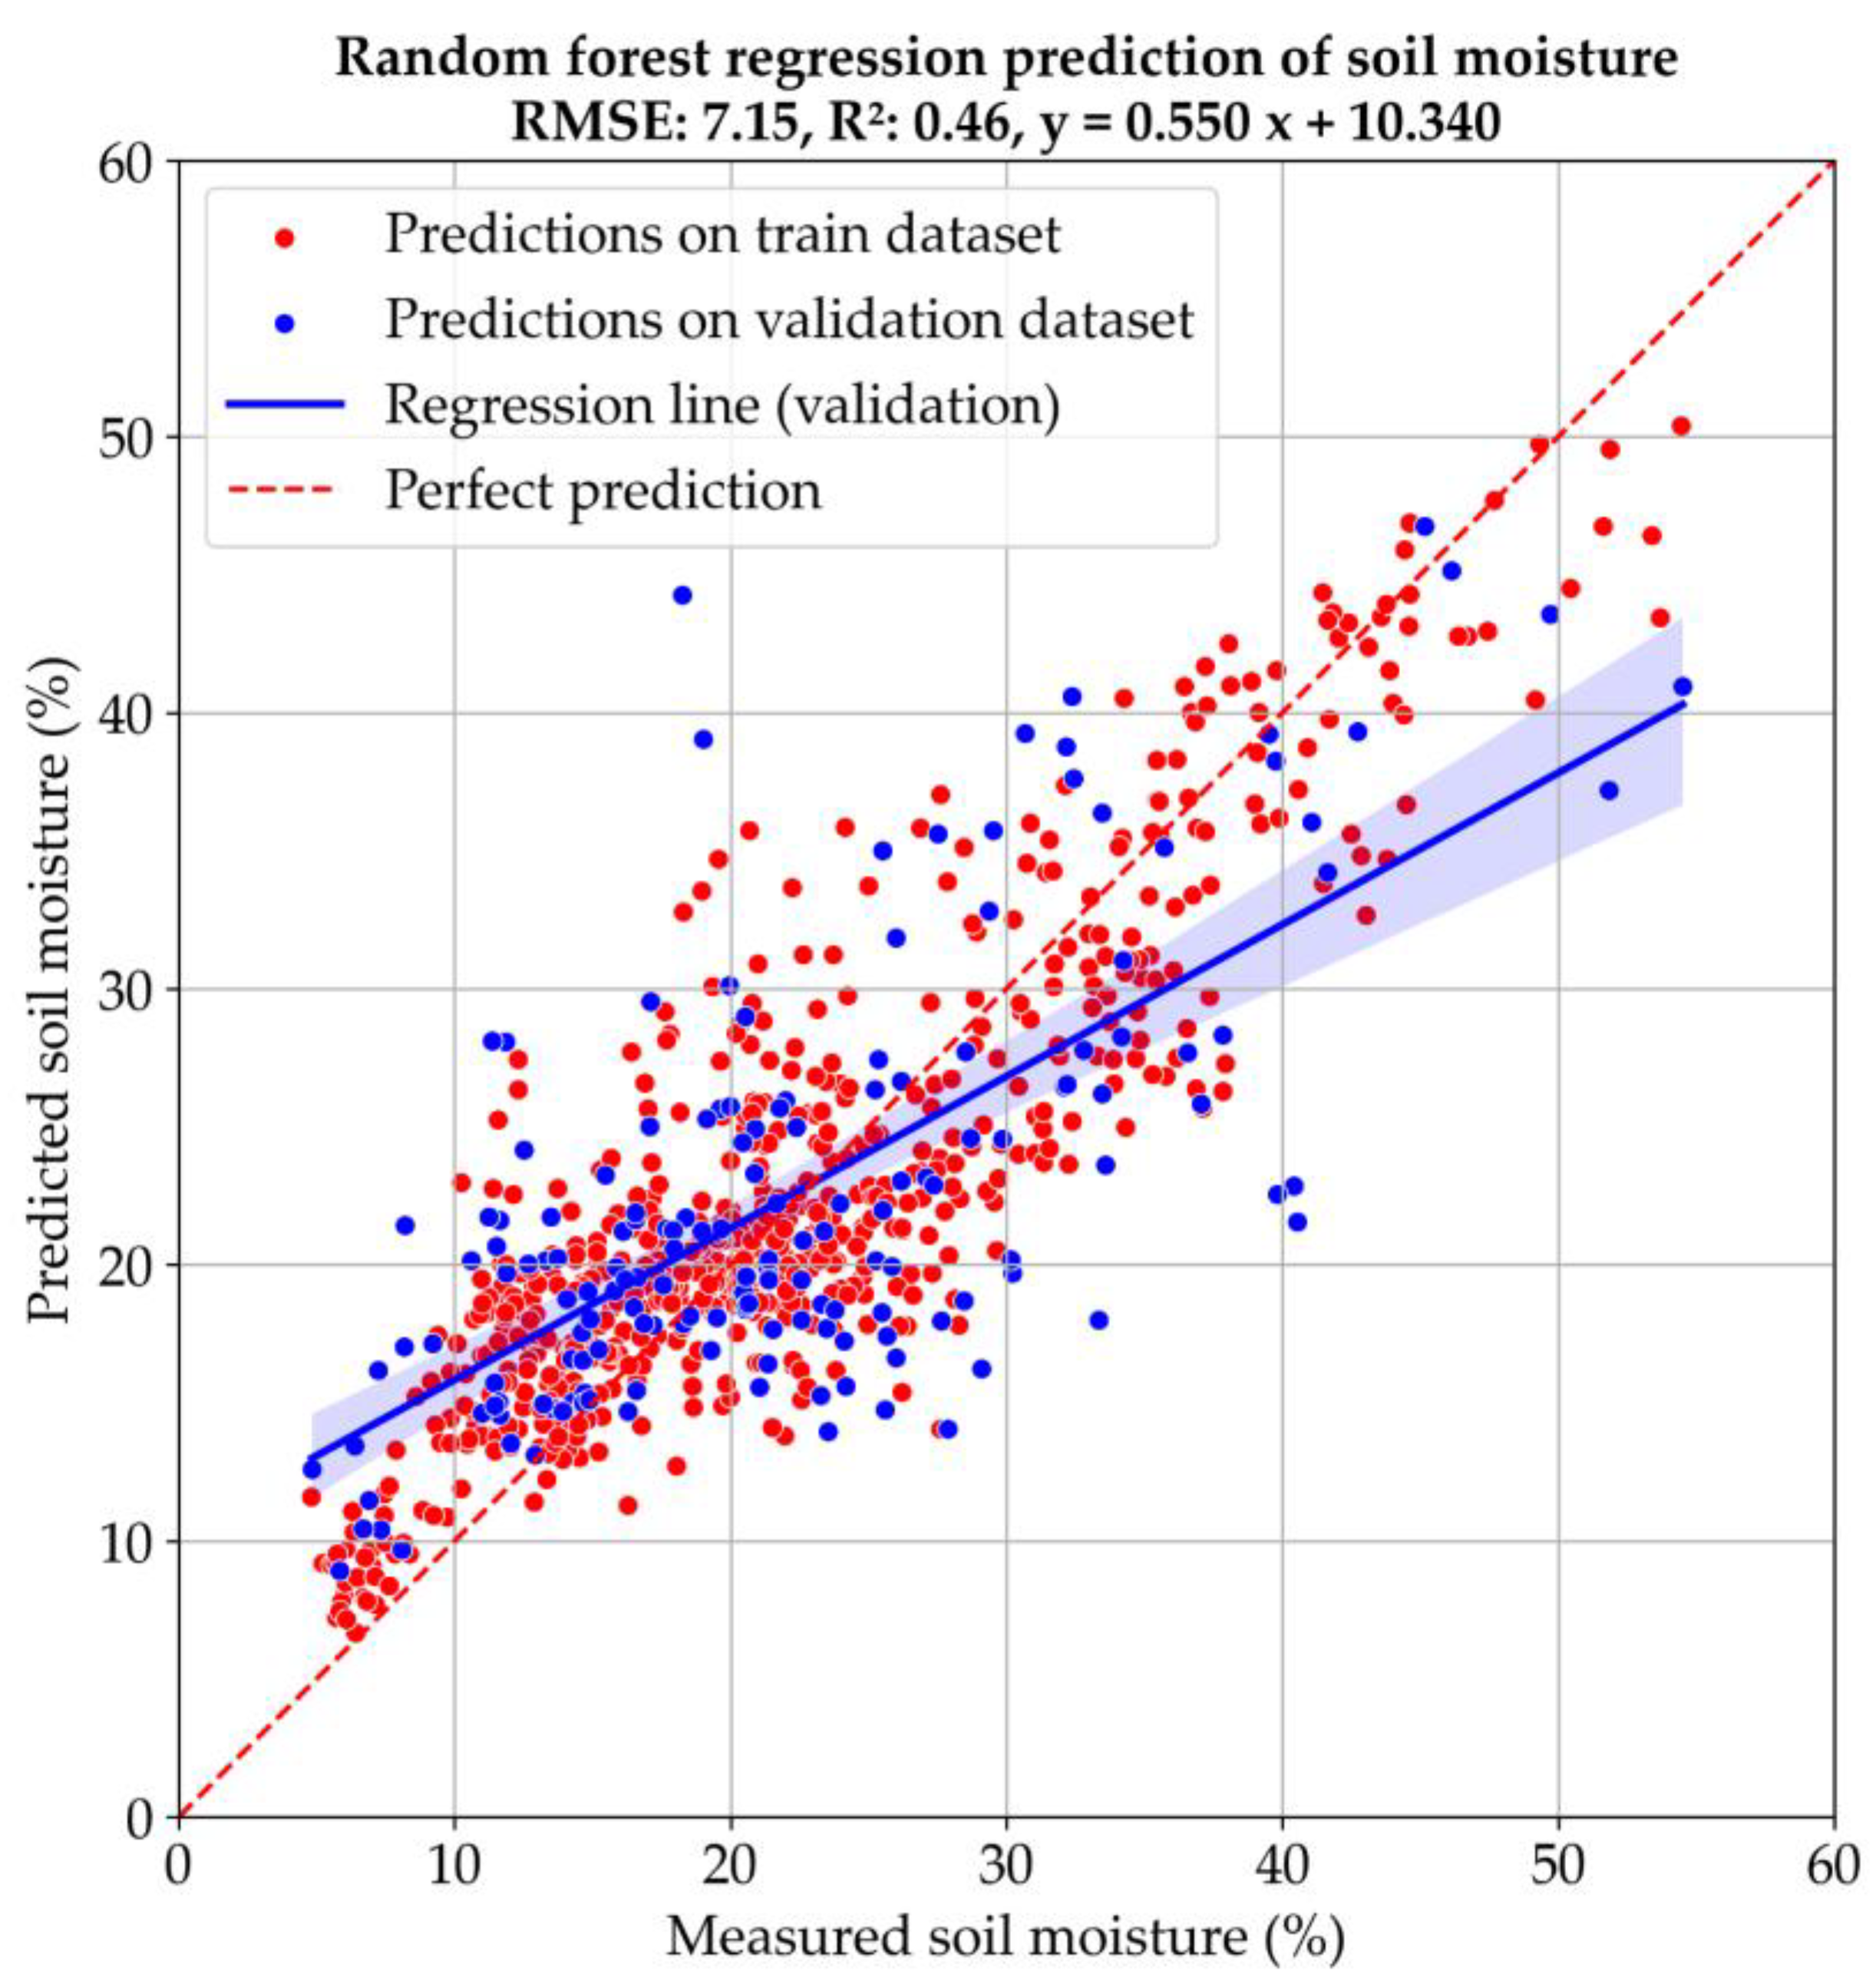
Figure 6.
The results of soil moisture modeling using Random Forest, channels from the Dual-Pol Model Based Decomposition (Sentinel-1 SLC product) and Projected Local Incidence Angle.
Figure 6.
The results of soil moisture modeling using Random Forest, channels from the Dual-Pol Model Based Decomposition (Sentinel-1 SLC product) and Projected Local Incidence Angle.
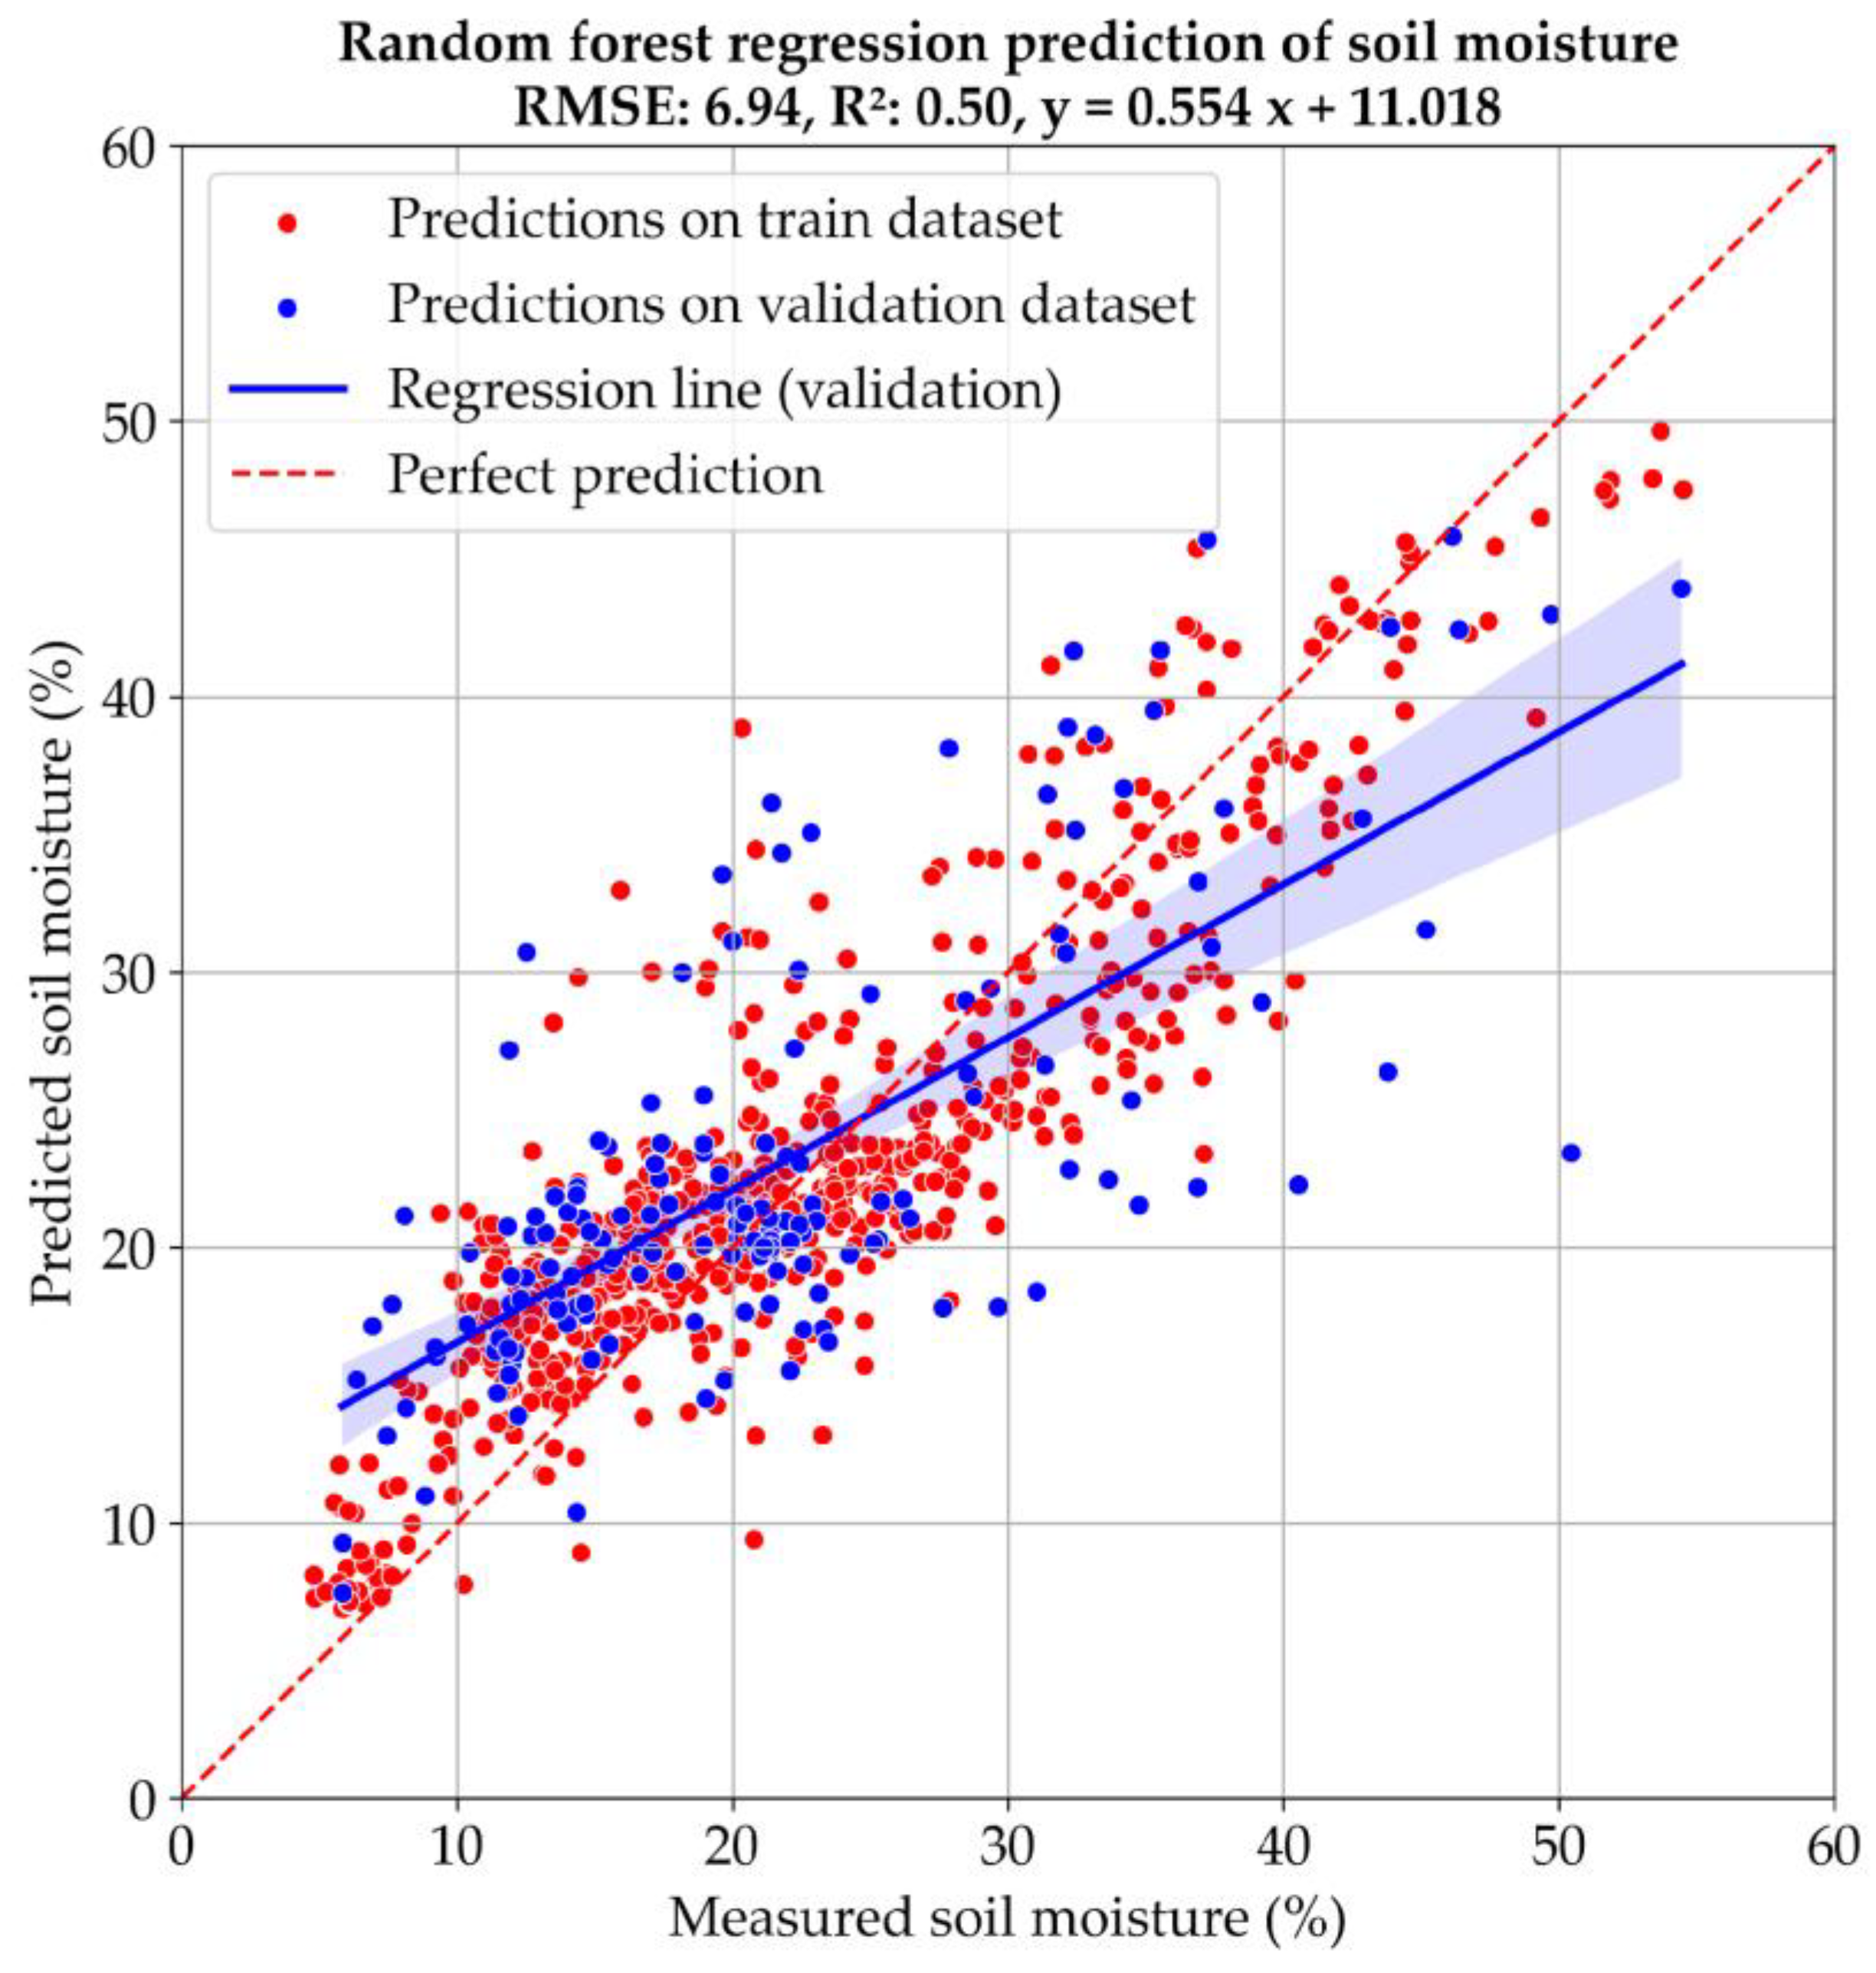
Figure 7.
The results of soil moisture modeling with Random Forest using backscattering coefficient from Sentinel-1 data and clay content in the soil (particles < 0.002) derived from soil maps.
Figure 7.
The results of soil moisture modeling with Random Forest using backscattering coefficient from Sentinel-1 data and clay content in the soil (particles < 0.002) derived from soil maps.
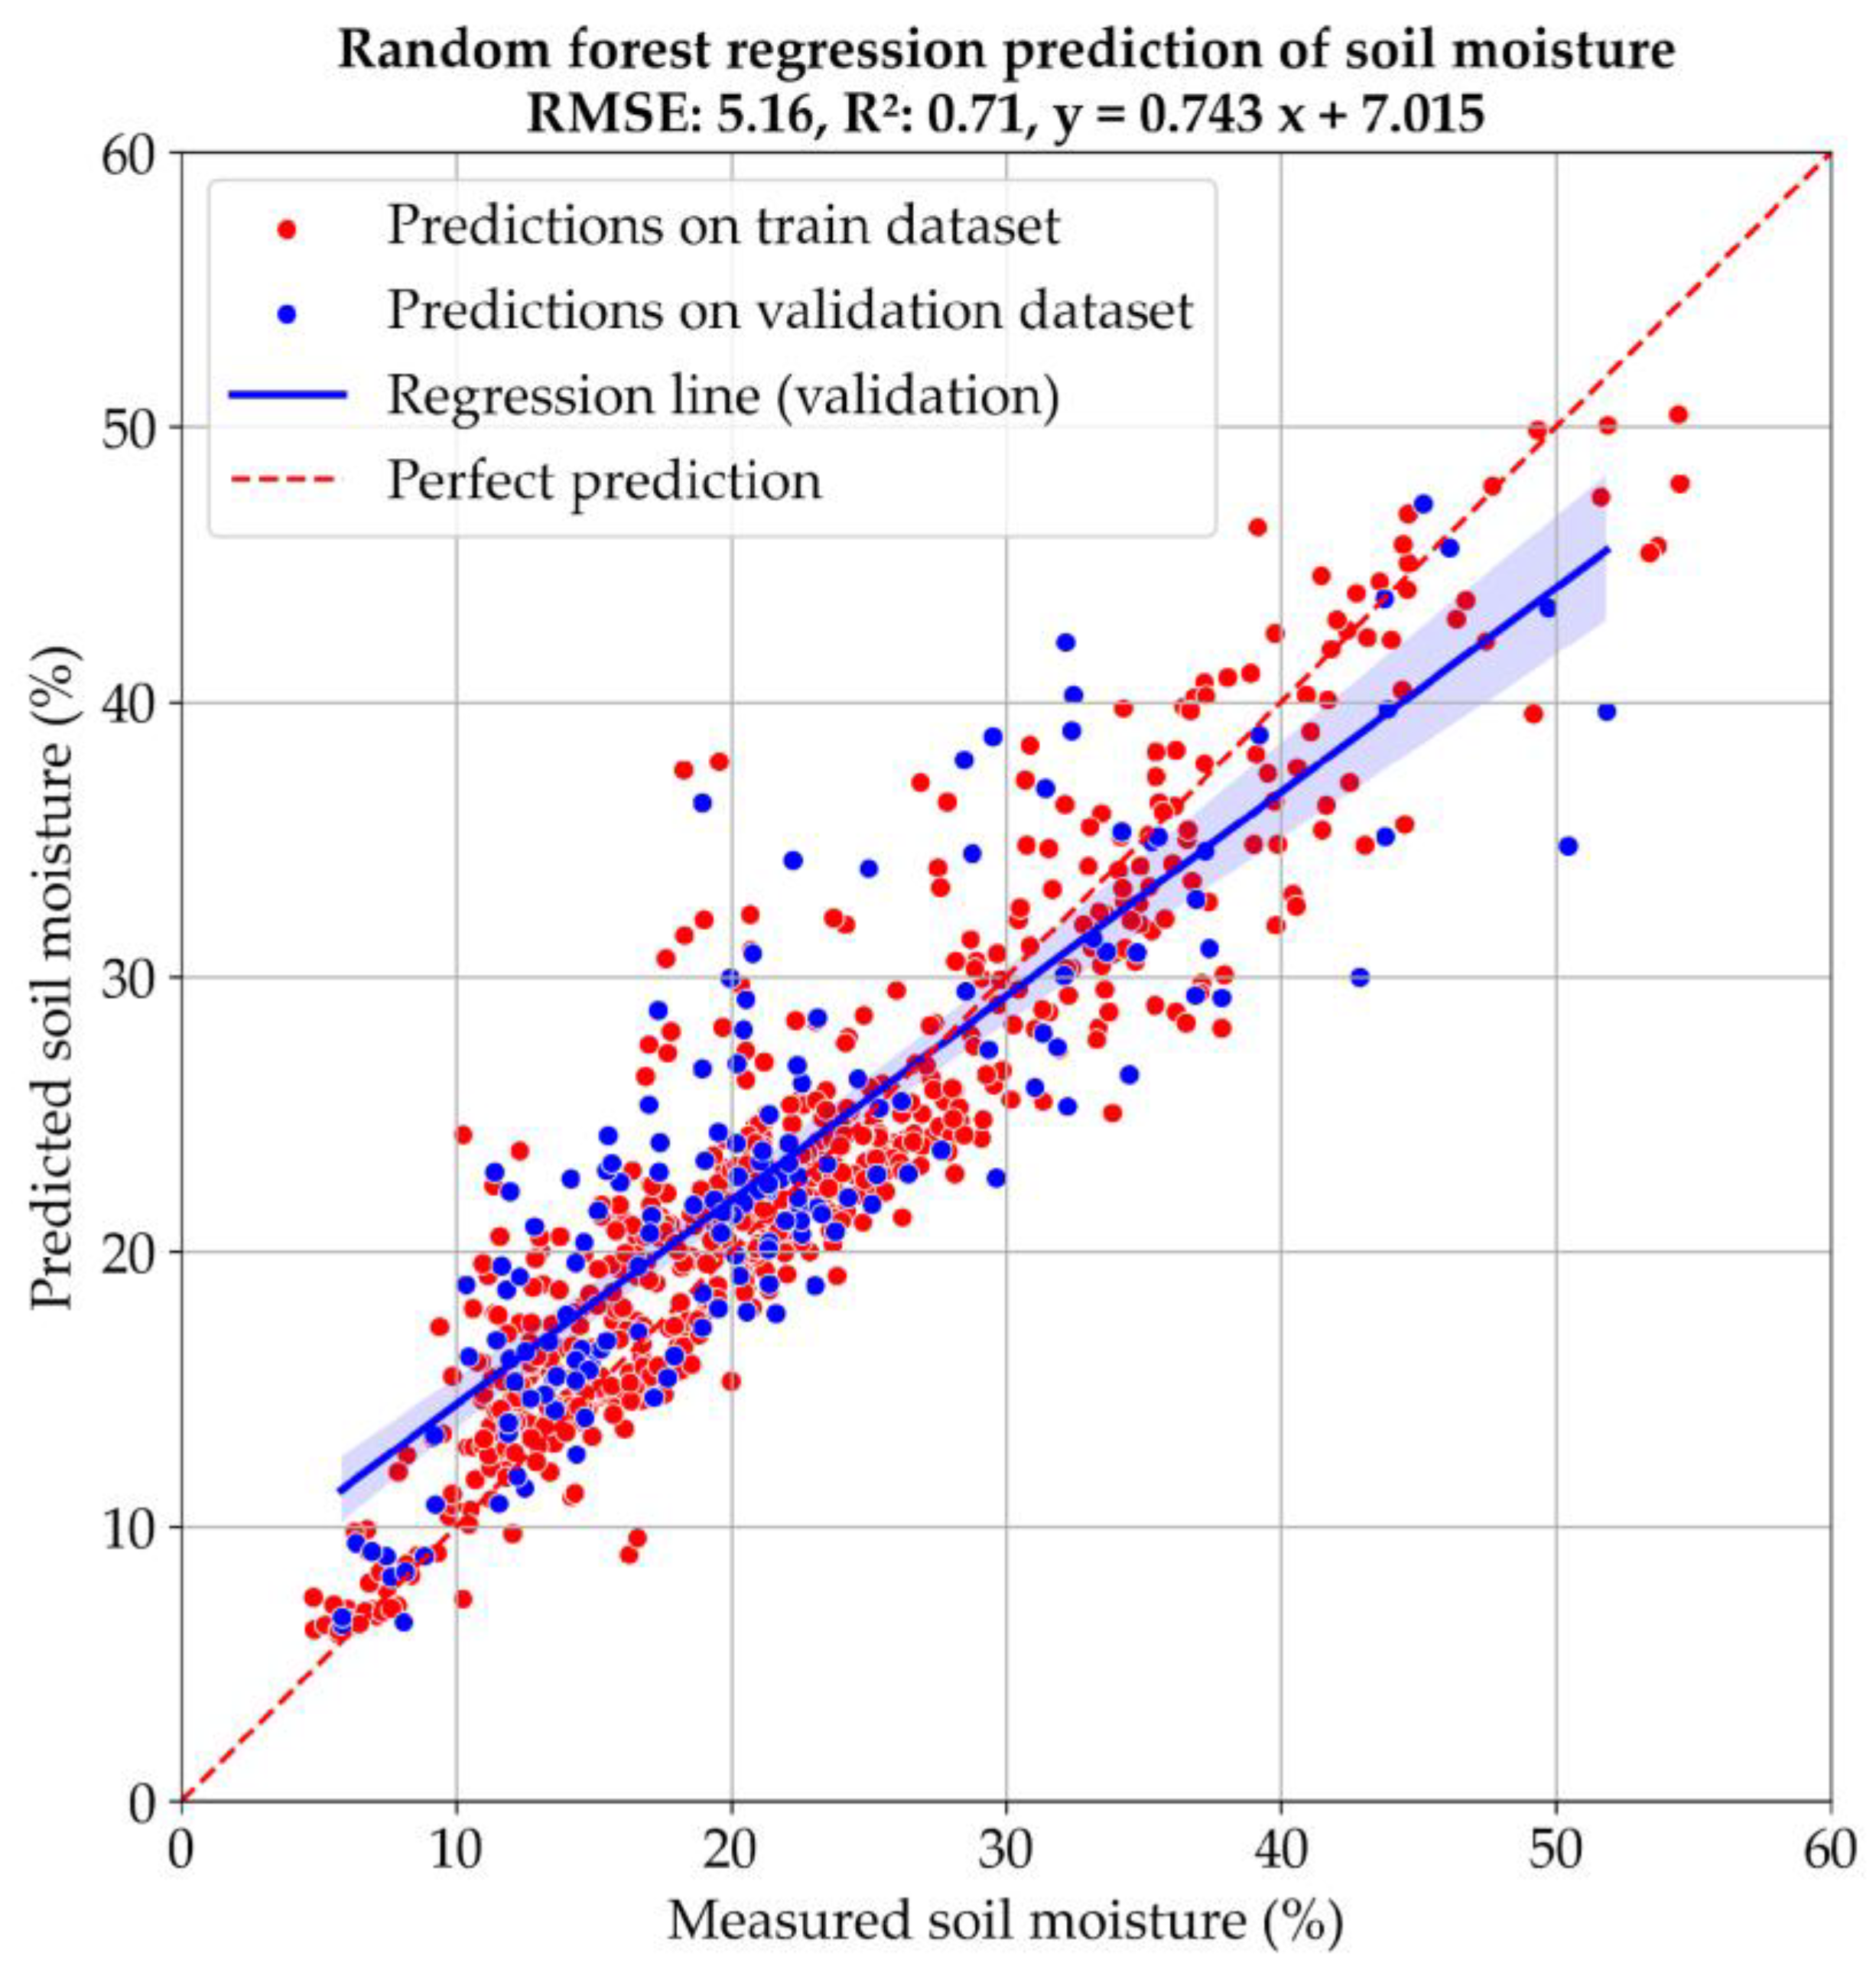
Figure 8.
The results of soil moisture modeling with Random Forest using Sentinel-1 polarimetric channels and clay content in the soil (particles < 0.002) derived from soil maps.
Figure 8.
The results of soil moisture modeling with Random Forest using Sentinel-1 polarimetric channels and clay content in the soil (particles < 0.002) derived from soil maps.
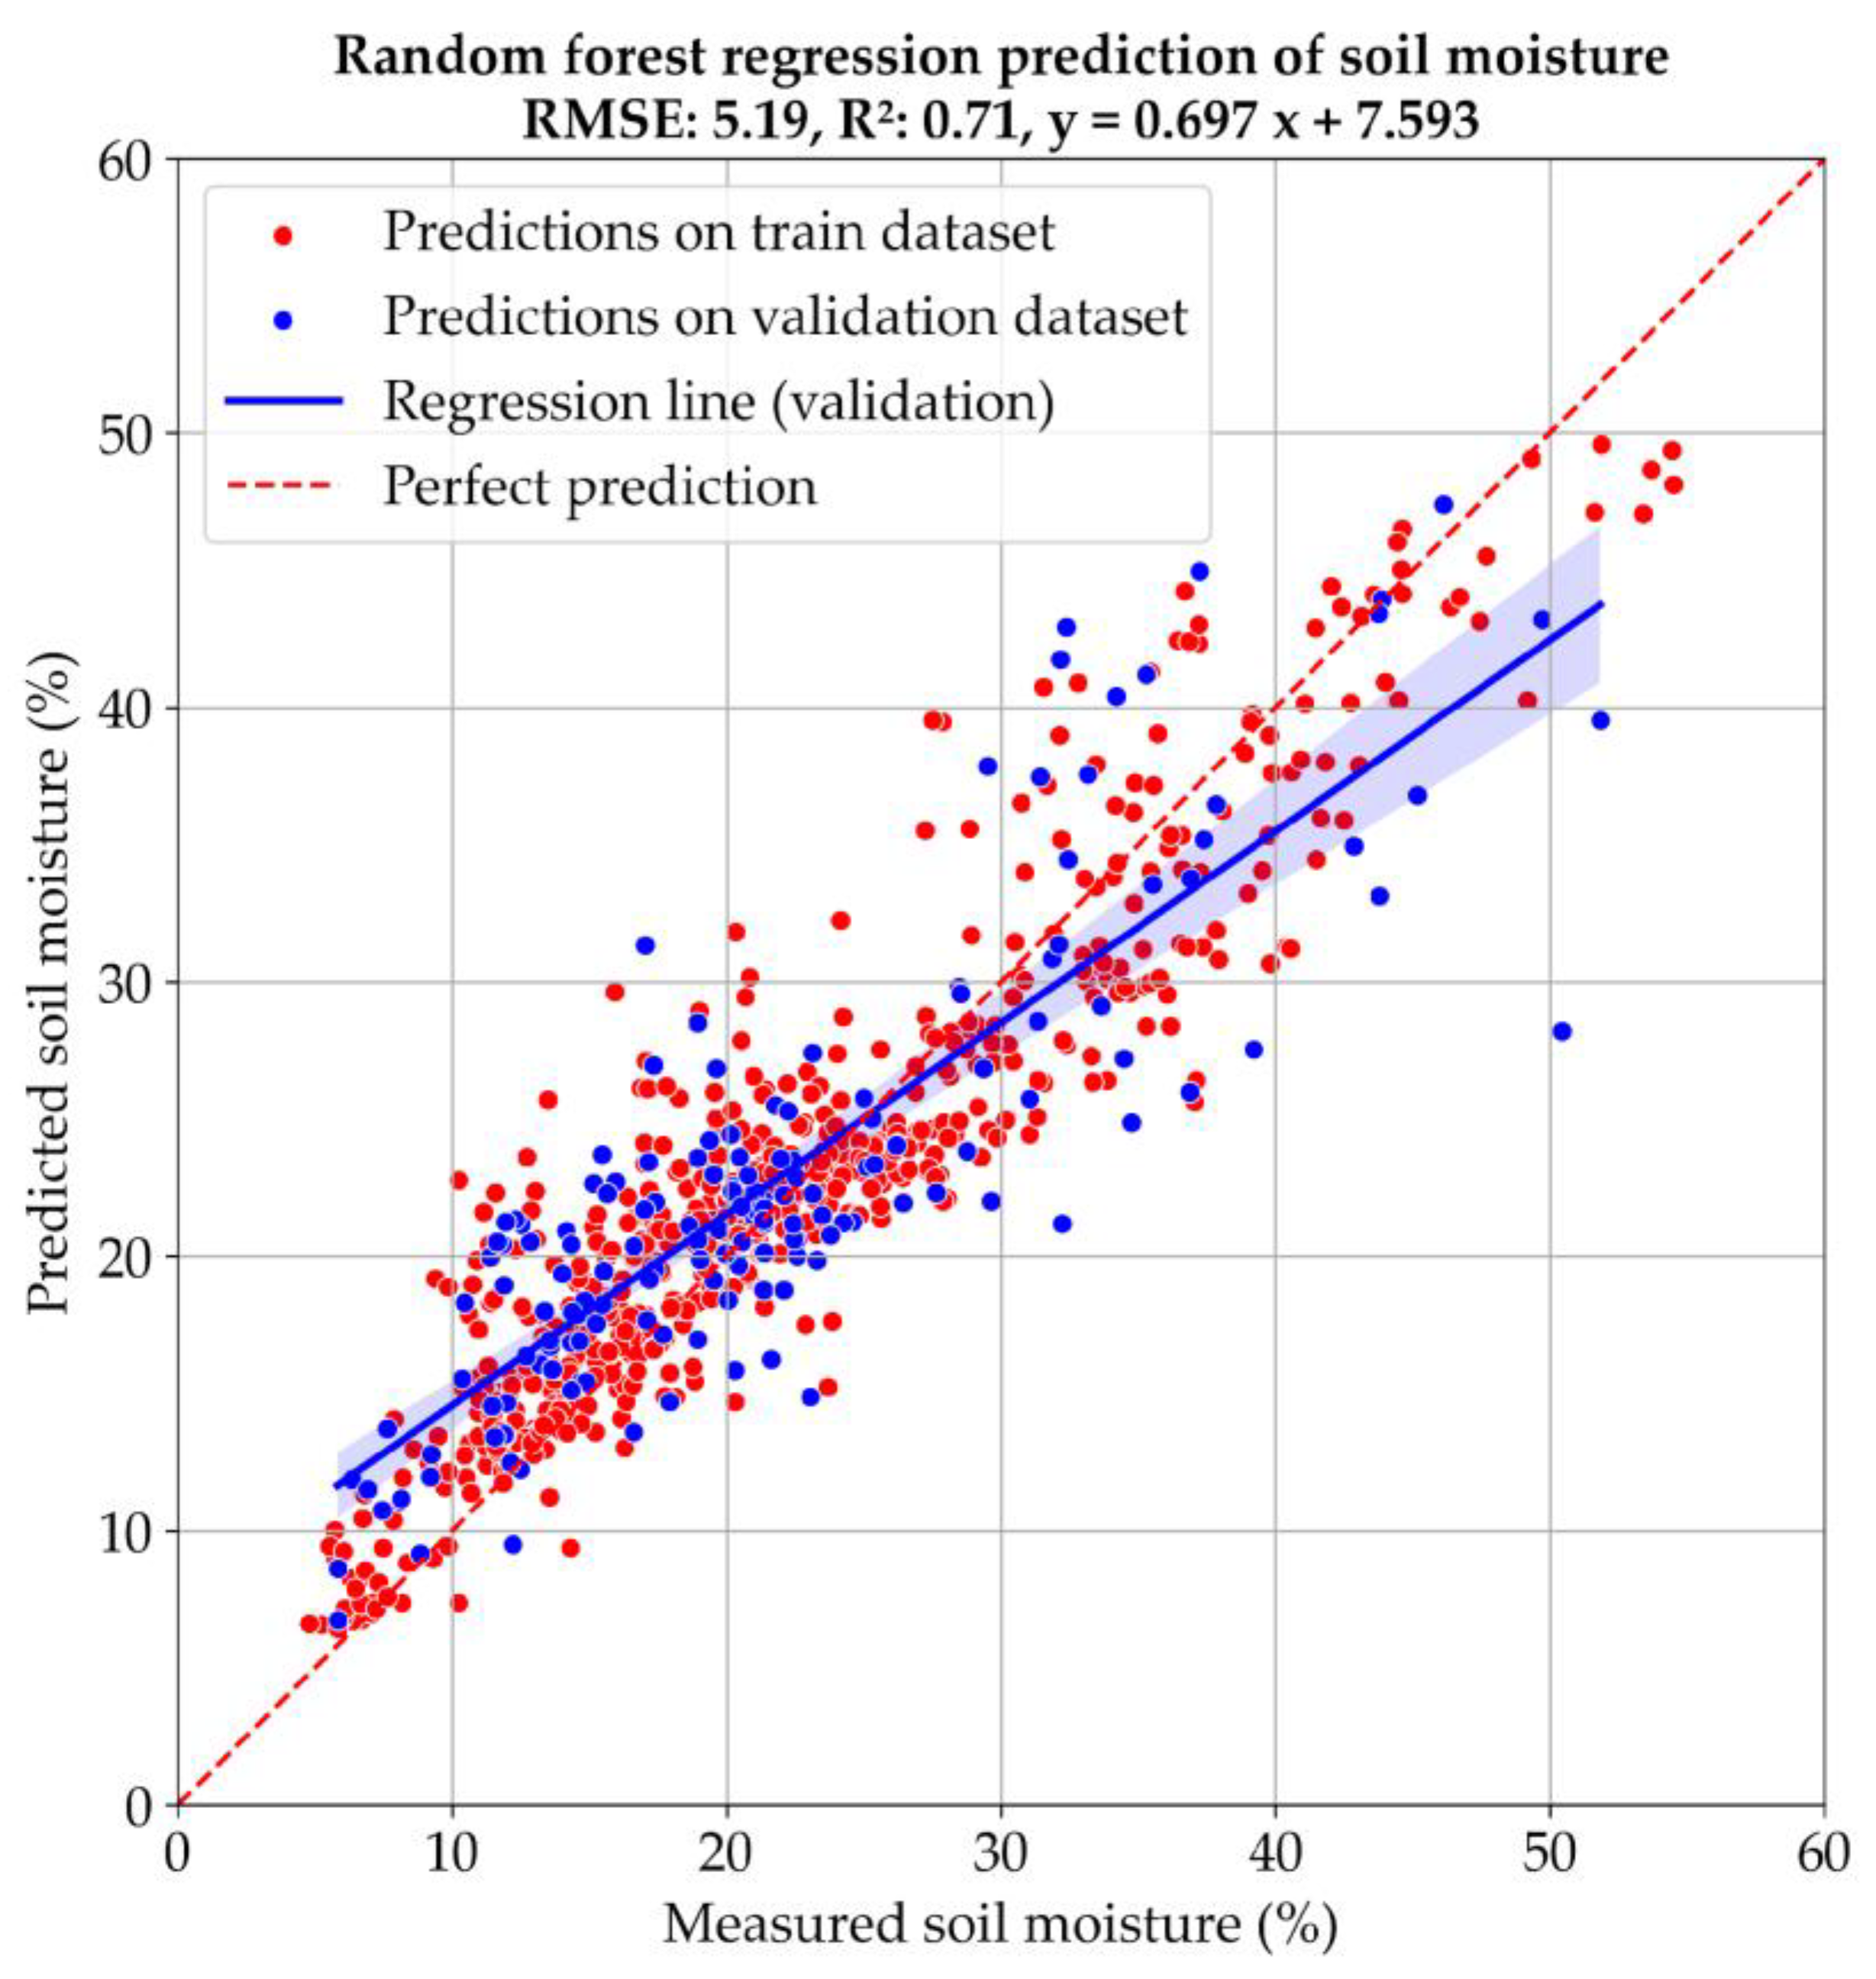
Table 1.
Soil moisture measurement area statistics.
| Study area | Measurement days | Number of fields | Measurement points | Measurements |
|---|---|---|---|---|
| Brwinów | 4 | 24 | 159 | 253 |
| JECAM | 2 | 20 | 100 | 100 |
| Kędzierzyn-Koźle | 2 | 27 | 121 | 121 |
| Obory | 15 | 19 | 196 | 333 |
| Młochów | 1 | 3 | 19 | 19 |
| Overall | 24 | 93 | 595 | 826 |
Table 3.
Channels from Sentinel-1 images used as features for Random Forest modelling.
| Channel | Sentinel-1 Product | Modelling |
|---|---|---|
| VH_dB | GRD | backscattering |
| VV_dB | GRD | backscattering |
| VH/VV | GRD | backscattering |
| SPAN_dB | GRD | backscattering |
| projectedLocalIncidenceAngle | GRD/SLC | backscattering and polarimetry |
| C11_dB | SLC | Polarimetry, C2 matrix element |
| C22_dB | SLC | Polarimetry, C2 matrix element |
| C12_real | SLC | Polarimetry, C2 matrix element |
| C12_imag | SLC | Polarimetry, C2 matrix element |
| Entropy_H-Alpha | SLC | Polarimetry, H-Alpha Decomposition |
| Anisotropy_H-Alpha | SLC | Polarimetry, H-Alpha Decomposition |
| Alpha_H-Alpha | SLC | Polarimetry, H-Alpha Decomposition |
| Surface_r_MB | SLC | Polarimetry, Model Based Decomposition |
| Volume_g_MB | SLC | Polarimetry, Model Based Decomposition |
| Ratio_b_MB | SLC | Polarimetry, Model Based Decomposition |
| Alpha_ MB | SLC | Polarimetry, Model Based Decomposition |
| Delta_h_ Model Based | SLC | Polarimetry, Model Based Decomposition |
| Rho_s_ Model Based | SLC | Polarimetry, Model Based Decomposition |
| Span_v_ Model Based | SLC | Polarimetry, Model Based Decomposition |
Table 4.
Random forest regressor parameters.
| Parameter | Value |
|---|---|
| n_estimators | 1000 |
| max_depth | 14 |
| min_samples_split | 2 |
| min_samples_leaf | 3 |
| max_features | sqrt |
| bootstrap | True |
Disclaimer/Publisher’s Note: The statements, opinions and data contained in all publications are solely those of the individual author(s) and contributor(s) and not of MDPI and/or the editor(s). MDPI and/or the editor(s) disclaim responsibility for any injury to people or property resulting from any ideas, methods, instructions or products referred to in the content. |
© 2025 by the authors. Licensee MDPI, Basel, Switzerland. This article is an open access article distributed under the terms and conditions of the Creative Commons Attribution (CC BY) license (http://creativecommons.org/licenses/by/4.0/).
Copyright: This open access article is published under a Creative Commons CC BY 4.0 license, which permit the free download, distribution, and reuse, provided that the author and preprint are cited in any reuse.


