
Submitted:
30 July 2025
Posted:
30 July 2025
You are already at the latest version
Abstract
To develop a CO2-free process for recovering Fe and Zn metals from electric arc furnace (EAF) dust, this study investigated the molten oxide electrolysis of Fe2O3 – ZnO mixtures in a B2O3 – Na2O electrolyte. Electrolysis was conducted using an Fe cathode and a Pt anode at 1173 K with different ratios of Fe2O3 to ZnO by applying cell voltages determined based on thermodynamic calculations and cyclic voltammetry measurements. When electrolysis was conducted at a cell voltage of 1.1 V, selective reduction of Fe oxide to Fe metal was observed without the reduction of ZnO. However, when 1.6 V was applied, the co-reduction of Fe oxide and ZnO to the Fe – Zn alloy was observed. In the vacuum distillation of the Fe – Zn alloy at 1000 – 1200 K, Zn metal with a purity exceeding 99.996 % was obtained with a recovery efficiency above 99.9 %, under certain conditions. These results demonstrate the feasibility of recovering Fe and Zn from EAF dust using low-temperature molten oxide electrolysis and subsequent vacuum distillation.
Keywords:
high-purity iron
; high-purity zinc
; secondary resources
; molten oxide electrolysis
; vacuum distillation
1. Introduction
Iron (Fe) and steel production have rapidly increased since the 20th century by the development of the global economy because Fe is a fundamental commodity. For example, the global pig Fe and steel production in 2023 exceeded 1.3 billion tonnes (Bt) and 1.8 Bt, respectively [1,2]. Owing to the increase in Fe and steel production, the generation of by-products, such as dust, has increased as well. Most of the dust is directly recycled as raw material for blast furnaces. However, electric arc furnace (EAF) dust is not directly recycled owing to its high zinc (Zn) concentration [3]. Currently, EAF dust is recycled using Waelz Kiln or Rotary Hearth Furnace (RHF) process. In these processes, Zn (g) and Fe (s) are recovered through the reduction of EAF dust using carbon (C) at temperatures above 1273 K, thus resulting in carbon monoxide (CO) and/or carbon dioxide (CO2) gas emission. Therefore, considering the environmental burden from current processes, the development of a CO2-free method for recycling EAF dust is paramount in the near future.
In the Fe industry, various technologies have been developed to mitigate CO2 gas emission. Among these technologies, the important approach involves changing the reducing agent from coke to hydrogen (H2) gas or electron [4]. The use of green H2 gas enables the CO2-free production of Fe. However, the green H2 gas is produced by water electrolysis. Therefore, the direct use of electrons as reducing agents for Fe metal production provides the advantage of simplifying the production process.
Several studies have been conducted on the electrolysis of Fe oxides, as shown in Table 1. Depending on the supporting electrolyte used, electrolysis using molten oxide, molten salt, molten carbonate, and molten hydroxide were investigated. Among the various electrolysis methods, molten oxide electrolysis is a promising method because of the high solubility of oxide feedstocks and the direct use of oxide feeds without any pre-treatment, such as sintering or pelletizing. Many studies have reported the results of molten oxide electrolysis at high temperatures such as approximately 1700 K, as shown in Table 1. However, operation at such high temperatures results in higher energy consumption compared with other electrolytic processes that use molten salt, carbonate, or hydroxide.
To decrease the energy consumption of molten oxide electrolysis, the low-temperature molten oxide electrolysis of hematite (Fe2O3) using a boron oxide (B2O3) – sodium oxide (Na2O) electrolyte was investigated [11]. When the electrolysis of Fe2O3 was conducted in B2O3 – Na2O at 1273 K by applying 1.4 – 2 V, Fe metal was obtained with the current efficiency of 32.3 – 54.7 %. The use of the B2O3 – Na2O electrolyte retains the advantages of the molten oxide electrolysis process, such as sufficient solubility of Fe2O3 even at moderate operating temperatures.
However, investigations of electrolytic methods using EAF dust to recover Fe and Zn have rarely been reported, as shown in Table 1. Liu et al. performed the electrolysis of ZnFe2O4 generated during Zn metallurgy instead of EAF dust in sodium chloride (NaCl) – calcium chloride (CaCl2) molten salt at 1073 K [19]. It was reported that ZnFe2O4 undergoes stepwise reduction, with Fe being reduced prior to Zn. Although this process can be used for recycling EAF dust, treating chloride salts is challenging because the environment of the electrolytic process tends to be corrosive owing to their hygroscopicity.
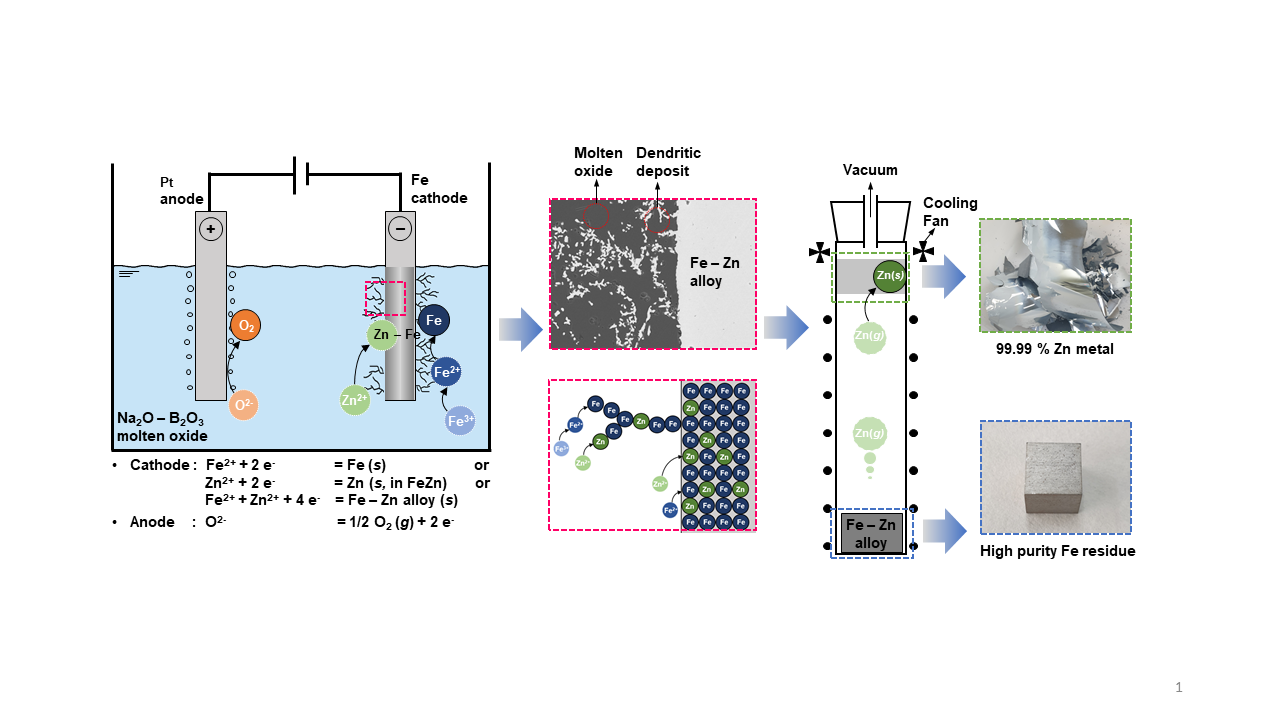
Low-temperature molten oxide electrolysis becomes an alternative method for recovering Fe and Zn from EAF dust. Molten oxide electrolysis offers a safer and more stable environment during electrolysis compared with chloride-based molten salt systems. In addition, Zn and Fe are recovered from EAF dust without CO2 gas emission by using an inert anode. Based on these advantages, as shown in Figure 1, a fundamental investigation of the electrochemical behavior of Fe and Zn oxides and their electrolysis at 1173 K was conducted using low-temperature molten oxide electrolysis to develop a novel and environmentally friendly method for recycling EAF dust.
2. Materials and Methods
2.1. Cyclic Voltammetry (CV) of Fe2O3 and ZnO in B2O3 – Na2O Molten Oxide
To investigate the electrochemical behavior of Fe2O3 and ZnO in B2O3 – Na2O molten oxide at 1173 K, CV measurements were conducted. Prior to the experiments, Na2O (purity: >97.5 %; Thermo Fisher Scientific Chemicals, Inc.) was dried in vacuum oven (Model: VOS-602 SD, EYELA) at 453 K for more than 24 h, and subsequently it was stored in a glove box (Model: MB-200MOD, MBRAUN) to prevent hydration by atmospheric moisture.
An oxide mixture of 71 mass% B2O3 (purity: 99.98 %; Thermo Fisher Scientific Chemicals, Inc.) – 26 mass% Na2O – 3 mass% Fe2O3 (purity: 99.9 %; Thermo Fisher Scientific Chemicals, Inc.) and a mixture of 71 mass% B2O3 – 26 mass% Na2O – 1.5 mass% Fe2O3 – 1.5 mass% ZnO (purity: 99.99 %; Thermo Fisher Scientific Chemicals, Inc.) were prepared at a room temperature. The oxide mixture was then placed in an alumina (Al2O3) crucible (O.D. = 56 mm, thickness (t) = 3.5 mm).
Figure 2 (a) shows a schematic of the electrolytic cell used for the CV measurement (see Figure S-1 in the supplementary material for a photograph of the apparatus). As shown in Figure 2 (a), the Al2O3 crucible containing the oxide mixture was placed in an electric furnace. Subsequently, the temperature was increased to 1173 K for the CV measurements.
In this study, platinum (Pt) wire (purity: 99.95 %; diameter (ϕ) = 0.5 mm; Thermo Fisher Scientific Chemicals, Inc.) was used as both the working and counter electrodes whereas molybdenum (Mo) wire (purity: 99.95 %; ϕ = 0.5 mm; Thermo Fisher Scientific Chemicals, Inc.) was used as the quasi-reference electrode. In addition, an identical Mo wire was used as a potential lead for all electrodes. The electrodes and the Mo potential lead were hand-polished before the experiment. After electrical connection between electrode and potential lead, the potential leads of working electrode and quasi-reference electrode were diagonally inserted into two holes of an Al2O3 tube (O.D. = 8.5 mm) with four holes (ϕ = 1.8 mm). In addition, the potential lead of the counter electrode was inserted into a hole in an identical Al2O3 tube. The end of the potential lead connected to the potentiostat was bent and secured with Teflon tape to prevent electrode movement. Subsequently, the prepared Al2O3 tubes were inserted into the furnace through two holes in the lid and fixed in position using clamps. The prepared electrodes were immersed in the molten oxide, and CV measurements were conducted using a potentiostat (Model: SP-150e, booster: VMP3B, 2 A – 20 V, Biologic Science Instruments).
2.2. Molten Oxide Electrolysis of Fe2O3 and ZnO Using Fe Cathode
Before the experiments, Na2O was dried in a vacuum oven at 453 K for more than 24 h and subsequently stored in a glove box. 3.0 g of the Fe2O3 – ZnO mixture with a predetermined composition in Table 2 was mixed with 97.0 g of an oxide mixture containing 73 mass% B2O3 – 27 mass% Na2O. The prepared oxide mixture was then placed in an Al2O3 crucible, which was then placed in an electric furnace. Subsequently, the temperature was increased to 1173 K and maintained for 3 h prior to electrolysis.
Figure 2 (b) shows a schematic of the experimental apparatus used for the molten oxide electrolysis. Fe wire (purity: 99.99 %; ϕ = 1 mm; Thermo Fisher Scientific Chemicals, Inc.) was used as the cathode, and Pt foil (purity: 99.9 %; length (l) = 20 mm, width (w) = 3 mm, t = 0.127 mm; Thermo Fisher Scientific Chemicals, Inc.) was used as the anode. A Mo wire was used as the potential lead for connecting the electrode and potentiostat. The electrodes and the Mo potential lead were hand-polished before use. Each potential lead, which was assembled with an electrode was inserted into a separate Al2O3 tube. The end of the potential lead connected to the potentiostat was bent and secured using Teflon tape. Subsequently, the prepared Al2O3 tubes were inserted into the furnace through two holes in the lid and fixed in position using clamps. The prepared electrodes were immersed in the molten oxide and chronoamperometry was performed in the range of 1.1 – 1.6 V at 1173 K. After electrolysis was completed, the electrodes were removed from the molten oxide. Subsequently, the temperature was decreased to room temperature and the cathode was retrieved for analysis.
2.3. Vacuum Distillation of Fe - Zn Alloys
Figure 3 shows a schematic and photograph of the experimental apparatus used for vacuum distillation. Fe – 27.1 mass% Zn alloy (l = 10 mm, w = 10 mm, t = 10 mm; RND KOREA Corp.) was placed in a small Al2O3 crucible (O.D. = 40 mm, t = 2 mm), which was then placed in another Al2O3 crucible (O.D. = 50 mm, t = 2 mm), with titanium (Ti) sponge packed at the bottom to absorb the residual O in the atmosphere at elevated temperatures. Subsequently, the assembly was positioned at the bottom of the quartz reactor (O.D. = 61 mm, t = 3 mm, height (h) = 650 mm).
After a Viton plug equipped with Pyrex tubes as the inlet and outlet was plugged into the top of the reactor, the reactor was evacuated and refilled with argon (Ar, purity = 99.999 %) gas twice to control the atmosphere. After the final filling Ar gas, the reactor was continuously evacuated using a rotary pump until the end of the experiment.
The reactor was placed in a furnace preheated to 1200 K for the vacuum distillation of Fe – Zn alloy for 1 – 12 h. After vacuum distillation, the reactor was immediately removed from the furnace and cooled to room temperature. The residue at the bottom of the crucible and the deposit on the inner wall of the reactor were recovered for analysis.
2.4. Analysis
The microstructures and compositions of the samples were analyzed using field-emission scanning electron microscopy (FE-SEM: GeminiSEM 560, Carl Zeiss AG.) equipped with energy-dispersive X-ray spectroscopy (EDS). The crystalline phases of samples were identified using X-ray diffractometer (XRD: SmartLab, Rigaku Corporation, Cu-Kα radiation). The compositions of the samples were analyzed using inductively coupled plasma optical emission spectroscopy (ICP-OES: 5800 ICP-OES, AGILENT).
3. Mechanism of the Electrolysis of Fe2O3 and ZnO in Molten B2O3 – Na2O
In this study, to produce metallic Fe or Fe – Zn alloy from Fe2O3 and ZnO, electrolysis in molten B2O3 – Na2O using an Fe cathode and a Pt anode was investigated. To understand the electrolysis mechanism of Fe2O3 and ZnO, the FactSage thermodynamic software (FactSage 8.3 version; www.factsage.com) was employed. In particular, the FTOxid database containing the optimized data of the Fe2O3– B2O3 – Na2O and ZnO – B2O3 – Na2O systems [26,27] and the FSStel database for the Fe-Zn alloy were utilized in the FactSage calculations.
The composition of the supporting electrolyte was determined based on the binary phase diagram of B2O3 – Na2O shown in Figure 4. As shown in Figure 4, eutectic compositions of this system are calculated at 73 mass%, 32 mass%, and 18 mass% B2O3. Na2O is a network modifier to break down B2O3 network structure in a borate melt, which leads to an increase in electrical conductivity [28,29,30]. However, Kim et al. showed that an increased amount of Na2O in molten oxides causes an increase in the basicity of molten oxides, thereby leading to the corrosion of iridium (Ir)-based inert anode [31]. Therefore, 73 mass% B2O3 – Na2O was determined as a supporting electrolyte in this study.
The eutectic temperature of 73 mass% B2O3 – Na2O is 1004 K (see in Figure 4). Therefore, for the stable operation of electrolyte considering the composition and temperature fluctuation at scaled-up process in future, the electrolysis temperature in this study was determined to be 1173 K.
The solubilities of Fe2O3 and ZnO in molten B2O3 – Na2O at 1173 K were calculated using the FactSage, and they are 11.7 mass% and 4.4 mass%, respectively. Consequently, the maximum concentration of ZnO added to 73 mass% B2O3 – Na2O was determined to be 3 mass% in this study. The sample compositions used in this study are listed in Table 2. Figure 5 shows the iso-composition plane of the quaternary phase diagram of the B2O3 – Na2O – Fe2O3 – ZnO system at 1173 K with 0 mass%, 1 mass%, 2 mass%, and 3 mass% ZnO content. According to the calculated phase diagrams in Figure 5, all the samples are in fully liquid states.
Table 3 shows the theoretical standard decomposition voltages of selected oxides at 1173 – 1373 K. Na2O and B2O3 are more stable than the other oxides owing to their higher decomposition voltages. The reduction of Fe2O3 and ZnO proceeds in the following order: Fe2O3 to wüstite (FeO), FeO to metallic Fe, and ZnO to liquid Zn. However, because the actual electrolytic process does not proceed under the standard state, it is necessary to consider the activities of oxides in actual electrolyte melt and metals at the Fe cathode to accurately estimate the decomposition voltages of all species involved during electrolysis at 1173 K. For this purpose, FactSage thermodynamic calculations were performed.
In the case of Fe, trivalent (Fe3+) and divalent (Fe2+) ions are present in the oxide melt. To calculate the decomposition voltages of Fe2O3 and FeO, their activities in the melt must be considered. Figure 6 (a) shows the variation of Fe2O3 and FeO in 73 mass% B2O3 – Na2O electrolyte at 1173 K as a function of oxygen partial pressure (pO2). Using the Nernst equation, the cell voltage required for the reduction of Fe2O3 to FeO at each oxygen partial condition was calculated and plotted in Figure 6 (a). As shown in Figure 6 (a), Fe3+ and Fe2+ are dominant at high pO2 and low pO2, respectively. During electrolysis, reducing conditions are formed near the cathode, corresponding to a low pO2, whereas oxidizing conditions are formed near the anode by O2 gas evolution, corresponding to a high pO2. Therefore, as electrolysis proceeds, Fe2+ mainly exists near the cathode, followed by the reduction of Fe3+ to Fe2+, whereas Fe3+ will mainly exists near the anode, as shown in Figure 6 (b).
Figure 7 shows the estimated decomposition voltages of Fe2O3, FeO, ZnO, B2O3, and Na2O from the Nernst equation, by considering their activities under the conditions used in this study at 1173 K as a function of the mass ratio of ZnO in the Fe2O3 – ZnO mixed feed. Before the electrolysis, Fe2O3 is dominant over FeO because the Fe2O3 – ZnO – B2O3 – Na2O system is in equilibrium with air (pO2 = 0.21 atm) at 1173 K. When the onset of the electrolysis near cathode is considered, the estimated decomposition voltage for reduction of Fe2O3 to FeO decreases from 0.74 V under the standard state to approximately 0.05 – 0.09 V because of the significantly low aFeO in the melt.
The decomposition voltage for the reduction of FeO to metallic Fe was calculated by considering the activity of Fe as unity owing to the formation of pure metallic Fe (s). Accordingly, the decomposition voltage is governed by aFeO, which is directly affected by FeO concentration near the cathode. Because the decomposition voltage for the reduction of Fe2O3 at the onset of electrolysis is considerably low as shown in Figure 7, Fe2O3 will be reduced to FeO prior to the reduction of FeO to metallic Fe. This results in the accumulation of FeO near the cathode, leading to a gradual increase in its concentration, until it is reduced to metallic Fe.
The equilibrium pO2 for Fe (s) / FeO (l, in melt) Equation under the experimental conditions is 10-18 atm at 1173 K. Therefore, the activity of the existing state of Fe oxides such as aFeO and aFe2O3 before the reduction of FeO to metallic Fe is determined by FeO (l, in melt) / Fe2O3 (l, in melt) Equation under pO2 = 10-18 atm. The resulting decomposition voltage estimated using aFeO was calculated to be approximately 1.09 V, which is slightly higher than that calculated under the standard state, 0.98 V. This increase is attributed to the lower aFeO content in the melt compared with that in the standard state.
The decomposition voltage for the reduction of ZnO was calculated by considering the activities of ZnO near the cathode and Zn in the Fe – Zn alloy. Figure 8 shows that the solubility of Zn in Fe is 38.4 mass% at 1173 K. Consequently, the activity of Zn in the 1 mass% Zn – Fe and 38.4 mass% Zn – Fe solid solutions were considered to estimate the decomposition voltage of ZnO. The aZn of 1 mass% Zn – Fe solid solution indicates the onset of ZnO reduction into the Fe cathode, whereas aZn of 38.4 mass% Zn – Fe solid solution indicates the saturation of Zn in the Fe cathode by ZnO reduction. The resulting decomposition voltages were estimated to 1.21 V for 1 mass% Zn – Fe solid solution and 1.34 V for 38.4 mass% Zn – Fe solid solution, as shown in Figure 7.
For the supporting electrolytes, the calculation results indicate that both B2O3 and Na2O decompose at higher voltages than that of Fe oxides and ZnO at 1173 K. The decomposition voltage for B2O3 (l, in melt) was estimated to 1.75 V, slightly higher than that of B2O3 (l) which is 1.70 V under the standard state. The decomposition voltage of Na2O (l, in melt) was estimated to 2.64 V, which is significantly higher than that of Na2O (s) in the standard state, which is 1.33 V. This increase is attributed to a substantial decrease in the activity of Na2O in the melt. The previous studies have shown that Na2O exhibits considerably low activity in acidic oxide systems, as it is strongly stabilized in the melt [32,33,34].
These results indicate that the reduction of Fe and Zn occurs prior to the decomposition of the electrolyte components. In addition, the selective reduction of FeO from the mixture of Fe2O3 and ZnO is feasible through molten oxide electrolysis at 1173 K by utilizing the difference in their decomposition voltages, as shown in Figure 7. Furthermore, when the cell voltage above the decomposition voltage determined by ZnO (l, in melt) / 1 mass% Zn – Fe (s) Equation is applied to the molten oxide electrolysis of the mixture of Fe2O3 and ZnO at 1173 K, the Fe – Zn solid solution will be obtained.
4. Results and Discussion
4.1. CV Measurement of Fe2O3 and Mixture of Fe2O3 and ZnO in Molten Oxide
To investigate the electrochemical behavior of the Fe and Zn oxides in the B2O3 – Na2O molten oxides at 1173 K, CV measurements were conducted using Mo as the quasi-reference electrode and Pt as both the working and counter electrodes. Figure 9 shows the results of the CV measurements conducted in the B2O3 – Na2O – Fe2O3 molten oxide before and after the addition of ZnO.
As shown in Figure 9a,b, a sharp increase in anodic current was observed at 1.15 V (vs. Mo quasi-reference electrode). The increase in the anodic current is attributed to the oxidation of O2- ions to O2 gas, as shown in Equation (1). In addition, a sharp increase in cathodic current was observed at – 0.5 V (vs. Mo quasi-reference electrode). As shown in Figure 7, the decomposition voltages of B2O3 (l, in melt) and Na2O (l, in melt) were estimated to 1.75 V and 2.64 V, respectively. Therefore, the increase in the cathodic current from – 0.5 V (vs. Mo quasi-reference electrode) is attributed to the reduction of B3+, as shown in Equation (2).
2 O2- (in melt) = O2 (g) + 4 e-
B3+ (in melt) + 3 e- = B (s)
As shown in Table 3, the decomposition voltages of Na2O and B2O3 are 1.33 V and 1.70 V at 1173 K under the standard state, respectively. The decomposition voltage of Na2O is lower than that of B2O3 under the standard state. It is worth noting that Na+ / Na (l) Equation was not observed in Figure 9. This shows that the results of the CV measurements match the estimated decomposition voltages of B2O3 (l, in melt) by the FactSage software for the Fe2O3 – B2O3 – Na2O and ZnO – B2O3 – Na2O systems. Therefore, the utilization of the optimized thermodynamic database is valid for estimating the electrochemical behavior of the molten oxide electrolysis of B2O3 – Na2O – Fe2O3 – ZnO system at 1173 K.
Meanwhile, as shown in Figure 9 (a) and (b), when the potential of the working electrode was decreased from 1.15 V (vs. Mo quasi-reference electrode) to 0.4 V (vs. Mo quasi-reference electrode), a gradual increase in the cathodic current was observed. Because the potential for O2- / O2 (g) Equation was estimated at 1.15 V (vs. Mo quasi-reference electrode), the value of pO2 is expected to be approximately 1 atm at 1.15 V (vs. Mo quasi-reference electrode). This condition corresponds to point a in Figure 6 where Fe2O3 is dominant. In this case, the estimated decomposition voltage of Fe2O3 is 0.05 V. Therefore, the gradual increase in the cathodic current from 1.15 V (vs. Mo quasi-reference electrode) is attributed to the reduction of Fe3+ to Fe2+, as shown in Equation (3).
Fe3+ (in melt) + e- = Fe2+ (in melt)
In addition, an increase in cathodic current was observed at 0.18 V (vs. Mo quasi-reference electrode), as shown in Figure 9 (a) and (b). The span of the potential between O2 gas evolution and 0.18 V is 0.97 V. Meanwhile, as the cathodic potential is swept in the negative direction from the potential of Fe3+ / Fe2+ Equation at 1.15 V (vs. Mo quasi-reference electrode), the concentration of FeO near the working electrode increases continuously. In addition, Figure 7 shows that the decomposition voltage of FeO (l, in melt) was estimated to 1.10 V. Therefore, the reduction of Fe2+ to Fe (s) shown in Equation (4) was occurred at 0.18 V (vs. Mo quasi-reference electrode).
Fe2+ (in melt) + 2 e- = Fe (s)
As the cathodic potential is further swept in the negative direction, an increase in cathodic current was observed at – 0.06 V (vs. Mo quasi-reference electrode) in Figure 9 (b). This increase in the cathodic current was not observed in Figure 9 (a) where only Fe2O3 was used as the feedstock. Therefore, the cathodic current at – 0.06 V (vs. Mo quasi-reference electrode) is attributed to the reduction of ZnO. The span of the potential between O2 gas evolution and – 0.06 V is 1.21 V. As shown in Figure 7, the decomposition voltage of ZnO (l, in melt) to Zn (s, in 1 mass% Zn – Fe) was estimated to 1.22 V. Therefore, the reduction of Zn2+ to Zn (s, in 1 mass% Zn – Fe) shown in Equation (5) was occurred at – 0.06 V (vs. Mo quasi-reference electrode).
Zn2+ (in melt) + 2 e- + Fe (s) = 1 mass% Zn–Fe (s)
4.2. Electrolysis of ZnO and Mixture of Fe2O3 and ZnO in Molten Oxide
4.2.1. Selective Reduction of Fe Oxide from B2O3 – Na2O – Fe2O3 – ZnO Melt
To evaluate the feasibility of selectively reducing Fe oxide from a mixed feedstock containing Fe2O3 and ZnO, electrolysis was conducted by applying cell voltage of 1.1 V for 1 h using an Fe cathode and a Pt anode in the B2O3 – Na2O – Fe2O3 – ZnO molten oxides at 1173 K. The applied cell voltage was determined by considering the results of the CV measurements in Figure 9, which indicated that Fe oxide can be reduced at 0.97 V, whereas the reduction of ZnO required a higher cell voltage of 1.21 V. In addition, to investigate the influence of the composition variation of Fe2O3 and ZnO in the EAF dust, feedstocks with different ratios of Fe2O3 to ZnO, as listed in Table 2, were employed.
Figure 10 shows the BSE-EDS analysis results of the cross-section of the cathode surface before and after electrolysis with varying Fe2O3 to ZnO ratios from 3:1 to 1:3. Compared with the smooth surface observed in the electrode before electrolysis shown in Figure 10 (a), the electrode recovered after electrolysis in Figure 10 (b) and (c) showed a rough surface owing to the dendritic growth of the reduced Fe. In addition, several coarse particles resulting from dendritic growth were partially detached from the electrode surface. Such morphologies have been reported in the reduction of metal oxides in the solid state on solid electrodes, where the deposits tend to exhibit weak adhesion to the solid substrate owing to their branched structure and limited interfacial contact [35].
As shown in Figure 10 (d), (e), and (f), regardless of the composition ratio of the mixture of Fe2O3 and ZnO feedstocks, only metallic Fe was observed on the surface of the Fe cathode, whereas Zn, B, and Na were not observed. In addition, although the average cathodic current density during electrolysis decreased from 0.09·A·cm-2 to 0.02 A·cm-2 as the Fe2O3 concentration in the molten oxides decreased (see Figure S-2 (a) in the supplementary material), the selective reduction of Fe oxide proceeded. These results indicate that the selective reduction of Fe oxide over ZnO can be achieved via electrolysis in B2O3 – Na2O molten oxides at 1173 K when the ratio of Fe2O3 to ZnO ranges from 3:1 to 1:3. Therefore, EAF dust with various concentrations of Fe oxide and ZnO can be utilized as feedstock for producing Fe metal using the molten oxide system investigated in this study.
4.2.2. Reduction of ZnO from B2O3 – Na2O – ZnO Melt
Before conducting the co-reduction of Fe oxide and ZnO, the reduction behavior of ZnO during electrolysis in B2O3 – Na2O molten oxides at 1173 K was investigated. Electrolysis was conducted for 1 – 3 h using a Fe cathode and a Pt anode by applying a cell voltage of 1.6 V. The applied cell voltage was determined by considering the results of the CV measurements shown in Figure 9, which indicate that ZnO can be reduced at 1.21 V, whereas the decomposition of the supporting electrolyte occurs at a higher cell voltage of 1.65 V.
Figure 11 shows the BSE-EDS analytical results for the cathode recovered after electrolysis. As shown in Figure 11 (a), (b), and (c), an Fe – Zn solid solution was observed at the cathode, indicating the reduction of ZnO during electrolysis. The morphology of the electrode exhibited smooth surface compared with that of the surface with only electrodeposited Fe metal. The Zn concentration exhibited its highest value of 26.96 – 28.01 mass% Zn in the Fe cathode at 16 – 20 μm from the surface of the cathode, which is close to its maximum solubility. As shown in Figure 11 (d), at depths between 18 – 100 μm from the cathode surface, Zn diffused into interior of the Fe cathode, resulting in a gradual decrease in Zn concentration from its maximum concentration to below its detection limit of Zn. In addition, Figure 11 (d) also shows that the Zn concentration decreased more gradually with increasing electrolysis duration, because a larger amount of Zn was reduced.
Meanwhile, Figure 11 (d) shows that at depths in the range of 0 – 18 μm from the cathode, Zn concentration increased from the surface of cathode to its highest value. Zn concentration at the surface of the cathode was only 4.71 – 9.12 mass%. The low concentration of Zn at the surface of the cathode is assumed to be due to the volatilization of Zn. As shown in Figure 8, Zn exhibits high vapor pressure of 10-2 atm, even when the concentration of Zn in the Fe – Zn alloy is 0.2 mass% at 1173 K. Therefore, Zn at the surface of the Fe cathode was expected to be evaporated during electrolysis, resulting in the low concentration of Zn at the surface of the Fe cathode.
4.2.3. Co-Reduction of Fe Oxide and ZnO from B2O3 – Na2O – Fe2O3 – ZnO Melt
Although the selective reduction of Fe oxides from a mixture of Fe2O3 and ZnO through electrolysis at 1.1 V was confirmed, a low cathodic current density was observed during electrolysis. Therefore, electrolysis of the mixture of Fe2O3 and ZnO was conducted by applying 1.6 V to investigate the reduction behavior of the oxides while increasing the cathodic current density. Electrolysis was conducted in B2O3 – Na2O – Fe2O3 – ZnO molten oxides using feedstocks with different ratios of Fe2O3 to ZnO in Table 2, for 1 h using an Fe cathode and a Pt anode at 1173 K. When electrolysis is conducted at 1.6 V, the co-reduction of Fe and Zn oxide to produce the Fe – Zn alloy is expected considering the decomposition voltages of Fe oxide and ZnO, as shown in Figure 9. However, Zn can be separated from the Fe – Zn alloy through vacuum distillation owing to the large vapor pressure difference between Fe and Zn.
Figure 12 shows the BSE-EDS analytical results of the cross-section of the cathode recovered after electrolysis conducted for 1 h at 1.6 V, using Fe2O3 and ZnO feedstock at the various ratios. As shown in Figure 12, an Fe – Zn solid solution was observed in the Fe cathode, indicating that ZnO was reduced on the Fe cathode. The Zn concentration in the Fe cathode increased as the ZnO concentration in the feedstock increased, exhibiting its highest value of 5.34 – 13.28 mass% Zn, at 10 – 14 μm from the surface of the cathode. The Zn concentration decreased gradually after reaching its highest concentration depth owing to its diffusion into the interior of the Fe cathode. Meanwhile, the concentration of Zn near at the surface of the Fe cathode was 1.89 – 2.87 mass%, because of the evaporation of Zn at the surface of the cathode.
In addition, as shown in Figure 12 (a), (b), and (c), the electrode showed rough surface owing to the dendritic growth of reduced Fe. The dendritic Fe deposit contained 6.98 – 17.87 mass% of Zn (see Figure S-3 in the supplementary material). These results indicate that the co-reduction of Fe oxide and ZnO occurred when the electrolysis was conducted at a cell voltage of 1.6 V.
The morphology of the dendritic Fe deposit was further analyzed to evaluate the effect of the cell voltage. As shown in Figure 10 (b), when the applied cell voltage is 1.1 V, the reduced Fe appears as coarse and compact deposits localized near the cathode surface. In contrast, as shown in Figure 10 (c), at 1.6 V, the deposits exhibit a finer dendritic morphology, which is more widely distributed in electrolyte. This suggests that a higher cell overpotential by applying 1.6 V promoted an increased nucleation rate and finer dendrite growth.
The electrolysis results indicate that the co-reduction of Fe oxide and ZnO is attainable at 1173 K with an applied cell voltage of 1.6 V, when the ratio of Fe2O3 to ZnO in the feedstock ranges from 3:1 to 1:3, where Fe is reduced on the surface of the Fe cathode and Zn is reduced into the Fe cathode and the Fe deposit. In addition, the cathodic current density of 0.46 A·cm-2 – 0.33 A·cm-2 was observed during electrolysis with the applied cell voltage of 1.6 V. This value is significantly higher than that observed during electrolysis at 1.1 V (see Figure S-2 in the supplementary), indicating an enhanced overall reduction rate of oxides.
4.3. Vacuum Distillation of Fe - Zn Alloys
To investigate the feasibility of separating high-purity Fe and Zn from the Fe – Zn alloy, vacuum distillation of Fe – 27.1 mass% Zn alloys was conducted at 1000 – 1200 K for 1 – 12 h. The concentration of Zn in the Fe – Zn alloy was selected by considering its maximum concentration in Fe – Zn alloys obtained after electrolysis. Owing to the large difference in vapor pressure between Fe and Zn, vacuum distillation at high temperature is an effective method for separating Fe and Zn from their alloys (see Figure S-4 in the supplementary material).
Figure 13 shows the XRD results of the deposit obtained from the low-temperature part of the reactor and the residue at the bottom of the reactor after vacuum distillation of the Fe – Zn alloy at 1200 K for 12 h. The results show that Zn was separated from the Fe – Zn alloy and was condensed at the low-temperature part of the reactor with purity of ≥ 99.996 %. In addition, residue at the bottom of the reactor was Fe with purity of ≥ 99.9 % (see Figure S-5 and S-6 in the supplementary material). These results indicate that vacuum distillation enables the separation and recovery of high-purity Zn and Fe from Fe – Zn alloy.
The influence of distillation time and temperature on the recovery efficiency of Zn was evaluated. The Zn recovery efficiency was calculated using Equation (6), where wresidue is the weight of the residue at the bottom of the reactor, wfeed is the weight of the Fe – Zn alloy before vacuum distillation, CZn_feed is the concentration of Zn in the Fe – Zn alloy before vacuum distillation, and CZn_residue is the concentration of Zn in the residue at the bottom of the reactor.
R (%) = 100 × {1 - (wresidue / wfeed) / (CZn_feed / CZn_residue)}
Figure 14 shows the Zn recovery efficiency obtained after the vacuum distillation of the Fe – Zn alloy at 1000 K and 1200 K for 1 – 12 h. At 1000 K, the Zn recovery efficiency increased from 85.9 % at 1 h to 96.5 % at 12 h with the increasing distillation time. However, the Zn in Fe – Zn alloys was not completely recovered even when the distillation was conducted for 12 h. This is because the vapor pressure of Zn was not sufficient for volatilization, as it decreases below 10-2 atm when its concentration in the Fe – Zn alloy decreases to 1.2 mass% during vacuum distillation.
Meanwhile, at 1200 K, the efficiency increased from 93.0 % to 99.0 % as the distillation time increased from 1 h to 6 h, and further increased to 99.7 – 99.9 % after 9 – 12 h. Recovery efficiency of Zn from Fe – Zn alloy at 1200 K was higher than that at 1000 K for the same distillation time because of the increase in the vapor pressure of Zn, as shown in Figure 8. These results suggest that a sufficient amount of Zn was recovered from the Fe – Zn alloy via vacuum distillation at 1200 K for 6 h, with recovery efficiency exceeding 99 %.
5. Conclusions
The electrochemical behavior and electrolysis of Fe2O3 and ZnO in a B2O3 – Na2O molten oxide electrolyte at 1173 K were investigated to develop a CO2-free process for the recovery of Fe and Zn from EAF dust. The results of CV measurements revealed that the decomposition voltages of FeO, ZnO, and B2O3 of the electrolyte were 0.97 V, 1.21 V, and 1.65 V, respectively, as expected from thermodynamic calculations. When electrolysis was conducted at a cell voltage of 1.1 V for 1 h using an Fe cathode and a Pt anode, selective reduction of Fe oxide was observed, forming coarse metallic deposits on the cathode surface. In addition, at the applied cell voltage of 1.6 V for 1 h, an Fe – Zn alloy was produced owing to the co-reduction of Fe oxide and ZnO, and the maximum concentration of Zn in the Fe cathode increased from 5.34 mass% to 13.28 mass% when the ratio of ZnO in the feedstock increased from 0.25 to 0.75. When vacuum distillation was conducted at 1200 K for 12 h, Zn metal with a purity exceeding 99.996 % was obtained, with a recovery efficiency above 99.9 %.
Supplementary Materials
The following supporting information can be downloaded at: Preprints.org, Figure S-1: Photograph of experimental apparatus used for cyclic voltammetry measurement and electrolysis in the study; Figure S-2: Current density during electrolysis of Fe2O3 and ZnO mixture in 73 mass% B2O3 – Na2O molten oxide electrolyte at 1173 K for 1h, by applying cell voltage of (a) 1.1 V and (b) 1.6 V; Figure S-3: SEM-EDS analysis result of the cathode after electrolysis of B2O3 – Na2O – Fe2O3 – ZnO at 1173 K for 1 h by applying cell voltage of 1.6 V in following feedstocks; (a) 2.25 g of Fe2O3 + 0.75 g of ZnO (Exp. no. 2-1); (b) 0.75 g of Fe2O3 + 2.25 g of ZnO (Exp. no. 2-3); Figure S-4: Vapor pressure of Fe and Zn at elevated temperatures; Figure S-5: Temperature profile of the reactor at 1200 K and photographs of deposit and residue obtained after vacuum distillation of Fe – Zn alloy at 1200 K for 12 h; Figure S-6: ICP results of Fe – Zn alloy before vacuum distillation, Zn deposit after distillation at 1200 K for 12 h, and residues after distillation at 1000 K and 1200 K for 1 – 12 h.
Author Contributions
Conceptualization: Joongseok Kim, In-Ho Jung, Jungshin Kang and Kyung-Woo Yi; Formal analysis, Joongseok Kim; Funding acquisition, Jungshin Kang and Kyung-Woo Yi; Investigation, Joongseok Kim; Supervision, Jungshin Kang and Kyung-Woo Yi; Validation, Joongseok Kim, In-Ho Jung, Jungshin Kang and Kyung-Woo Yi; Visualization, Joongseok Kim; Writing—original draft preparation, , Joongseok Kim; Writing—review and editing, In-Ho Jung, Jungshin Kang and Kyung-Woo Yi;. All authors have read and agreed to the published version of the manuscript.
Funding
This research was supported by the Korea Institute of Energy Technology Evaluation and Planning (KETEP) (Project No.: RS-2023-00246095), funded by the Ministry of Trade, Industry & Energy (MOTIE) of the Republic of Korea and by Pohang Iron & Steel Company (POSCO) (Project No.: 2022Z001).
Institutional Review Board Statement
Not applicable.
Informed Consent Statement
Not applicable.
Data Availability Statement
The original contributions presented in the study are included in the article. Further inquiries can be directed to the corresponding author.
Conflicts of Interest
The authors declare no conflict of interest.
References
- World Steel Association. World steel in figures 2025. Available online: https://worldsteel.org/data/world-steel-in-figures/world-steel-in-figures-2025/ (accessed on 7 Jul 2025).
- US Geological Survey. Mineral commodity summaries 2025: iron and steel. Available online: https://pubs.usgs.gov/periodicals/mcs2025/mcs2025-iron-steel.pdf (accessed on 14 Jul 2025).
- Sohn, H. Recycling of Common Metals; KNU Press: Daegu, Korea, 2020; pp. 120–121. [Google Scholar]
- World Steel Association. Steel’s contribution to a low carbon future and climate resilient societies. Available online: https://www.acero.org.ar/wp-content/uploads/2020/02/Position_paper_climate_2020_vfinal.pdf (accessed on 14 Jul 2025).
- Allanore, A.; Yin, L.; Sadoway, D.R. A new anode material for oxygen evolution in molten oxide electrolysis. Nature 2013, 497, 353–356. [Google Scholar] [CrossRef]
- Zhang, K.; Jiao, H.; Zhou, Z.; Jiao, S.; Zhu, H. Electrochemical behavior of Fe (III) ion in CaO-MgO-SiO2-Al2O3-NaF-Fe2O3 melts at 1673 K. J. Electrochem. Soc. 2016, 163, D710. [Google Scholar] [CrossRef]
- Wiencke, J.; Lavelaine, H.; Panteix, P.-J.; Petitjean, C.; Rapin, C. Electrolysis of iron in a molten oxide electrolyte. J. Appl. Electrochem. 2018, 48, 115–126. [Google Scholar] [CrossRef]
- Liu, J.; Zhang, Y. Electroreduction mechanism and electrodeposition of ferric ions in CaO−SiO2−Al2O3−Fe2O3 slags at 1773 K. Can. Metall. Q. 2023, 62, 119–124. [Google Scholar] [CrossRef]
- Kim, H.; Paramore, J.D.; Allanore, A.; Sadoway, D.R. Stability of iridium anode in molten oxide electrolysis for ironmaking: influence of slag basicity. ECS Trans. 2010, 33, 219. [Google Scholar] [CrossRef]
- Wang, D.; Gmitter, A.J.; Sadoway, D.R. Production of oxygen gas and liquid metal by electrochemical decomposition of molten iron oxide. J. Electrochem. Soc. 2011, 158, E51. [Google Scholar] [CrossRef]
- Choi, H.-G.; Choi, S.; Kim, M.-K.; Jang, J.; Nam, K.T.; Jung, I.-H.; Yi, K.-W. Electrolysis of iron with oxygen gas evolution from molten sodium borate electrolytes. Ironmaking Steelmaking 2021, 48, 1030–1037. [Google Scholar] [CrossRef]
- Park, K.W.; Sohn, I. Electrochemical reduction of K2MoO4-Fe2O3 binary melts using a consumable steel electrode to produce ferromolybdenum alloys. J. Sustain. Metall. 2023, 9, 753–762. [Google Scholar] [CrossRef]
- Zhou, Z.; Jiao, H.; Tu, J.; Zhu, J.; Jiao, S. Direct production of Fe and Fe-Ni alloy via molten oxides electrolysis. J. Electrochem. Soc. 2017, 164, E113. [Google Scholar] [CrossRef]
- Haarberg, G.M.; Kvalheim, E. Electrochemical behavior of dissolved Fe2O3 in molten CaCl2-KF. J. Iron Steel Res. Int. 2008, 15, 48–51. [Google Scholar] [CrossRef]
- Haarberg, G.M.; Kvalheim, E.; Rolseth, S.; Murakami, T.; Pietrzyk, S.; Wang, S. Electrodeposition of iron from molten mixed chloride/fluoride electrolytes. ECS Trans. 2007, 3, 341. [Google Scholar] [CrossRef]
- Li, H.; Jia, L.; Liang, J.-l.; Yan, H.-y.; Cai, Z.-y.; Reddy, R.G. Study on the direct electrochemical reduction of Fe2O3 in NaCl-CaCl2 melt. Int. J. Electrochem. Sci. 2019, 14, 11267–11278. [Google Scholar] [CrossRef]
- Xie, K.; Kamali, A.R. Molten salt electrochemical production and in situ utilization of hydrogen for iron production. Int. J. Hydrog. Energy 2019, 44, 24353–24359. [Google Scholar] [CrossRef]
- Li, G.; Wang, D.; Chen, Z. Direct reduction of solid Fe2O3 in molten CaCl2 by potentially green process. J. Mater. Sci. Technol. 2009, 25, 767. [Google Scholar]
- Liu, C.; Liang, J.; Li, H.; Yan, H.; Zheng, S.; Cao, W.; Wang, L. The electrochemical reduction mechanism of ZnFe2O4. In NaCl-CaCl2 Melts. Crystals 2021, 11, 925. [Google Scholar] [CrossRef]
- Xu, Y.; Yan, H.; Jing, Z.; Qi, X.; Li, H.; Liang, J. Effect of Fe2O3 on electro-deoxidation in Fe2O3-Al2O3-NaCl-KCl system. Crystals 2021, 11, 1026. [Google Scholar] [CrossRef]
- Panigrahi, M.; Iizuka, A.; Shibata, E.; Nakamura, T. FeTi alloy production by electrolytic reduction of (Fe, Ti) oxide electrodes in molten calcium chloride. In Proceedings of the TT Chen Honorary Symposium on Hydrometallurgy, Electrometallurgy and Materials Characterization; TMS: Warrendale, PA, USA; 2012; pp. 273–284. [Google Scholar]
- Qiu, G.; Wang, D.; Ma, M.; Jin, X.; Chen, G.Z. Electrolytic synthesis of TbFe2 from Tb4O7 and Fe2O3 powders in molten CaCl2. J. Electroanal. Chem. 2006, 589, 139–147. [Google Scholar] [CrossRef]
- Tang, D.; Yin, H.; Xiao, W.; Zhu, H.; Mao, X.; Wang, D. Reduction mechanism and carbon content investigation for electrolytic production of iron from solid Fe2O3 in molten K2CO3-Na2CO3 using an inert anode. J. Electroanal. Chem. 2013, 689, 109–116. [Google Scholar] [CrossRef]
- Cox, A.; Fray, D.J. Mechanistic investigation into the electrolytic formation of iron from iron (III) oxide in molten sodium hydroxide. J. Appl. Electrochem. 2008, 38, 1401–1407. [Google Scholar] [CrossRef]
- Wang, S.; Ge, J.; Hu, Y.; Zhu, H.; Jiao, S. Electrochemical reduction of iron oxide in molten sodium hydroxide based on a Ni0. 94Si0. 04Al0. 02 metallic inert anode. Electrochim. Acta 2013, 87, 148–152. [Google Scholar] [CrossRef]
- Kim, M.-K.; Jung, I.-H. Coupled experimental phase diagram study and thermodynamic optimization of the Na2O−B2O3−Fe2O3 system in air. Calphad 2022, 76, 102364. [Google Scholar] [CrossRef]
- Kim, M.-K.; Jung, I.-H. Coupled phase diagram study and thermodynamic modeling of the Na2O-B2O3-ZnO system. J. Eur. Ceram. Soc. 2024, 44, 7370–7382. [Google Scholar] [CrossRef]
- Claes, P.; Coq, J.; Glibert, J. Electrical conductivity of molten B2O3 Na2O mixtures. Electrochim. Acta 1988, 33, 347–352. [Google Scholar] [CrossRef]
- Al-Zaibani, M.; Althobiti, R.; El Agammy, E.; Alzahrani, E.; El-Damrawi, G.; Doweidar, H.; Al-Muntaser, A. Electrical conduction in ternary Na2O-ZnO-B2O3 glasses; a unique dependence on the mobility of Na+ ions as main charge carriers. J. Non-Crystal. Solids 2025, 650, 123367. [Google Scholar] [CrossRef]
- Tijaria, M.; Sharma, Y.; Kumar, V.; Dahiya, S.; Dalal, J. Effect of Na2O on physical, structural and electrical properties of borate glasses. Mater. Today Proc. 2021, 45, 3722–3725. [Google Scholar] [CrossRef]
- Kim, H.; Paramore, J.; Allanore, A.; Sadoway, D.R. Electrolysis of molten iron oxide with an iridium anode: the role of electrolyte basicity. J. Electrochem. Soc. 2011, 158, E101. [Google Scholar] [CrossRef]
- Asai, K.; Yokokawa, T. Thermodynamic activity of Na2O in Na2O−B2O3−SiO2 melt. Trans. Jpn Inst. Met. 1982, 23, 571–577. [Google Scholar] [CrossRef]
- Konakov, V. A study of the acid–base properties of melts in the Na2O−B2O3−SiO2 system: II. Composition Joins with Sodium Oxide Contents of 25, 30, and 35 mol%. Glass Phys. Chem. 2002, 28, 135–138. [Google Scholar] [CrossRef]
- Park, J.H.; Min, D.J. Thermodynamic behavior of Na2O B2O3 melt. Metall. Mater. Trans. B 2001, 32, 297–303. [Google Scholar] [CrossRef]
- Popov, K.I.; Nikolić, N.D. General theory of disperse metal electrodeposits formation. In Electrochemical Production of Metal Powders; Springer, 2012; pp. 1–62. [CrossRef]
Figure 1.
Flowchart of the Fe and Zn production process presented in this study.
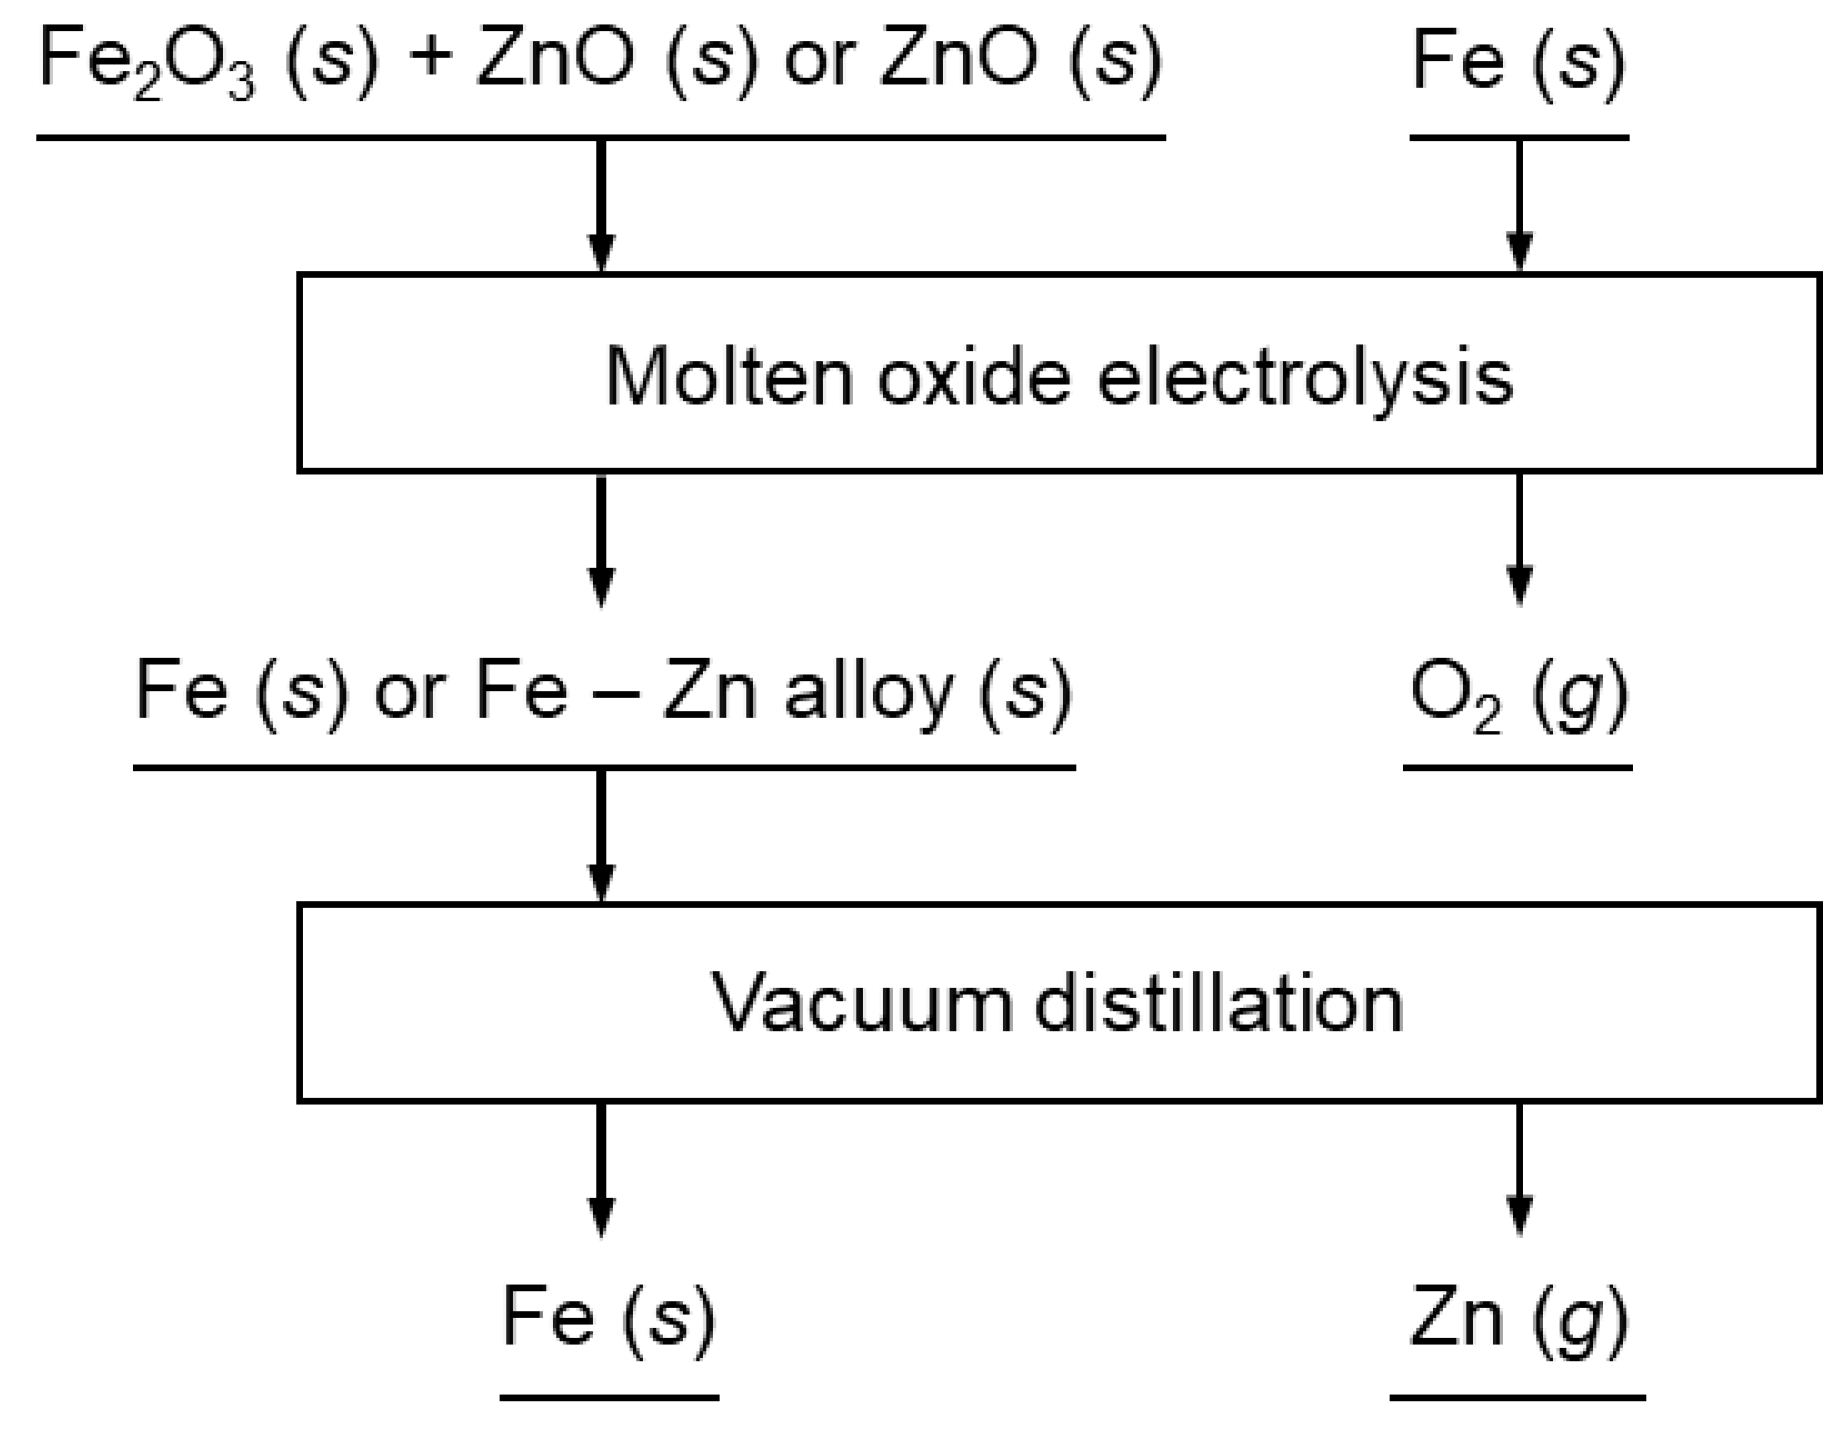
Figure 2.
Schematic of experimental apparatus used for (a) cyclic voltammetry measurement and (b) electrolysis in this study.
Figure 2.
Schematic of experimental apparatus used for (a) cyclic voltammetry measurement and (b) electrolysis in this study.
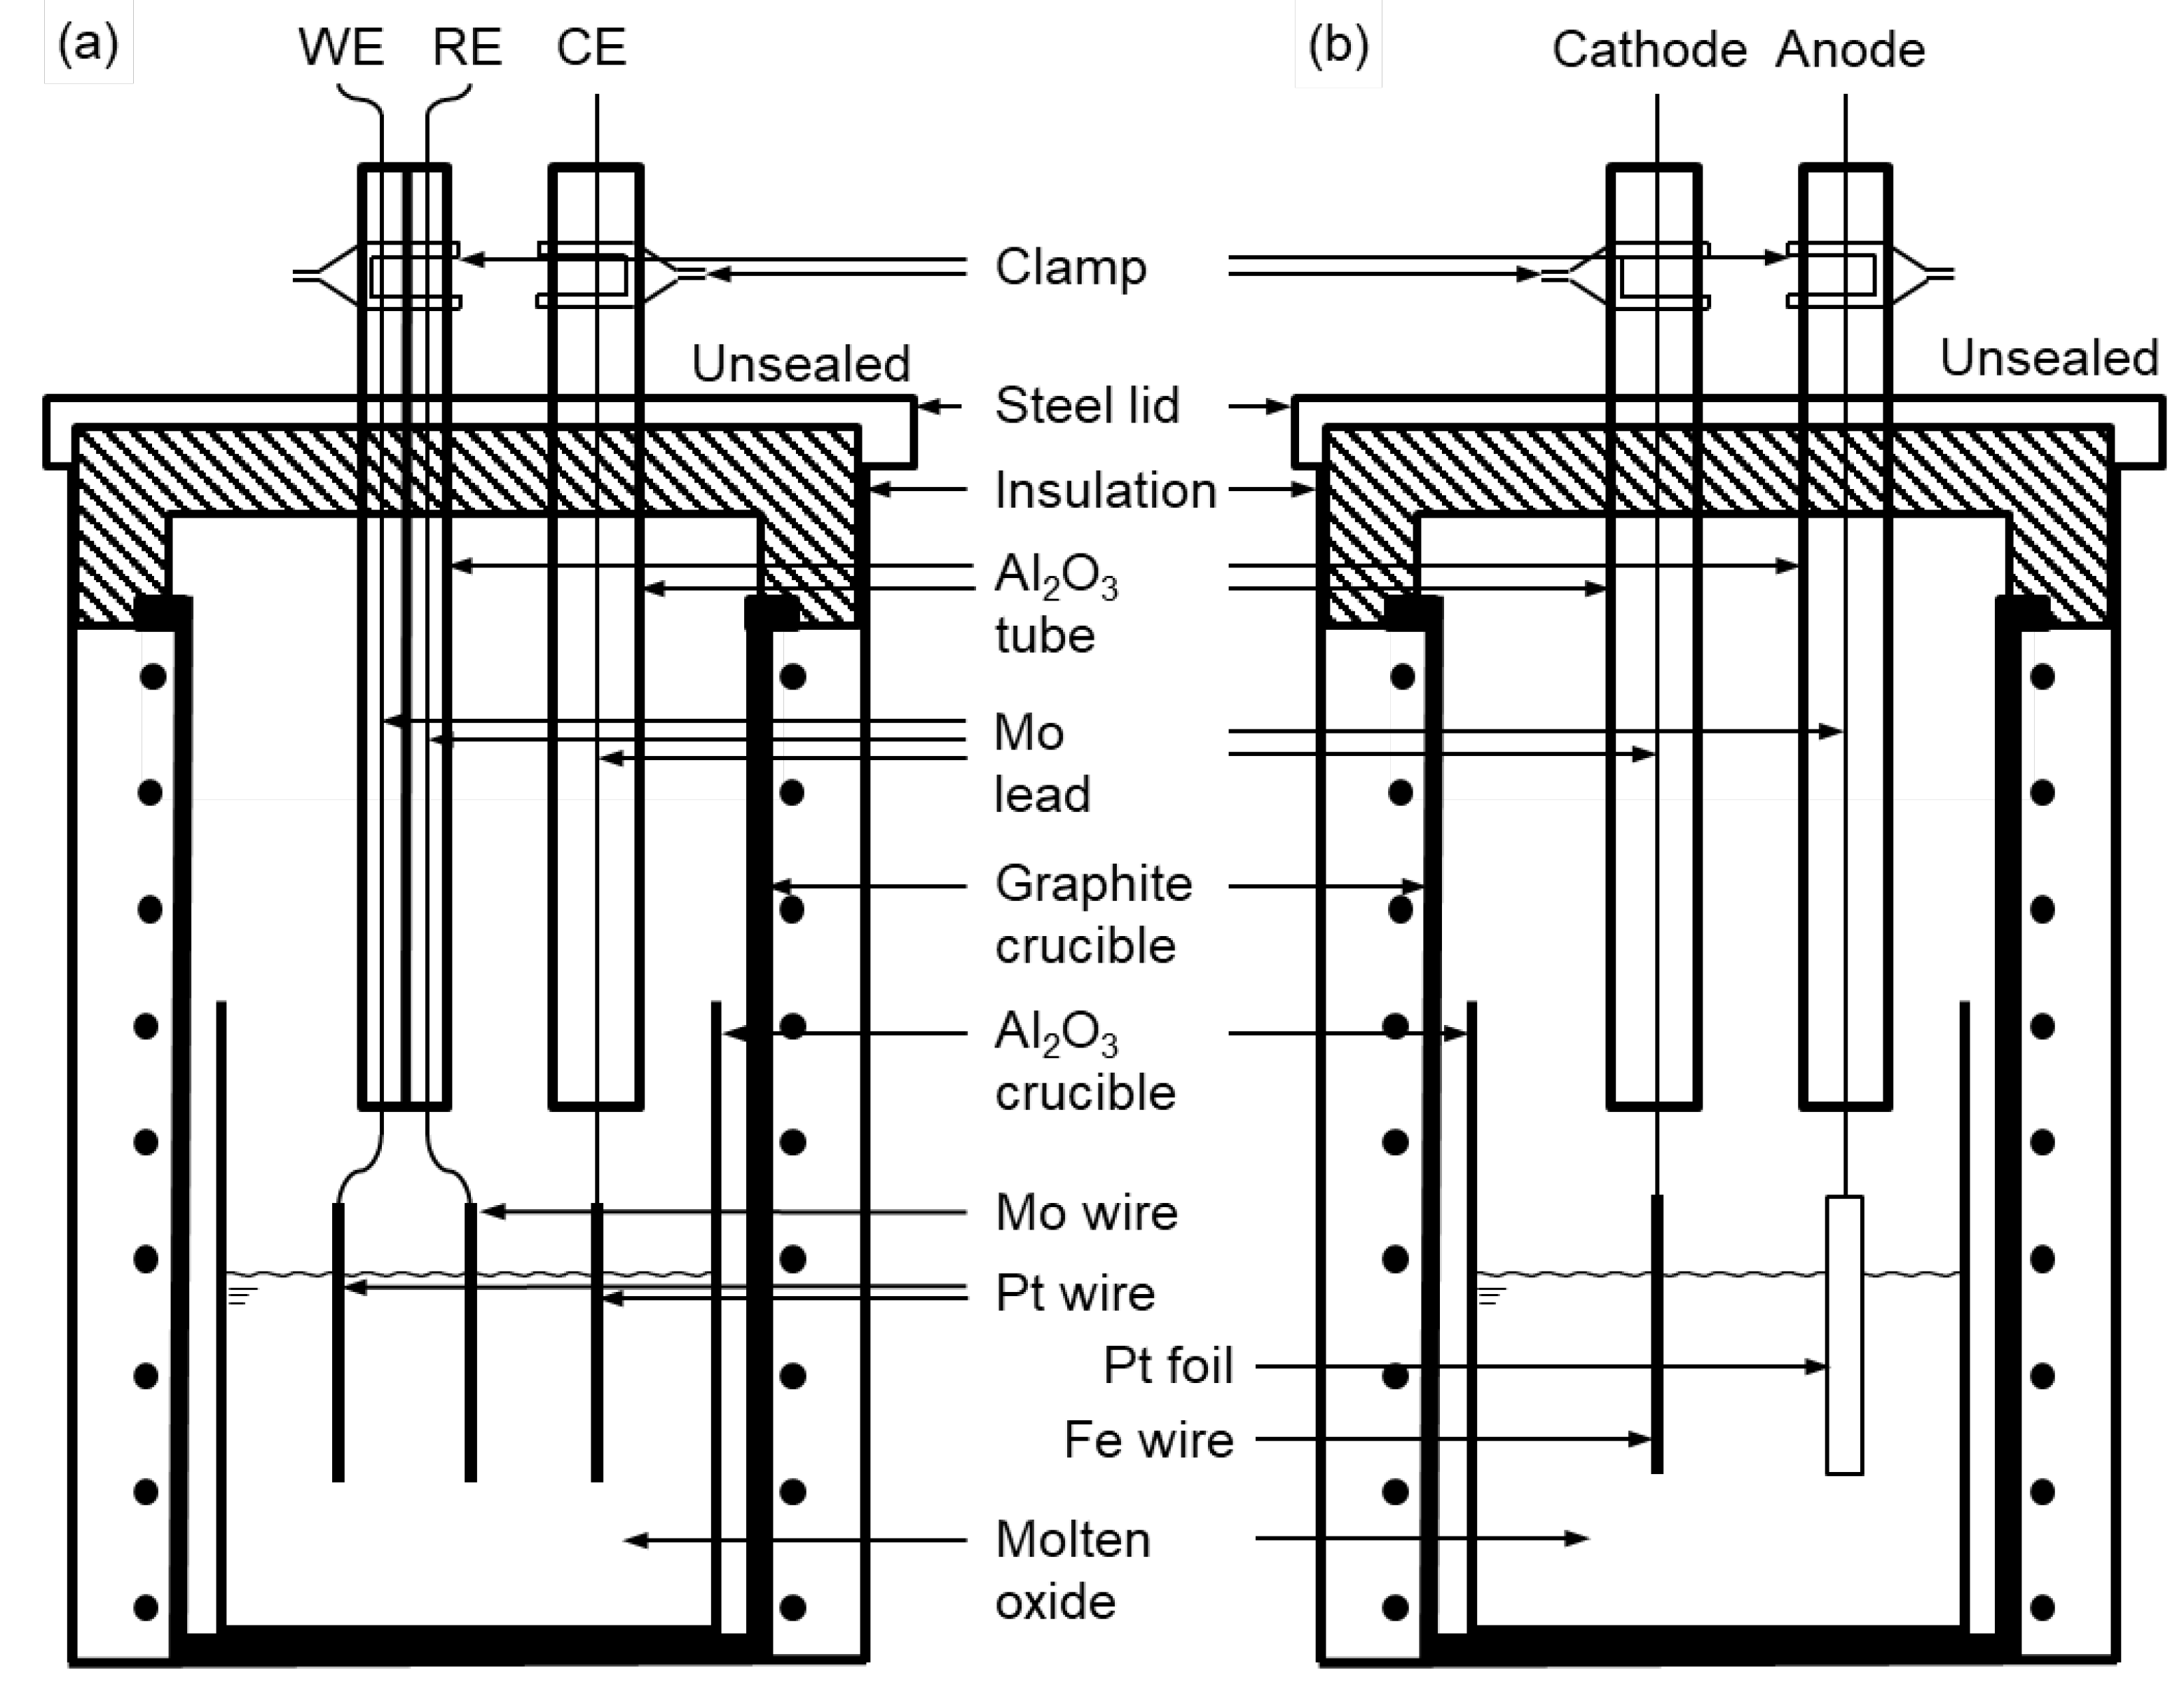
Figure 3.
(a) Schematic and (b) photograph of the experimental apparatus for vacuum distillation.
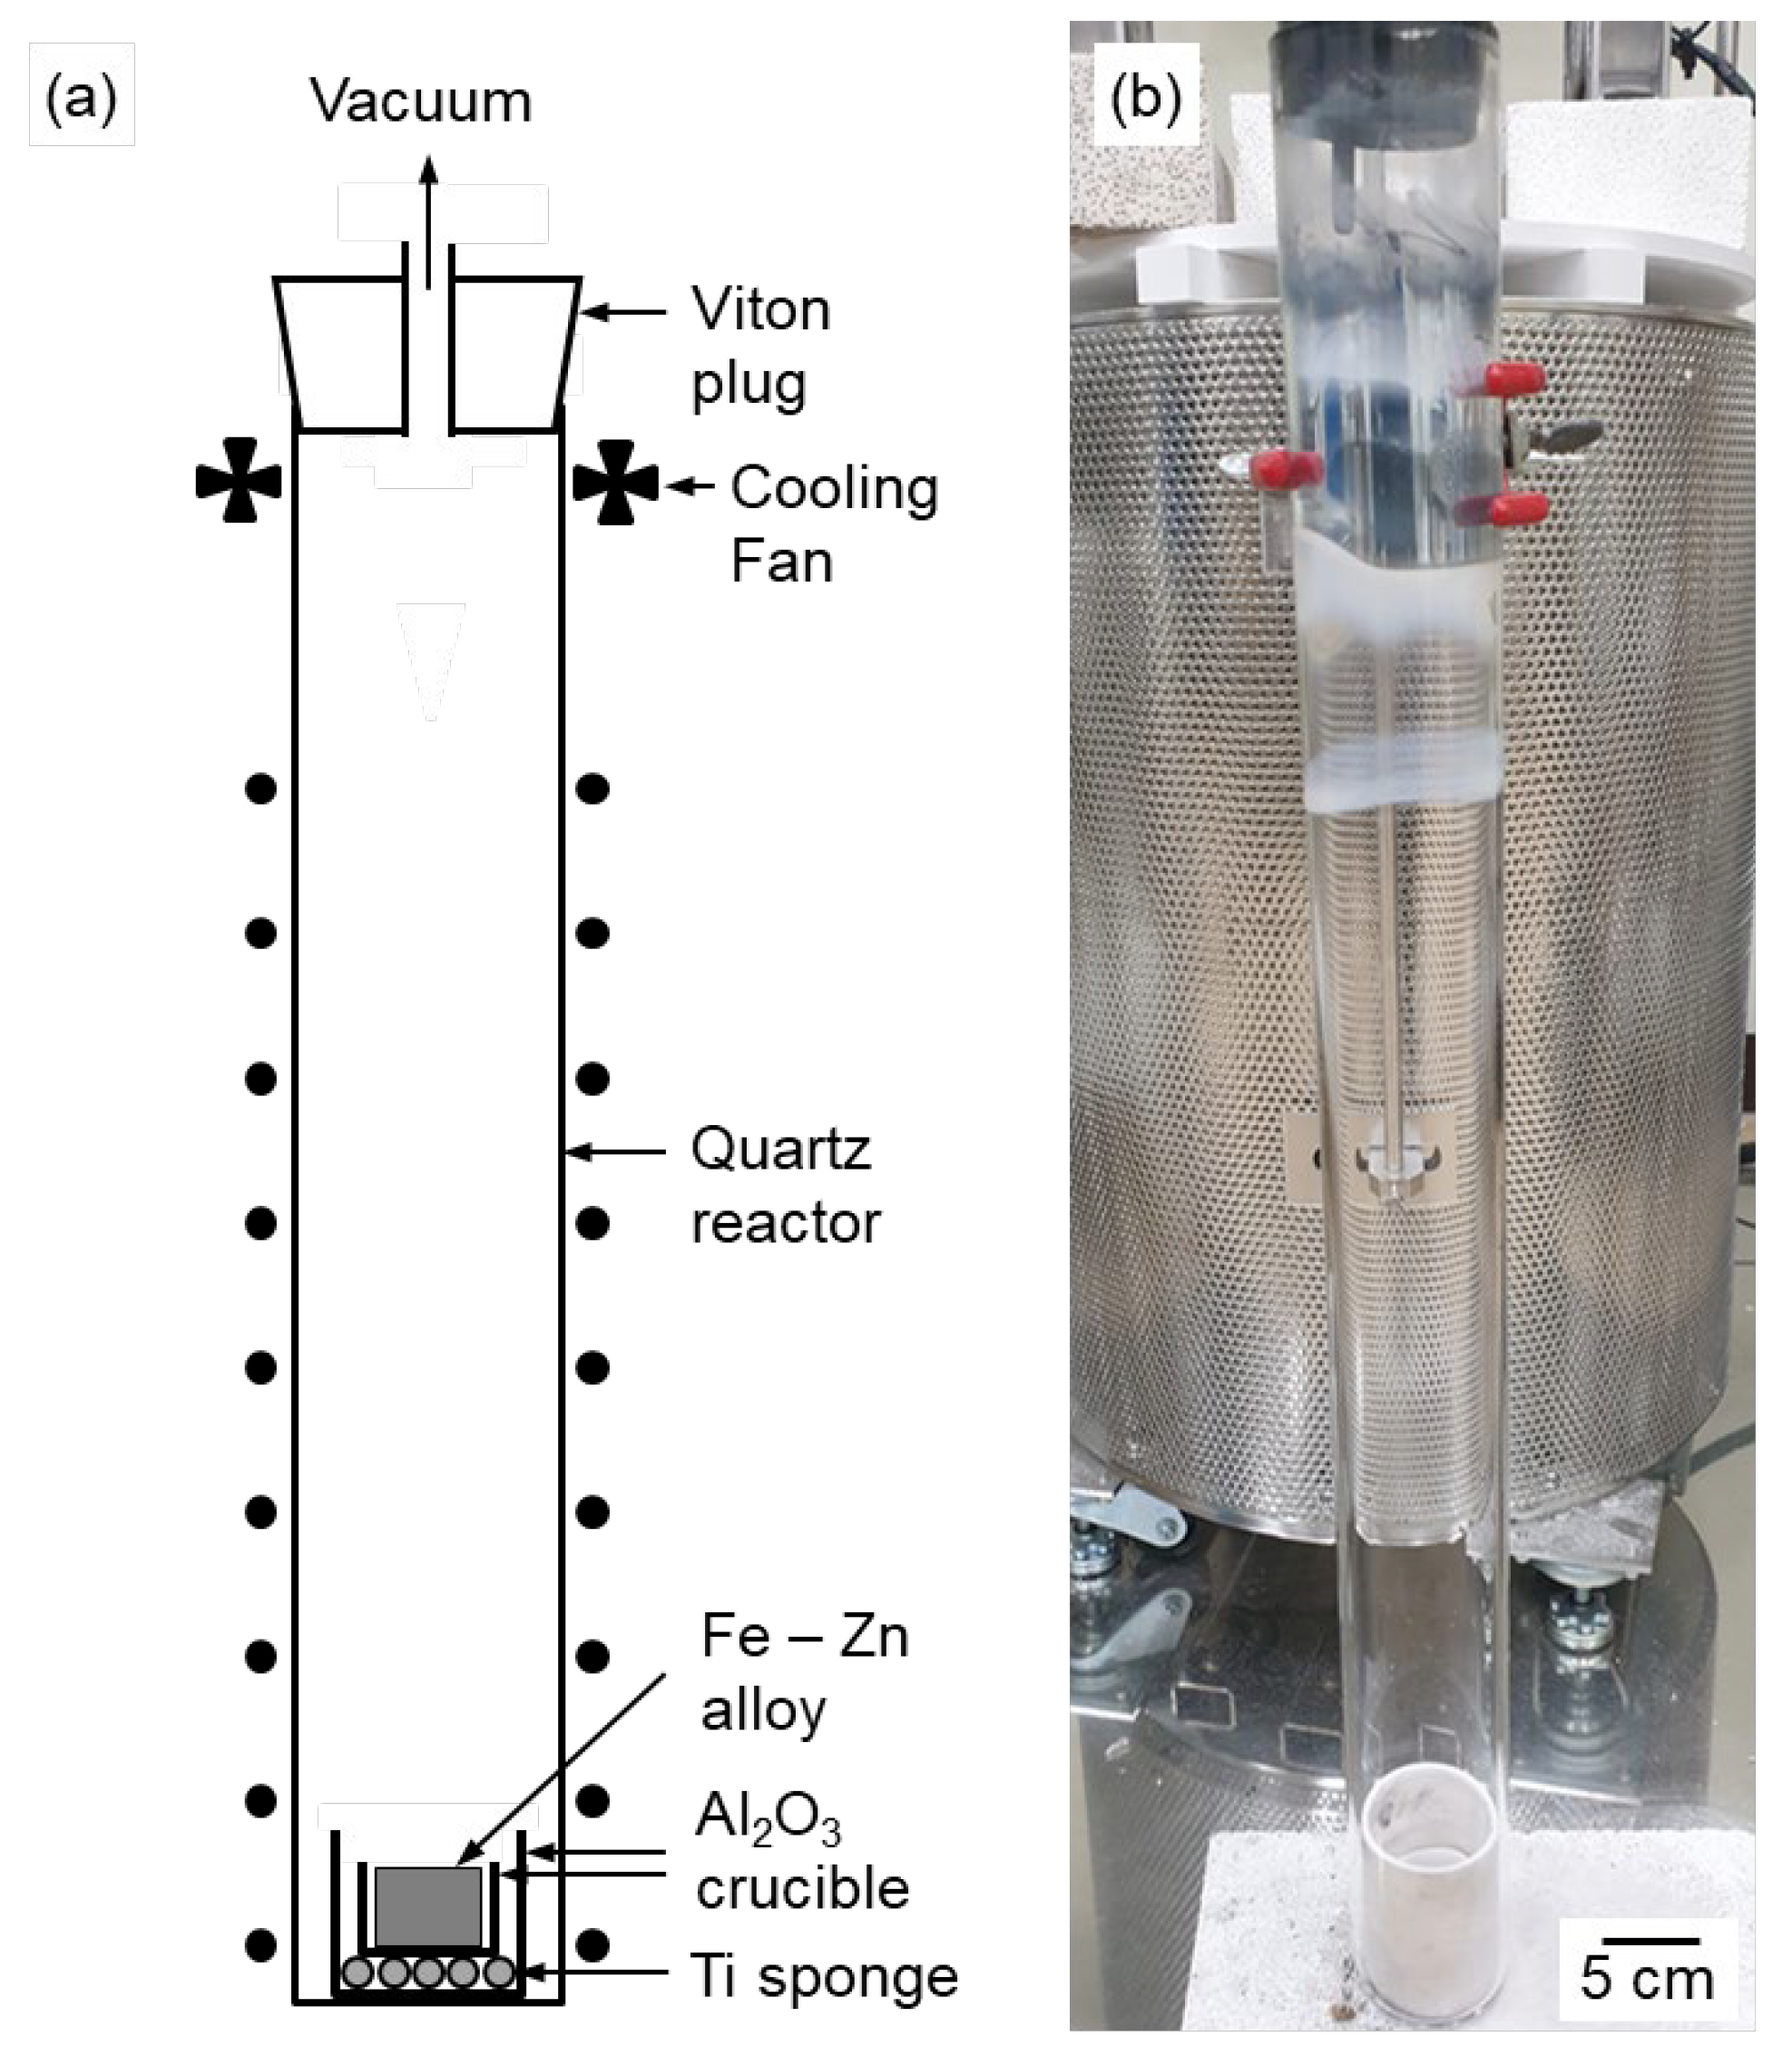
Figure 4.
Calculated binary phase diagram of the B2O3 – Na2O system.
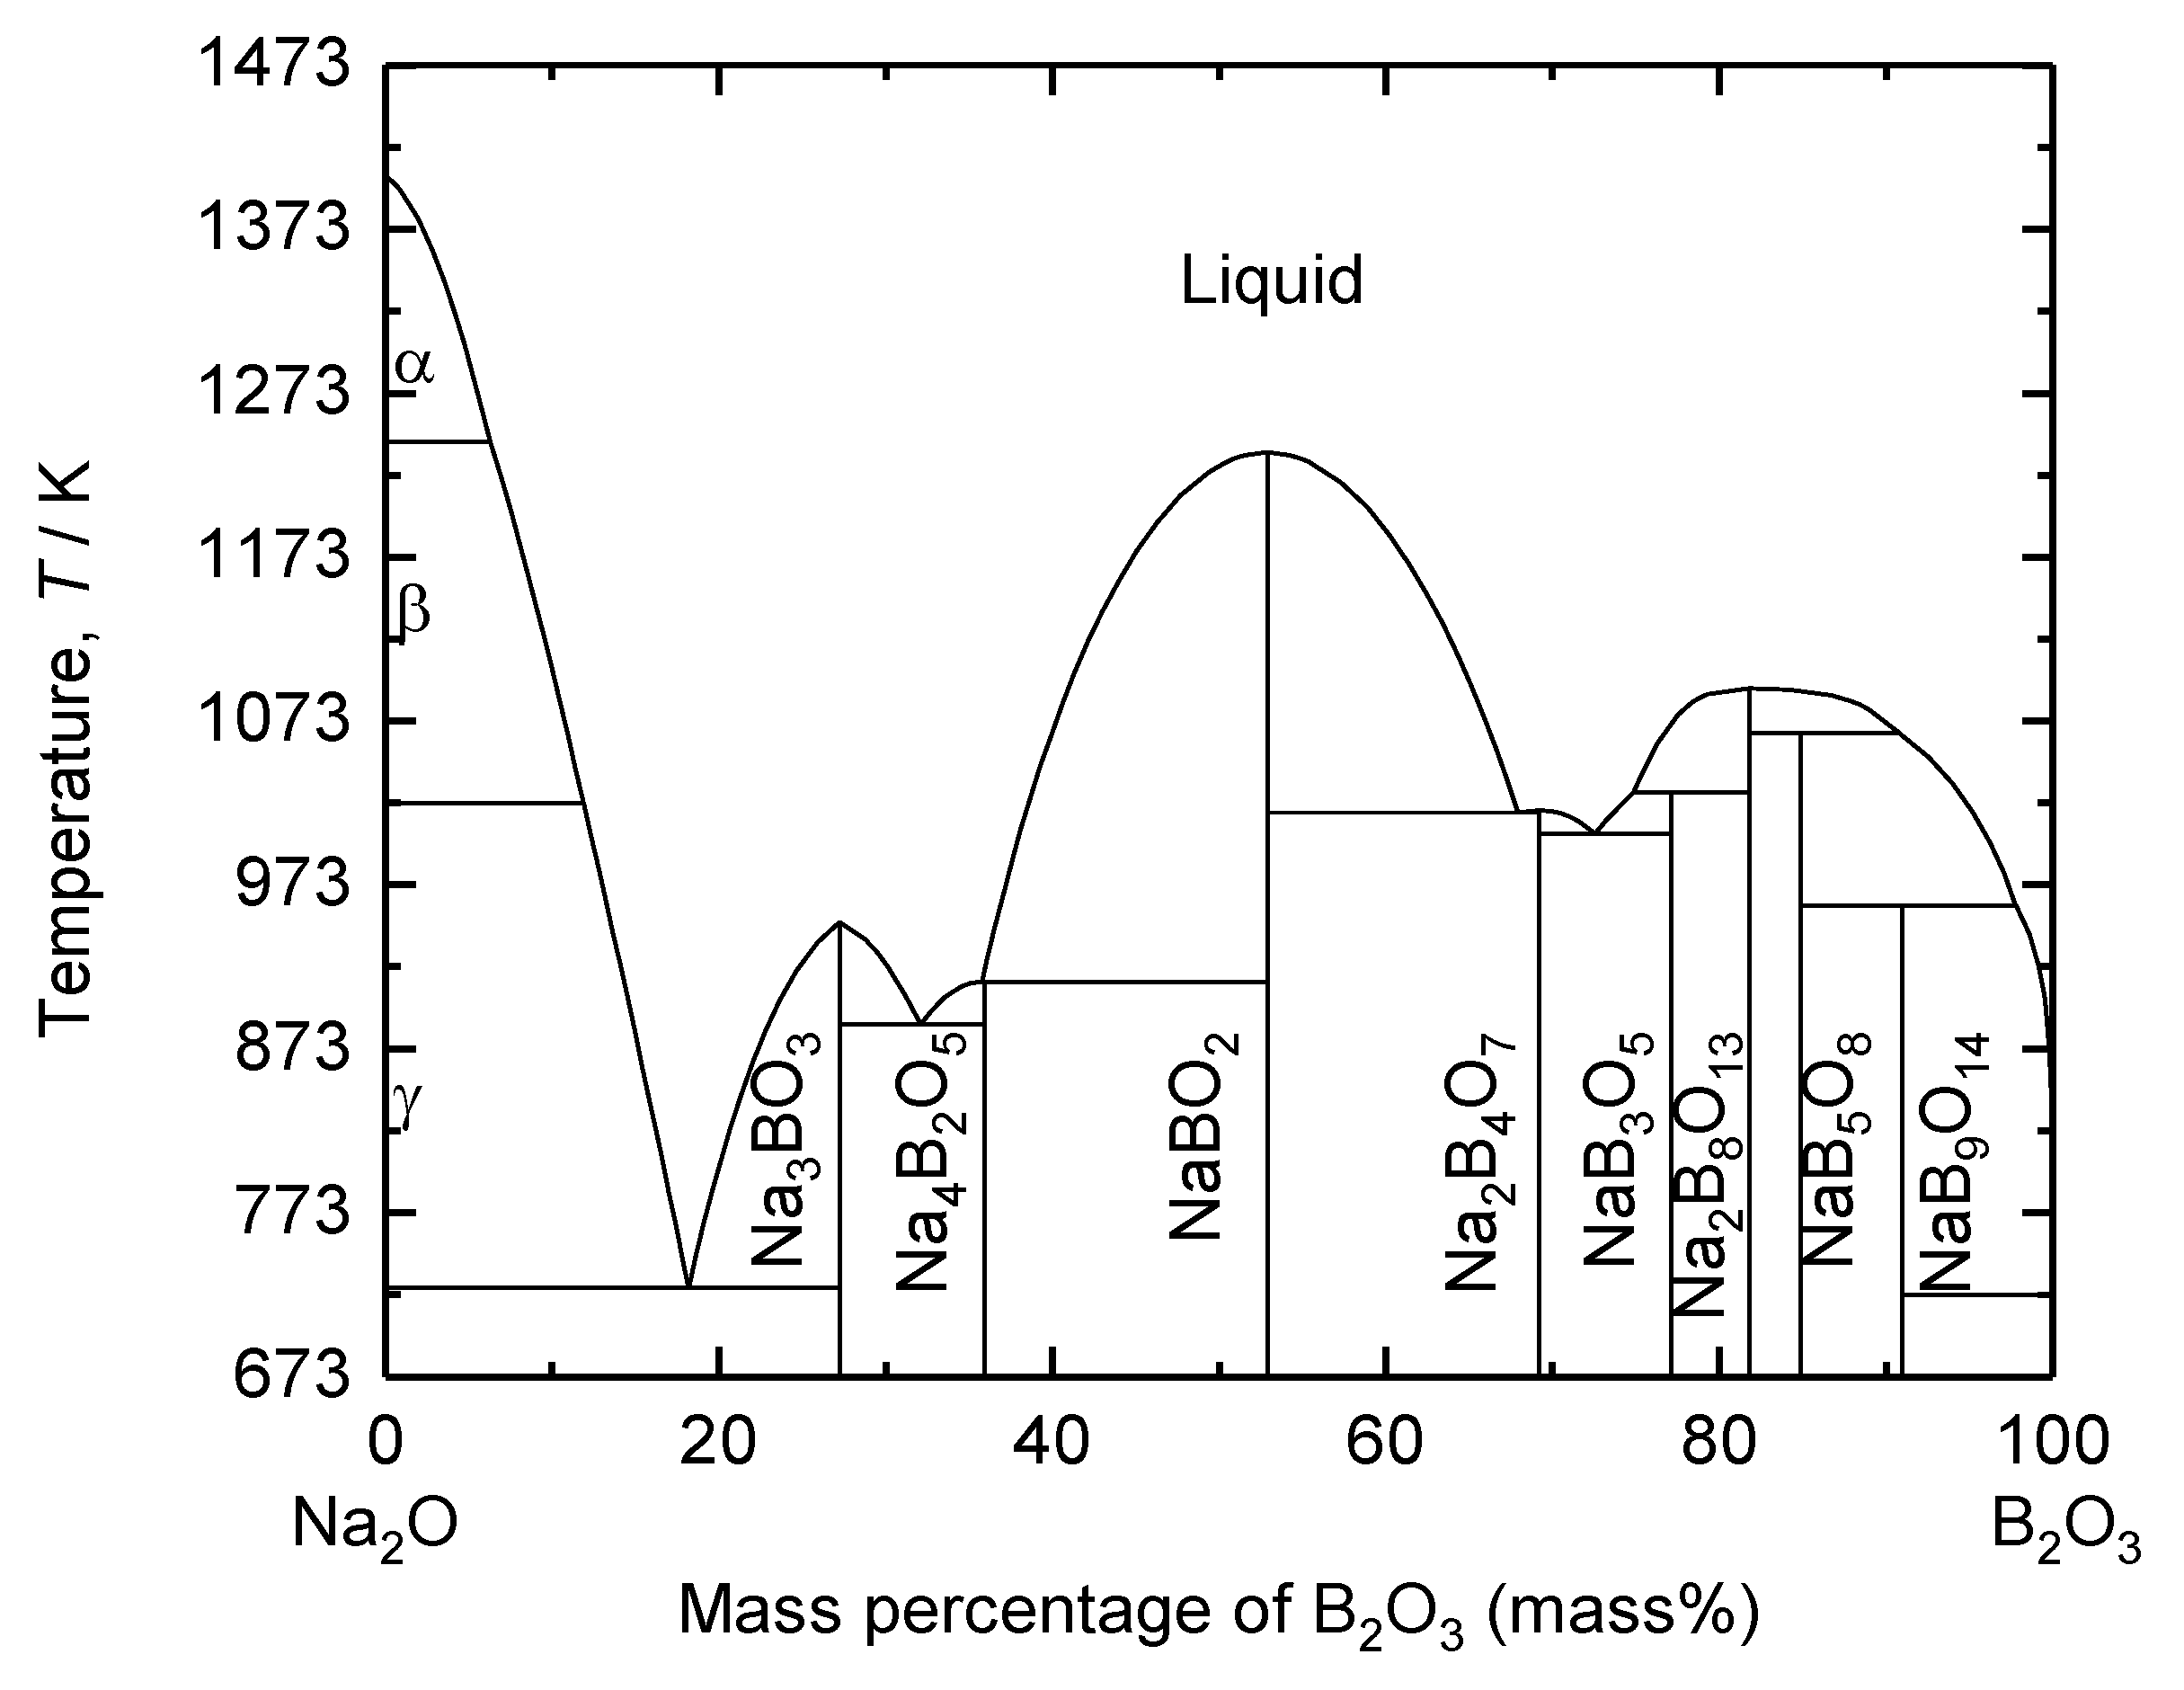
Figure 5.
Calculated phase diagram of B2O3 – Na2O – Fe2O3 – ZnO system at 1173 K with constant ZnO content of (a) 0 mass%, (b) 1 mass%, (c) 2 mass%, and (d) 3 mass%.
Figure 5.
Calculated phase diagram of B2O3 – Na2O – Fe2O3 – ZnO system at 1173 K with constant ZnO content of (a) 0 mass%, (b) 1 mass%, (c) 2 mass%, and (d) 3 mass%.
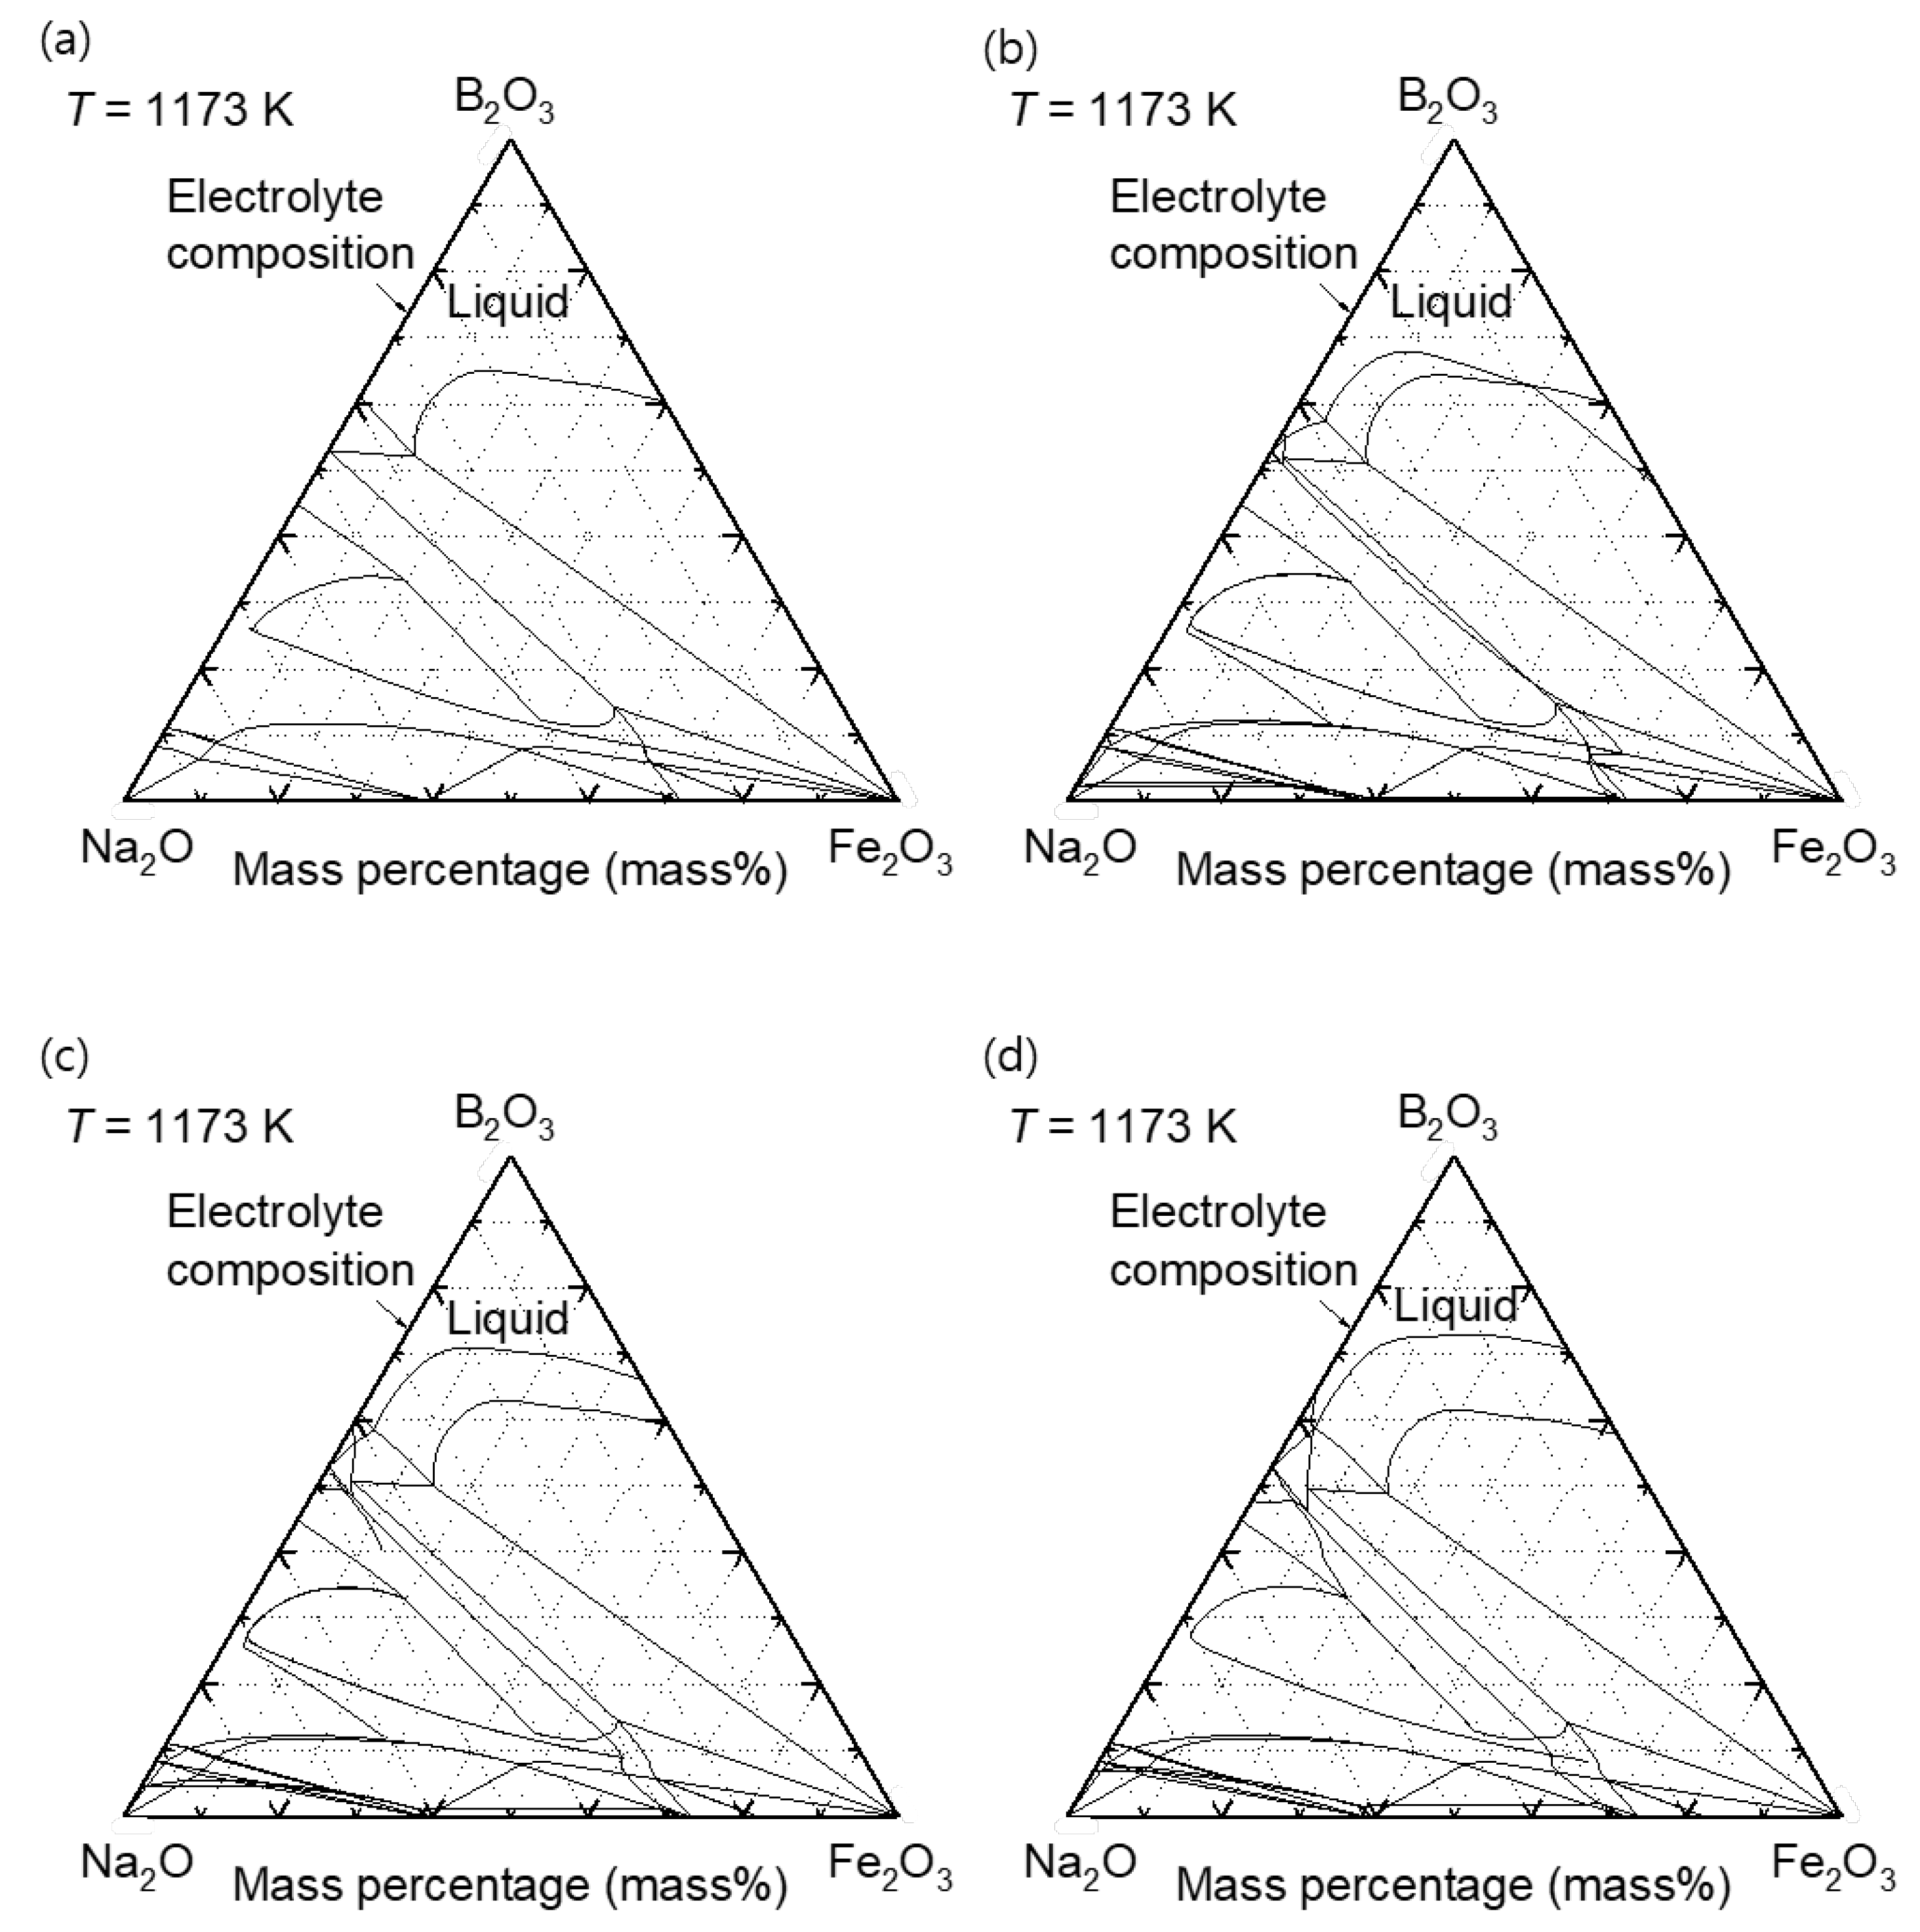
Figure 6.
(a) Variation of Fe2O3 and FeO in melt and the decomposition voltage for reduction of Fe2O3 to FeO as a function of partial oxygen pressure at 1173 K, calculated from FactSage database: electrolyte composition of 73 mass% B2O3 – Na2O. (b) Illustration of reactions during electrolysis of Fe oxide in oxide melt.
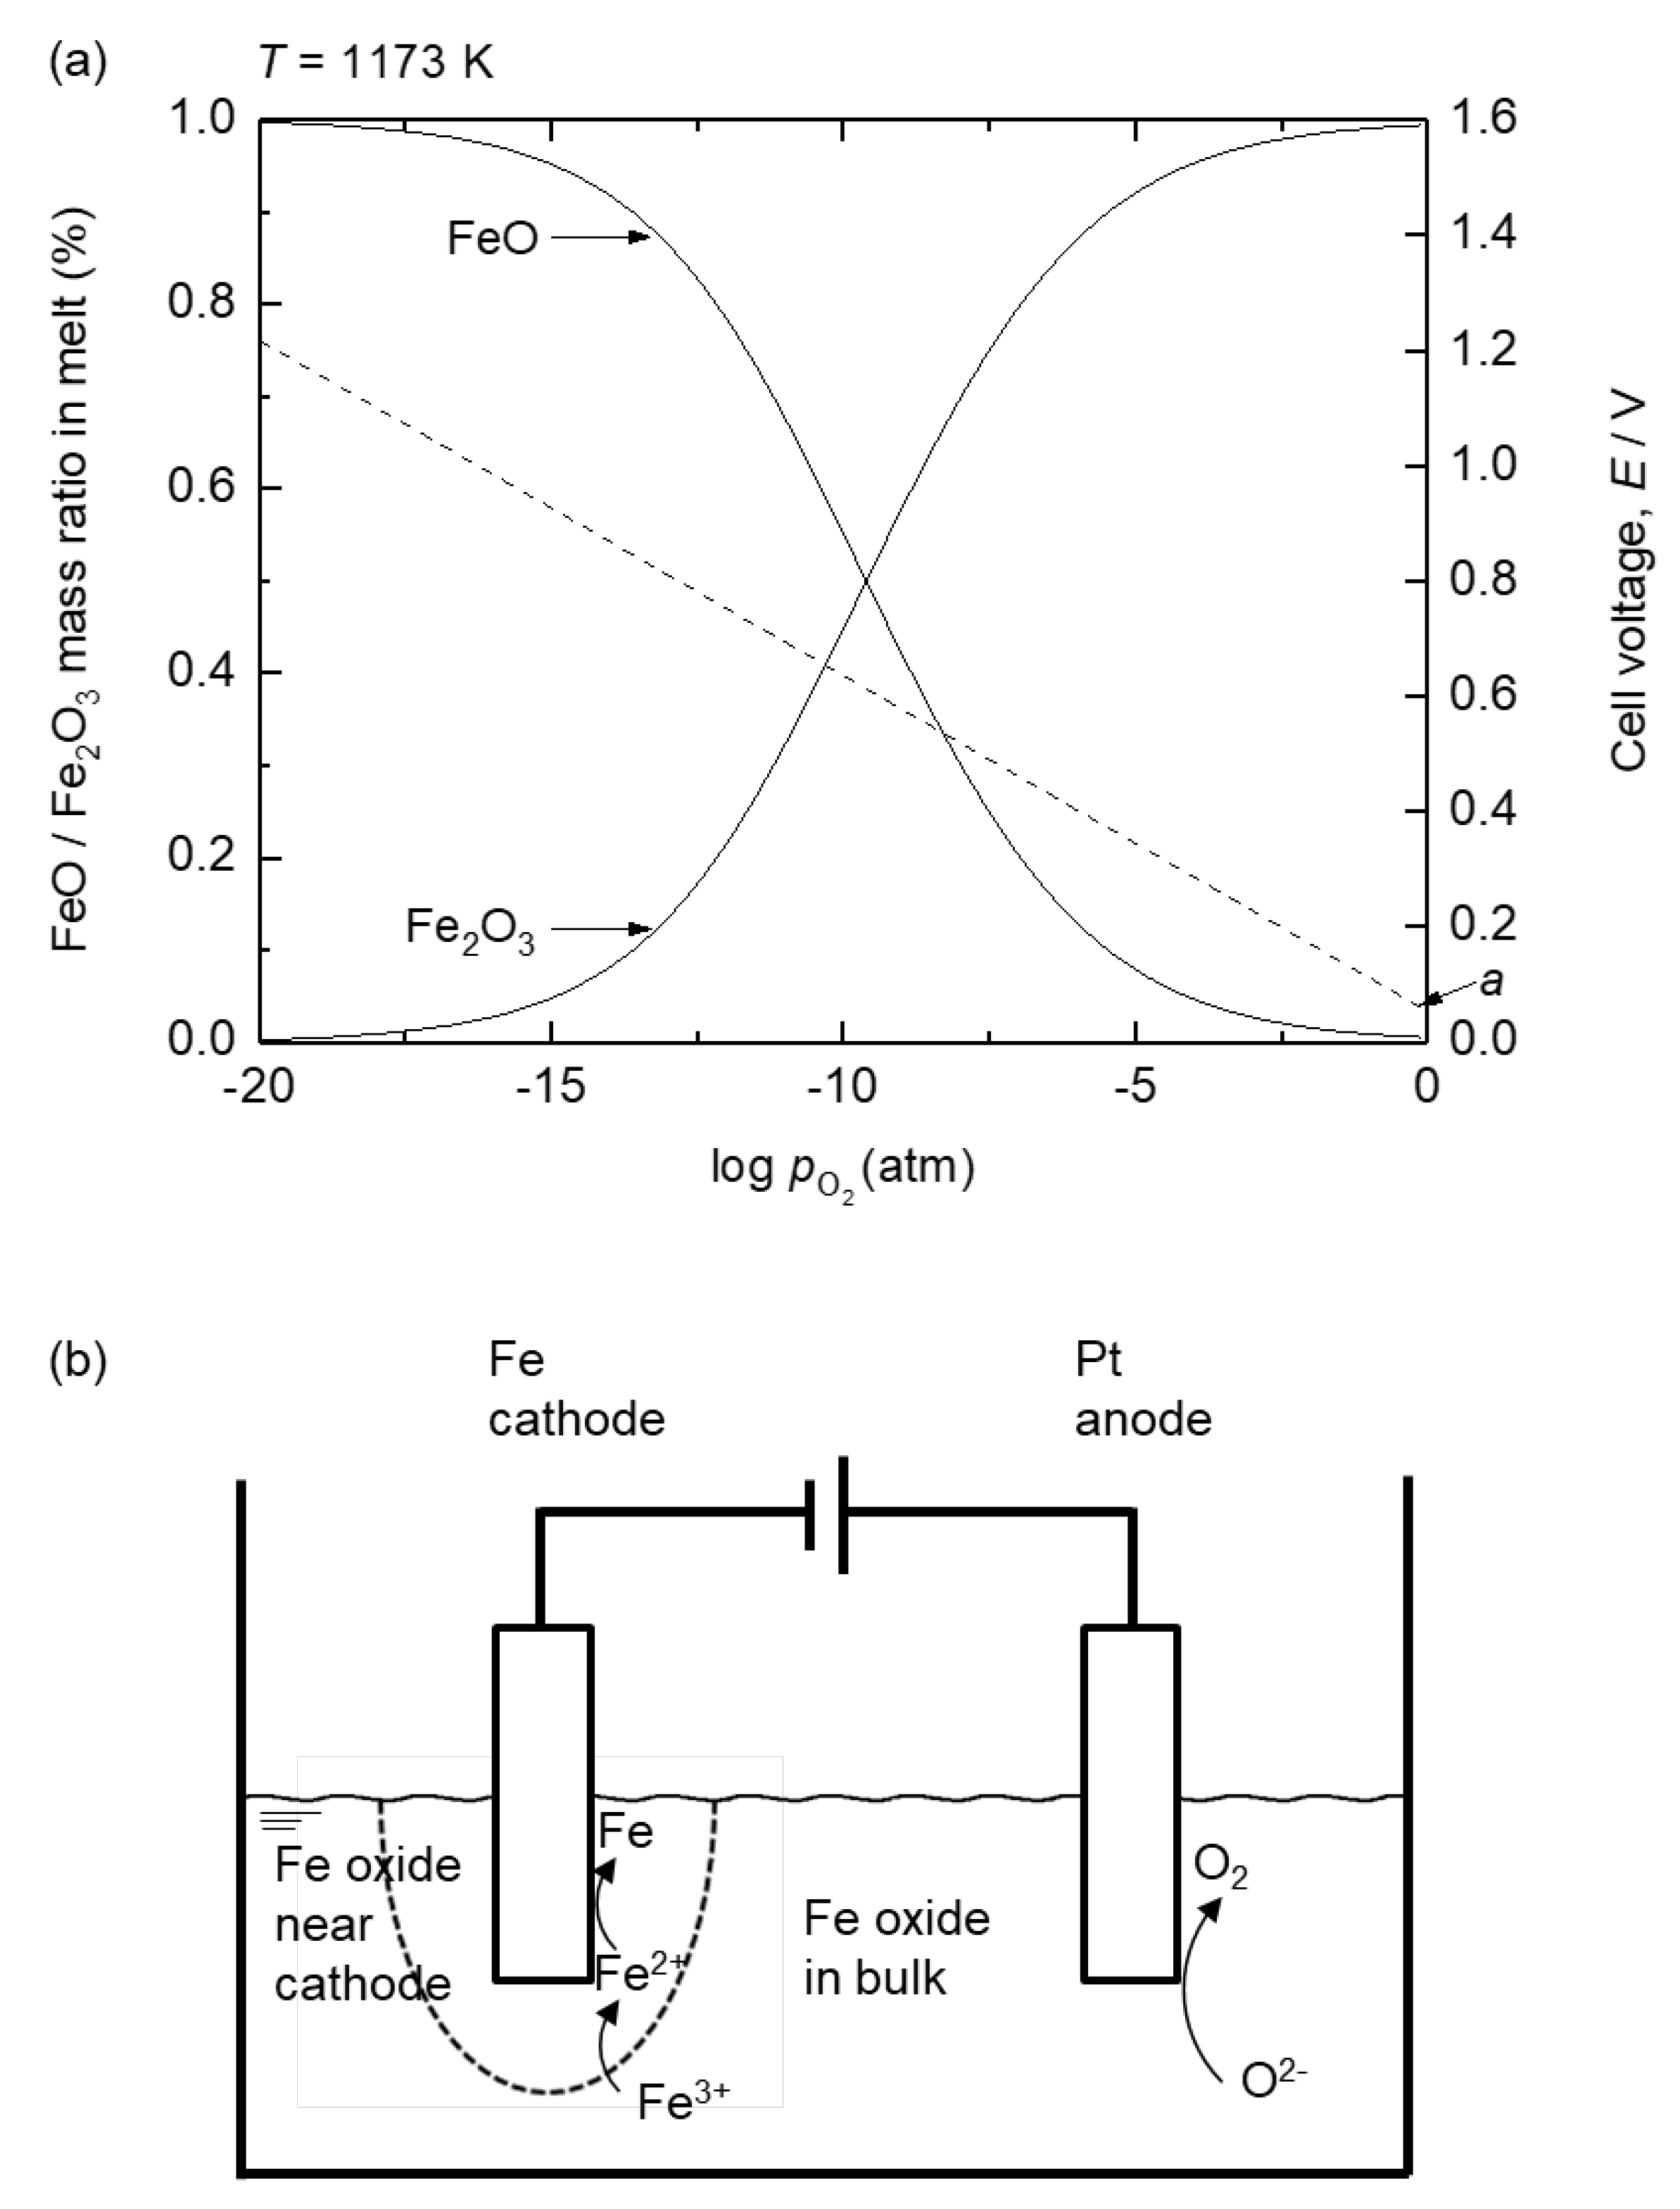
Figure 7.
Decomposition voltages of selected oxides as a function of ZnO concentration in mixed feedstock.
Figure 7.
Decomposition voltages of selected oxides as a function of ZnO concentration in mixed feedstock.
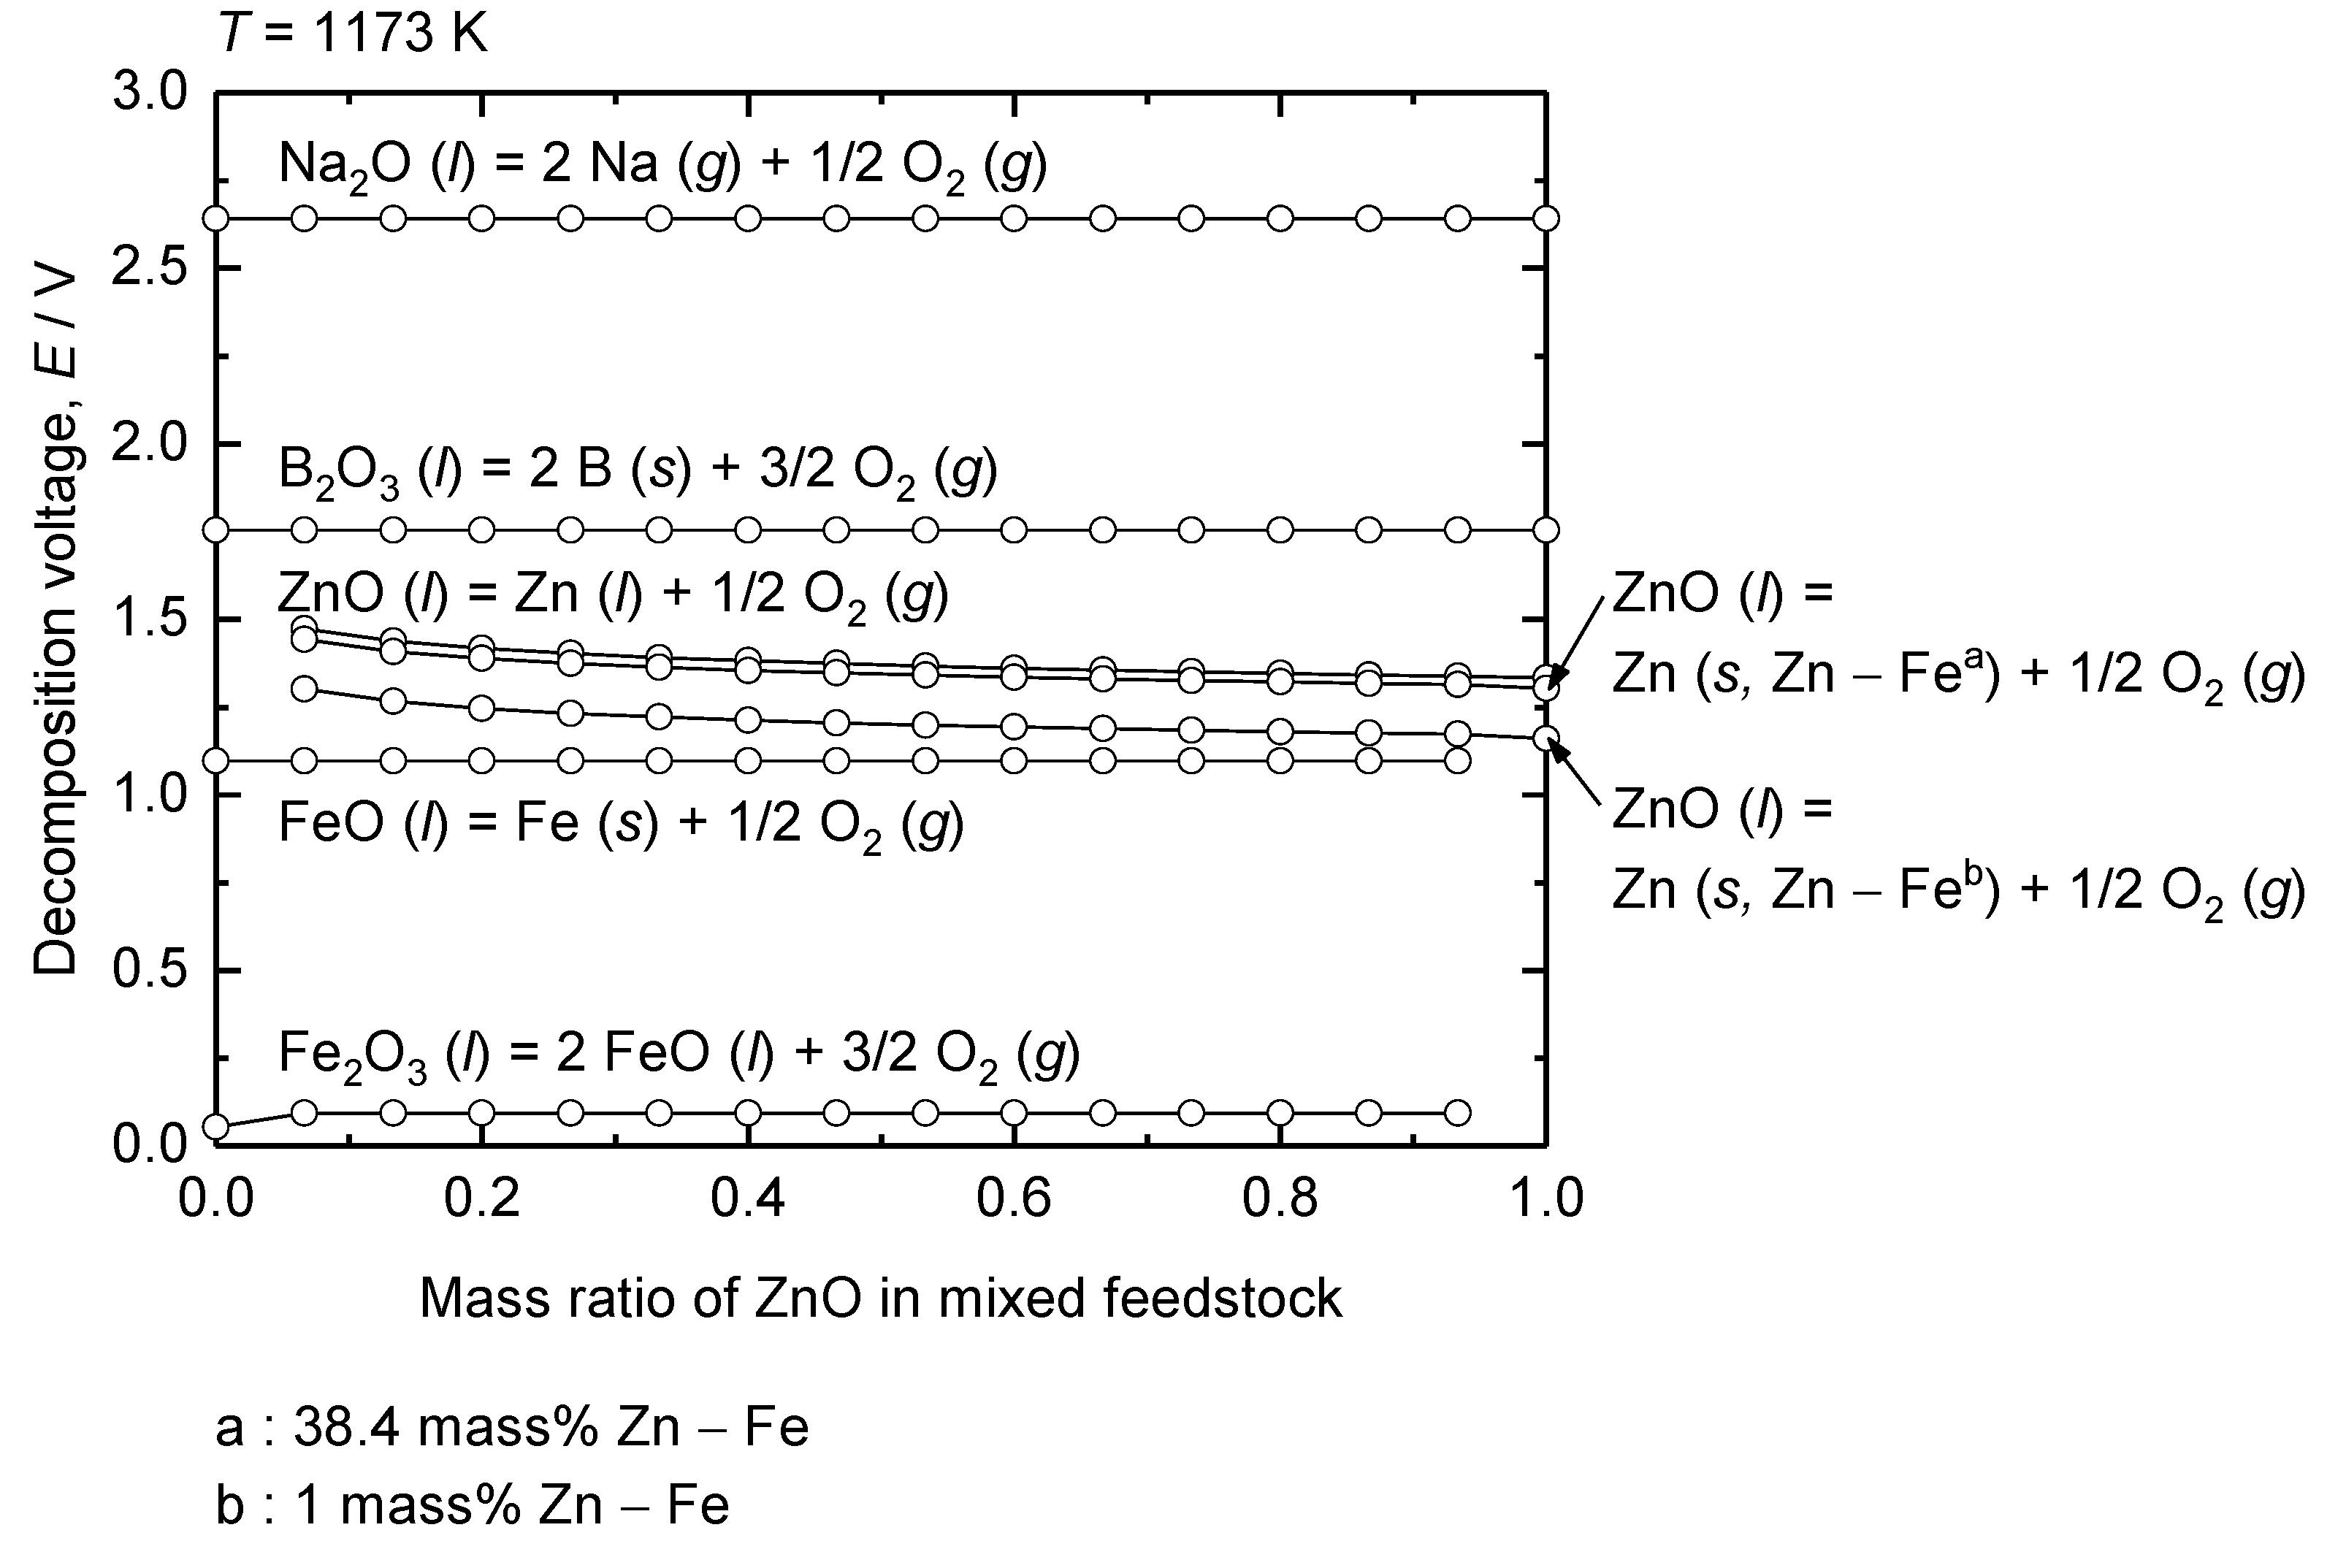
Figure 8.
Calculated binary phase diagram of Fe – Zn system at 1 atm total pressure. Dotted lines are isobaric vapor pressure of Zn (g).
Figure 8.
Calculated binary phase diagram of Fe – Zn system at 1 atm total pressure. Dotted lines are isobaric vapor pressure of Zn (g).
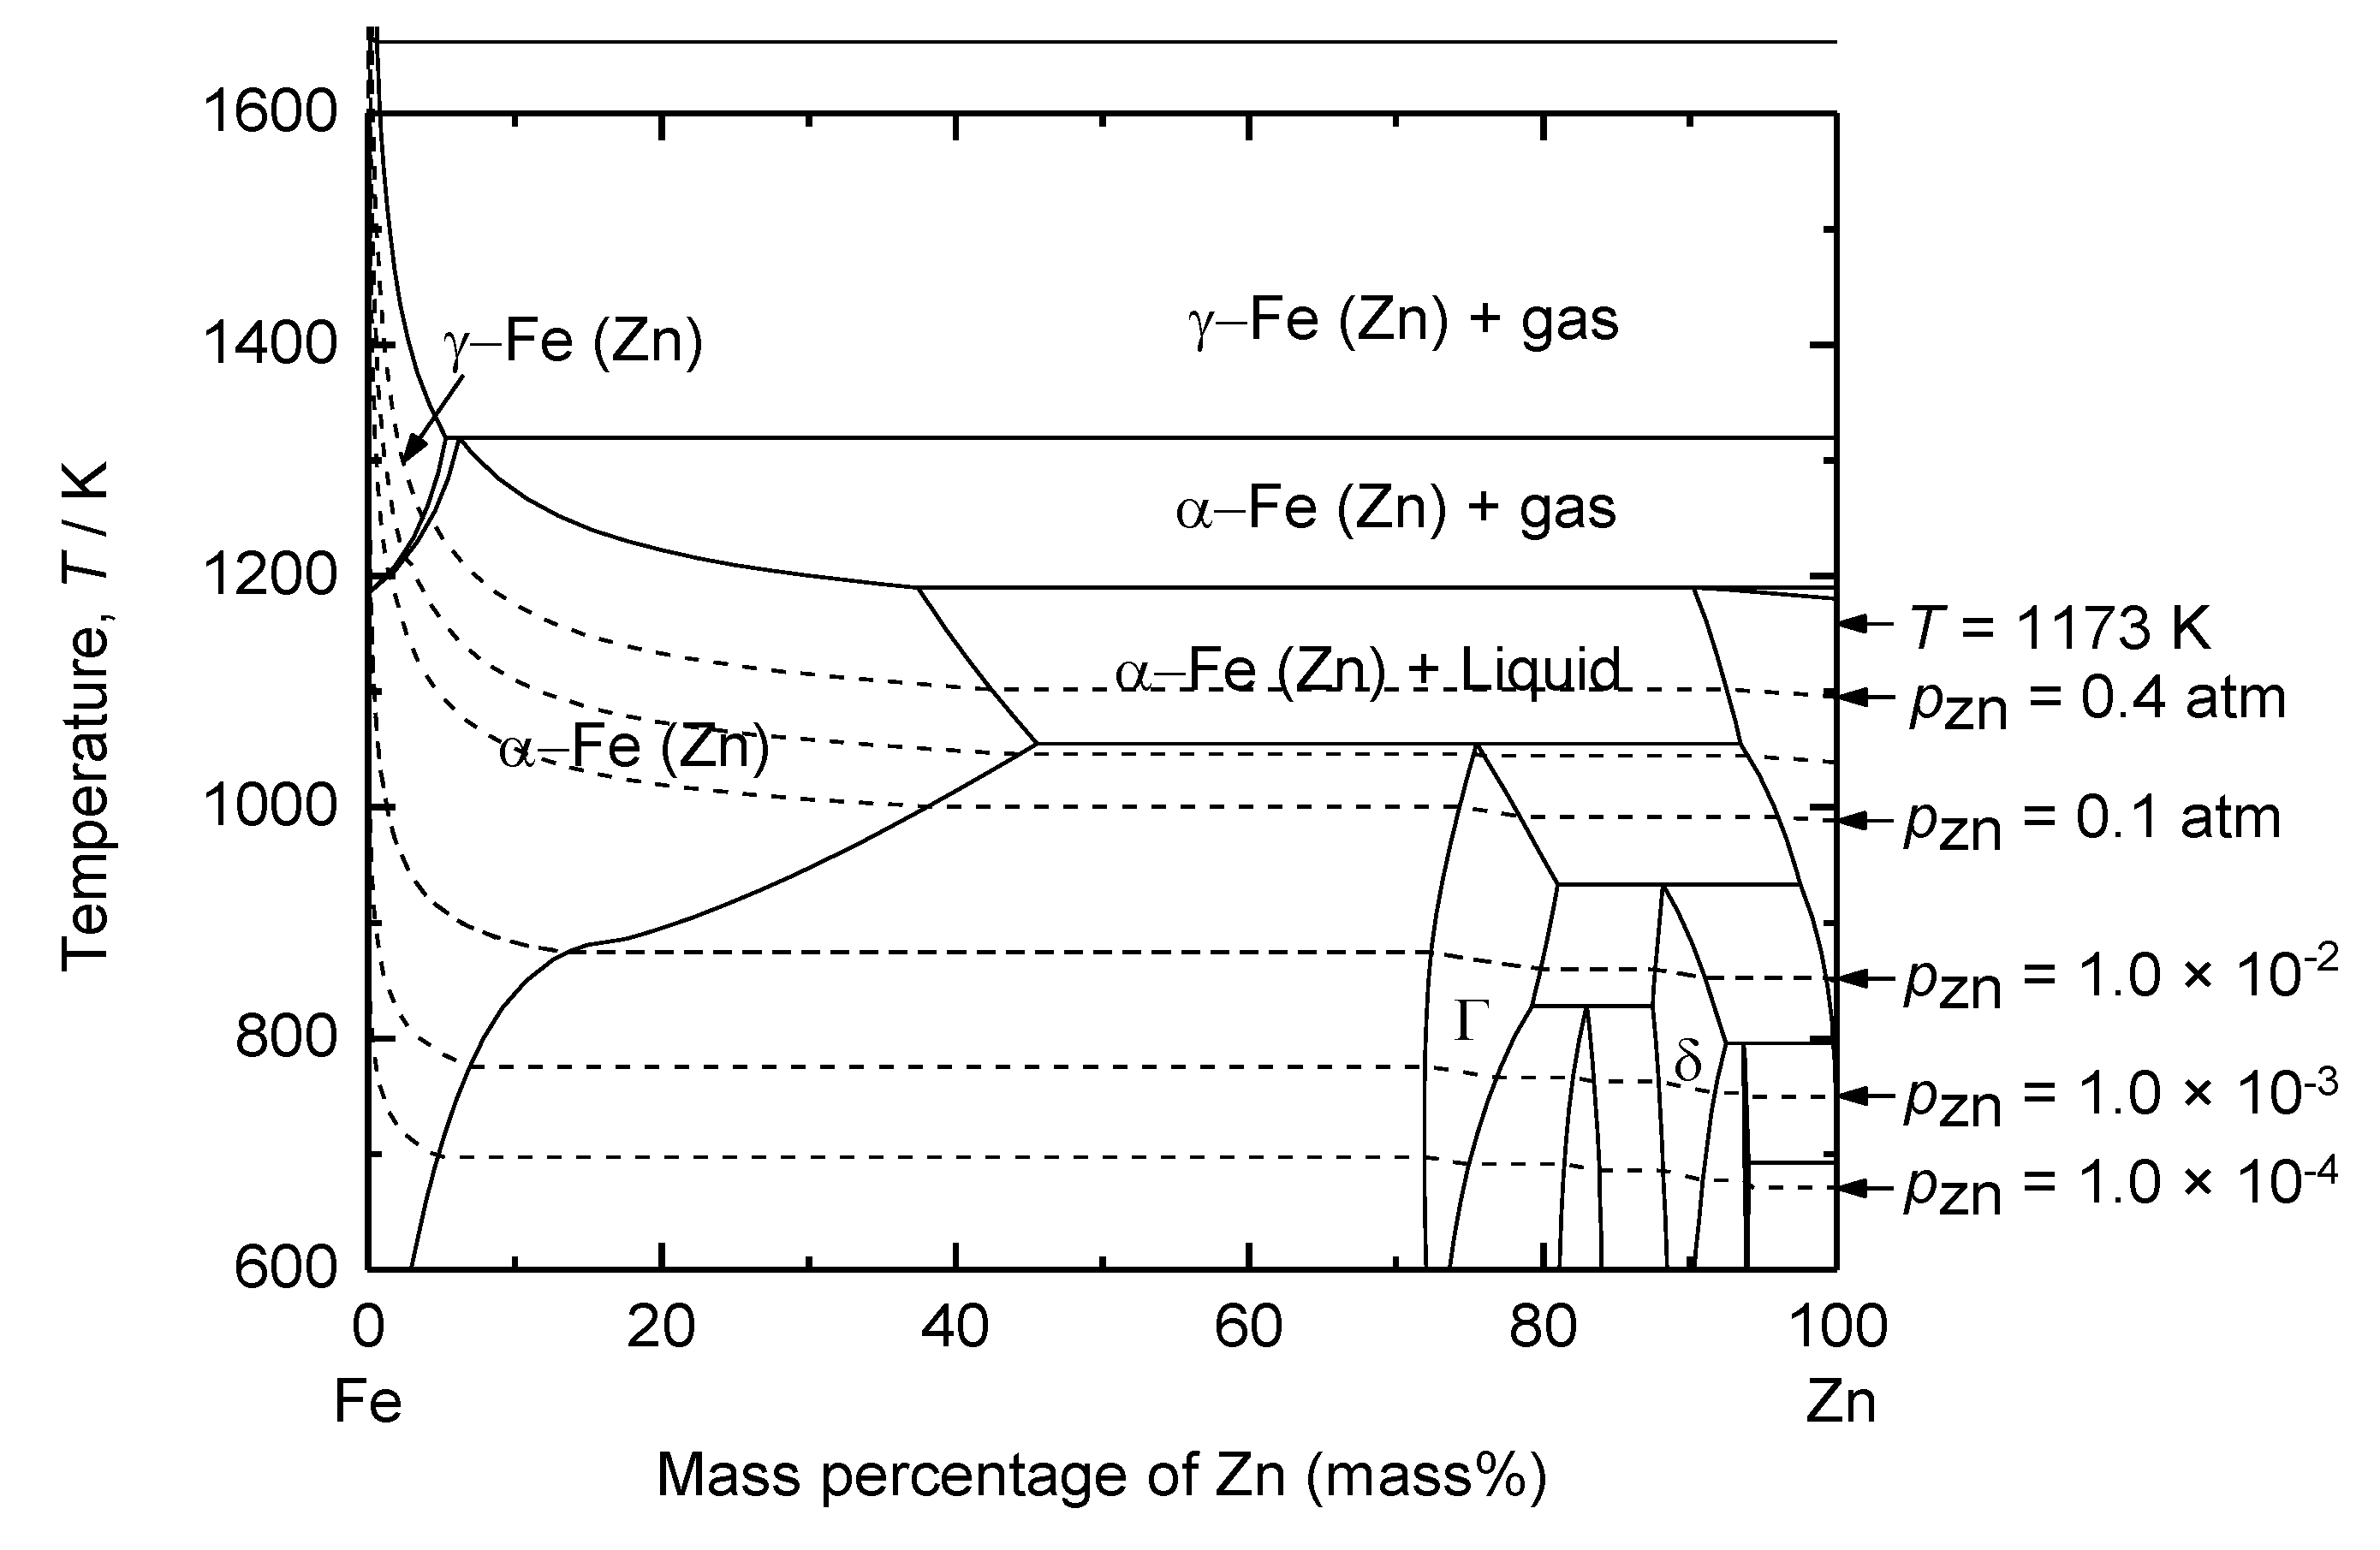
Figure 9.
Results of the CV measurements of (a) B2O3 – Na2O – Fe2O3 molten oxides and (b) B2O3 – Na2O – Fe2O3 – ZnO molten oxides at 1173 K with a scan rate of 0.03 V·s-1.
Figure 9.
Results of the CV measurements of (a) B2O3 – Na2O – Fe2O3 molten oxides and (b) B2O3 – Na2O – Fe2O3 – ZnO molten oxides at 1173 K with a scan rate of 0.03 V·s-1.
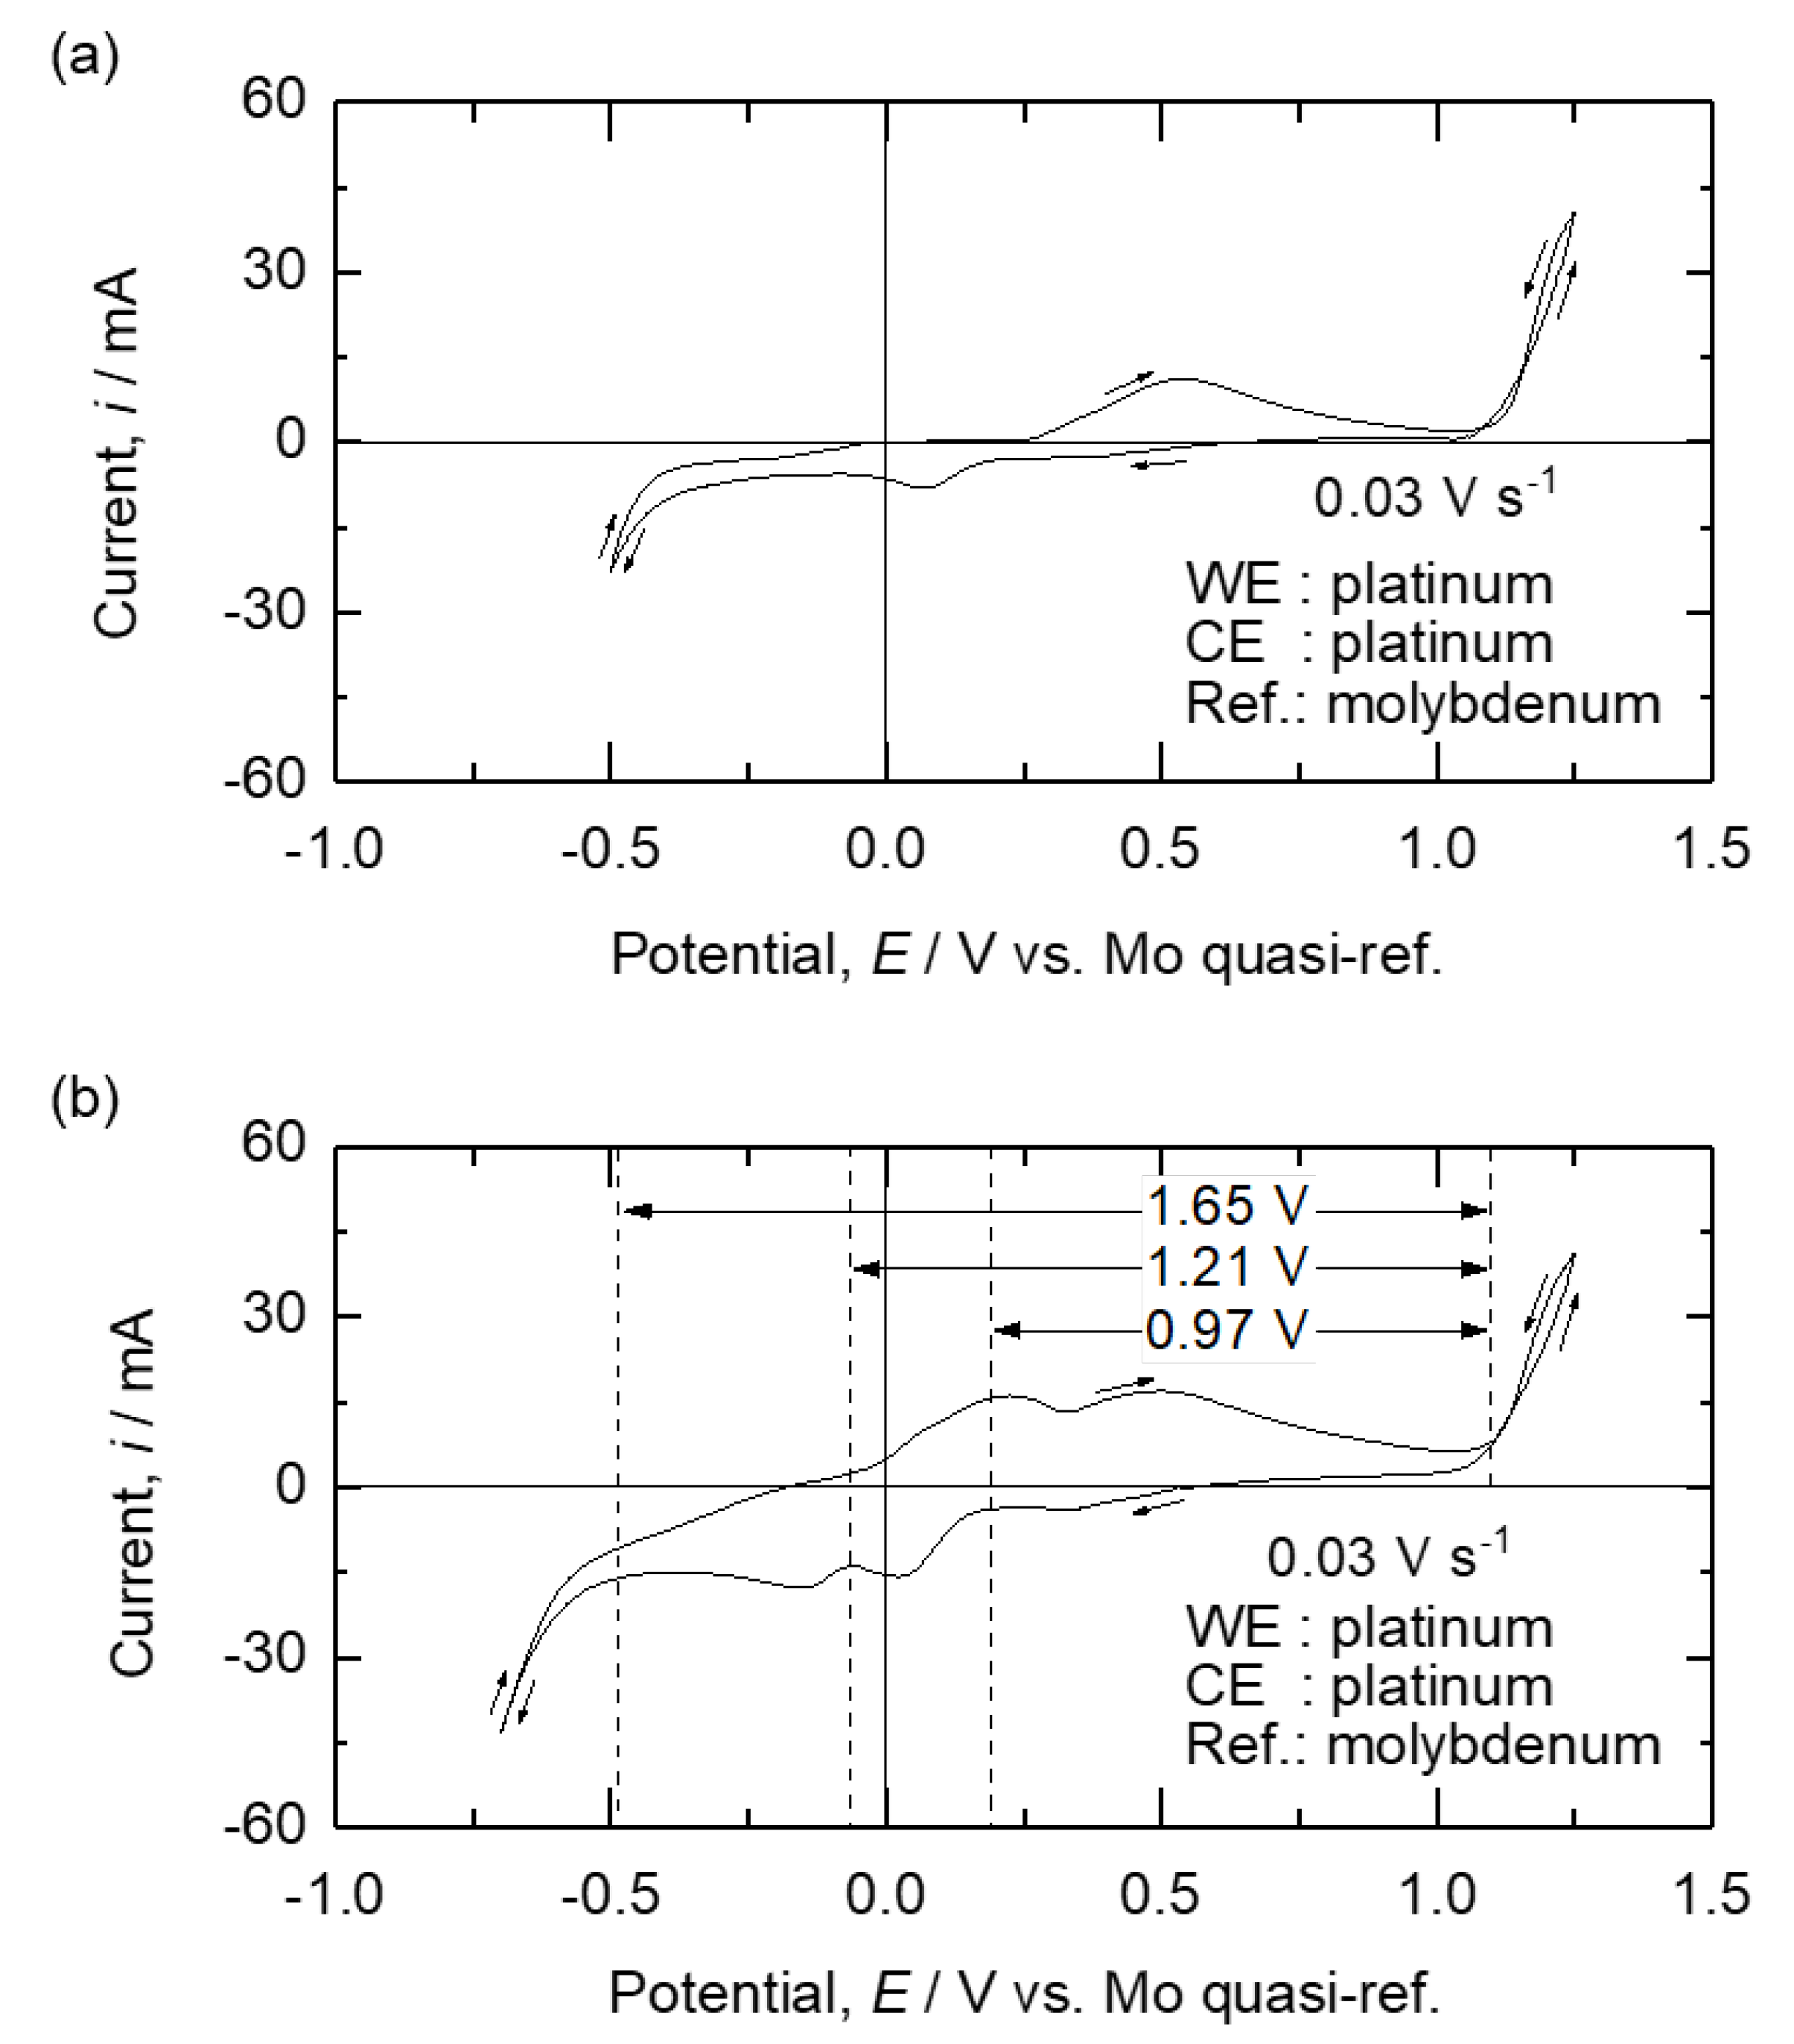
Figure 10.
SEM-EDS analysis results of the cathode surface (a) before electrolysis and after the electrolysis at 1173 K for 1 h with following conditions; (b) 1.1 V, 0.75 g of Fe2O3 + 2.25 g of ZnO (Exp. no. 1-3); (c) 1.6 V, 0.75 g of Fe2O3 + 2.25 g of ZnO (Exp. no. 2-3); (d) 1.1 V, 2.25 g of Fe2O3 + 0.75 g of ZnO (Exp. no. 1-1); (e) 1.1 V, 1.50 g of Fe2O3 + 1.50 g of ZnO (Exp. no. 1-2); and (f) 1.1 V, 0.75 g of Fe2O3 + 2.25 g of ZnO (Exp. no. 1-3).
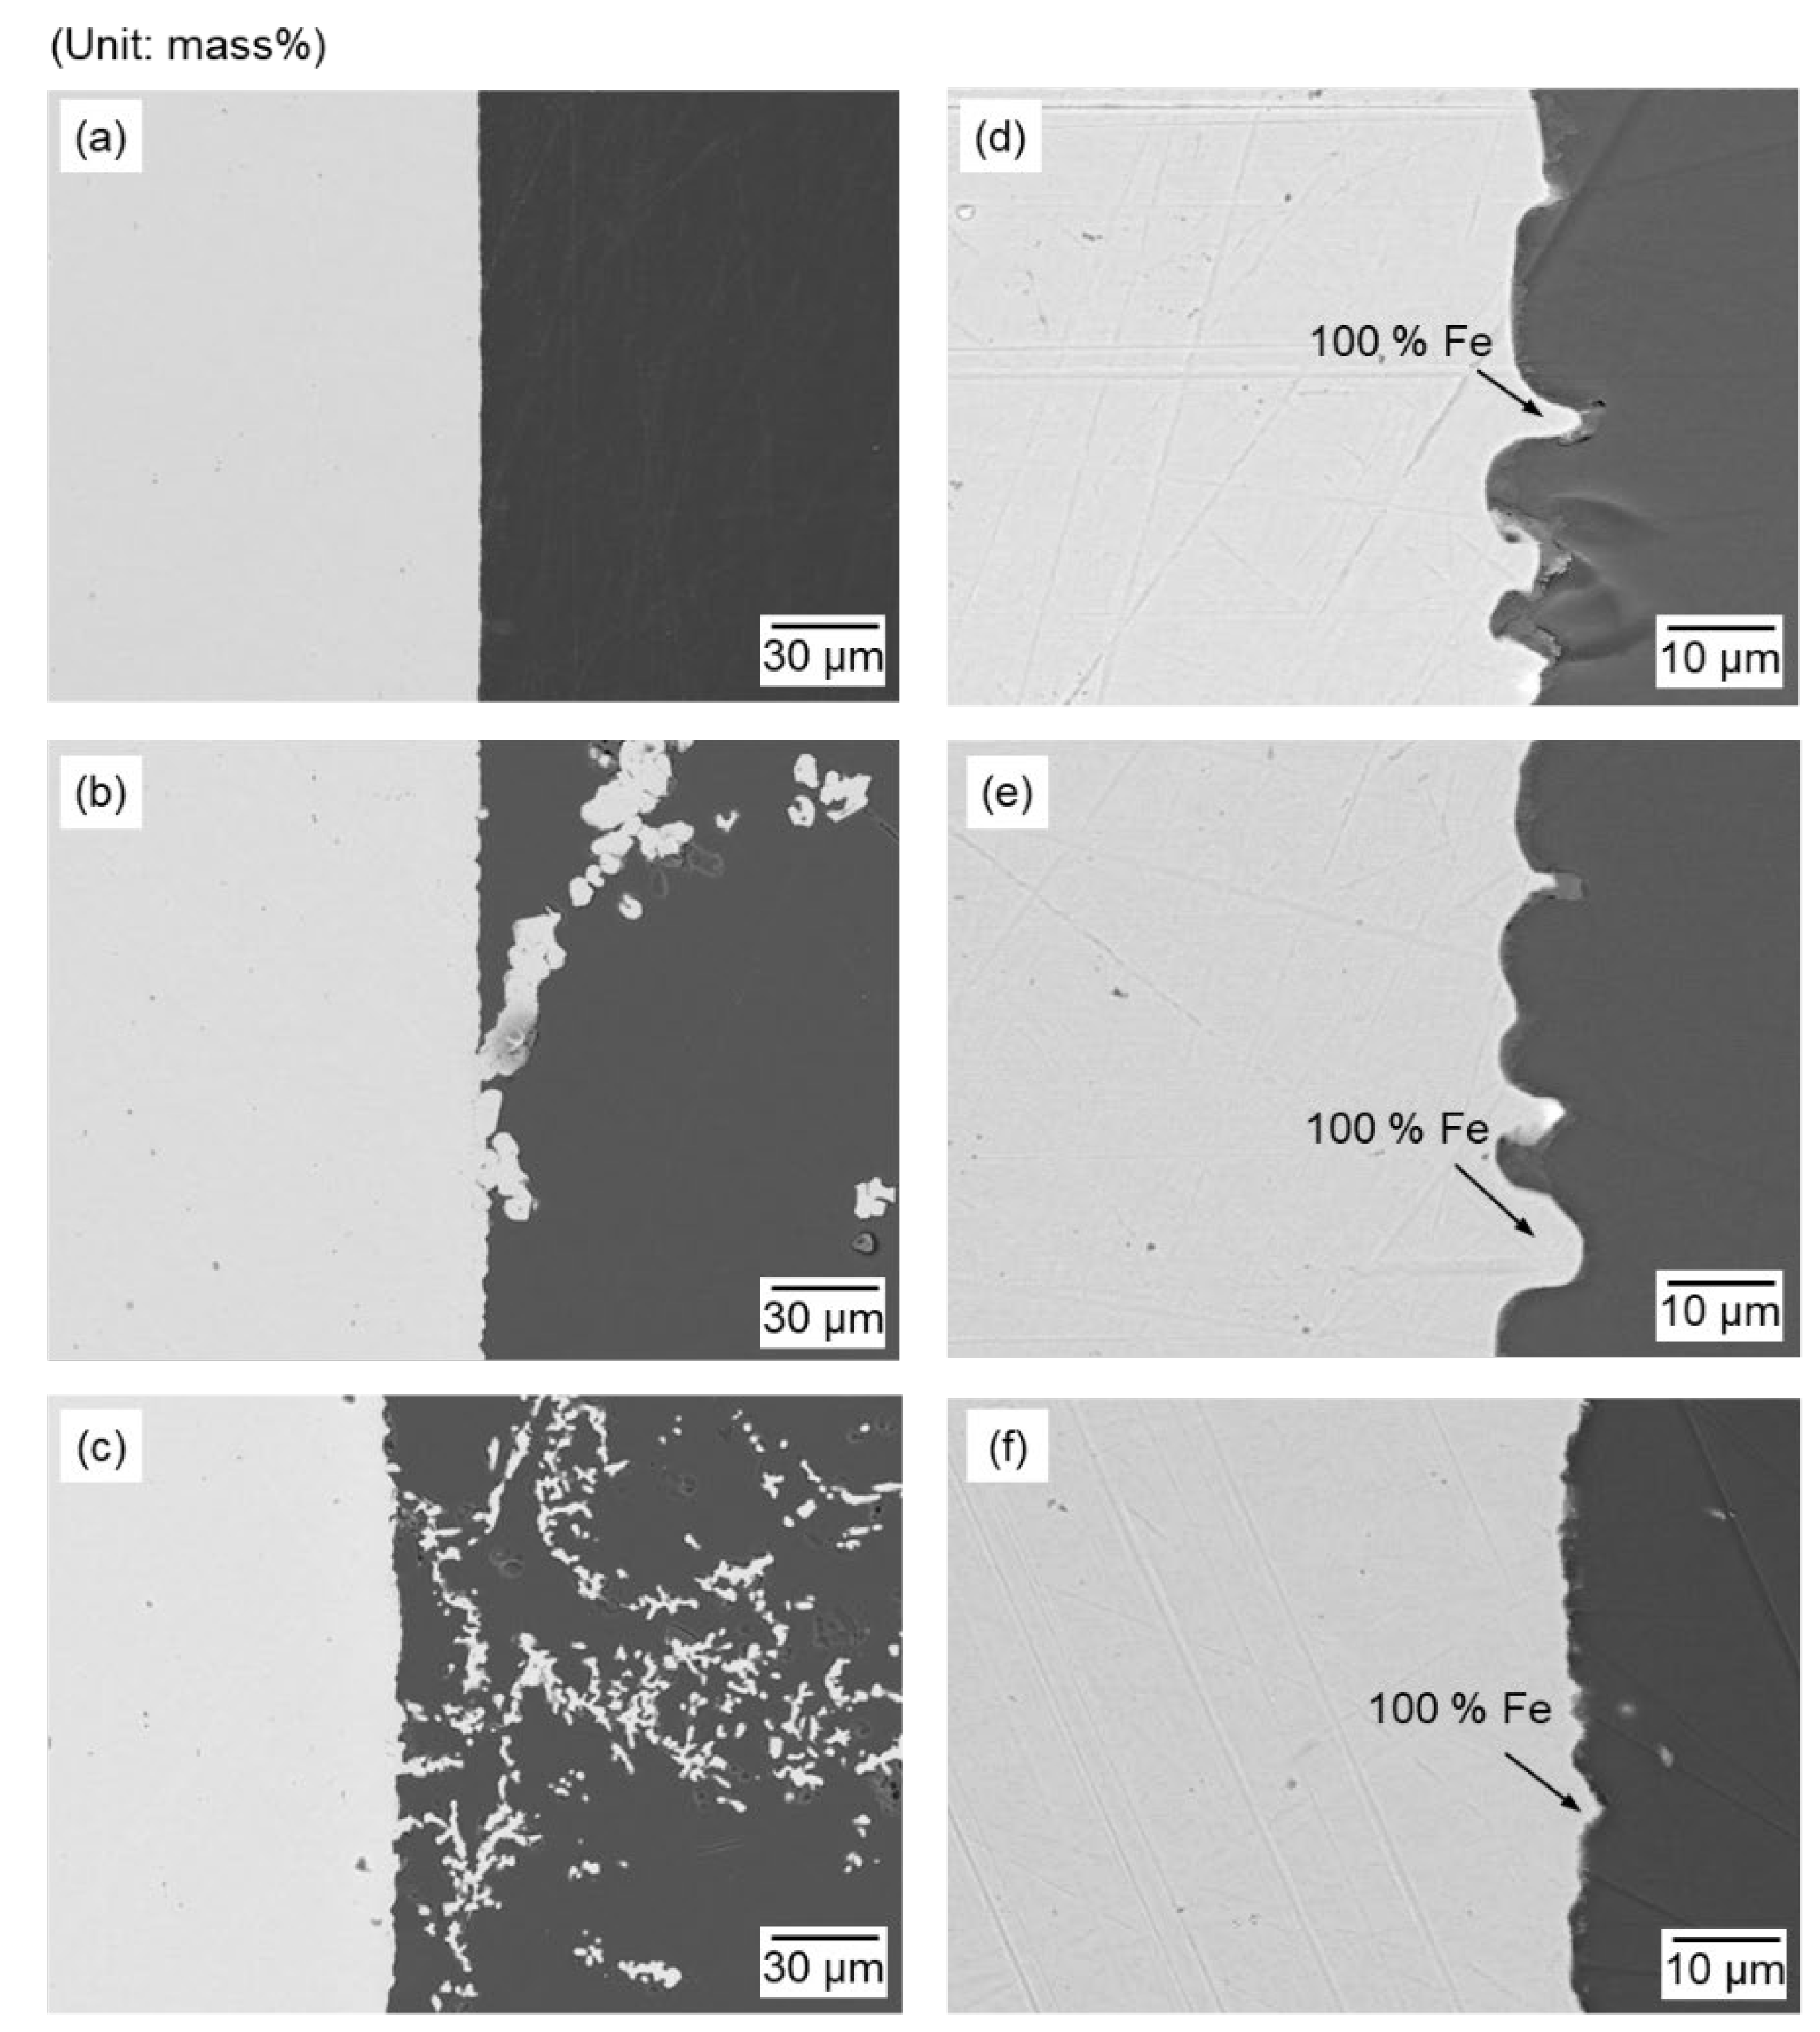
Figure 11.
SEM-EDS analysis results of the cathode after electrolysis of B2O3 – Na2O – ZnO at 1173 K by applying cell voltage of 1.6 V for (a) 1 h, (b) 2 h, and (c) 3 h and (d) EDS line analysis result of Zn concentration in Fe cathode as a function of distance from the electrode surface.
Figure 11.
SEM-EDS analysis results of the cathode after electrolysis of B2O3 – Na2O – ZnO at 1173 K by applying cell voltage of 1.6 V for (a) 1 h, (b) 2 h, and (c) 3 h and (d) EDS line analysis result of Zn concentration in Fe cathode as a function of distance from the electrode surface.
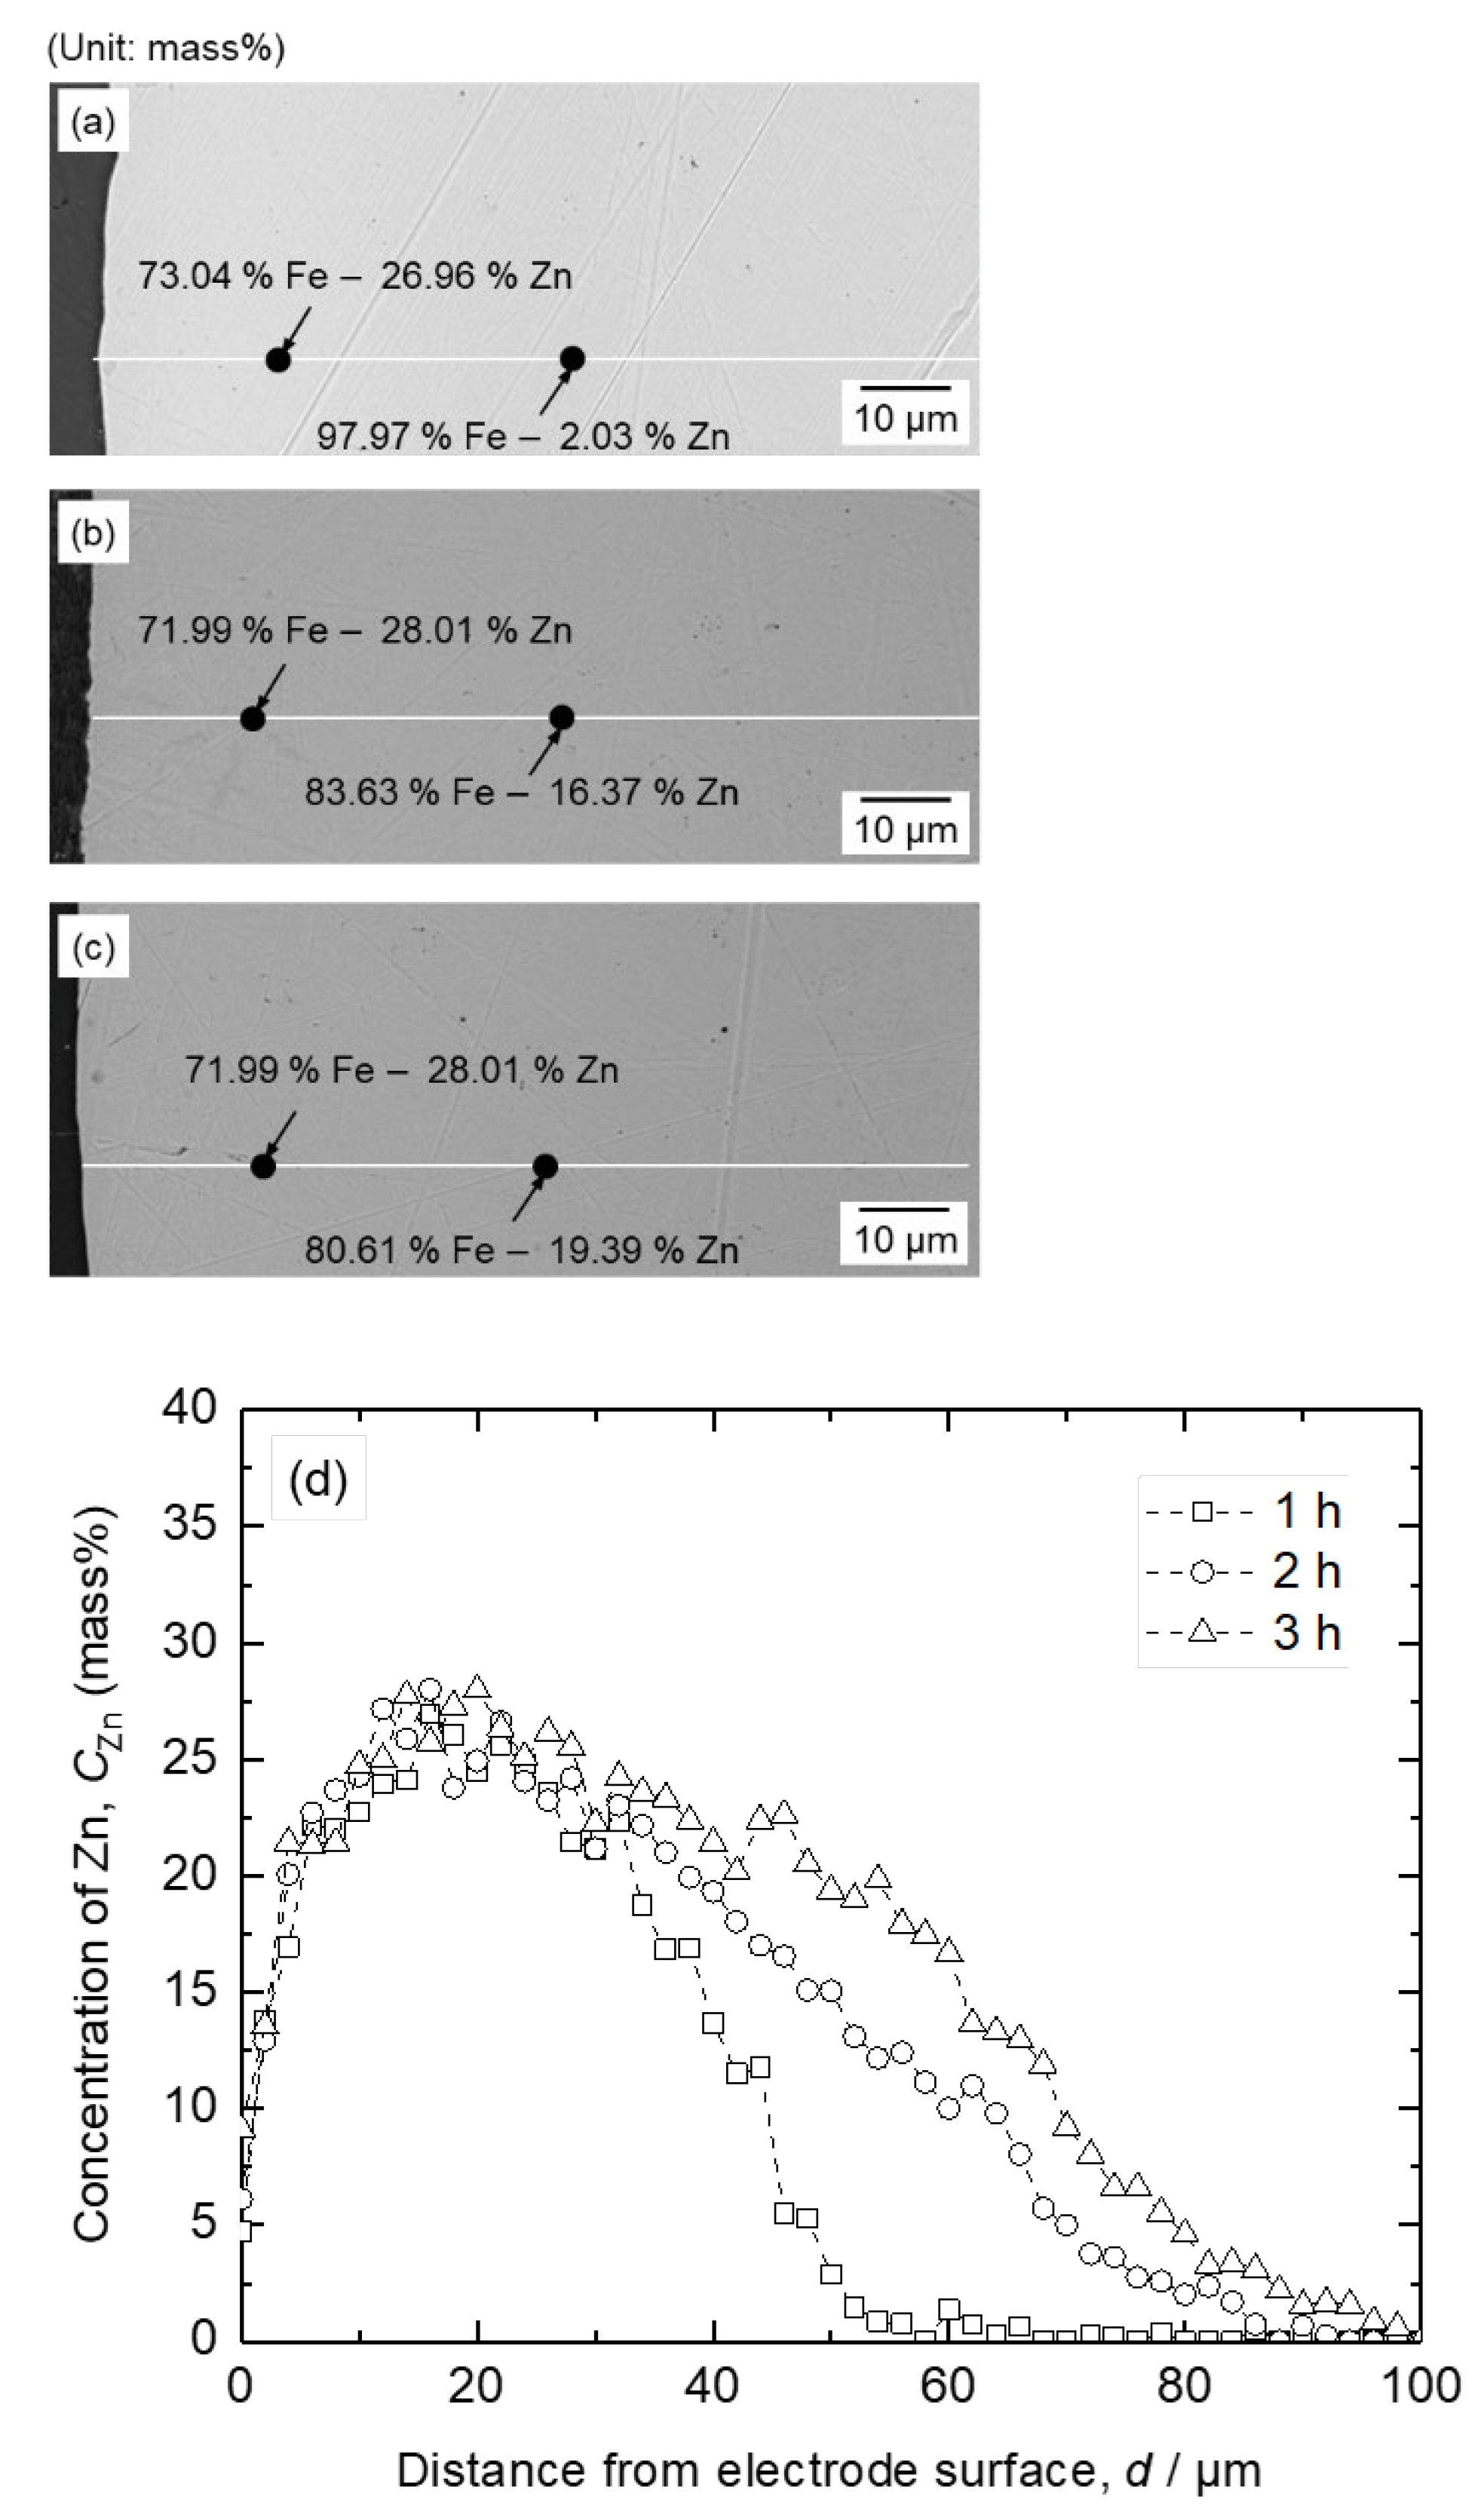
Figure 12.
SEM-EDS analysis results of the cathode after electrolysis of B2O3 – Na2O – Fe2O3 – ZnO at 1173 K for 1 h by applying cell voltage of 1.6 V in following feedstocks; (a) (a) 2.25 g of Fe2O3 + 0.75 g of ZnO (Exp. no. 2-1); (b) 1.50 g of Fe2O3 + 1.50 g of ZnO (Exp. no. 2-2); (c) 0.75 g of Fe2O3 + 2.25 g of ZnO (Exp. no. 2-3) and (d) EDS line analysis result of Zn concentration in Fe cathode as a function of distance from the electrode surface.
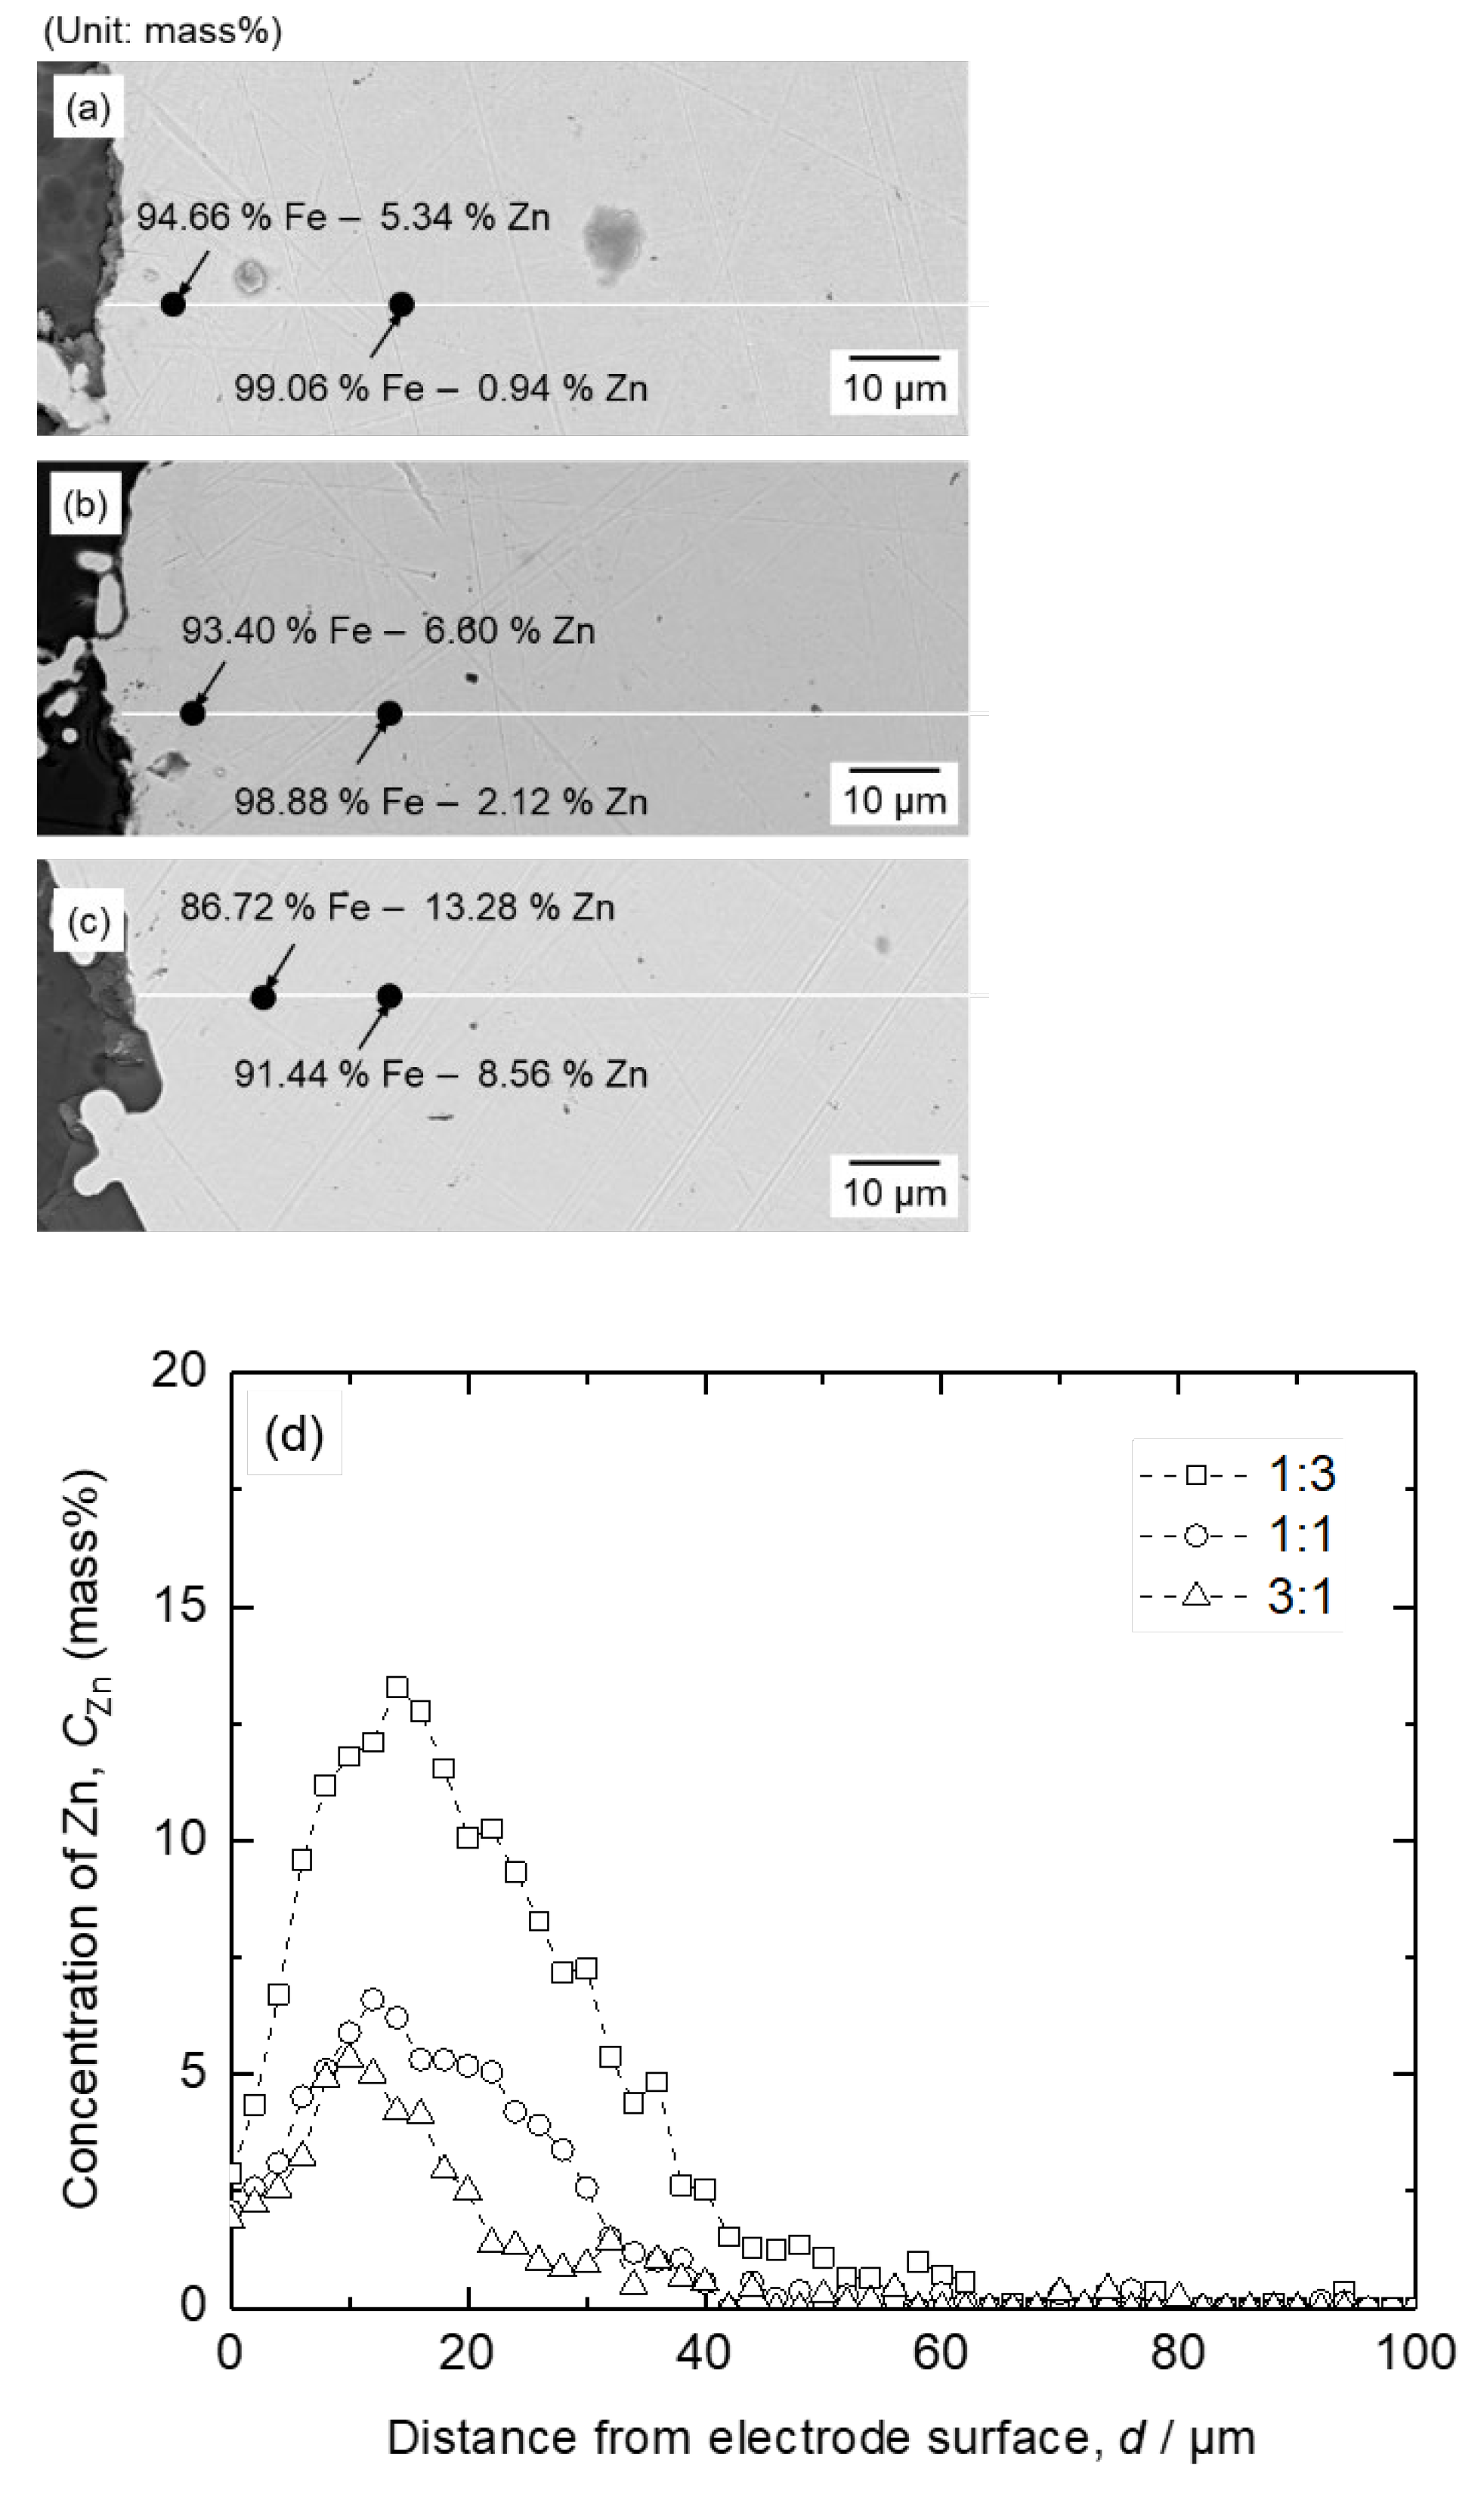
Figure 13.
XRD results of the (a) deposit obtained from the low-temperature part of the reactor and (b) residue at the bottom of the reactor after vacuum distillation of Fe – Zn alloy at 1200 K for 12 h.
Figure 13.
XRD results of the (a) deposit obtained from the low-temperature part of the reactor and (b) residue at the bottom of the reactor after vacuum distillation of Fe – Zn alloy at 1200 K for 12 h.
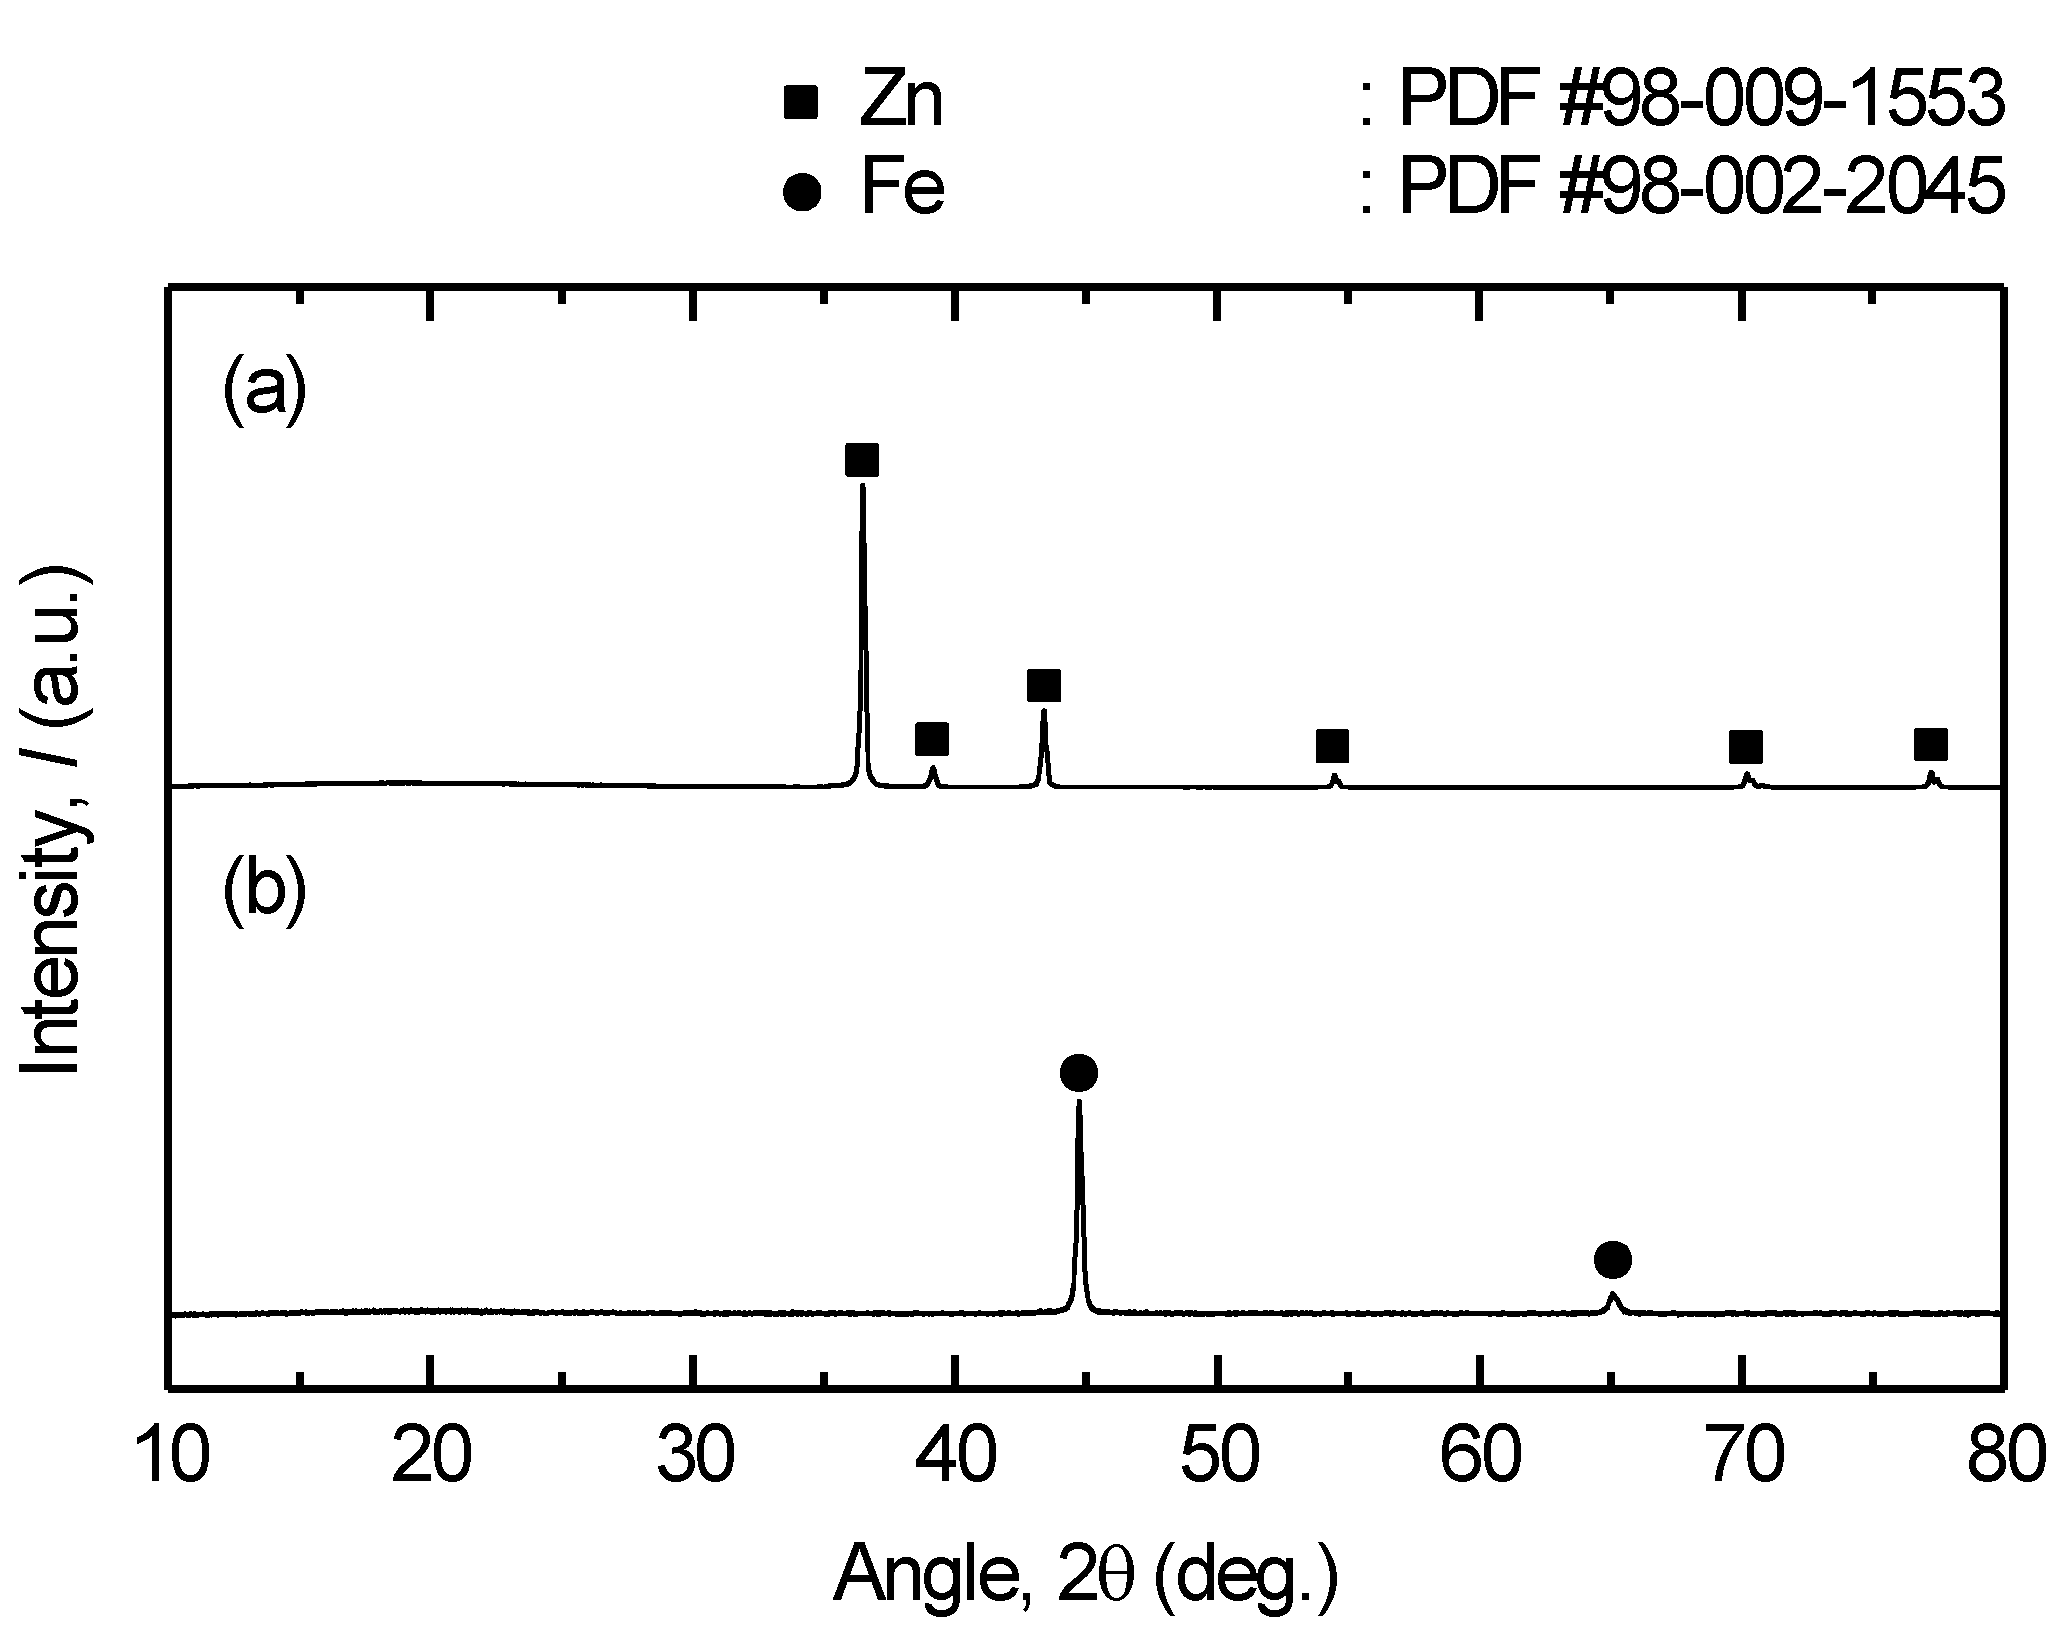
Figure 14.
Zn recovery efficiency obtained after vacuum distillation of Fe – Zn alloy at 1000 K and 1200 K for 1 – 12 h.
Figure 14.
Zn recovery efficiency obtained after vacuum distillation of Fe – Zn alloy at 1000 K and 1200 K for 1 – 12 h.
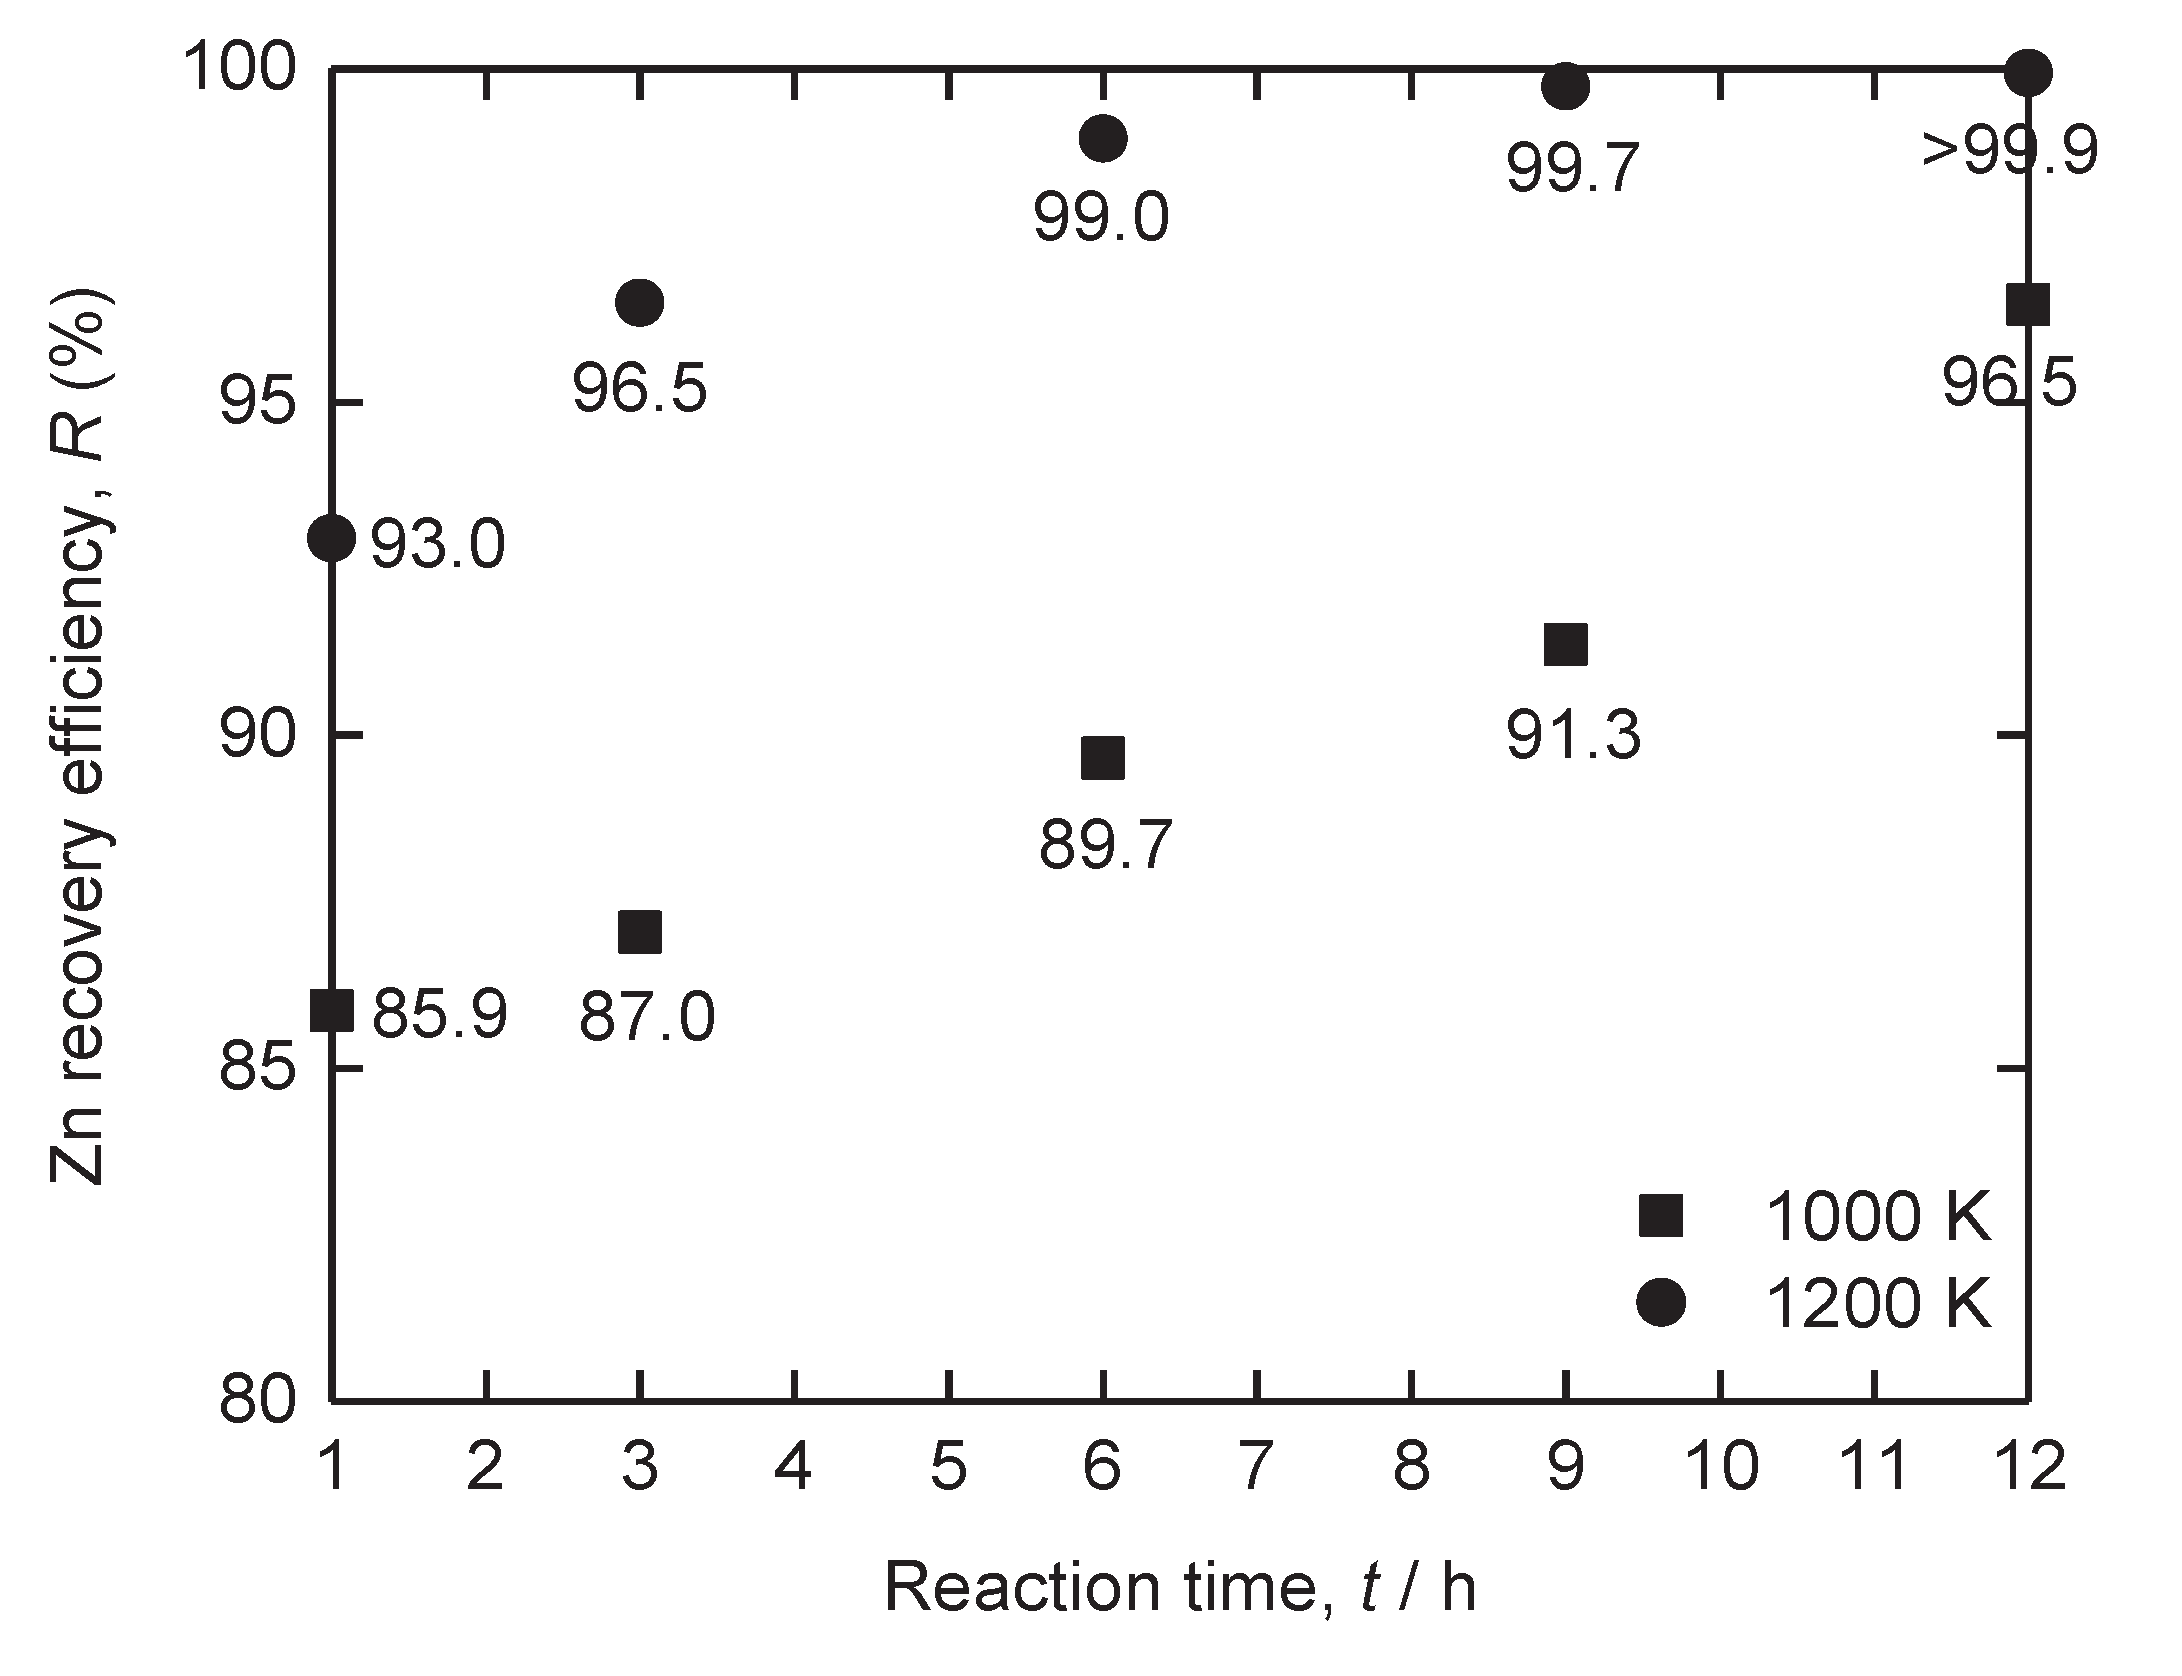

Table 1.
Previous studies on electrolysis of Fe oxide feedstock in various electrolytes.
| Method | Electrolyte | Feedstock | Temp,T / K | Electrode for electrolysis | Cathode product | Cell voltage,E / V | Faradic efficiency,(%) | Ref. | ||
|---|---|---|---|---|---|---|---|---|---|---|
| Type | FeOx conc.(mass%) | Cathode | Anode | |||||||
| Molten oxide electrolysis |
Al2O3 – CaO – MgO | Fe3O4 | 10 | 1838 | Mo | Cr90Fe10 | Fe | 3.8 | 34 | [5] |
| Al2O3 – CaO – MgO – SiO2 | Fe2O3 | 10 | 1873 | Mo | Graphite | Fe | 2 | 32 | [6] | |
| Al2O3 – MgO – SiO2 | Fe3O4 | 15 | 1823 | Pt – Rh | Pt | Fe | 3 | 36 | [7] | |
| Al2O3 – CaO – SiO2 | Fe2O3 | 5 | 1773 – 1873 | Mo | Graphite | Fe | – | 64 – 83 | [8] | |
| Al2O3 – CaO – MgO – SiO2 | Fe2O3 | 9.1 | 1823 | Mo | Ir | Fe | 2 | 25a | [9] | |
| Al2O3 – CaO – MgO – SiO2 | Fe2O3 | 5 | 1848 | Mo | Ir | Fe | – | – | [10] | |
| B2O3 – Na2O | Fe2O3 | 5 | 1273 | Pt | Pt | Fe | 1.4 | 33.2 | [11] | |
| K2MoO4 – Fe2O3 | Fe2O3 | – | 1273 | Steel | Steel | Fe – Mo | – | 70.77 | [12] | |
| Al2O3 – CaO – MgO – SiO2 | Fe2O3, NiO |
15 | 1723 | W | Graphite | Fe – Ni | – | 46 | [13] | |
| Molten salt electrolysis |
CaCl2 – KF | Fe2O3 | 1.7 | 1100 | Fe | Fe3O4 | Fe | – | – | [14] |
| CaCl2 – CaF2 | Fe2O3 | 1.5 | 1163 | Fe | Fe3O4 | Fe | – | 92 | [15] | |
| NaCl – CaCl2 | Fe2O3b | – | 1073 | Fe2O3 | Graphite | Fe | 1.2 | 95.3 | [16] | |
| LiCl | Fe2O3b | – | 933 | Fe2O3 | Graphite | Fe | 0.97 | 97 | [17] | |
| CaCl2 | Fe2O3b | – | 1073 | Fe2O3 | Graphite | Fe | 1.8 | 90 | [18] | |
| NaCl – CaCl2 | ZnFe2O4b | – | 1073 | ZnFe2O4 | Graphite | Fec | 1.8 | – | [19] | |
| NaCl – KCl | Fe2O3, Al2O3b |
– | 1123 | Fe2O3 – Al2O3 |
Graphite | FeO – Al2O3 | 2.3 | – | [20] | |
| CaCl2 | Fe2O3, TiO2b |
– | 1223 | Fe2O3 – TiO2 |
Graphite | Fe – Ti | 3 | – | [21] | |
| CaCl2 | Fe2O3, Tb4O7b |
– | 1173 | Fe2O3 – Tb4O7 |
Graphite | Fe – Tb | 2.6 | 13.6 | [22] | |
| Molten carbonate electrolysis |
Na2CO3 – K2CO3 | Fe2O3b | – | 1023 | Fe2O3 | NiCuFe | Fe | 2 | 93.6 | [23] |
| Molten hydroxide electrolysis |
NaOH | Fe2O3b | – | 803 | Fe2O3 | Ni | Fe | 1.7 | 89 | [24] |
| NaOH | Fe2O3b | – | 773 | Fe2O3 | Ni Si Al | Fe | 1.7 | 30 | [25] | |
a: anodic current efficiency was reported. b: direct solid-state electrolysis using oxide cathode as feedstock. c: Zn volatilized.
Table 2.
Experimental conditions for the electrolysis of Fe2O3 and/or ZnO using Fe cathode and Pt anode at 1173 K.
Table 2.
Experimental conditions for the electrolysis of Fe2O3 and/or ZnO using Fe cathode and Pt anode at 1173 K.
| Exp.no.a | Weight of feed, wfeed / g | Mass ratio of oxide to feed, roxide / feed | Applied cell voltage,E / V | Time,t / h | ||
|---|---|---|---|---|---|---|
| Fe2O3 | ZnO | Fe2O3 | ZnO | |||
| 1-1 | 2.25 | 0.75 | 0.75 | 0.25 | 1.10 | 1 |
| 1-2 | 1.50 | 1.50 | 0.50 | 0.50 | 1.10 | 1 |
| 1-3 | 0.75 | 2.25 | 0.25 | 0.75 | 1.10 | 1 |
| 2-1 | 2.25 | 0.75 | 0.75 | 0.25 | 1.60 | 1 |
| 2-2 | 1.50 | 1.50 | 0.50 | 0.50 | 1.60 | 1 |
| 2-3 | 0.75 | 2.25 | 0.25 | 0.75 | 1.60 | 1 |
| 3-1 | 0.00 | 3.00 | 0.00 | 1.00 | 1.60 | 1 |
| 3-2 | 0.00 | 3.00 | 0.00 | 1.00 | 1.60 | 2 |
| 3-3 | 0.00 | 3.00 | 0.00 | 1.00 | 1.60 | 3 |
a: Experimental conditions: 1) Weight of supporting electrolyte, w electrolyte = 97 g; 73 mass% B2O3 – 27 mass% Na2O.
Table 3.
Theoretical decomposition voltages of selected oxides at 1173 K, 1273 K and 1373 K.
| Reaction | Decomposition voltage, Eo / V | Phase transformation | ||
|---|---|---|---|---|
| 1173 K | 1273 | 1373 K | ||
| FeO (s) = Fe (s) + 1/2 O2 (g) | 0.98 | 0.94 | 0.91 | Fe (BCC) → Fe (FCC) at 1184.81 K |
| ZnO (s) = Zn (l,g) + 1/2 O2 (g) | 1.19 | 1.09 | 0.98 | Zn (l) → Zn (g) at 1181.47 K |
| B2O3 (l) = 2 B (s) + 3/2 O2 (g) | 1.70 | 1.66 | 1.62 | – |
| Na2O (s) = 2 Na (g) + 1/2 O2 (g) | 1.33 | 1.18 | 1.03 | Na2O (β) → Na2O (α) at 1243 K |
| Fe2O3 (s) = 2 Fe (s) + 3/2 O2 (g) | 0.90 | 0.86 | 0.81 | Fe (BCC) → Fe (FCC) at 1184.81 K |
| Fe3O4 (s) = 3 Fe (s) + 2 O2 (g) | 0.96 | 0.92 | 0.88 | Fe (BCC) → Fe (FCC) at 1184.81 K |
| Fe2O3 (s) = 2 FeO (s) + 1/2 O2 (g) | 0.74 | 0.68 | 0.62 | – |
Disclaimer/Publisher’s Note: The statements, opinions and data contained in all publications are solely those of the individual author(s) and contributor(s) and not of MDPI and/or the editor(s). MDPI and/or the editor(s) disclaim responsibility for any injury to people or property resulting from any ideas, methods, instructions or products referred to in the content. |
© 2025 by the authors. Licensee MDPI, Basel, Switzerland. This article is an open access article distributed under the terms and conditions of the Creative Commons Attribution (CC BY) license (http://creativecommons.org/licenses/by/4.0/).
Copyright: This open access article is published under a Creative Commons CC BY 4.0 license, which permit the free download, distribution, and reuse, provided that the author and preprint are cited in any reuse.


