
Submitted:
29 July 2025
Posted:
30 July 2025
You are already at the latest version
Abstract
Wearable sensors are a promising tool to quantify physical activity, with step count serving as one of the most intuitive measures. However, significant gait alterations in individuals with neurological conditions limit the accuracy of step-counting algorithms trained on able-bodied individuals. Therefore, this study investigates the accuracy of step-counting during activities of daily living (ADL) in a neurological population. Seven individuals with neurological conditions wore seven accelerometers while performing ADL for 30 minutes. Step events manually annotated from video served as ground truth. An optimal sensing and analysis configuration for machine learning algorithm development (sensor location, filter range, window length, and regressor type) was identified and compared to existing algorithms developed for able-bodied individuals. The most accurate configuration includes a waist-worn sensor, a 0.5–3 Hz bandpass filter, a 5-second window, and gradient boosting regression. The corresponding algorithm showed a significantly lower error rate compared to existing algorithms trained on able-bodied data. Notably, all algorithms undercounted steps. This study identified an optimal sensing and analysis configuration for machine learning based step counting in a neurological population and highlights the limitations of applying able-bodied-trained algorithms. Future research should focus on developing accurate and robust step-counting algorithms tailored to individuals with neurological conditions.

Keywords:
accelerometer
; accuracy
; activities of daily living
; algorithm development
; inertial measurement unit
; machine learning
; neurological population
; population-specific algorithm
; step count
; validation
1. Introduction
The importance of physical activity (PA) for quality of life, morbidity, and mortality is well documented, not only in the general population but also among individuals living with neurological conditions [1,2,3]. However, individuals with neurological conditions are considerably less active than their healthy peers [3,4]. For example, stroke, the leading reason for neurological rehabilitation and single biggest driver of years of life lived with disability [5], is associated with markedly low PA levels. Stroke survivors accumulate only about half the number of daily steps compared to the general population [6,7,8,9,10]. This lack of PA is clinically relevant: It is a major lifestyle-related risk factor for stroke recurrence and a strong predictor of long-term disability, while reaching adequate PA levels after stroke is associated with substantial reductions in serious adverse events [11,12,13].
Wearable motion sensors have become the preferred method for objectively tracking PA, overcoming the recall bias and social desirability effects that limit self-reported questionnaires [14,15,16]. Modern wearable devices for remote monitoring typically incorporate a triaxial accelerometer, often combined with a gyroscope, and are commonly worn on the wrist, waist, chest, thigh, ankle, or lower back [17,18,19,20,21,22,23]. From the raw sensor signal, researchers derive a wide range of PA outcomes, including time spent at different intensity levels, energy expenditure, step count, activity recognition, and activity counts [17,18,21,22,24,25].
From a therapeutic perspective, step count is a particularly valuable outcome because it provides a tangible, meaningful, and easily interpretable metric representing a fundamental unit of human activity that is widely used [8,22,26,27,28]. Step count is seen among the top outcomes for assessing PA frequency/volume by researchers and clinicians [24]. An accurate step counter could be used to monitor a patient’s progress over time – detecting both improvements and deteriorations – and to identify patients in need of a PA intervention. Furthermore, individualized real-time feedback from step counters could be a fundamental part of the PA intervention itself [29,30]. However, the gait patterns commonly observed in neurological populations – characterized by slow walking speeds, short stride lengths, brief and irregular walking bouts, asymmetric walking, compensatory upper body movements, and the use of walking aids – differ substantially from those of able-bodied populations, for which most available step-counting algorithms are designed [31,32,33,34]. For this reason, there is a need to evaluate how can we accurately count steps with wearable sensors during activities of daily living (ADL) in individuals with neurological conditions [22].
The primary aim of the present study is to determine the optimal sensing and analysis configuration for a neurological population-specific machine learning algorithm to count steps during ADL. The secondary aim is to compare the accuracy of such an algorithm with algorithms trained on able-bodied data. The focus on ADL separates the present study from the vast majority of studies investigating the accuracy of step counting in neurological populations during standardized clinical assessments such as the 2- or 6-minute walking test [35,36,37,38,39,40].
2. Materials and Methods
This experimental, cross-sectional study recruited inpatients from the Cereneo Neurorehabilitation Clinic in Hertenstein, Switzerland. The study was reviewed under the Swiss Federal Human Research Act and deemed not to require ethical approval due to its technical focus. All applicable ethical guidelines including the latest version of the declaration of Helsinki were followed [41].
2.1. Participants
Participants were recruited from the clinic’s inpatient population of neurologically impaired adults. For this purpose, a research assistant visited the patients to explain the study. Each patient was free to consent to the study; participation did not affect their treatment. Eligibility criteria included being at least 18 years old, the ability to understand written and oral study instructions, and having a Functional Ambulation Category score of ≥2 (walking ability with minimal physical assistance, able to support body weight independently). Medical staff approved participant enrolment. All participants provided informed consent prior to study inclusion, and data were pseudonymized to protect privacy.
2.2. Data Collection
Data collection took place between November 5 and December 18, 2024, at the clinic facility. The protocol of the present study was designed to capture short indoor walking bouts during typical ADL – varying in length, shape, and speed. Walking was performed under both single- and dual-task conditions (e.g., walking with a cup of coffee), including stair use when deemed safe by the therapist. Activities included the morning routine (e.g., getting dressed, brushing teeth), household tasks (e.g., carrying and fetching items, preparing food), and leisure activities (e.g., reading the newspaper, walking to the balcony, drinking coffee). The entire recording lasted approximately 30 minutes and was supervised by a trained therapist. To reflect ADL, the recorded activities were not standardized. Participants were free to perform them in their own way; only the order was prescribed.
Participants were video recorded (30 Hz) using a handheld Galaxy S23 Ultra (Samsung, Seoul, KOR) and wore seven triaxial inertial measurement units (AX6, Axivity, Newcastle, UK) recording at 100 Hz (±8g). Sensors were placed in accordance with previous research at the wrist (left and right, worn with bracelet), chest (medial, taped, between the shoulder blades), lower back (medial, taped, at the level of thoracic vertebra 7), waist (left, clipped to belt or trousers), thigh (left, taped, mid-thigh), and ankle (left, with bracelet, above the malleolus) [17,18,19,20,21,22,23]. Additional sensors not analyzed here were placed on both hands (taped, middle finger axis), both upper arms (taped, mid-biceps), and the right ankle. To synchronize video with sensor data, one sensor was tapped at both the start and end of the recording while in view of the camera. Video timestamps were subsequently linearly interpolated to synchronize with the sensor timeline [18].
2.3. Ground Truth
An experienced annotator (FC) manually labelled steps on the video recording using ELAN 6.8 (The Language Archive, Nijmegen, Netherlands). Steps as part of walking (shifting weight off from one foot to lift it, followed by reloading it after displacement in any direction) and shuffling (foot lift without forward progression) were labelled [42]. Data were excluded if the participant’s feet were not visible in the video for more than one second (e.g., toilet visits).
To assess inter-annotator agreement, a second experienced annotator (RPK) – blinded to the first annotator’s labels – independently labelled three participants representing different Functional Ambulation Category scores.
2.4. Data Processing
Data were processed in Python (version 3.9.21). The selection of sensing and analysis parameters was informed by the review of Boukhennoufa et al. (2022) [18]. This included 1) sensor location, 2) filtering the raw acceleration signal, 3) windowing (i.e., segmenting the signal into windows) for feature extraction, and 4) training various regressor types to count step events. Only accelerometer data were used with respect to power consumption in future long-term field monitoring. In addition, a previous investigation found no added value by including a gyroscope to quantify PA [43].
2.4.1. Sensor Location
Accelerometer data from all locations (left and right wrist, chest, lower back, waist, thigh, and ankle) were analyzed. Each sensor was analyzed independently; combinations of sensor locations were not considered with respect to future field use.
2.4.2. Filter Range
Human gait generates acceleration components predominantly below 5 Hz, with the fundamental walking frequency typically not exceeding 3 Hz [44]. To investigate the impact of signal filtering, the signal was processed using three different 5th-order Butterworth filter ranges, selected a priori: wide-band (low-pass, 15Hz cut-off frequency), medium-band (band-pass, 0.2-5 Hz), and narrow-band (band-pass, 0.5-3 Hz).
2.4.3. Window Length
Signal features were calculated using sliding windows with 50% overlap across three window sizes: short (0.5 seconds), medium (2 seconds), and long (5 seconds). Time-domain (e.g., mean, standard deviation, number of peaks) and frequency-domain features (e.g., energy, dominant frequency, magnitude of dominant frequency) for the vertical and anteroposterior axes and correlation-based features (e.g., cross-correlation, autocorrelation) between the axes were computed. The vertical and anteroposterior axes have been found to be most reliable in another patient population [45]. Axes were determined according to the SciKit Digital Health method (vertical: highest mean acceleration, anteroposterior: strongest correlation to vertical axis) to ensure signal processing is independent of coordinate system orientation [46].
2.4.4. Regressor Type
Informed by literature, five methods were evaluated [18]: Gradient Boosting (GB), k-Nearest Neighbors (kNN), Multilayer Perceptron (MLP), Random Forest (RF), and Support Vector Regression (SVR). To reduce the likelihood of overfitting and obtain realistic estimates of generalizability, a leave-one-subject-out (LOSO) cross-validation scheme was employed with three folds. LOSO is well-suited for wearable sensor data, which typically exhibits high inter-subject and low intra-subject variability. It ensures that each validation fold involves a subject not seen during training, thereby simulating deployment to new users [47]. The three test subjects for each parameter combination were randomly drawn from the sample. Each regressor was trained to minimize the root mean squared error (RMSE).
2.5. Data Analysis
2.5.1. Annotator Agreement
Inter-annotator agreement was evaluated using the mean absolute percentage error (MAPE) and Pearson correlation coefficients, calculated for each of the three investigated window lengths (short, medium, long). These metrics compare the number of steps identified by the second annotator to the ground truth established by the first annotator.
2.5.2. Optimal Sensing and Analysis Configuration
To answer the primary research question, a generalized linear model was used to estimate the effect of sensor location (reference: waist), filter range (reference: wide-band), window length (reference: medium), and regressor type (reference: GB) on step counting accuracy. The outcome variable was the median RMSE scaled to 1 second.
A generalized linear model with a gamma distribution and log-link function was applied to account for the positively skewed RMSE values. Model assumptions were assessed visually and statistically (Kolmogorov-Smirnov test). The short window length condition was excluded due to clear violations of distributional assumptions, including a bimodal distribution with substantially higher RMSE values for the short compared to the other window lengths (see Supplementary Material, Figure 1). If no parameter level significantly outperformed its reference, the reference was retained for the algorithm comparison. Level of significance was set to 0.05. Due to the log-link function, results are directly reported as effect sizes with 95% confidence intervals, p-values, and RMSE values. The predicted RMSE for each parameter level represents the expected RMSE when that level is used in combination with all other parameters set to their reference. Parameter importance was quantified by expressing the RMSE of the worst-performing level relative to that of the best-performing level within each parameter.
2.5.3. Algorithm Comparison
To analyze the secondary research question, the optimal sensing and analysis configuration identified in the previous step was used to train a step-counting algorithm using a LOSO cross-validation approach with seven folds. The performance of this neurologically specific algorithm was subsequently compared to four established algorithms originally developed for able-bodied individuals:
- Threshold-Crossing Algorithm (TCA), detects a step when the vector magnitude of acceleration exceeds a fixed threshold (here: 0.3 m/s2) [48].
- Continuous Wavelet Transform (CWT): applies a Morlet wavelet transform to the signal, followed by peak detection. The wavelet scale adapts to walking speed, improving robustness to temporal variation [49].
- SciKit Digital Health (SKDH): a pre-trained machine learning algorithm designed for lower back sensor data [46].
- OxWearables (OxW): a pre-trained machine learning algorithm designed for wrist worn sensors [50].
TCA and CWT were applied to the optimal sensor location identified in step 1; SKDH and OxW were applied to the original sensor location (lower back and wrist, respectively). Algorithm performance was compared using the mean absolute percentage error (MAPE) between predicted and ground-truth step counts. Normality was assessed visually (Q-Q plot, see Supplementary Material, Figure 3) and statistically (Shapiro-Wilk test). If the assumption of normality was not met, a non-parametric Friedman test was applied. Level of significance was set to 0.05. Results are reported with median and interquartile range.
3. Results
The study included seven neurological patients (6 male, 1 female) with stroke (n = 4), Parkinson’s disease (n = 1), spinal cord injury (n = 1), and hydrocephalus (n = 1). The mean age was 72.7 ± 10.8 years (range: 57-90 years). All participants were right-side dominant and had Functional Ambulation Category scores of 5 (n = 2), 4 (n = 3), 3 (n = 1), and 2 (n = 1). One participant used a walking aid (cane).
The mean recording duration was 34.7 ± 8.8 minutes (range: 20-46 minutes), during which participants collected an average of 775 ± 301 steps (range: 443-1’156 steps). The measurement of one participant had to be repeated due to video loss caused by a software update of the camera. Inter-annotator agreement was high, with a MAPE of 1.3% and Pearson correlation coefficients exceeding 0.99 for each of the evaluated window lengths (short, medium, long).
3.1. Optimal Sensing and Analysis Configuration
After excluding the short window length (see Supplementary Material, Figure 1), visual inspection of model residuals (Supplementary Material, Figure 2) suggested good model fit. This was confirmed by the Kolmogorov-Smirnov test (p = 0.8275), indicating no violation of distributional assumptions.
Significant variations in step counting accuracy were observed across all four parameters (Table 1). Sensor location had the largest influence on accuracy: RMSE was 100.2% higher for the worst performing location (right wrist, 0.61) compared to the best (waist, 0.3, p≤0.001). Window length had the second largest effect: RMSE was 29.6% higher for the worst performing length (medium, 0.30) compared to the best (long, 0.23, p≤0.01). Regressor type had the third largest effect: RMSE was 14.1% higher for the worst performing model (kNN, 0.34) compared to the best (RF, 0.30, p≤0.01). Finally, filter range showed the smallest effect: RMSE was 10.9% higher for the worst performing range (wide, 0.30) compared to the best (narrow, 0.27, p≤0.01).
Based on these results, the optimal configuration uses the waist sensor, the narrow filter band (0.5–3 Hz), the long window (5-second), and GB.
3.2. Algorithm Comparison
Compared to the ground truth step count, the algorithm trained with the optimal sensing and analysis configuration counted a median of 86.4% of total steps [interquartile range: 10.2%]. In contrast, CWT counted 47.4% [21.2%], SKDH counted 39.5% [23.2%], TCA counted 18.1% [33.6%], and OxW counted 11.2% [21.7%] of total steps.
This corresponds to a MAPE of 13.6% [9.3%] for GB, 52.6% [21.3%] for CWT, 60.5% [23.3%] for SKDH, 81.9% [33.6%] for TCA, and 88.8% [21.7%] for OxW (Figure 1). The Friedman test indicated a significant difference in algorithm accuracy (p=0.002). A non-parametric test was chosen because the Shapiro–Wilk test approached the level of significance (p=0.053) and the Q–Q plot showed substantial deviations from normality (see Supplementary Material, Figure 3).
4. Discussion
This study investigated the accuracy of step-counting algorithms during ADL in individuals with neurological conditions, who typically exhibit altered gait patterns compared to healthy peers. Impaired gait and limited mobility significantly affect functional independence and quality of life [51,52], and step count serves as a clinically meaningful outcome measure to quantify PA [24,26,27]. The results of this study demonstrate that step counting accuracy varies significantly across sensing and analysis parameters. The optimal configuration – a waist sensor combined with a 0.5-3 Hz filter range, a 5-second window, and a gradient boosting regressor – achieved the lowest error rate (mean MAPE of 13.6%). In contrast, the algorithms developed for able-bodied individuals performed markedly worse in this sample (mean MAPE of 52.6%-88.8%).
Using step frequency values for stroke survivors during controlled clinical walking assessments (1.66 steps/s during the 6-minute walking test [40]), these error rates translate to 0.23 steps/s for the population-specific algorithm and 0.87-1.48 steps/s for the able-bodied-trained algorithms. These values exceed the error margins typically observed in controlled clinical settings (e.g., 2- or 6-minute walking test), where step-counting errors range from 0.04 to 0.45 steps/s [36,37,39,40]. However, similar error margins have been observed in other studies conducted outside standardized test conditions (MAPE: 27.0%–320.8% or 0.45-5.34 steps/s) [53]. Furthermore, similar error margins are found when using step frequency values observed in the present study (775 steps in 34.7 minutes or 0.37 steps/s on average): 0.05 steps/s for the population-specific algorithm and 0.19-0.32 steps/s for the able-bodied-trained algorithms. Of note, all algorithms investigated in the present study underestimate the number of steps compared to the ground truth.
Sensor location showed the largest effect on step counting accuracy among the investigated parameters, with the waist yielding a significantly lower RMSE compared to all other locations. Notably, the lower back and ankle sensors also demonstrated acceptable performance, with effect sizes within 10% of the waist sensor (Table 1). This is in line with a previous study that estimated distance walked in stroke survivors and identified the waist and ankle as the most accurate location [54]. While one could expect the ankle to outperform the waist due to its proximity to the ground, the unilateral placement may have limited the ankle’s ability to detect steps of the contralateral foot. This might be particular relevant during ADL including steps that are not part of bilateral gait patterns, such as brushing teeth or preparing food. The value of sensors mounted on the core, such as the waist and lower back, has previously been shown with respect to gait asymmetries [55]. The observed difference in performance between the waist and lower back was unexpected and warrants further investigation. We pre-selected the waist as the reference because it is the most frequently used sensor location for measuring PA [17,18,21], as well as for practical reasons related to wear comfort and donning/doffing. For long-term field monitoring, a waist-worn sensor clipped to the belt or trousers likely offers superior wear comfort compared to a taped sensor on the lower back, which could interfere with backrests during seated activities and might require assistance for donning/doffing. Conversely, from a data perspective, taping a sensor may improve the accuracy of sensor placement and wear compliance, particularly over long wear periods. When combined with previous research of our group, the ankle might be the preferred choice if step counting is to be combined with a tracking of body posture, while the waist and lower back might be the preferred choices if step counting is to be combined with other PA outcomes [43]. For the remaining locations, accuracy declined with increasing distance from the feet (thigh to chest to wrist), a trend consistent with expectations based on biomechanical signal attenuation and movement variability at more cranial/distal locations during ADL. However, when considering wearing comfort, the wrist could become a very interesting alternative. The wrist would allow combining the step counting with upper extremity usage, a very well researched topic [17,18]. However, the results observed in this study (Table 1, Figure 1) make the wrist the least preferred choice from an accuracy point of view.
Window length was the second most influential factor, with longer windows (5 seconds) yielding lower RMSE rate compared to shorter ones (2 seconds). The shortest window length (0.5 seconds) had even to be excluded from the analysis due to very poor performance on the RMSE (see Supplementary Material, Figure 1). Window length determines the amount of temporal information captured in each analysis segment (i.e., feature). Very short windows may capture only partial steps, especially in individuals with slow or irregular gait, and are more susceptible to motion artifacts during non-walking activities, making feature extraction less meaningful and stable, and ultimately negatively impacting step counting accuracy. In contrast, long windows are more likely to encompass complete or multiple steps, resulting in more robust and representative feature sets. The longest window length investigated in this study yielded the lowest RMSE. As previous research has used even longer windows, up to 10 seconds [18], future studies should evaluate whether extending window lengths further improves performance during ADL, where many steps may occur outside of structured walking bouts. Conversely, if the goal is to reduce window length to increase temporal resolution and enable the detection of individual steps that are not part of walking bouts, future research should consider alternative feature sets, e.g., without correlation-based features that might be less reliable in very short segments.
Regressor type also influenced performance, with ensemble methods such as GB and RF outperforming simpler models like kNN. This suggests that more complex, non-linear models are better suited to capturing the heterogeneous and irregular movement patterns observed in individuals with neurological conditions and confirms previous research [18]. Ensemble methods aggregate multiple weak learners, enabling them to model subtle, high-dimensional relationships between features and step events, which is particularly valuable when signal characteristics vary between individuals. In contrast, simpler models such as kNN rely heavily on local similarity in feature space and may be more vulnerable to inter-subject variability, which is expected to be pronounced in clinical populations. Interestingly, while neural network models like the MLP offer theoretical flexibility, they did not outperform tree-based methods in this study, potentially due to the limited size of the training data. Our findings support the use of ensemble learning methods in wearable sensor-based gait analysis, particularly in scenarios involving small datasets, which are common in research on clinical populations. Future studies with larger samples should systematically compare ensemble methods with neural network models to better understand their relative strengths.
The filter range, the fourth processing parameter investigated, showed a moderate influence on accuracy. The narrowest band (0.5–3 Hz) yielded the lowest RMSE, likely because it captures the frequency components most relevant to gait while effectively suppressing high-frequency noise and low-frequency drift. The medium band (0.2–5 Hz) is a viable alternative, whereas the wide band (low-pass with a 15 Hz cut-off) does not provide comparable performance.
The algorithm comparison showed that the neurological population-specific step-counting algorithm, trained with the optimal sensing and analysis configuration, achieved the lowest error rate. The able-bodied algorithms reached MAPEs that were 4 to 6.5 times higher. However, it is important to note that this comparison is inherently biased. The population-specific algorithm – despite using LOSO cross-validation – was both trained and validated on the same sample, while the able-bodied algorithms used independent development samples. Consequently, future research should confirm these findings using an independent neurological sample. Such a study should pay close attention to the sample composition of the sample, including age, diagnosis, Functional Ambulation Category, and use of assistive devices. Notably, a previous study observed a 6% decrease in performance when moving from LOSO cross-validation in the development sample to validation in an independent sample of healthy participants [56]. A similar or larger reduction in performance should be expected here. To improve the robustness of the population-specific algorithm, we recommend further training on a larger and more diverse neurological cohort prior to independent validation. Interestingly, the ranking of the able-bodied algorithms’ MAPEs in the algorithm comparison (secondary research question, Figure 1) mirrors the ranking of sensor locations in the search for the optimal sensing and analysis configuration (primary research question, Table 1): the waist (CWT) achieved the lowest error, followed by the back (SKDH) and the wrist (OxW) with the substantially largest error. The only exception is the simple TCA algorithm applied to the waist, which had a higher MAPE than SKDH for the back sensor. This aligns with the regressor comparison, where simpler models like kNN and SVR produced the highest error rates.
4.1. Methodological Considerations
A key strength of the present study is its focus on ADL, including typical non-walking tasks such as tooth brushing and food preparation. This contrasts with the vast majority of comparable studies, which rely on standardized clinical gait assessments involving continuous, uninterrupted walking, such as the 2- or 6-minute walking tests [35,36,37,38,39,40]. The ADL investigated in this study or by Henderson et al. 2022 are far more representative of patients’ activities in their home environment, strengthening the study’s ecological validity [53]. However, this realism comes at the cost of higher error rates [17,22,36,37,39,40,53,57]. Two key factors contribute to this trade-off. First, the average step frequency in our study was around 0.37 steps/s versus 1.66 steps/s observed in the 6-minute walking test [40], reflecting the fragmented, irregular nature of daily movements. Second, recent work has shown that non-stepping tasks are frequently misclassified as steps when algorithms are trained or validated exclusively on structured walking tasks, undermining their generalizability to real-life settings [53]. In this context, it should be noted that this study was limited to indoor ADL performed in a rehabilitation clinic, which may not fully capture the variability encountered in home environments.
This study included a diverse neurological sample (Functional Ambulation Category score ranging from 2 to 5) with four out of seven patients being stroke survivors. Although the sample is relatively small, the study was sufficiently powered to address the primary research question regarding optimal sensing and analysis configuration, as evident from the significant differences observed for all investigated parameters (Table 1). The sample size in combination with the significance level (0.05) rendered effect sizes of ≥9% statistically significant. Whether smaller effect sizes are clinically meaningful remains a question for future research. We consider the sample size to represent a reasonable balance between the need for statistical power and the ethical responsibility to minimize participant burden. However, it was insufficient to perform a post hoc Wilcoxon test for the algorithm comparison (secondary aim). With seven participants, the smallest possible Wilcoxon p-value is 0.0156 (i.e., 2 x 0.57), which cannot reach significance when correcting for multiple comparisons. Therefore, we recommend that the next step involves training an algorithm using the optimal sensing and analysis configuration identified in this study on a larger neurological sample, followed by a validation on an independent dataset. The limited sample size also supported our choice to express the primary results as effect sizes (Table 1), and to constrain the number of signal features to reduce regressor complexity. Future studies with larger samples should consider incorporating a broader set of features and employing evidence-based feature selection methods, such as those described previously [58]. Additionally, collecting more than 35 minutes of data or exceeding 775 steps per participant is advisable to further enhance model robustness.
The search for optimal sensing and analysis parameters followed a structured approach using generalized linear modelling to obtain results as robust as possible. An alternative would have been to select the single best-performing parameter combination. However, we argue that in algorithm development, particularly for neurological populations, the primary goal should not be to maximize performance on a specific dataset, but rather to prioritize robustness and generalizability. This is especially critical when the intended application involves remote monitoring of ADL. This focus on robustness is also one of the main reasons why the present study incorporated a broad range of ADL not directly related to walking, supporting the study’s ecological validity.
The present study investigated step count as a measure of PA volume and frequency [24]. Other gait-related variables such as cadence, stance duration, or gait speed may provide even greater clinical insights. Gait speed, for instance, is a strong predictor of functional status, independence and quality of life, and is sometimes referred to as the “sixth vital sign” [22,59]. Nevertheless, we view accurate step counting as an essential first step toward assessing gait in real-world environments outside the clinics and standardized clinical assessments, and recommend that future algorithm developments for more sophisticated gait outcomes be based on algorithms that can accurately detect steps [60,61]. We fully acknowledge that gait speed has a substantial impact on step detection accuracy [39,40,62,63]. This likely contributes to the poor performance of algorithms developed on able-bodied individuals when applied to neurological populations. Finally, this study did not distinguish between steps taken during walking and those during shuffling. While this distinction may be less critical for general step-counting, it could be important in the context of PA, where differentiating gait intensity may be relevant.
5. Conclusions
This study is among the first structured investigations of how sensor location, filter settings, window length, and algorithm type affect machine learning-based step detection in neurological populations during ADL. The results demonstrate that population-specific algorithms are essential for accurate step counting. The optimal sensing and analysis configuration includes a waist-mounted sensor, a 0.5-3 Hz filter, a 5-second window, and a gradient boosting regressor. The corresponding algorithm detected on average 86% of the steps taken by the individuals with neurological conditions, while the able-bodied trained algorithm detected ≤47% of the steps. Notably, all algorithms tended to underestimate step counts relative to the ground truth. This highlights the inherent challenges of step detection in individuals with neurological conditions, particularly during non-walking activities that are common in daily life but poorly represented in traditional gait assessments such as the 6-minute walking test. Future studies are needed to evaluate the generalizability of these findings in larger and independent neurological samples.
Supplementary Materials
The following supporting information can be downloaded at the website of this paper posted on Preprints.org, Figure S1: Histogram of RMSE for window length; Figure S2: Visualizations of generalized linear model fit; Figure S3: Assessing normal distribution for algorithm comparison.
Author Contributions
Conceptualization, J.P., C.M.B. and R.P.K.; methodology, F.C., J.P. and R.P.K.; software, F.C. and R.P.K.; validation, F.C. and R.P.K.; formal analysis, F.C. and R.P.K.; investigation, F.C. and J.P.; resources, J.P., C.E.A., C.M.B.; data curation, F.C., J.P. and R.P.K.; writing—original draft preparation, F.C. and R.P.K.; writing—review and editing, F.C., J.P., C.E.A., C.M.B. and R.P.K.; visualization, R.P.K.; supervision, J.P., C.E.A., C.M.B. and R.P.K.; project administration, J.P. and R.P.K.; funding acquisition, C.M.B. All authors have read and agreed to the published version of the manuscript.
Funding
This research received no external funding.
Informed Consent Statement
Informed consent was obtained from all subjects involved in the study.
Data Availability Statement
The raw data supporting the conclusions of this article will be made available by the authors on reasonable request.
Conflicts of Interest
The authors declare no conflicts of interest.
Abbreviations
The following abbreviations are used in this manuscript:
| PA | Physical Activity |
| ADL | Activities of Daily Living |
| RMSE | Root Mean Square Error |
| MAPE | Mean Absolute Percentage Error |
| GB | Gradient Boosting |
| kNN | k-Nearest Neighbors |
| MLP | Multilayer Perceptron |
| RF | Random Forest |
| SVR | Support Vector Regression |
| LOSO | Leave-one-subject-out |
| TCA | Threshold-Crossing Algorithm |
| CWT | Continuous Wavelet Transform |
| SKDH | SciKit Digital Health |
| OxW | OxWearables |
References
- Lear SA, Hu W, Rangarajan S, Gasevic D, Leong D, Iqbal R, et al. The effect of physical activity on mortality and cardiovascular disease in 130 000 people from 17 high-income, middle-income, and low-income countries: the PURE study. The Lancet. 2017 Dec;390(10113):2643–54.
- Morley JF, Subramanian I, Farahnik J, Grout L, Salcido C, Kurtzer J, et al. Physical Activity, Patient-Reported Outcomes, and Quality of Life in Parkinson’s Disease. J Geriatr Psychiatry Neurol. 2025 ;08919887251346495. 30 May.
- Yu, C.; Cao, Y.; Liu, Q.; Tan, H.; Xia, G.; Chen, B.; Du, F.; Lu, K.; Saposnik, G. Sitting Time, Leisure-Time Physical Activity, and Risk of Mortality Among US Stroke Survivors: A Prospective Cohort Study From the NHANES 2007 to 2018. Stroke 2025, 56, 1738–1747. [Google Scholar] [CrossRef]
- Andersen, T.M.; Andersen, A.M.; Riemenschneider, M.; Taul-Madsen, L.; Diechmann, M.; Gaemelke, T.; Dalgas, U.; Brønd, J.C.; Hvid, L.G. Comprehensive evaluation of accelerometer-based physical activity in persons with multiple sclerosis – The influence of disability status and its impact on walking capacity. Mult. Scler. Relat. Disord. 2024, 93, 106243. [Google Scholar] [CrossRef]
- Cieza, A.; Causey, K.; Kamenov, K.; Hanson, S.W.; Chatterji, S.; Vos, T. Global estimates of the need for rehabilitation based on the Global Burden of Disease study 2019: a systematic analysis for the Global Burden of Disease Study 2019. Lancet 2020, 396, 2006–2017. [Google Scholar] [CrossRef]
- Butler, E.N.; Evenson, K.R. Prevalence of Physical Activity and Sedentary Behavior Among Stroke Survivors in the United States. Top. Stroke Rehabilitation 2014, 21, 246–255. [Google Scholar] [CrossRef] [PubMed]
- English, C.; Manns, P.J.; Tucak, C.; Bernhardt, J. Physical Activity and Sedentary Behaviors in People With Stroke Living in the Community: A Systematic Review. Phys. Ther. 2014, 94, 185–196. [Google Scholar] [CrossRef] [PubMed]
- Fini, N.A.; Holland, A.E.; Keating, J.; Simek, J.; Bernhardt, J. How Physically Active Are People Following Stroke? Systematic Review and Quantitative Synthesis. Phys. Ther. 2017, 97, 707–717. [Google Scholar] [CrossRef]
- Fini, N.A.; Bernhardt, J.; Churilov, L.; Clark, R.; Holland, A.E. Adherence to physical activity and cardiovascular recommendations during the 2 years after stroke rehabilitation discharge. Ann. Phys. Rehabilitation Med. 2021, 64, 101455. [Google Scholar] [CrossRef] [PubMed]
- Gebruers, N.; Vanroy, C.; Truijen, S.; Engelborghs, S.; De Deyn, P.P. Monitoring of Physical Activity After Stroke: A Systematic Review of Accelerometry-Based Measures. Arch. Phys. Med. Rehabilitation 2010, 91, 288–297. [Google Scholar] [CrossRef]
- Hobeanu, C.; Lavallée, P.C.; Charles, H.; Labreuche, J.; Albers, G.W.; Caplan, L.R.; A Donnan, G.; Ferro, J.M.; Hennerici, M.G.; A Molina, C.; et al. Risk of subsequent disabling or fatal stroke in patients with transient ischaemic attack or minor ischaemic stroke: an international, prospective cohort study. Lancet Neurol. 2022, 21, 889–898. [Google Scholar] [CrossRef]
- Kang, S.-M.; Kim, S.-H.; Han, K.-D.; Paik, N.-J.; Kim, W.-S. Physical activity after ischemic stroke and its association with adverse outcomes: A nationwide population-based cohort study. Top. Stroke Rehabilitation 2020, 28, 170–180. [Google Scholar] [CrossRef]
- Turan, T.N.; Nizam, A.; Lynn, M.J.; Egan, B.M.; Le, N.-A.; Lopes-Virella, M.F.; Hermayer, K.L.; Harrell, J.; Derdeyn, C.P.; Fiorella, D.; et al. Relationship between risk factor control and vascular events in the SAMMPRIS trial. Neurology 2017, 88, 379–385. [Google Scholar] [CrossRef]
- Adams, S.A.; Matthews, C.E.; Ebbeling, C.B.; Moore, C.G.; Cunningham, J.E.; Fulton, J.; Hebert, J.R. The Effect of Social Desirability and Social Approval on Self-Reports of Physical Activity. Am. J. Epidemiol. 2005, 161, 389–398. [Google Scholar] [CrossRef]
- Prince, S.A.; Adamo, K.B.; Hamel, M.E.; Hardt, J.; Gorber, S.C.; Tremblay, M. A comparison of direct versus self-report measures for assessing physical activity in adults: A systematic review. Int. J. Behav. Nutr. Phys. Act. 2008, 5, 56. [Google Scholar] [CrossRef]
- Troiano, R.P.; McClain, J.J.; Brychta, R.J.; Chen, K.Y. Evolution of accelerometer methods for physical activity research. Br. J. Sports Med. 2014, 48, 1019–1023. [Google Scholar] [CrossRef]
- Bernaldo de Quirós M, Douma EH, van den Akker-Scheek I, Lamoth CJC, Maurits NM. Quantification of Movement in Stroke Patients under Free Living Conditions Using Wearable Sensors: A Systematic Review. Sensors. 2022 Jan;22(3):1050.
- Boukhennoufa, I.; Zhai, X.; Utti, V.; Jackson, J.; McDonald-Maier, K.D. Wearable sensors and machine learning in post-stroke rehabilitation assessment: A systematic review. Biomed. Signal Process. Control. 2022, 71. [Google Scholar] [CrossRef]
- Godfrey, A.; Hetherington, V.; Shum, H.; Bonato, P.; Lovell, N.; Stuart, S. From A to Z: Wearable technology explained. Maturitas 2018, 113, 40–47. [Google Scholar] [CrossRef]
- Johansson, D.; Malmgren, K.; Alt Murphy, M. Wearable sensors for clinical applications in epilepsy, Parkinson’s disease, and stroke: a mixed-methods systematic review. J. Neurol. 2018, 265, 1740–1752. [Google Scholar] [CrossRef]
- Letts, E.; Jakubowski, J.S.; King-Dowling, S.; Clevenger, K.; Kobsar, D.; Obeid, J. Accelerometer techniques for capturing human movement validated against direct observation: a scoping review. Physiol. Meas. 2024, 45, 07TR01. [Google Scholar] [CrossRef] [PubMed]
- Peters, D.M.; O’bRien, E.S.; Kamrud, K.E.; Roberts, S.M.; Rooney, T.A.; Thibodeau, K.P.; Balakrishnan, S.; Gell, N.; Mohapatra, S. Utilization of wearable technology to assess gait and mobility post-stroke: a systematic review. J. Neuroeng. Rehabilitation 2021, 18, 1–18. [Google Scholar] [CrossRef] [PubMed]
- Sun, Y.; Chen, J.; Ji, M.; Li, X. Wearable Technologies for Health Promotion and Disease Prevention in Older Adults: Systematic Scoping Review and Evidence Map. J. Med Internet Res. 2025, 27, e69077. [Google Scholar] [CrossRef] [PubMed]
- A Fini, N.; Simpson, D.; A Moore, S.; Mahendran, N.; Eng, J.J.; Borschmann, K.; Conradsson, D.M.; Chastin, S.; Churilov, L.; English, C. How should we measure physical activity after stroke? An international consensus. Int. J. Stroke 2023, 18, 1132–1142. [Google Scholar] [CrossRef]
- Pohl, J.; Ryser, A.; Veerbeek, J.M.; Verheyden, G.; Vogt, J.E.; Luft, A.R.; Easthope, C.A. Accuracy of gait and posture classification using movement sensors in individuals with mobility impairment after stroke. Front. Physiol. 2022, 13, 933987. [Google Scholar] [CrossRef]
- Bassett, D.R.; Toth, L.P.; LaMunion, S.R.; Crouter, S.E. Step Counting: A Review of Measurement Considerations and Health-Related Applications. Sports Med. 2016, 47, 1303–1315. [Google Scholar] [CrossRef]
- Brandenbarg, P.; Hoekstra, F.; Barakou, I.; Seves, B.L.; Hettinga, F.J.; Hoekstra, T.; van der Woude, L.H.V.; Dekker, R.; Krops, L.A. Measurement properties of device-based physical activity instruments in ambulatory adults with physical disabilities and/or chronic diseases: a scoping review. BMC Sports Sci. Med. Rehabilitation 2023, 15, 1–35. [Google Scholar] [CrossRef]
- Fini NA, Holland AE, Keating J, Simek J, Bernhardt J. How is physical activity monitored in people following stroke? Disability and Rehabilitation. 2015 Sep 11;37(19):1717–31.
- Larsen, R.T.; Wagner, V.; Korfitsen, C.B.; Keller, C.; Juhl, C.B.; Langberg, H.; Christensen, J. Effectiveness of physical activity monitors in adults: systematic review and meta-analysis. BMJ 2022, 376, e068047. [Google Scholar] [CrossRef]
- Neumann S, Ducrot M, Vavanan M, Naef AC, Easthope Awai C. Providing Personalized Gait Feedback in Daily Life. In: Pons JL, Tornero J, Akay M, editors. Converging Clinical and Engineering Research on Neurorehabilitation V. Cham: Springer Nature Switzerland; 2025. p. 632–5.
- Coca-Tapia, M.; Cuesta-Gómez, A.; Molina-Rueda, F.; Carratalá-Tejada, M. Gait Pattern in People with Multiple Sclerosis: A Systematic Review. Diagnostics 2021, 11, 584. [Google Scholar] [CrossRef]
- Lavelle, G.; Norris, M.; Flemming, J.; Harper, J.; Bradley, J.; Johnston, H.; Fortune, J.; Stennett, A.; Kilbride, C.; Ryan, J.M. Validity and Acceptability of Wearable Devices for Monitoring Step-Count and Activity Minutes Among People With Multiple Sclerosis. Front. Rehabilitation Sci. 2022, 2. [Google Scholar] [CrossRef]
- Xu, J.; Witchalls, J.; Preston, E.; Pan, L.; Waddington, G.; Adams, R.; Han, J. Stroke-related factors associated with gait asymmetry in ambulatory stroke survivors: A systematic review and meta-analysis. Gait Posture 2025, 121, 173–181. [Google Scholar] [CrossRef] [PubMed]
- Zanardi, A.P.J.; da Silva, E.S.; Costa, R.R.; Passos-Monteiro, E.; dos Santos, I.O.; Kruel, L.F.M.; Peyré-Tartaruga, L.A. Gait parameters of Parkinson’s disease compared with healthy controls: a systematic review and meta-analysis. Sci. Rep. 2021, 11, 1–13. [Google Scholar] [CrossRef] [PubMed]
- Costa, P.H.V.; de Jesus, T.P.D.; Winstein, C.; Torriani-Pasin, C.; Polese, J.C. An investigation into the validity and reliability of mHealth devices for counting steps in chronic stroke survivors. Clin. Rehabilitation 2019, 34, 394–403. [Google Scholar] [CrossRef] [PubMed]
- Fulk, G.D.; Combs, S.A.; Danks, K.A.; Nirider, C.D.; Raja, B.; Reisman, D.S. Accuracy of 2 Activity Monitors in Detecting Steps in People With Stroke and Traumatic Brain Injury. Phys. Ther. 2014, 94, 222–229. [Google Scholar] [CrossRef]
- Katzan, I.; Schuster, A.; Kinzy, T. Physical Activity Monitoring Using a Fitbit Device in Ischemic Stroke Patients: Prospective Cohort Feasibility Study. JMIR mHealth uHealth 2021, 9, e14494. [Google Scholar] [CrossRef]
- Macko, R.F.; Haeuber, E.; Shaughnessy, M.; Coleman, K.L.; Boone, D.A.; Smith, G.V.; Silver, K.H. Microprocessor-based ambulatory activity monitoring in stroke patients. Med. Sci. Sports Exerc. 2002, 34, 394–399. [Google Scholar] [CrossRef]
- Mahendran N, Kuys SS, Downie E, Ng P, Brauer SG. Are Accelerometers and GPS Devices Valid, Reliable and Feasible Tools for Measurement of Community Ambulation After Stroke? Brain Impairment. 2016 Sep;17(2):151–61.
- Schaffer, S.D.; Holzapfel, S.D.; Fulk, G.; Bosch, P.R. Step count accuracy and reliability of two activity tracking devices in people after stroke. Physiother. Theory Pr. 2017, 33, 788–796. [Google Scholar] [CrossRef]
- World Medical Association. World Medical Association Declaration of Helsinki: Ethical Principles for Medical Research Involving Human Participants. JAMA. 2025 Jan 7;333(1):71–4.
- Ustad, A.; Logacjov, A.; Trollebø, S.Ø.; Thingstad, P.; Vereijken, B.; Bach, K.; Maroni, N.S. Validation of an Activity Type Recognition Model Classifying Daily Physical Behavior in Older Adults: The HAR70+ Model. Sensors 2023, 23, 2368. [Google Scholar] [CrossRef] [PubMed]
- Kuster, R.P.; Baumgartner, D.; Hagströmer, M.; Grooten, W.J. Where to Place Which Sensor to Measure Sedentary Behavior? A Method Development and Comparison Among Various Sensor Placements and Signal Types. J. Meas. Phys. Behav. 2020, 3, 274–284. [Google Scholar] [CrossRef]
- Xu, Y.; Li, G.; Li, Z.; Yu, H.; Cui, J.; Wang, J.; Chen, Y. Smartphone-Based Unconstrained Step Detection Fusing a Variable Sliding Window and an Adaptive Threshold. Remote. Sens. 2022, 14, 2926. [Google Scholar] [CrossRef]
- Kobsar, D.; Osis, S.T.; Phinyomark, A.; Boyd, J.E.; Ferber, R. Reliability of gait analysis using wearable sensors in patients with knee osteoarthritis. J. Biomech. 2016, 49, 3977–3982. [Google Scholar] [CrossRef] [PubMed]
- Adamowicz L, Christakis Y, Czech MD, Adamusiak T. SciKit Digital Health: Python Package for Streamlined Wearable Inertial Sensor Data Processing (Preprint) [Internet]. 2022 [cited 2024 Jul 1]. Available from: http://preprints.jmir. 3676.
- Kuster, R.P.; Huber, M.; Hirschi, S.; Siegl, W.; Baumgartner, D.; Hagströmer, M.; Grooten, W. Measuring Sedentary Behavior by Means of Muscular Activity and Accelerometry. Sensors 2018, 18, 4010. [Google Scholar] [CrossRef]
- Ducharme, S.W.; Lim, J.; Busa, M.A.; Aguiar, E.J.; Moore, C.C.; Schuna, J.M.; Barreira, T.V.; Staudenmayer, J.; Chipkin, S.R.; Tudor-Locke, C. A Transparent Method for Step Detection Using an Acceleration Threshold. J. Meas. Phys. Behav. 2021, 4, 311–320. [Google Scholar] [CrossRef]
- Brajdic, A.; Harle, R.K. Walk detection and step counting on unconstrained smartphones. In Proceedings of the 2013 ACM International Joint Conference on Pervasive and Ubiquitous Computing, Zurich, Switzerland, 8–12 September 2013; 225–234; Association for Computing Machinery(ACM): New York, NY, USA, ; pp, 2013. [Google Scholar]
- Small SR, Chan S, Walmsley R, von Fritsch L, Acquah A, Mertes G, et al. Development and Validation of a Machine Learning Wrist-worn Step Detection Algorithm with Deployment in the UK Biobank. medRxiv. 2023 Feb 22;2023.02.20.23285750.
- Kim, K.; Kim, Y.M.; Kim, E.K. Correlation between the Activities of Daily Living of Stroke Patients in a Community Setting and Their Quality of Life. J. Phys. Ther. Sci. 2014, 26, 417–419. [Google Scholar] [CrossRef]
- Ramos-Lima MJM, Brasileiro I de C, de Lima TL, Braga-Neto P. Quality of life after stroke: impact of clinical and sociodemographic factors. Clinics (Sao Paulo). 2018;73:e418.
- Henderson, C.E.; Toth, L.; Kaplan, A.; Hornby, T.G. Step Monitor Accuracy during Poststroke Physical Therapy and Simulated Activities. Transl. J. Am. Coll. Sports Med. 2021, 7. [Google Scholar] [CrossRef] [PubMed]
- Compagnat, M.; Batcho, C.S.; David, R.; Vuillerme, N.; Salle, J.Y.; Daviet, J.C.; Mandigout, S. Validity of the Walked Distance Estimated by Wearable Devices in Stroke Individuals. Sensors 2019, 19, 2497. [Google Scholar] [CrossRef]
- Zhang, W.; Smuck, M.; Legault, C.; Ith, M.A.; Muaremi, A.; Aminian, K. Gait Symmetry Assessment with a Low Back 3D Accelerometer in Post-Stroke Patients. Sensors 2018, 18, 3322. [Google Scholar] [CrossRef]
- Kuster, RP. Advancing the measurement of sedentary behaviour: classifying posture and physical (in-)activity. Stockholm: Karolinska Institutet; 2021. 80 p.
- Andrews K, Stewart J. STROKE RECOVERY: HE CAN BUT DOES HE? Rheumatology and Rehabilitation. 1979;18(1):43–8.
- Kuster, R.P.; Grooten, W.J.A.; Baumgartner, D.; Blom, V.; Hagströmer, M.; Ekblom, Ö. Detecting prolonged sitting bouts with the ActiGraph GT3X. Scand. J. Med. Sci. Sports 2019, 30, 572–582. [Google Scholar] [CrossRef] [PubMed]
- Schmid, A.; Duncan, P.W.; Studenski, S.; Lai, S.M.; Richards, L.; Perera, S.; Wu, S.S. Improvements in Speed-Based Gait Classifications Are Meaningful. Stroke 2007, 38, 2096–2100. [Google Scholar] [CrossRef]
- Neumann S, Bauer CM, Nastasi L, Läderach J, Thürlimann E, Schwarz A, et al. Accuracy, concurrent validity, and test–retest reliability of pressure-based insoles for gait measurement in chronic stroke patients. Frontiers in Digital Health. 2024 Apr 3;6:1359771.
- Werner, C.; Easthope, C.A.; Curt, A.; Demkó, L. Towards a Mobile Gait Analysis for Patients with a Spinal Cord Injury: A Robust Algorithm Validated for Slow Walking Speeds. Sensors 2021, 21, 7381. [Google Scholar] [CrossRef]
- Clay, L.; Webb, M.; Hargest, C.; Adhia, D.B. Gait quality and velocity influences activity tracker accuracy in individuals post-stroke. Top. Stroke Rehabilitation 2019, 26, 412–417. [Google Scholar] [CrossRef] [PubMed]
- Taraldsen, K.; Askim, T.; Sletvold, O.; Einarsen, E.K.; Bjåstad, K.G.; Indredavik, B.; Helbostad, J.L. Evaluation of a Body-Worn Sensor System to Measure Physical Activity in Older People With Impaired Function. Phys. Ther. 2011, 91, 277–285. [Google Scholar] [CrossRef] [PubMed]
Figure 1.
Mean absolute percentage error (MAPE) of the investigated algorithms: Gradient Boosting (GB, waist sensor), Continuous Wavelet Transform (CWT, waist sensor), SciKit Digital Health (SKDH, lower back sensor), Threshold-Crossing Algorithm (TCA, waist sensor), and OxWearables (OxW, wrist sensor). Only the GB algorithm was developed in this study using data from individuals with neurological conditions; the remaining algorithms were developed in other studies using data from able-bodied individuals.
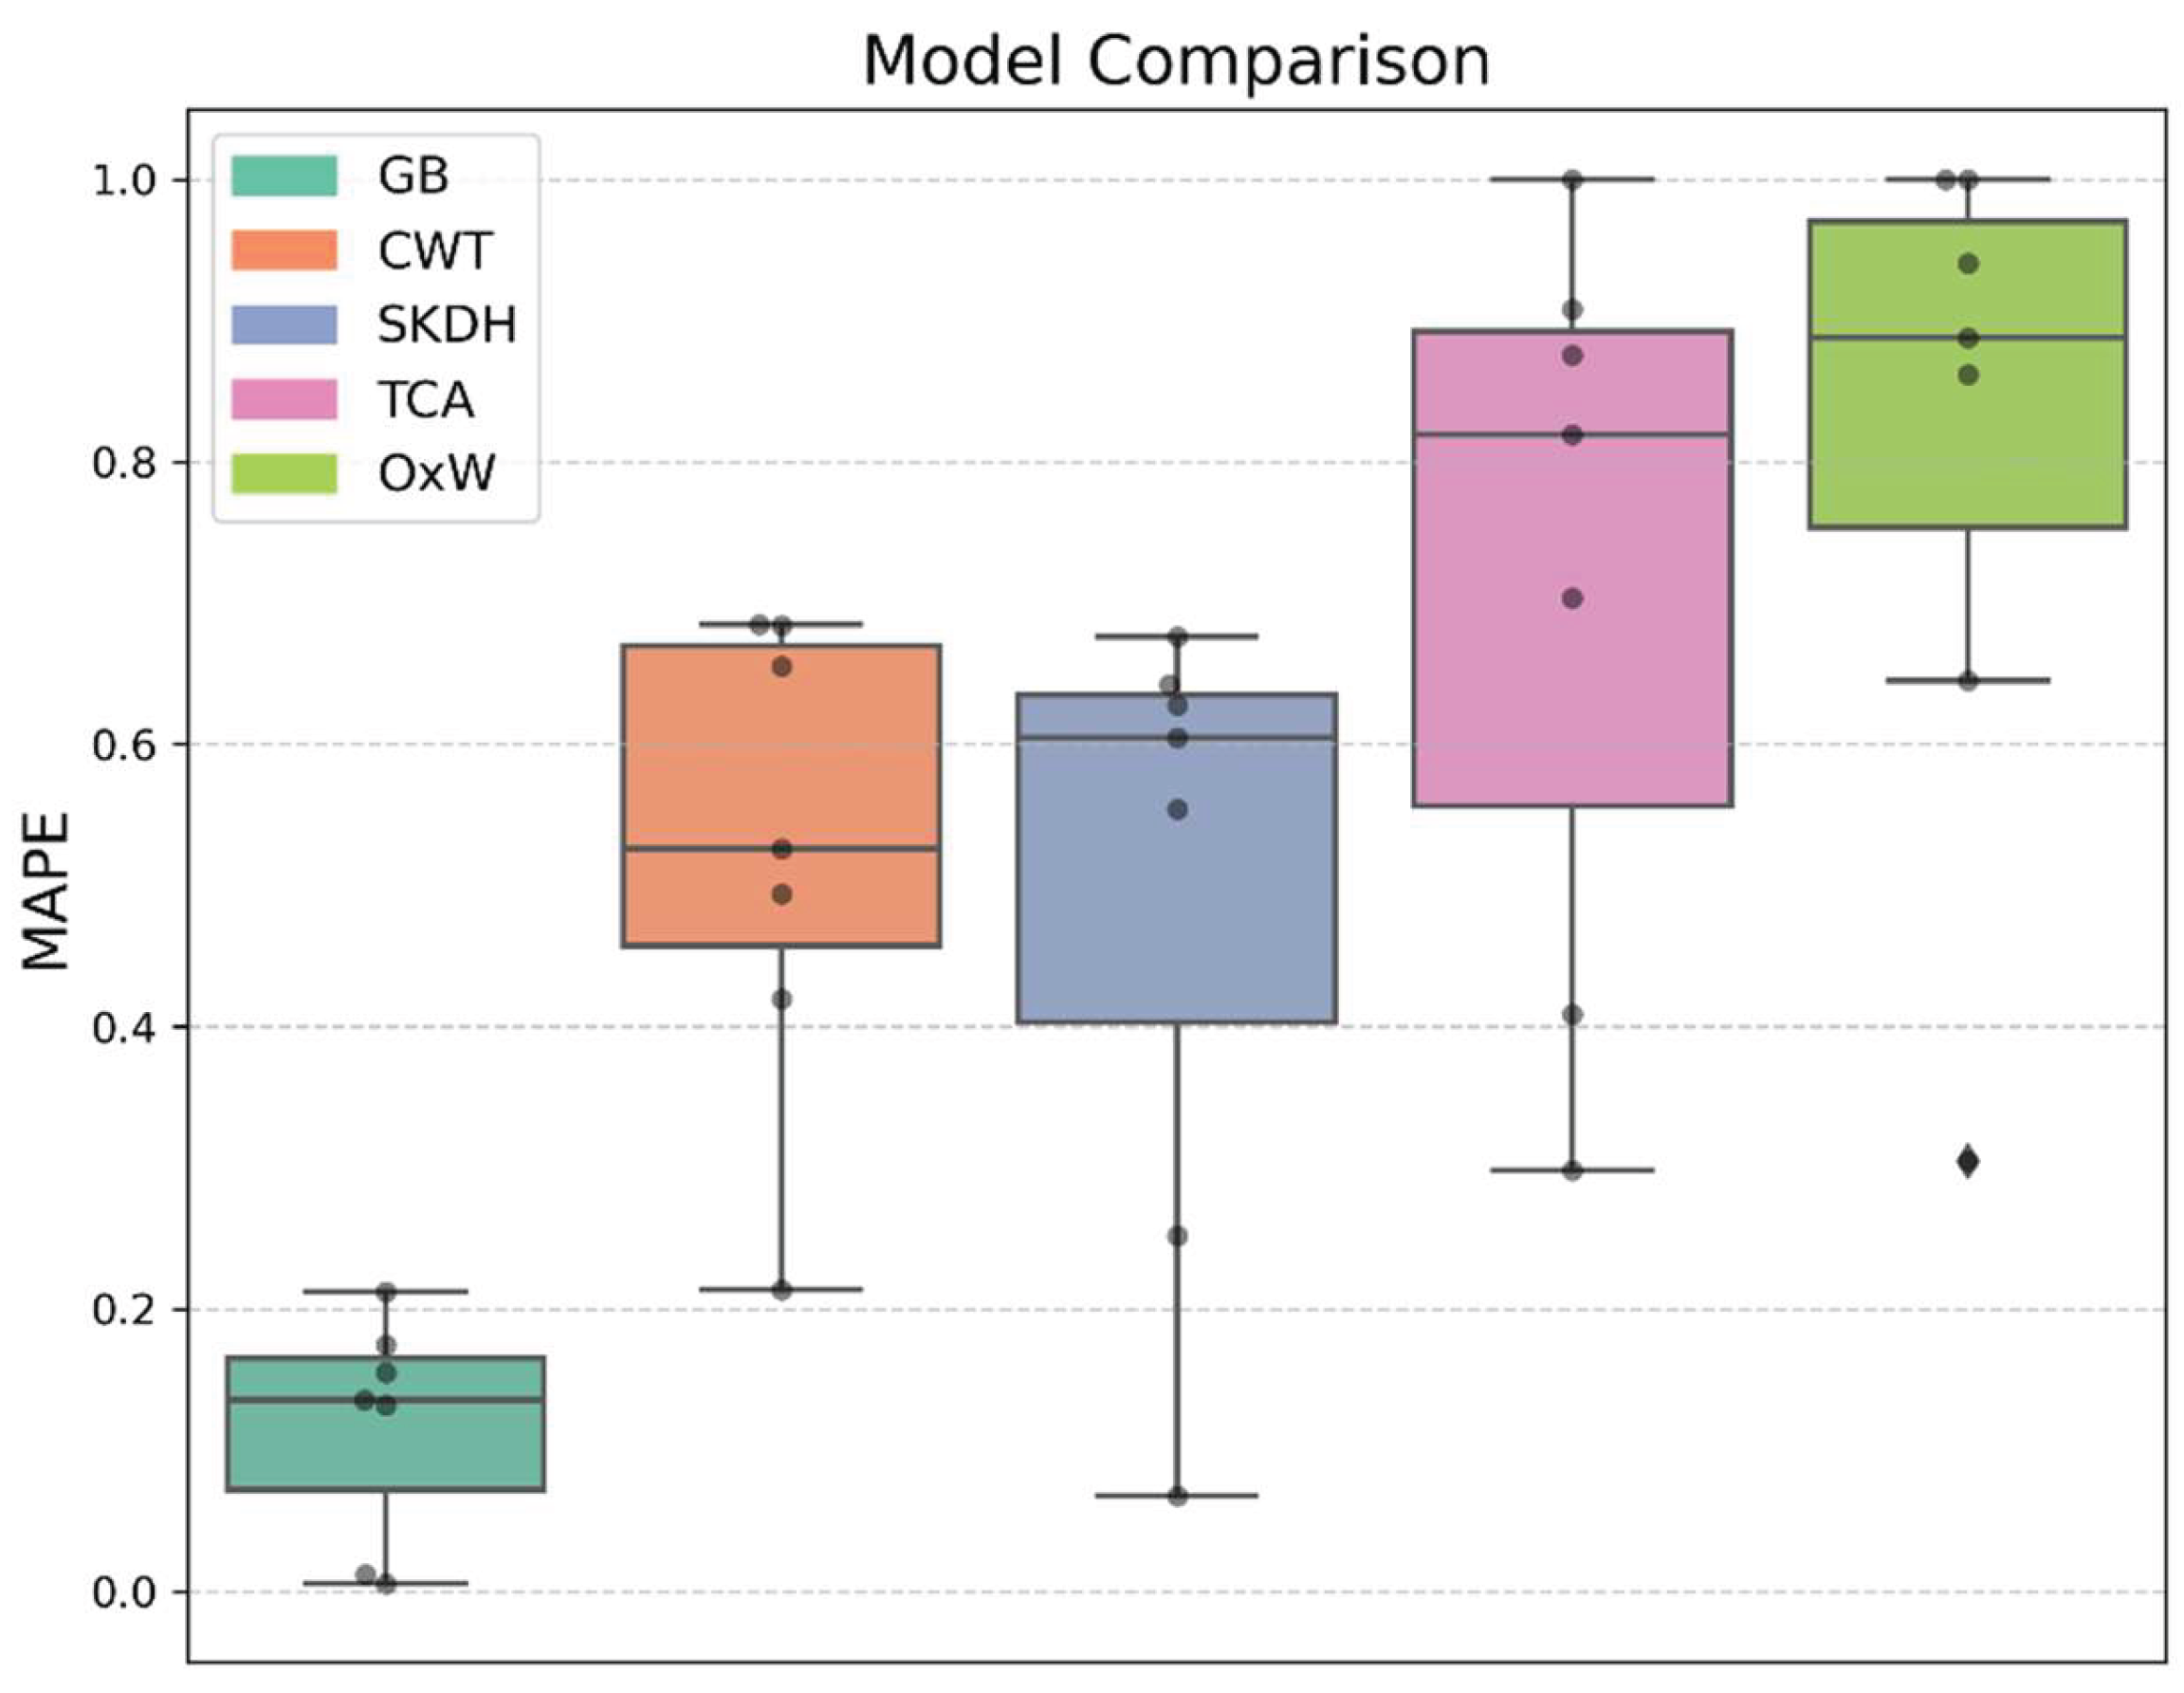

Table 1.
Result of the generalized linear model assessing the effects of sensor location, filter range, window size, and regressor type on the root mean squared error (RMSE) of step counting. Significant differences compared to the reference indicated with asterisk (*). Effect sizes and their 95% confidence intervals (95% CI) reported as exp(β) and 95% CI (exp(β)), respectively, with exp(β) representing the multiplicative change in RMSE relative to the reference.
| Parameter | Level | Effect Size | 95% CI | p-value | RMSE |
| Reference (Ref) | 0.30 | ||||
| Location (Ref = Waist) |
Lower Back* | 1.100 | [1.002, 1.206] | 0.044 | 0.33 |
| Ankle* | 1.101 | [1.004, 1.208] | 0.041 | 0.33 | |
| Thigh* | 1.195 | [1.089, 1.310] | <0.001 | 0.36 | |
| Chest* | 1.276 | [1.164, 1.400] | <0.001 | 0.39 | |
| Wrist (l)* | 1.848 | [1.685, 2.027] | <0.001 | 0.56 | |
| Wrist (r)* | 2.002 | [1.825, 2.196] | <0.001 | 0.61 | |
| Filter (Ref = wide band) |
narrow band* | 0.902 | [0.849, 0.958] | 0.001 | 0.27 |
| medium band* | 0.911 | [0.857, 0.968] | 0.003 | 0.28 | |
| Window (Ref = medium) |
long* | 0.772 | [0.734, 0.811] | 0.000 | 0.23 |
| Regressor (Ref = GB) |
RF | 0.989 | [0.914, 1.069] | 0.776 | 0.30 |
| MLP | 1.063 | [0.983, 1.150] | 0.125 | 0.32 | |
| SVR* | 1.089 | [1.007, 1.178] | 0.032 | 0.33 | |
| kNN* | 1.128 | [1.043, 1.219] | 0.003 | 0.34 |
Abbreviations: left (l), right (r), Gradient Boosting (GB), Random Forest (RF), Multi-Layer Perceptron (MLP), Support Vector Regression (SVR), k-Nearest Neighbors (kNN). Note that the short window condition was excluded due to modelling constraints (see Supplementary Material, Figure 1).
Disclaimer/Publisher’s Note: The statements, opinions and data contained in all publications are solely those of the individual author(s) and contributor(s) and not of MDPI and/or the editor(s). MDPI and/or the editor(s) disclaim responsibility for any injury to people or property resulting from any ideas, methods, instructions or products referred to in the content. |
© 2025 by the authors. Licensee MDPI, Basel, Switzerland. This article is an open access article distributed under the terms and conditions of the Creative Commons Attribution (CC BY) license (https://creativecommons.org/licenses/by/4.0/).
Copyright: This open access article is published under a Creative Commons CC BY 4.0 license, which permit the free download, distribution, and reuse, provided that the author and preprint are cited in any reuse.


