
Submitted:
10 July 2025
Posted:
11 July 2025
You are already at the latest version
Abstract
Poly(lactide) (PLA) is the most versatile biopolymer, but it has an unfavorable end-of-life. Biodegradation occurs under strictly defined conditions, and ultimately, it is landfilled, where it behaves like conventional plastics. To completely utilize the potential of PLA, it is necessary to rethink end-of-life scenarios. In this work, the influence of 10 cycles of reprocessing PLA pre-consumer industrial waste on the material's properties was examined. The mechanical milling of the material was followed by injection molding, and after each cycle, mechanical, thermal, chemical, and optical properties were studied. Between the cycles, no virgin PLA or any additives were added to enhance the properties. Results showed a slight decrease in molecular weight, while the thermal properties remained unchanged compared to the starting material.
Keywords:
bioplastics
; poly(lactide)
; industrial waste
; mechanical recycling
; thermal properties
; mechanical properties
1. Introduction
The growing demand for environmentally sustainable materials has driven the increasing adoption of bio-based polymers, among which poly(lactide) (PLA) has emerged as a leading alternative to petrochemical plastics. Derived from renewable resources such as corn starch and sugarcane, PLA offers advantages including biodegradability, biocompatibility, and favorable mechanical and thermal properties, making it widely used in packaging, textiles, 3D printing, and biomedical applications [1,2,3,4].
Despite its ecological appeal, the environmental benefit of PLA depends largely on how it is managed at the end-of-life (EoL). PLA is compostable under industrial conditions (≥58 °C, high humidity, microbial activity), yet, its biodegradation in natural or home composting environments is extremely slow, often requiring months to years [5,6]. In practice, a significant share of PLA ends up in landfills or incineration, undermining its circular potential [7]. Therefore, viable recycling strategies are critical for realizing the full sustainability of PLA.
Several EoL routes are available for PLA, including mechanical recycling, chemical depolymerization, industrial composting, and incineration with energy recovery [8,9,10,11,12,13,14,15,16,17]. Among these, mechanical recycling is recognized as the most economically and energetically feasible pathway in the short term, as it allows for the reuse of the polymer without depolymerization, maintaining the material’s structural integrity through physical reprocessing steps such as shredding, melting, and extrusion [18,19]. Mechanical recycling also aligns well with circular economy goals, especially in industrial and post-consumer contexts such as 3D printing and food packaging.
However, repeated mechanical recycling of PLA might introduce thermal and hydrolytic degradation, primarily through chain scission, leading to reduced molecular weight, diminished mechanical properties, and altered viscosity [20]. These limitations restrict the recyclability of PLA, particularly for applications demanding high mechanical performance.
To mitigate such degradation, researchers have developed various strategies:
- Blending recycled PLA with virgin material (typically 30–70%) maintains mechanical integrity while enhancing sustainability [23].
In this work, pre-consumer waste underwent 10 processing cycles and properties were studied after each to better understand the influence of reprocessing on mechanical, thermal, chemical and optical properties of PLA compared to the starting material.
2. Materials and Methods
Stramex PET d.o.o. (Podplat, Slovenia) supplied PLA bottles (pre-consumer industrial waste). They were used as received, without any treatment.
2.1. Processing of the Material
Bottles were milled using Wanner milling machine for thermoplastics extruded on the twin-screw extruder Labtech LTE 20-44. The screws diameters 20 mm, L/D ratio 44:1, screws rotation 600 rpm, temperature profile was from the hopper (165 °C) to the die (180 °C).
After extrusion, PLA pellets were processed using ARBURG injection molding machine (Allrounder 320 C500-100 Golden Edition). The temperature was increasing from the hopper (165 °C) to the die (180 °C). The tool temperature was set to 45 °C and the cooling time to 20 s. After the first cycle of injection molding, molded samples were milled and molded in nine more consecutive cycles. From each cycle, 10 samples for further examination were taken. Between the cycles, milled material was dried at 75 °C until the moisture content was below 0.025 % which was determined using the Mettler Toledo HX204 moisture analyser. No plasticizer or any other additive was added to PLA during the recycling.
2.2. Characterization of the Material
The melt flow index (MFI) of samples was evaluated according to ISO 1133 via MFI indexer (Dongguan Liyi Test Equipment, type LY-RR) at a temperature of 210 °C with a 2.16 kg weight. Results are expressed as average value with standard deviation.
Thermal measurements were carried out with a differential scanning calorimeter (DSC 2, Mettler Toledo) under a nitrogen atmosphere (20 mL/min). The sample temperature was increased from 0 to 200 °C at a heating rate of 10 °C/min and held in the molten state for 5 min to erase their thermal history. After being cooled at 10 °C/min, the samples were reheated to 200 °C at 10 °C/min. The crystallization temperature (Tc), crystallization enthalpy (∆Hc), melting temperature (Tm) and melting enthalpy (∆Hm) were obtained from the cooling and the second heating scan. Moreover, the relative crystallinity values (Xc) were calculated, using following equation:
where ΔHm refers to enthalpy of melting
ΔHcc refers to enthaly of cold crystallization
ΔHf refers to enthalpy of melting of 100% crystaline PLA and equals 93,6 kJ/g
Thermogravimetric analyses (TGA) were performed on a Mettler Toledo TGA/DSC3. The analyses were carried out in a nitrogen atmosphere (20 mL/min) from 40 to 600 °C with a heating rate of 10 °C/min, followed by a segment in the oxygen atmosphere (20 mL/min) from 600 °C to 700 °C while the heating rate remained the same.
Thermo-mechanical properties were examined using a Perkin Elmer DMA 8000. The samples were heated at 2 °C/min from room temperature to 170 °C under an air atmosphere. A frequency of 1 Hz and an amplitude of 20 μm were used in dual cantilever mode.
Impact tests were performed on the pendulum Dongguan Liyi Test Equipment, type LY-XJJD5, according to ISO 179. The distance between supports was 60 mm, 2 J pendulum was used.
Flexural and tensile tests were conducted on the Shimadzu AG-X plus according to ISO 178 and ISO 527-1, respectively. Five measurements were performed for each sample.
Chemical properties were examined via infrared spectroscopy with Fourier transformation (FTIR, IRAffinity-1S, Shimadzu), measuring the transmittance (T%), in the wavenumber range 4000-400 cm-1 and 4 cm-1 resolution.
Crystallinity was determined using an X-ray diffractometer, Rigaku MiniFlex 600 (XRD), using Cu-Kα radiation. The 2θ range was from 0 to 50, resolution 0.04, and 3 s hold.
Surface properties of materials were determined by measuring contact angle against water (Osilla Goniometer). One drop of distilled water was placed on the surface of the material, and the contact angle was determined using software.
The colorimetric properties of the samples, subjected to multiple recycling cycles, were evaluated using the CIELAB color space system, comprising parameters L*, a*, b*, C*, and h*. These parameters provide a comprehensive representation of the material’s perceived color. L* denotes lightness (0 for black, 100 for white), a* represents the red-green axis (positive for red, negative for green), b* represents the yellow-blue axis (positive for yellow, negative for blue), C* signifies chroma or saturation, and h* indicates the hue angle. A 3nh NR60CP spectrophotometer was used for evaluation of described parameters.
3. Results and Discussion
Figure 1 illustrates changes in MFI and viscosity with consecutive processing of PLA. Except for cycles 2 and 3 (samples PLA2 and PLA 3), MFI is increasing, while the viscosity of the melt is decreasing. Since no processing additives were added to the PLA, these changes are a direct consequence of consecutive milling and injection molding, which induced a decrease in molecular weight of the PLA molecules.
Thermal properties of the examined samples are summarized in Table 1 and the thermograms of second healting cycle are given at Figure 2. The present results are from the second heating cycle. It can be seen that there are no changes in Tg, Tc and Tm, they are very constant with low deviation from first to last cycle. There are changes in the values of both crystallization and melting enthalpies, which don’t follow the regular trend of change. Variations in enthalpies might be a consequence of different crystalization time of the samples, since the processing was not done the same day for all cycles.
The degradation temperature (Td1) was determined by the TGA method. The values have an almost linear trend of decrease, from 370 °C to 363.7 °C (Table 1), which is in line with MFI results. When MFI is higher, molecular weight is lower, and it is expected that within corresponding samples Td1 will be lower. Even though the degradation temperature is decreasing, the maximum difference is below 7 °C, which is only 2%. Considering DSC and TGA data, it can be concluded that thermal stability did not significantly change with multiple consecutive processing of PLA.
Dynamic-mechanical analysis results give insight into stiffness, storage modulus, and mechanical Tg values, which reflect mechanical softening (segmental motion). The difference in Tg values is low, less than 1 °C, which is in accordance with DSC results. The difference in Tg values determined by DSC and DMA (Table 2 and Figure 3) is expected, since the methods deliver different types of Tg. DSC is the best for thermodynamic Tg, which is related to the processing and the thermal stability of the material, while DMA gives insight into mechanical Tg, which is related to the functional behavior and the mechanical material’s design. DMA Tg has a higher value, and the expected difference compared to DSC Tg is from 5 to 20 °C, which is proven in this case, where DMA Tg has a higher value for 6 to 7 °C. Samples PLA5, PLA6, and PLA8 have two, and PLA7 has three crystallization peaks, which refers to stepwise or incomplete crystallization. It can also be the result of heterogeneous nucleation or processing of the material on different days and different crystallization time for the material.
The reaction of the material to high stress load can be measured by an impact test, resulting in the impact strength and evaluation of brittleness/ductility of the material. Brittle materials, like PLA, have very low impact strength in both notched and unnotched examined samples. Comparing the impact strength from the first to the tenth cycle within notched samples, the value slightly decreases from 2.85 to 2.55 kJ/m2 (Figure 3). Within unnotched samples, sample PLA8 has the highest impact strength of 22.3 kJ/m2, while PLA3 sample has the lowest impact strength of 14 kJ/m2. All samples, notched and unnotched, have low energy absorption potential and have fragile break behavior with almost no plastic deformation.
Flexural and tensile properties of the material are of the highest importance when it comes to the end-use application. Recycled materials usually do not meet requirements for high-performance use, so they are used for more technical applications. In the case of multiple recycling of PLA, it can be seen (Table 3) that (considering standard deviation), there are no significant differences between flexural strength and strain at strength of the examined samples. This indicates that samples retain rigidity, even after ten cycles of thermal processing.
Tensile test results are summarized in Table 4. Measured values indicate that the material is brittle and rigid (which is also proven with previous DMA and impact test results) and has very small elongation before break. Differences in tensile strength and strain at break are low and are not significant, and it can be concluded that multiple recycling does not affect the tensile properties of PLA. Comparing the values of the flexural and tensile tests, it can be concluded that the material can withstand higher stress loads in the transversal direction than in the longitudinal direction, since a higher force is necessary for the material to break.
Changes in the chemical structure of PLA during multiple processing are determined by the FTIR method, and spectra are illustrated in Figure 3 and Figure 4. The difference in peaks around 3000 cm-1 was detected, while the difference around 2360-2320 cm-1 is related to the CO2. Selection of peaks from 3100 to 2800 cm-1 is shown in Figure 4. Spectra of PLA1 and PLA3 (bottom blue and yellow lines) have a different shape compared to the others. Spectra of samples PLA9 and PLA10 do not have the peak at 2850 cm-1. Peaks from 2995 to 2945 cm-1 are related to the CH stretching, the peak at 2879 cm-1 is related to asymmetric -CH3 stretching, while the peak at 2852 cm-1 corresponds to the symmetric -CH3 or -CH2 stretching. The difference in those peaks can indicate the polymer chain scision, which is in correlation with MFI results.
According to the literature [24], PLA has a contact angle between 70 and 80 °, which makes its surface moderately hydrophilic to slightly hydrophobic. Values obtained during this experiment fall into this range (Figure 5), except for samples PLA2 (lower value - more hydrophilic), PLA4 and PLA9 (higher value - more hydrophobic). Images of water drops on the sample surface are illustrated in Figure 6. This can also be connected to the different relaxation times for different series of samples, which can cause the difference in surface properties and orientation of the groups in the polymer chain.
Crystallinity of selected samples is shown in Figure 7. It can be seen that there is no change in the crystallinity of samples within different cycles. A wide peak from 10 to 25 °, with a maximum at 16.7 °, which is according to literature data [25], is a result of the scattering of PLA. One peak with very low intensity occurs around 34 °, and it is not related to PLA, but can be caused by the crystallization of some additive present in the starting material, since, in this work, technical grade PLA was used (there is no data on the exact composition).
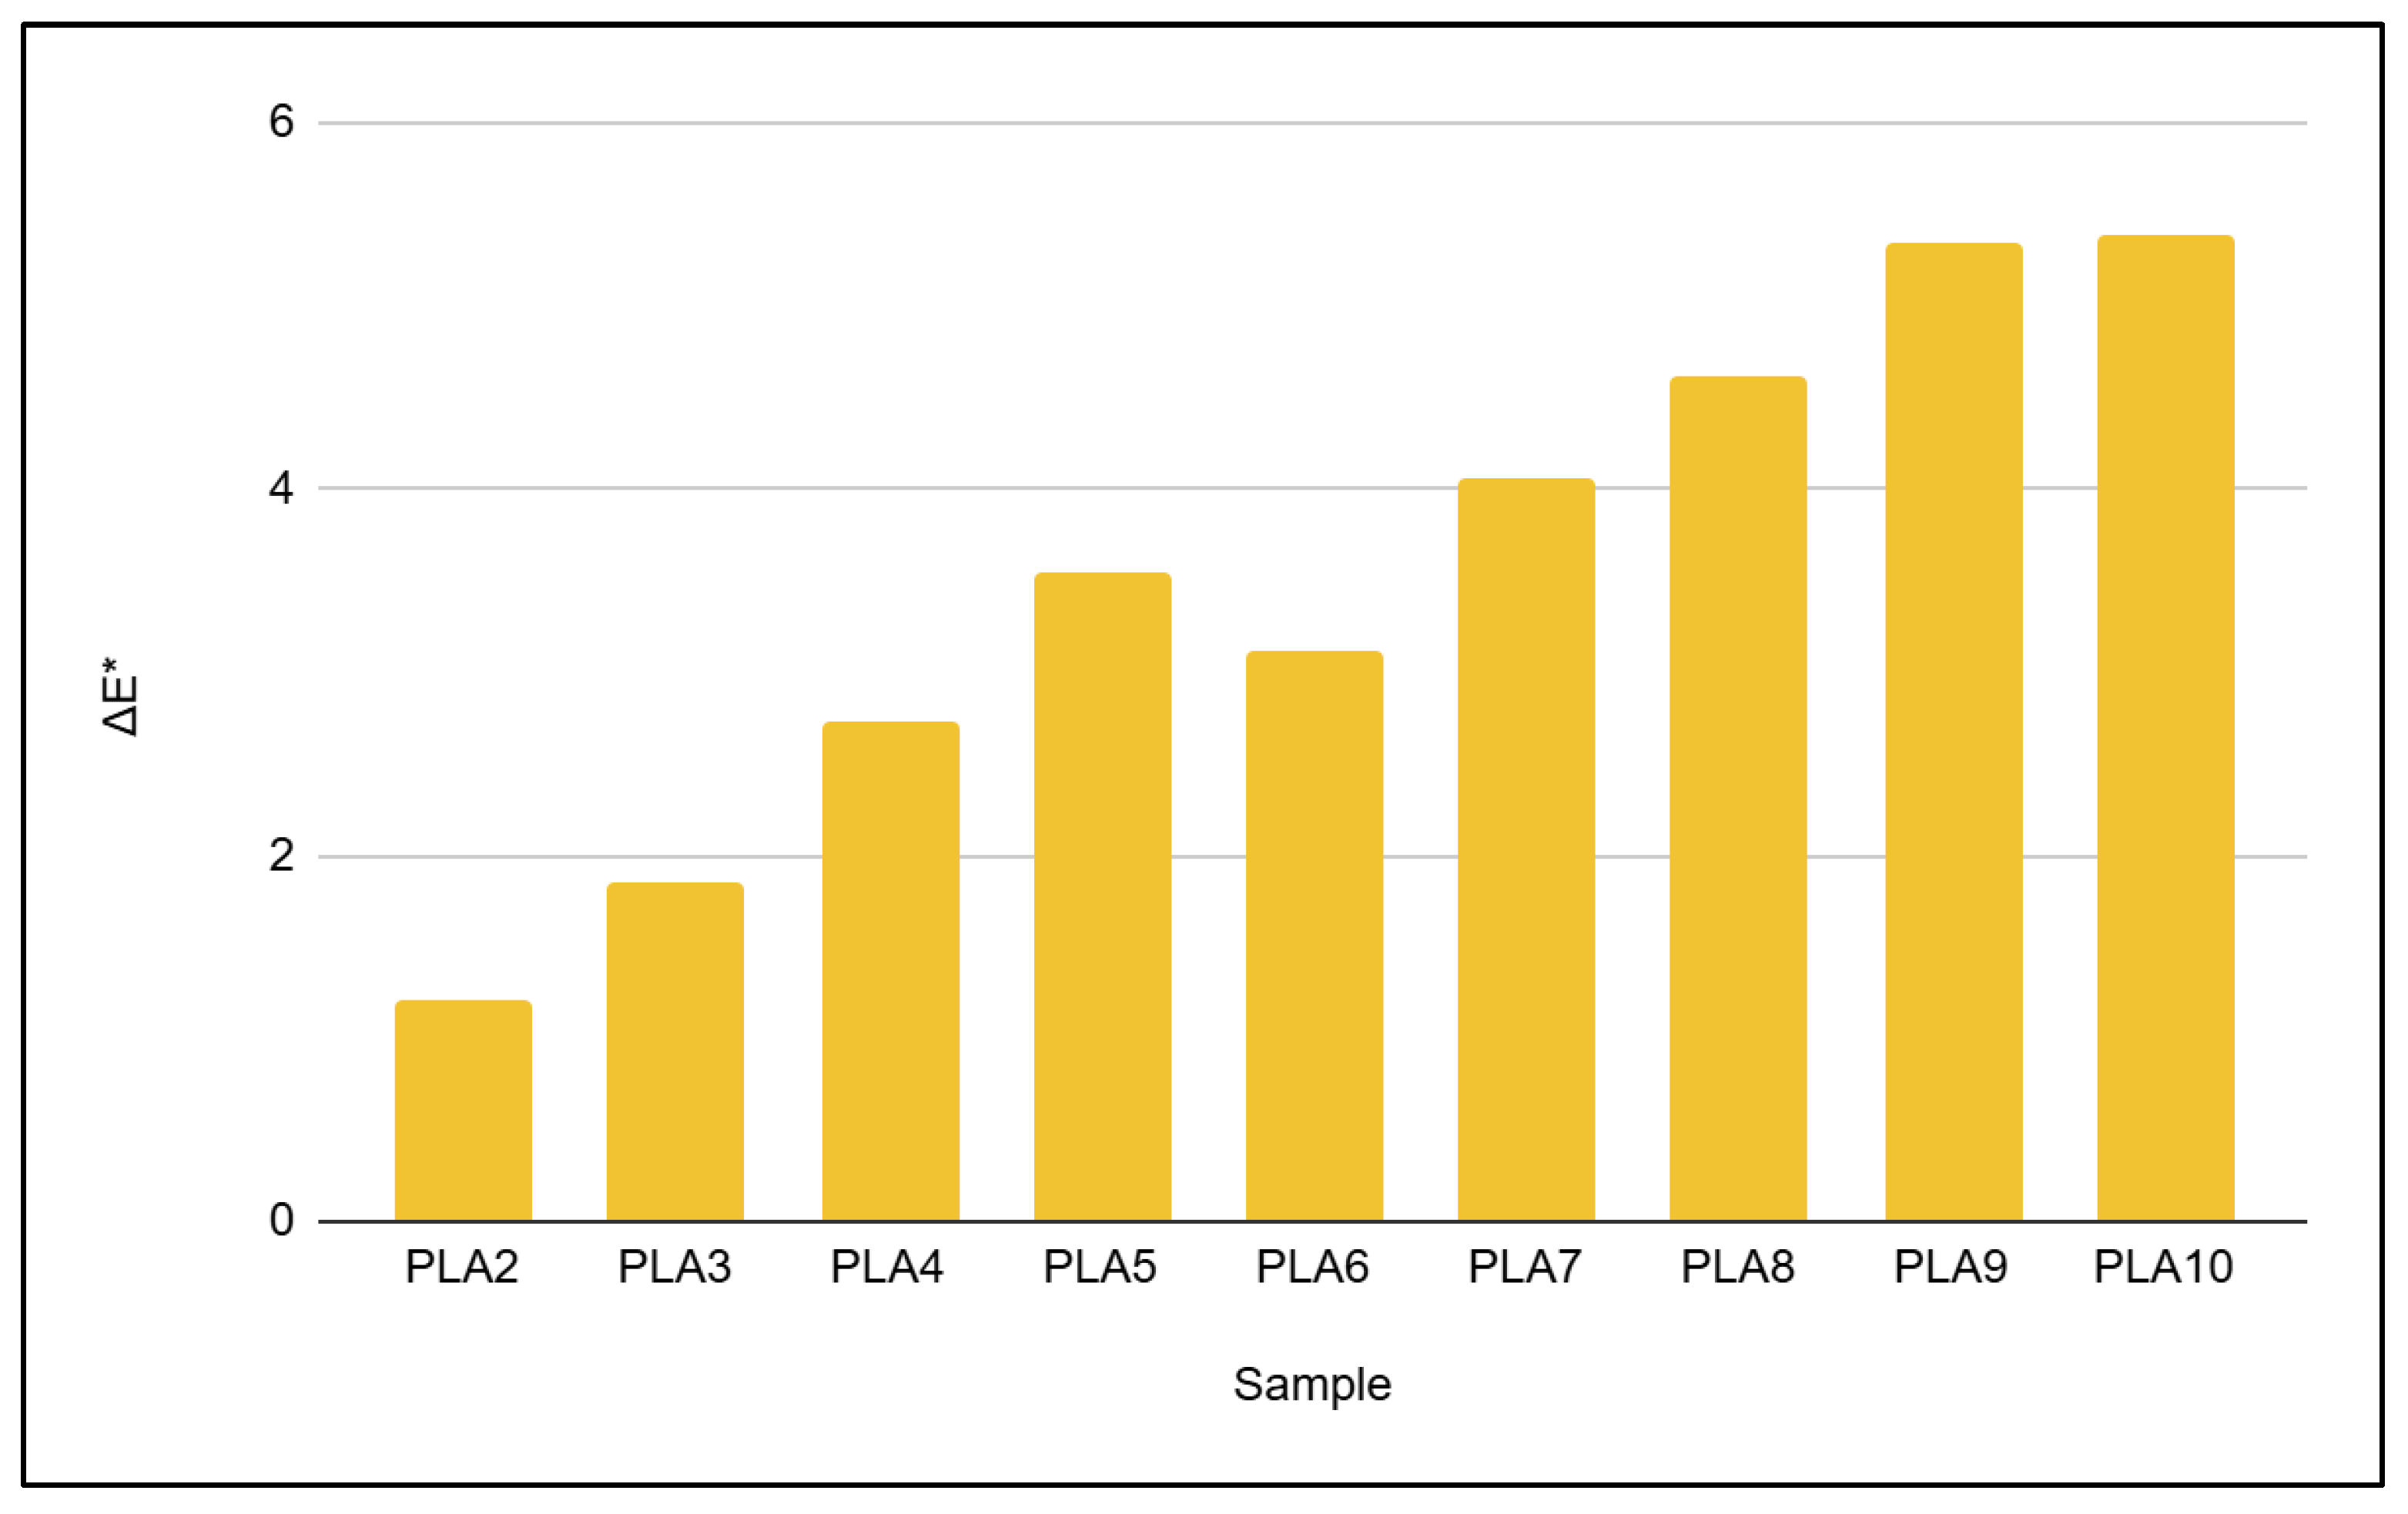
The color change development from the first to the tenth injection molding cycle is almost linear. Figure 8. illustrates the increase in ΔE* values from the second to the tenth sample, which interprets the sample’s color difference compared to the reference (in this case, PLA1).
The measured values, along with their respective standard deviations, are presented in Table 5. As the number of recycling cycles increased from PLA1 to PLA10, a clear trend in the optical properties of the samples was observed. The L* parameter consistently decreased from 89.598±0.253 (PLA1) to 84.782±0.232 (PLA10). This reduction in L* indicates that the recycled PLA samples became progressively darker with each successive reprocessing step. Changes were also noted along the chromatic axes. The a* values decreased from −5.878±0.101 (PLA1) to −7.366±0.071 (PLA10), signifying a shift towards a more pronounced green color. Conversely, the b* values showed a consistent increase from 7.98±0.112 (PLA1) to 9.848±0.107 (PLA10), indicating an intensified yellow tone. The combined effect of these changes in a* and b* parameters suggests a distinct yellowish-green discoloration of the PLA material upon repeated recycling.
Figure 9.
XRD spectra of PLA samples.
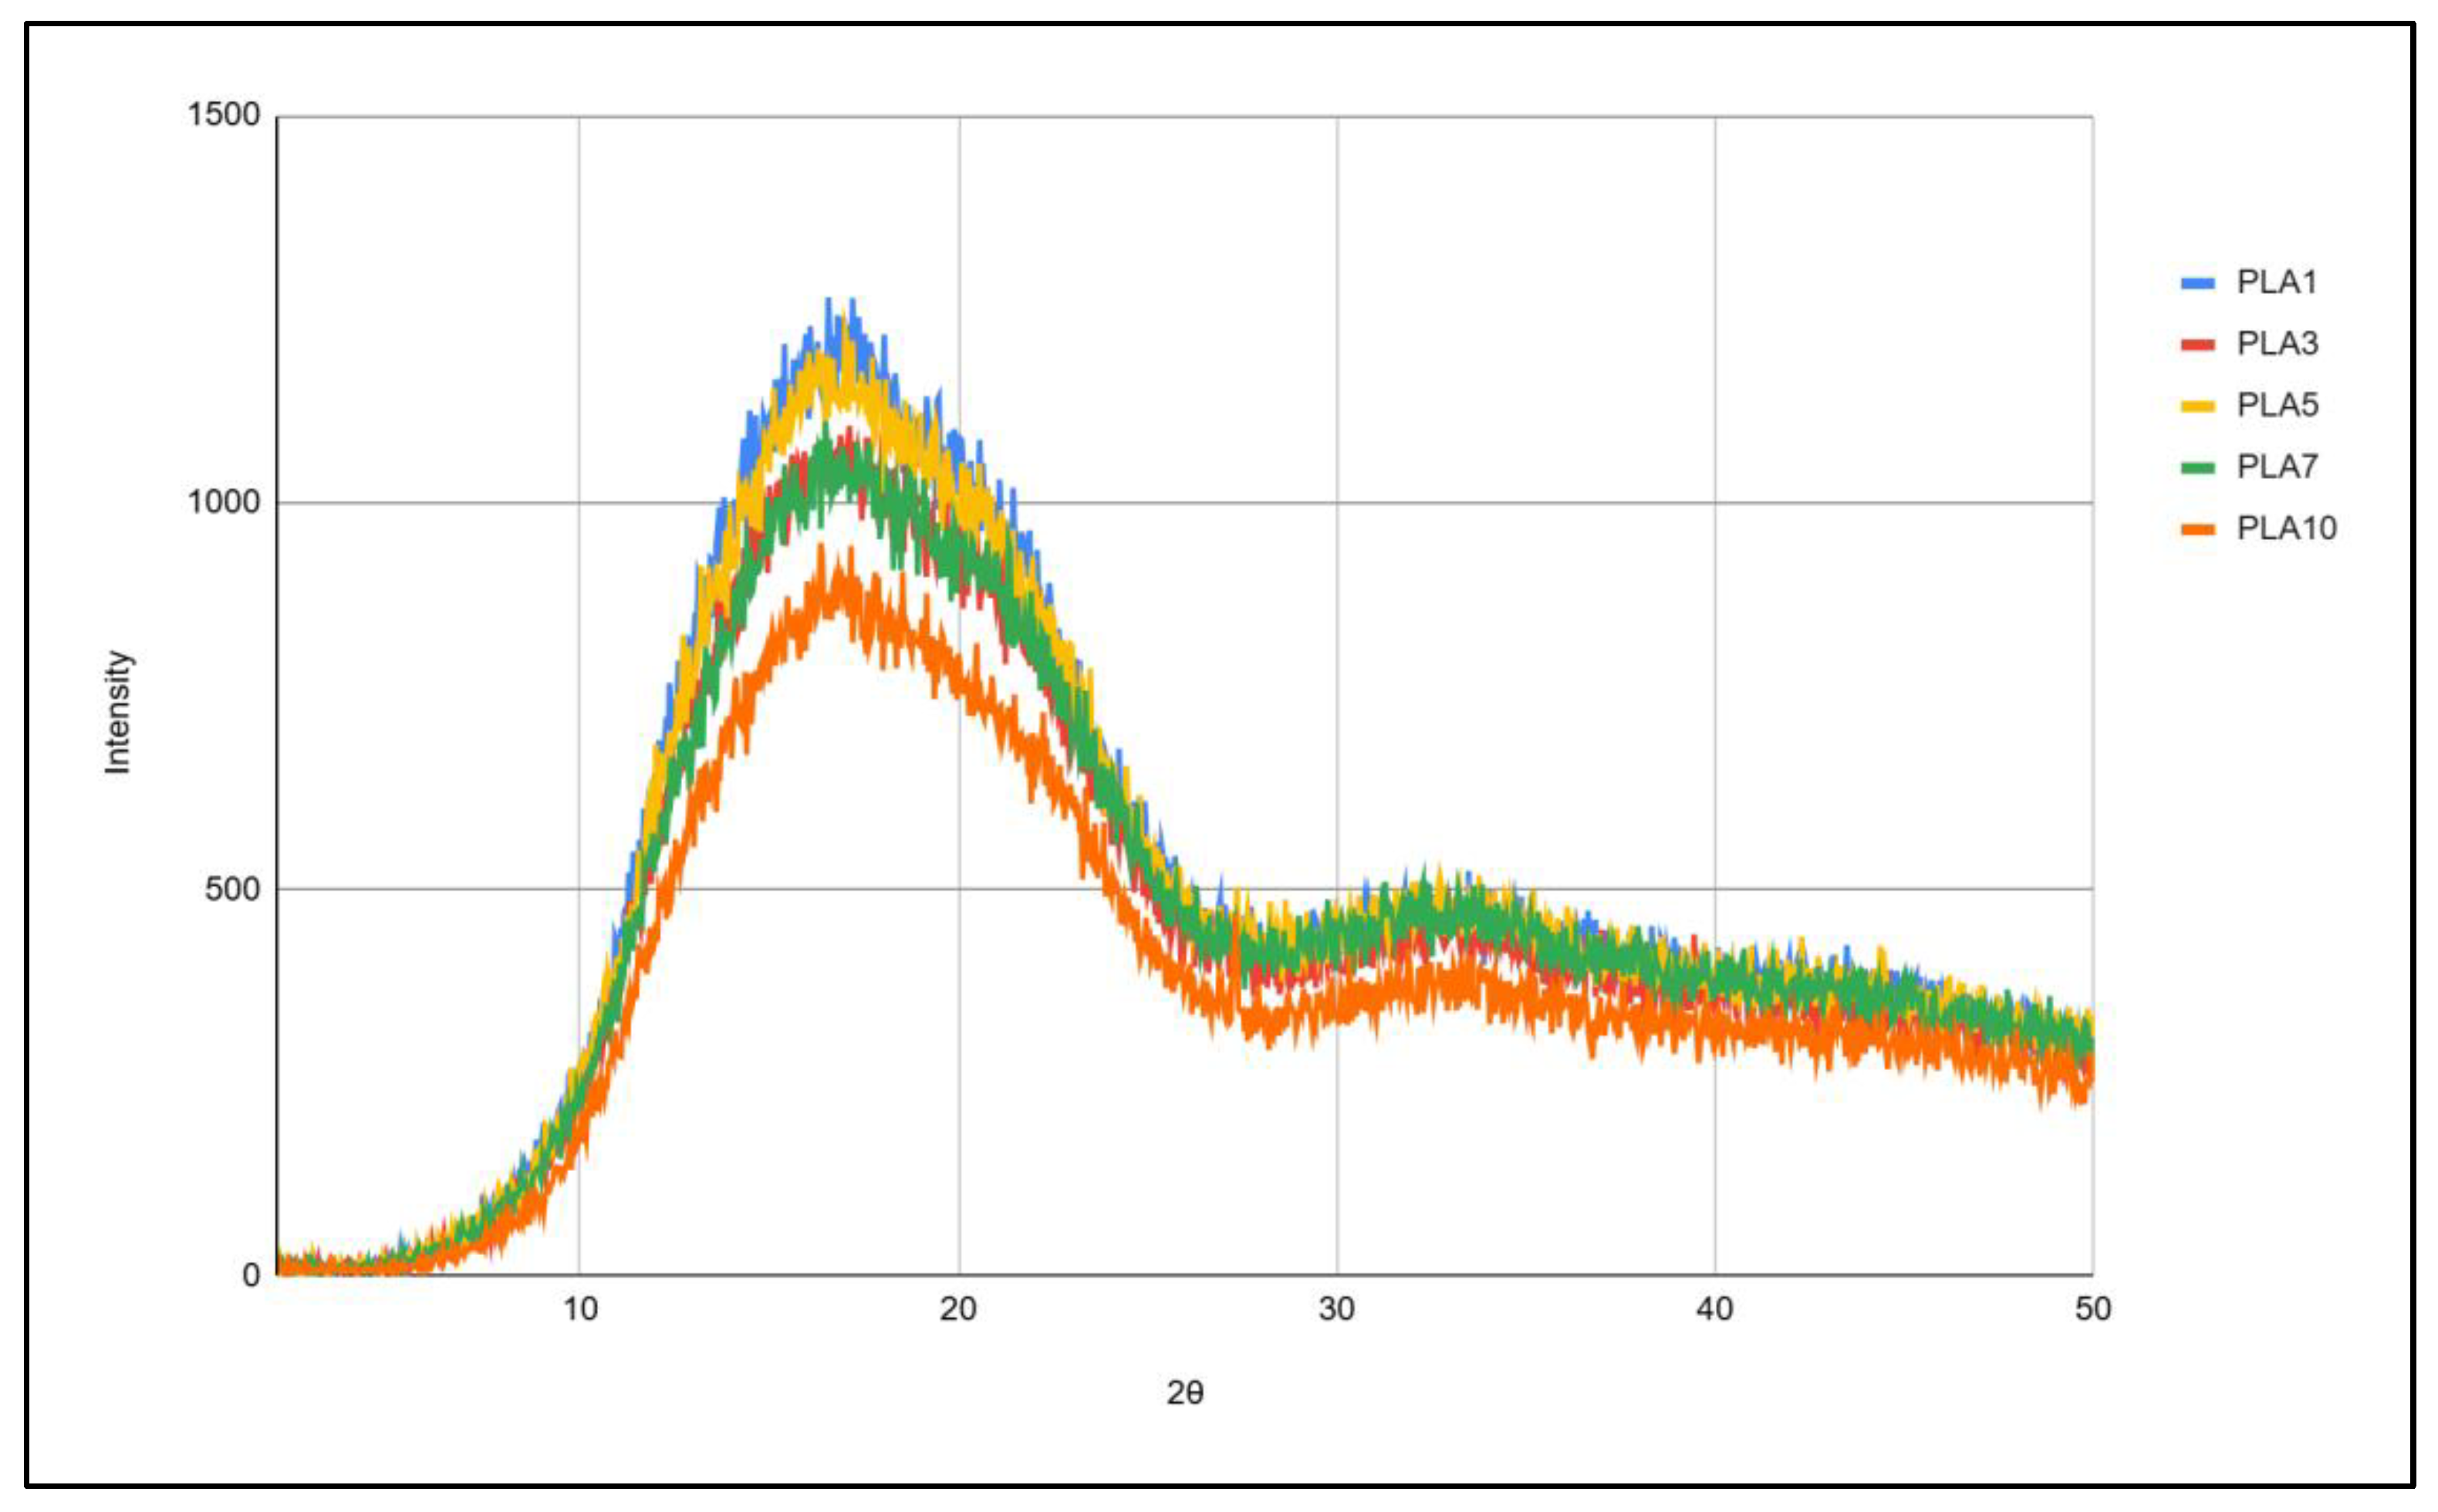
Figure 10.
Color change of the samples.
Further analysis of the color saturation, represented by the C* parameter, revealed an increase from 9.912±0.151 (PLA1) to 12.298±0.123 (PLA10). This indicates that the observed color changes are not merely shifts in tone, but also an increase in the vibrancy or intensity of the yellowish-green color. Overall, the colorimetric measurements strongly suggest that the repetitive thermal and mechanical stresses associated with multiple recycling cycles lead to a noticeable degradation of the PLA material, visually manifested as a darkening and a more intense yellowish-green discoloration. These optical changes are likely a direct consequence of polymer degradation mechanisms, such as chain scission and oxidation, which can alter the polymer’s light absorption and scattering properties.

Table 5.
Colorimetric values of examined samples.
| Sample | L* | a* | b* | c* | h* |
|---|---|---|---|---|---|
| PLA1 | 89.598±0.253 | -5.878±0.101 | 7.98±0,112 | 9.912±0.151 | 126.382±0.106 |
| PLA2 | 88.512±0.311 | -6.216±0.134 | 8.43±0.127 | 10.478±0.181 | 126.404±0.191 |
| PLA3 | 87.956±0.499 | -6.42±0.185 | 8.64±0.230 | 10.762±0.296 | 126.614±0.169 |
| PLA4 | 87.166±0.315 | -6.67±0.107 | 8.966±0.156 | 11.174±0.187 | 126.658±0.136 |
| PLA5 | 86.428±0.199 | -6.906±0.087 | 9.216±0.157 | 11.518±0.166 | 126.84±0.310 |
| PLA6 | 86.804±0.132 | -6.766±0.067 | 9.056±0.084 | 11.308±0.094 | 126.762±0.270 |
| PLA7 | 85.982±0.276 | -7.016±0.097 | 9.454±0.107 | 11.77±0.137 | 126.572±0.232 |
| PLA8 | 85.47±0.659 | -7.166±0.22 | 9.596±0.242 | 11.978±0.324 | 126.752±0.201 |
| PLA9 | 84.81±0.688 | -7.382±0.238 | 9.84±0.297 | 12.3±0.382 | 126.872±0.065 |
| PLA10 | 84.782±0.232 | -7.366±0.071 | 9.848±0.107 | 12.298±0.123 | 126.796±0.168 |
5. Conclusions
Within this work, it is shown that multiple mechanical recycling of pre-consumer PLA waste, consisting of 10 cycles of injection molding and milling, does not significantly change the properties of the resulting PLA compared to the starting material without the use of additives or virgin material. An increase in MFI, which indicates a decrease in molecular weight, does not significantly key mechanical properties such as tensile strength, flexural strength, and modulus, as well as thermal properties like Tg, Tm, and degradation temperature, remained stable across cycles. This suggests that multiple mechanical reprocessings do not significantly impair the material’s functional performance, especially for non-critical applications. The main drawback of recycling is the color change that develops from the first to the tenth cycle, making the material more yellow and dull. This color change, driven by polymer degradation mechanisms such as chain scission and oxidation, may limit the reuse of material in aesthetically sensitive applications unless color stabilization strategies are introduced. Overall, these findings reinforce the feasibility of closed-loop mechanical recycling of PLA industrial waste for sustainable material management, providing valuable insights for advancing circular economy practices in the processing of bioplastics.
Author Contributions
Conceptualization, A.N. and S.B..; methodology, A.N., B.P., S.B.; formal analysis, R.L. and A.N.; investigation, A.N., R.L., S.B., B.N. and B.P.; resources, B.P., S.B., B.N.; data curation, A.N. and R.L..; writing—original draft preparation, A.N. and R.L.; writing—review and editing, B.P., S.B. and B.N.; visualization, A.N.; supervision, B.P. and S.B.; project administration, A.N.; funding acquisition, A.N. All authors have read and agreed to the published version of the manuscript.
Funding
This research was co-funded by COST Action CA19124, STSM grant number E-COST-GRANT-CA19124-95e3fc77”, Autonomous Province of Vojvodina, Provincial Secretary for High Education and Research no. 003060425 2024 09418 003 000 000 001 04 002 and Ministry of Science, Technological Development and Innovation of Republic of Serbia programs number 451-03-136/2025-03/200134 and 451-03-137/2025-03/200134.
Institutional Review Board Statement
Not relevant.
Data Availability Statement
The Dataset is available on request from the authors (alexm@uns.ac.rs, rebeka.lorber@ftpo.eu).
Conflicts of Interest
The authors declare no conflicts of interest.
Abbreviations
The following abbreviations are used in this manuscript:
| PLA | Poly(lactide) |
| EoL | End-of-Life |
| MFI | Melt flow index |
| DSC | Differential scanning calorimetry |
| Tc | Crystallization temperature |
| ΔHc | Crystallization enthalpy |
| Tm | Melting temperature |
| ΔHm | Melting enthalpy |
| Xc | Relative crystallinity |
| ΔHf | Metling enthalpy of 100% crystalline PLA |
| TGA | Thermo-gravimetric analysis |
| DMA | Dynamic-mechanical analysis |
| FTIR | Infrared spectroscopy with Fourrier transformation |
| XRD | X-ray diffraction |
| Td1 | Degradation temperature |
| Tg | Glass transition temperature |
References
- Farah, S.; Anderson, D.G.; Langer, R. Physical and mechanical properties of PLA, and their functions in widespread applications—a comprehensive review. Adv. Drug Deliv. Rev. 2016, 107, 367–392. [CrossRef]
- K. Jim Jem; Bowen, T. The development and challenges of poly (lactic acid) and poly (glycolic acid). Adv. Ind. and Eng. Poly. Res. 2020, 3 (2), 60-70. [CrossRef]
- Lambert, S.; Wagner, M. Environmental sustainability of bio-based and biodegradable plastics: The road ahead. Chem. Soc. Rev., 2017,46, 6855-6871. [CrossRef]
- European Bioplastics. Market Development Update 2024. Available online: https://www.european-bioplastics.org/market/ (accessed on 08.07.2025.).
- Hajilou, N.; Mostafayi, S.S.; Yarin, A.L.; Shokuhfar, T. A Comparative Review on Biodegradation of Poly(Lactic Acid) in Soil, Compost, Water, and Wastewater Environments: Incorporating Mathematical Modeling Perspectives. AppliedChem 2025, 5, 1. [CrossRef]
- Maragkaki, A.; Malliaros, N.G.; Sampathianakis, I.; Lolos, T.; Tsompanidis, C.; Manios, T. Evaluation of Biodegradability of Polylactic Acid and Compostable Bags from Food Waste under Industrial Composting. Sustainability 2023, 15, 15963. [CrossRef]
- Hasan, M.R.; Davies, I.J.; Pramanik, A.; John, M.; Biswas, W.K. Recycling Post-Consumed Polylactic Acid Waste Through Three-Dimensional Printing: Technical vs. Resource Efficiency Benefits. Sustainability, 2025, 17, 2484. [CrossRef]
- Aryan, V.; Maga, D.; Majgaonkar, P.; Hanich, R. Valorisation of polylactic acid (PLA) waste: A comparative life cycle assessment of various solvent-based chemical recycling technologies. Resour. Conserv. Recycl., 2021, 172, 105670. [CrossRef]
- Cosate de Andrade, M.F.; Souza, P.M.S.; Cavalett, O.; Morales, A.R. Life Cycle Assessment of Poly(Lactic Acid) (PLA): Comparison Between Chemical Recycling, Mechanical Recycling and Composting. J. Polym. Environ. 2016, 24, 372–384. [CrossRef]
- F.R. Beltrán, V. Lorenzo, M.U. de la Orden, J. Martínez-Urreaga. Effect of different mechanical recycling processes on the hydrolytic degradation of poly(l-lactic acid). Poly. Deg. and Stab., 2016, 133, 339-348. [CrossRef]
- T. Ramos-Hernández, J. R. Robledo-Ortíz, M. E. González-López, A. S. M. del Campo, R. González-Núñez, D. Rodrigue, A. A. Pérez Fonseca, J. Appl. Polym. Sci., 2023, 140, e53759. [CrossRef]
- McKeown, P.; Jones, M.D. The Chemical Recycling of PLA: A Review. Sustain. Chem. 2020, 1, 1-22. [CrossRef]
- Piemonte, V., Sabatini, S. & Gironi, F. Chemical Recycling of PLA: A Great Opportunity Towards the Sustainable Development?. J Polym Environ 21, 640–647 (2013). [CrossRef]
- Danyluk, C.; Erickson, R.; Burrows, S.; Auras, R. Industrial Composting of Poly(Lactic Acid) Bottles. J. Test. Eval. 2010, 38, 717–723. [CrossRef]
- Musioł, M.; Sikorska, W.; Adamus, G.; Janeczek, H.; Richert, J.; Malinowski, R.; Jiang, G.; Kowalczuk, M. Forensic engineering of advanced polymeric materials. Part III—Biodegradation of thermoformed rigid PLA packaging under industrial composting conditions. Waste Manag. 2016, 52, 69–76. [CrossRef]
- Sun, C.; Wei, S.; Tan, H.; Huang, Y.; Zhang, Y. Progress in upcycling polylactic acid waste as an alternative carbon source: A review. Chem. Eng. J. 2022, 446, 136881. [CrossRef]
- Maga, D.; Hiebel, M.; Thonemann, N. Life cycle assessment of recycling options for polylactic acid. Resour. Conserv. Recycl. 2019, 149, 86–96. [CrossRef]
- Hasan, M.R.; Davies, I.J.; Pramanik, A.; John, M.; Biswas, W.K. Potential of recycled PLA in 3D printing: A review. Sustain. Manuf. Serv. Econ. 2024, 3, 100020. [CrossRef]
- Finnerty, J.; Rowe, S.; Howard, T.; Connolly, S.; Doran, C.; Devine, D.M.; Gately, N.M.; Chyzna, V.; Portela, A.; Bezerra, G.S.N.; et al. Effect of Mechanical Recycling on the Mechanical Properties of PLA-Based Natural Fiber-Reinforced Composites. J. Compos. Sci. 2023, 7, 141. [CrossRef]
- Agüero, A.; Morcillo, M.d.C.; Quiles-Carrillo, L.; Balart, R.; Boronat, T.; Lascano, D.; Torres-Giner, S.; Fenollar, O. Study of the Influence of the Reprocessing Cycles on the Final Properties of Polylactide Pieces Obtained by Injection Molding. Polymers 2019, 11, 1908. [CrossRef]
- Fiorio, R.; Barone, A.C.; De Cillis, F.; Palumbo, M.; Righetti, M.C. Stabilization of recycled polylactic acid with chain extenders: Effect of reprocessing cycles. Polymers 2022, 14, 3522. [CrossRef]
- Beltrán, F.R.; Infante, C.; Ulagares de la Orden, M.; Martínez Urreaga, J. Mechanical recycling of poly(lactic acid): Evaluation of a chain extender and a peroxide as additives for upgrading the recycled plastic. J. Clean. Prod. 2019, 219, 46–56. [CrossRef]
- Hasan, M.R.; Davies, I.J.; Pramanik, A.; John, M.; Biswas, W.K. Recycling Post-Consumed Polylactic Acid Waste Through Three-Dimensional Printing: Technical vs. Resource Efficiency Benefits. Sustainability 2025, 17, 2484. [CrossRef]
- Sambudi, N.S.; Lin, W.Y.; Harun, N.Y.; Mutiari, D. Modification of Poly(lactic acid) with Orange Peel Powder as Biodegradable Composite. Polymers 2022, 14, 4126. [CrossRef]
- Puchalski, M.; Kwolek, S.; Szparaga, G.; Chrzanowski, M.; Krucińska, I. Investigation of the Influence of PLA Molecular Structure on the Crystalline Forms (α’ and α) and Mechanical Properties of Wet Spinning Fibres. Polymers 2017, 9, 18. [CrossRef]
Figure 1.
MFI (blue line) and viscosity (red line) of recycled PLA.
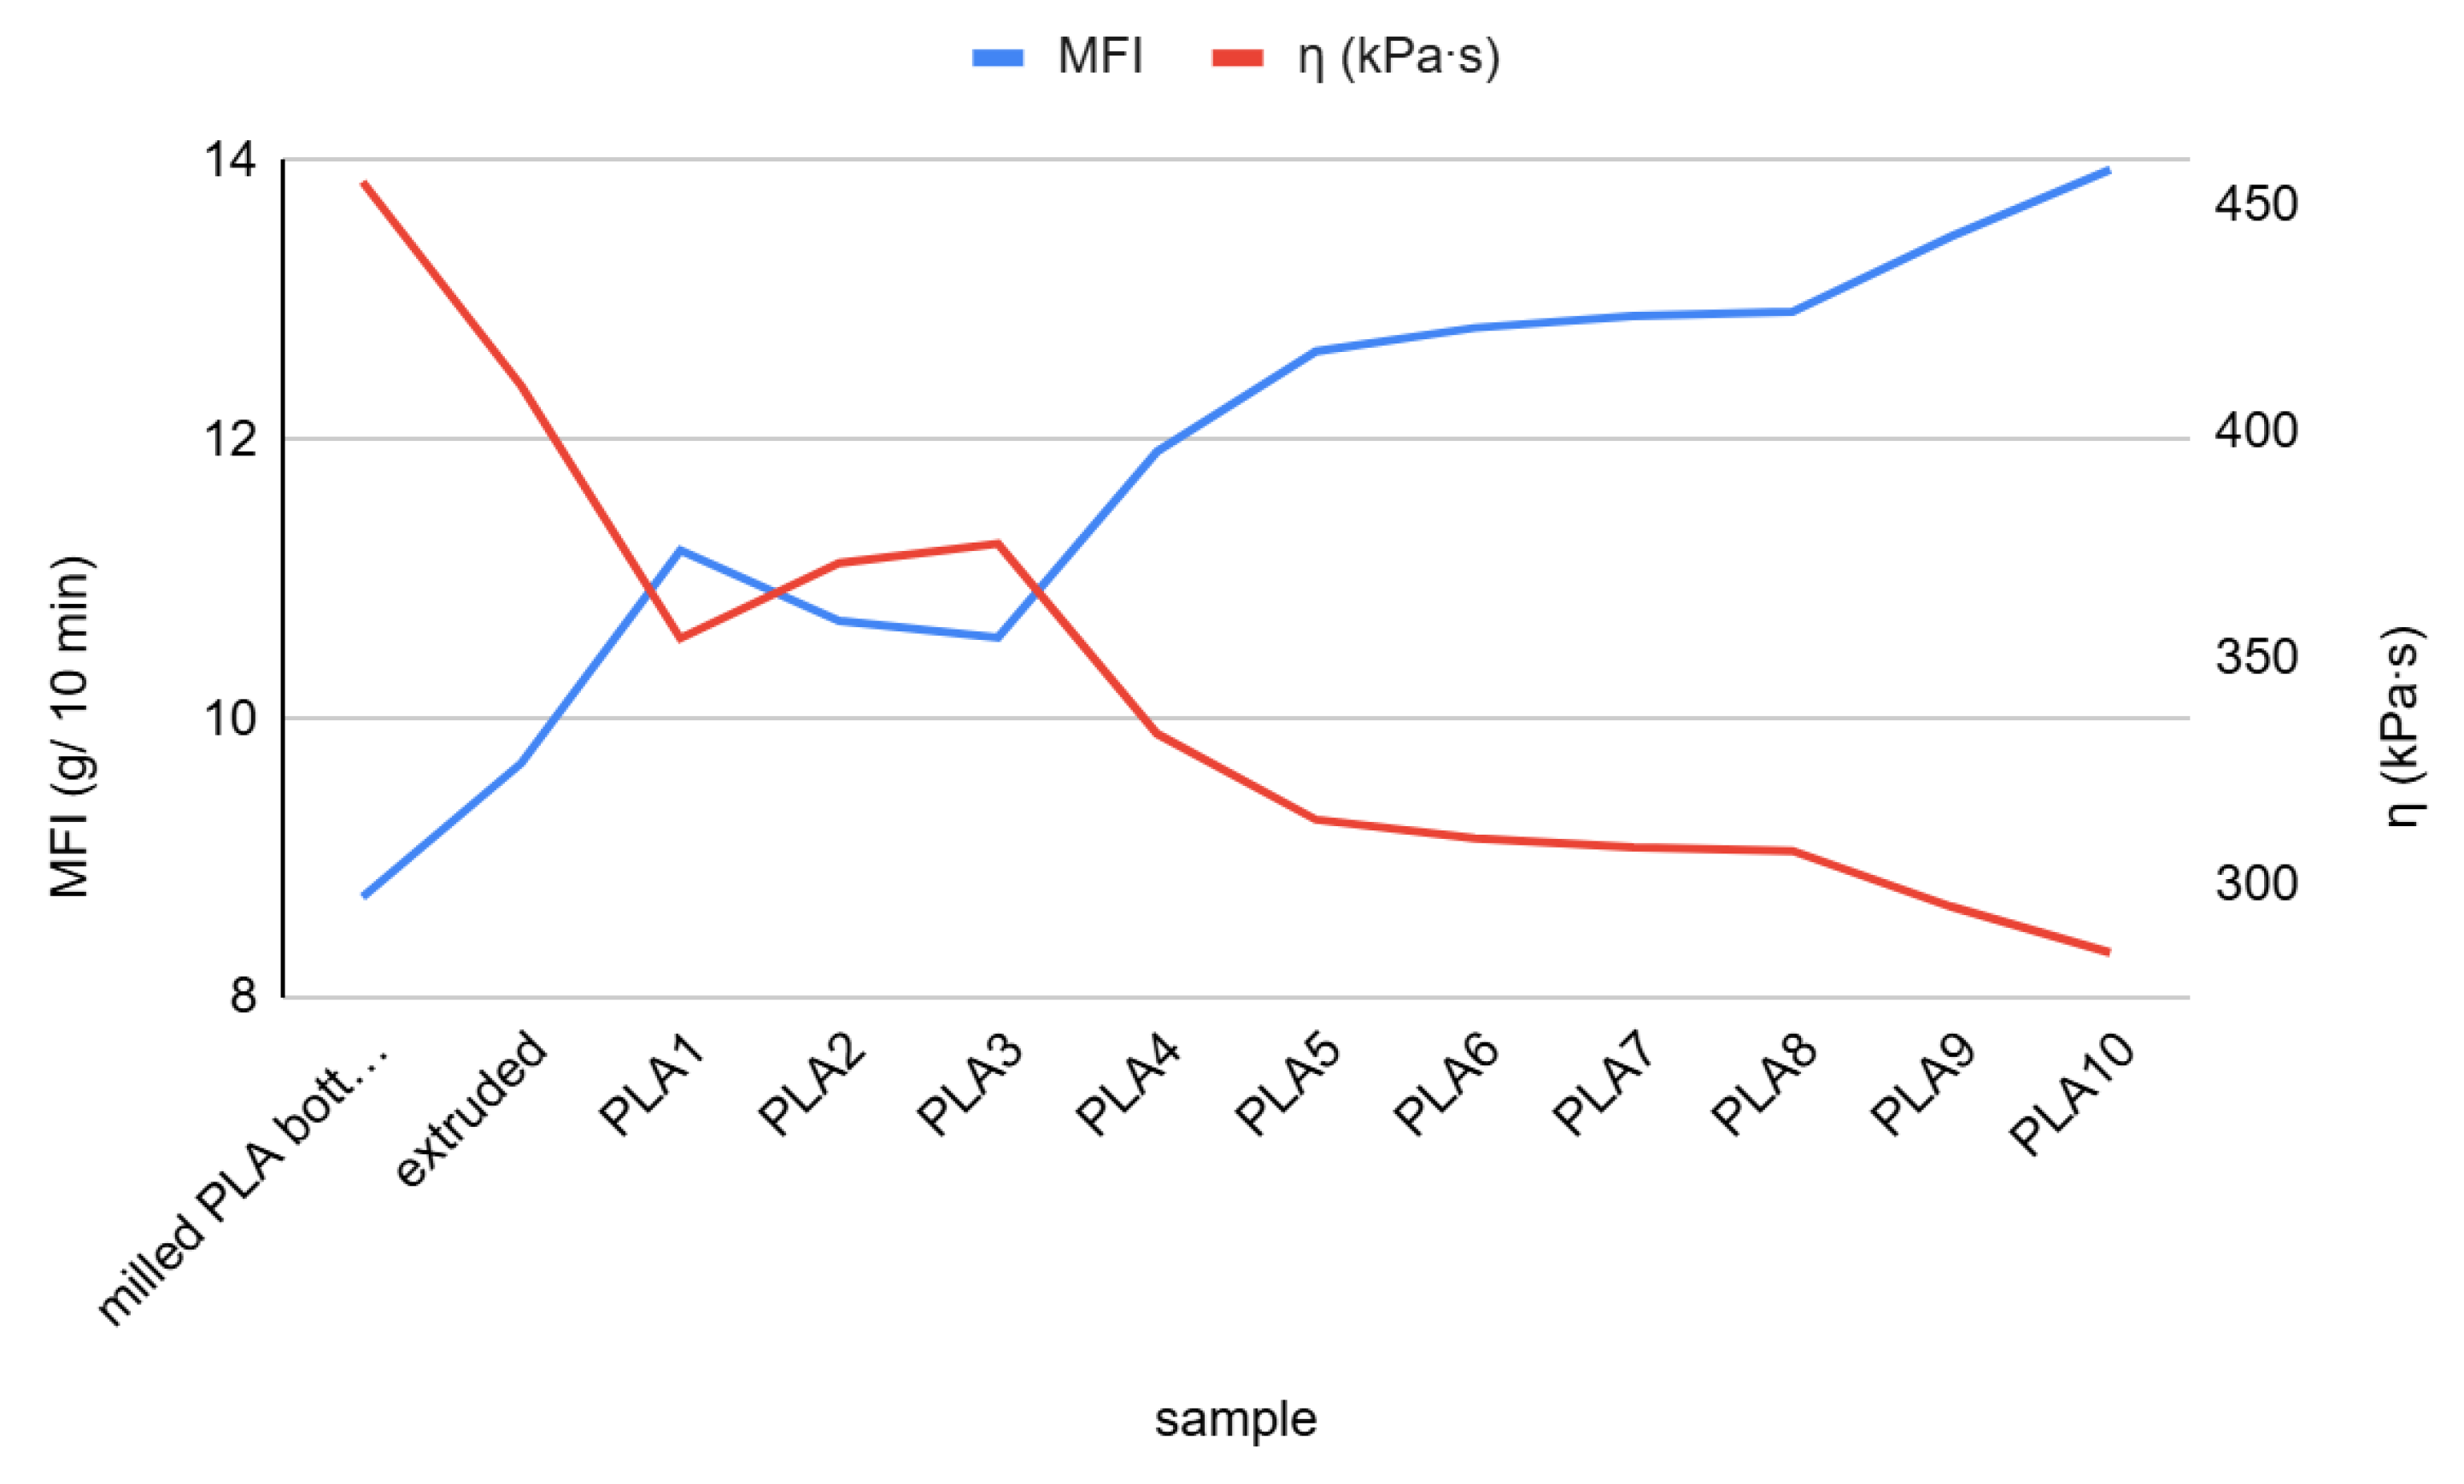
Figure 2.
Thermograms of the second heating cycle.
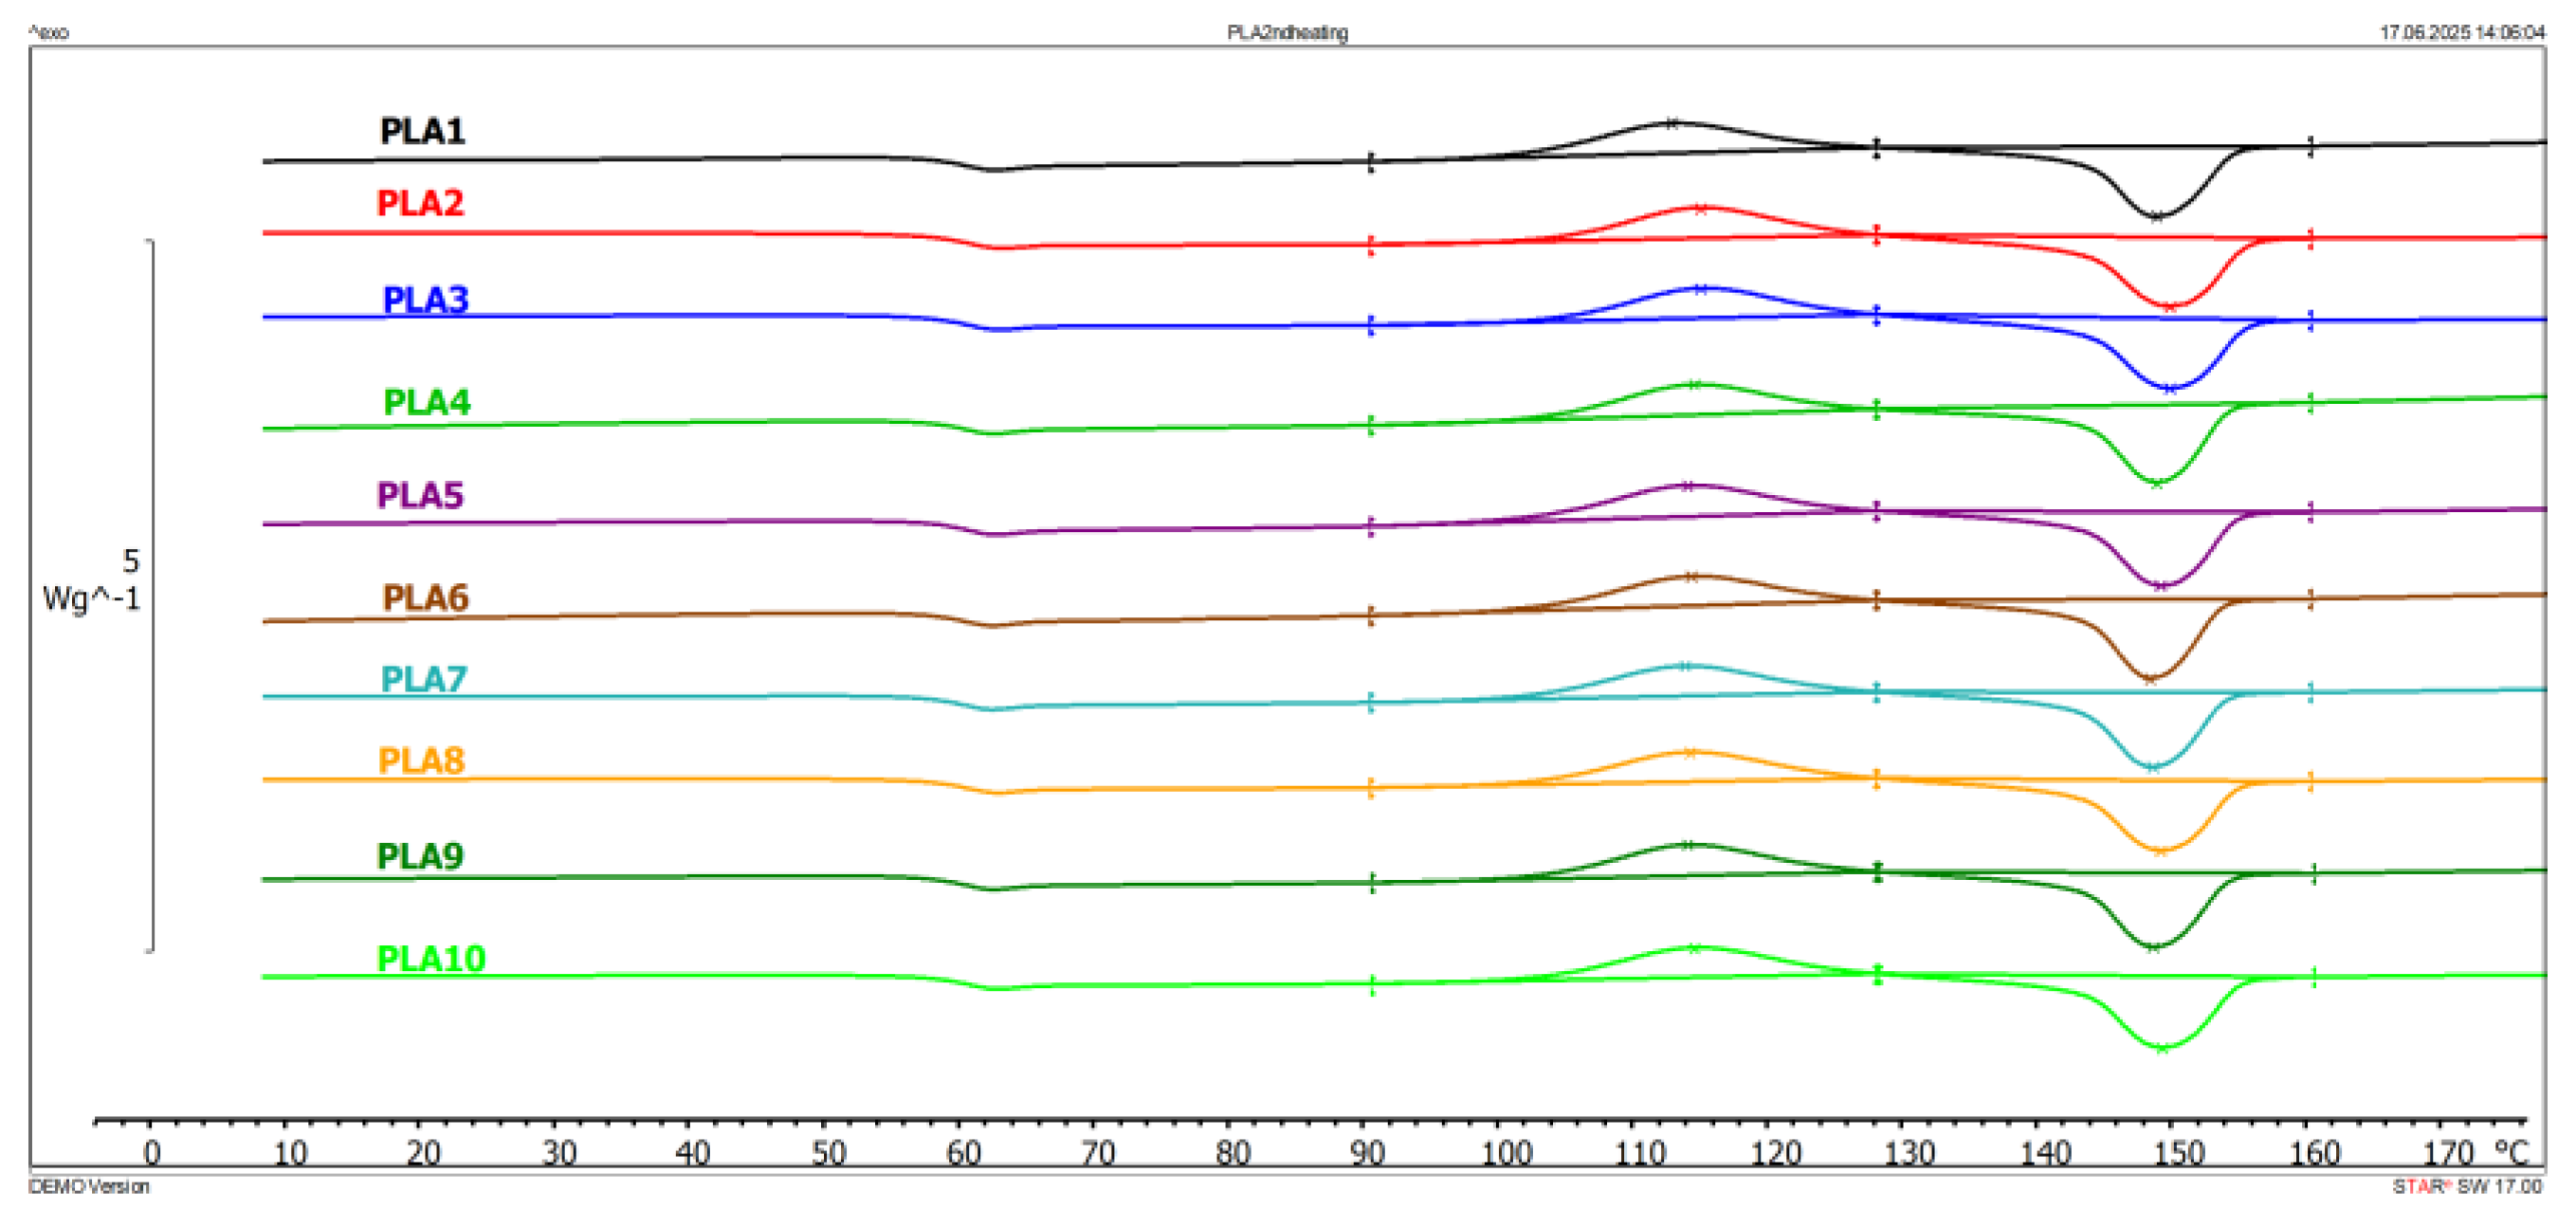
Figure 3.
DMA curves of selected samples.
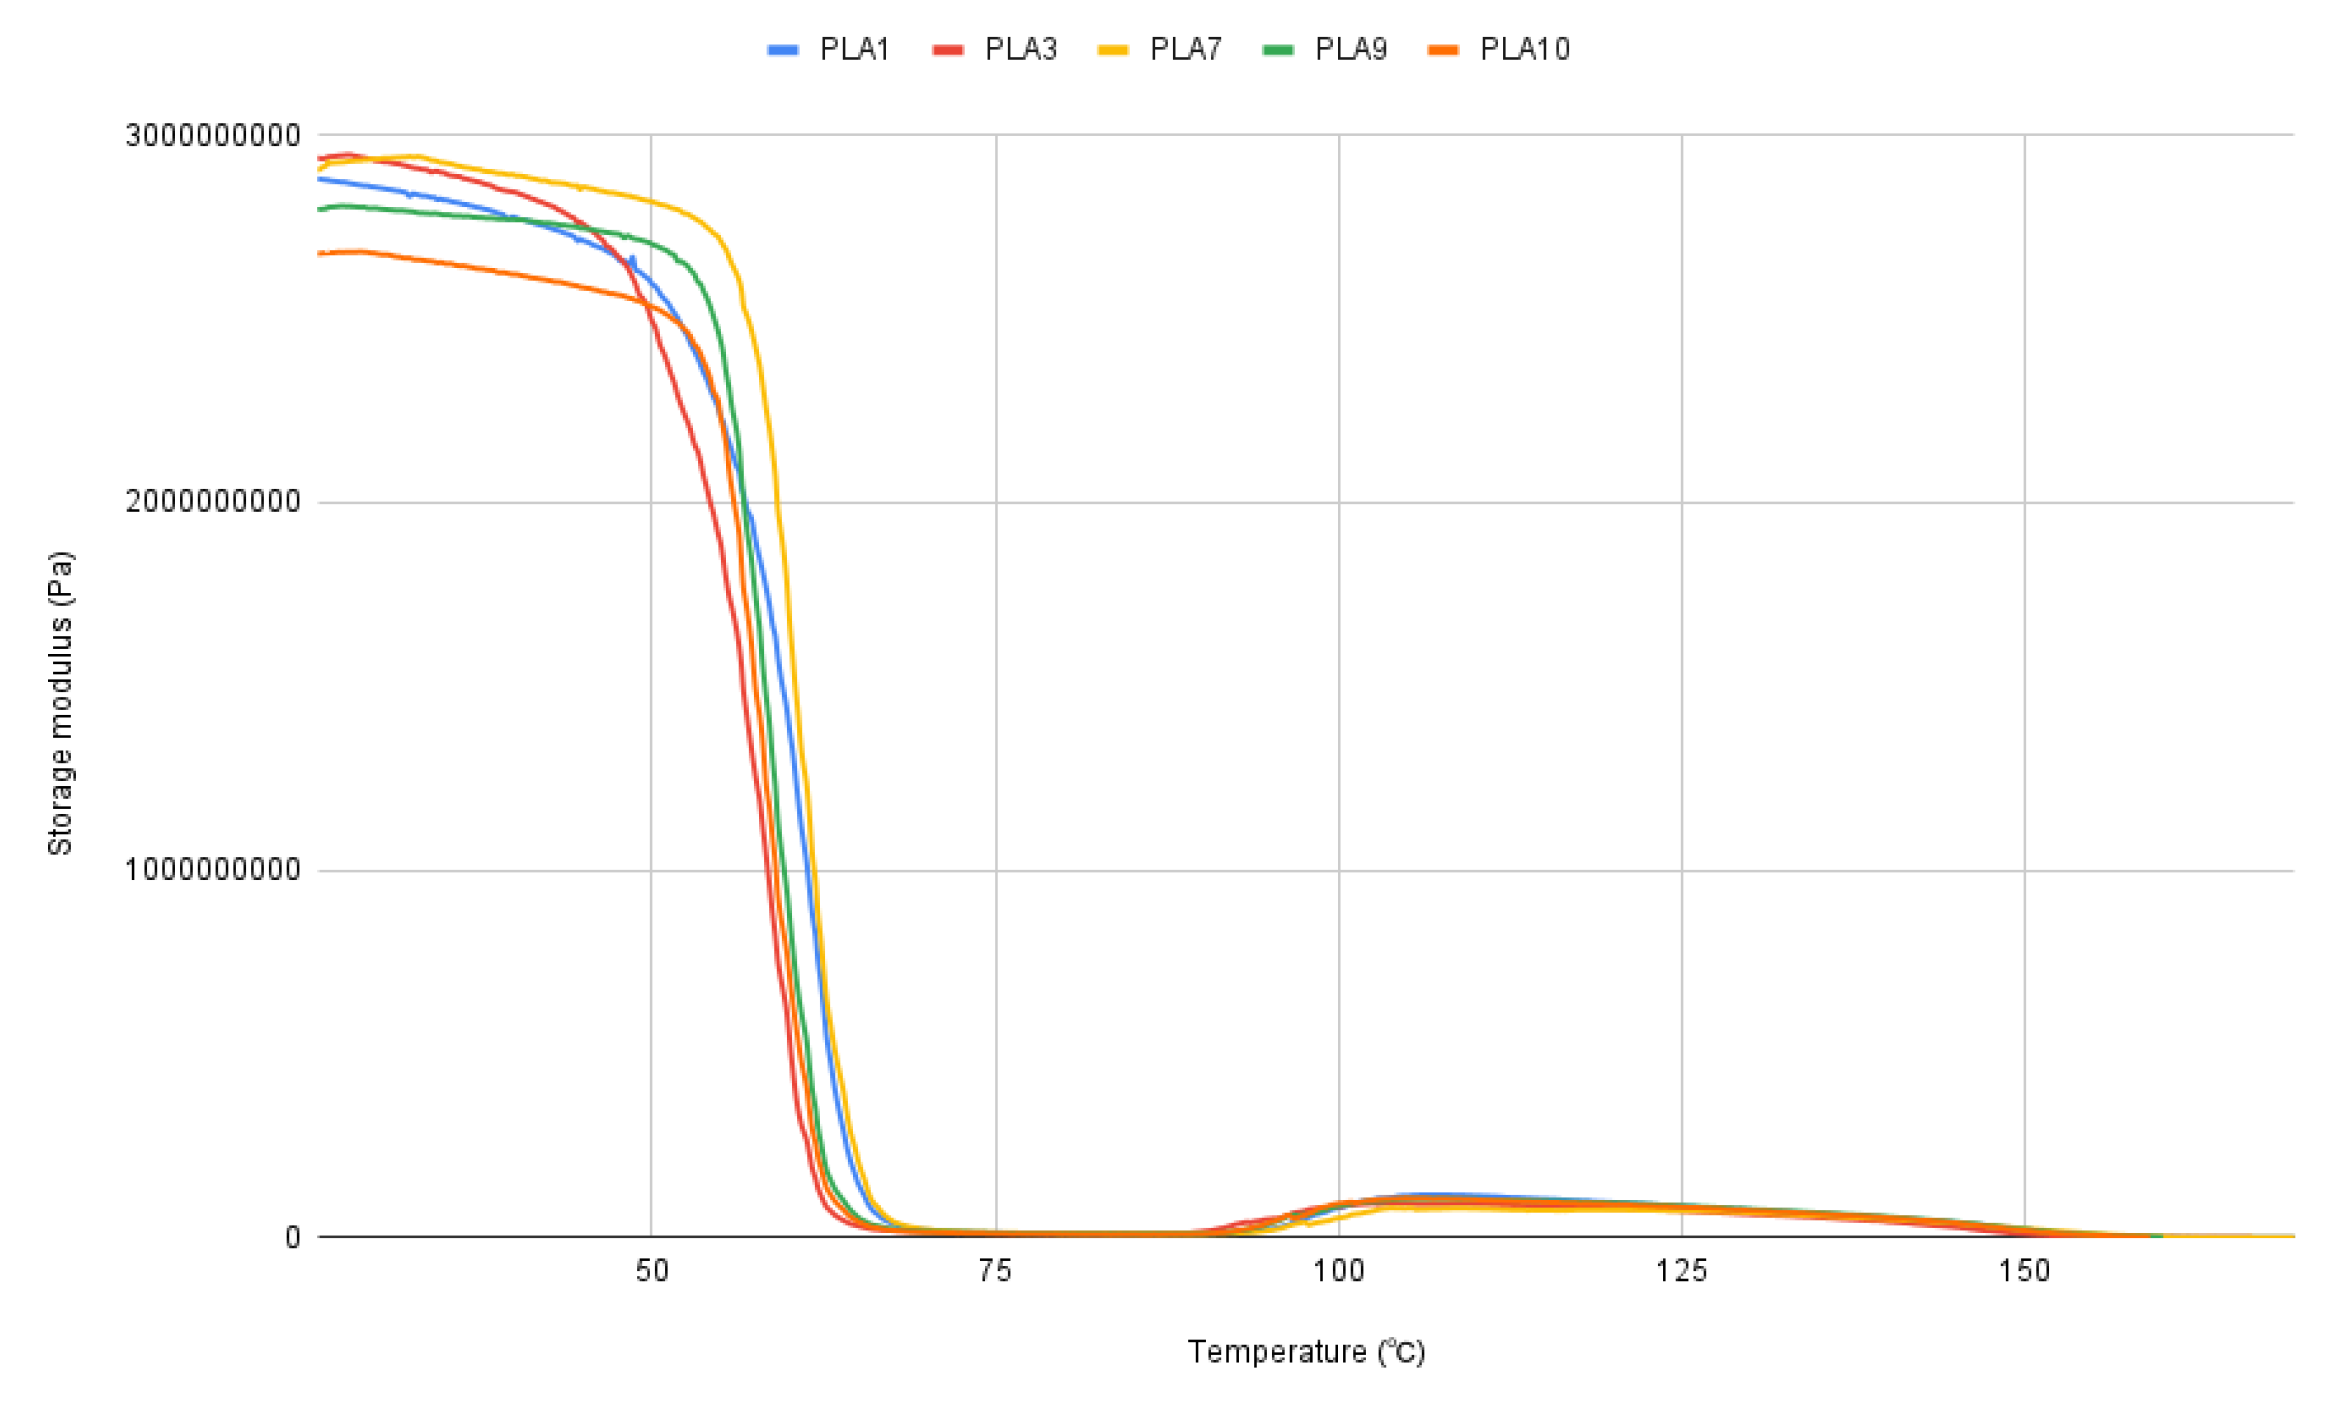
Figure 4.
Impact test results for notched (green) and unnotched (orange) bars.
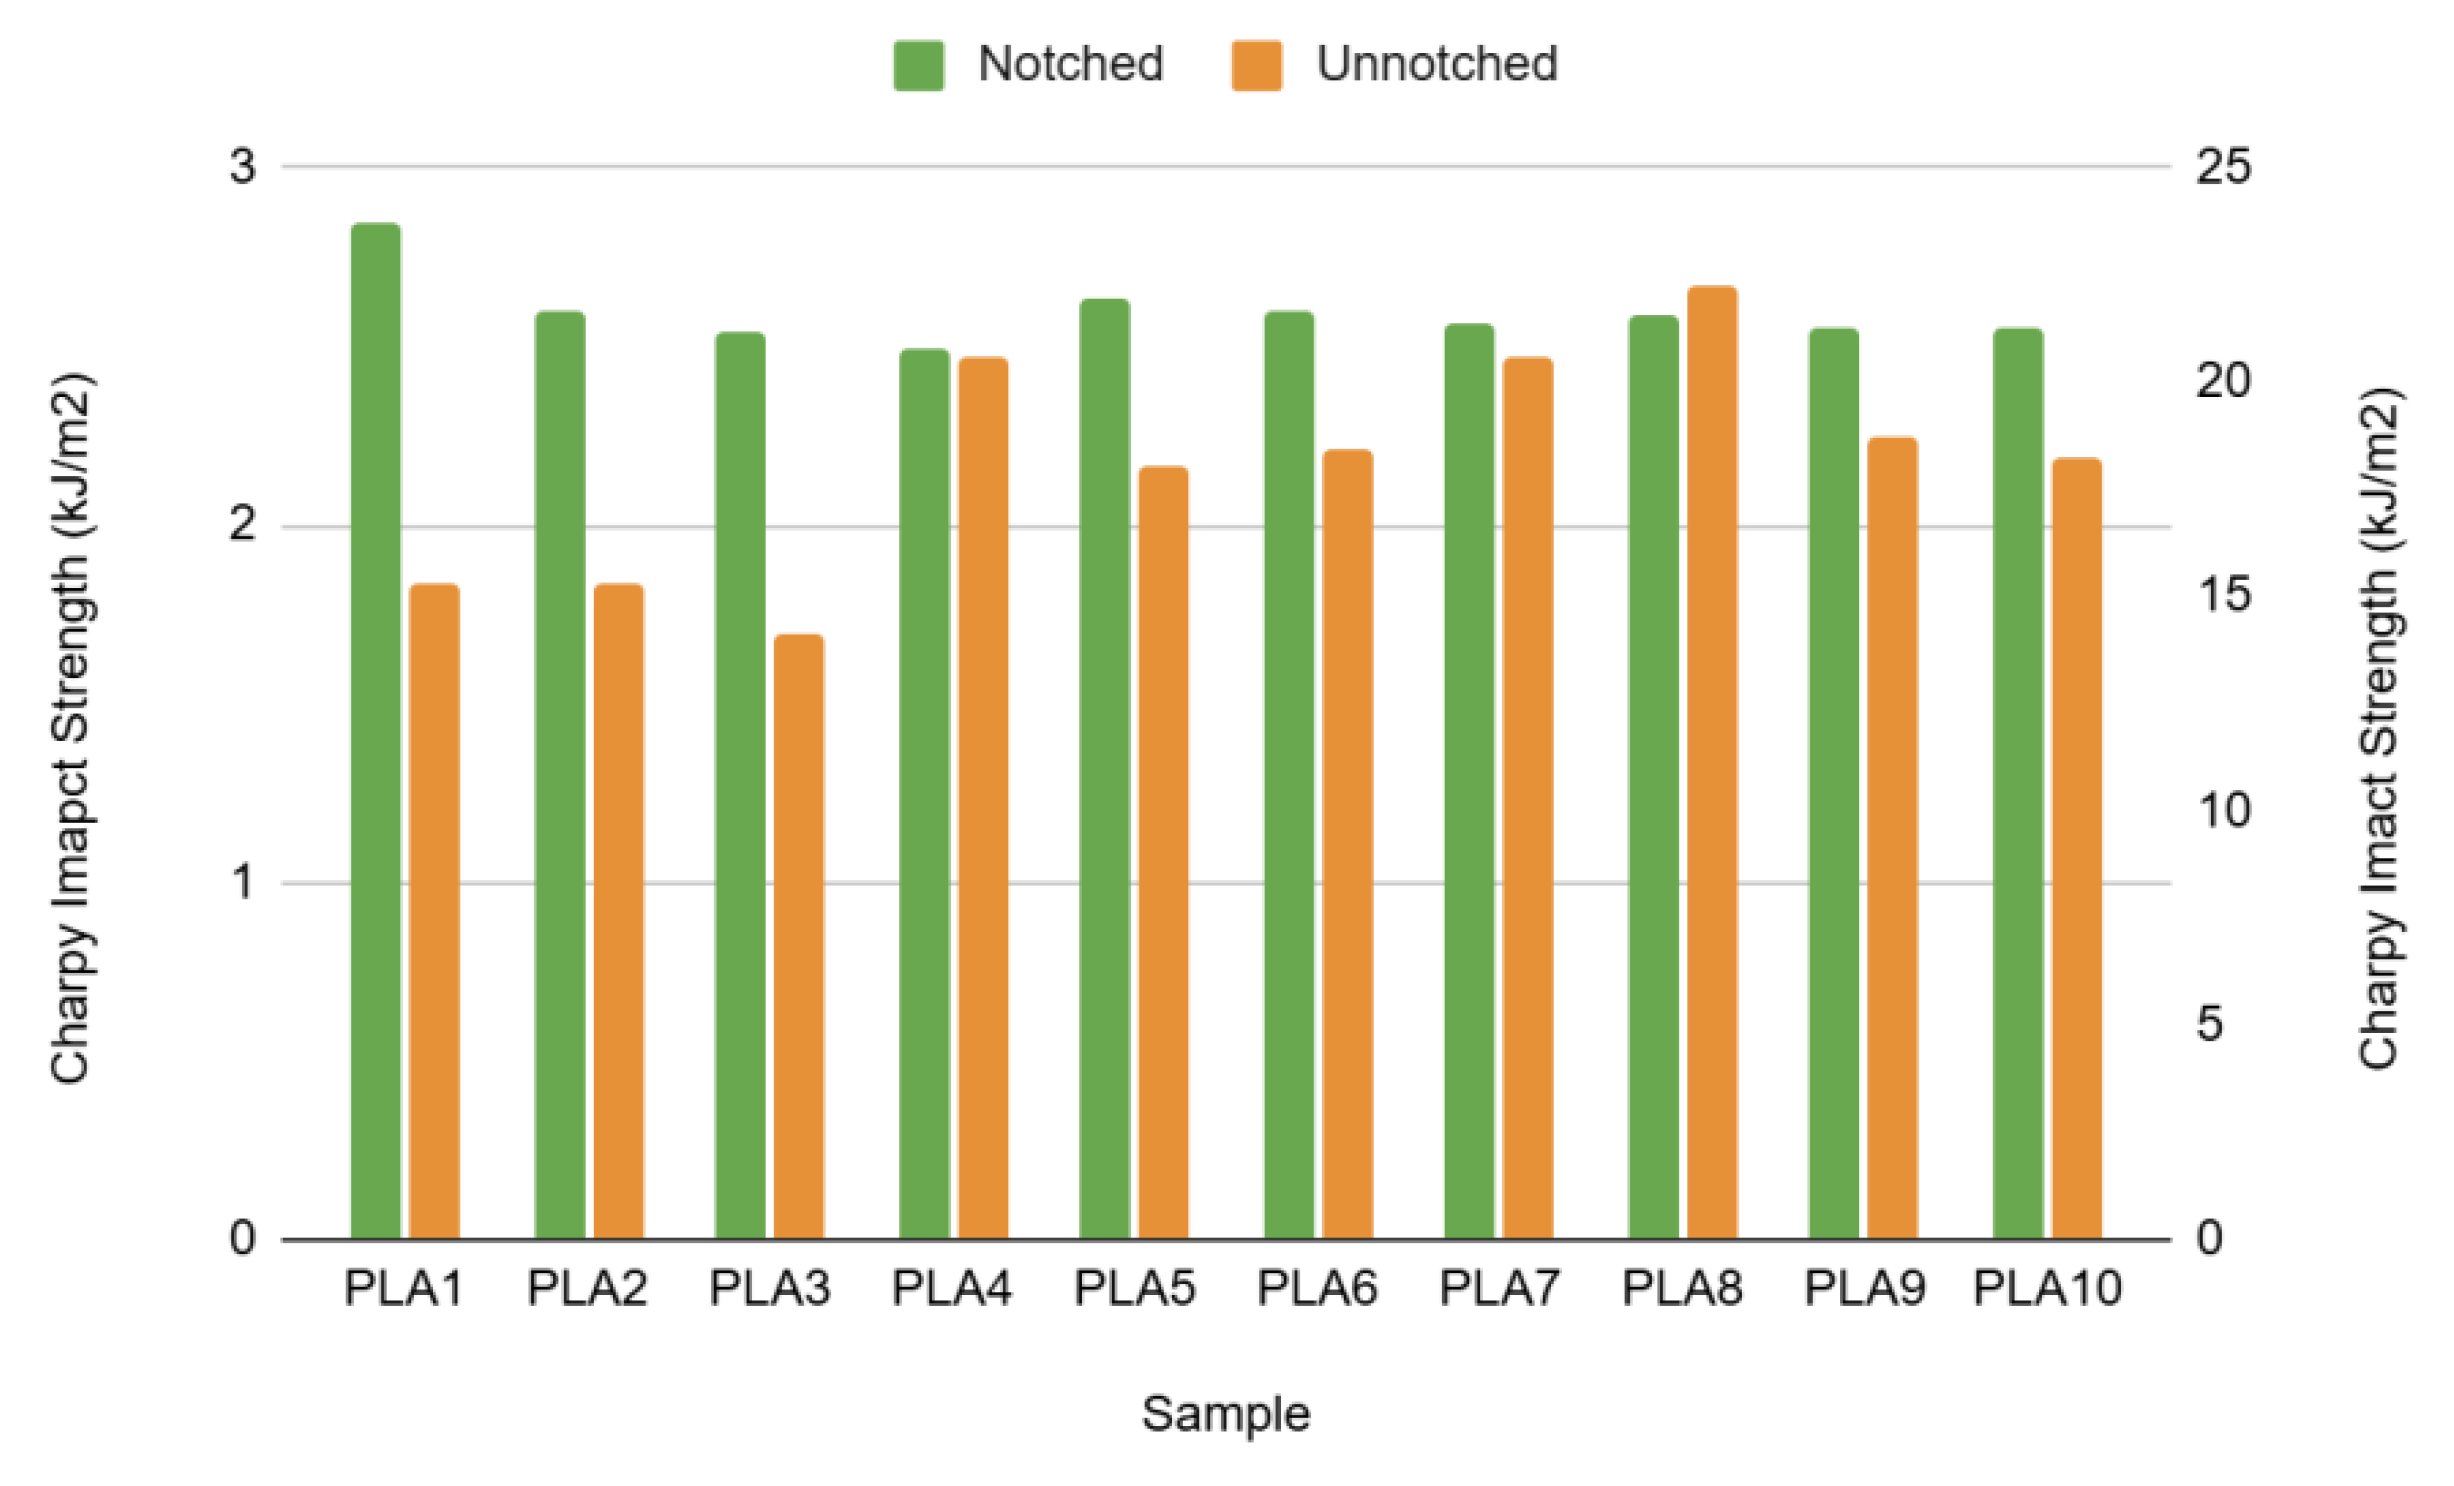
Figure 5.
FTIR spectra of selected samples.
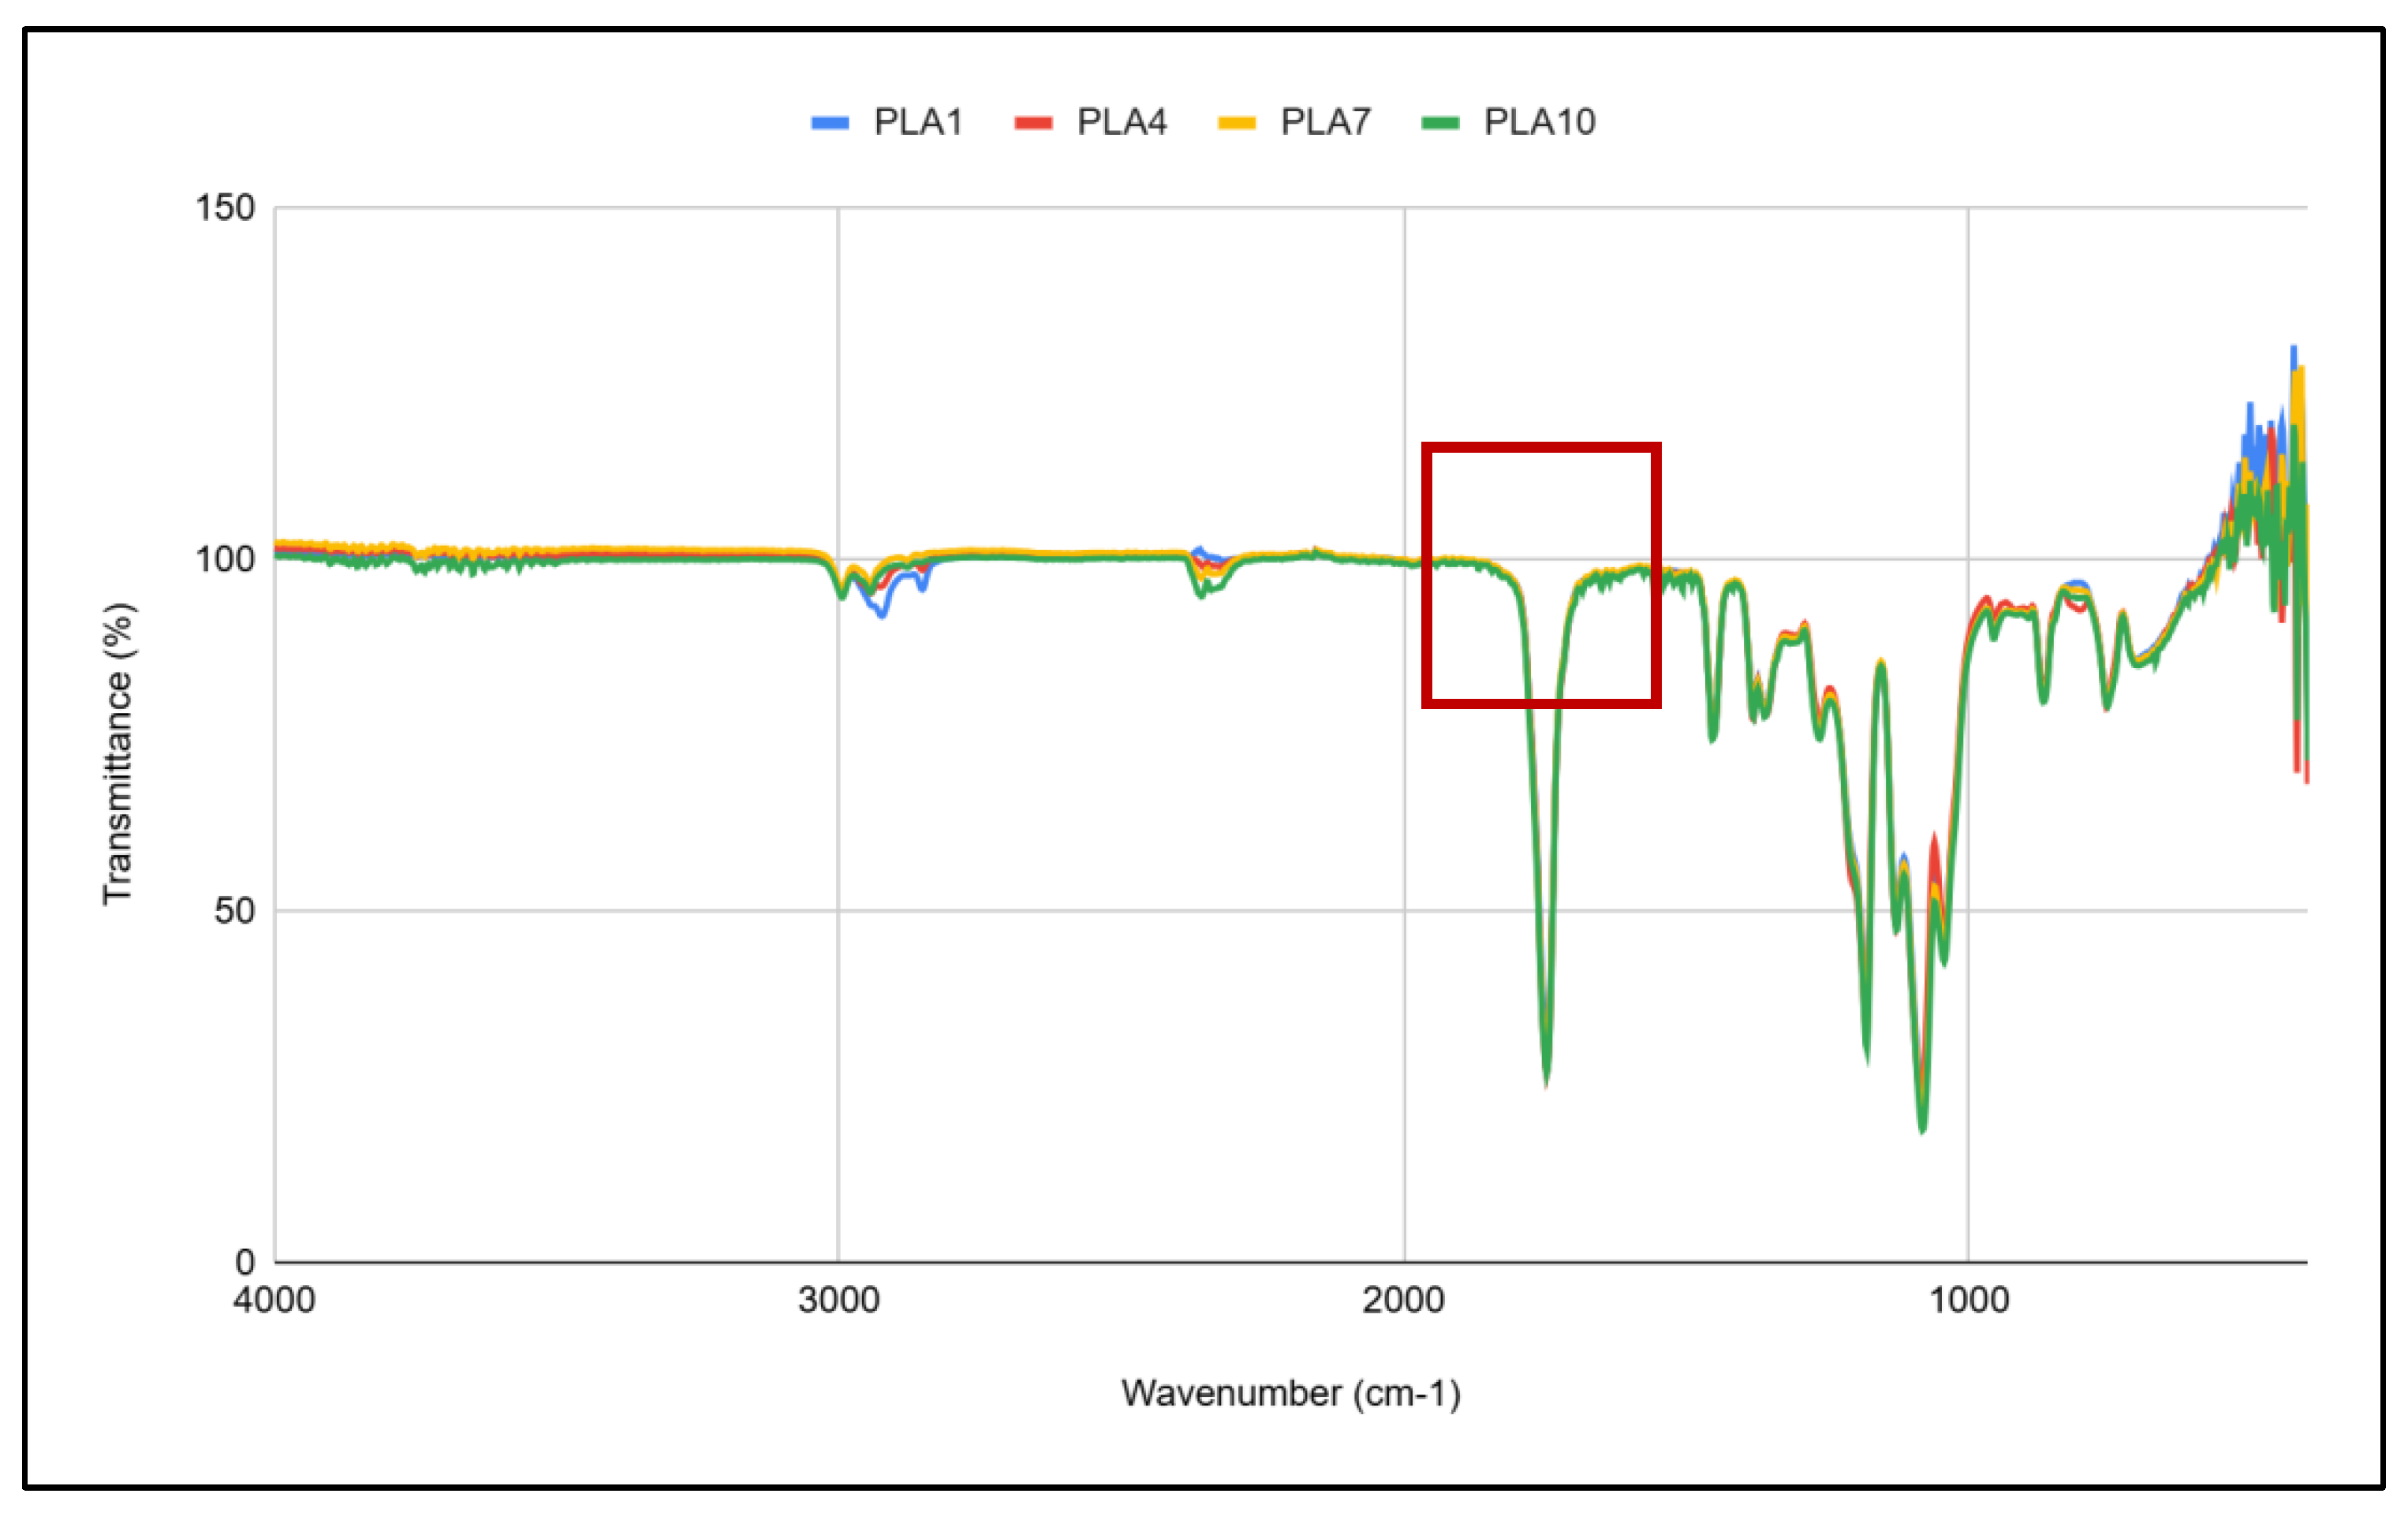
Figure 6.
Selection of FTIR peaks.
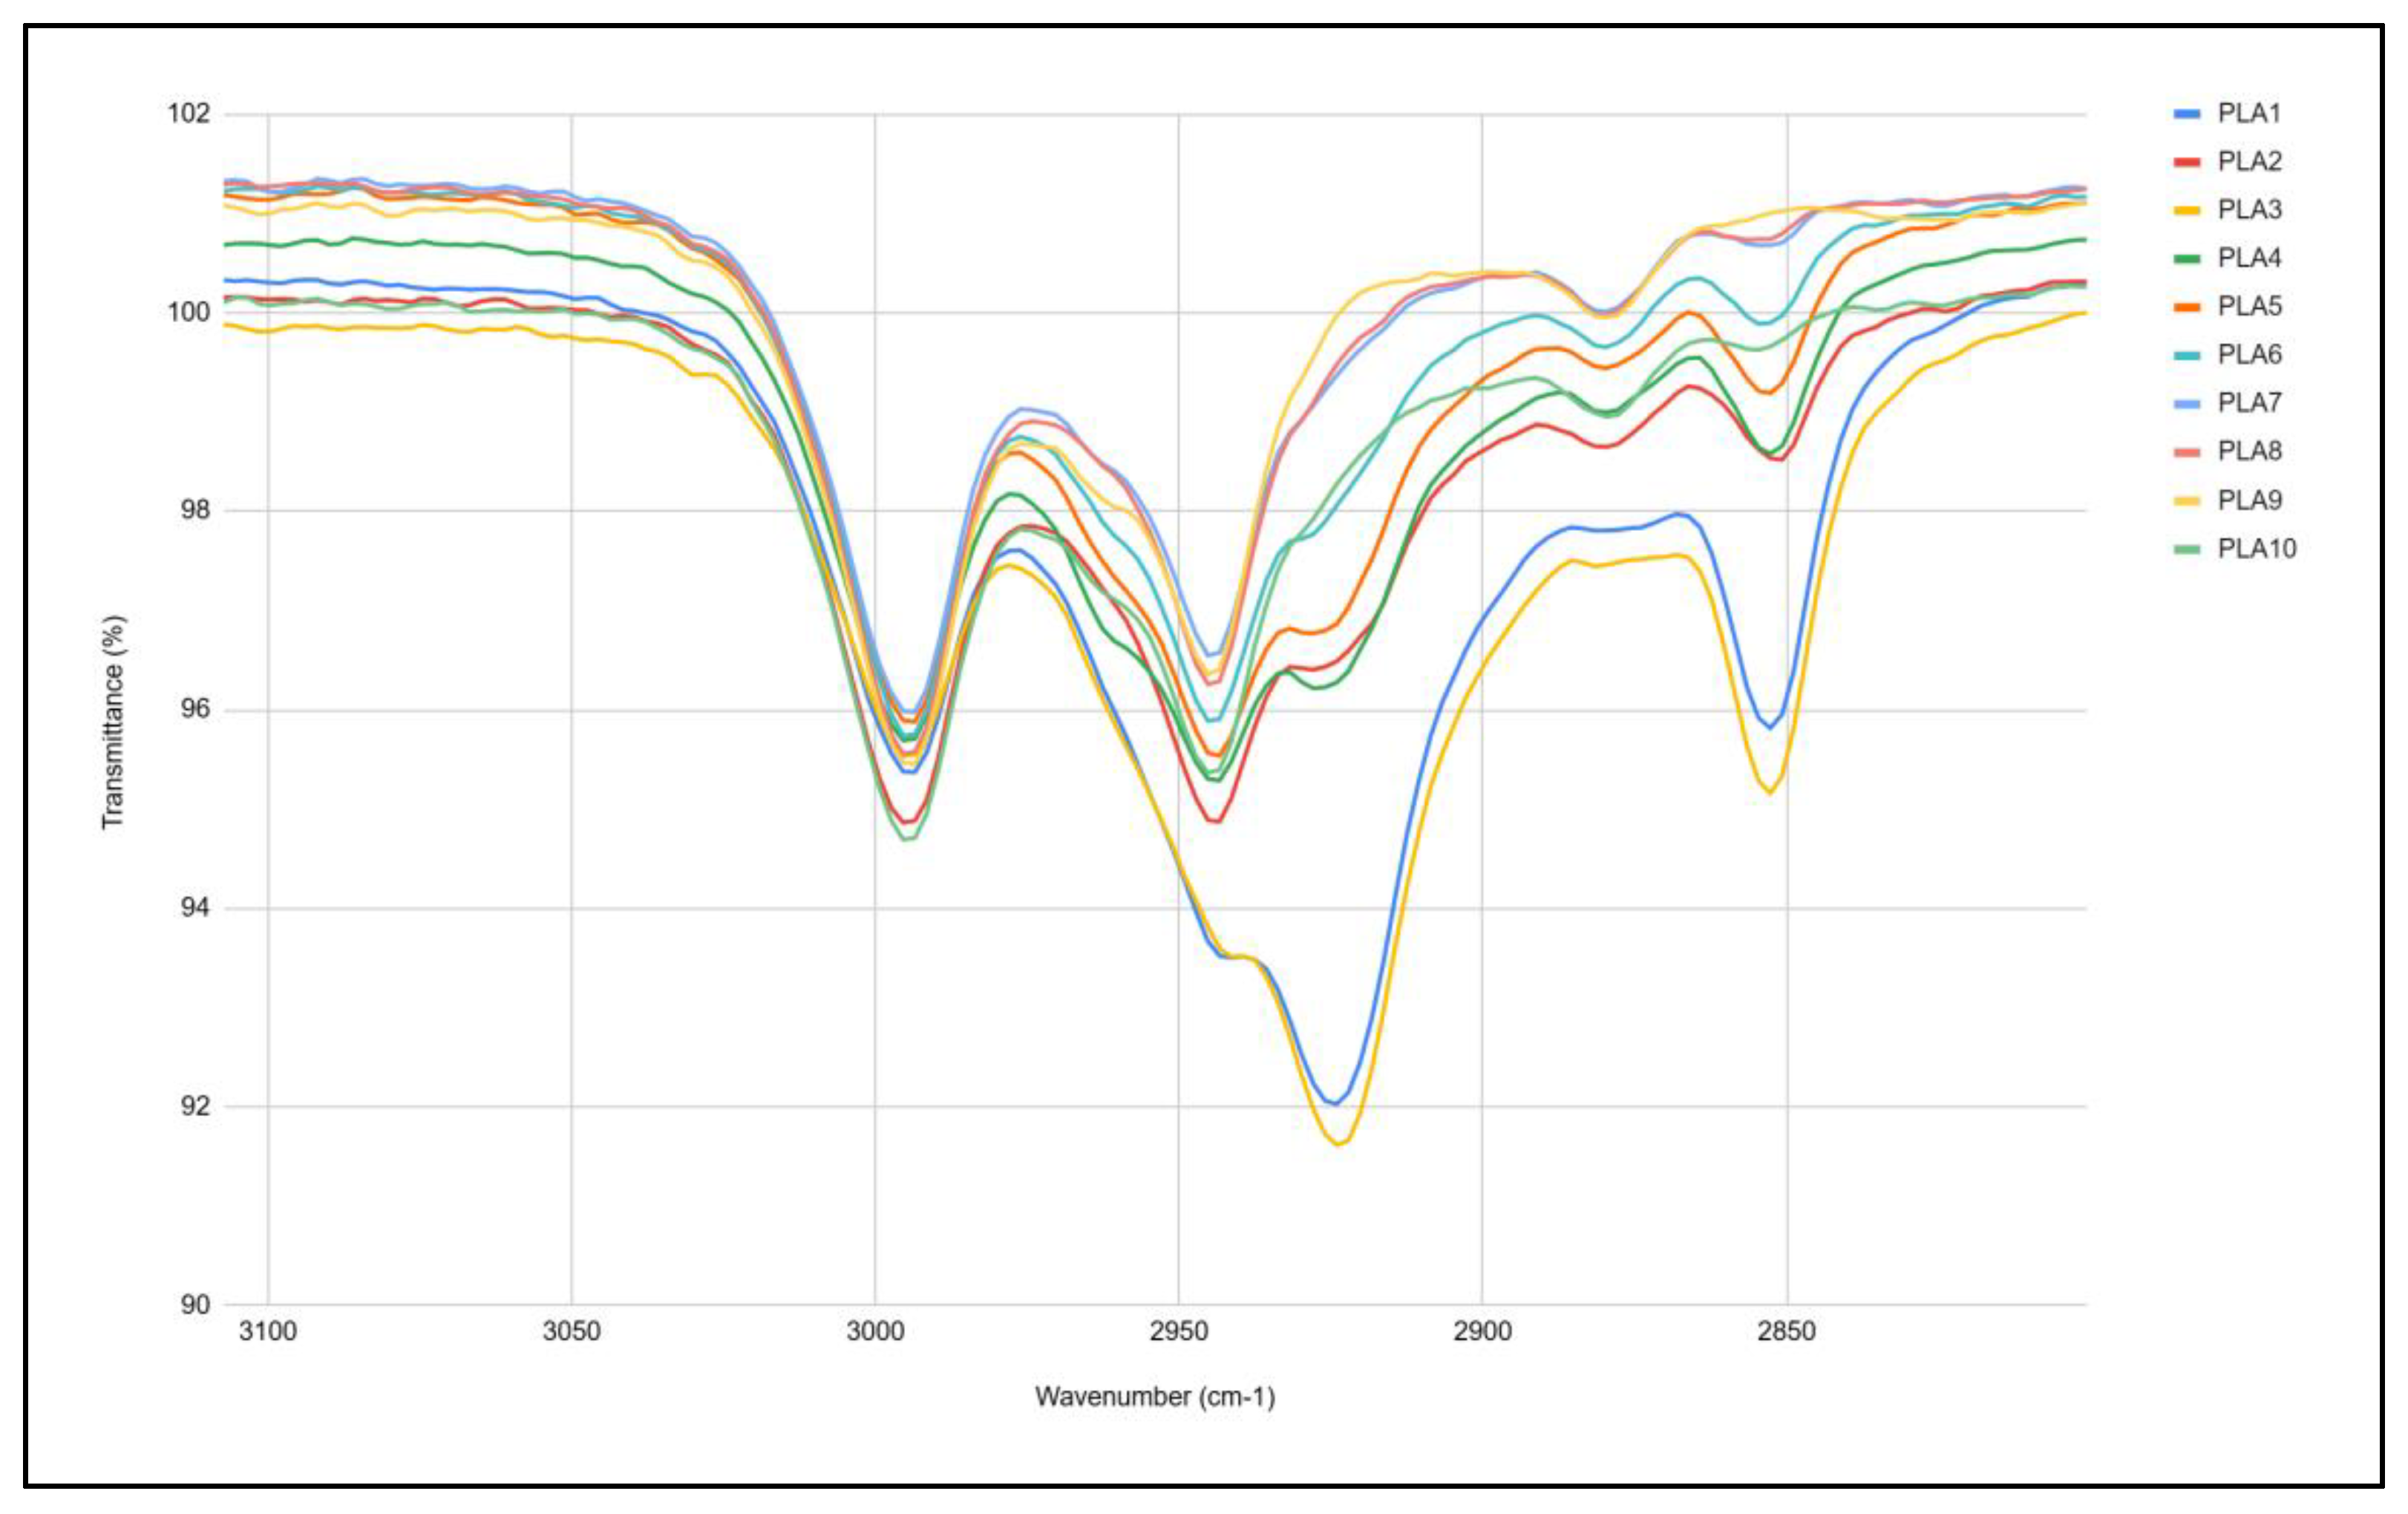
Figure 7.
Contact angle of PLA samples.
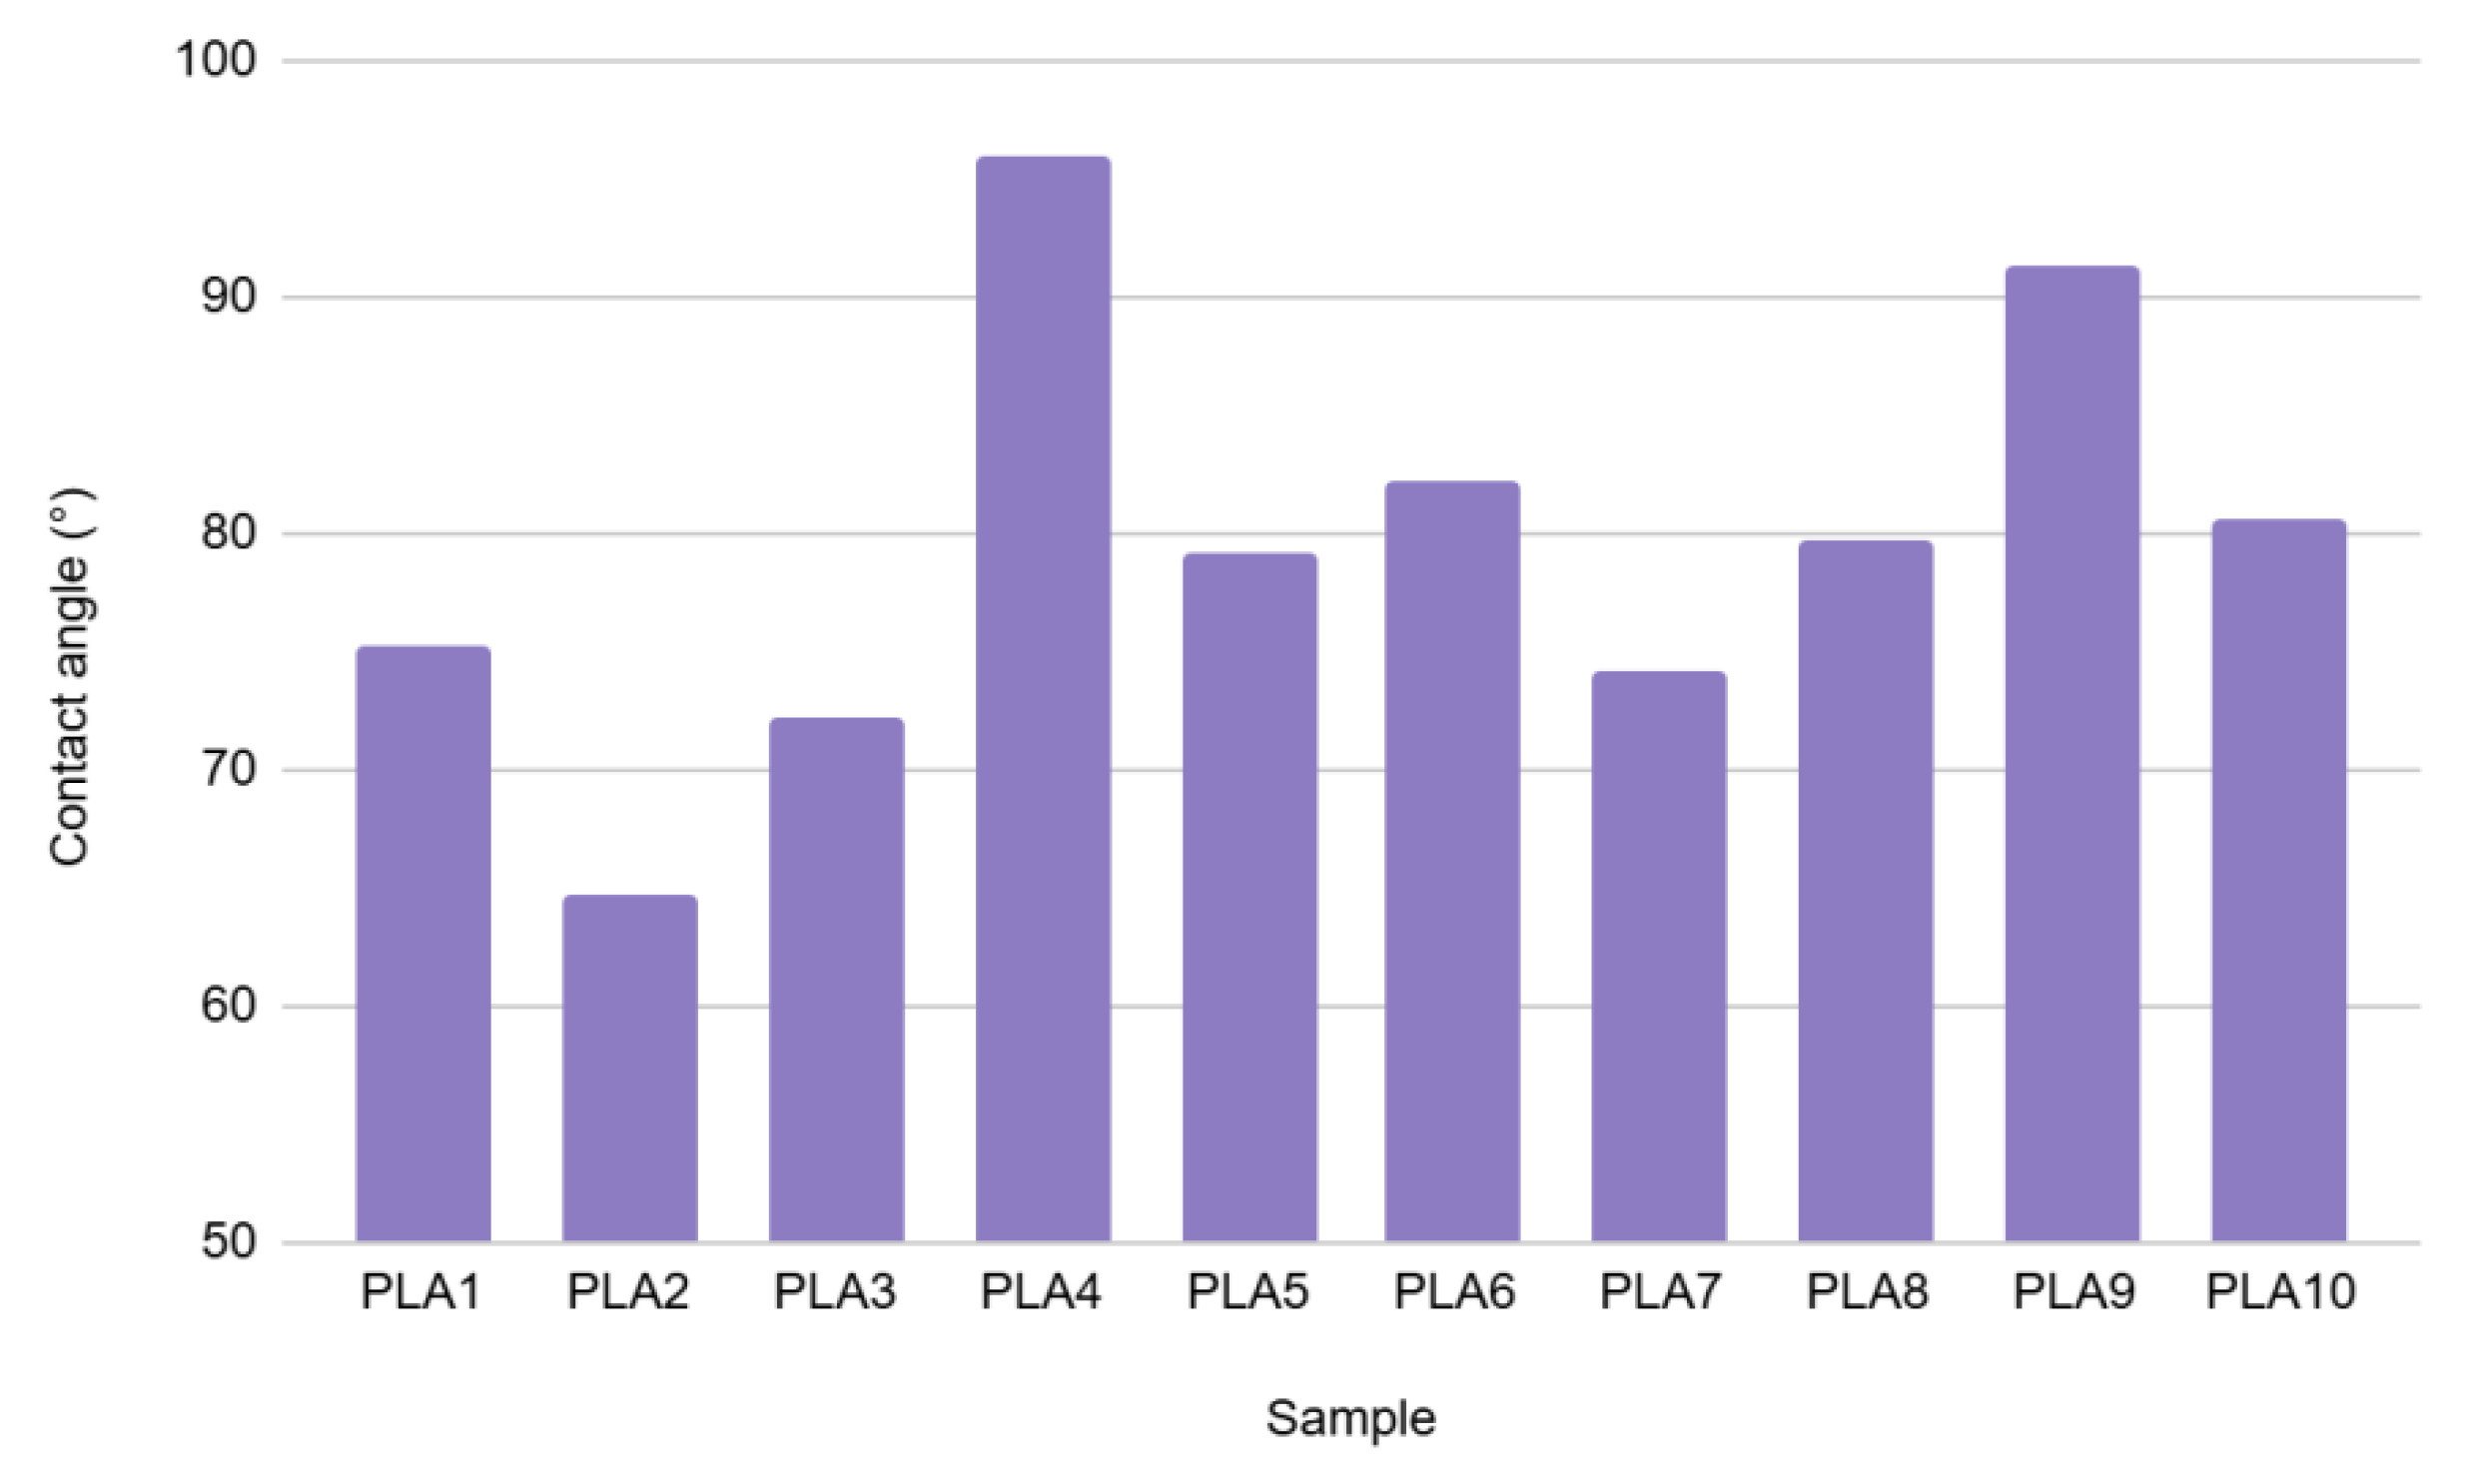
Figure 8.
Images of water drops on the surface of different samples: a) PLA1, b) PLA4, c) PLA6, d) PLA9 and e) PLA10.
Figure 8.
Images of water drops on the surface of different samples: a) PLA1, b) PLA4, c) PLA6, d) PLA9 and e) PLA10.
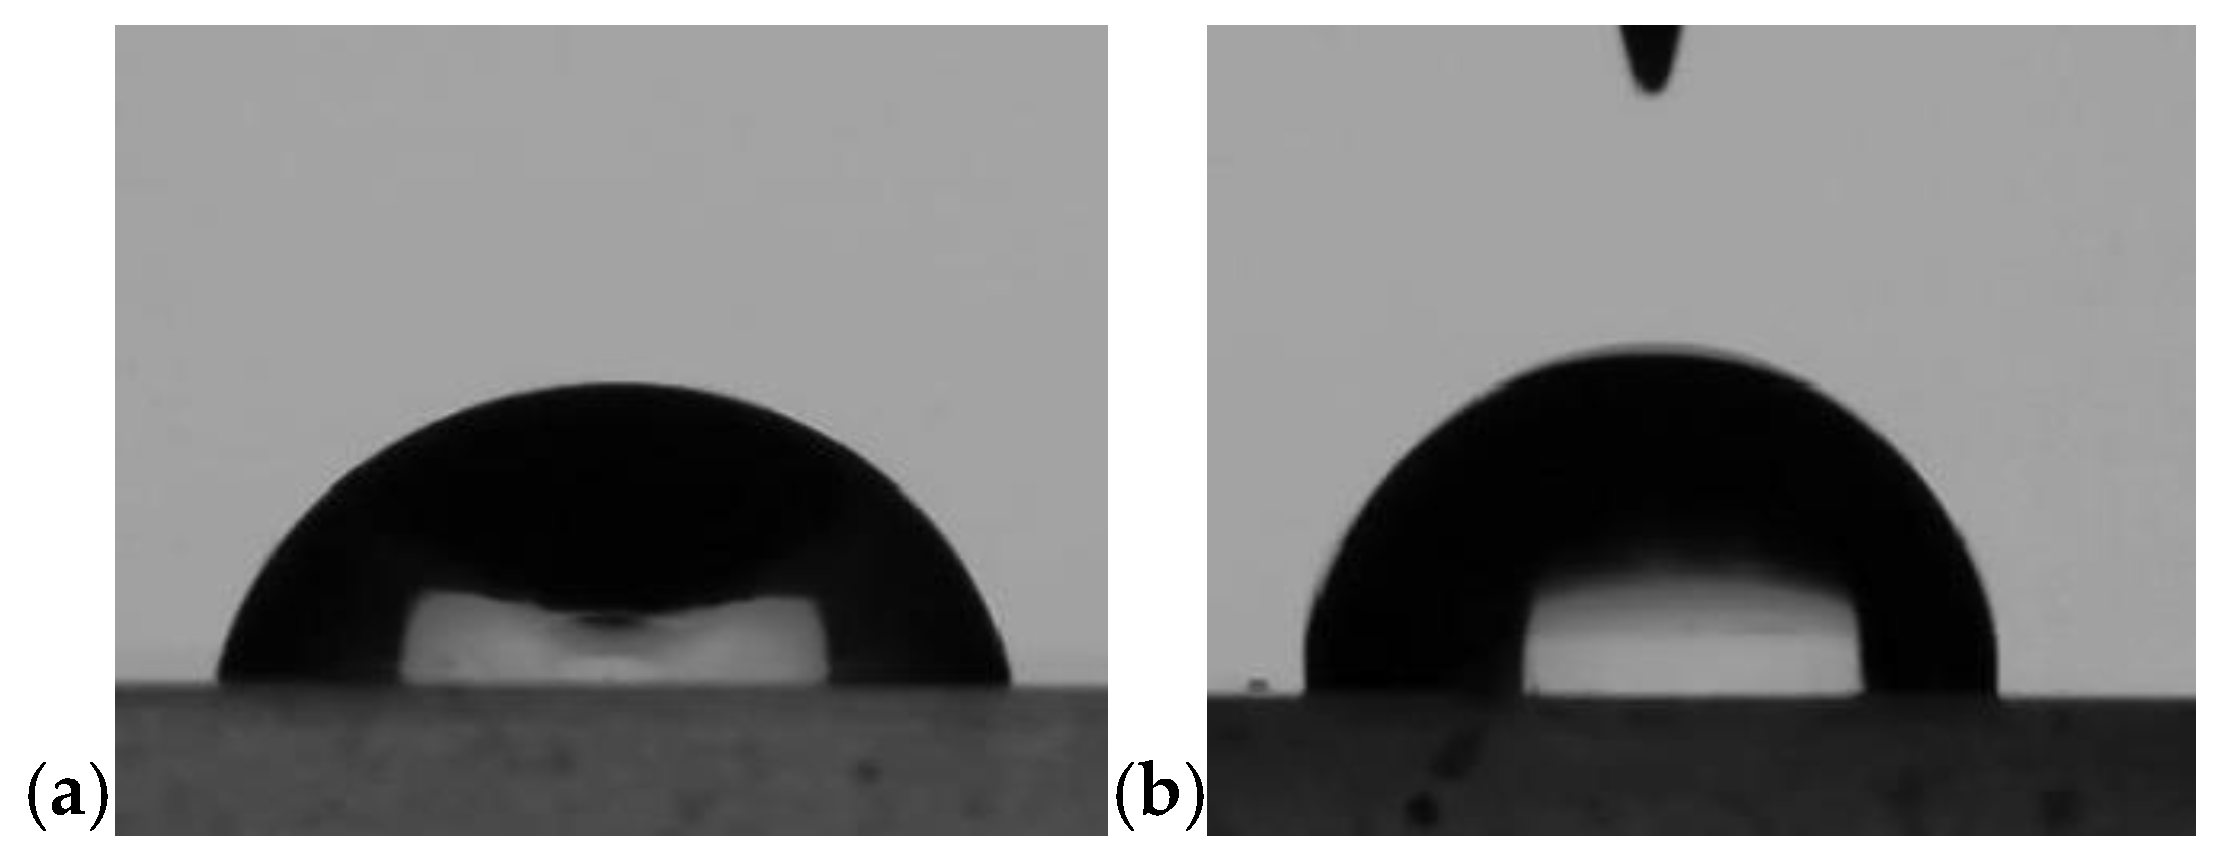
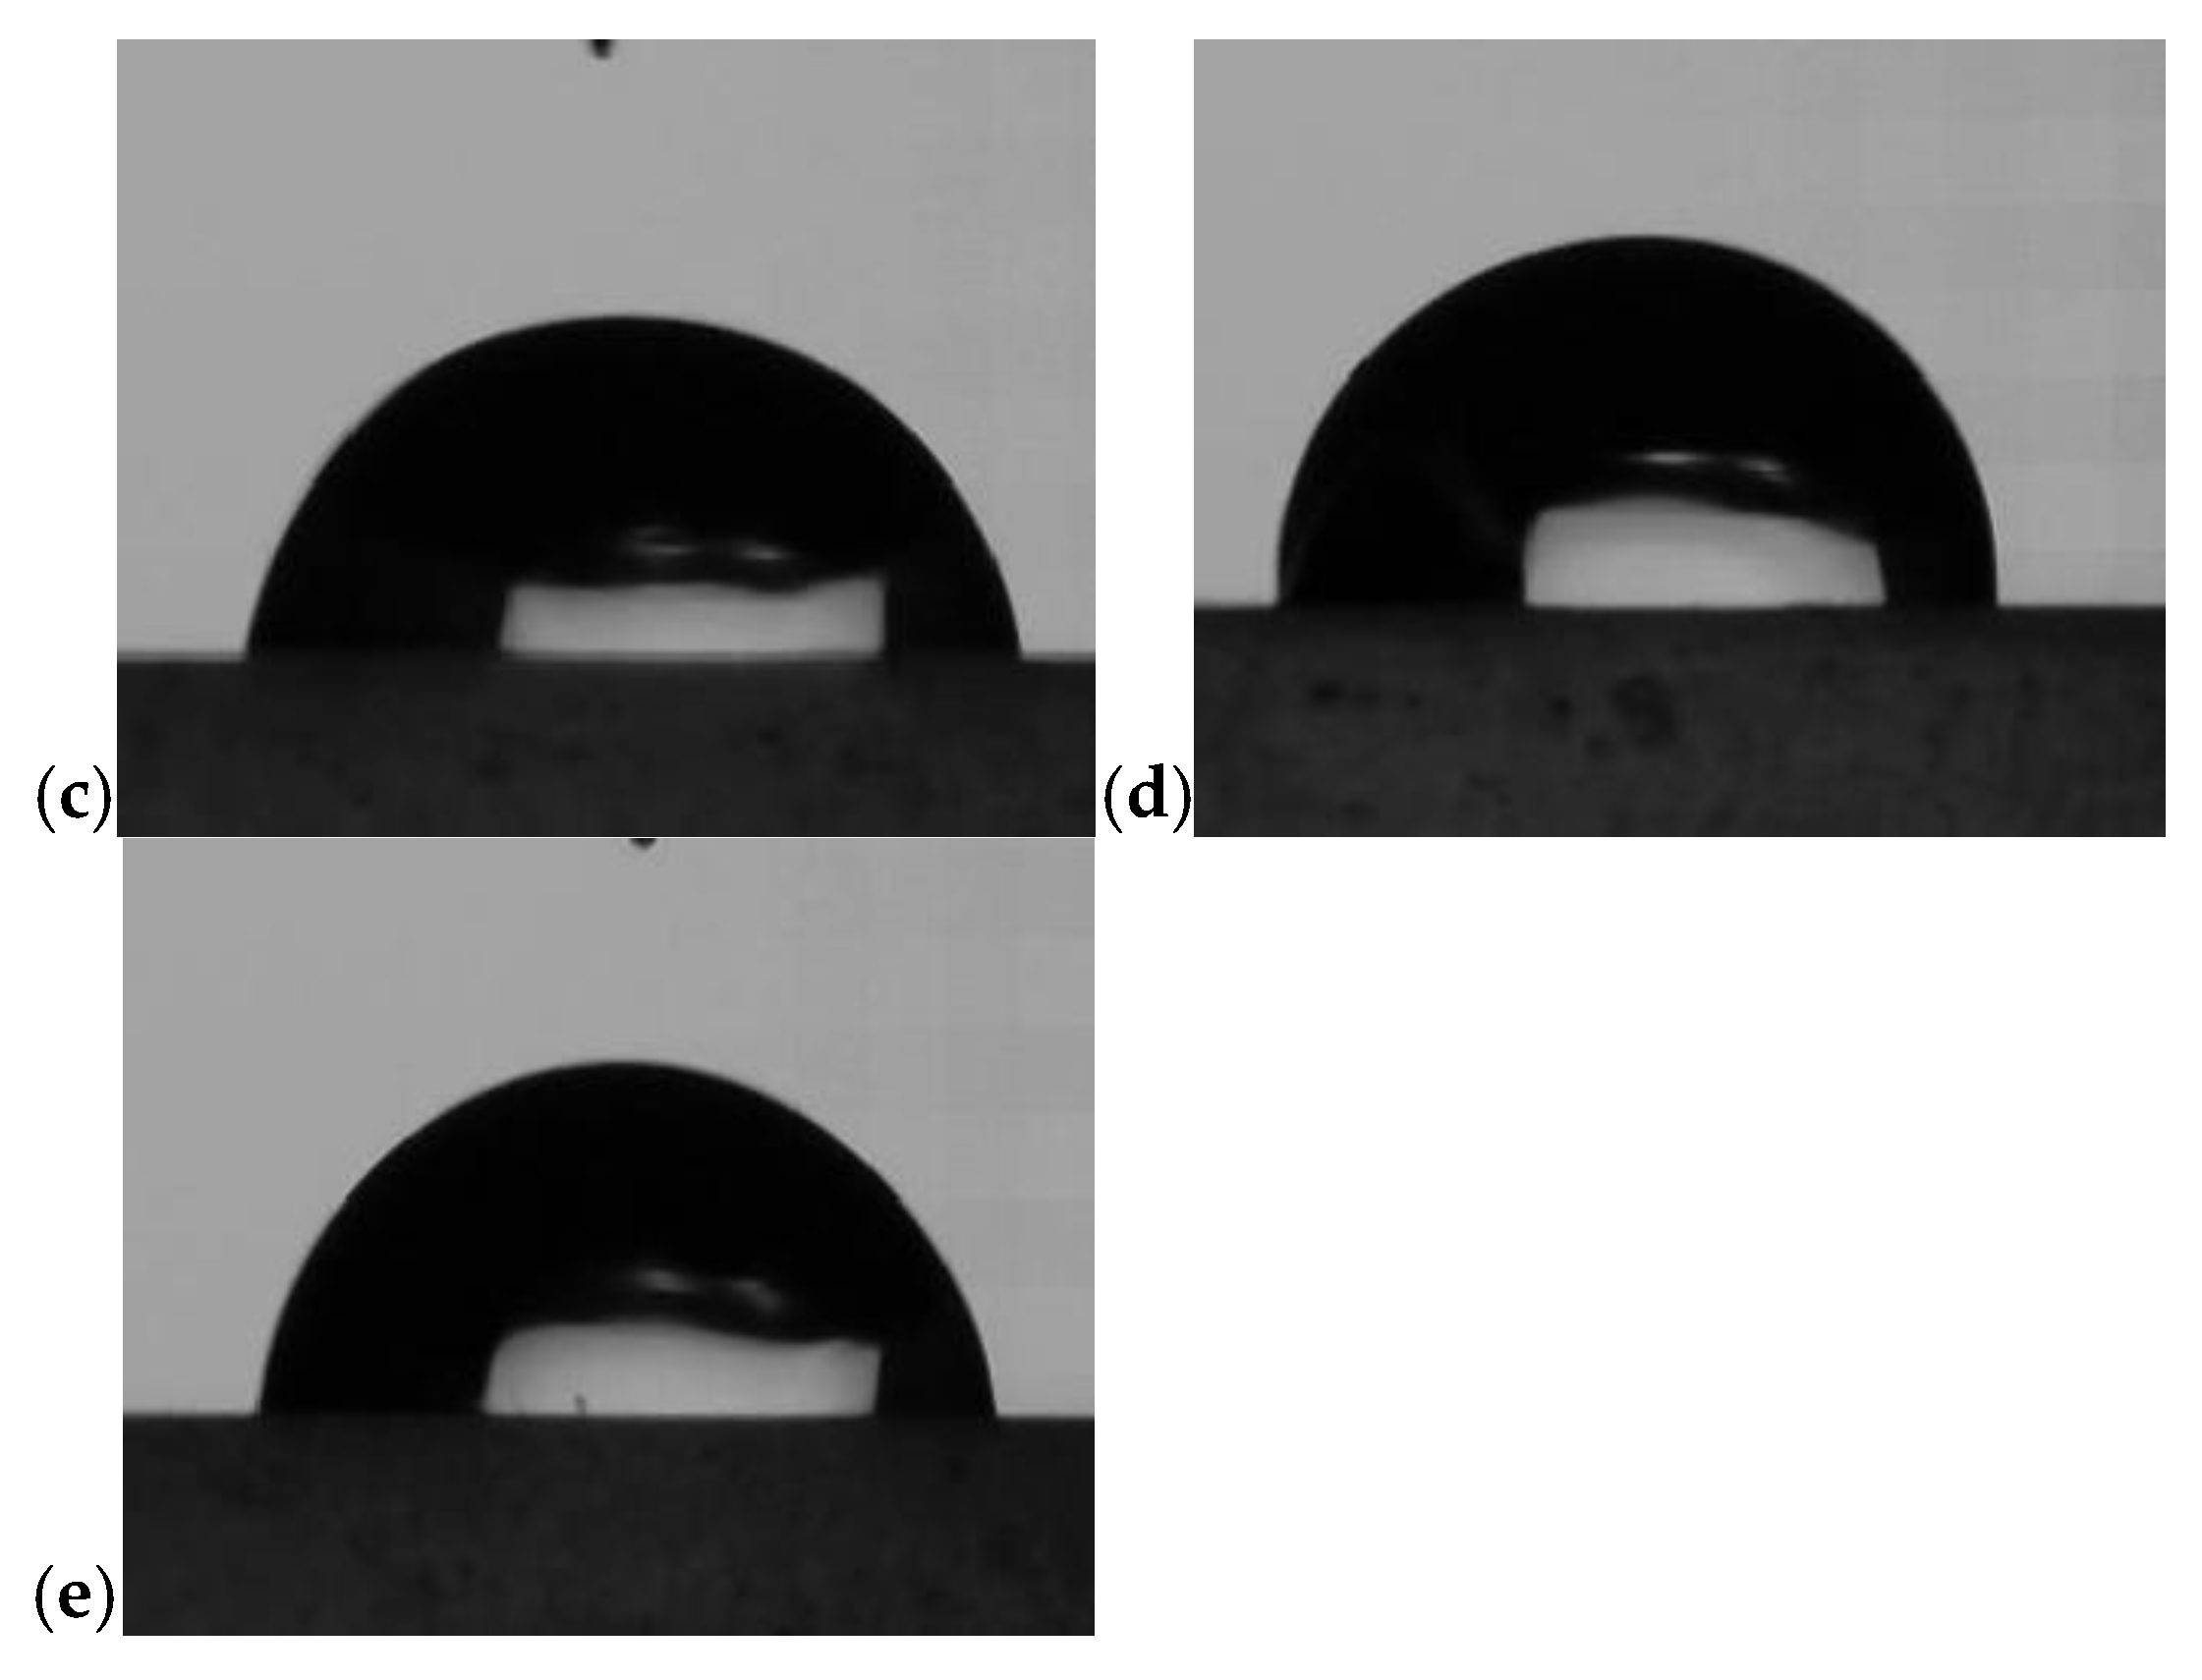
Table 1.
Thermal data from 2nd heating cycle.
| Sample | Tg (°C) | Tcc (°C) | ΔHcc (J/g) | Tm (°C) | ΔHm (J/g) | Xc (%) | Td1 (°C) |
|---|---|---|---|---|---|---|---|
| Milled PLA | 59.5 | 113.1 | 17.6 | 148.9 | 26 | 8.96 | 370.1 |
| Extruded PLA | 59.3 | 114.4 | 22.21 | 148.8 | 23.21 | 1.07 | 369 |
| PLA1 | 59.2 | 114.4 | 23.2 | 148.7 | 24.09 | 0.95 | 368.7 |
| PLA2 | 59.9 | 115.2 | 16.79 | 149.7 | 28.84 | 12.86 | 368.5 |
| PLA3 | 59.7 | 115.2 | 16.35 | 149.8 | 28.69 | 13.17 | 368.1 |
| PLA4 | 59.5 | 114.7 | 16.93 | 148.9 | 28.25 | 12.08 | 367.5 |
| PLA5 | 59.5 | 115 | 24.47 | 149.6 | 25.53 | 1.13 | 366.9 |
| PLA6 | 59.7 | 114.2 | 18.73 | 149.2 | 28.36 | 10.28 | 367.1 |
| PLA7 | 59.4 | 114.5 | 17.24 | 148.4 | 27.94 | 11.42 | 366.6 |
| PLA8 | 59.4 | 114 | 17.74 | 148.5 | 27.59 | 10.51 | 364.8 |
| PLA9 | 59.7 | 114.4 | 17.3 | 149.2 | 27.86 | 11.27 | 365.3 |
| PLA10 | 59.5 | 114.9 | 23.15 | 149.4 | 25.16 | 2.15 | 363.7 |
Table 2.
Results of DMA analysis of PLA samples.
| Sample | E’ @ 30 °C (GPa) | tanδ | Tg | tanδ cc (-) | tanδ cc (°C) | E’ cc (GPa) |
|---|---|---|---|---|---|---|
| PLA1 | 2.8561 | 1.942 | 66.96 | 95,1 | 0,168 | 0,11 |
| PLA2 | 2.949 | 1.903 | 67.28 | 95,3 | 0,156 | 0,10 |
| PLA3 | 2.9365 | 1.966 | 67.56 | 95,7 | 0,166 | 0,09 |
| PLA4 | 3.0025 | 1.988 | 67.48 | 94,5 | 0,162 | 0,10 |
| PLA5 | 2.7808 | 1.973 | 67.44 | 95,6/107,7 | 0,171/0,126 | 0,07/0,08 |
| PLA6 | 2.8575 | 1.928 | 66.64 | 95,1/109,2 | 0,162/0,090 | 0,10/0,09 |
| PLA7 | 2.9219 | 1.968 | 66.72 | 95,6/105,2/115,3 | 0,158/0,122/0,106 | 0,08/0,07 |
| PLA8 | 3.0066 | 1.991 | 66.76 | 95,4/106,6 | 0,159/0,135 | 0,07/0,08 |
| PLA9 | 2.8005 | 1.961 | 66.4 | 93,3 | 0,151 | 0,10 |
| PLA10 | 2.6755 | 2.049 | 67.19 | 94,3 | 0,166 | 0,10 |
Table 3.
Flexural test results.
| Sample | Flexural Modulus (GPa) | Flexural Strength (MPa) | Strain at Strength (%) |
|---|---|---|---|
| PLA1 | 3.25 ± 0.01 | 94.41 ± 0.05 | 4.25 ± 0.05 |
| PLA2 | 3.23 ± 0.05 | 94.19 ± 0.25 | 4.24 ± 0.02 |
| PLA3 | 3.3 ± 0.07 | 94.5 ± 0.63 | 4.29 ± 0.09 |
| PLA4 | 3.28 ± 0.08 | 98.59 ± 0.32 | 4.35 ± 0.02 |
| PLA5 | 3.32 ± 0.03 | 93.87 ± 0.84 | 4.1 ± 0.17 |
| PLA6 | 3.31 ± 0.01 | 93.78 ± 0.44 | 4.21 ± 0.04 |
| PLA7 | 3.33 ± 0.03 | 94.59 ± 0.43 | 4.14 ± 0.13 |
| PLA8 | 3.34 ± 0.05 | 95.27 ± 0.47 | 4.25 ± 0.05 |
| PLA9 | 3.44 ± 0.03 | 97.31 ± 1.58 | 4.08 ± 0.4 |
| PLA10 | 3.39 ± 0.05 | 98.05 ± 0.26 | 4.3 ± 0.06 |
Table 4.
Tensile test results.
| Sample | Tensile modulus (GPa) | Tensile Strength (MPa) | Strain at Strength (%) | Strain at Break (%) |
|---|---|---|---|---|
| PLA1 | 2.62 ± 0.23 | 68.2 ± 2.72 | 4.58 ± 0.29 | 5.18 ± 0.78 |
| PLA2 | 2.55 ± 0.26 | 67.4 ± 0.51 | 4.48 ± 0.36 | 5.72 ± 0.55 |
| PLA3 | 2.66 ± 0.33 | 67.9 ± 1.16 | 4.36 ± 0.35 | 5.34 ± 0.61 |
| PLA4 | 2 ± 0.25 | 69 ± 0.73 | 4.22 ± 0.16 | 5.92 ± 0.9 |
| PLA5 | 3.18 ± 0.15 | 67.5 ± 0.85 | 4.15 ± 0.24 | 4.94 ± 0.49 |
| PLA6 | 2.69 ± 0.38 | 66.9 ± 0.92 | 4.08 ± 0.15 | 5.79 ± 0.64 |
| PLA7 | 3.21 ± 0.32 | 66.6 ± 0.71 | 4.13 ± 0.15 | 4.99 ± 0.16 |
| PLA8 | 2.73 ± 0.15 | 65.5 ± 0.74 | 4.13 ± 0.08 | 5.04 ± 0.37 |
| PLA9 | 2.6 ± 0.33 | 66.3 ± 0.34 | 4.19 ± 0.15 | 5.67 ± 0.62 |
| PLA10 | 2.86 ± 0.23 | 67.1 ± 0.8 | 4.09 ± 0.09 | 5.3 ± 0.41 |
Disclaimer/Publisher’s Note: The statements, opinions and data contained in all publications are solely those of the individual author(s) and contributor(s) and not of MDPI and/or the editor(s). MDPI and/or the editor(s) disclaim responsibility for any injury to people or property resulting from any ideas, methods, instructions or products referred to in the content. |
© 2025 by the authors. Licensee MDPI, Basel, Switzerland. This article is an open access article distributed under the terms and conditions of the Creative Commons Attribution (CC BY) license (http://creativecommons.org/licenses/by/4.0/).
Copyright: This open access article is published under a Creative Commons CC BY 4.0 license, which permit the free download, distribution, and reuse, provided that the author and preprint are cited in any reuse.


