
Submitted:
04 July 2025
Posted:
08 July 2025
You are already at the latest version
Abstract
Background. Standard room temperature housing (~22°C) represents a stress for labora-tory mice, resulting in an increased metabolic rate, calorie consumption, heart rate, and catecholamine levels compared to thermoneutral conditions (29-32°C). Using a recently established two-hit heart failure with preserved ejection fraction (HFpEF) model (Angio-tensin II + High-fat diet for 28 days; MHS), we investigated how housing temperature modulates cardiac remodeling and function in male and female C57Bl/6J mice.
Methods. Using the MHS mouse model, we studied cardiac remodeling and function in 8-week-old C57Bl6/J mice of both sexes housed at 10°C, 22°C and 30°C for four weeks. Control mice were analyzed in parallel. Before the MHS, the animals were allowed to ac-climate for a week before the MHS started.
Results. Mice housed at 10°C consumed more food and had increased fat mass compared to those at 22°C or 30°C. This was accompanied by increased heart weight, stroke volume, heart rate and cardiac output. Mice housed at 22 °C and 30 °C were similar for these car-diac parameters. Following MHS, mice at 10°C and 22°C developed marked cardiac hy-pertrophy, whereas thermoneutral housing attenuated this response and reduced left atri-al enlargement. Cold-exposed females showed more diastolic dysfunction after MHS (in-creased E’ wave, E/E’, and isovolumetric relaxation time) than those at 22°C or 30°C. Ejec-tion fraction and cardiac output declined significantly at 10°C after MHS but were pre-served at 22°C and 30°C in females.
Conclusions. Cold housing exacerbates cardiac dysfunction in mice subjected to HFpEF-inducing stress, with pronounced effects in females. In contrast, thermoneutrality limits the cardiac hypertrophic response.
Keywords:
housing temperature
; cold stress
; heart failure
; brown fat
; cardiac hypertrophy
; HFpEF
1. Introduction
Several murine models of heart failure with preserved ejection fraction (HFpEF) have been developed in recent years, most commonly using C57Bl/6 mice. These models typically combined hypertensive stress (e.g., L-NAME, Angiotensin II, DOCA-Salt) with metabolic alterations (e.g., high-fat or Western diets). Some of these models have been studied in males, females, or both. Combining multiple stresses (or hits) better reflects the multifactorial nature of HFpEF in human patients [1,2,3,4].
One key physiological difference between humans and mice is their thermoregulatory capacity. Thermoneutrality in mice is estimated to range between 26-32°C [5,6,7]. Mice are typically housed at a temperature that creates a cold-stressful environment (22-23°C). Under these conditions, mice display elevated catecholamine levels, increased energy expenditure through adaptive thermogenesis, and increased brown adipose tissue (BAT) activity [5,6,7,8,9]. Chronically elevated catecholamines are known contributors to the development and progression of heart failure, suggesting that cold stress could accelerate cardiac dysfunction in susceptible mouse models. A recent study using a two-hit HFpEF model revealed onset of diastolic dysfunction in mice housed at 30°C compared to 23°C. However, housing temperature was not a differentiating factor if the stress persisted [10].
BAT activation, often triggered by cold exposure, has been proposed have cardioprotective effects through the release of endocrine factors known “batokines”. These include FGF21, neuregulin 4, 12,13-diHOME, and BAT-derived microRNAs, all of which have been implicated in modulating cardiac or vascular function in the context of cardiovascular diseases [11].
Thus, while cold exposure activates BAT thermogenesis and batokine secretion, it also induces physiological stress that may negatively impact cardiovascular health. [12]. However, the impact of cold exposure on HFpEF pathophysiology remains unclear.
To address this, we used a recently developed two-hit mouse model of HFpEF [13] to study the impact of housing temperature on cardiac structure and function. Male and female C57Bl6/J mice were housed for five weeks at 10°C (cold), 22°C (room temperature), or 30°C (thermoneutrality)). Half of the animals were subjected to the MHS protocol, consisting of an Angiotensin II (AngII) continuous infusion combined with a high-fat diet for 28 days (MHS) [13].
We report that housing mice at 10°C is associated with BAT activation, cardiac hypertrophy, left ventricular (LV) remodelling, and increased cardiac output. In MHS-treated mice, cold exposure further exacerbated diastolic dysfunction. In contrast, thermoneutral housing decreased LV mass (as assessed by echocardiography and cardiomyocyte size) and attenuated the cardiac hypertrophic response. Furthermore, the expression of pathological gene markers was less pronounced at thermoneutrality compared to cold stress conditions.
2. Materials and Methods
Animals
Seven-week-old male and female C57BL6/J mice were purchased from Jackson Laboratory (Bar Harbor, ME, USA). Mice were housed on a 12-hour light-12-hour dark cycle with free access to food and water. Mice were individually housed at thermoneutrality (30°C), room temperature (22°C), or cold temperature (10°C). The protocol was approved by the Université Laval’s animal protection committee and followed the recommendations of the Canadian Council on Laboratory Animal Care (approval numbers 2023-1549 and 2023-1550, dated February 2023). Mice were randomly assigned to the various experimental groups (n = 6 per group). Health and behavior were monitored daily by experienced technicians, and body weight was measured weekly. Three intact male mice died in the MHS group.
Metabolic and Hypertensive Stress (MHS) Protocol
As described before [13], mice in the MHS group were implanted with a subcutaneous osmotic minipump (Alzet #1004) delivering an angiotensin II (AngII; 1.5mg/kg/day) (Sigma, Mississauga, ON, Canada) for 28 days. In parallel, mice were fed a high-fat diet (HFD: 60% calories; Research Diets Cat. #D12492). Control animals were fed a standard chow and no AngII infusion.
Echocardiography
Body Composition
After euthanasia and osmotic pump removal, whole-body composition was assessed using a Bruker’s Minispec Whole Body Composition Analyzer.
Myocardial Fibrosis Evaluation
Myocardial samples were frozen in OCT, sliced in serial sections (10μm thick), and stained with Picrosirius Red to assess the percentage of interstitial fibrosis. The formula used to calculate the percentage of interstitial fibrosis was: ((% Fibrosis) / (% Fibrosis + % Tissue)) × 100 [16].
Cardiomyocyte Cross-Sectional Area
The cardiomyocyte cross-sectional area (CSA) was visualized with immunofluorescent wheat germ agglutinin FITC (Sigma) staining as previously described [16].
RNA Isolation and Quantitative Real-Time Polymerase Chain Reaction
As described previously, total RNA was extracted from LV tissue [13]. Quantitative RT-PCR was used to quantify LV gene expression in at least six animals per group. Cyclophilin A (Ppia) was the control “housekeeping” gene for studying cardiac genes, and RPL13 for brown fat genes. The primers used are listed in Table 1.
BAT Histology
BAT samples were preserved in a 4% paraformaldehyde solution for 48 hours and transferred to 70% ethanol. The specimens were paraffin-embedded, cut into 4-μm sections and stained with hematoxylin and eosin.
Statistical Analysis
All data are expressed as mean ± standard error of the mean (SEM). Outliers were removed using the ROUT test with a Q of 1% with Prism. Intergroup comparisons were conducted using the Student’s T-test using GraphPad Prism 10.4 (GraphPad Software Inc., La Jolla, CA, USA). Comparisons among more than two groups were analyzed using a two-way ANOVA and the Holm-Sidak post hoc test. P<0.05 was considered statistically significant.
3. Results
3.1. Different Housing Temperatures Result in Sex-Specific Adaptations in C57Bl6/J Mice
As illustrated in Figure 1A, C57Bl6/J mice were individually housed at three different temperatures: 10°, 22° or 30° for five weeks. Half of the mice, starting seven days later, received AngII and the high-fat diet (HFD) for four weeks (MHS). The other half remained untreated.
After five weeks, female mice at 10°C had a similar body weight to those housed at 22°C or 30°C (Figure 1B). Their body composition was studied after euthanasia and showed a higher proportion of fat tissue than the two other groups (Figure 1C,D). In males, cold exposure resulted in higher body weight, increased fat content, and slower growth (Figure 1E). Lean mass was reduced in males at 30°C. As expected, food consumption was highest in mice at 10°C and lowest in those at 30°C (Figure 1F).
3.2. Housing Temperature Affects Cardiac Morphology and Function
Heart weight indexed to tibial length was highest in cold-housed mice (Figure 2A). Left atrial weight was lower in females housed at thermoneutrality, whereas it was increased in males at 10°C compared to the two other groups (Figure 2B). Lung weight (wet: Figure 2C and dry: Figure 2D) in mice housed at 22°C fell between those of animals at 10°C (higher) and 30°C (lighter).
We then studied the mouse cardiac morphology and function by echocardiography, the day before euthanasia. Using B-mode imaging, we measured LV internal end-diastolic volume (EDV; Figure 2E), LV stroke volume (SV; Figure 2F), the heart rate (HR; Figure 2G) and the resulting cardiac output (CO; Figure 2G). In females, cold exposure was associated with increased EDV, SV and cardiac output. In males, a similar situation was observed (Table 1). All these parameters remained unchanged between mice kept at standard housing temperature (22°C) and those maintained at thermoneutrality.
As illustrated in Figure 3, housing at warmer temperatures was associated with smaller LV diastolic and systolic areas, resulting in smaller volumes.
Using M-mode imaging, we observed that the LV internal diastolic diameter (EDD; Figure 4A) was increased in females and that LV walls (Figure 4B) were thicker. Relative LV wall thickness (RWT; Figure 4C) remained unchanged, but estimated LV mass (Figure 4D) was increased. In males, EDD was unchanged, but LV walls were thicker, and LV mass was increased at 10°C.
3.3. Thermoneutrality (30°C) Reduces the Cardiac Hypertrophic Response to MHS
Half of the mice, after one week of acclimatization, were implanted with a mini-osmotic pump delivering a continuous AngII infusion for four weeks and fed a high-fat diet (MHS; Figure 1A). As illustrated in Figure 5A, heart weight was significantly increased after the MHS in both female and male mice, except for mice housed at thermoneutrality. Left atrial enlargement, a feature of HFpEF [2], was present in all groups, but left atrial weight gain after MHS was significantly lower in mice at 30°C (Figure 5B). CSA was the largest in MHS animals housed in the cold (Figures 5C,D). Myocardial fibrosis was increased in MHS animals and did not differ based on the housing temperature (Figure 5E–G).
3.4. Cold Exacerbates Diastolic Dysfunction After MHS and Causes a Loss of Ejection Fraction
When assessed using echocardiography, diastolic function parameters were not markedly altered by the housing temperature (Figure 6A–D). MHS reduced E wave velocities in most groups (Figure 6E). E’ wave velocity was increased only in females at 10°C and all three male MHS groups compared to controls (Figure 6F). This resulted in an abnormal E/E’ ratio in females housed in the cold (Figure 6G). The isovolumetric relaxation time (IVRT) was increased in male and female mice housed at 10°C (Figure 6H), as was the left atrial diameter (Figure 6I). A similar observation was also made for the isovolumetric contraction time (IVCT) in mice housed at cold temperatures (Figure 6J).
This longer IVCT in MHS mice at 10°C suggested that systolic function may have been altered. We used M-mode echocardiography imaging to measure LV wall thickness and internal diameters. As expected, MHS increased LV wall thickness in all groups (Table 2), resulting in an increased relative wall thickness, an index of concentric LV remodelling and increased LV mass. Using bidimensional (B-mode) echocardiography, we observed that MHS decreased LV volumes in males, not females. Stroke volume and cardiac output were reduced in males after MHS. This was the case in females only at 10 °C. Ejection fraction was significantly reduced after MHS in mice housed at 10°C (Figure 7), but not in the groups housed at 22°C and 30°C.
3.5. Housing Temperature Modulates Myocardial Hypertrophy and Fibrosis Marker Genes After MHS
We measured the expression levels of several myocardial hypertrophy or fibrosis marker genes to determine if they showed differences in their modulation related to the housing temperature in MHS mice. As illustrated in Figure 8A,B, MHS increased LV gene expression of natriuretic peptides, Nppa (atrial) and Nppb (brain). For Nppa and Nppb, this increase was more substantial in groups housed in the cold.
Procollagens 1 and 3 (Col1a1 and Col3a1) gene expression were increased after MHS (Figure 8C,D). In both females and males, MHS did not significantly increase the expression levels of these two genes in mice housed at 22°C; however, it did so in mice housed at 10°C and 30°C. Periostin (Postn) and Thrombospondin 4 (Thbs4), marker genes of extracellular matrix synthesis and remodelling, increased their expression levels after MHS (Figure 8E,F). This increase was more pronounced in females housed in the cold, but not in males.
3.6. Cold Stress Activates BAT, and MHS Induces BAT Browning at Thermoneutrality
At the time of euthanasia, we collected the scapular brown fat depot, a thermogenic organ. As illustrated in Figure 9A, BAT weight was increased in animals housed at 10°C compared to mice at 22°C and 30°C. BAT weight was higher in males at thermoneutrality than at room temperature. Representative pictures of the collected fat depot are illustrated in Figure 9B. Hematoxylin-eosin-stained BAT sections show that thermoneutrality was associated with larger cell fat droplets in male and female mice (Figure 9C). Interestingly, the MHS induced significant histological changes in the BAT of mice housed at 30°C, similar to those observed in groups housed in cold environments (Figure 9D).
Housing at 10°C was associated with larger BAT adipocytes (fewer nuclei per microscope field) compared to room temperature (Figure 9E). The MHS stress reduced adipocyte size in both male and female mice. Uncoupling protein 1 (UCP1) is a marker of BAT thermogenesis, and as expected, its gene expression correlated with housing temperatures, being more expressed in cold-stressed animals (Figure 9F). The MHS did not modulate Ucp1 gene expression in the cold-stressed groups (not shown) but increased it in mice at thermoneutrality (Figure 9G).
Food consumption in calories per day was higher in control groups housed at 10°C compared to those housed at 22°C or 30°C (Figure 1F). The HFD contained more calories per gram than the standard diet (5.24 kcal/g vs. 3.82 kcal/g). For mice at 10°C and 30°C, the HFD was not associated with higher levels of consumed calories than standard diet-fed mice. Males at 10°C even consumed less. Only at 22°C did mice consume more calories with the HFD. (Figure 9H).
4. Discussion
Most preclinical studies in mice are performed at standard housing temperatures (~22°C), which represent a cold stress for these animals [5,6,7,8,9,10,17]. Cold exposure increases energy expenditure, food consumption, and locomotion, while individual housing removes opportunities for huddling-based thermoregulation, adding futher physiological stress.
Compared to thermoneutrality, cold housing activates the sympathetic nervous system (SNS) and the renin-angiotensin-aldosterone (RAAS) system. Circulating catecholamines are increased by cold exposure [18,19] as well as plasma renin activity and AngII formation [20,21]. Nitric oxide production, a central vasodilator that controls BT and endothelial function, is reduced via decreased endothelial nitric oxide synthase (eNOS) expression [22]. Evidence also exists that endothelin-1 levels, a potent vasoconstrictor, increase in response to cold exposure [23]. These adaptations to cold will cause increased hypertension (CIH) and heart rate [189].
Since CIH can cause cardiac hypertrophy, it is plausible that inhibiting the SNS or RAAS systems would block cold-induced cardiac hypertrophy (CICH). Although cold-induced hypertension can be reduced using β-blockers or RAAS inhibitors, this did not translate into blocking CICH [12].
Cold exposure is also associated with an increase in circulating thyroid hormone levels, which are known to activate thermogenesis [24,25]. Interestingly, blockade of thyroid hormones’ action has been shown to reduce CICH in rats [26]. Since thyroid hormones are also known for their implication in the postnatal cardiac growth, a form of physiological CH [27], it is plausible that they, in part, control the development of CICH.
More recently, it was reported that increased oxidative stress could partly modulate CICH. Blocking the expression of the gp91phox-containing NADPH oxidase (Nox2), which is selectively expressed by endothelial cells, using RNA interference, inhibited CICH in rats. This NADPH oxidase is a significant source of oxygen radical generation in the arterial wall [28]. Endothelin-1 inhibition using RNA interference was also shown to inhibit CICH [29]. This also emphasizes the possible roles of myocardial endothelial cells in the development of CICH.
Although some authors consider CICH as a pathological phenotype [12,30,31], others view it as a physiological adaptation to this stress. Increased myocardial capillarity, lipid uptake, and reversibility after stress removal, along with enhanced metabolic capacity, indicate physiological hypertrophy [32]. These authors identify the capacity of a reversal toward a normal phenotype as a hallmark of physiological CH, along with the absence of activation of a myocardial gene profile associated with pathological hypertrophy.
Our results show that the continuous demand for cold adaptation can stretch the animal’s capacity, especially the myocardium, to respond to a pathological stress, such as the MHS, and exacerbate the severity of the induced phenotype. A similar observation was made in mice, showing that pressure overload-induced cardiac hypertrophy was accentuated by cold housing [33].
We observed that although CICH in animals housed at 10°C for five weeks was not associated with changes in the expression of the hypertrophy and fibrosis marker genes we measured, when the MHS was applied, the heart of both male and female mice showed exacerbated cardiac dysfunction compared to mice at thermoneutrality and at ambient room temperature.
This did not appear to be related to exaggerated myocardial fibrosis, as we did not observe higher levels in mice exposed to cold temperatures compared to groups housed at warmer temperatures. Other signs of a pathological phenotype related to the cold exposure include increased left atrial size and/or mass, lungs’ wet and dry weights, and dilated LV. This phenotype may only reflect a physiological volume overload induced by the need for a higher cardiac output for thermogenesis. On the other hand, the animals housed at 10°C were more susceptible to pathological stressors.
Adaptations to the cold were similar in male and female mice (increased food consumption and body fat content, dilated LV, higher cardiac output), but several differences were observed. Male mice increased their body weight, not females, and body growth (tibial length) slowed in males, not females. Cardiac adaptations to the cold were relatively similar between the sexes, however.
Housing mice at thermoneutrality provides an opportunity to assess the degree of stress that ambient housing temperatures represent for mice. Globally, for control mice, the differences between mice at 22°C and 30°C were relatively mild. Except for food consumption in mice housed at 22°C, we also observed that females had less lean mass and had an enlarged left atrium. Only food consumption was increased at ambient temperature in males.
Differences became evident when the mice were subjected to the MHS. Thermoneutral groups had a blunted hypertrophic response compared to those housed at 22°C, and left atrial enlargement was also reduced. The MHS also modulated fewer diastolic echocardiography parameters. Interestingly, these potential benefits of thermoneutrality were not observed in the expression of gene markers for hypertrophy and extracellular matrix remodeling. For instance, collagens were more expressed in the LV of MHS mice at 30°C compared to those at 22°C. Nppa and Postn were also more expressed in MHS males at thermoneutrality.
Cardiac adaptations during the acclimatization period of mice transiting from ambient room temperature to 30°C may have coincided with those induced by the MHS stress, since only one week separated the two. However, thermoneutrality helped reduce the hypertrophic response to MHS. Substantial morphological and functional changes in cardiac physiology are not induced by the cold stress of being housed at 22°C, but it may fragilize the mice exposed to the MHS.
Cold exposure creates a demand for increased thermogenesis. Brown adipose tissue is an essential mammal heat producer activated by the β3-adrenergic receptor (β3-AR) in mice. The uncoupled protein 1 (UCP1) is central to this response to the cold. Cold stimuli are transmitted to the hypothalamus through the skin, indirectly releasing norepinephrine to activate the cAMP-protein kinase A (PKA) signalling pathway via the β3-AR. PKA phosphorylation activates factors that lead to the activation of PGC-1α expression. This activates intranuclear UCP1 production, which then migrates to the mitochondria to produce heat.
In addition to its role in thermogenesis, BAT has been shown to produce factors (batokines) that can protect the cardiovascular system, particularly the heart, in pathological situations. Evidence for the modulation of cardiovascular function exists in the context of pathological states, such as hypertension, atherosclerosis, and ischemia/reperfusion injury, for several of these batokines (FGF21, neuregulin 4, 12,13-diHOME, and BAT-derived microRNAs) [11]. Activation of the β3-AR in BAT has been shown to exhibit cardioprotective effects by suppressing exosomal inducible nitric oxide synthase (iNOS) originating from the BAT [34].
As we observed here, the BAT in mice at thermoneutrality presents histological similarities with white adipose tissue, whereas browning is evident at 22°C and 10°C. This is accompanied by increased Ucp1 mRNA levels, which are more elevated as the cold stress is more intense.
The activation of the BAT by cold exposure may help produce cardioprotective factors or inhibit others, such as iNOS [11,34]. These putative benefits of BAT activation were entirely superseded by the heart’s obligatory response to increase its cardiac output in a cold environment. Those factors did not protect the heart against the MTS in the cold-stressed groups, although they may have helped limit the adverse response to low temperatures. It would be interesting to investigate the action of pharmaceutical agonists or antagonists of β3-AR to modulate this signalling pathway and test if BAT activation without a cold stress could benefit the response to MHS. For instance, Lin and colleagues observed that mirabegron, a β3-AR agonist, could activate the BAT and inhibit the release of exosomal iNOS in the Ang II mouse cardiac hypertrophy model [34].
Interestingly, the main effect of thermoneutrality was to inhibit cardiac hypertrophy after the MHS. Several factors may contribute to this observation. Food consumption was reduced in mice housed at 30°C, resulting in fewer calories from fat being consumed. In our model, the HFD does not cause cardiac hypertrophy in males, but does in females. Only in mice housed at 22°C did we observe an increase in calories consumed in mice fed the HFD.
As previously described by Chen and collaborators [35], housing mice at thermoneutrality reduces blood pressure (BP), but this reduction could be reversed by feeding mice with an HFD. They also test a pressure overload stress in their mice by performing a transverse aortic constriction (TAC). A significant increase in the indexed heart weight was noted in TAC mice at 22°C or thermoneutrality; however, CH tended to be less in the thermoneutral mice.
AngII is the primary hypertrophic stress in our model [13], and its effects were almost completely blunted in mice under thermoneutral conditions. We did not record BP in this study. Still, AngII infusion alone or in the MHS was associated with significantly increased mean BP in males, and less in females [13]. The cardiac hypertrophy induced by AngII was equivalent between the sexes, regardless of BP. It is thus possible that BP was lower in the MHS mice at 30°C, although feeding with the HFD should have partially counteracted the benefits of thermoneutrality on BP. This needs to be explored further, but apart from cardiac hypertrophy, the benefits of housing at thermoneutrality compared to standard room temperature were relatively mild in our mice.
The MHS induced browning of the BAT in mice at thermoneutrality, accompanied by elevated Ucp1 gene expression and decreased adipocyte size, suggesting the activation of this fat depot. The MHS combines two factors with potential opposite effects on general adiposity. We previously observed that the HFD for four weeks increased body weight in mice compared to a standard diet, and AngII did the opposite in males. Females’ body weight remained unchanged after AngII. Combining the two, as for the MHS, resulted in similar body weights after four weeks in animals at 22 °C [13].
The control of adiposity by the RAAS is believed to be mediated by the Angiotensin II receptor type II (AT2R). The knock-out of this receptor results in increased obesity in mice fed an HFD, and its activation with a specific agonist (C21) blunts weight gain [36,37,38].
C21 can also lead to BAT activation (upregulation of Ucp1) and the browning of white adipose tissue in mice [38]. In our animals at thermoneutrality, it seems that the effects of AngII on the BAT were preponderant. It is unclear how it altered batokines production in our mice, which may have contributed to the reduction of CH in the MHS mice.
5. Study Limitations
This study used a two-hit model to induce HFpEF that resembles human HFpEF. It is still not representative of the entire spectrum of HFpEF patients. In addition to being housed in a cold-stressed environment, being housed alone may have changed the mice’s social environment.
The translation of our results to humans is challenging, but they emphasize that mouse housing temperatures are a factor in the development and study of preclinical animal models.
Several parameters were not measured in this study, including BP, animal metabolic activity, or daily activity, which may have affected our results.
6. Conclusions
Our results indicate that housing temperatures influence the cardiac response to a stressor that induces HFpEF. In itself, housing at 10°C demands essential cardiovascular adaptations to increase the cardiac output. Although those adaptations may be, in large part, reversible once the animal is returned to warmer housing environments, suggesting physiological cardiac remodelling, it fragilizes the heart to respond to an additional stress, here the MHS.
On the other hand, thermoneutrality blunts cardiac hypertrophy without reducing myocardial fibrosis. This suggests a more complex interplay between factors known to be reduced in these conditions (e.g., catecholamines, BP and others) on cardiac remodelling in a pathological stress.
Author Contributions
Conceptualization, S.-E. T., É.W.-W, S.B., M.A. and J.C.; methodology, S.-E. T., É.W.-W., A.M.-G., S. B., A. C., and J.C.; validation, S.-E. T., É.W.-W. and J.C.; formal analysis, S.-E. T., É.W.-W., and J.C.; investigation, S.-E. T., É.W.-W., E.-A.L., M.-E. L; data curation, S.-E. T., É.W.-W., and J.C.; writing—original draft preparation, S.-E. T., and J.C.; writing—review and editing, A. C., M.A. and J.C.; supervision, J.C.; project administration, J.C.; funding acquisition, M.A. A.C. and J.C. All authors have read and agreed to the published version of the manuscript.
Funding
This work was supported by grants from the Canadian Institutes for Health Research PJT-1665850 (to J. Couet and M. Arsenault) and from the Fondation de l’Institut universitaire de cardiologie et de pneumologie de Québec (to J. Couet and A. Caron).
Institutional Review Board Statement
The animal study protocol was approved by the Laval University Animal Protection Committee (protocols 2023-1549 and 2023-1550, approval February 2023).
Informed Consent Statement
The authors declare no conflict of interest.
Data Availability Statement
The authors will make the raw data supporting the conclusions of this article available on request.
Abbreviations
The following abbreviations are used in this manuscript:
| HFpEF | Heart failure with preserved ejection fraction |
| AngII | Angiotensin II |
| MHS | Metabolic and hypertensive stress (AngII + HFD) |
| HFD | High-fat diet |
| LA | Left atrial or left atrium |
| LV | Left ventricle |
| DOCA | Deoxycorticosterone acetate |
| CIH | Cold-induced hypertension |
| CICH | Cold-induced cardiac hypertrophy |
| CH | Cardiac hypertrophy |
| EF | Ejection fraction |
| UCP1 | Uncoupled protein 1 |
| ECM | Extracellular matrix |
| EDD | End-diastolic diameter |
| ESD | End-systolic diameter |
| RWT | Relative wall thickness |
| SV | Stroke volume |
| CO | Cardiac output |
| BW | Body weight |
| CSA | Cross-sectional area |
| FGF21 | Fibroblast growth factor 21 |
| 12-HOME | 2,13-double bond of octadeca-9,12-dienoic acid |
| L-NAME | L-NG-Nitroarginine Methyl Ester |
| BP | Blood pressure |
| EDV | End-diastolic volume |
| ESV | End-systolic volume |
| Nppa | Atrial natriuretic peptide |
| Nppb | Brain natriuretic peptide |
| Col1a | Pro-collagen1 alpha |
| Col3a | Pro-collagen3 alpha |
| Postn | Periostin |
| Thbs4 | Thrombospondin 4 |
| PW | Posterior wall |
| IVSW | Interventricular septal wall |
| SEM | Standard error of the mean |
| RWT | Relative LV wall thickness |
| Ppia | Cyclophilin A |
| RPL13 | L13 ribosomal protein |
| eNOS | Nitric oxide synthase, endothelial |
| iNOS | Nitric oxide synthase, inducible |
| TAC | Transverse aortic constriction |
| EF | Ejection fraction |
| AT2R | Angiotensin II receptor, type 2 |
| β3-AR | Adrenergic receptor, beta 3 |
| BAT | Brown adipose tissue |
| RAAS | Renin-angiotensin-aldosterone system |
| SNS | Sympathetic nervous system |
References
- Smith AN, Altara R, Amin G, Habeichi NJ, Thomas DG, Jun S, Kaplan A, Booz GW, Zouein FA. Genomic, Proteomic, and Metabolic Comparisons of Small Animal Models of Heart Failure With Preserved Ejection Fraction: A Tale of Mice, Rats, and Cats. J Am Heart Assoc. 2022 Aug 2;11(15):e026071. [CrossRef]
- Withaar C, Lam CSP, Schiattarella GG, de Boer RA, Meems LMG. Heart failure with preserved ejection fraction in humans and mice: embracing clinical complexity in mouse models. Eur Heart J. 2021 Nov 14;42(43):4420-4430. [CrossRef]
- Jasińska-Stroschein, M. Searching for Effective Treatments in HFpEF: Implications for Modeling the Disease in Rodents. Pharmaceuticals (Basel). 2023 Oct 12;16(10):1449. [CrossRef]
- Gao S, Liu XP, Li TT, Chen L, Feng YP, Wang YK, Yin YJ, Little PJ, Wu XQ, Xu SW, Jiang XD. Animal models of heart failure with preserved ejection fraction (HFpEF): from metabolic pathobiology to drug discovery. Acta Pharmacol Sin. 2024 Jan;45(1):23-35. [CrossRef]
- Reitman, ML. Of mice and men - environmental temperature, body temperature, and treatment of obesity. FEBS Lett. 2018 Jun;592(12):2098-2107. [CrossRef]
- James CM, Olejniczak SH, Repasky EA. How murine models of human disease and immunity are influenced by housing temperature and mild thermal stress. Temperature (Austin). 2022 Jul 15;10(2):166-178. [CrossRef]
- Keijer J, Li M, Speakman JR. What is the best housing temperature to translate mouse experiments to humans? Mol Metab. 2019 Jul;25:168-176. [CrossRef] [PubMed]
- Hankenson FC, Marx JO, Gordon CJ, David JM. Effects of Rodent Thermoregulation on Animal Models in the Research Environment. Comp Med. 2018 Dec 1;68(6):425-438. [CrossRef]
- Kowaltowski, AJ. Cold Exposure and the Metabolism of Mice, Men, and Other Wonderful Creatures. Physiology (Bethesda). 2022 Sep 1;37(5):0. [CrossRef]
- Chaudhary R, Suhan TK, Wu C, Alzamrooni A, Madamanchi N, Abdel-Latif A. Housing temperature influences metabolic phenotype of heart failure with preserved ejection fraction in J vs N strain C57BL/6 mice. Mol Cell Endocrinol. 2025 Mar 1;598:112457. [CrossRef]
- McLeod K, Datta V, Fuller S. Adipokines as Cardioprotective Factors: BAT Steps Up to the Plate. Biomedicines. 2025 Mar 13;13(3):710. [CrossRef]
- Sun, Z. Cardiovascular responses to cold exposure. Front Biosci (Elite Ed). 2010 Jan 1;2(2):495-503. [CrossRef]
- Aidara ML, Walsh-Wilkinson É, Thibodeau SÈ, Labbé EA, Morin-Grandmont A, Gagnon G, Boudreau DK, Arsenault M, Bossé Y, Couët J. Cardiac reverse remodeling in a mouse model with many phenotypical features of heart failure with preserved ejection fraction: effects of modifying lifestyle. Am J Physiol Heart Circ Physiol. 2024 Apr 1;326(4):H1017-H1036. [CrossRef]
- Walsh-Wilkinson É, Aidara ML, Morin-Grandmont A, Thibodeau SÈ, Gagnon J, Genest M, Arsenault M, Couet J. Age and sex hormones modulate left ventricle regional response to angiotensin II in male and female mice. Am J Physiol Heart Circ Physiol. 2022 Oct 1;323(4):H643-H658. [CrossRef]
- Walsh-Wilkinson E, Arsenault M, Couet J. Segmental analysis by speckle-tracking echocardiography of the left ventricle response to isoproterenol in male and female mice. PeerJ. 2021 Mar 12;9:e11085. [CrossRef]
- Labbé EA, Thibodeau SÈ, Walsh-Wilkinson É, Chalifour M, Sirois PO, Leblanc J, Morin-Grandmont A, Arsenault M, Couet J. Relative contribution of correcting the diet and voluntary exercise to myocardial recovery in a two-hit murine model of heart failure with preserved ejection fraction. Am J Physiol Heart Circ Physiol. 2025 Jul 1;329(1):H51-H68. [CrossRef]
- Zhao Z, Yang R, Li M, Bao M, Huo D, Cao J, Speakman JR. Effects of ambient temperatures between 5 and 35 °C on energy balance, body mass and body composition in mice. Mol Metab. 2022 Oct;64:101551. [CrossRef]
- Richard D, Labrie A, Rivest S. Tissue specificity of SNS response to exercise in mice exposed to low temperatures. Am J Physiol. 1992 May;262(5 Pt 2):R921-5. [CrossRef]
- Papanek PE, Wood CE, Fregly MJ. Role of the sympathetic nervous system in cold-induced hypertension in rats. J Appl Physiol (1985). 1991 Jul;71(1):300-6. [CrossRef]
- Dejima Y, Fukuda S, Ichijoh Y, Takasaka K, Ohtsuka R. Cold-induced salt intake in mice and catecholamine, renin and thermogenesis mechanisms. Appetite. 1996 Jun;26(3):203-19. [CrossRef]
- Sun Z, Fregly MJ, Cade JR. Effect of renal denervation on elevation of blood pressure in cold-exposed rats. Can J Physiol Pharmacol. 1995 Jan;73(1):72-8. [CrossRef]
- Sun Z, Cade R, Zhang Z, Alouidor J, Van H. Angiotensinogen gene knockout delays and attenuates cold-induced hypertension. Hypertension. 2003 Feb;41(2):322-7. [CrossRef]
- Chen GF, Sun Z. Effects of chronic cold exposure on the endothelin system. J Appl Physiol (1985). 2006 May;100(5):1719-26. [CrossRef]
- Fregly, MJ. Activity of the hypothalamic-pituitary-thyroid axis during exposure to cold. Pharmacol Ther. 1989;41(1-2):85-142. [CrossRef]
- Ribeiro MO, Carvalho SD, Schultz JJ, Chiellini G, Scanlan TS, Bianco AC, Brent GA. Thyroid hormone--sympathetic interaction and adaptive thermogenesis are thyroid hormone receptor isoform--specific. J Clin Invest. 2001 Jul;108(1):97-105. [CrossRef]
- Fregly MJ, Rossi F, Cade JR. A role for thyroid hormones in cold-induced elevation of blood pressure and cardiac hypertrophy. Can J Physiol Pharmacol. 1994 Sep;72(9):1066-74. [CrossRef]
- Maillet M, van Berlo JH, Molkentin JD. Molecular basis of physiological heart growth: fundamental concepts and new players. Nat Rev Mol Cell Biol. 2013 Jan;14(1):38-48. [CrossRef]
- Wang X, Skelley L, Wang B, Mejia A, Sapozhnikov V, Sun Z. AAV-based RNAi silencing of NADPH oxidase gp91(phox) attenuates cold-induced cardiovascular dysfunction. Hum Gene Ther. 2012 Sep;23(9):1016-26. [CrossRef]
- Chen PG, Sun Z. AAV Delivery of Endothelin-1 shRNA Attenuates Cold-Induced Hypertension. Hum Gene Ther. 2017 Feb;28(2):190-199. [CrossRef]
- Kong, X. , Liu, H., He, X., Sun, Y. and Ge, W. (2020). Unraveling the mystery of cold stress-induced myocardial injury. Front. Physiol. 11, 580811. [CrossRef]
- Portes AMO, Paula ABR, Miranda DC, Resende LT, Coelho BIC, Teles MC, Jardim IABA, Natali AJ, Castrucci AML, Isoldi MC. A systematic review of the effects of cold exposure on pathological cardiac remodeling in mice. J Therm Biol. 2023 May;114:103598. [CrossRef]
- Burns MPA, Reges CR, Barnhill SW, Koehler KN, Lewis BC, Colombo AT, Felter NJ, Schaeffer PJ. Chronic cold exposure causes left ventricular hypertrophy that appears to be physiological. J Exp Biol. 2024 Oct 15;227(20):jeb247476. [CrossRef]
- Lu S, Xu D. Cold stress accentuates pressure overload-induced cardiac hypertrophy and contractile dysfunction: role of TRPV1/AMPK-mediated autophagy. Biochem Biophys Res Commun. 2013 Dec 6;442(1-2):8-15. [CrossRef]
- Lin JR, Ding LL, Xu L, Huang J, Zhang ZB, Chen XH, Cheng YW, Ruan CC, Gao PJ. Brown Adipocyte ADRB3 Mediates Cardioprotection via Suppressing Exosomal iNOS. Circ Res. 2022 Jul 8;131(2):133-147. [CrossRef]
- Chen X, Bollinger E, Cunio T, Damilano F, Stansfield JC, Pinkus CA, Kreuser S, Hirenallur-Shanthappa D, Roth Flach RJ. An assessment of thermoneutral housing conditions on murine cardiometabolic function. Am J Physiol Heart Circ Physiol. 2022 Feb 1;322(2):H234-H245. [CrossRef]
- Alvarez-Gallego F, González-Blázquez R, Gil-Ortega M, Somoza B, Calderón-Dominguez M, Moratinos J, Garcia-Garcia V, Fernández P, González-Moreno D, Viana M, Alcalá M. Angiotensin II type 2 receptor as a novel activator of brown adipose tissue in obesity. Biofactors. 2023 Nov-Dec;49(6):1106-1120. [CrossRef]
- Nag S, Patel S, Mani S, Hussain T. Role of angiotensin type 2 receptor in improving lipid metabolism and preventing adiposity. Mol Cell Biochem. 2019 Nov;461(1-2):195-204. [CrossRef]
- Nag S, Khan MA, Samuel P, Ali Q, Hussain T. Chronic angiotensin AT2R activation prevents high-fat diet-induced adiposity and obesity in female mice independent of estrogen. Metabolism. 2015 Jul;64(7):814-25. [CrossRef]
- Than A, Xu S, Li R, Leow MK, Sun L, Chen P. Angiotensin type 2 receptor activation promotes browning of white adipose tissue and brown adipogenesis. Signal Transduct Target Ther. 2017 Jun 23;2:17022. [CrossRef]
Figure 1.
Effects of three different housing temperatures (10°C, 22°C or 30°C) on mouse body composition and food consumption. A. Schematic representation of the experimental design (Created in BioRender. Couet, J. (2025) https://BioRender.com/r27xz47). Eight-week-old C57BL/6J male and female mice were housed individually for 5 weeks (1 week of acclimatization and 4 weeks for the protocol). All mice were fed a standard diet described in the Materials and Methods section. After one week, the MHS was started in half of the mice for four weeks. B. Body weight, C. Body fat (%), D. Lean mass (%), E. Tibial length and F. Daily food consumption. Graphs of females (top, orange) and males (bottom, blue). Results are expressed as mean ± standard error of the mean (SEM). One-way ANOVA followed by Holm-Sidak post-test. *: p<0.05, **: p<0.01, ***: p<0.001 and ****: p<0.0001 between indicated groups (n=6 mice/group).
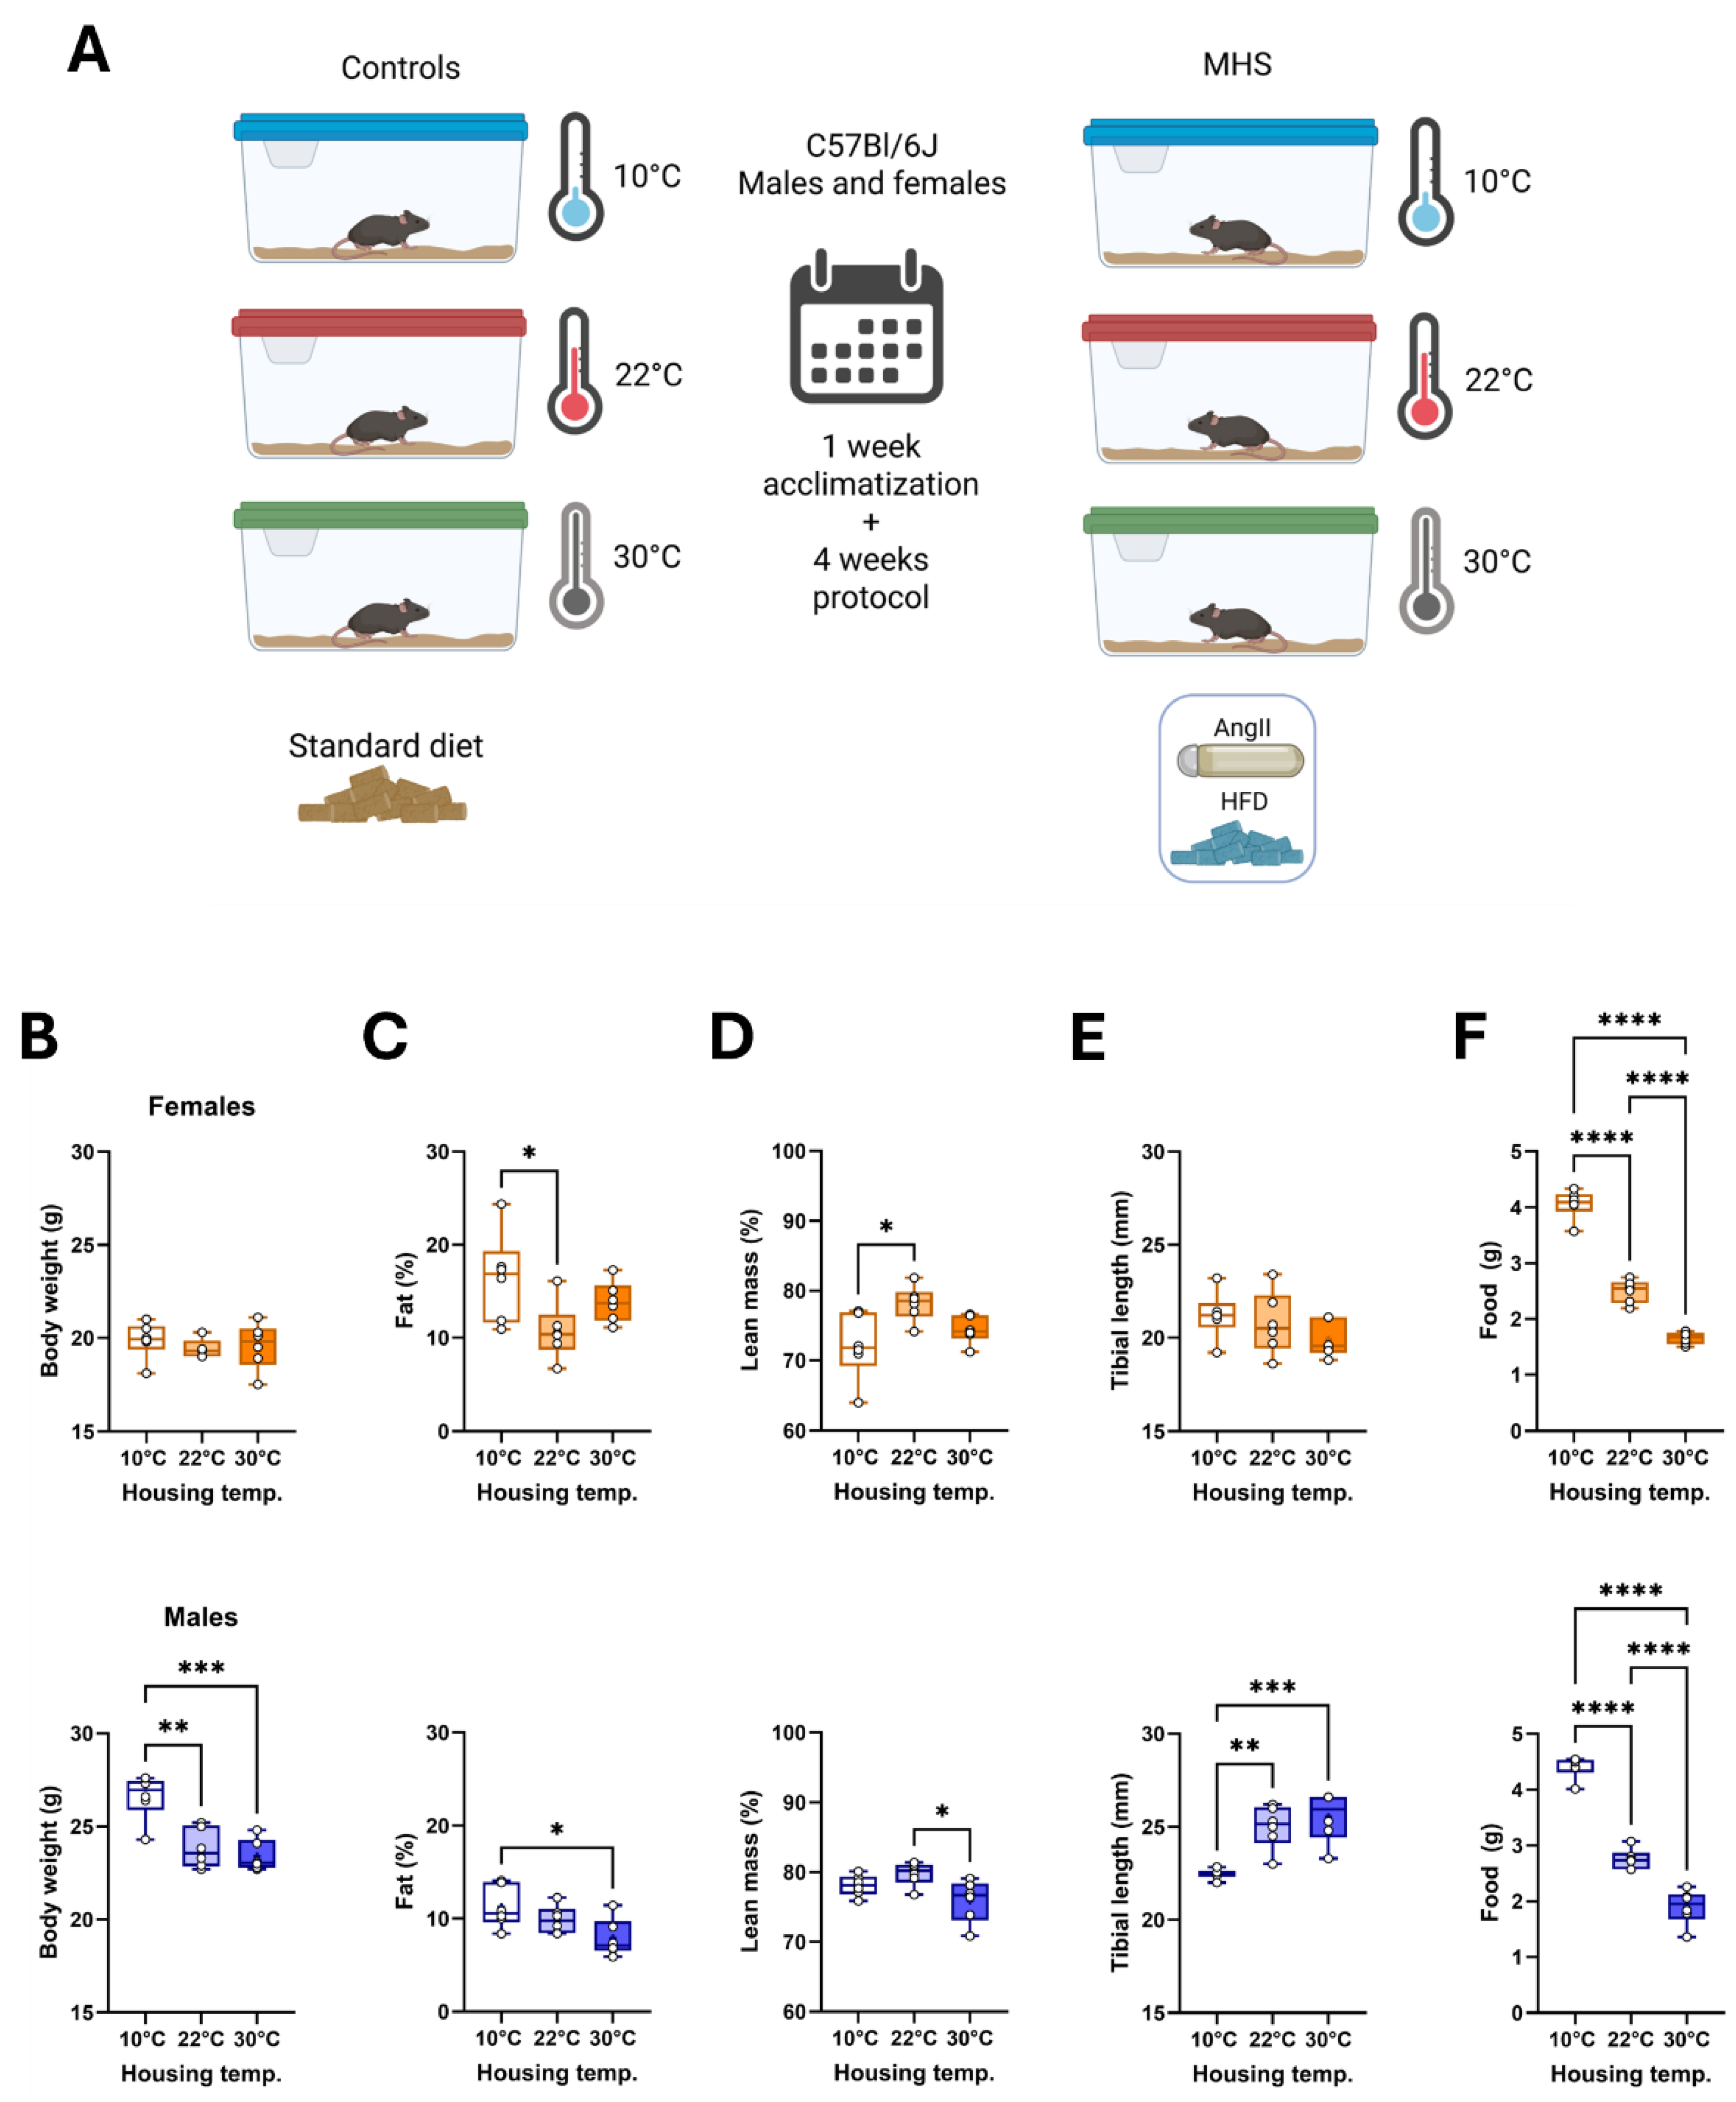
Figure 2.
Effects of three different housing temperatures (10°C, 22°C or 30°C) on mouse cardiac morphology and function. A. Indexed heart weight for the tibial length, B. left atrial weight, C. Lungs wet weight, D. Lungs dry weight, E. End-diastolic volume (EDV), F. LV stroke volume (SV), G. Heart rate (HR) and H. Cardiac output. Results are expressed as mean ± SEM. One-way ANOVA followed by Holm-Sidak post-test. *: p<0.05, **: p<0.01, ***: p<0.001, and ****: p<0.0001 between indicated groups (n=6 mice/group).
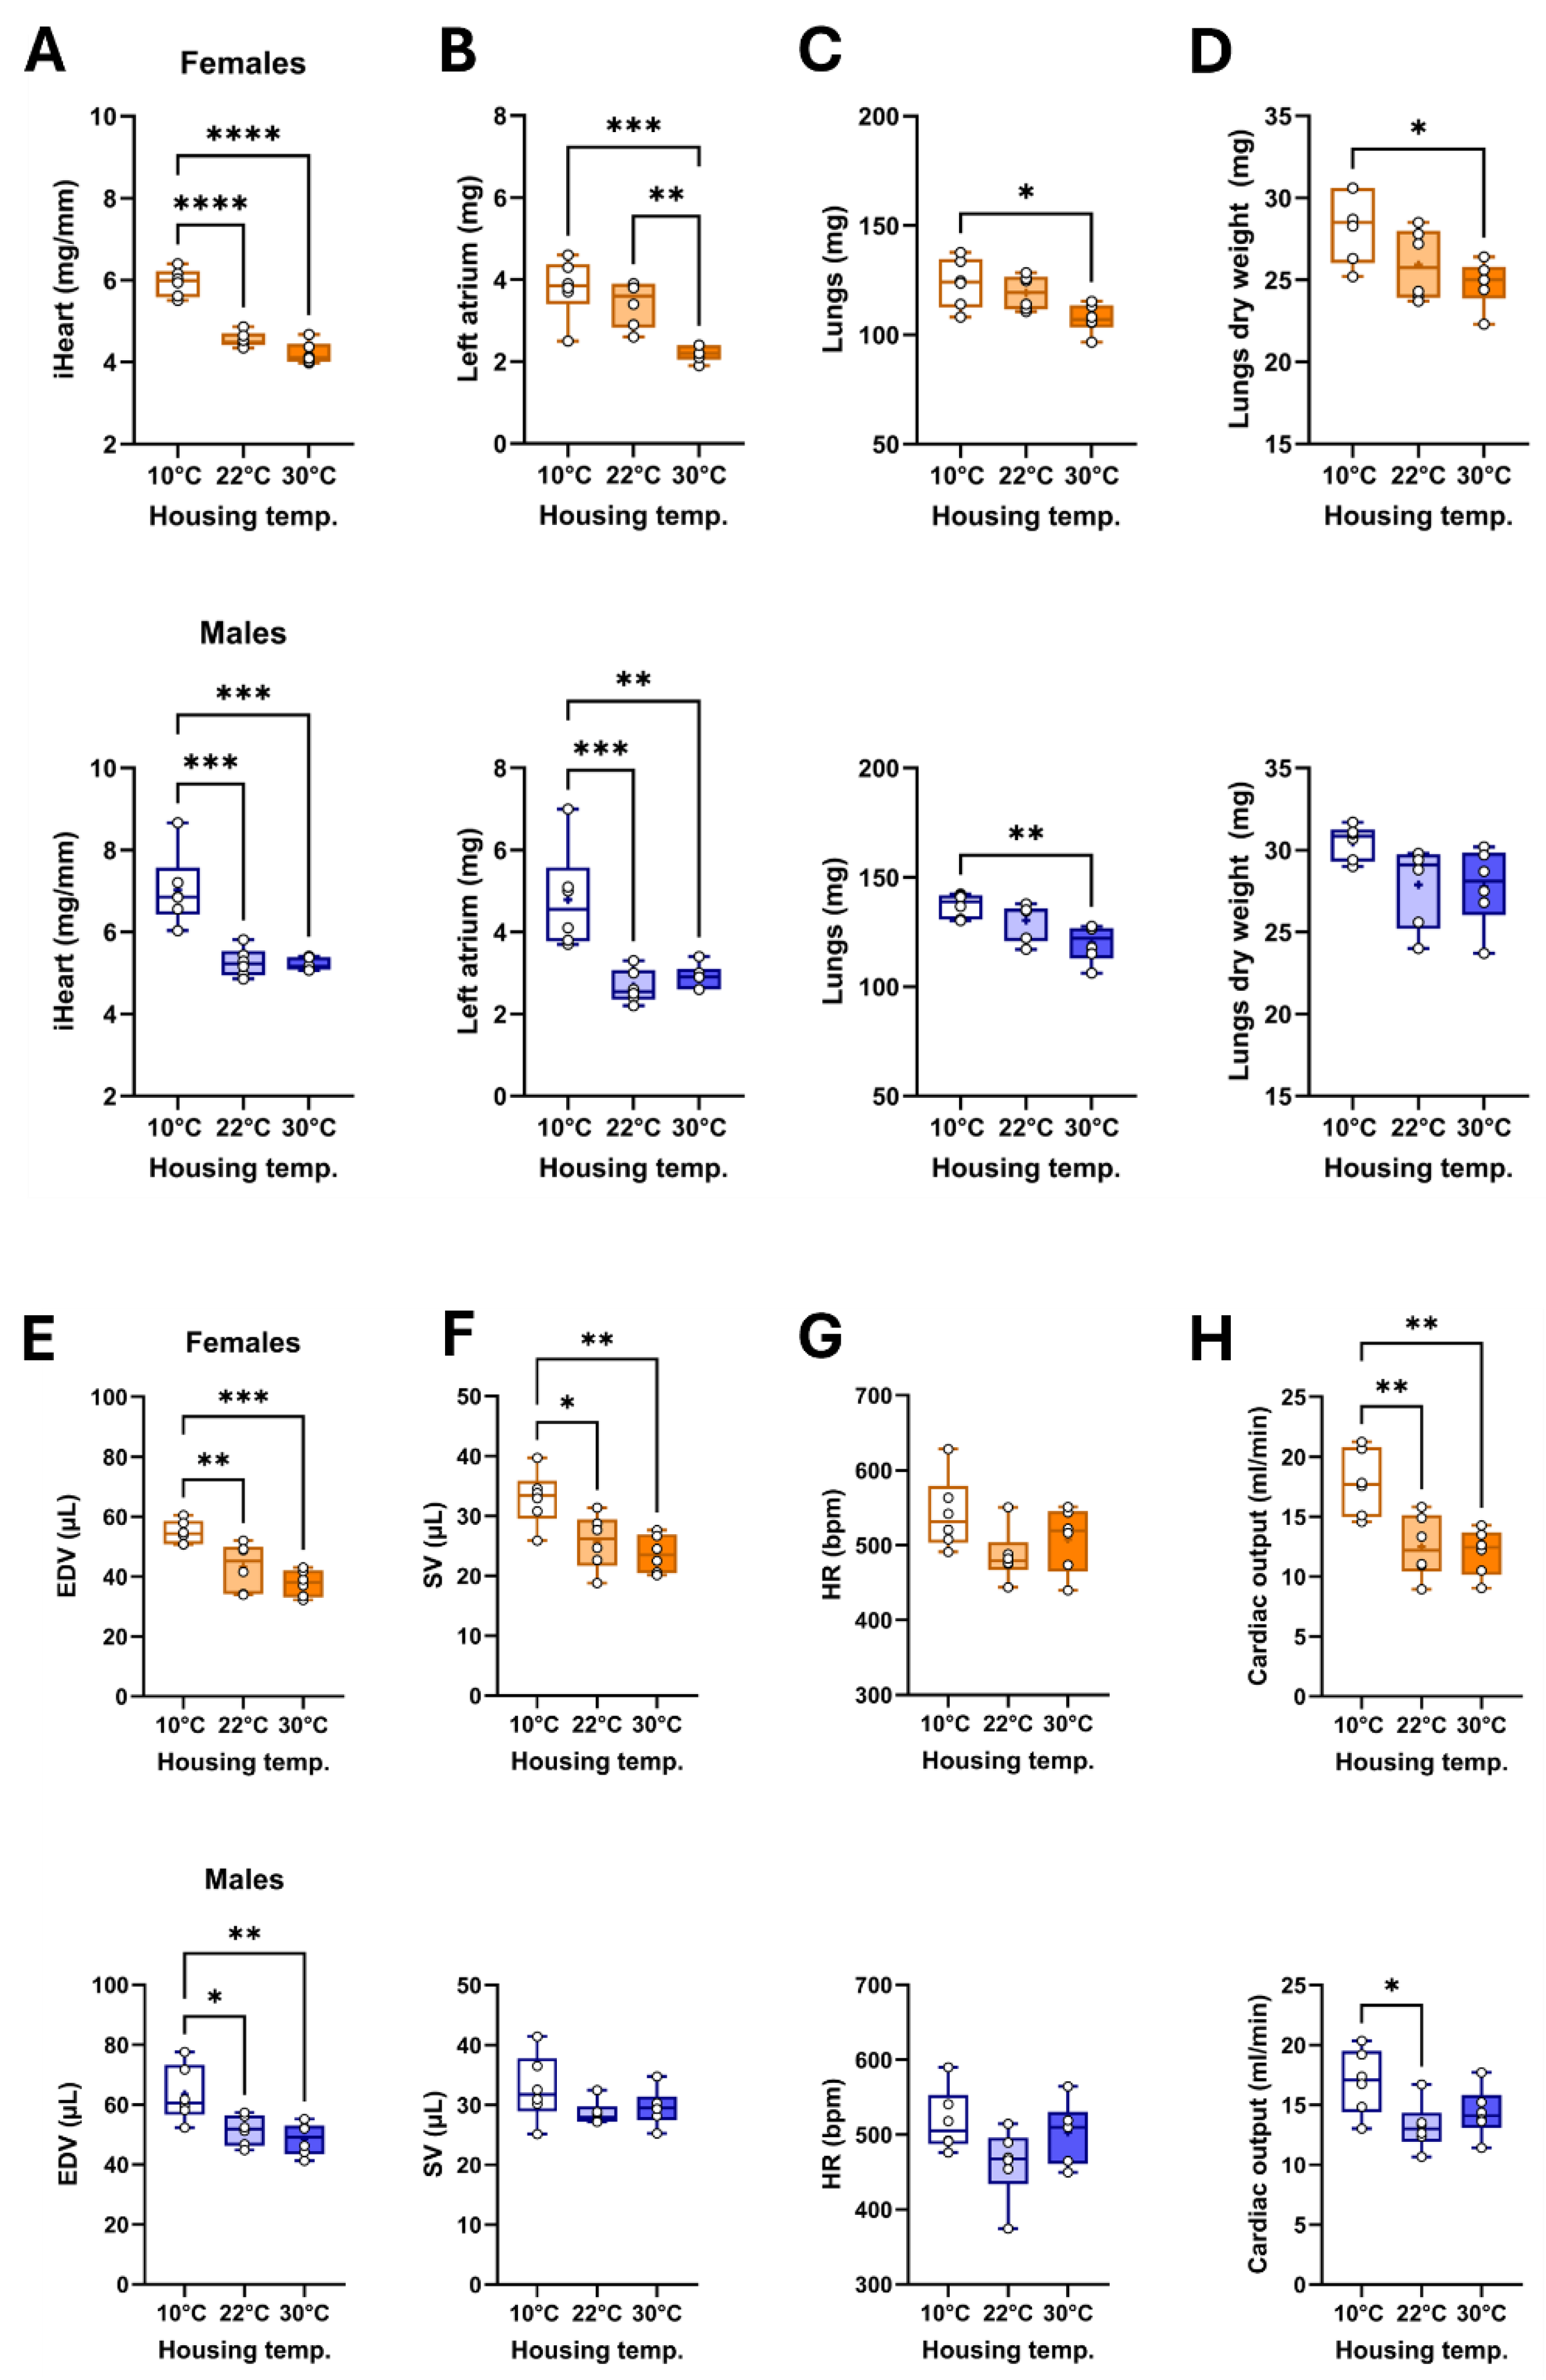
Figure 3.
Representative B-mode LV diastolic and systolic tracings of mice 5 weeks after being housed at 10°C, 22°C or 30°C.
Figure 3.
Representative B-mode LV diastolic and systolic tracings of mice 5 weeks after being housed at 10°C, 22°C or 30°C.
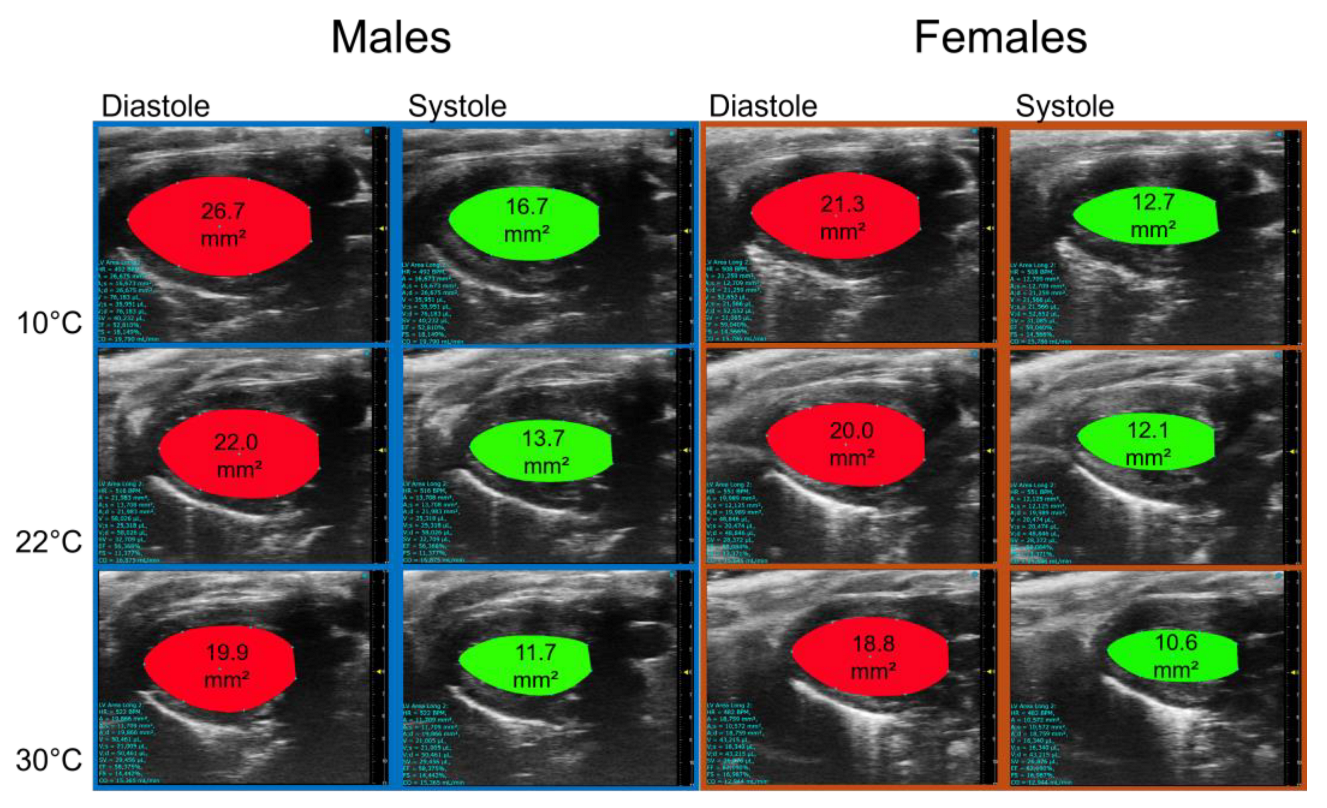
Figure 4.
Effects of three different housing temperatures (10°C, 22°C or 30°C) on LV dimensions and cardiomyocyte cross-sectional area (CSA). A. End-diastolic diameter (EDD), B. LV walls (posterior + septal) thickness, C. Relative wall thickness (RWT), D. LV mass. E. Representative images of picrosirius red staining of female and male heart sections, F. Representative images of WGA-FITC staining from LV sections of the various indicated groups. And G. CSA of cardiomyocytes was quantified by WGA-FITC staining. Results are expressed as mean ± SEM. One-way ANOVA followed by Holm-Sidak post-test. *: p<0.05, **: p<0.01, ***: p<0.001 and ****: p<0.0001 between indicated groups (n=6 mice/group).

Figure 5.
Effects of MHS (M) on mice housed at three different temperatures (10°C, 22°C or 30°C) on cardiac morphology and cardiomyocyte area compared to controls (C). A. Heart weight, B. Left atrial weight, C. Cross-sectional area, D. Cross-sectional area of cardiomyocytes stained with WGA-FITC, E. Representative images of picrosirius red staining of MHS female and male heart sections, F. Magnification of a mid-posterior wall section of control and MHS LV sections. Bar scale: 200 µm. G. Myocardial fibrosis (picrosirius red staining). Results are expressed as mean ± SEM. Two-way ANOVA followed by Holm-Sidak post-test. *: p<0.05, **: p<0.01, ***: p<0.001 and ****: p<0.0001 between indicated groups (n=6 mice/group).
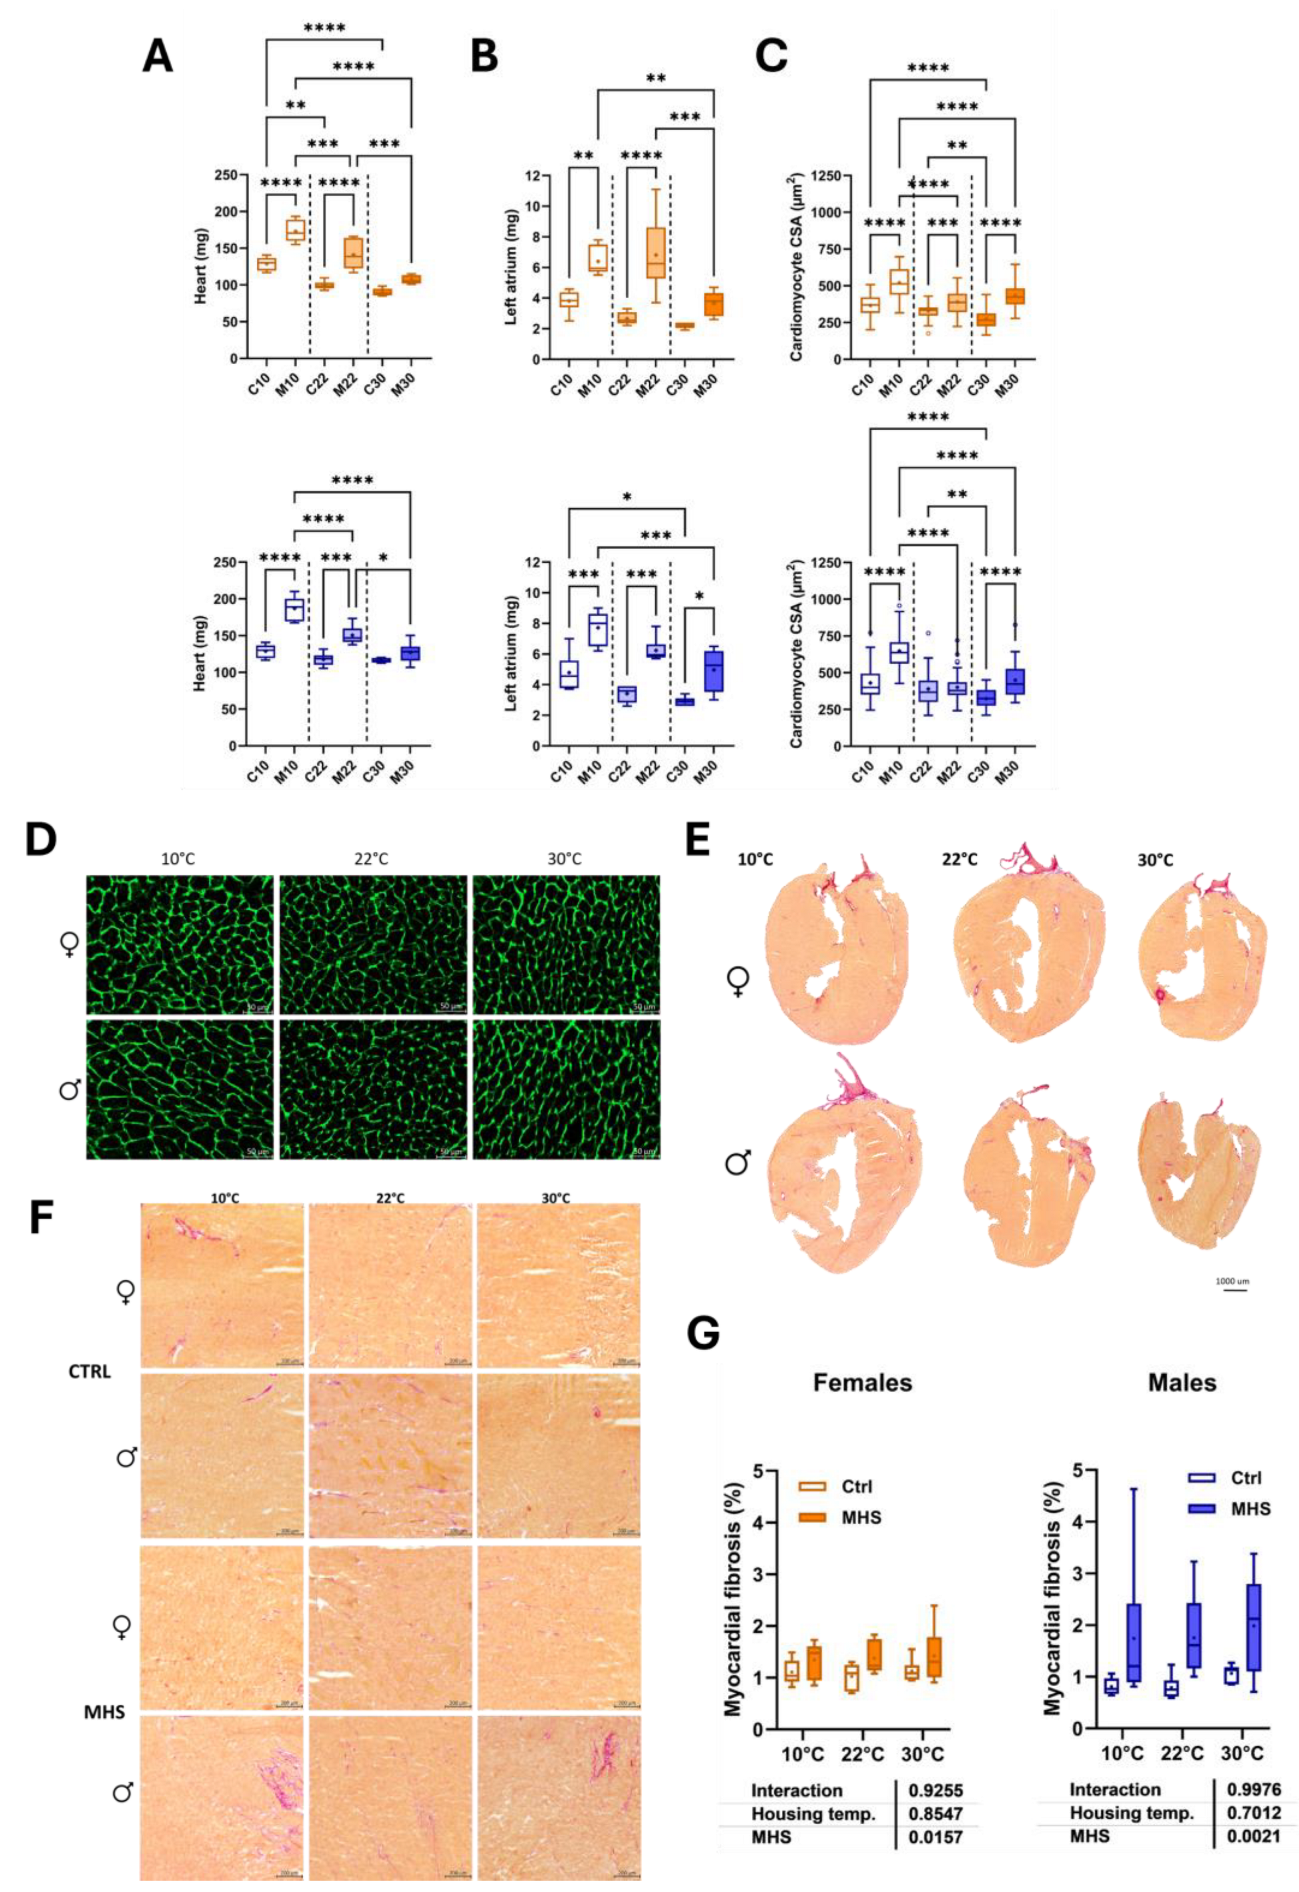
Figure 6.
Effects of MHS (M) on diastolic function echocardiography parameter in mice housed at three different temperatures (10°C, 22°C or 30°C). Controls. A. E wave velocity, B. A wave velocity, C. E/A ratio and D. E/E’ ratio. MHS. E. E wave velocity, F. E’ wave velocity, G. E/E’ ratio, H. Isovolumetric relaxation time (IVRT), I. LA diameter and J. Isovolumetric contraction time (IVCT). Lines in Graphs E to J represent the average value of this parameter in control mice. Darker to light colours: 10°, 22° and 30°C, respectively. Results are expressed as mean ± SEM—one-way ANOVA followed by Holm-Sidak post-test. Comparisons to controls were analyzed using T-tests. *: p<0.05, **: p<0.01, ***: p<0.001 and ****: p<0.0001 between indicated groups (n=6 mice/group).
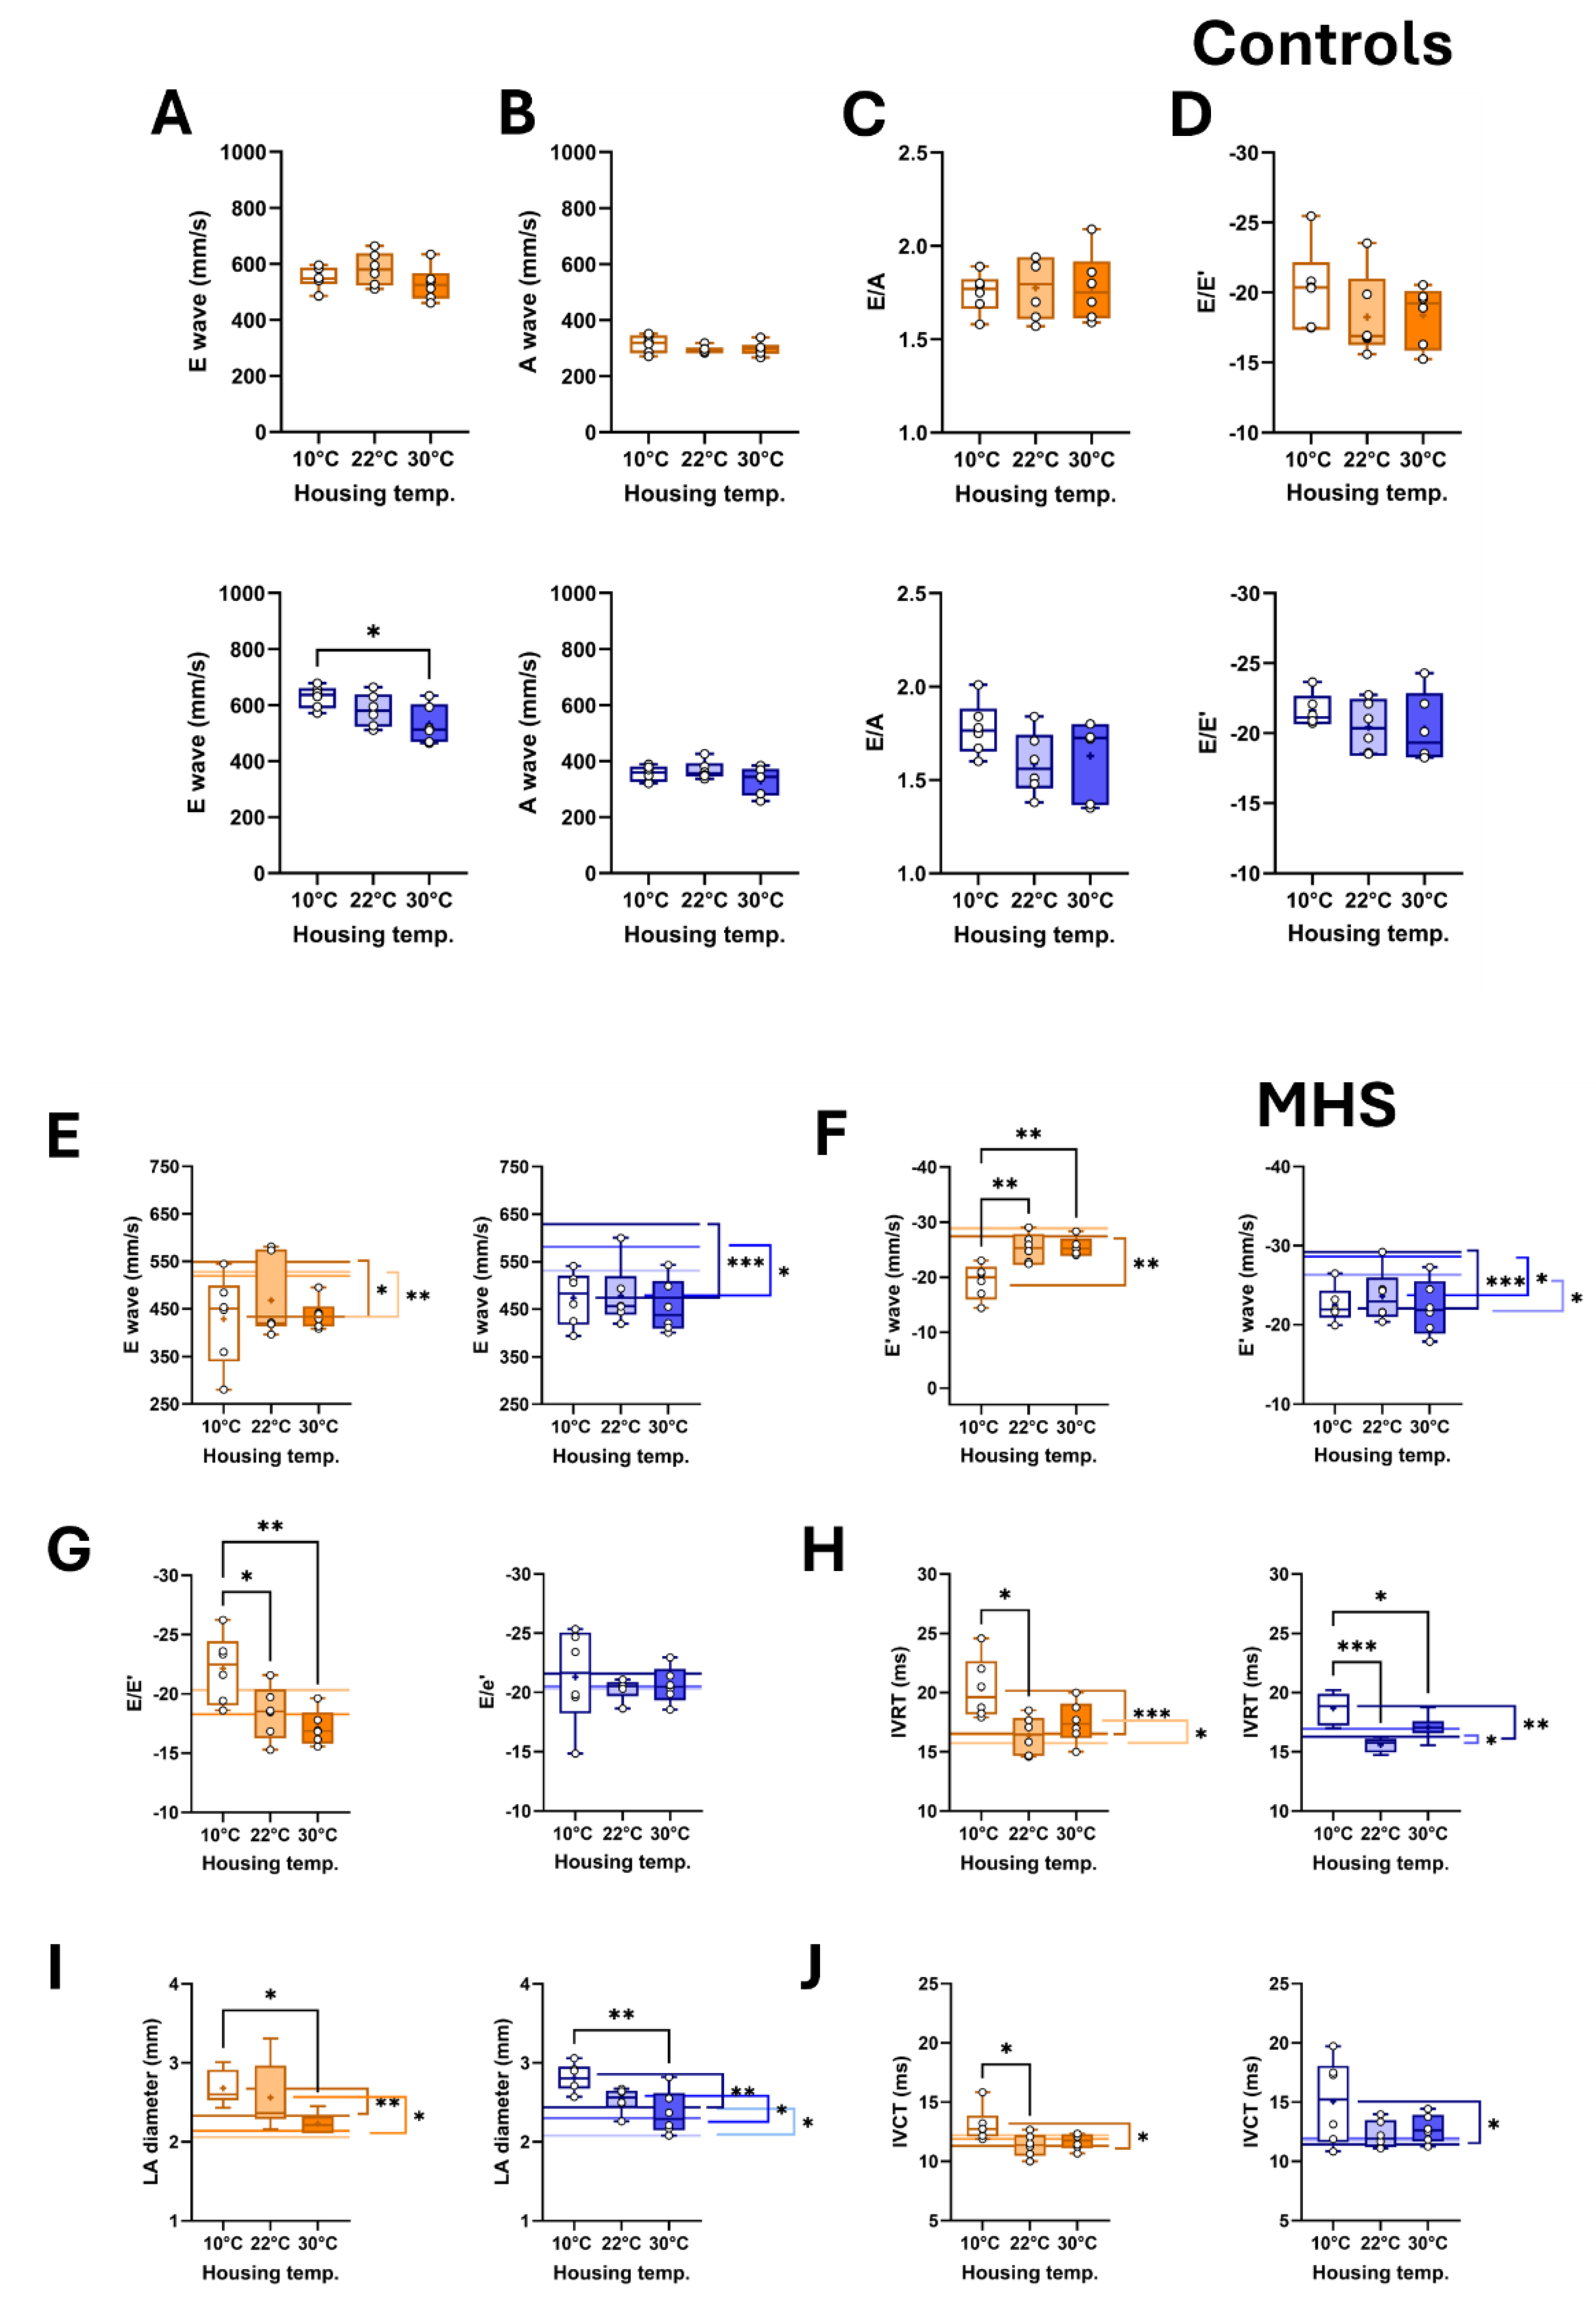
Figure 7.
Representative B-mode LV diastolic and systolic tracings of control (Ctrl) and MHS housed at 10°C.
Figure 7.
Representative B-mode LV diastolic and systolic tracings of control (Ctrl) and MHS housed at 10°C.
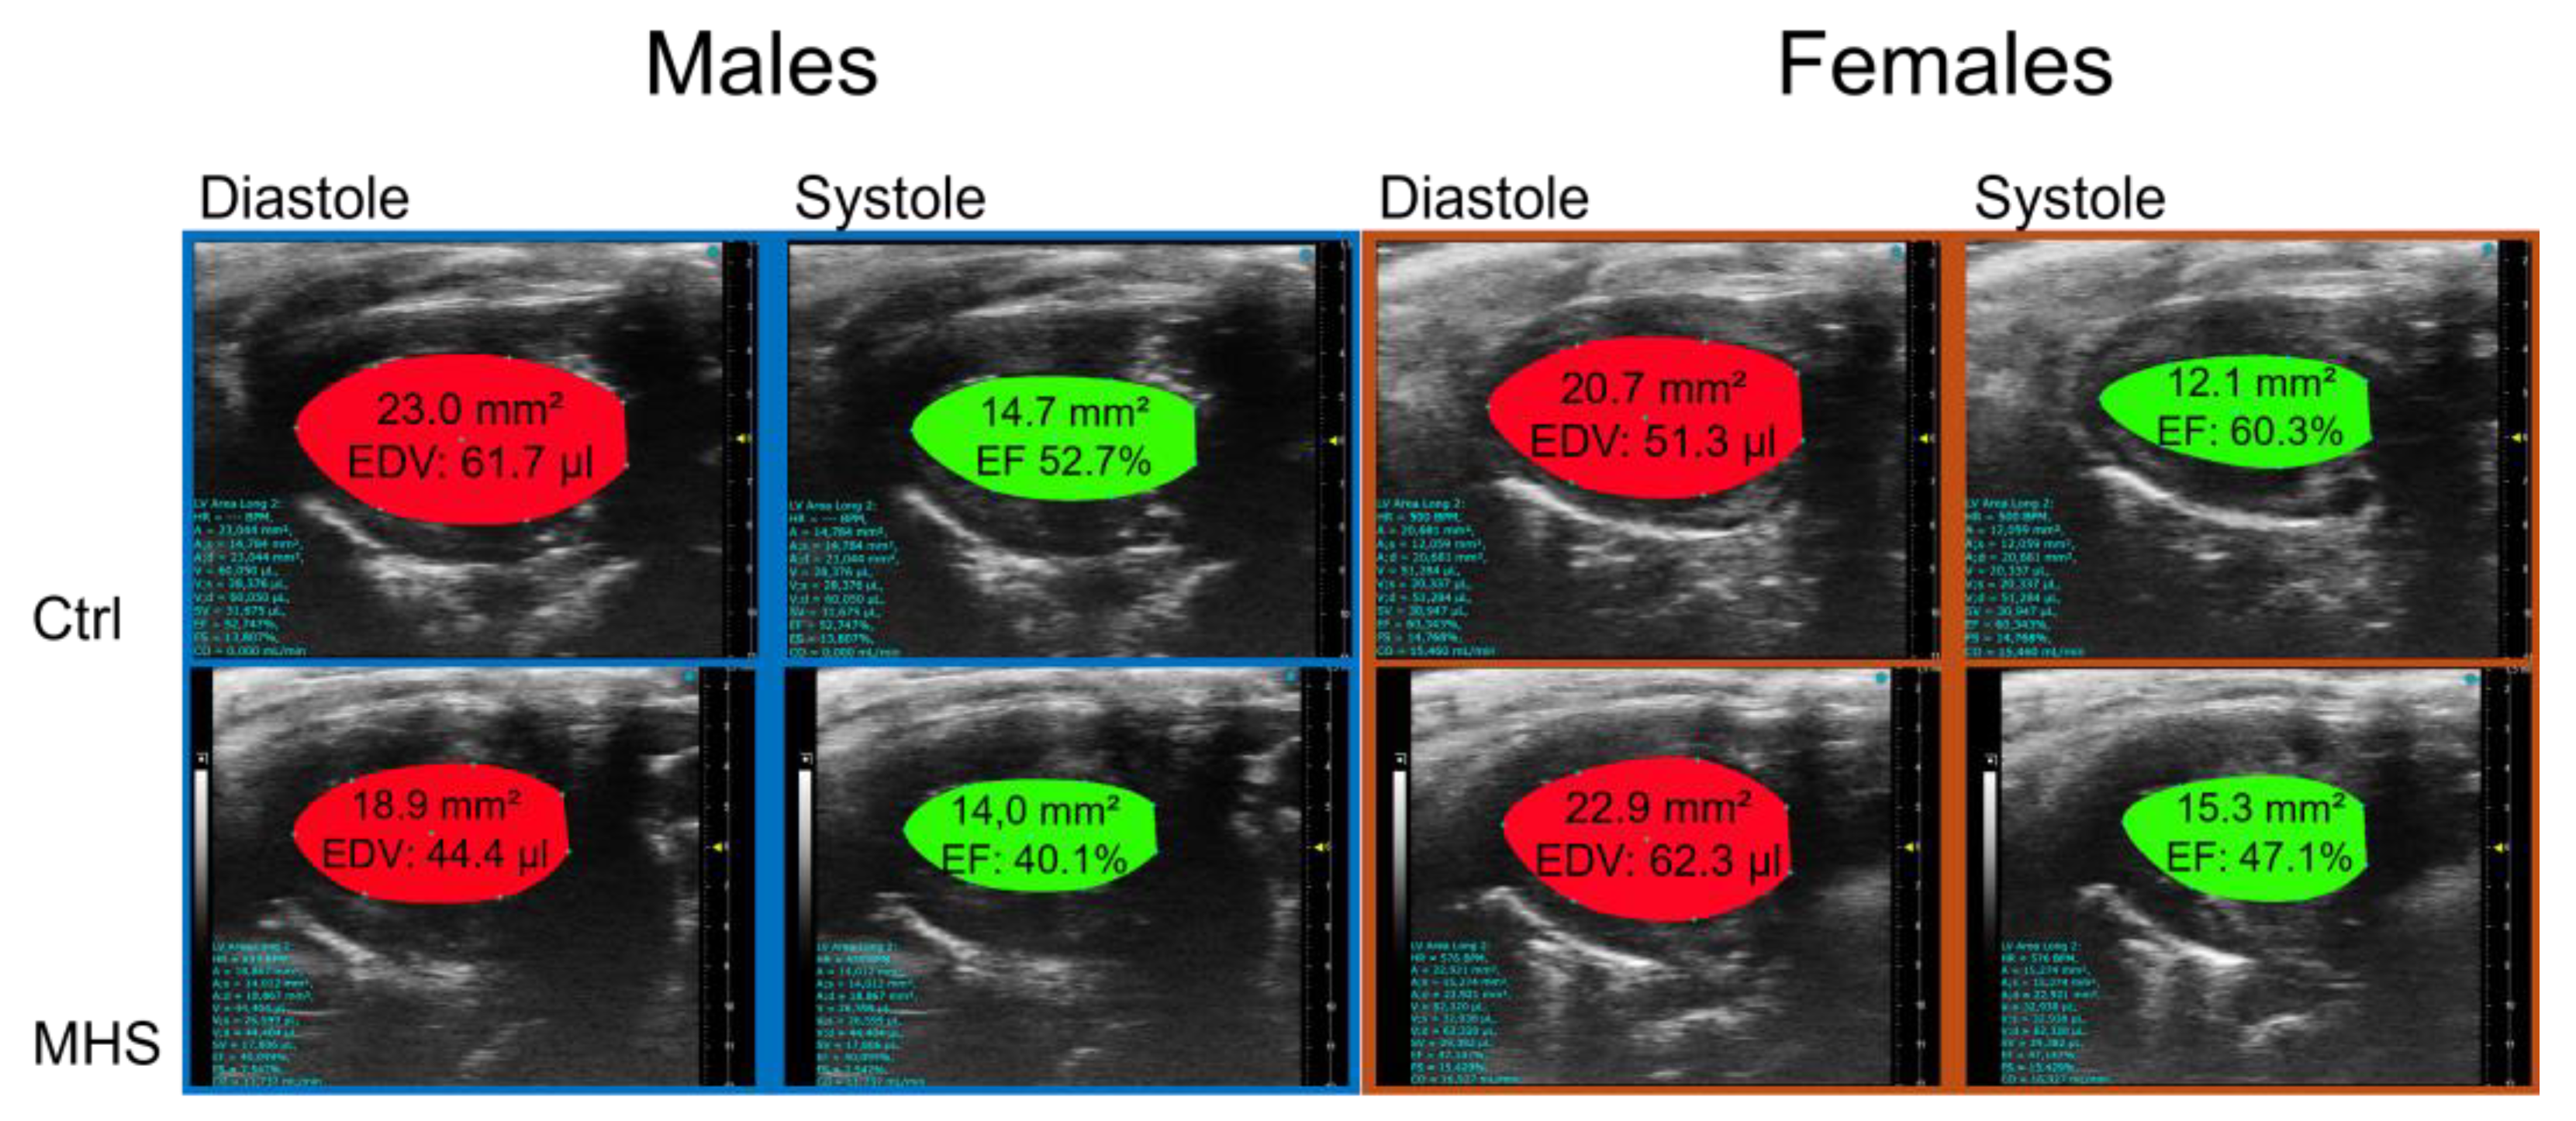
Figure 8.
Modulation of LV gene expression after MHS in mice housed at three different temperatures. A. Nppa, atrial natriuretic peptide. B. Nppb, brain natriuretic peptide. C. Col1a1, Collagen 1α1, D. Col3a1, Collagen 3α1, E. Postn, periostin and F. Tbsp4, thrombospondin 4. Data are represented as mean ± SEM (n=6 per group). Two-way ANOVA followed by Holm-Sidak post-test. *: p<0.05, **: p<0.01, ***: p<0.001 and ****: p<0.0001 between indicated groups.
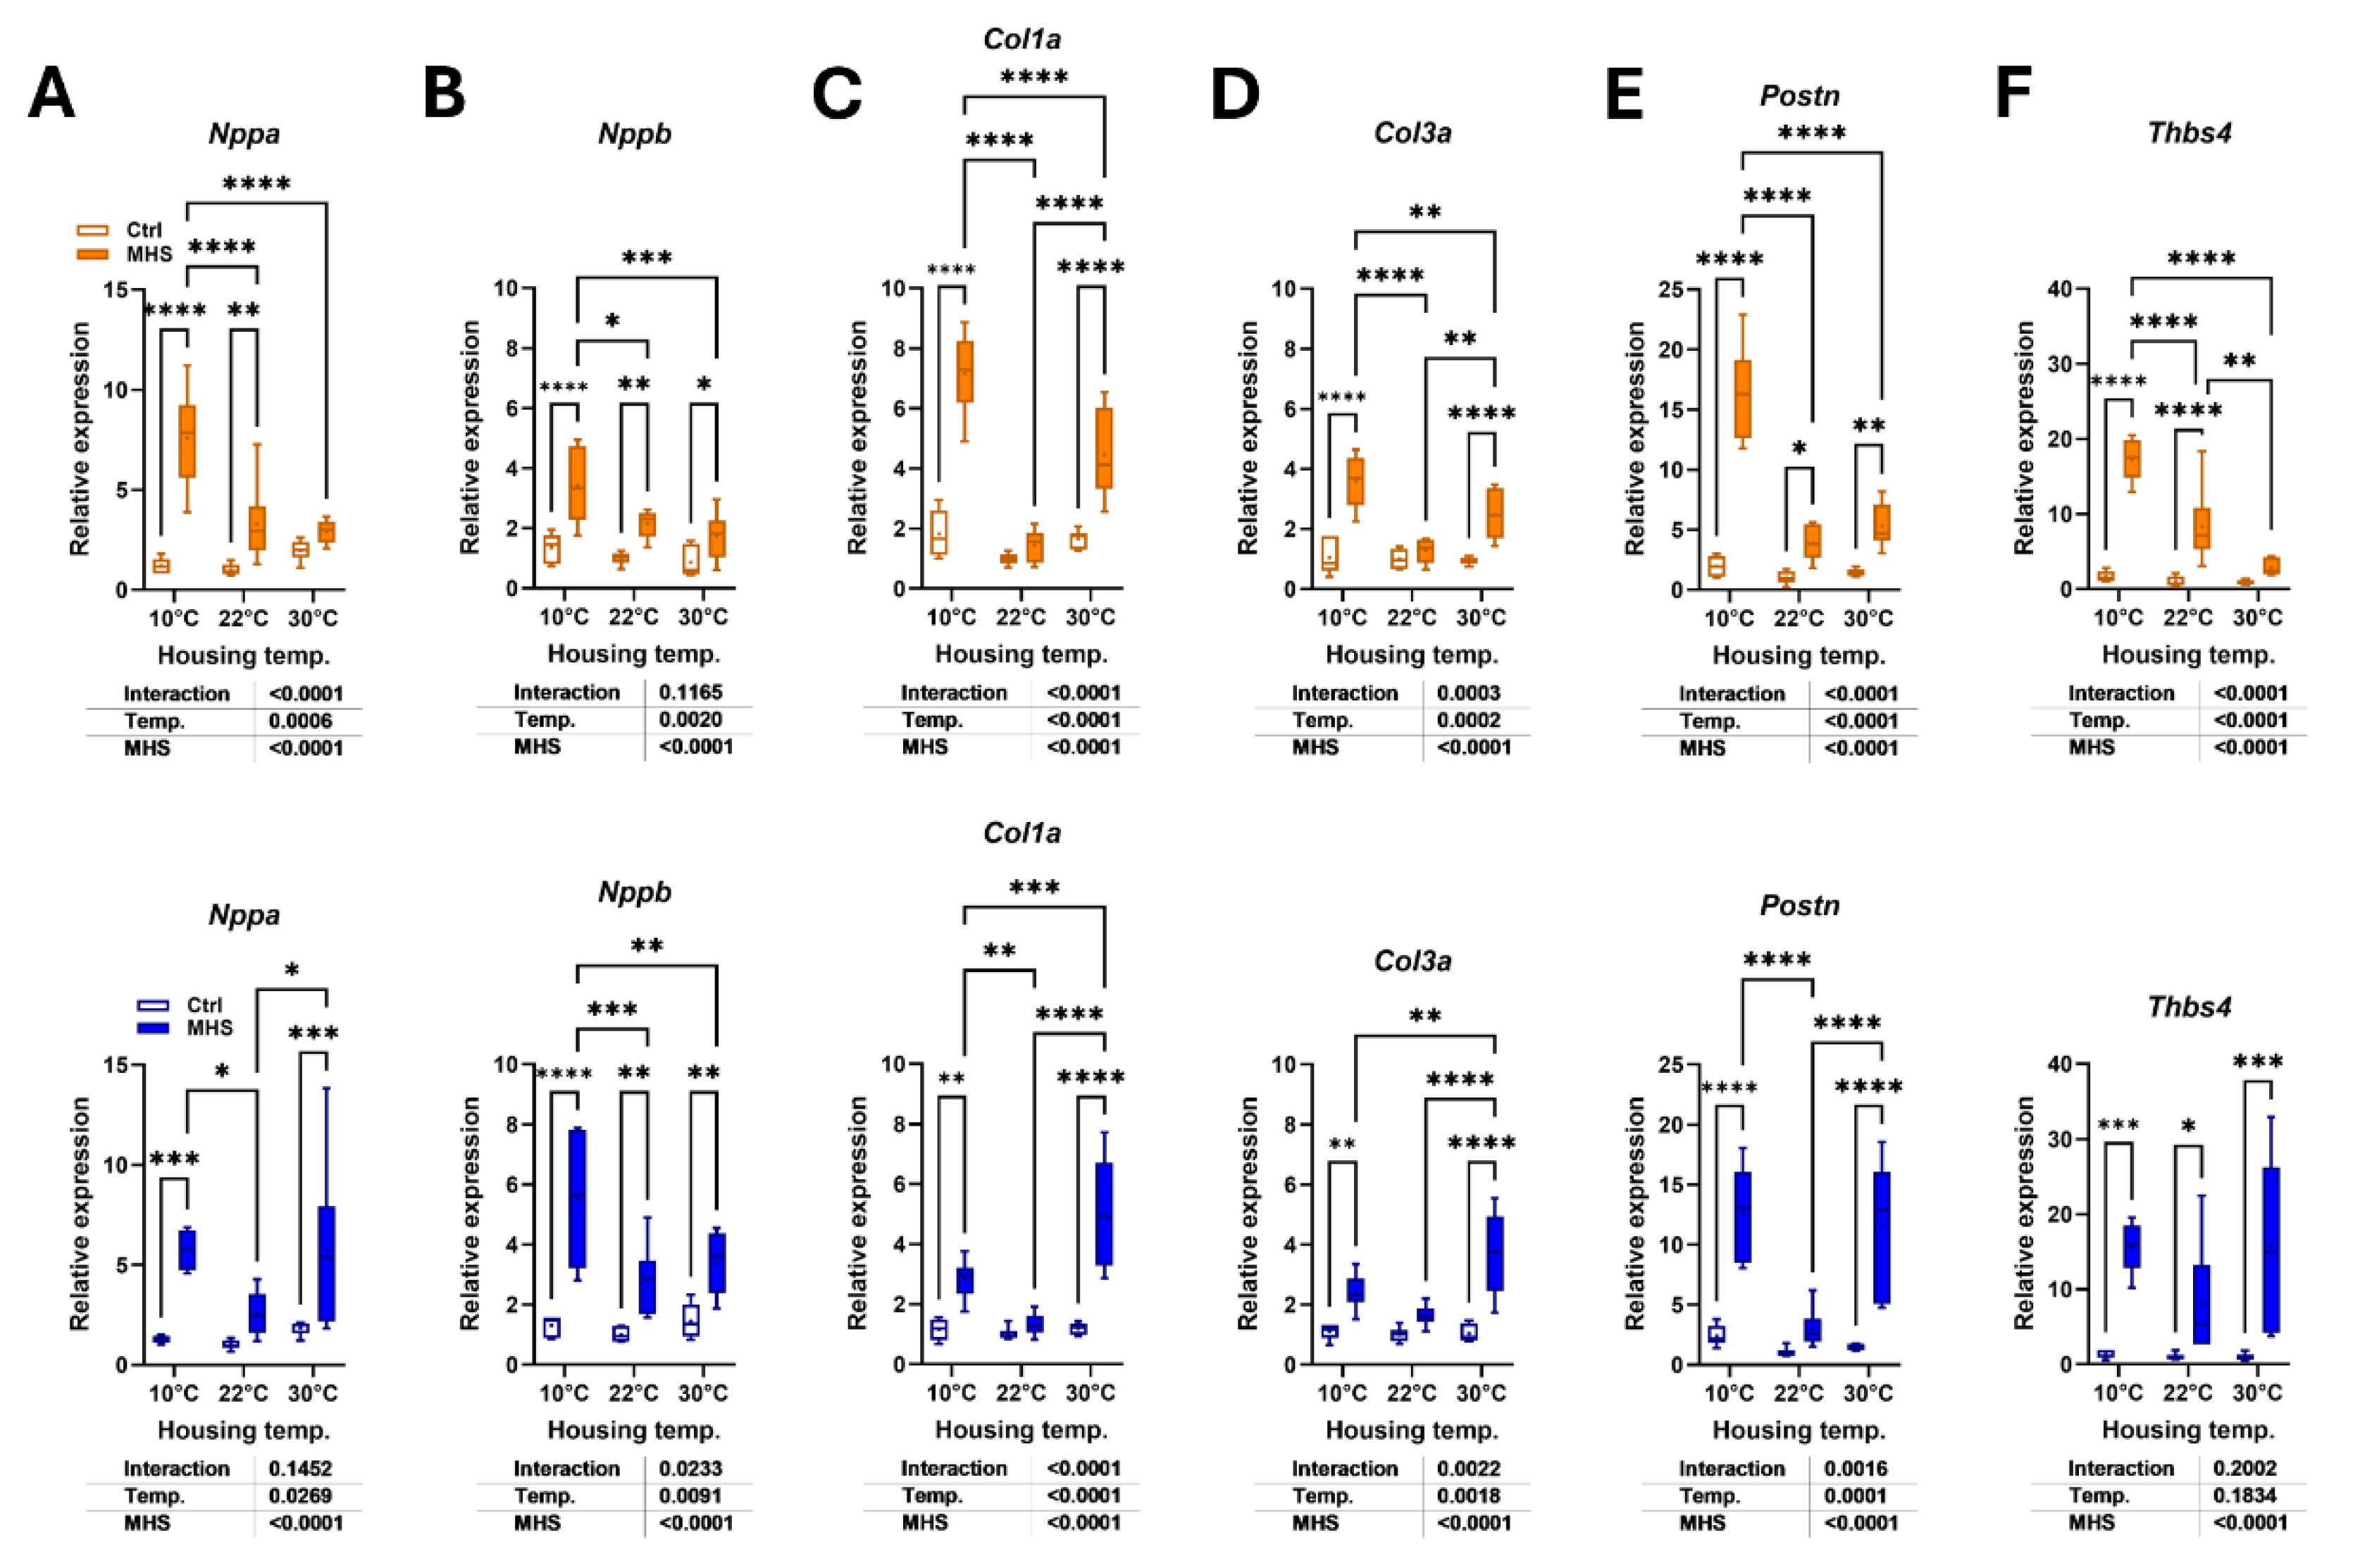
Figure 9.
Effects of housing temperature and MHS on brown adipose morphology. A. Scapular brown fat depot weight (BAT). B. Representative pictures of BAT depots for each control group. C. Hematoxylin/eosin staining of the BAT section from a mouse in each control group. D. Hematoxylin/eosin staining of BAT section from a mouse of each MHS group, E. Number of nuclei/field, F. Ucp1 or Uncoupled protein 1 gene expression in the BAT of control mice, G. BAT Ucp1 expression in mice at 30°C after the MHS. H. Average daily food consumption (KCalories per day; Kcal/day) for each mouse group. Data are represented as mean ± SEM (n=6 per group). One- or Two-way ANOVA followed by Holm-Sidak post-test. *: p<0.05, **: p<0.01, ***: p<0.001 and ****: p<0.0001 between indicated groups.
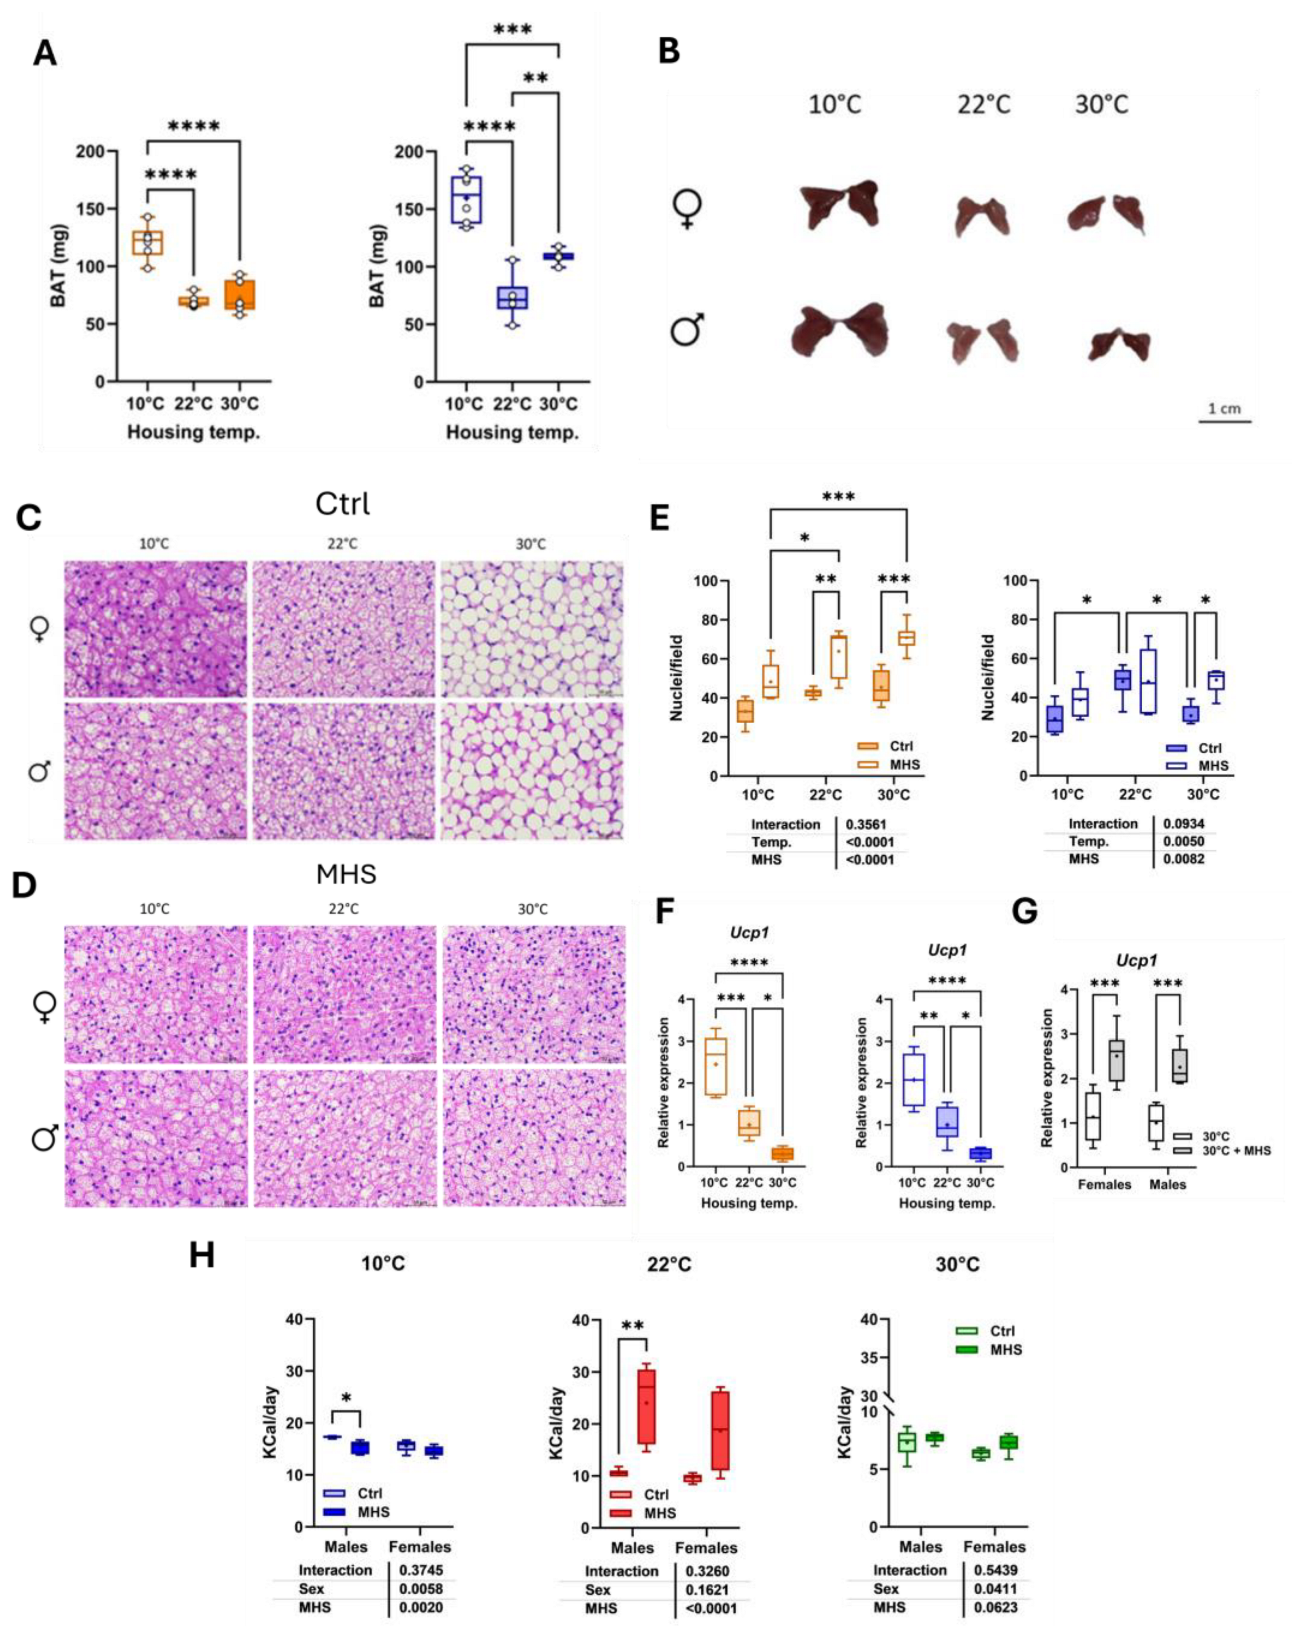

Table 1.
Sequences of primers used in this study.
| Symbol | Description | Forward sequence Reverse sequence |
|---|---|---|
| Col1a1 | Collagen Type I Alpha 1 Chain | 5’-CAT TGT GTA TGC AGC TGA CTT C-3’ 5’CGC AAA CAC TCT ACA TGT CTA GG-3’ |
| Col3a1 | Collagen Type III Alpha 1 Chain | 5’-TCT CTA GAC TCA TAG GAC TGA CC-3’ 5’ TTC TTC TCA CCC TTC TTC ATC C-3’ |
| Nppa | Natriuretic Peptide B | 5’-CTC CTT GGC TGT TAT CTT CGG-3’ 5’-GGG TAG GAT TGA CAG GAT TGG-3’ |
| Nppb | Natriuretic Peptide A | 5’-AGG TGA CAC ATA TCT CAA GCT G-3’ 5’-CTT CCT ACA ACA TCA GTG C-3’ |
| Ppia | Cyclophilin A | 5’-TTC ACC TTC CCA AAG ACC AC-3’ 5’-CAA ACA CAA ACG GTT CCC AG-3’ |
| Postn | Periostin | 5’-GCT TTC GAG AAA CTG CCA CG-3’ 5’-ATG GTC TCA AAC ACG GCT CC-3’ |
| Thbs4 | Thrombospondin 4 | 5’-GAT ACT GAC GGG GAT GGG AG-3’ 5’-CGT CAC TGT CTT GGT TGG TG-3’ |
| Ucp1 | Uncoupled protein 1 | 5’-GCT TCT ACG ACT CAG TCC AA-3’ 5’-CTC TGG GCT TGC ATT CTG AC-3’ |
Table 2.
Echo data in male and female mice after MHS (M) at three different housing temperatures (10°C, 22°C and 30°C). Controls (C). Standard echo left ventricle parameters after 4 weeks of MHS and after 4 weeks. Control mice were studied in parallel Echo exams as described in the Methods section. PWd: diastolic posterior wall thickness, IVSd: diastolic interventricular septum, EDD: end-diastolic LV diameter, ESD: end-systolic LV diameter, RWT: relative wall thickness, EDV: end-diastolic volume, ESV: end-systolic volume, SV: stroke volume, HR: heart rate, EF: ejection fraction, CO: cardiac output. Results are expressed as the mean ± SEM. P values were calculated using Student’s T-test. a: p<0.05 vs controls, b: p<0.01, c: p<0.001 and d: p<0.0001.
| Males | ||||||
| Parameters | C10 (n=6) | M10 (n=6) | C22(n=6) | M22(n=6) | C30(n=6) | M30(n=6) |
| PWd, mm | 0.85±0.012 | 1.11±0.035d | 0.78±0.017 | 1.05±0.032d | 0.76±0.011 | 1.10±0.038d |
| IVSd, mm | 0.76±0.010 | 0.93±0.024d | 0.71±0.017 | 0.94±0.043c | 0.67±0.019 | 0.89±0.027d |
| EDD, mm | 4.29±0.101 | 4.12±0.142 | 3.90±0.057 | 3.54±0.092b | 3.73±0.045 | 3.22±0.091c |
| ESD, mm | 3.25±0.104 | 3.18±0.128 | 2.93±0.088 | 2.42±0.116b | 2.57±0.051 | 2.09±0.102b |
| RWT | 0.38±0.009 | 0.50±0.031b | 0.38±0.012 | 0.57±0.032c | 0.38±0.008 | 0.62±0.023d |
| LV mass, mg | 133±5.2 | 171±3.8d | 103±2.6 | 132±5.0c | 90±3.1 | 115±8.7a |
| EDV, µl | 63±3.2 | 53±2.6a | 51±1.7 | 39±2.5b | 49±1.9 | 37±2.5b |
| ESV, µl | 31±1.9 | 29±1.6 | 23±1.4 | 17±2.0b | 19±1.3 | 14±1.7a |
| SV, mm | 32±1.9 | 24±1.8b | 29±0.7 | 22±1.3c | 30±1.1 | 23±1.1b |
| HR, bpm | 518±14.5 | 579±13.0 | 461±16.4 | 495±4.5 | 503±14.1 | 532±13.3 |
| EF, % | 52±1.8 | 44±1.8a | 56±1.6 | 58±1.1 | 62±1.6 | 63±1.4 |
| CO, ml/min | 16.9±0.93 | 13.7±0.94a | 13.9±0.69 | 9.8±0.75a | 14.4±0.71 | 12.4±0.54 |
|
Females |
||||||
| Parameters | C10 (n=6) | M10 (n=6) | C22(n=6) | M22(n=6) | C30(n=6) | M30(n=6) |
| PWd, mm | 0.85±0.017 | 1.11±0.043c | 0.72±0.009 | 0.96±0.034d | 0.72±0.009 | 0.89±0.018d |
| IVSd, mm | 0.73±0.097 | 0.96±0.037c | 0.70±0.011 | 0.87±0.034c | 0.67±0.011 | 0.88±0.030d |
| EDD, mm | 3.98±0.020 | 3.89±0.067 | 3.73±0.037 | 3.75±0.148 | 3.51±0.025 | 3.27±0.050b |
| ESD, mm | 2.88±0.098 | 3.02±0.090 | 2.67±0.054 | 2.67±0.054 | 2.30±0.030 | 2.15±0.044b |
| RWT | 0.40±0.014 | 0.53±0.024c | 0.38±0.006 | 0.50±0.034 | 0.40±0.004 | 0.54±0.015d |
| LV mass, mg | 115±4.8 | 161±8.8b | 89±2.2 | 127±3.9d | 78±2.0 | 98±4.1b |
| EDV, µl | 55±1.6 | 52±2.4 | 43±2.7 | 50±3.3 | 38±1.5 | 34±2.25 |
| ESV, µl | 22±0.8 | 27±1.1b | 18±1.3 | 24±2.0a | 14±0.8 | 12±1.3 |
| SV, mm | 33±1.9 | 26±1.9a | 26±1.6 | 26±1.8 | 24±1.1 | 21±1.1 |
| HR, bpm | 542±20.1 | 531±15.3 | 486±12.1 | 515±11.5 | 508±14.8 | 513±8.4 |
| EF, % | 60±2.0 | 49±3.2a | 59±1.3 | 59±1.1 | 63±1.4 | 64±2.0 |
| CO, ml/min | 17.8±1.12 | 13.7±1.09a | 12.5±0.90 | 13.6±0.96 | 12.0±0.67 | 11.0±0.66 |
Disclaimer/Publisher’s Note: The statements, opinions and data contained in all publications are solely those of the individual author(s) and contributor(s) and not of MDPI and/or the editor(s). MDPI and/or the editor(s) disclaim responsibility for any injury to people or property resulting from any ideas, methods, instructions or products referred to in the content. |
© 2025 by the authors. Licensee MDPI, Basel, Switzerland. This article is an open access article distributed under the terms and conditions of the Creative Commons Attribution (CC BY) license (http://creativecommons.org/licenses/by/4.0/).
Copyright: This open access article is published under a Creative Commons CC BY 4.0 license, which permit the free download, distribution, and reuse, provided that the author and preprint are cited in any reuse.


