
Submitted:
26 June 2025
Posted:
27 June 2025
You are already at the latest version
Abstract
Natural fiber-based biocomposite are increasingly favored in green engineering for their sustainable properties. Designing their Supply Chains (SCs) requires strategic decisions around pre-processing equipment while accounting for environmental, economic, social, and technical criteria. This article aims to introduce a comprehensive sustainability-based multicriteria decision-making framework for a hemp-based biocomposite SC design, using an Analytical Network Process (ANP) model incorporating both inner and outer dependencies among decision criteria and alternatives. Also, a nonlinear optimization-based sensitivity analysis model is proposed to assess the robustness of the decisions. A combination of full/half screen hammer mill and square/round baler, as pre-processing equipment options, are evaluated along with input data uncertainty. Evaluating four preprocessing scenarios, results show the round baler with half-screen hammer mill as the most sustainable option, while the full-screen and square baler setup performs best economically and environmentally. The trade-off analysis highlighted key drivers: demand-sensitive pricing, carcinogenic impact, job creation, and product quality.
Keywords:
biocomposites
; sustainability by design
; pre-processing equipment selection
; Analytic Network Process (ANP)
; scenario analysis
1. Introduction
Biocomposites are now well recognized for their role in promoting sustainability across multiple manufacturing industries such as automotive, construction, packaging, textiles, etc. [1]. Researchers are increasingly focusing on biocomposite material options to meet the demand for lighter structural products while addressing environmental concerns. These materials, which combine natural fibers such as jute, hemp, flax, and cotton with bio-based polymer matrices, offer a renewable and biodegradable alternative to traditional composites [2], [3]. Among plant-based natural fibers, hemp with legally permitted cultivation in Canada has gained significant attention for biocomposites production due to its potential to drive economic growth and support the Canadian economy [4]. The integration of hemp into composite products not only supports sustainability goals, but also presents cost-saving opportunities by reducing reliane on synthetic fibers [4]. Moreover, hemp’s strong mechanical and thermal properties highlight its potential in eco-friendly, structural (as well as non-structural) applications, reinforcing the importance of biocomposites in reducing environmental footprints [5].
Biocomposites production is a multifaceted process that involves interconnected operations within each given Supply Chain (SC). A typical SC includes critical stages such as the collection, transportation, pre-processing of the agri-industrial feedstock, and conversion of the feedstock to value-added product [6]. The overall effectiveness of the SC depends on strategic decisions regarding location, equipment, and materials during production [7]. Notably, the bulk of research published in such SC activities has considered purchasing, encompassing supplier sourcing, evaluation, development, and logistics between supplier and customer sites (for instance, 41.96% of the research has focused primarily on addressing supplier and facility location decisions [8], [9]). In the context of biocomposites, the natural fiber pre-processing, comprising particle size reduction and mechanical separation decisions, is a critical step in production [10]. Moreover, for the commercial application of biocomposites, the economic and environmental viability of these materials throughout the SC and during service is crucial [11], which can be assessed by examining Techno-Economic Analysis (TEA) and Life Cycle Assessment (LCA) models [12]. While many studies stated that biocomposites are more environmentally friendly than fossil fuel-based alternatives, only a limited number have utilized these comprehensive tools such as TEA and LCA within the SCs to substantiate these notions in detail [2]. A primary focus has been on the functional properties’ assessment of biocomposites [13], [14], and separately the economic and environmental aspects [15,16,17]. The natural fibers in such case studies have been considered as reinforcement, including wood fibers [18], bagasse fiber [19], flax fiber [20], vine shoots [21], sugarcane [22], etc. The study by Schmehl et al. [23] investigated a bus body component made from hemp natural fibers and a vegetable-based thermoset resin, highlighting its environmental benefits [23]. Another study by Haylock and Rosentrater [24] conducted a combined TEA-LCA to compare energy intensities and environmental impacts only during the production of PLA biocomposites, considering different fillers, processing methods, and end-of-life options [25].
From a managerial perspective, while economic and environmental assessments are often addressed in SC design, the lack of uncertainty analysis in defining sustainability metrics can limit the strategic insights that could support robust decision-making. This dimension has been also overlooked in prior SC methodologies considering biocomposites [26].
Furthermore, integrating social considerations, which is similarly largely overlooked [27], becomes essential for sustainable SC design of biocomposites, as industries are pressured to reduce greenhouse gas emissions in line with the European Green Deal and United Nations (UN) Sustainable Development Goals (SDG) [28]. Research on sustainable SC assessment predominantly emphasizes environmental (28%) and economic aspects with Net Present Value consideration (9%), with a limited focus on the social dimension (5%) [29]. While 17% address the Triple Bottom Line (TBL) approach, 40% examine the interplay between economic and environmental factors. Moreover, it is important to note that sustainability is often assessed using only a single metric, which varies depending on the study [29,30].
Chen et al. [31] investigated both the economic and social implications of biocomposites derived from potato pulp. In addition to TBL impacts (integrating the three sustainability dimensions), the life cycle engineering (including the technical or functional aspect) is another critical factor for ensuring the success of biocomposites in industrial applications [32,33]. High-performing biocomposites must maintain their mechanical properties and durability while offering sustainability advantages that attract both consumers and industries [33]. Product quality is essential for ensuring the material’s suitability for applications like injection molding. Maintaining quality not only contributes to environmental sustainability but also enhances the economic feasibility of biocomposites in commercial production [34]. Furthermore, the definition and selection of criteria indicators play a critical role in positively influencing the overall sustainability score. These indicators can be qualitative or quantitative, adding complexity to the decision-making phase [36].
In order to address the current gap on integrating the four sustainability dimensions of the biocomposites SC including economic, environmental, social and technical aspects, Multi-Criteria Decision Making (MCDM) approaches are deemed the most common tool, helping with resolving conflicting criteria and reaching key decisions among the feasible options/alternatives [37,38]. For instance, in the study by Chanpuypetch et al. [39], an integrated Analytic Hierarchy Process (AHP)-TOPSIS framework is used to assess bamboo-based products, highlighting its application in SC management for sustainable materials. By concurrently evaluating criteria such as production cost, market demand, and environmental impact, their model provided a systematic approach for product selection that could be adopted to biocomposites. Similarly, focusing on product quality, in a recent study, Saha et al. [40] employed the VIKOR method to evaluate the properties of different biocomposites for use in automobile interiors. By considering tensile strength, thermal stability, and moisture resistance, their research highlighted how bamboo-based biocomposites meet both performance requirements and sustainability goals [41]. Far too little attention has been paid to objectively evaluating the sustainability of biocomposites, focusing on the decisions involved in the pre-processing stage of biocomposite production [42]. These assessments are crucial for the industrial production and application of hemp, as they offer valuable sustainable insights into the research and capital investments needed to develop the infrastructure required to expand the industry [43].
Among different MCDM methods, some studies have applied the Analytic Network Process (ANP) method as an effective and well-established tool based on pairwise comparisons to address the interdependencies between decision factors [44]. ANP integrates both quantitative and qualitative criteria, yielding more realistic outcomes and providing managerial insights when systematically selecting suppliers, for example in [19,45]. The use of ANP in SC decision-making underscores its importance in navigating complex trade-offs, making it a valuable tool in biocomposite production [17].
In MCDM models, especially involving both qualitative and quantitative factors, results are often influenced by input data affected by personal opinions, cognitive biases, and measurement errors [46]. Hence, in such cases, sensitivity analysis is crucial for understanding how changes in criteria weights would impact decision rankings [47]. Several researchers have developed sensitivity analysis models for MCDM methods. For example, Masuda [48] and Huang [49] proposed models for AHP, while Chen and Kocaoglu [50] introduced an algorithm for hierarchical decision models. More recently, studies by Badi et al. [51] and Bouraima et al. [52] analyzed the effects of adjusting the most important criteria weights on the rankings of alternatives, offering insight into the stability of MCDM models. In other studies, weight fluctuations are examined, calculating the range within which rankings remained consistent [29], while some researchers introduced more advanced techniques including standard deviation to compare variations of alternative scores across MCDM methods [53,54].
Despite these advances in analyzing the sensitivity analysis results, most methods employed have been based on adjusting criteria weights manually, and few studies employed optimization models to calculate the minimum changes necessary to shift the ranking of alternatives. Wolters and Mareschal [55] and Sowlati and Asadi [56] addressed this by developing Linear Programming (LP) models for PROMETHEE and AHP, respectively, to calculate the minimum required changes in criteria weights to alter the top-ranked alternative. However, ANP remains underexplored in this area of research due to its complexity in modeling dependencies among elements. This highlights the need for a more systematic sensitivity analysis approach within ANP, providing decision-makers with a robust method to address uncertainties and interdependencies in ANP-based decision models, particularly for emerging SC designs including those of biocomposites.
Objective and Contribution of the Present Study
Further to the above review, no recent studies have investigated the sustainability criteria and assessment of biocomposites SC with a focus on cuncurrent economic, environmental, social, and technical criteria, while also incorporating possible interdependencies among these decision attributes themselves under an MCDM framework [36]. The only exception is the study by Ribeiro et al. [57], which focused on flax-fiber based biocomposites. Their analysis was limited to product cost under the economic category, environmental impacts on human health, ecosystems, and resources, and technical factors including product weight and performance. Finally, to the best of our knowledge, in the biocomposites area, there is a notable gap in sustainability decision-based studies focusing on the role of feedstock pre-processing equipment in a holistic view of the SC in order to achieve the sustainability across operations among entities.
Accordingly, this paper aims to develop a Analytic Network Process MCDM-based pre-processing equipment selection framework, through a hemp-based biocomposite SC design example. All the four sustainability dimensions/criteria are considered (economic, environmental, social, and technical), while also incorporating possible mutual interdependencies among the SC criteria as well as alternatives. The specific pre-processing equipment alternatives for biomass size reduction and collection are: (A) Full-screen hammer mill and Round baler combination (Full-Round), (B) Full-screen hammer mill and Square baler (Full-Square), (C) Half-screen hammer mill and Round baler (Half-Round), (D) Half-screen hammer mill and Square baler (Half-Square). Finally, a novel Non-Linear Programming (NLP)-based sensitivity analysis has been conducted over the ANP model, for automatically identifying potential decision rank reversal scenarios, and thereby assessing the robustness limit of the proposed framework.
2. Materials and Methods
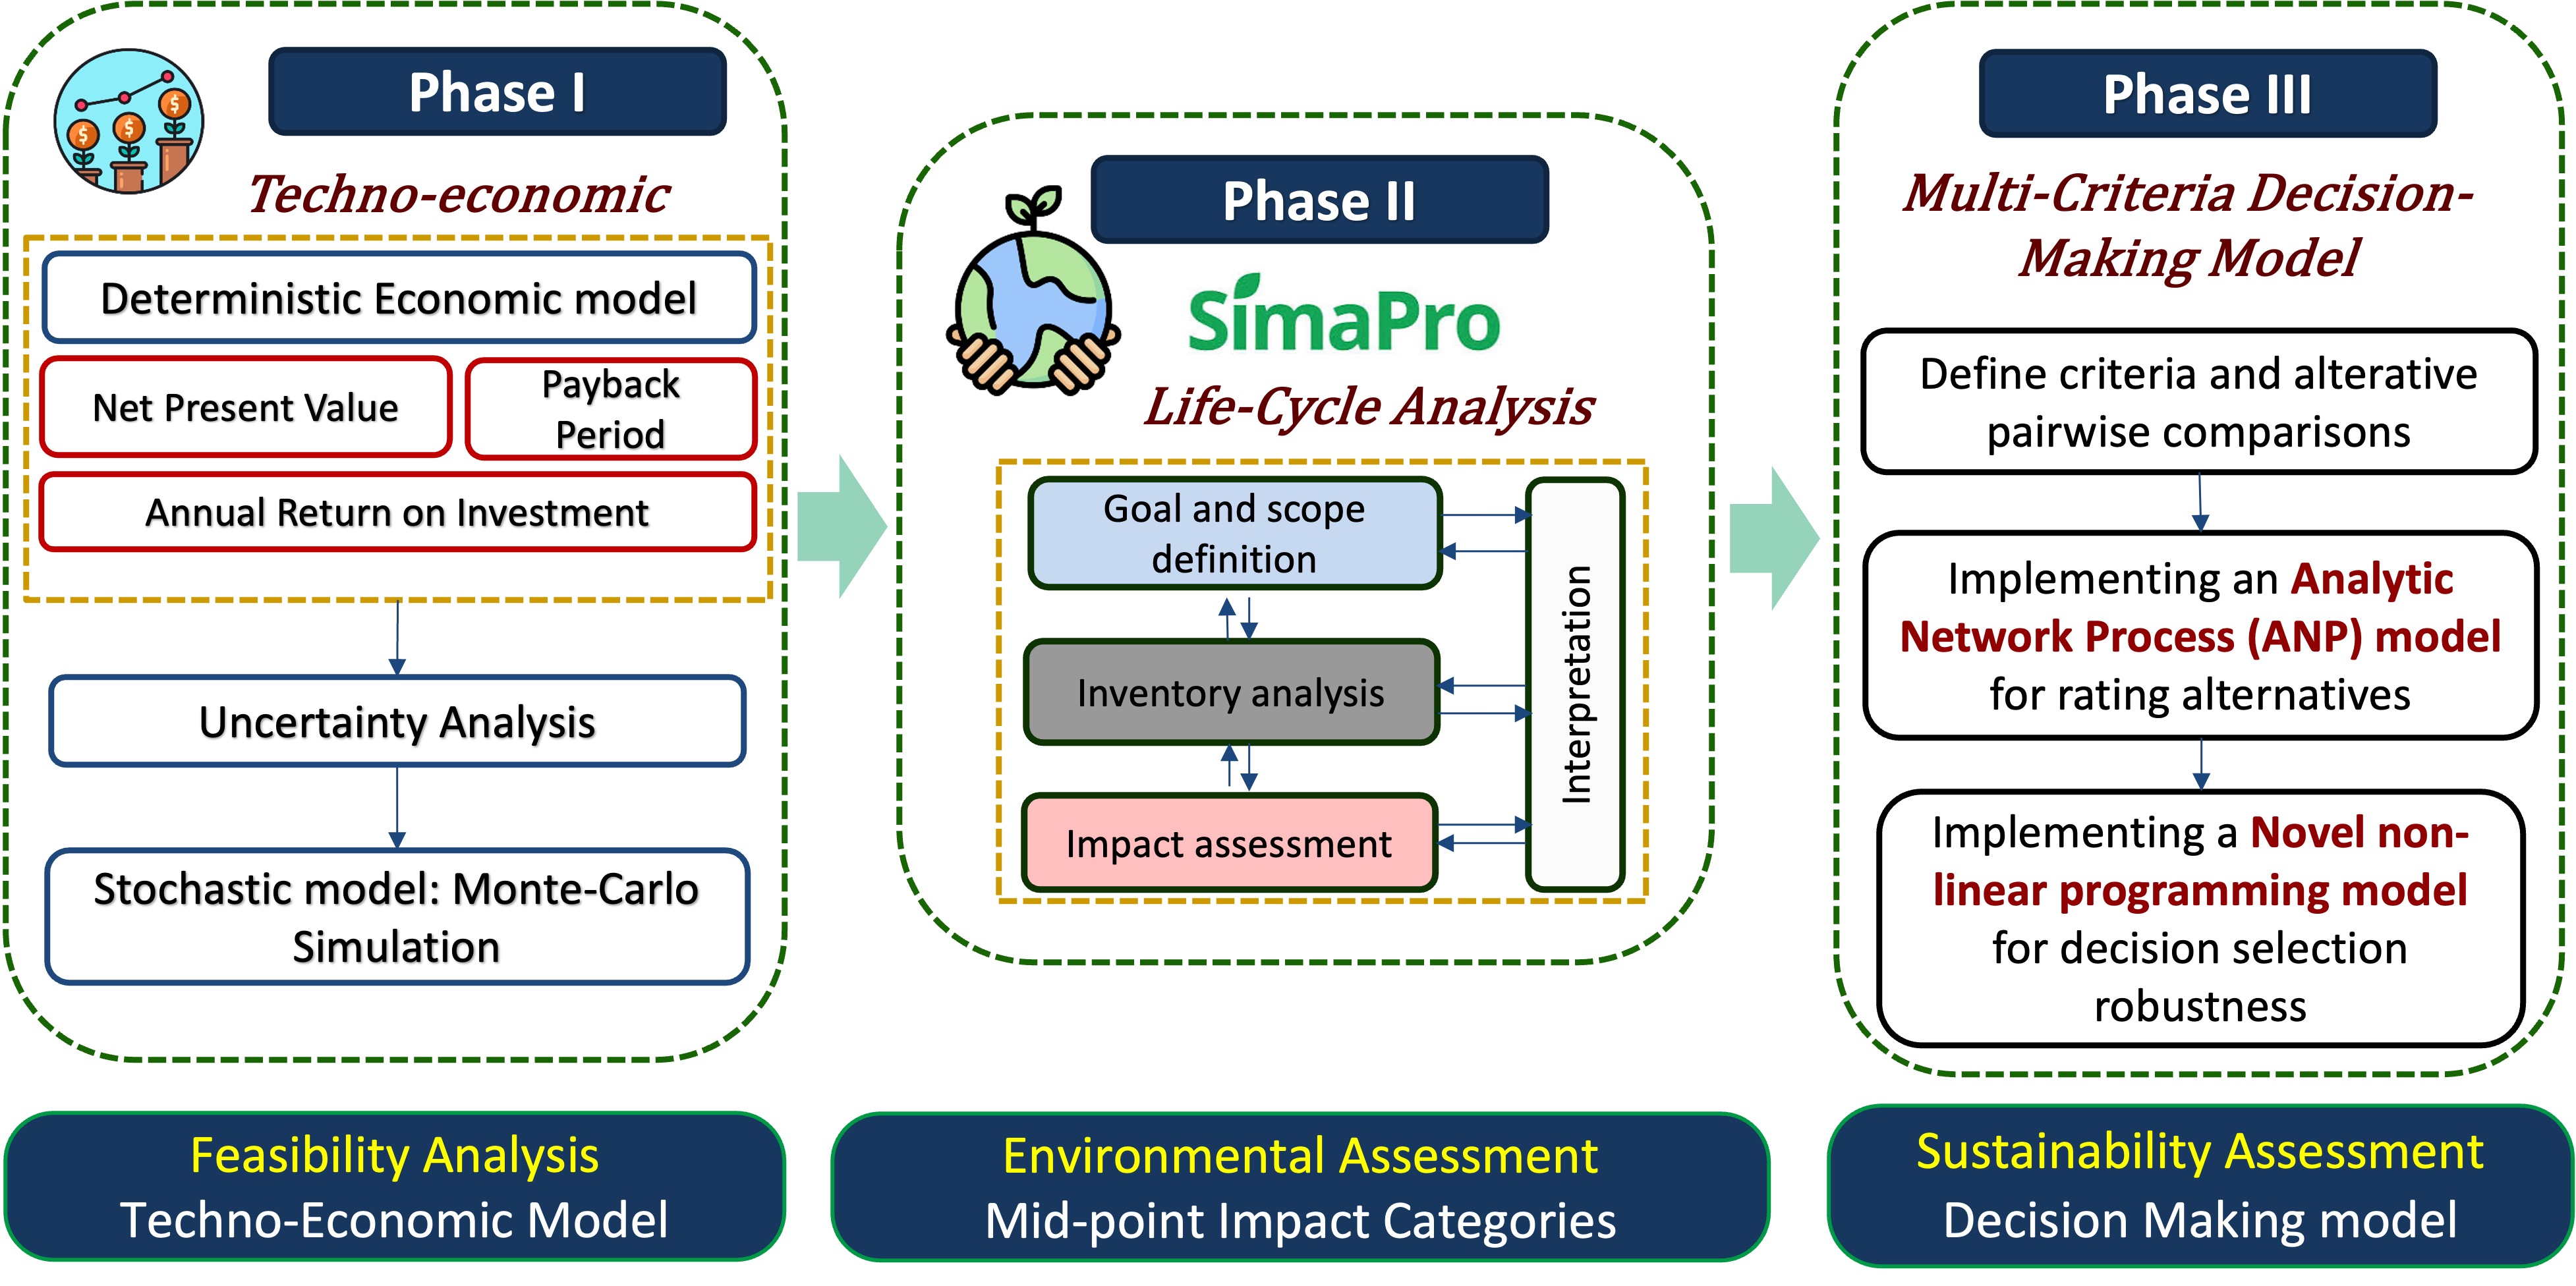
Overview: The proposed scenario-based framework of sustainability assessment consisted of a two-stage approach: 1) identification of a set of alternatives and criteria relevant to the selected case study (Section 2.1), and 2) the selection of the best alternative using an MCDM model coupled with the evaluation of solution robustness using sensitivity analysis (Section 2.2). The foundational frameworks of sustainability assessment is often defined by four pillars: economic, environmental, and social, with also incorporating underlying technical performance criteria in decision-making [58], [59]. In this work, economic and environmental criteria are derived from the earlier studies of the authors using techno-economic analysis (TEA) and life cycle assessment (LCA) modeling within the same case study [60,61], while social and technical indicators relied on industry expert interviews and literature. Given the requirement for balancing conflicting criteria under inter-dependencies, an ANP model is used, as a commonly known advanced decision tool for complex systems [62]. Then, an NLP model is developed for the sensitivity analysis of the ANP, namely to determine the minimum changes in the criteria weights that would make a second-ranked alternative to be the top-ranked one (i.e., rank reversal analysis). A representation of thesis entire model is shown in Figure 1 conceptually, and more detailed explanations for each phase will be presented in the following sub-sections.
2.1. Case Study
The global adoption of biocomposite pellets (for efficient downstream manufacturing processes like injection molding and sheet extrusion) is increasing, especially in automotive industry, due to their multiple benefits including the preservation of natural fibre resources, and the utilization of environmentally friendly constituents [69]. Canada is one of the highest producers of industrial hemp in the world. Approximately 34,262 hectares (84,660 acres) of hemp were farmed in 2015. Also, hemp stands out as a promising material for biocomposites due to its superior tensile properties and modulus as well as high growing period (70-140 days) compared to many other natural fibers [43]. These characteristics, coupled with its bio-based nature, make hemp an ideal choice for use as either a matrix or reinforcement component in sustainable composite materials [88]. To exemplify the application potential, in Saskatchewan, Canada, seedlings occurred on about 15,335 hectares (37,892 acres) with over 400 total licenses issued to grow hemp in 2015 [89].
In this industrial case study, it has been of interest to produce and scale up a commercial plant producing sustainable (bio)plastics from hemp feedstock, for downstream 3D printing products in 20-years planning horizon. These bioplastics need to be non-toxic, biodegradable, and carbon-negative with engineered-grade quality (i.e., strong, not flammable, high heat and moisture resistance), which help mitigate climate change and environmental issues. In our case study, the production of biocomposite pellets focused on two primary components derived from hemp: hemicellulose and lignin. This assumption is based on that the entire hemp plant is used for biocomposites production. A facility with an input capacity of 300 tonnes/day of hemp for extracting lignin and hemicellulose is considered, based on insights from an interview with company executives.
The process flow diagram for the ligno-chemical biorefinery commercial plant located in Saskatchewan, Canada, is shown in Figure 2. The activity starts with the harvesting of the entire hemp plant and then baling it using baler machines. For the purposes of this study, it is assumed that hemp availability is consistent across all seasons, ensuring a continuous supply for the production process. No resource shortages are considered in the model, as it is assumed that sufficient quantities of hemp are readily accessible in the region throughout the year. Next, the baled hemp is transported to an intermediate facility, where is size-reduced using a hammer mill (25% of hemp used as the composites reinforcement) and shredder (75% of hemp to be processed for the biopolymer conversion) before undergoing the biopolymer conversion process.
Pre-processing at the field or facility could reduce the SC costs and provide higher-value feedstock. The majority of previous studies focused on using hammer mills due to lower maintenance than any other size reduction machine [90]. Self-unloading trucks are used to transport and unload hemp bales. The travel distance is assumed to be around 50 km. In the biorefinery facility, hemp ingredients including lignin and cellulose/hemicellulose are extracted, and then the biopolymer is produced with further processing of the cellulose/hemicellulose [91]. To enhance the mechanical properties of biocomposites, natural fibers are recognized as one of the most effective green fillers for polymer matrices [92,93]. Ultimately, the blend of ground hemp (biofiller), lignin, and the biopolymer undergo compounding and extrusion processes, which yield biocomposite pellets.
2.1.1. Biomass Harvesting and Collection
Regarding the biomass collection, baling can be performed using square or round balers [63]. Round balers require smaller tractors compared to large-square balers, which is an advantage for smaller farms [64]. However, square balers have a wider pickup area, leading to higher efficiency than round balers [39,65,66]. Also, the wrap and eject time of round balers reduces their throughput capacity to 50%. These differences in baler efficiency result in variations in the amount of biomass fed into each type. While square balers consume approximately 1.25 times more energy per hour than round balers, their higher throughput makes them more energy-eficient on a per-tonne basis, as demonstrated in a study by Lemos et al. [67]. Additionally, round balers produce bale with lower density, facilitating better drying in the field, which improves biomass quality, a critical factor in enhancing the overall quality of the final biocomposite [43]. In contrast, square balers compress biomass into “flakes” before forming compact bales [63].
2.1.1. Biomass Pre-Processing
From the perspective of the size reduction activity, two types of hammer mills including full-screen and half-screen can be used for crushing purposes to produce biofillers as biocomposite reinforcement [68,69]. Hammer mills are energy-intensive machines, and factors such as screen size and particle size affect their energy requirement [70]. The finer the output particle size, the higher the energy needed to achieve a micrometric particle size [21]. Full-screen hammer mills require less power and energy along with higher throughput and efficiency compared to all hammer mill styles [70]. The energy consumption of half-screen hammer mill can be at least five times higher than that of the full-screen hammer mill [69,71]. When the screen size increases from 1 mm to 1.5 mm, the production efficiency increases by at least 50% [72]. Also, decreasing the screen size mesh reduces the production capacity arising from the increased residence time during the grinding [73]. Moreover, the maintenance cost for equipment that produces finer particles is nearly double than equipment handling larger particles [65]. On the other hand, finely ground hemp used as a reinforcement in biocomposite presents many benefits for sample preparation because it increases homogeneity and surface area, which improves extraction efficiency [74]. Therefore, evaluating the economic performance of different hammer mill and baler equipment combinations is crucial in decision-making.
2.1.1. Biocomposites Production
Finally, within biorefinery facility, lignin is extracted through the organosolv technique mixing with an organic solvent including ethanol in the bio-reactor, known as the company’s proprietary solvent, then the mixed product is cooked in the bio-reactor under pressure and the extracted black liquor solution is cooled down, followed by filtering and drying processes for lignin production. The hemp components are then washed with water to extract a cellulose/hemicellulose solution, which undergoes fermentation with the aid of bacteria to produce a biopolymer. This biopolymer is subsequently polymerized and utilized in bioplastic compounding. For producing biocomposites pellets, the lignin and biopolymers along with biofillers (hemp grinds) are compounded using a compounder (twin-screw extruder).
2.1.1. Supply Chain Configurations (Alternatives) Considered
Given the difference of the pre-processing equipment for biomass collection and size-down, particularly in terms of energy consumption, efficiency, and capacity [75], a combination of square/round balers and half/full-screen balers, was considered, affecting the total SC costs [76]. These assumptions resulted in the definition of four alternative configurations for the SC: 1) Full-screen hammer mill with Round baler (Full-Round), 2) Full-screen hammer mill with Square baler (Full-Square), 3) half-screen hammer mill with round baler (Half-Round), and 4) half-screen hammer mill with square baler (Half-Square).
It should be noted that the capacities of the full-screen hammer mill and square baler were established based on the daily demand/production and industry expert recommendations. Subsequently, the capacities and energy requirements for the other options were adjusted relative to these benchmarks, using data from previous studies. The key parameters of different balers and hammer mill types are listed in Table 1.
2.1.1. Identification of Decision Criteria and Sub-Criteria
The process of selecting suitable criteria plays a paramount role in any multicriteria decision-making endeavors [77]. Identified sub-criteria for each sustainability dimension in the present case study was as follows:
Economic: to define economic factors and select the relevant sub-criteria under this category, different deterministic engineering economics methods were used for comparing different options. For performing a detailed techno-economic study in Akbarian-saravi et al. [60], Net Present Value (NPV), Annual Worth (AW), Internal Rate of Return (IRR), Return on Investment (RoI), and payback period of each alternative were calculated through developing spreedsheet-based calculator. To do so, data and information on technical aspects and costs were required (as shown in Table A1, Table A2 and Table A3 in Appendix A). The costs include capital costs such as equipment purchase, installation, and engineering costs as well as operational costs including biomass purchase, energy, maintenance, and labor costs. All technical and economic data including bioplastic demand, total hemp area availability, equipment efficiency, capital costs, and per unit costs (e.g., for feedstock, energy, labour, and maintenance) were obtained from the literature and industry experts. Since this is a new development project, the demand was assumed to be equal to the considered production capacity. The results of the economic model are also presented in Table A4 in the Appendix A. To examine the uncertainty issues in TEA, Monte Carlo (MC) simulation was employed. The finalized economic metrics using stochastic TEA include the mean NPV, NPV under risk, including the average of worst-case scenarios which are quantified using the Conditional Value at Risk (CVaR)-NPV metric, along with the selling price range given the unstable market and demand. CVaR is used to calculate the expected worst outcome (potential profit loss) under market instability and fluctuating demand [60].
Environmental: For the environmental impacts, the LCA model using TRACI method based on ISO 14,044 was implemented in Akbarian-Saravi et al. [61]. The input parameters data for the environmental assessment is presented in Table A5 along with the results presented in Appendix B. The most contributing impact categories (5% cut-off) are selected in this study as the environmental criteria, relating to human and ecosystem impacts, which consist of carcinogenic, non-carcinogenic, ecotoxicity, and eutrophication impact categories.
Social: the perceived number of created jobs under each decision scenario is considered as a social factor in this study (as a sample representative of social factors). The social impact is predominantly influenced by activities within the agricultural sector, which accounts for the highest proportion of employment hours [31]. In this study, social factors are assessed by estimating the number of jobs created under different operational configurations. Specifically, these jobs are calculated based on biomass pre-processing equipment usage, including the capacity and hours of operation per machine (such as hammer mills or balers) and the number of shifts assumed per day for each piece of equipment. The total number of employment hours needed for equipment operation is determined based on the amount of material required to meet the production demand for each configuration. Once the equipment hours are estimated, the number of workers needed for each configuration is calculated. This approach links the operational requirements directly to job creation, which is considered a key social factor in this study. Therefore, the number of jobs created is considered a proxy for social impacts.
Technical: Another key characteristic of a sustainable SC is the technical aspect, for which product quality, system reliability, and Technology Readiness Level (TRL) are included in the present problem. From the current literature, clearly there is an essential variability in the quality of the processed biocomposites as well as system reliability and TRL under different pre-processing equipment [78]. All the qualitative data are collected using industry experts’ opinion as shown in Table 2. These experts provided insights based on their experience and knowledge of the equipment and processes involved in biocomposite material production.
Product quality: Product quality in biocomposites is significantly influenced by the properties of base biofillers used as reinforcement [79]. Namely, the mechanical characteristics of these biofillers are affected by various factors across multiple stages including filler production (grinding) and the hemp storage processes. The quality of biofillers, such as hemp grinds, particularly plays a crucial role in determining the modulus (stiffness) of the final biocomposite product. A higher-quality biofiller, with smaller particle size and well-preserved fiber integrity, can enhance the modulus of the composite by providing better reinforcement to the polymer matrix. Conversely, poor-quality biofillers, with irregularities or degradation due to improper handling, may result in weaker bonding with the matrix, reducing the product’s stiffness and overall mechanical performance [80].
System reliability: Reliability is often quantified as the percentage of time the system operates without failure within that period. One key reliability metric, Mean Time To Repair (MTTR), measures the average time required to restore the system to full functionality after a failure [81]. For instance, comparing the maintenance time of square and round balers, the criteria have been assessed. It indicates the level at which the system maintains the level of quality over time. Square baler needs more maintenance and repair compared to round baler leading to higher maintenance cost of square baler compared to the round baler. Due to less complicated handling system for round balers to tie the bales, they require less frequent maintenance [67]. Besides, storage of square bales is more difficult than round bales because they must be under a structure or out of the weather to decrease mass loss due to weathering [82]. Failure of the equipment on the other hand can be a major contribution to the maintenance costs [83]. Therefore, the equipment with the most maintenance costs has less reliability. From the hammer mill’s perspective, the components of a hammer mill that experience the most wear are its screens, which may appear costly to replace at first glance. Typically, depending on factors like the material being processed and screen hole size, a set of high-quality, hard-faced hammer mill screens will wear out after 2-4 replacements before the hammers need attention. Smaller screen hole sizes may necessitate even more frequent replacements [84], which makes the half-screen hammer mill system less reliable compared to full-screen hammer mill according to MTTR factor.
Technology Readiness Level (TRL): Another qualitative technical factor considered is the TRL, which is a framework that has been used in many variations across industries to provide a measurement of technology maturity from idea generation (basic principles) to commercialization [85]. TRL can also be adapted to support understanding of capabilities and resources required to develop technologies at different stages of development. The TRL stages are based on the Government of Canada assessment [86]. As shown in Table 2, when evaluating the qualitative criteria for the combination of the hammer mill and baler equipment, the baler’s importance is deemed more significant than the hammer mill due to the proportion of raw materials processed by each. Specifically, only 25% of the raw materials are processed using the hammer mill. The TRL stages are based on the Government of Canada assessment [87]. The evaluation for the analysis shown in Table 2 is based on the expert evaluation.
The MCDM methods systematically account for the abovementioned influential factors and their relative significance in prioritizing alternatives. While using such methods, the account of inter-dependence between some criteria can also be critical [87,88]. For instance, as concluded in the TEA model, the selling price range significantly impacts both the mean NPV and CVaR-NPV, as variability in prices directly affects the expected value and risk-adjusted outcomes.
2.2. Analytical Network Process (ANP) MCDM Model
The ANP, introduced by Saaty [89], is a MCDM method to address the limitations of the AHP, by incorporating interdependencies and feedback among decision criteria and alternatives. While AHP uses a strict hierarchical structure to analyze decision-making problems, ANP allows for the modeling of a decision problem using a network-based structure [89].
In this work, we have adopted the ANP-based valuation framework for the selection of best SC alternative. ANP is widely used in the literature due to the following reasons [90]: 1) analyzing complex (network-based) multi-criteria decision problems, 2) incorporating interdependencies among decision factors (instead of some independency assumptions e.g., in AHP), 3) subjectiveness of some of the criteria can make it challenging for a decision maker to directly derive a weighting for each criterion. The basic assumption of this study is that economic, environmental, social, and technical can be seen as subsystems of a larger, integrated performance management system, hence potentially making the ANP a suitable MCDM candidate.
The method first involves pairwise comparisons to quantify the relative importance of criteria and alternatives, using Saaty’s fundamental scale as shown in Table 3 [91]. A supermatrix is constructed to capture the interrelationships among the sustainability pillars, with a specific focus on the economic cluster. This matrix is then normalized and raised to successive powers until convergence, providing global priorities for the alternatives. For detailed explanations and mathematical formulations, readers are referred to Saaty’s works [72,91], and other foundational studies [92,93]. Here, through criteria inner-dependence (looping) feature of the ANP [87], the correlation between the selling price range, the mean NPV and CVaR-NPV criteria were considered.
To capture the inner-dependence among economic criteria, pairwise comparisons were conducted using Saaty’s 1–9 fundamental scale to reflect the perceived influence each criterion has over the others within the economic cluster. Three local pairwise comparison matrices were developed where each criterion was treated as a controlling element in turn. For instance, when Mean NPV is the controlling factor, the Selling Price Range has a greater influence (entry value is 5) compared to CVaR-NPV (entry value as 1). Each local matrix was then normalized by column, and the resulting eigenvectors (average of each row in the normalized matrix) were computed, representing the relative influence of other economic criteria under the control of each criterion. These eigenvectors form the columns of the unweighted supermatrix for the economic cluster.
By incorporating these numbers into the supermatrix structure, the model reflects the internal feedback (looping) between the economic sub-criteria, a key advantage of ANP over traditional AHP. This structured approach ensures that the model captures the dynamic interdependencies among economic indicators.
2.3. Incorporating Qualitative (Expert Opinion-Based) Data Uncertainty Under ANP’s Outer-Dependence Feature
Theoretically, an ANP network could be applicable compared to a hierarchy-based framework (e.g., AHP) in cases where the expert during qualitative data collection in evaluating a given alternative may have more/less reliable data/confidence compared to the other alternatives, under a same given criterion. Accrodngly, the decision maker may wish to assign a varying weight to this crierion for a more reliable decision making (note that in the standard MCDM methods, the weight of a given criterion is fixed regardless of alternatives, and it cannot vary with respect to one alternative to another; this is where ANP present a great advantage over many MCDM methods [45]).
To better exemplify, assume we are comparing two alternatives for a SC strategy (A1 and A2) under two criteria (C1 and C2) with the goal of choosing the better strategy. Inspired by the work of Milani et al. [55], the expert prefers to use the additional information (e.g., past data availability/experience/reliability/etc.) they may have and define a higher weight for while scoring (as more reliable alternatively, i.e., with more certain data), while considering a lower weight for while scoring A2 (less reliable alternative). In the present decision-making case study, the level of confidence of the decision-maker (e.g., during qualitative data collection) is likely to be influenced by how the combination of pre-processing equipment contributes to the overall performance under specific criteria, such as product quality. For example, the combination of the half-screen hammer mill and round baler (Alternative C) demonstrates consistently high product quality for both equipment components, leading to a high overall score and greater confidence in its selection. In contrast, the full-screen hammer mill and round baler (Alternative A) presents a mix of extremes, with high quality for the round baler but low quality for the full-screen hammer mill, making it difficult to determine whether the overall performance is medium or low. This variability introduces uncertainty and lowers confidence in evaluation of this alternative. Similarly, the half-screen hammer mill and square baler (Alternative D) exhibits a trade-off, where the high product quality of the half-screen hammer mill is offset by the lower quality of the square baler, resulting in uncertainty about whether the overall score should be medium, low, or even different, ultimately depending on the decision-maker’s confidence level. By dynamically adjusting the weights based on system reliability and product quality qualitative criteria, the model allows decision-makers to prioritize specific criteria and balance trade-offs, ensuring decisions align with their confidence in the robustness and performance of the selected supply chain configuration. In this case, for an ANP model, the adjusted aggregated score for each alternative is as follows [93].
where is the weighted metrics for the alternatives and criteria based on the normalized pairwise metrics in ANP model (elements from supermatrix in ANP), is the average performance value under criteria ; defined as Unreliability Factor (UF) is the adjusting weight representing the extent to the unreliability of for ; 0 . Therefore, in this case study, ANP is used to not only respond to the interdependency of criteria but also to the unreliability in assessing some alternatives under specific criteria. Note that the depends on the alternative. In this case, lower weights () are assigned to alternatives with lower confidence. For example, Alternative A (full-screen hammer mill and round baler) and Alternative D (half-screen hammer mill and square baler) receive reduced weights (reflected by multiplying with UF) because their product quality varies, one equipment performs well while the other does not. Conversely, Alternative C (half-screen hammer mill and round baler), which demonstrates consistently high product quality, is assigned higher weights, reflecting greater confidence in its performance.This decision-making flexibility is a key advantage of the ANP approach, which is often unattainable using earlier MADM SC selection methods. Additionally, ANP can accommodate a large number of criteria and alternatives simultaneously, making it possibly suitable for complex networks and large scale.
Incorporating the UF into the decision-making process introduces a practical and adaptive approach to account for uncertainties in data quality or external dependencies. By using UF to adjust the criteria weights for specific alternatives, the model can better reflect real-world decision-making conditions where not all criteria are equally reliable or equally relevant for every alternative. This method allows for a more flexible evaluation of alternatives, adapting to different degrees of reliability or uncertainty associated with the criteria.
The rationale behind using UF to modify the criteria weights is that it allows decision-makers to systematically explore how increasing or decreasing uncertainty impacts the performance of alternatives. By scaling the importance of specific criteria according to their unreliability (i.e., using smaller UF values to represent greater uncertainty), the model becomes more realistic in handling external factors that might not always be predictable or stable. The UF can be derived from expert confidence levels, depending on the decision context. This integration enables decision-makers to prioritize robustness, rather than just optimality, especially in sustainable SC design where data uncertainty and system variability are inherent.
After adjusting the criteria weights with the UF, these modified weights are integrated into the supermatrix to calculate the final results. The supermatrix in ANP captures the outerdependencies among criteria and alternatives, and by incorporating UF-adjusted weights, the model dynamically reflects how changes in uncertainty affect the relative importance of each criterion for each alternative.
An interdependencies among the network elements under economic criteria is assumed in this case study. The focus of the study is on specific relationships within one cluster (e.g., economic impact), and limited data or expert judgment are available for other clusters. These interdependencies modify the priority weights assigned to each criterion in the network. Unlike the traditional AHP (where criteria are assumed independent), ANP allows these relationships to modify the relative importance of each criterion dynamically.
The evaluation issue was addressed using two different scenarios through Excel spreadsheet and a Python programming-based model. Scenario 1 allows interdependencies between variables and alternatives; to be represented in the next section. Scenario 2, on the other hand, assumes that the explanatory variables are independent, structuring the evaluation problem as a hierarchical model and solving it using AHP.
2.3.1. Supply Chain Configuration Scenario 1
In this scenario, it is assumed that the expert and decision maker have unequal preference over criteria and that their relative importance can change from one alternative to another depending on the specific unreliability factors raised in assessing those alternatives (refer to Equation (2)). For this case, we developed an ANP framework to evaluate the sustainable performance of SC as shown in Figure 3.
Focusing on one cluster, the interdependencies among the mean NPV, CVaR-NPV, and selling price range are determined using expert opinion and the TEA results. A higher Mean NPV indicates greater profitability, which generally reduces financial risk (CVaR) and allows for more flexible pricing and larger selling price range. CVaR-NPV measures the risk of extreme losses; higher CVaR suggests greater uncertainty, which can lower NPV as future cash flows are discounted more heavily. This risk could also limit the Selling Price Range, leading to more conservative pricing to avoid losses. Finally, the selling price range impacts both mean NPV and CVaR-NPV. A wider range or higher prices improve revenue and NPV, while a narrower or lower range increases financial risk, raising CVaR. In summary, a high NPV reduces risk (CVaR-NPV) and results in higher pricing flexibility and range, while higher prices boost NPV and affect risk.
2.3.1. Supply Chain Configuration Scenario 2
In this scenario, it is assumed that the decision-maker has no preference for one criterion over another one and no additional information on each alternative is present. Hence, the question of e.g., comparing to with respect to yields a similar value for all alternatives (refer to Figure 4).
2.3. Nonlinear programming model used for sensitivity analysis
After ranking alternatives using ANP method and determining the rank of alternatives, the proposed nonlinear mathematical model can be used to assess the extent to which the weight of each criterion has to change so as to make an alternative the top-ranked one by ANP. The proposed approach is inspired by a similar analysis for AHP, originally pioneered by Sowlati and Asadi [56] for decision-making problems in management. Such results can provide valuable insights into the robustness of the rankings by a given MCDM method. The objective function and required constraint for performing the sensitivity analysis are shown in Equations (8)–(14). Table 4 lists the sets, parameters, and variables used in the model.
Objective function:
Constraints:
Objective function (3) minimizes the sum of deviations of the new weights from the existing weights of criteria. Constraint (4) guarantees that the new global weight of alternative under criterion in the limit matrix must be greater than the [94] osite weight of any other alternative ( under the same criterion . As the final step of the ANP model, the supermatrix is raised to powers through multiplication until it converges into a limit matrix (. Convergence indicates that the values in each row have stabilized, reflecting the long-term influence priorities [62]. Constraint (5) ensures that the summation of new weight of all criteria is equal to 1. Constraint (6) and (7) ensure that each new criteria weight under the specific alternative must be within a range of 0 and 1. Constraint (8) specifies that under each alternative, any increase in the weight of one criterion must be offset by a corresponding decrease in the weight of another criterion to maintain the overall balance. Lastly, the non-negativity constraint for criteria weights changes is also stated in constraint (9).
The specified NLP formulation includes variables and approximately constraints excluding variable bounds. To solve the mathematical model, Python programming was employed, and the corresponding code is publicly available [62] he author’s GitHub repository [94]. The open-source Python script used for the robustness analysis is freely accessible in the author’s GitHub repository and can be applied to replicate the procedure with any generic dataset, ensuring transparency and reproducibility. Due to the non-linear nature of the model, the “IPOPT” solver was used to handle its non-linearity.
The percentage variation in the weight of each criterion (CW) required to make the second alternative a top-ranked one can be calculated using Equation (10).
To compare the robustness of ANP with AHP, the Linear Programming (LP) mathematical optimization model shown in Eqs. (11)-(17), inspired by Sowlati and Asadi [95], is utilized (specifically for AHP) and developed using Python programming [94,96]. In this model, due to the linear nature of the model, the “GLPK (GNU Linear Programming Kit)” solver can be used, which is an open-source solver designed for linear programming problems.
where is the weight of alternative under criteria .
Similar to the ANP-based sensitivity analysis model, the objective is to minimize changes in criteria weights (as per constraint (11)), while ensuring that the second alternative ranks first (constraint (12)), the total weight distribution remains balanced (constraint (13), and individual weights are non-negative and do not exceed 1, maintaining logical consistency and preventing any disproportionate influence (constraints (14)–(17)). Also, the percentage variation in the weight of each criterion (CW) required to make an alternative a top-ranked one can be calculated using Equation (18).
3. Results and Discussion
As discussed in Section 2, ANP is an extension of the AHP that incorporates feedback loops (inner dependence) and interactions (outer dependence) between decision elements. Following the screening of alternatives and the selection of relevant criteria as discussed previously in Table 2, a normalized decision matrix was created from raw data in Table 2 by converting all cost-related criteria into benefit-related criteria. Following, each row is normalized by dividing by the sum of the values. The resulting normalized values are presented in Table 5. Subsequently, pairwise comparisons between the alternatives for each criterion were calculated directly from the normalized decision matrix by determining the ratio of values for each pair of alternatives based on the corresponding criterion.
For the pairwise comparisons including interdependencies among economic sub-criteria, Table 6 illustrates one such case. The weighted priority (e-Vector) is calculated through the pairwise comparisons. By adding a feedback relationship between alternatives and criteria, a more complex decision situation should be solved. In the case of assuming scenario 1, the decision maker has the preference of one criterion over another one (e.g., comparing to with respect to is calculated). Under the same conditions applied to all pairwise comparisons in the feedback analysis, a weighted supermatrix is generated as shown in Table 7, where the sum of each column is equal to 1.
In this weighted matrix, the normalized weights for each criterion are located in the top-right section. The unreliability factor for the product quality and system reliability under specified alternatives is assumed to be 0.5 (as per Equation (2)). The normalized data from Table 5 appears in the bottom-left section of Table 7. The zero values in Table 7 indicate no interdependence was defined within either the criteria cluster or the alternatives cluster. Next, the limit matrix is presented in Table 8, where the final scores and rankings of the candidate materials are outlined. The supermatrix reaches convergence at the power of 5. Each row of the limit matrix represents the global score for the alternatives and criteria. The normalized criteria and alternative scores are then calculated as shown in Figure 5a and Figure 6.
As illustrated in Figure 5a, the ANP analysis identified the top four most important criteria for sustainable SC evaluation as follows: Selling Price Range in the economic cluster, Carcinogenic Impact (a human health risk) within the environmental category, Product Quality from the technical aspect of sustainability assessment, and Job Quantity in the social cluster. When comparing these rankings to the local weights produced using AHP model (as shown in Figure 5b, the only notable difference is Mean NPV, which ranked as the top criterion in the economic cluster when interdependencies were disregarded. This emphasizes the crucial role of interdependencies in ANP for accurately capturing the relationships between criteria, which are often overlooked in simpler models like AHP. Additionally, in the global weights produced by ANP, Selling Price range and CVaR-NPV rank higher than that of AHP, likely due to the strong interdependencies between economic metrics and other sustainability dimensions, which ANP is positioned to capture. Furthermore, as shown in Figure 6, the half-round alternative (C) has achieved the highest rank, primarily driven by its superior Mean NPV ($65.28M) and product quality (ranked high), which hold the greatest weights in the local supermatrix. Additionally, this alternative offers the most substantial Job quantities (14 jobs), further underscoring its social dimension. These factors underscore the economic and technical strengths of this alternative, contributing significantly to its overall rankings. However, the environmental impacts of this alternative is worse compare to that of other alternative, especially due to lower efficiency and capacity of equipment affecting the energy and resource consumption as supported by previous work. The high negative environmental impacts are mainly due to the fertilizer and diesel use in agricultural stage of production [43]. Environmental emissions of productions can be further reduced by replacing the nitrogen fertilizer with compost as analyzed in the previous work by Akbarian-Saravi et al. [61].
The full-round alternative is positioned closely in second place, achieving a score of 0.267. Although its Mean NPV ($61.65M) is slightly lower than half-round, it still ranks highly. This alternative also performs well in product quality (medium) and has strong system reliability (high). Despite having more moderate environmental impacts and Job Quantities (13 jobs), its moderate performance across multiple categories leads to a competitive ranking just behind the half-round. With a score of 0.221, the full-square alternative ranks lowest, primarily due to its poor performance in key areas such as product quality and job quantities. Although it has the lowest environmental impacts, including Eutrophication (26.05 kg N eq) and Carcinogenic Impact (0.00049 CTUh), its weaker economic performance, especially Mean NPV ($53.96M) and other technical disadvantages lead to this alternative’s lower ranking. The difference between the top two alternatives and the fourth-ranked full-square is more significant, reflecting a reduction in performance, particularly in technical and social dimensions.
The closeness in scores between the half-round and full-round alternatives indicates that small changes in criteria weights or performance can significantly affect the rankings. This sensitivity analysis underscores the value of using an optimization model to evaluate the minimal adjustments needed to alter the rankings. Furthermore, as shown in Table 9, athough both the AHP and ANP methods result in the same ranking of alternatives, their final scores differ, which has important implications for decision-making. For example, Alternative C has the highest global weight (0.2797 and 0.269) under AHP and ANP methods, respectively, but achieves this differently due to the criteria interdependencies considered in ANP. Slightly lower global scores in ANP compared to AHP is because of the interdependencies among economic criteria such as selling price range, mean NPV, and CVaR-NPV. ANP, by accounting for interdependencies between economic criteria, can produce more nuanced results that may better reflect the complex relationships between different factors. Accordingly, by applying the optimization model, the robustness of these rankings is tested. By comparing how sensitive the AHP and ANP models are to such changes, the stability and reliability of rankings are assessed.
Presenting decision-making problems through performance clusters, as shown in Figure 7, is particularly useful for large-scale SC selection processes. This approach facilitates assessing alternatives based on specific clusters, such as economic, environmental, social, and technical properties. By adjusting the weight of a particular cluster to one while setting the others to zero, the decision-maker can repeat the same model. For instance, to evaluate alternatives merely on economic performance, the weight for the economic cluster is set to one and others to zero, where Alternative B performs best. Under environmental considerations, Alternative A is selected due to its superior environmental performance. In another scenario, equal weights may be assigned to all clusters. As presented in Figure 7, the rankings demonstrate the model’s adaptability across various scenarios. While the results shift depending on the importance of different criteria clusters, Alternative (C) consistently ranks as a top alternative, particularly when social and technical factors are given priority.
As shown in Figure 8, the sensitivity of ranking results to UF in ANP has been examined. It is particularly noteworthy that in most cases, the rankings remain consistent across different UF values, demonstrating the robustness of the model. However, as indicated in the magnified section of the graph, at a UF value of 0.1, where uncertainty is highest, the ranking between Alternatives A and C changes. In this case, Alternative A overtakes Alternative C, highlighting how greater uncertainty can lead to a shift in rankings. This shift shows that when uncertainty is significant, the model becomes sensitive to the slightest variations in the criteria’s influence, resulting in ranking changes that are closer to real-world unpredictability. For the final analysis, a UF of 0.5 was selected to represent a balanced level of uncertainty, ensuring that the results are reliable while still accounting for realistic uncertainty.
Sensitivity Analysis for Rank Reversals
As explained in Section 2.4, in order to test the robustness of the MCDM model (namely, here finding solution’s resistance limit against changes in criteria weights and causing rank reversals), an optimization-based programming model is developed on the ANP and AHP. The new criteria weights and the corresponding percentage changes have been calculated and are detailed based on the model solution in Table 10 and Figure 9.
As shown in Figure 9(a), the sensitivity analysis reveals that in the ANP model, significant weight adjustments are required for Alternative (A) (originally ranked second) to become the top-ranked option. Specifically, the weight of “system reliability” criterion would need to increase by 100%, while the weight of “product quality” would need to decrease by 30%. These recalibrated weights and their impacts on alternative scores are presented in detail in Table 10. This implies that if “system reliability” is prioritized over “technology readiness level”, Alternative (A) (full-round) could surpass the other alternatives, given its strength in that criterion.
In contrast, in the AHP model, as indicated in Figure 9(b), smaller adjustments are necessary for Alternative (A) to rank first. A 37% increase in the weight of “system reliability”, along with decreases of 11% and 31% in “product quality” and “technology readiness level”, respectively, would suffice to change the rankings. AHP assumes no interdependencies between criteria, which simplifies the problem and allows for smaller changes to criteria weights to affect the rankings.
The analysis highlights that the ANP model demands more substantial changes in criteria weights to alter the rankings, indicating a higher level of stability and resilience to variations in input parameters compared to AHP. This robustness makes ANP a preferred choice in decision-making processes where stability is critical. Additionally, the developed non-linear programming model for ANP approach, solved using the IPOPT solver in Python, offers the capability to estimate the minimum changes required to alter alternative rankings.
This sensitivity analysis reinforces that while AHP and ANP may yield similar rankings under stable conditions, ANP demonstrates greater resilience when facing changes in criteria or weightings. This makes it a more robust choice for complex decision-making processes like sustainability assessments, where criteria interdependencies and external factors can play a crucial role. The optimization model further enhances the decision-making process by quantifying the minimum changes needed to shift rankings, confirming the reliability and adaptability of ANP in dynamic scenarios.
While practitioners might choose simpler model like AHP, which are easier to understand and provide greater transparency, incorporating sensitivity analysis can enhance the evaluation of solution robustness. By accounting for the effects of complexity, sensitivity analysis provides deeper insights into how changes in inputs affect outcomes, ensuring that the solutions remain resilient under varying conditions.
4. Conclusions
In this study, a comprehensive ANP-based MCDM framework was developed for evaluating the sustainable SC selection for a hemp-based biocomposite production. The framework accounted for economic, environmental, social, and technical dimensions while explicitly addressing the dependencies decision elements, particularly within the economic cluster an aspect often overlooked in traditional MCDM methods such as AHP. The dependencies within the economic cluster includes the relationships between criteria such as selling price range, mean NPV and CVaR-NPV. For example, selling price directly influences both mean NPV and CVaR-NPV, reflecting its role in determining both the profitability (NPV) and the financial risk (CVaR), underscoring how adverse fluctuations in selling price can significantly impact average NPV and financial risk under worst-case scenarios. The analysis of four biomass pre-processing alternatives identified the half-round option as the top choice, primarily due to its strong economic performance, notably in Mean NPV and product quality. Its positive contributions to job creation further strengthened its ranking in the social dimension. The full-round option closely followed, performing well across multiple dimensions, including system reliability and product quality. Conversely, the full-square alternative ranked lowest due to its weaker performance in technical and social criteria, despite some environmental benefits.
In addressing uncertainties in qualitative data in criteria weights under specific alternatives, the Unreliability Factor (UF) was introduced. For example, lower weights were assigned to alternatives with lower confidence in their evaluation by the decision maker, such as Alternative A (full-screen hammer mill and round baler) and Alternative D (half-screen hammer mill and square baler), due to inconsistent product quality within the respective baler or hammer mill equipment. While rankings remained stable across most UF values, a higher uncertainty (e.g., UF = 0.1) caused significant shifts, particularly between the top two alternatives ranking. Under increased uncertainty, the full-round alternative overtook the half-round, illustrating how uncertainty can impact outcomes. This underscores the importance of incorporating uncertainty in decision models, especially in qualitative factors assessment. The final analysis used a balanced UF of 0.5, providing both reliability and realism.
To evaluate the robustness of ANP against AHP due to criterial weights changes, a Non-Linear Programming (NLP) model was developed as part of ANP sensitivity analysis, alongside a Linear Programming (LP) model for AHP. The results demonstrated that ANP required significant changes in criteria weights to alter/reverse the rankings, indicating its stability in decision-making with variable inputs. Conversely, AHP, while simpler, required smaller weight adjustments to affect rankings, suggesting that it may be less effective in handling complex interdependencies. This robustness makes ANP particularly valuable for industries facing dynamic sustainability challenges, where decision stability is essential despite fluctuating criteria weights or external conditions.
In conclusion, the proposed ANP-based framework, combined with optimization-based sensitivity analysis, provided a robust tool for decision-makers aiming to ensure the sustainable development of biocomposite SCs. By incorporating dependencies and conducting sensitivity analysis, this framework could offer a more reliable and adaptable decision-making process, ensuring that selected alternatives align with both economic viability and sustainability goals. Future research is needed to explore and test the extension of this model to other biocomposite industries and SCs, as well as integrate dynamic (time-dependent) criteria to further enhance its applicability in rapidly evolving environments. Additionally, examining the interdependencies among all criteria and sub-criteria through the ANP can provide a deeper, more comprehensive understanding of the relationships between these various elements. For future studies, integrating simulation models into supply chain data gathering is also recommended to improve the accuracy and precision of sustainability measurements, addressing a gap in previous research, as noted by Perez et al. [97].
Funding
This research was funded by the MITACS Accelerate Program (grant number: IT29287).
Data Availability Statement
The Python code and datasets used to implement the optimization model for rank adjustment in the ANP and AHP method are openly available on GitHub at the following repository: https://github.com/niloofarcrno/Optimized-Rank-Adjustment-Sensitivity-Analysis-for-MCDM. This repository contains the source code, input data (e.g., criteria weights and supermatrix), and output files necessary to reproduce the results presented in this study.
Acknowledgments
The authors gratefully acknowledge the support of their industry partner, Advanced Biocarbon 3D Inc., as well as the valuable discussions with colleagues from the Composites Research Network (CRN).
Conflicts of Interest
The authors declare no conflicts of interest.
Appendix A. Economic Factor Quantification—Base Data

Table A1.
Input parameters assumed for the four SC alternatives focusing on biomass processing and collection equipment.
Table A1.
Input parameters assumed for the four SC alternatives focusing on biomass processing and collection equipment.
| Parameters | Baler Types | Hammer Mill Types | References | ||
| Square Baler | Round baler | Full-Screen | Half-screen | ||
| Purchase cost | $19000 | $7000 | $6700 | $4500 | [84] |
| Diesel fuel/Electricity consumption | 3 liter/tonnes | 20 liter/tonnes | 160 kWh/tonnes | 900 kWh/tonnes | [65,98] |
| Capacity | 37.5 tonnes/hr | 7.2 tonnes/hr | 3.5 tonnes/hr | 1.5 tonnes/hr | [64] |
| Efficiency | 63% | 50% | 90% | 70% | [64] |
| Maintenance cost | 10% of purchase price | 2% of purchase price | 10% of purchase price | 20% of purchase price | [84] |
| # of operators | 2 | 12 | 1 | 2 | Calculated |
| # of equipment pieces | 1 | 3 | 1 | 1 | Calculated |
| Shifts | 1 | 2 | 1 | 2 | personal communication with industry expert [June, 2021] |
| Speed | 4.2 km/hour | 3.5 km/hour | 1200 rpm | 1200 rpm | [84] |
Table A2.
Capital investment costs (source: personal communication with industry expert [June, 2021]).
Table A2.
Capital investment costs (source: personal communication with industry expert [June, 2021]).
| Parameter | Value (CAD$) |
| Land for farming | 110,000,000 |
| Land for building | 110,000 |
| Heating and cooling equipment installation | 36,000,000 |
| Reactors’ purchase cost | 80,000 |
| Tank purchase cost | 3,500,000 |
| Filter press purchase cost | 4,000,000 |
| Compounder extruder twin | 500,000 |
| Trucks | 120,000 |
| Loaders | 220,000 |
| Contractor | 32,000,000 |
| Design engineering | 1,000,000 |
| Unforeseen costs | 5% of capital costs |
| Total capital costs | 211,398,256 |
| Funding (incentivesprovided by Federal and Provincial governments | 350,000 |
| Total capital costs after incentives | 211,048,256 |
Table A3.
Data for calculating Operation and Maintenance (O&M) costs within each SC stage.
| Parameter | value | References |
| Feedstock cost (CAD$/ODT) | 200 | Personal communication with industry expert [June, 2021] |
| Electricity cost including taxes and customer fee price (CAD$/KWh) | 5 | [99] |
| Diesel fuel price (CAD$/liter) | 1.56 | [99] |
| Staff salary (operation) (CAD$/hour) (24/7) | 30 | Personal communication with industry expert [June, 2021] |
| Staff Salary (professional engineer) (CAD$/hour) | 60 | Personal communication with industry expert [June, 2021] |
| Annual maintenance rate for equipment and building | 2% of total investment | [100] |
Table A4.
Results of economic assessment.
| Economic Metrics | Alternatives | |||
| Full-Round | Full-Square | Half-Round | D: Half-Square | |
| Net Present Value | $123M | $108M | $130M | $114M |
| Annual Return on Investment (RoI) | 145.1% | 141.1% | 149.7% | 145.7% |
| Payback Period | 15 years | 14 years | 15 years | 14 years |
| Internal Rate of Return (IRR) | 15.98% | 15.02% | 16.41% | 15.42% |
| Annual Worth (AW) | $14.5M | $12.7M | $15.3M | $13.45M |
| Selling Price (Profit margin 50%) | $3,687 | $3,069 | $3,964 | $3,326 |
Appendix B. Environmental Factor Quantification—Base Data
Table A5.
Table A5. LCA Inventory inputs to produce 1 tonne of hemp-based biopolymer.
| Flow | Unit | Value | Reference |
| Agricultural and farming | |||
| Hemp yield | tonne/hectare | 2.2 | [101] |
| Diesel consumption (tractor use for fertilization) | Hour/hectare | 1.8 | [102] |
| Diesel consumption (tractor use for fertilization) | Kg/hour | 8.78 | [102] |
| Diesel use for cutting and harvesting | Kg/hour | 48.24 | [102] |
| Diesel use for cutting and harvesting | Hours/hectare | 4 | [102] |
| Seedling rate | Kg/hectare | 34 | [101] |
| Fertilizer ( , applied as Potassium Oxide) |
Kg/hectare | 67 | [101,103] |
| Fertilizer (N, Nitrogen fertilization) | Kg/hectare | 100 | [101,103] |
| Fertilizer ( phosphate rate |
Kg/hectare | 50 | [101,102,103] |
| Water for germination | m3/hectare | 120 | [102] |
| CO2 Uptake | tonne/hectare | - 0.67 | [102] |
| Size reduction | |||
| Electricity use for hammer mill | GJ/tonne | 0.58 | [104] |
| Electricity use for shredder | GJ/tonne | 0.047 | [104] |
| Biopolymer conversion (1 tonne) | |||
| Enzymes | gram/liter biomass | 3 | [105] |
| N2 (Nitrogen) | tonne | 0.009 | [106] |
| Limestone | tonne | 0.03 | [106] |
| Water | Liter | 16000 | [106] |
| Extruder usage | Kg/hour | 20 | Industry expert |
| Electricity usage in extruder | kWh/kg | 0.27 | Industry expert |
| Transportation and loading | |||
| Fuel use in loaders | Liter/tonne | 10.9 | [107] |
| Three-axile semi-trailer | Liter/km | 0.68 | [107] |
Table A6.
Table A6. Environmental burdens per impact category for all four alternatives evaluated (data reported per functional unit: 1 tonne of biocomposites pellet).
Table A6.
Table A6. Environmental burdens per impact category for all four alternatives evaluated (data reported per functional unit: 1 tonne of biocomposites pellet).
| Impact Category | Unit |
Alt. A: Full-Round |
Alt. B: Full-Square |
Alt. C: Half-Round |
Alt. D: Half-Square |
| Global Warming Potential (GWP) | Kg eq |
9,377 | 6,521 | 10,985 | 7,514 |
| Acidification Potential (AP) | kg eq |
73.09 | 51.40 | 82.99 | 57.57 |
| Ozone Depletion Potential (ODP) | kg CFC-11 eq | 0.001 | 0.0007 | 0.0013 | 0.0008 |
| Eutrophication Potential (EuP) | kg N eq | 34.98 | 26.05 | 37.51 | 27.61 |
| Ecotoxicity Potential (EP) | CTUe | 78,763.91 | 53,656.53 | 87,393.42 | 58,914.38 |
| Carcinogenic Potential (CP) | CTUh | 0.0007 | 0.0004 | 0.0008 | 0.0005 |
| Non-carcinogenic Potential (NCP) | CTUh | 0.010 | 0.009 | 0.017 | 0.0107 |
| Fossil Fuel Depletion Potential (FFDP) | MJ surplus | 12,258 | 8,271.25 | 15,175 | 10,085 |
| Smog Potential (SP) | kg eq |
1,071.83 | 693.44 | 1,201 | 771 |
| Respiratory Effects Potential (REP) | kg PM2.5 eq | 13.79 | 9.49 | 15.13 | 10.29 |
References
- Das, P.P.; Chaudhary, V. Moving towards the era of bio fibre based polymer composites. Clean. Eng. Technol. 2021, 4, . [CrossRef]
- Suárez, L.; Castellano, J.; Díaz, S.; Tcharkhtchi, A.; Ortega, Z. Are Natural-Based Composites Sustainable?. Polymers 2021, 13, 2326, . [CrossRef]
- Ahmad, H.; Chhipi-Shrestha, G.; Hewage, K.; Sadiq, R. A Comprehensive Review on Construction Applications and Life Cycle Sustainability of Natural Fiber Biocomposites. Sustainability 2022, 14, 15905, . [CrossRef]
- Jawaid, M.; Paridah, M.; Saba, N. INtroduction to biomass and its composites,” in Lignocellulosic Fibre and Biomass-Based Composite Materials, Elsevier, 2017, pp. 1–11. [CrossRef]
- Ahmed, A.T.M.F.; Islam, Z.; Mahmud, S.; Sarker, E.; Islam, R. Hemp as a potential raw material toward a sustainable world: A review. Heliyon 2022, 8, e08753, . [CrossRef]
- Trucillo, P.; Erto, A. Sustainability Indicators for Materials and Processes. Sustainability 2023, 15, 6689, . [CrossRef]
- Zarrinpoor, N.; Khani, A. A biofuel supply chain design considering sustainability, uncertainty, and international suppliers and markets. Biomass- Convers. Biorefinery 2022, 13, 14127–14153, . [CrossRef]
- Pérez, A.T.E.; Vásquez, Ó.C. How to Measure Sustainability in the Supply Chain Design: An Integrated Proposal from an Extensive and Systematic Literature Review. Sustainability 2023, 15, 7138, . [CrossRef]
- Pallaro, E.; Subramanian, N.; Abdulrahman, M.D.; Liu, C. Sustainable production and consumption in the automotive sector: Integrated review framework and research directions. Sustain. Prod. Consum. 2015, 4, 47–61, . [CrossRef]
- Yancey, N.; Wright, C.T.; Westover, T.L. Optimizing hammer mill performance through screen selection and hammer design. Biofuels 2013, 4, 85–94, . [CrossRef]
- Roy, P.; Rodriguez-Uribe, A.; Mohanty, A.K.; Pujari, D.; Tiessen, M.; Bali, A.; Misra, M. Production Cost of Biocarbon and Biocomposite, and Their Prospects in Sustainable Biobased Industries. Sustainability 2024, 16, 5633, . [CrossRef]
- Lo, S.L.Y.; How, B.S.; Teng, S.Y.; Lam, H.L.; Lim, C.H.; Rhamdhani, M.A.; Sunarso, J. Stochastic techno-economic evaluation model for biomass supply chain: A biomass gasification case study with supply chain uncertainties. Renew. Sustain. Energy Rev. 2021, 152, . [CrossRef]
- T. Wang, A. Rodriguez-Uribe, M. Misra, and A. K. Mohanty, “Biocarbon from miscanthus,” 2018.
- Guo, Z.; Ren, P.; Zhang, Z.; Dai, Z.; Lu, Z.; Jin, Y.; Ren, F. Fabrication of carbonized spent coffee grounds/graphene nanoplates/cyanate ester composites for superior and highly absorbed electromagnetic interference shielding performance. J. Mater. Sci. Technol. 2022, 102, 123–131, . [CrossRef]
- Civancik-Uslu, D.; Ferrer, L.; Puig, R.; Fullana-I-Palmer, P. Are functional fillers improving environmental behavior of plastics? A review on LCA studies. Sci. Total. Environ. 2018, 626, 927–940, . [CrossRef]
- Pandey, J.; Nagarajan, V.; Mohanty, A.K.; Misra, M. Commercial potential and competitiveness of natural fiber composites. In Biocomposites; Elsevier BV, 2015; pp. 1–15;.
- Roy, P.; Defersha, F.; Rodriguez-Uribe, A.; Misra, M.; Mohanty, A.K. Evaluation of the life cycle of an automotive component produced from biocomposite. J. Clean. Prod. 2020, 273, . [CrossRef]
- Mahalle, L.; Alemdar, A.; Mihai, M.; Legros, N. A cradle-to-gate life cycle assessment of wood fibre-reinforced polylactic acid (PLA) and polylactic acid/thermoplastic starch (PLA/TPS) biocomposites. Int. J. Life Cycle Assess. 2014, 19, 1305–1315, . [CrossRef]
- Ita-Nagy, D.; Vázquez-Rowe, I.; Kahhat, R.; Quispe, I.; Chinga-Carrasco, G.; Clauser, N.M.; Area, M.C. Life cycle assessment of bagasse fiber reinforced biocomposites. Sci. Total. Environ. 2020, 720, 137586, . [CrossRef]
- O. M. De Vegt and W. G. Haije, “COMPARATIVE ENVIRONMENTAL LIFE CYCLE ASSESSMENT OF COMPOSITE MATERIALS,” 1997.
- David, G.; Vega, G.C.; Sohn, J.; Nilsson, A.E.; Hélias, A.; Gontard, N.; Angellier-Coussy, H. Using life cycle assessment to quantify the environmental benefit of upcycling vine shoots as fillers in biocomposite packaging materials. Int. J. Life Cycle Assess. 2020, 26, 738–752, . [CrossRef]
- Luz, S.M.; Caldeira-Pires, A.; Ferrão, P.M. Environmental benefits of substituting talc by sugarcane bagasse fibers as reinforcement in polypropylene composites: Ecodesign and LCA as strategy for automotive components. Resour. Conserv. Recycl. 2010, 54, 1135–1144, . [CrossRef]
- Schmehl, M.; Müssig, J.; Schönfeld, U.; Von Buttlar, H.-B. Life Cycle Assessment on a Bus Body Component Based on Hemp Fiber and PTP®. J. Polym. Environ. 2008, 16, 51–60, . [CrossRef]
- materials and processes by Randall A . Haylock A thesis submitted to the graduate faculty in partial fulfillment of the requirements for the degree of MASTER OF SCIENCE Major : Agricultural and Biological Systems Engineering Program of Study Committee : K,” 2016.
- Haylock, R.; Rosentrater, K.A. Cradle-to-Grave Life Cycle Assessment and Techno-Economic Analysis of Polylactic Acid Composites with Traditional and Bio-Based Fillers. J. Polym. Environ. 2017, 26, 1484–1503, . [CrossRef]
- Diaz, R.; Marsillac, E. Evaluating strategic remanufacturing supply chain decisions. Int. J. Prod. Res. 2016, 55, 2522–2539, . [CrossRef]
- Kirchherr, J.; Reike, D.; Hekkert, M. Conceptualizing the circular economy: An analysis of 114 definitions. Resour. Conserv. Recycl. 2017, 127, 221–232, . [CrossRef]
- Rutitis, D.; Smoca, A.; Uvarova, I.; Brizga, J.; Atstaja, D.; Mavlutova, I. Sustainable Value Chain of Industrial Biocomposite Consumption: Influence of COVID-19 and Consumer Behavior. Energies 2022, 15, 466, . [CrossRef]
- Barbosa-Póvoa, A.P.; da Silva, C.; Carvalho, A. Opportunities and challenges in sustainable supply chain: An operations research perspective. Eur. J. Oper. Res. 2018, 268, 399–431, . [CrossRef]
- Govindan, K.; Rajendran, S.; Sarkis, J.; Murugesan, P. Multi criteria decision making approaches for green supplier evaluation and selection: a literature review. J. Clean. Prod. 2015, 98, 66–83, . [CrossRef]
- Chen, W.; Oldfield, T.L.; Cinelli, P.; Righetti, M.C.; Holden, N.M. Hybrid life cycle assessment of potato pulp valorisation in biocomposite production. J. Clean. Prod. 2020, 269, . [CrossRef]
- Rodriguez, L.J.; Peças, P.; Carvalho, H.; Orrego, C.E. A literature review on life cycle tools fostering holistic sustainability assessment: An application in biocomposite materials. J. Environ. Manag. 2020, 262, 110308, . [CrossRef]
- Frącz, W.; Pacana, A.; Siwiec, D.; Janowski, G.; Bąk, Ł. Reprocessing Possibilities of Poly(3-hydroxybutyrate-co-3-hydroxyvalerate)–Hemp Fiber Composites Regarding the Material and Product Quality. Materials 2023, 17, 55, . [CrossRef]
- Frącz, W.; Pacana, A.; Siwiec, D.; Janowski, G.; Bąk, Ł. Reprocessing Possibilities of Poly(3-hydroxybutyrate-co-3-hydroxyvalerate)–Hemp Fiber Composites Regarding the Material and Product Quality. Materials 2023, 17, 55, . [CrossRef]
- Ribeiro, I.; Kaufmann, J.; Götze, U.; Peças, P.; Henriques, E. Fibre reinforced polymers in the sports industry – Life Cycle Engineering methodology applied to a snowboard using anisotropic layer design. Int. J. Sustain. Eng. 2018, 12, 201–211, . [CrossRef]
- Rodriguez, L.J.; Peças, P.; Carvalho, H.; Orrego, C.E. A literature review on life cycle tools fostering holistic sustainability assessment: An application in biocomposite materials. J. Environ. Manag. 2020, 262, 110308, . [CrossRef]
- M. Khokhar, Y. Hou, M. A. Rafique, and W. Iqbal, “Evaluating the Social Sustainability Criteria of Supply Chain Management in Manufacturing Industries: A Role of BWM in MCDM Ocena kryteriów zrównoważoności społecznej w zarządzaniu łańcuchem dostaw w przemyśle wytwórczym: rola BWM w MCDM,” 2020.
- Rahim, A.A.; Musa, S.N.; Ramesh, S.; Lim, M.K. A systematic review on material selection methods. Proc. Inst. Mech. Eng. Part L: J. Mater. Des. Appl. 2020, 234, 1032–1059, . [CrossRef]
- Chanpuypetch, W.; Niemsakul, J.; Atthirawong, W.; Supeekit, T. An integrated AHP-TOPSIS approach for bamboo product evaluation and selection in rural communities. Decis. Anal. J. 2024, 12, . [CrossRef]
- Saha, A.; Kulkarni, N.D.; Kumari, P. Development of Bambusa tulda-reinforced different biopolymer matrix green composites and MCDM-based sustainable material selection for automobile applications. Environ. Dev. Sustain. 2023, 1–37, . [CrossRef]
- Badi, I.; Pamučar, D.; Stević, Ž.; Muhammad, L. Wind farm site selection using BWM-AHP-MARCOS method: A case study of Libya. Sci. Afr. 2022, 19, . [CrossRef]
- Mousavi-Avval, S.H.; Sahoo, K.; Nepal, P.; Runge, T.; Bergman, R. Environmental impacts and techno-economic assessments of biobased products: A review. Renew. Sustain. Energy Rev. 2023, 180, . [CrossRef]
- Parvez, A.M.; Lewis, J.D.; Afzal, M.T. Potential of industrial hemp (Cannabis sativa L.) for bioenergy production in Canada: Status, challenges and outlook. Renew. Sustain. Energy Rev. 2021, 141, . [CrossRef]
- Lin, C.; Madu, C.N.; Kuei, C.-H.; Tsai, H.-L.; Wang, K.-N. Developing an assessment framework for managing sustainability programs: A Analytic Network Process approach. Expert Syst. Appl. 2015, 42, 2488–2501, . [CrossRef]
- Büyüközkan, G.; Çifçi, G. Evaluation of the green supply chain management practices: a fuzzy ANP approach. Prod. Plan. Control. 2011, 23, 405–418, . [CrossRef]
- Demir, G.; Chatterjee, P.; Pamucar, D. Sensitivity analysis in multi-criteria decision making: A state-of-the-art research perspective using bibliometric analysis. Expert Syst. Appl. 2023, 237, . [CrossRef]
- Demir, G.; Chatterjee, P.; Pamucar, D. Sensitivity analysis in multi-criteria decision making: A state-of-the-art research perspective using bibliometric analysis. Expert Syst. Appl. 2023, 237, . [CrossRef]
- Masuda, T. Hierarchical sensitivity analysis of priority used in analytic hierarchy process. Int. J. Syst. Sci. 1990, 21, 415–427, . [CrossRef]
- Huang, Y.-F. Enhancement on sensitivity analysis of priority in analytic hierarchy process. Int. J. Gen. Syst. 2002, 31, 531–542, . [CrossRef]
- Chen, H.; Kocaoglu, D.F. A sensitivity analysis algorithm for hierarchical decision models. Eur. J. Oper. Res. 2008, 185, 266–288, . [CrossRef]
- Badi, I.; Pamučar, D.; Stević, Ž.; Muhammad, L. Wind farm site selection using BWM-AHP-MARCOS method: A case study of Libya. Sci. Afr. 2022, 19, . [CrossRef]
- Bouraima, M.B.; Tengecha, N.A.; Stević, Ž.; Simić, V.; Qiu, Y. An integrated fuzzy MCDM model for prioritizing strategies for successful implementation and operation of the bus rapid transit system. Ann. Oper. Res. 2023, 342, 141–172, . [CrossRef]
- Menekse, A.; Ertemel, A.V.; Akdag, H.C.; Gorener, A.; Badi, I. Additive manufacturing process selection for automotive industry using Pythagorean fuzzy CRITIC EDAS. PLOS ONE 2023, 18, e0282676, . [CrossRef]
- Stevens, G.C. Integrating the Supply Chain. Int. J. Phys. Distrib. Mater. Manag. 1989, 19, 3–8, . [CrossRef]
- Wolters, W.; Mareschal, B. Novel types of sensitivity analysis for additive MCDM methods. Eur. J. Oper. Res. 1995, 81, 281–290, . [CrossRef]
- Sowlati, T.; Assadi, P.; Paradi, J.C. Developing a mathematical programming model for sensitivity analysis in analytic hierarchy process. Int. J. Math. Oper. Res. 2010, 2, 290, . [CrossRef]
- Ribeiro, I.; Kaufmann, J.; Götze, U.; Peças, P.; Henriques, E. Fibre reinforced polymers in the sports industry – Life Cycle Engineering methodology applied to a snowboard using anisotropic layer design. Int. J. Sustain. Eng. 2018, 12, 201–211, . [CrossRef]
- Sarkis, J.; Dhavale, D.G. Supplier selection for sustainable operations: A triple-bottom-line approach using a Bayesian framework. Int. J. Prod. Econ. 2015, 166, 177–191, . [CrossRef]
- Cinelli, M.; Coles, S.R.; Sadik, O.; Karn, B.; Kirwan, K. A framework of criteria for the sustainability assessment of nanoproducts. J. Clean. Prod. 2016, 126, 277–287, . [CrossRef]
- Akbarian-Saravi, N.; Sowlati, T.; Fry, D.; Milani, A.S. Techno-economic Analy.Sis and multi-criteria assessment of a hemp-based biocomposite production supply chain: a case study,” in Biocomposites and the Circular Economy, Elsevier, 2025, pp. 287–321. [CrossRef]
- Akbarian-Saravi, N.; Sowlati, T.; Ahmad, H.; Hewage, K.; Sadiq, R.; Milani, A.S. Life cycle A.Ssessment of hemp-based biocomposites production for agricultural emission mitigation strategies: a case study,” in Biocomposites and the Circular Economy, Elsevier, 2025, pp. 261–285. [CrossRef]
- T. L. Saaty, “Decision Making with Dependence and Feedback: The Analytic Network Process,” RWS Publications, 1996, ISBN 0-9620317-9-8, p. 370, 1996, [Online]. Available: http://www.rwspublications.com/books/anp/decision-making-with-dependence-and-feedback/.
- D. Brownell and J. Liu, “Field test and cost analysis of four harvesting options for herbaceous biomass handling,” International Journal of Agricultural and Biological Engineering, vol. 4, no. 3, pp. 58–68, 2011, . [CrossRef]
- Mitkidis, G.; Magoutas, A.; Kitsios, F. Market and economic feasibility analysis for the implementation of 2nd generation biofuels in Greece. Energy Strat. Rev. 2018, 19, 85–98, . [CrossRef]
- Shinners, K.; Binversie, B.; Muck, R.; Weimer, P. Comparison of wet and dry corn stover harvest and storage. Biomass- Bioenergy 2007, 31, 211–221, . [CrossRef]
- Sokhansanj, S.; Turhollow, A.F. BASELINE COST FOR CORN STOVER COLLECTION. Appl. Eng. Agric. 2002, 18, . [CrossRef]
- Lemos, S.; Denadai, M.; Guerra, S.; Esperancini, M.; Bueno, O.; Takitane, I. Economic efficiency of two baling systems for sugarcane straw. Ind. Crop. Prod. 2014, 55, 97–101, . [CrossRef]
- Lagemann, L.M.; da Silva, H.L.; Turatti, L.; Spinelli, R. Analysis of the thermal behavior of Masonry Concrete Block with Internal Natural Element Coating. Int. J. Adv. Eng. Res. Sci. 2023, 10, 017–027, . [CrossRef]
- Bitra, V.S.P.; Womac, A.R.; Chevanan, N.; Sokhansanj, S. Comminution Properties of Biomass in Hammer Mill and its Particle Size Characterization. 2008 Providence, Rhode Island, June 29 - July 2, 2008. LOCATION OF CONFERENCE, COUNTRYDATE OF CONFERENCE; .
- B. Mill, F. Decortication, M. L. Baker, M. L. Baker, and M. L. Bakero, “Evaluation of a Hammer Mill and planetary Master of Science Evaluation of a Hammer Mill and planetary Ball Mill for Hemp Fibre Decortication By of Master of Science,” 2009.
- Ivanova, T.; Havrland, B.; Novotny, R.; Muntean, A.; Hutla, P.; Szeląg-Sikora, A. Influence of raw material properties on energy consumption during briquetting process. BIO Web Conf. 2018, 10, 02006, . [CrossRef]
- B. Lu, “What is the main factors affecting the working performance of hammer mill?”.
- Orisaleye, J.I.; Jekayinfa, S.O.; Ogundare, A.A.; Adefuye, O.A.; Bamido, E. Effect of screen size on particle size distribution and performance of a small-scale design for a combined chopping and milling machine. Clean. Eng. Technol. 2022, 7, 100426, . [CrossRef]
- Atkins, P.L. Sample Processing and Preparation Considerations for Solid Cannabis Products. J. AOAC Int. 2019, 102, 427–433, . [CrossRef]
- Miao, Z.; Shastri, Y.; Grift, T.E.; Hansen, A.C.; Ting, K. Lignocellulosic biomass feedstock transportation alternatives, logistics, equipment configurations, and modeling. Biofuels, Bioprod. Biorefining 2012, 6, 351–362, . [CrossRef]
- Lyons, A.; Patterson, P.; Boney, J. Hammermill screen selection for soybean processing: soybean meal particle size and pullet performance effects. J. Appl. Poult. Res. 2022, 31, . [CrossRef]
- Tayyab, M.; Sarkar, B. An interactive fuzzy programming approach for a sustainable supplier selection under textile supply chain management. Comput. Ind. Eng. 2021, 155, . [CrossRef]
- Ho, M.-P.; Wang, H.; Lee, J.-H.; Ho, C.-K.; Lau, K.-T.; Leng, J.; Hui, D. Critical factors on manufacturing processes of natural fibre composites. Compos. Part B Eng. 2012, 43, 3549–3562, doi:10.1016/j.compositesb.2011.10.001.
- Sasimowski, E.; Majewski, Ł.; Grochowicz, M. Analysis of Selected Properties of Biocomposites Based on Polyethylene with a Natural Origin Filler. Materials 2020, 13, 4182, doi:10.3390/ma13184182.
- Kumar, S.; Saha, A. Effects of particle size on structural, physical, mechanical and tribology behaviour of agricultural waste (corncob micro/nano-filler) based epoxy biocomposites. J. Mater. Cycles Waste Manag. 2022, 24, 2527–2544, . [CrossRef]
- Engineering Systems Acquisition and Support,” 2015.
- G. T. Fasick, “a Miscanthus Conditioning and Bale Compression Analysis,” no. May, p. 112, 2015.
- M. E. Shedden, “TRACE : Tennessee Research and Creative Exchange A Quantitative Analysis for Improving Harvest Productivity for Biomass Crops,” 2018.
- California Pellet Mill, “Economics of grinding for pelleted feeds,” pp. 1–24, 2017.
- Rybicka, J.; Tiwari, A.; Leeke, G.A. Technology readiness level assessment of composites recycling technologies. J. Clean. Prod. 2016, 112, 1001–1012, . [CrossRef]
- Government of Canada, Technology Readiness Level.” [Online]. Available: https://ised-isde.canada.ca/site/innovation-canada/en/technology-readiness-levels.
- Government of Canada, Technology Readiness Level.” [Online]. Available: https://ised-isde.canada.ca/site/innovation-canada/en/technology-readiness-levels.
- Saaty, T.L.; Vargas, L.G. Saaty, T. L., Vargas, L. G., Saaty, T. L., & Vargas, L. G. (2013). The analytic network process (pp. 1-40). Springer US. [CrossRef]
- T. L. Saaty, “Decision Making with Dependence and Feedback: The Analytic Network Process,” RWS Publications, 1996, ISBN 0-9620317-9-8, p. 370, 1996.
- Agarwal, A.; Shankar, R.; Tiwari, M. Modeling the metrics of lean, agile and leagile supply chain: An ANP-based approach. Eur. J. Oper. Res. 2006, 173, 211–225, . [CrossRef]
- Saaty, T.L. How to make a decision: The analytic hierarchy process. Eur. J. Oper. Res. 1990, 48, 9–26, doi:10.1016/0377-2217(90)90057-i.
- Kahraman, C.; Ruan, D.; Doǧan, I. Fuzzy group decision-making for facility location selection. Inf. Sci. 2003, 157, 135–153, . [CrossRef]
- Milani, A.; Shanian, A.; El-Lahham, C. A decision-based approach for measuring human behavioral resistance to organizational change in strategic planning. Math. Comput. Model. 2008, 48, 1765–1774, . [CrossRef]
- N. Akbarian-Saravi, “Optimized-Rank-Adjustment-Sensitivity-Analysis-for-MCDM (GitHub).” [Online]. Available: https://github.com/niloofarcrno/Optimized-Rank-Adjustment-Sensitivity-Analysis-for-MCDM-.
- Sowlati, T.; Assadi, P.; Paradi, J.C. Developing a mathematical programming model for sensitivity analysis in analytic hierarchy process. Int. J. Math. Oper. Res. 2010, 2, 290, . [CrossRef]
- Sowlati, T.; Assadi, P.; Paradi, J.C. Developing a mathematical programming model for sensitivity analysis in analytic hierarchy process. Int. J. Math. Oper. Res. 2010, 2, 290, . [CrossRef]
- Pérez, A.T.E.; Vásquez, Ó.C. How to Measure Sustainability in the Supply Chain Design: An Integrated Proposal from an Extensive and Systematic Literature Review. Sustainability 2023, 15, 7138, . [CrossRef]
- S. Mani, S. Sokhansanj, X. Bi, and A. Turhollow, “E p f p b,” vol. 22, no. 3, pp. 421–426, 2006.
- Sokhansanj, S.; Mani, S.; Tagore, S.; Turhollow, A. Techno-economic analysis of using corn stover to supply heat and power to a corn ethanol plant – Part 1: Cost of feedstock supply logistics. Biomass- Bioenergy 2010, 34, 75–81, . [CrossRef]
- S. Mani, S. Sokhansanj, X. Bi, and A. Turhollow, “E p f p b,” vol. 22, no. 3, pp. 421–426, 2006.
- S. P. Mooleki et al., “Hemp Production in Saskatchewan,” Saskatchewan Ministry of Agriculture, 2017.
- Zampori, L.; Dotelli, G.; Vernelli, V. Life Cycle Assessment of Hemp Cultivation and Use of Hemp-Based Thermal Insulator Materials in Buildings. Environ. Sci. Technol. 2013, 47, 7413–7420, . [CrossRef]
- Finnan, J.; Burke, B. Potassium fertilization of hemp (Cannabis sativa). Ind. Crop. Prod. 2013, 41, 419–422, . [CrossRef]
- Sokhansanj, S.; Mani, S.; Tagore, S.; Turhollow, A. Techno-economic analysis of using corn stover to supply heat and power to a corn ethanol plant – Part 1: Cost of feedstock supply logistics. Biomass- Bioenergy 2010, 34, 75–81, . [CrossRef]
- Enzymatic Hydrolysis.” [Online]. Available: https://www.sciencedirect.com/topics/chemical-engineering/enzymatic-hydrolysis.
- M. A. P. Pool, “The eco-profiles for current and near-future NatureWorks ® polylactide (PLA) production,” pp. 58–81, 2006.
- C. Cambero, M. H. Alexandre, and T. Sowlati, “Resources , Conservation and Recycling Life cycle greenhouse gas analysis of bioenergy generation alternatives using forest and wood residues in remote locations : A case study in British Columbia , Canada,” vol. 105, pp. 59–72, 2015.
Figure 1.
The proposed sustainable decision-making framework for SC pre-processing equipment selection.
Figure 1.
The proposed sustainable decision-making framework for SC pre-processing equipment selection.
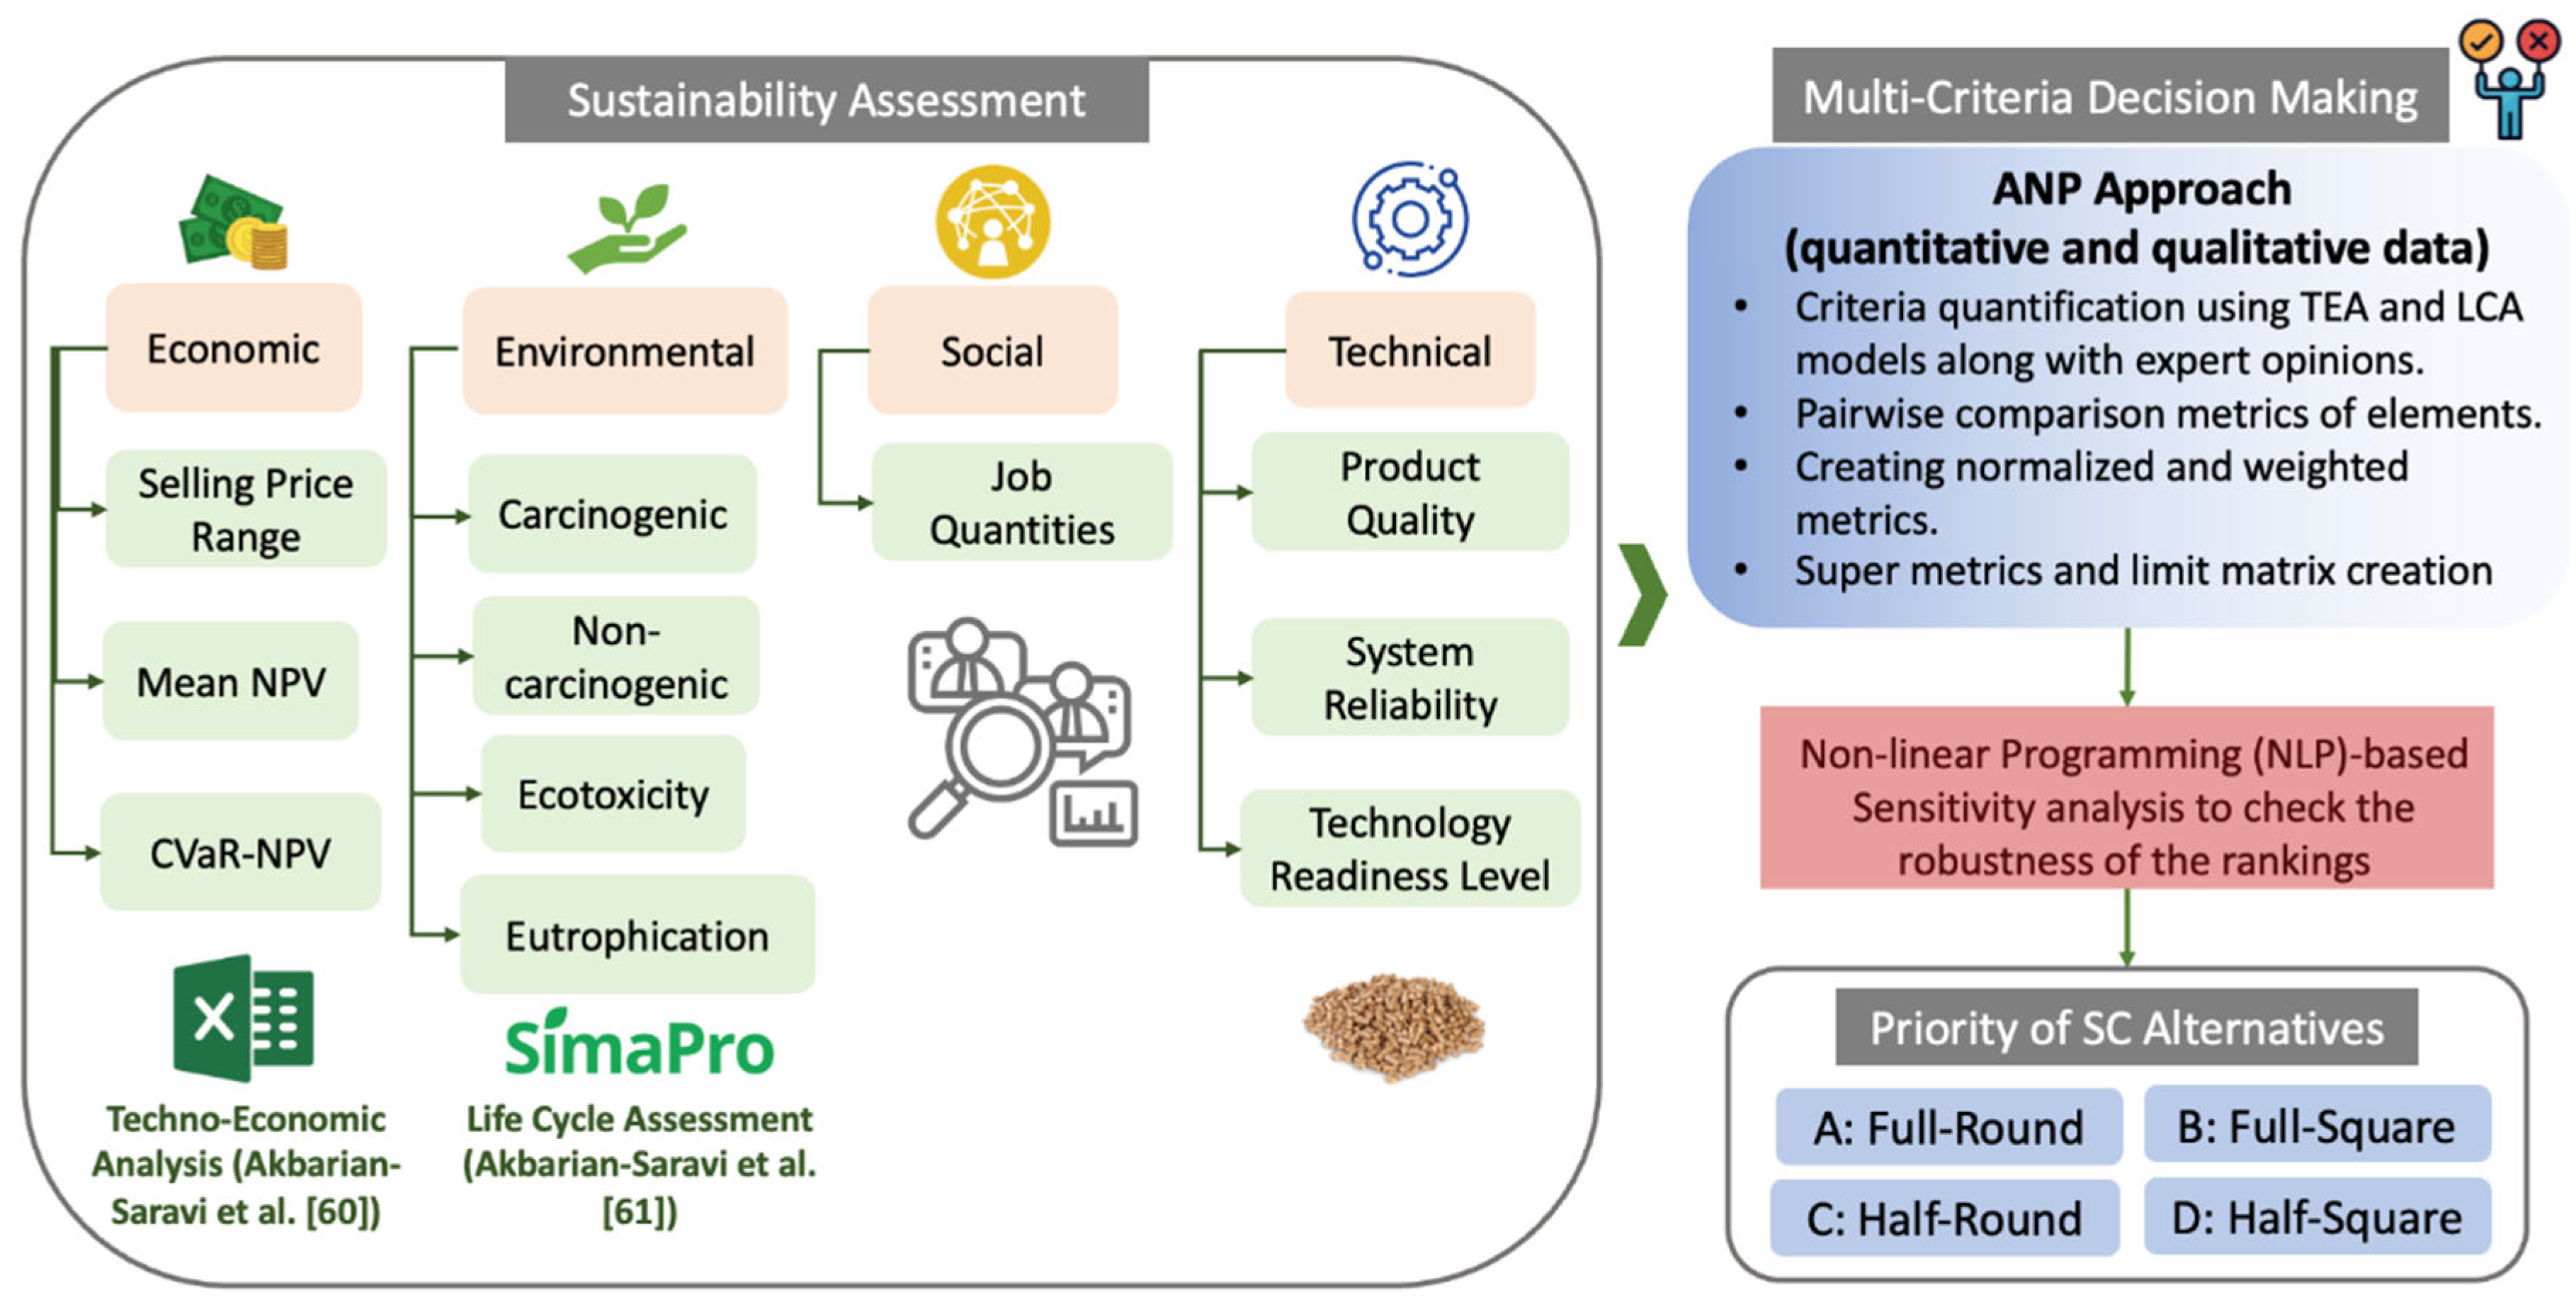
Figure 2.
Overview of the supply chain activities and the different alternatives considered in the current study (encircled by the dotted line).
Figure 2.
Overview of the supply chain activities and the different alternatives considered in the current study (encircled by the dotted line).
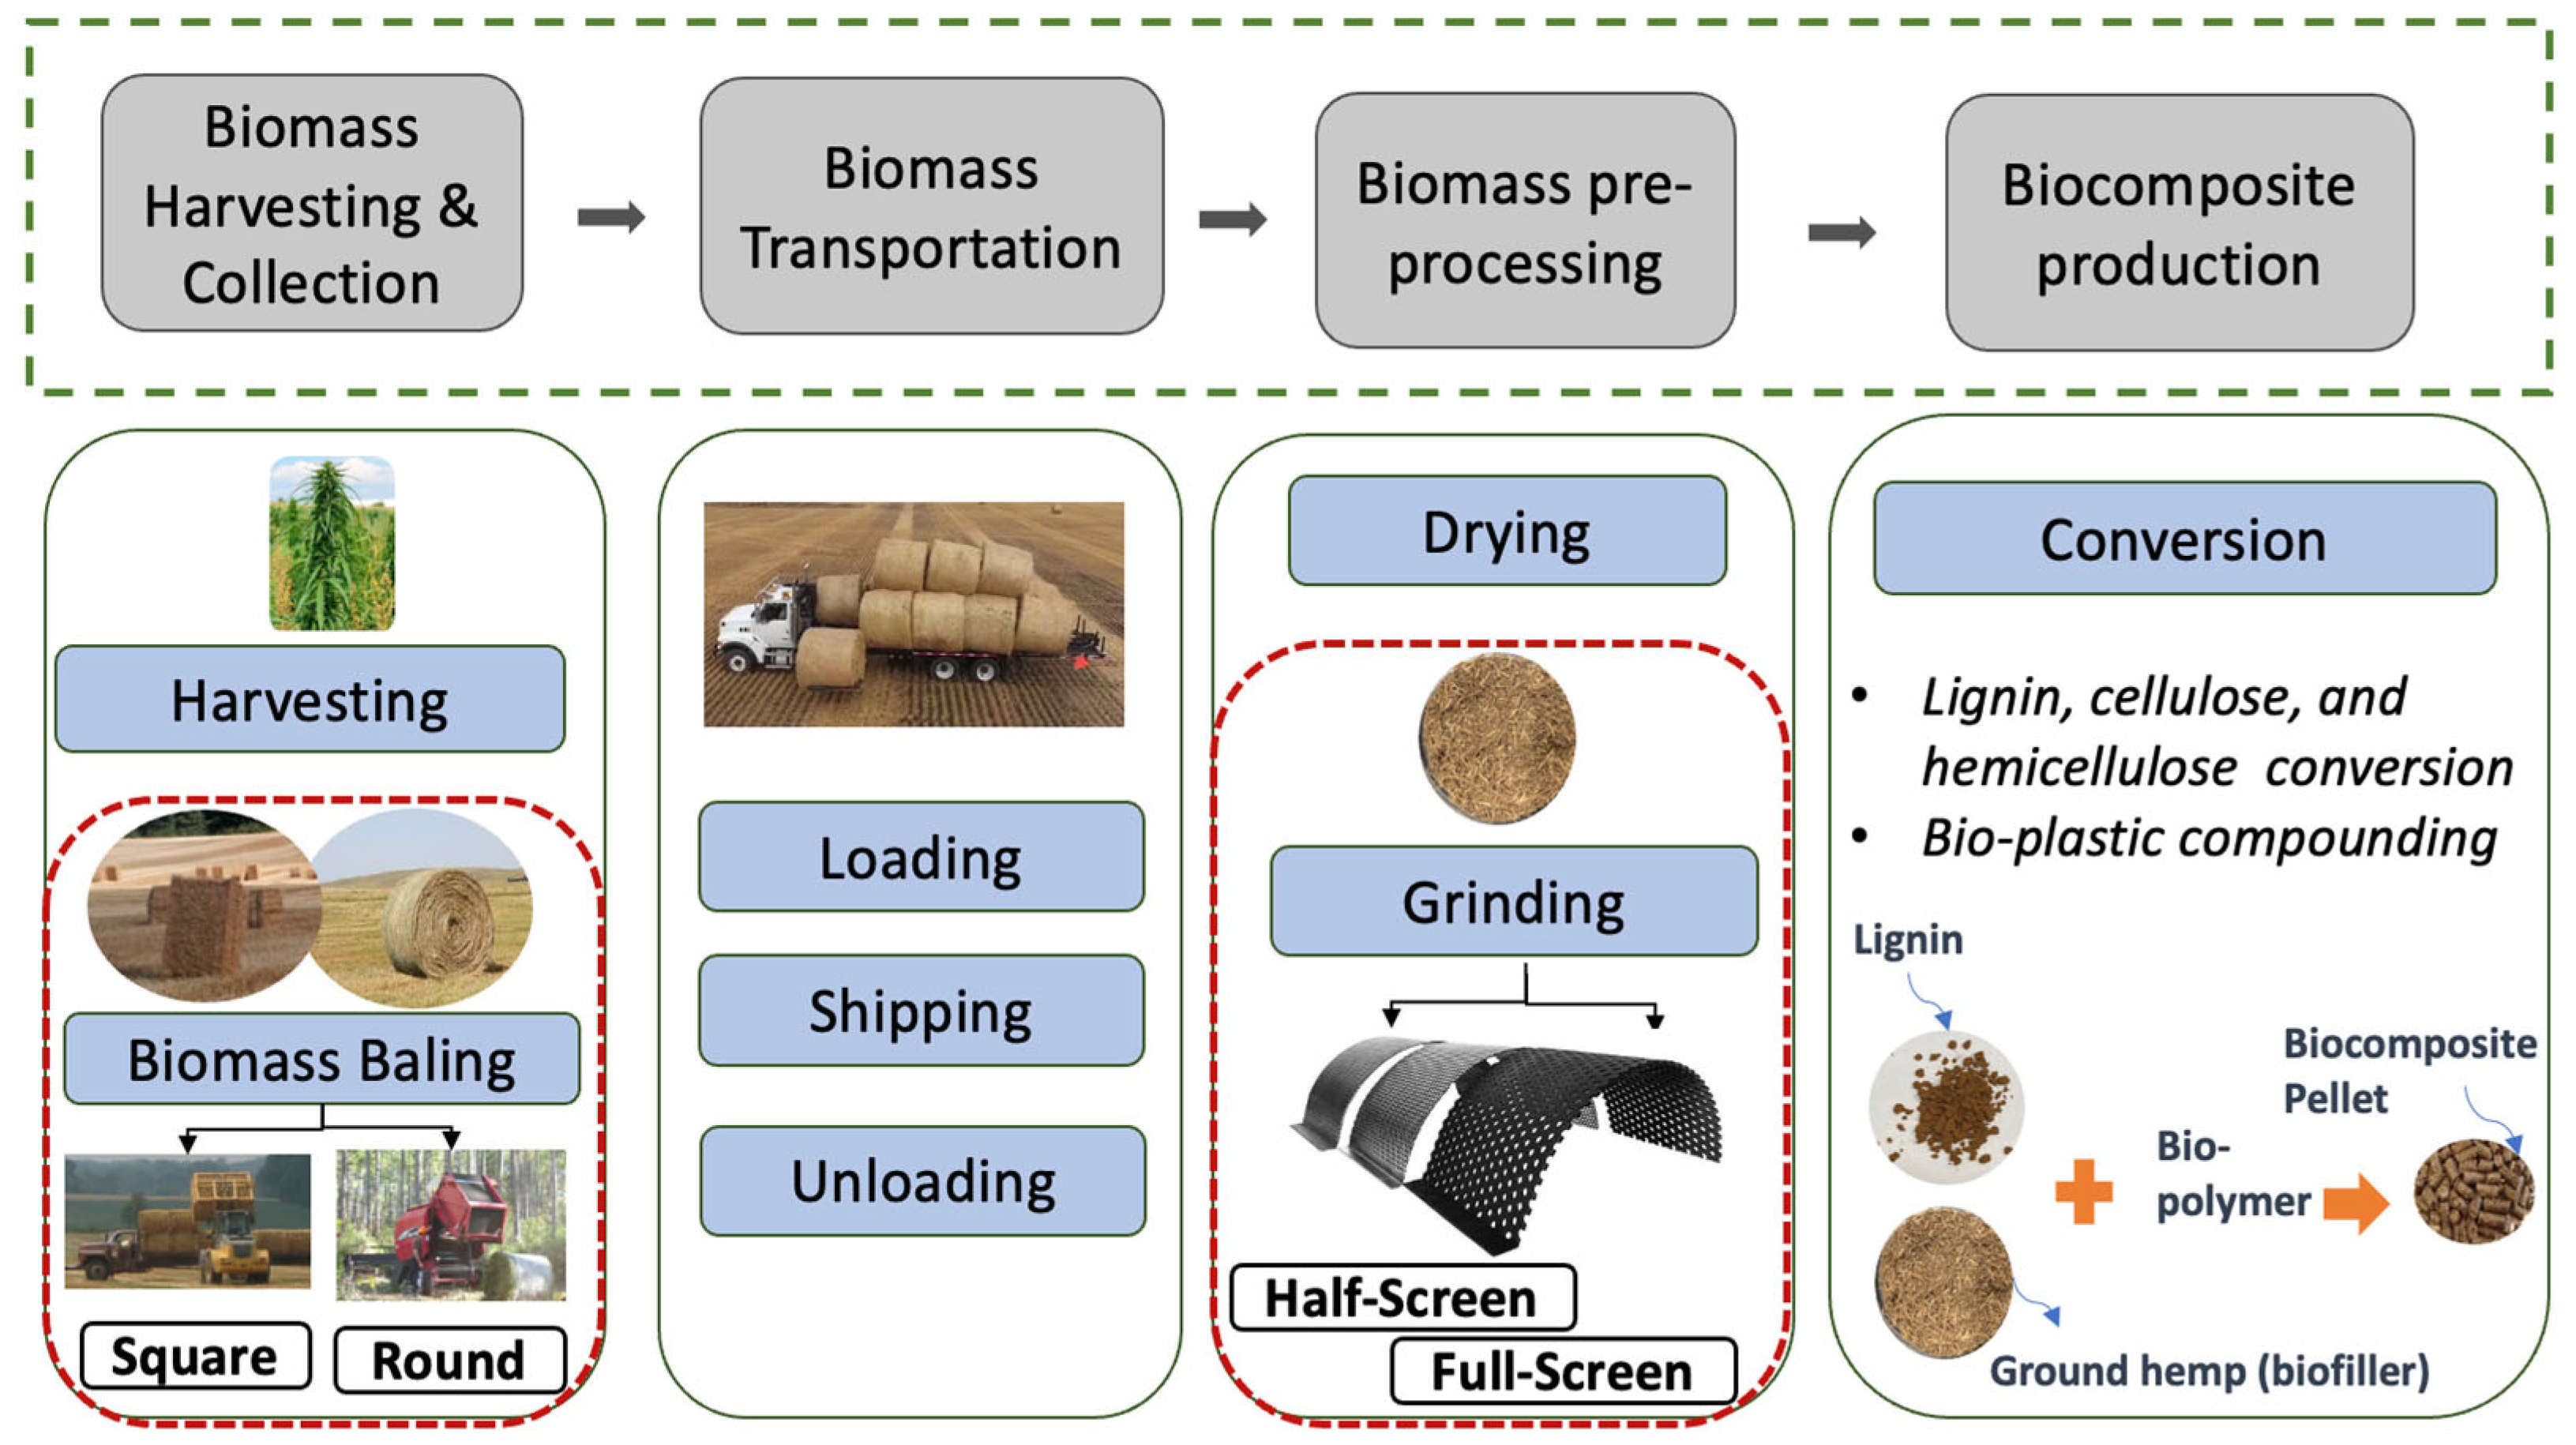
Figure 3.
Analytic Network Process (ANP) used for scenario 1.
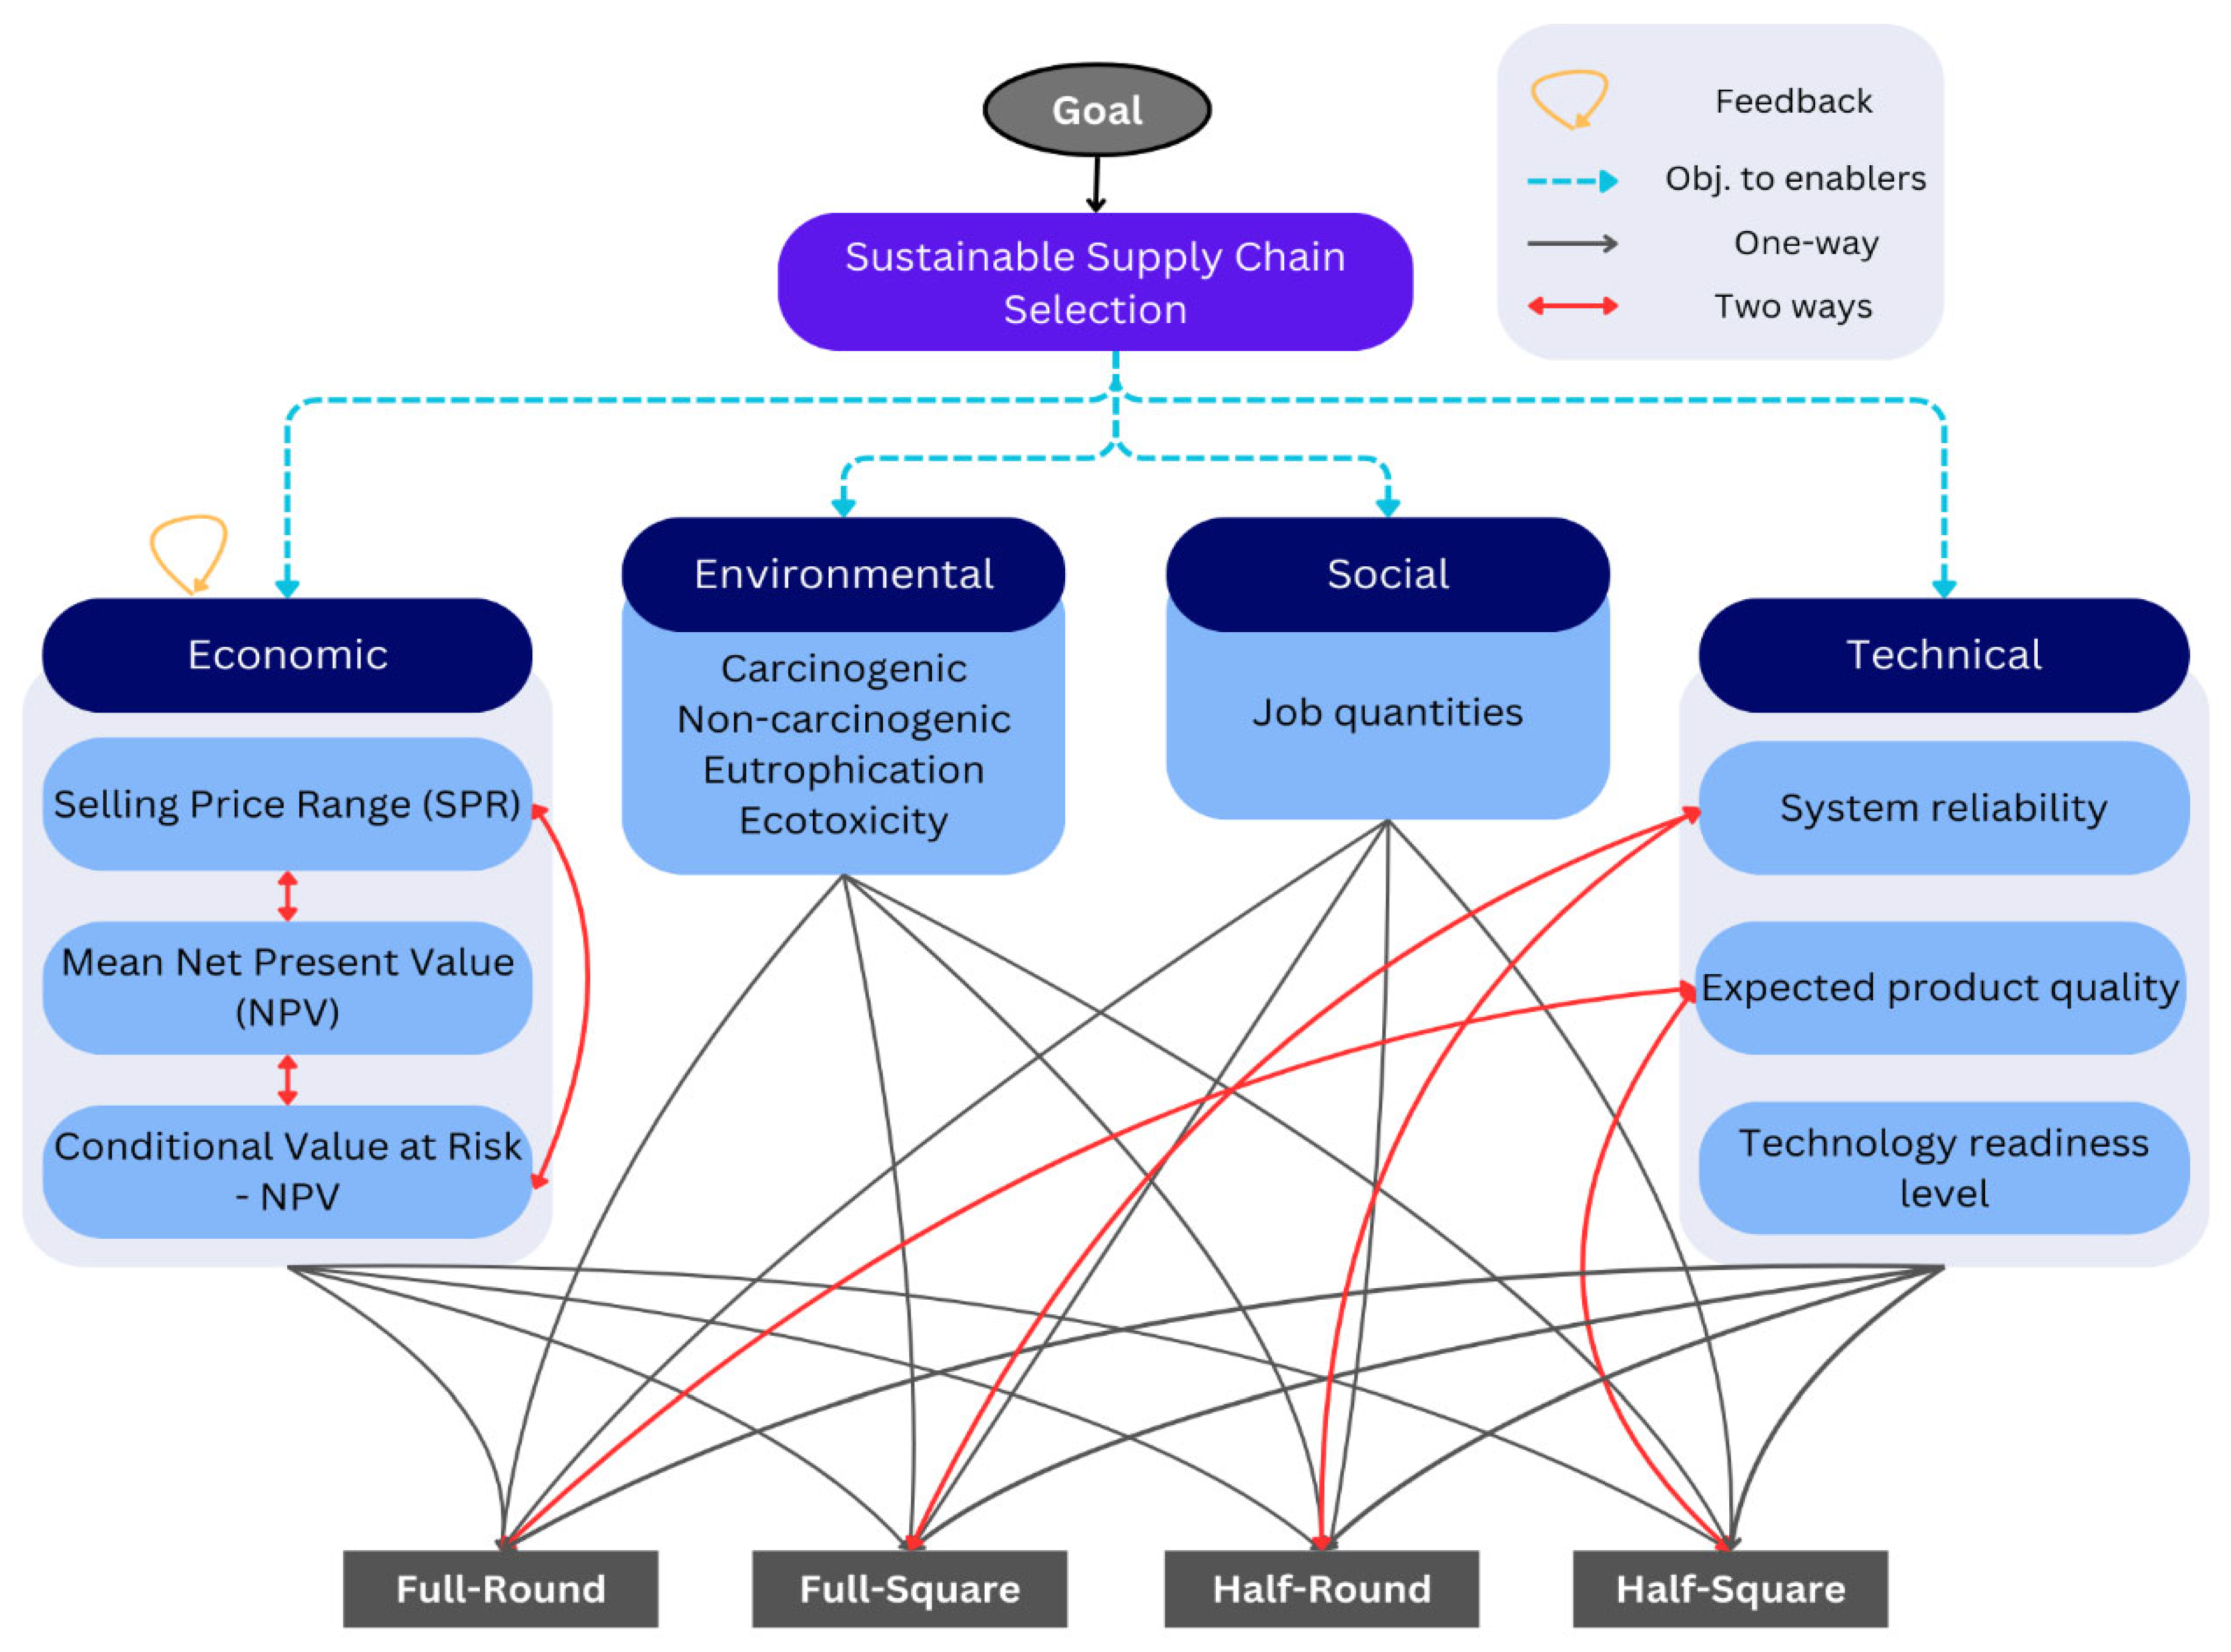
Figure 4.
Figure 4. The Analytic Hierarchy Process (AHP) used for scenario 2.
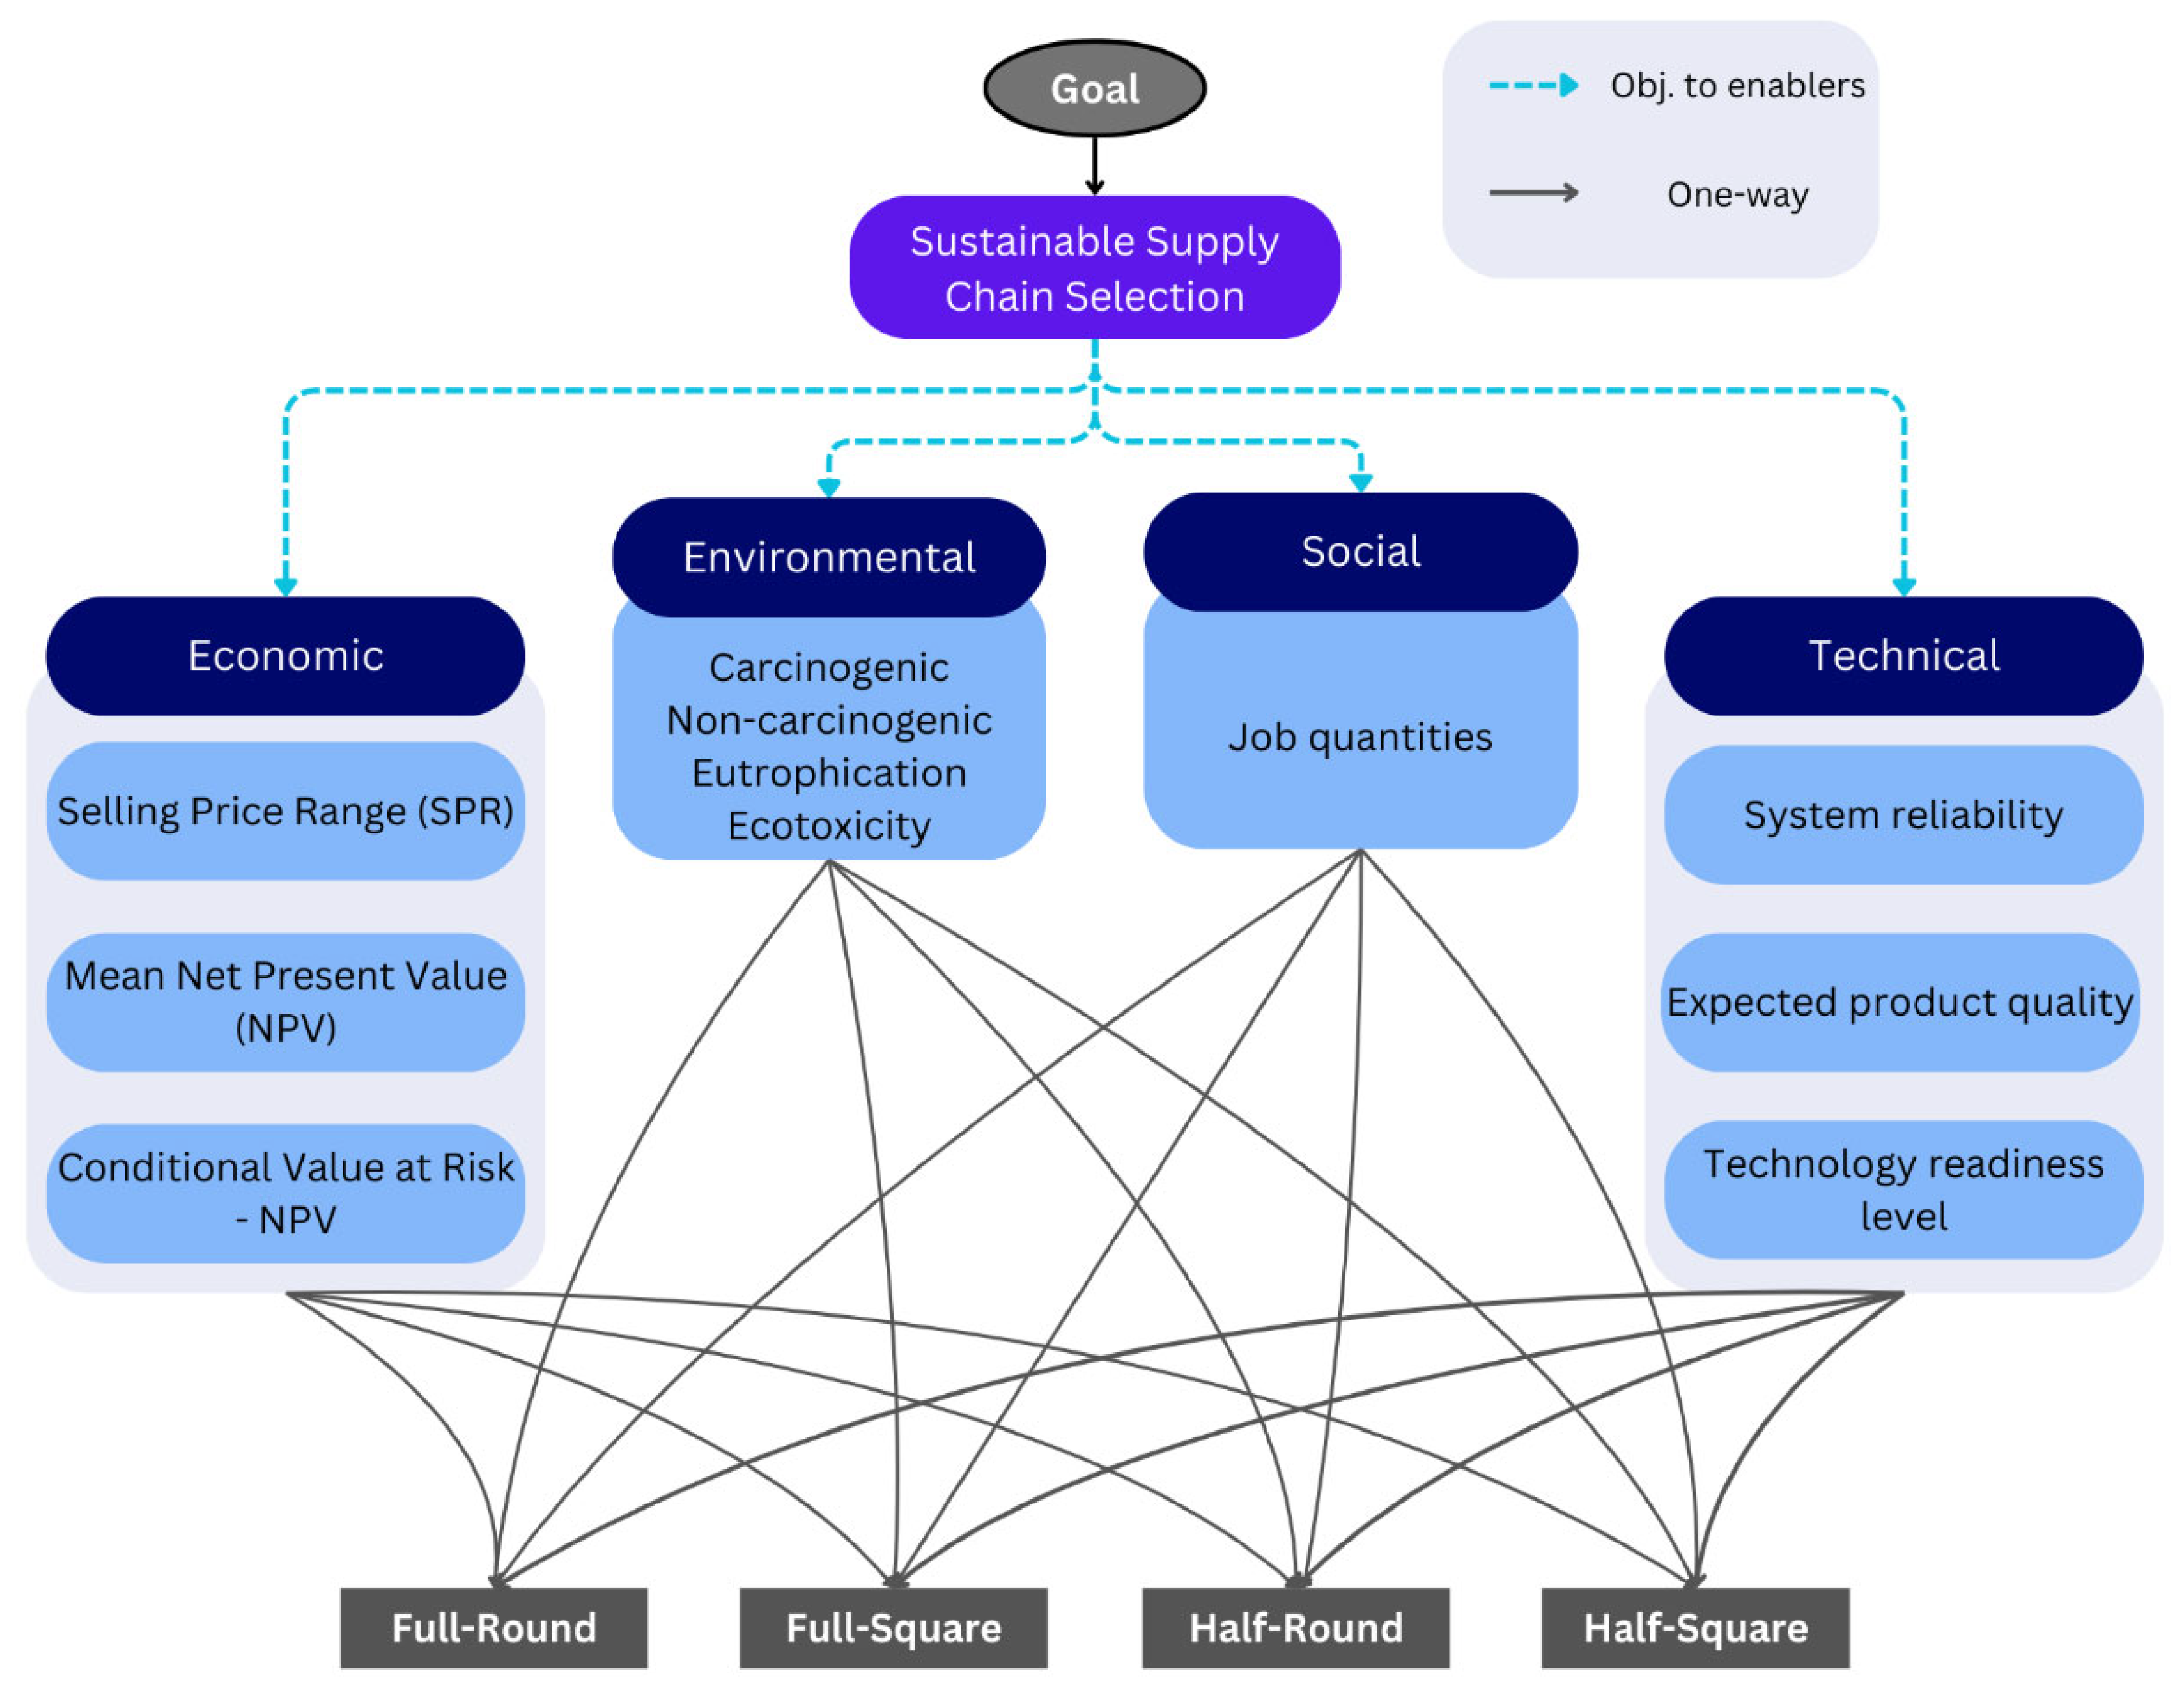
Figure 5.
Criteria weights using pairwise comparisons; a) ANP (interdependencies), b) AHP model (without interdependencies).
Figure 5.
Criteria weights using pairwise comparisons; a) ANP (interdependencies), b) AHP model (without interdependencies).
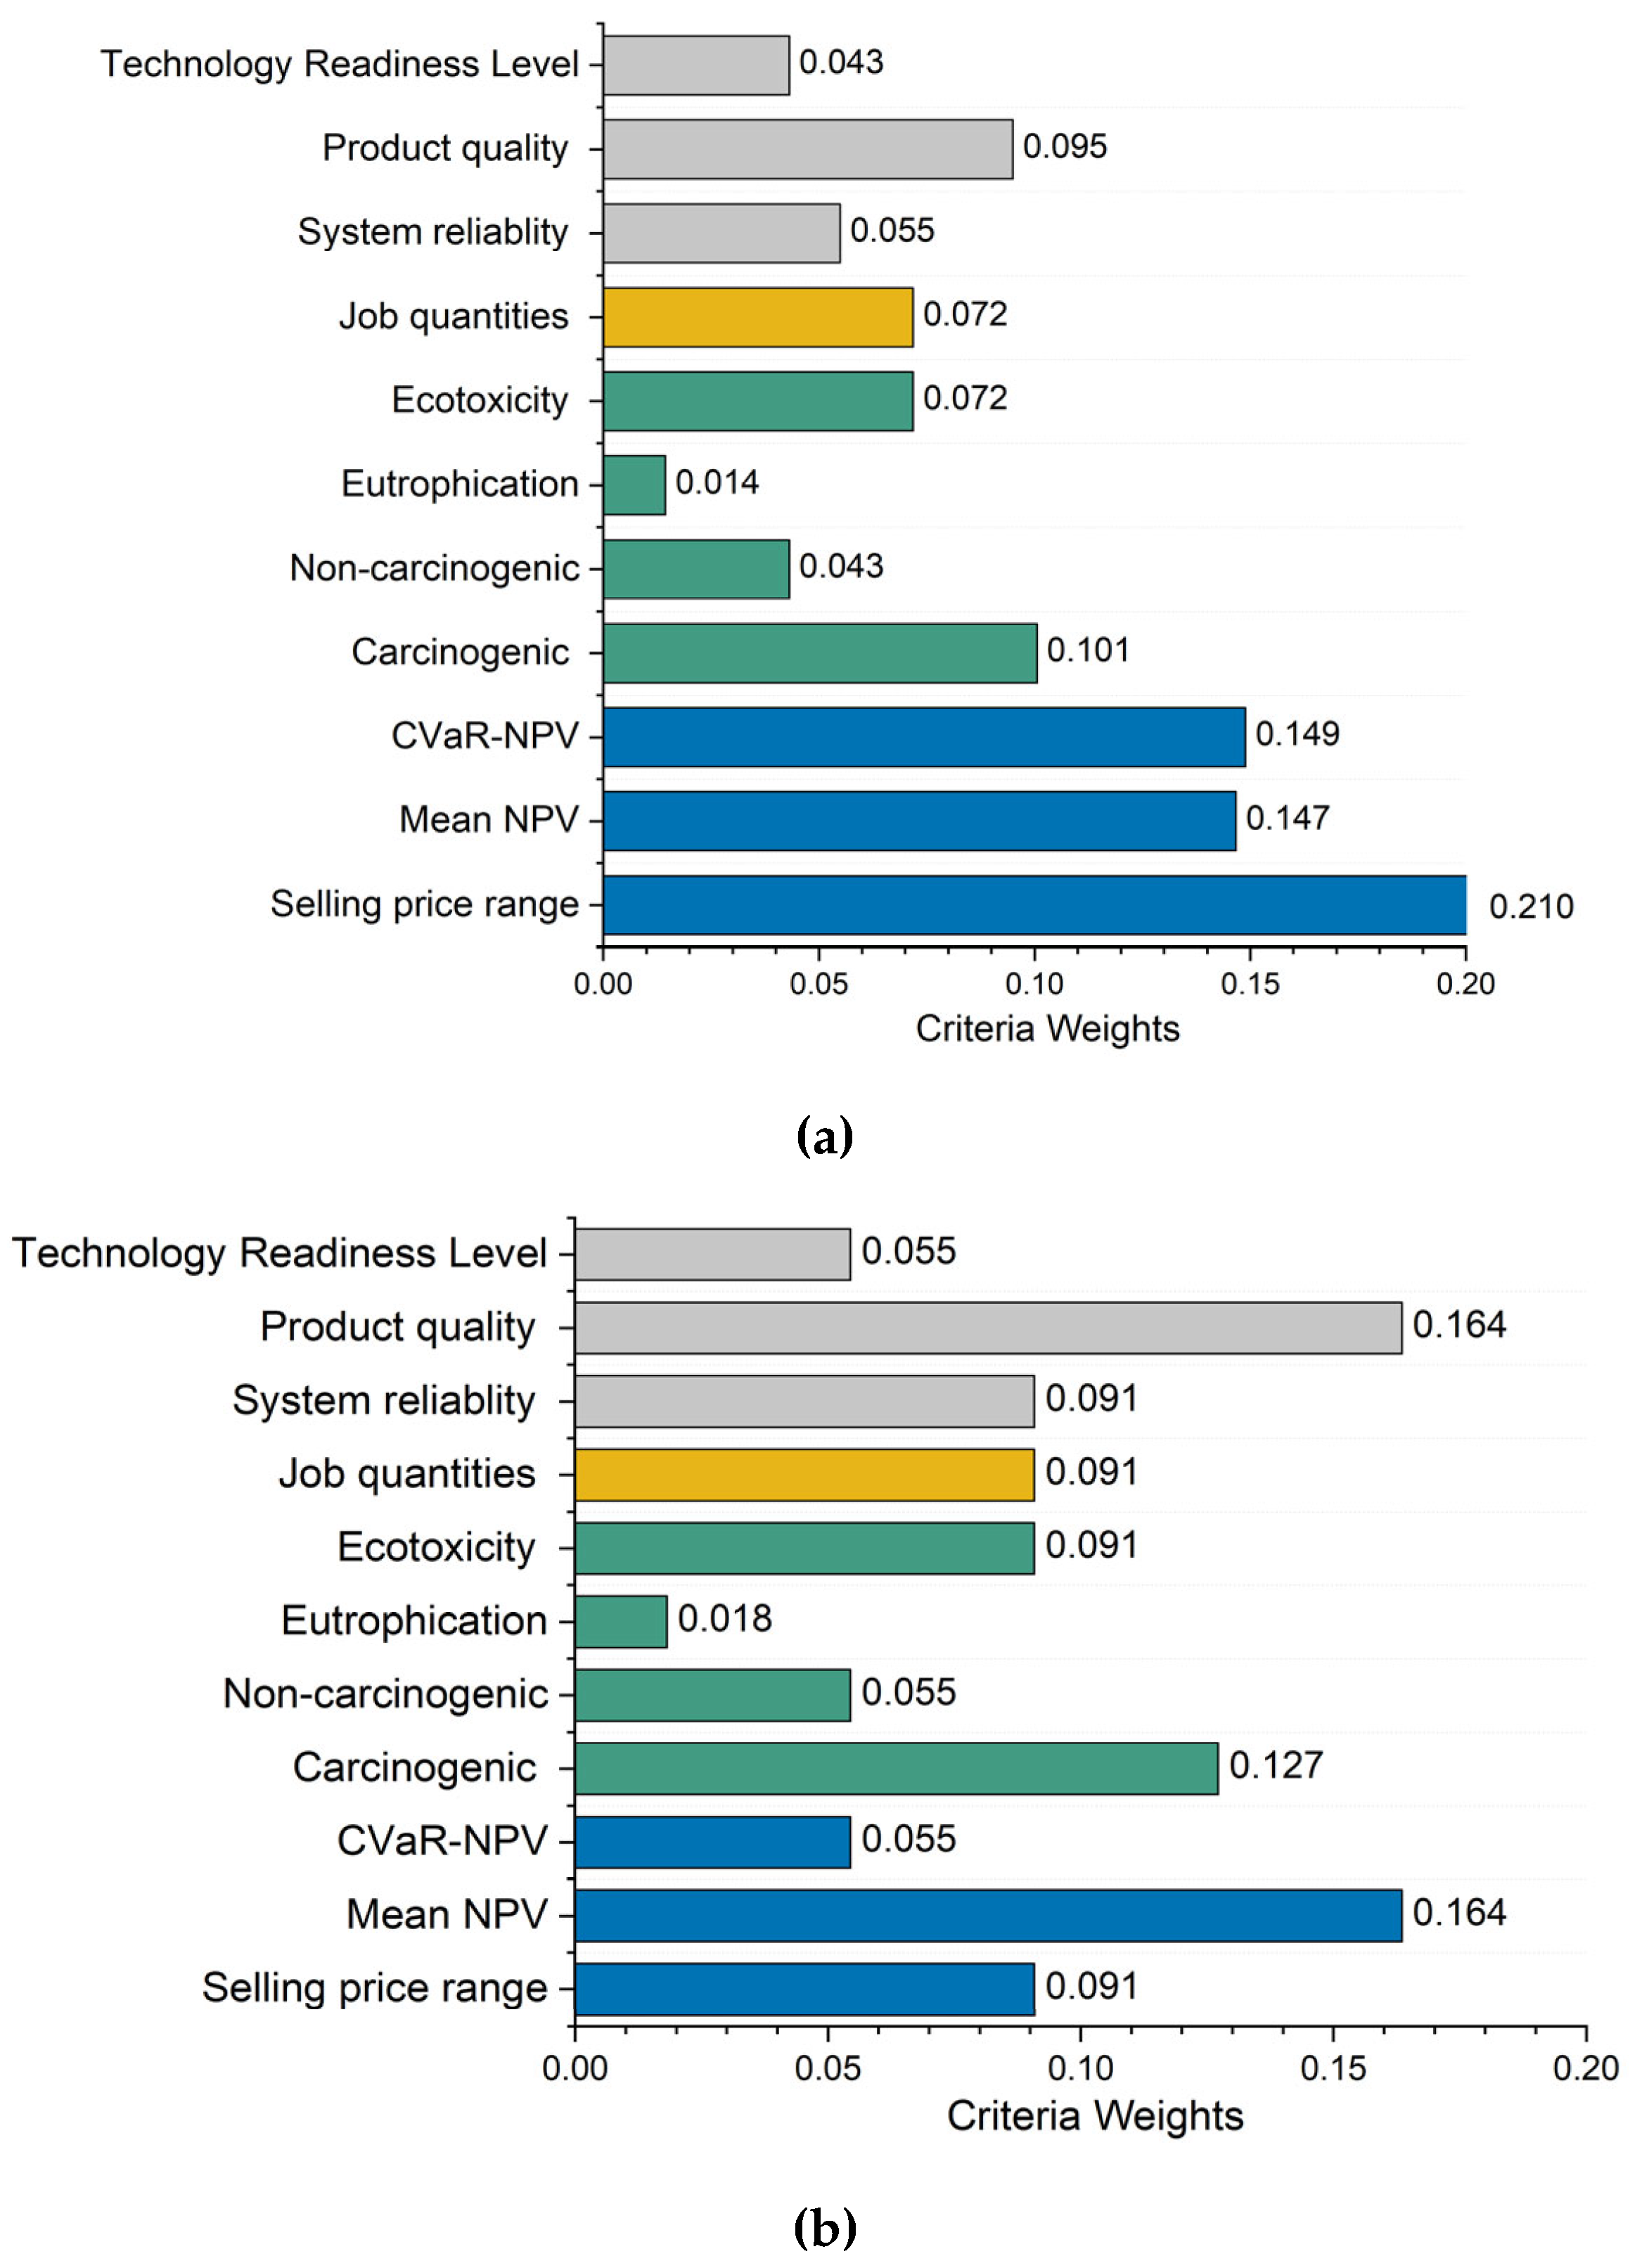
Figure 6.
The alternatives ranking of the SC configurations in scenario 1 (with inner/outer dependence).
Figure 6.
The alternatives ranking of the SC configurations in scenario 1 (with inner/outer dependence).
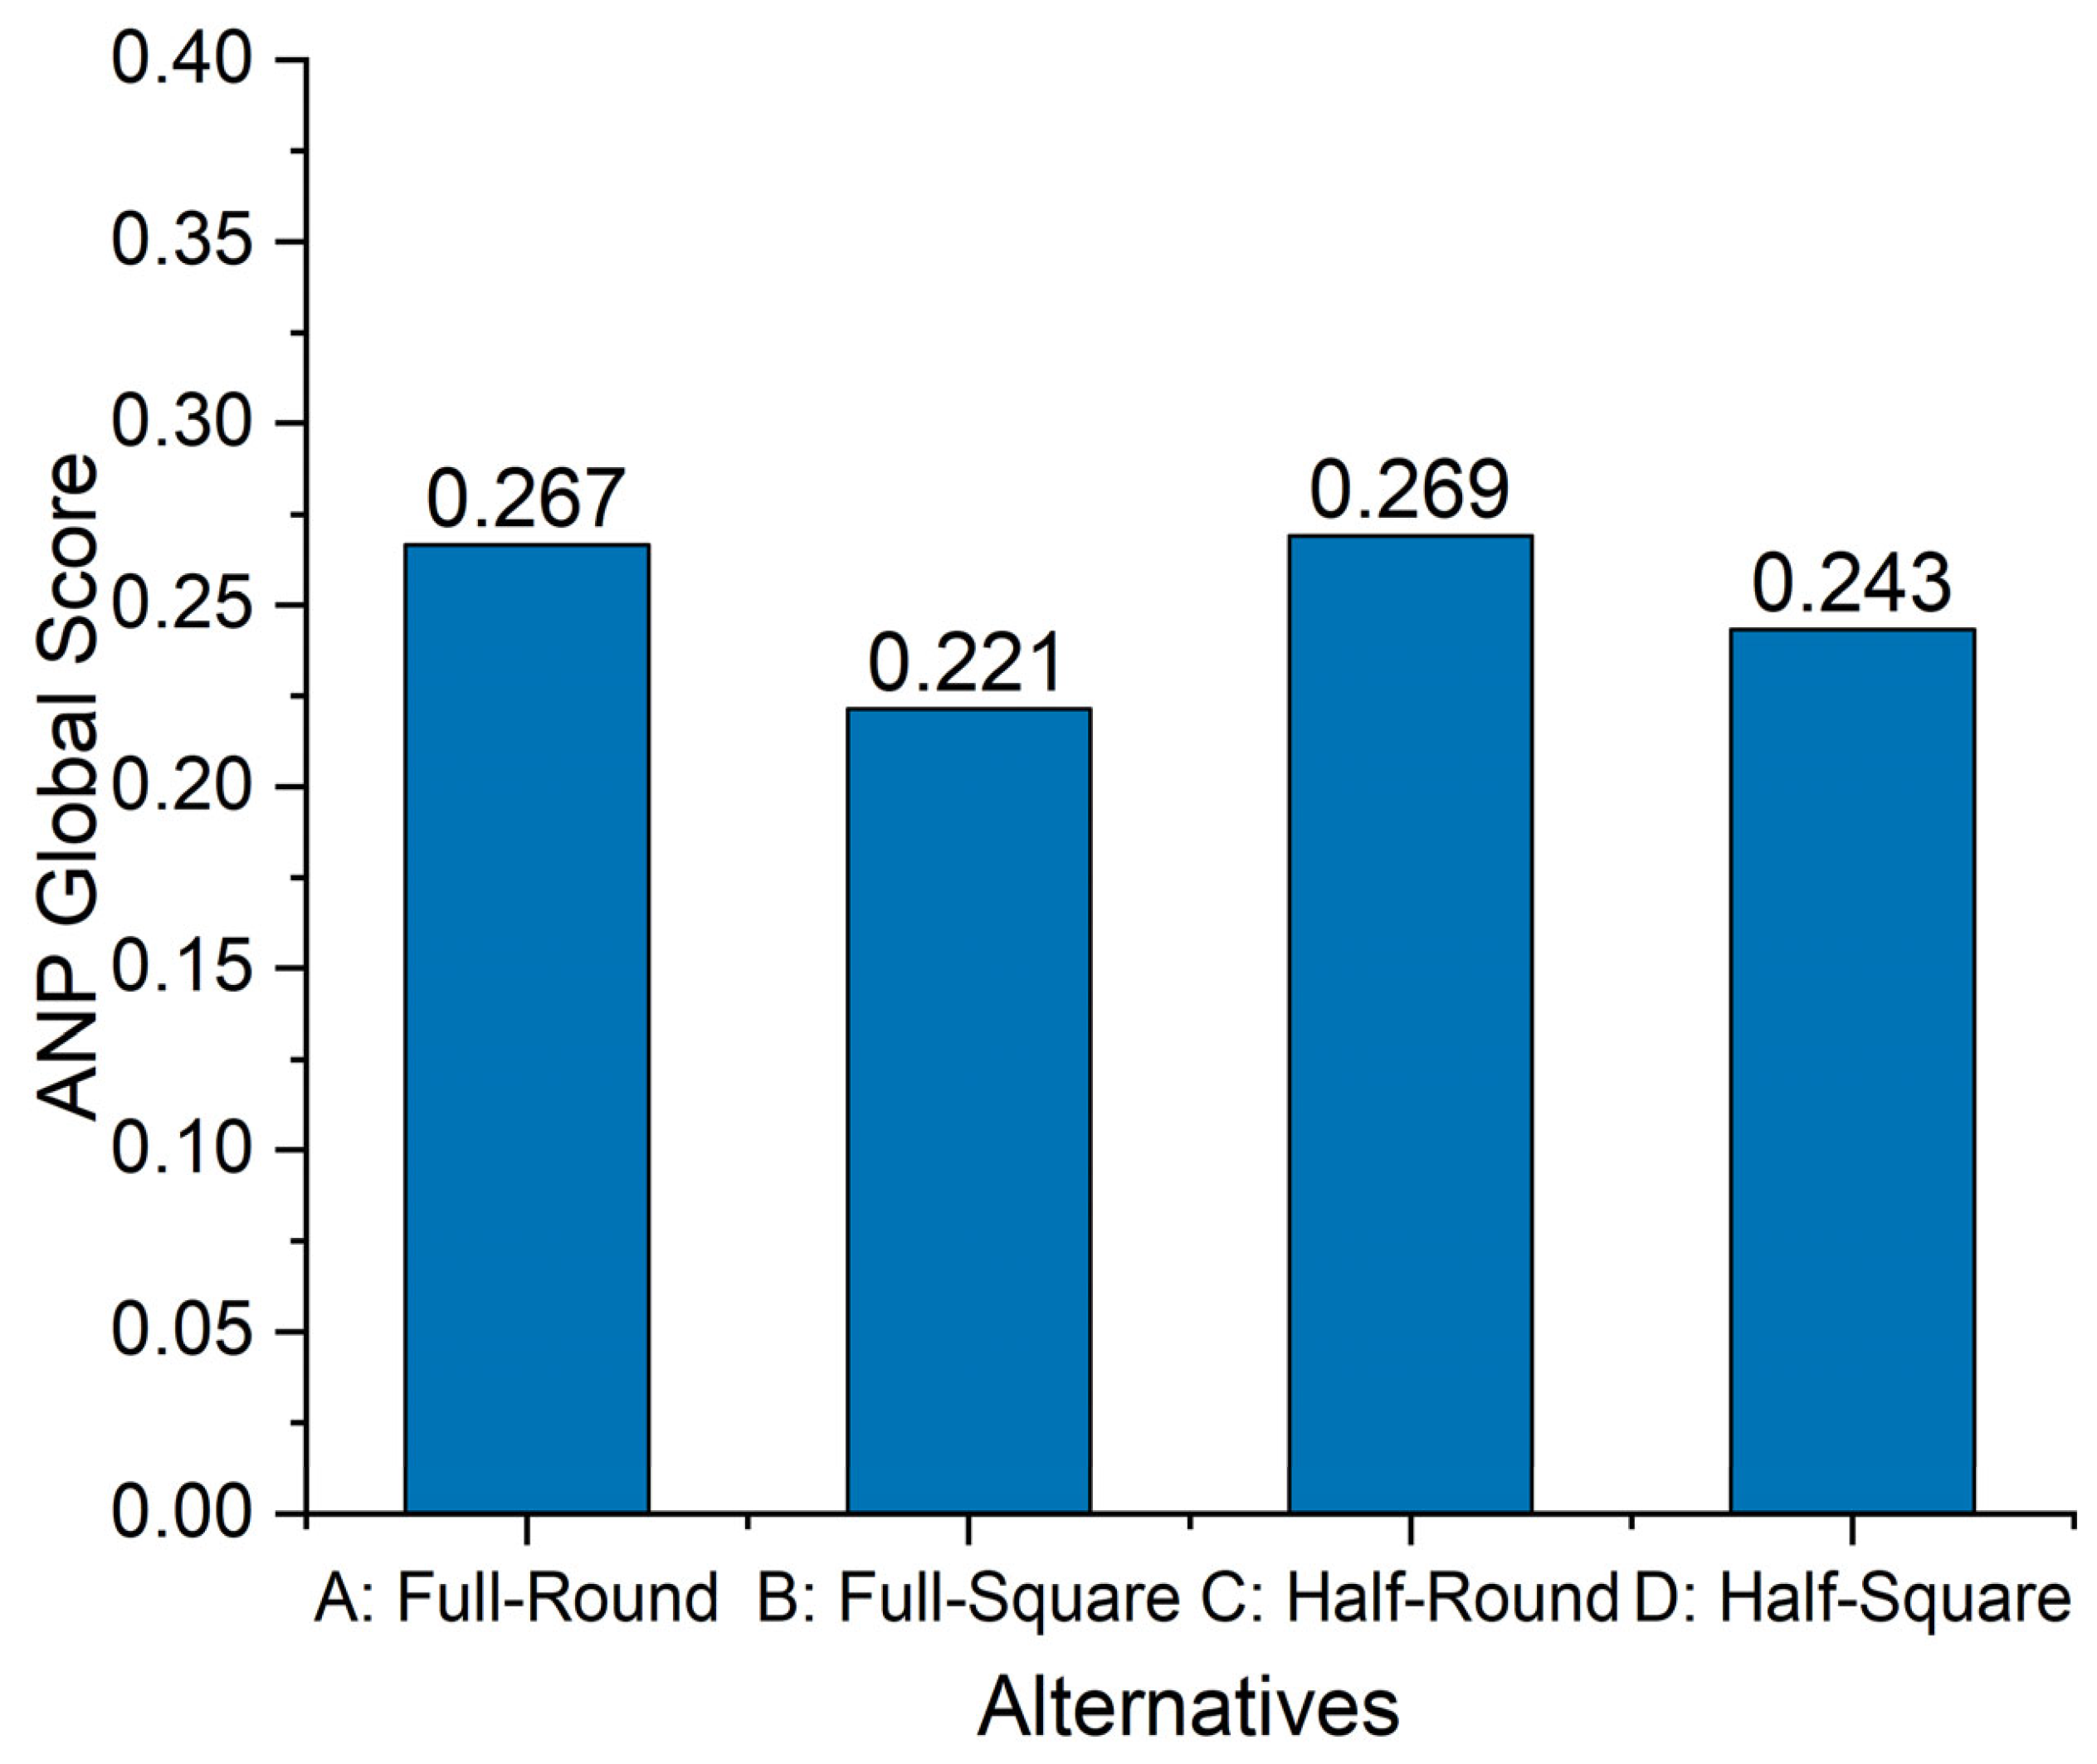
Figure 7.
Sensitivity analysis results of decision criteria clusters importance (economic, environmental, social, and technical) for alternatives ranking in scenario 1.
Figure 7.
Sensitivity analysis results of decision criteria clusters importance (economic, environmental, social, and technical) for alternatives ranking in scenario 1.
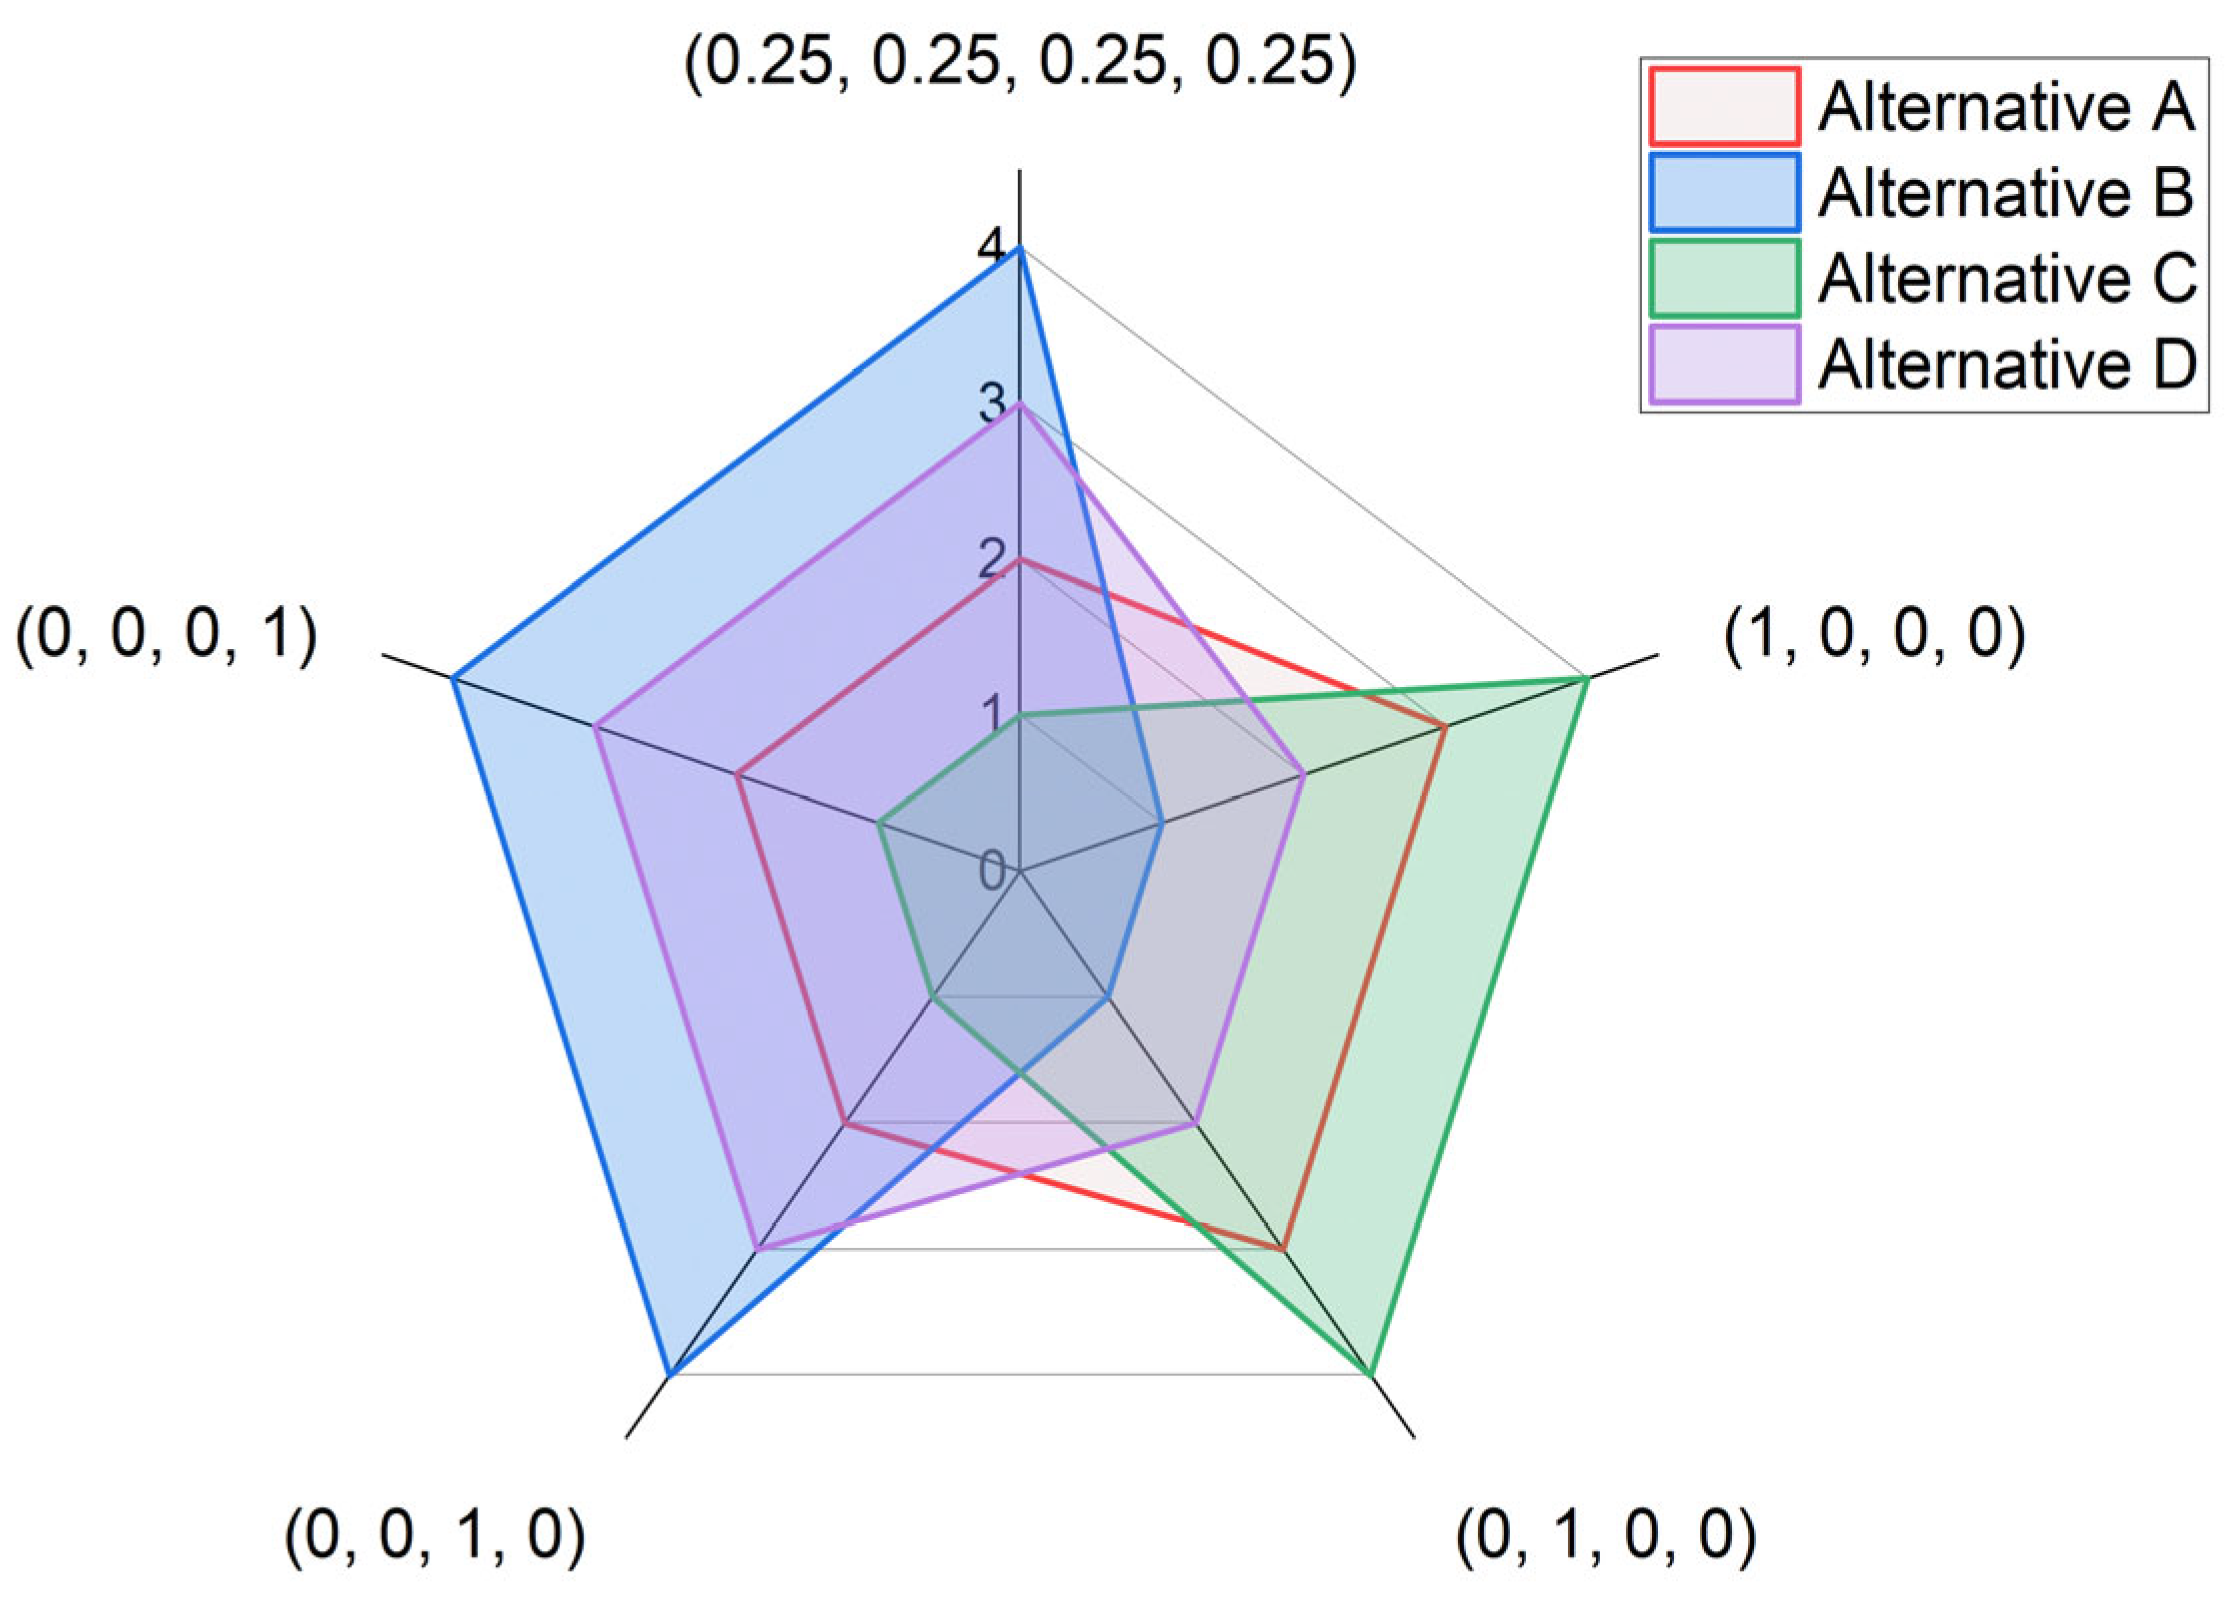
Figure 8.
Sensitivity analysis of the Unreliability Factor (UF) on alternatives scores, focusing on qualitative factors such as product quality and system reliability.
Figure 8.
Sensitivity analysis of the Unreliability Factor (UF) on alternatives scores, focusing on qualitative factors such as product quality and system reliability.
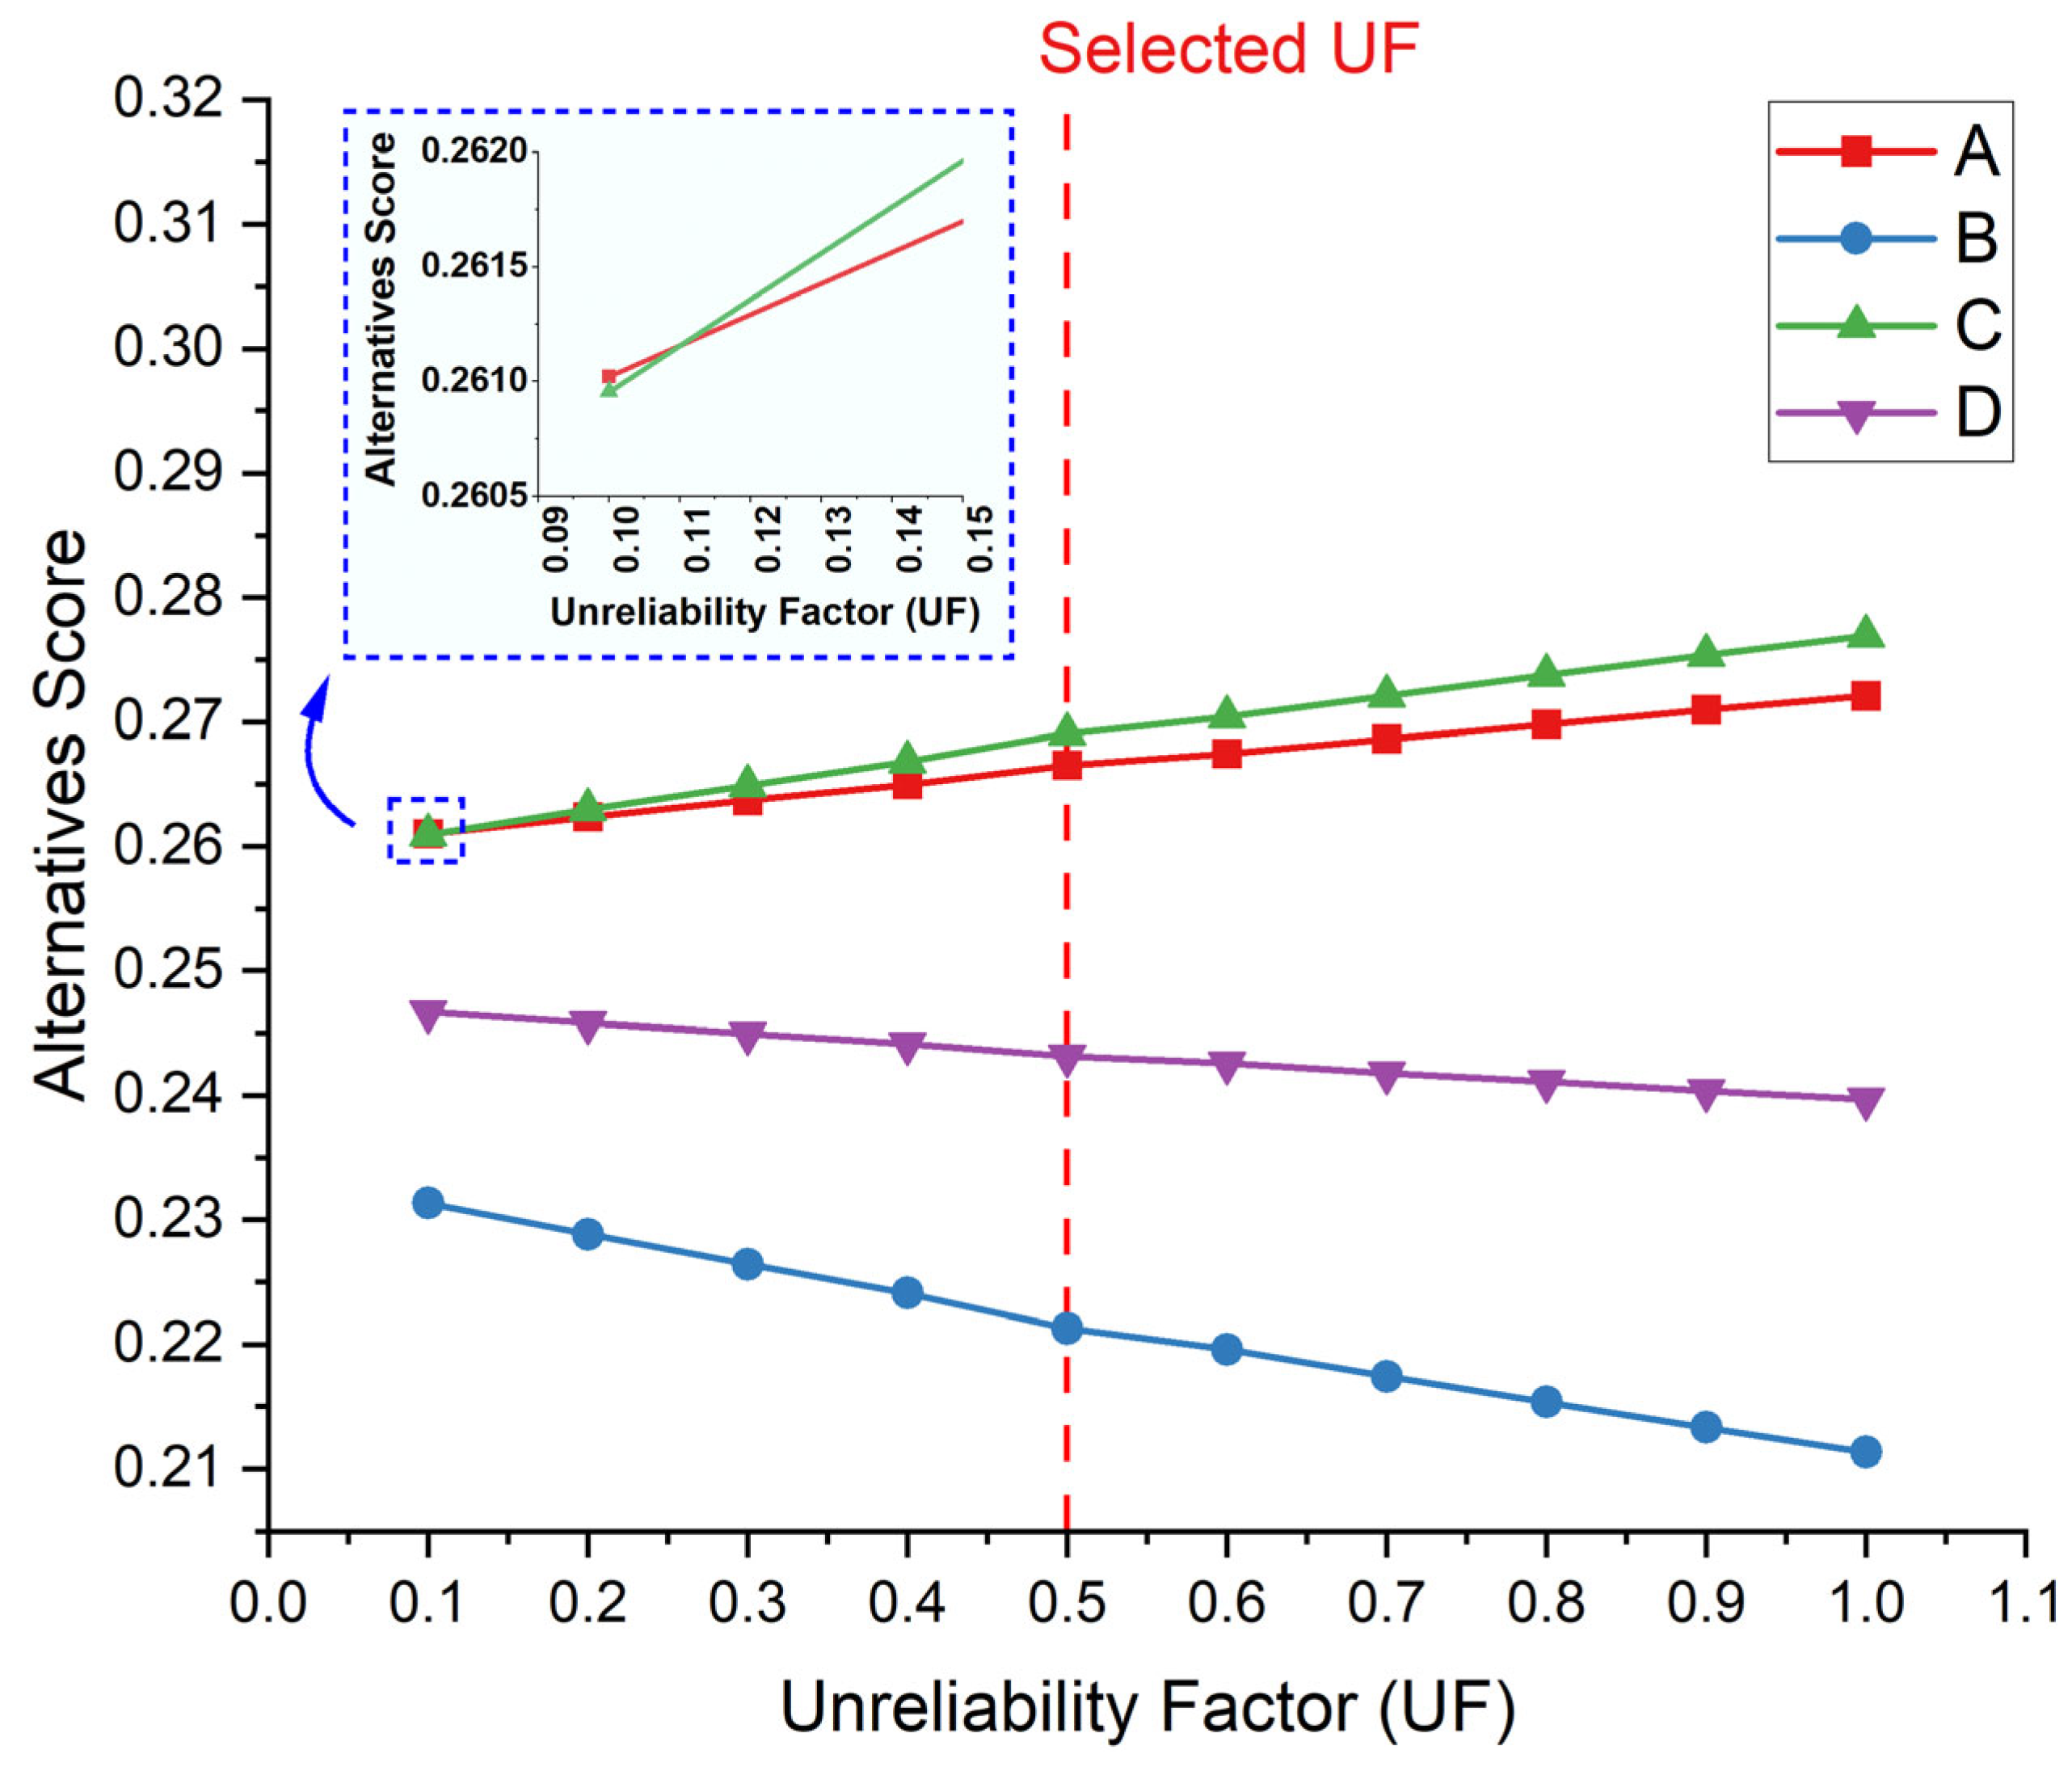
Figure 9.
Example of the sensitivity analysis results, identifying the required criteria weight changes for rank several in (a) the ANP model and (b) the AHP model; under alternative C.
Figure 9.
Example of the sensitivity analysis results, identifying the required criteria weight changes for rank several in (a) the ANP model and (b) the AHP model; under alternative C.
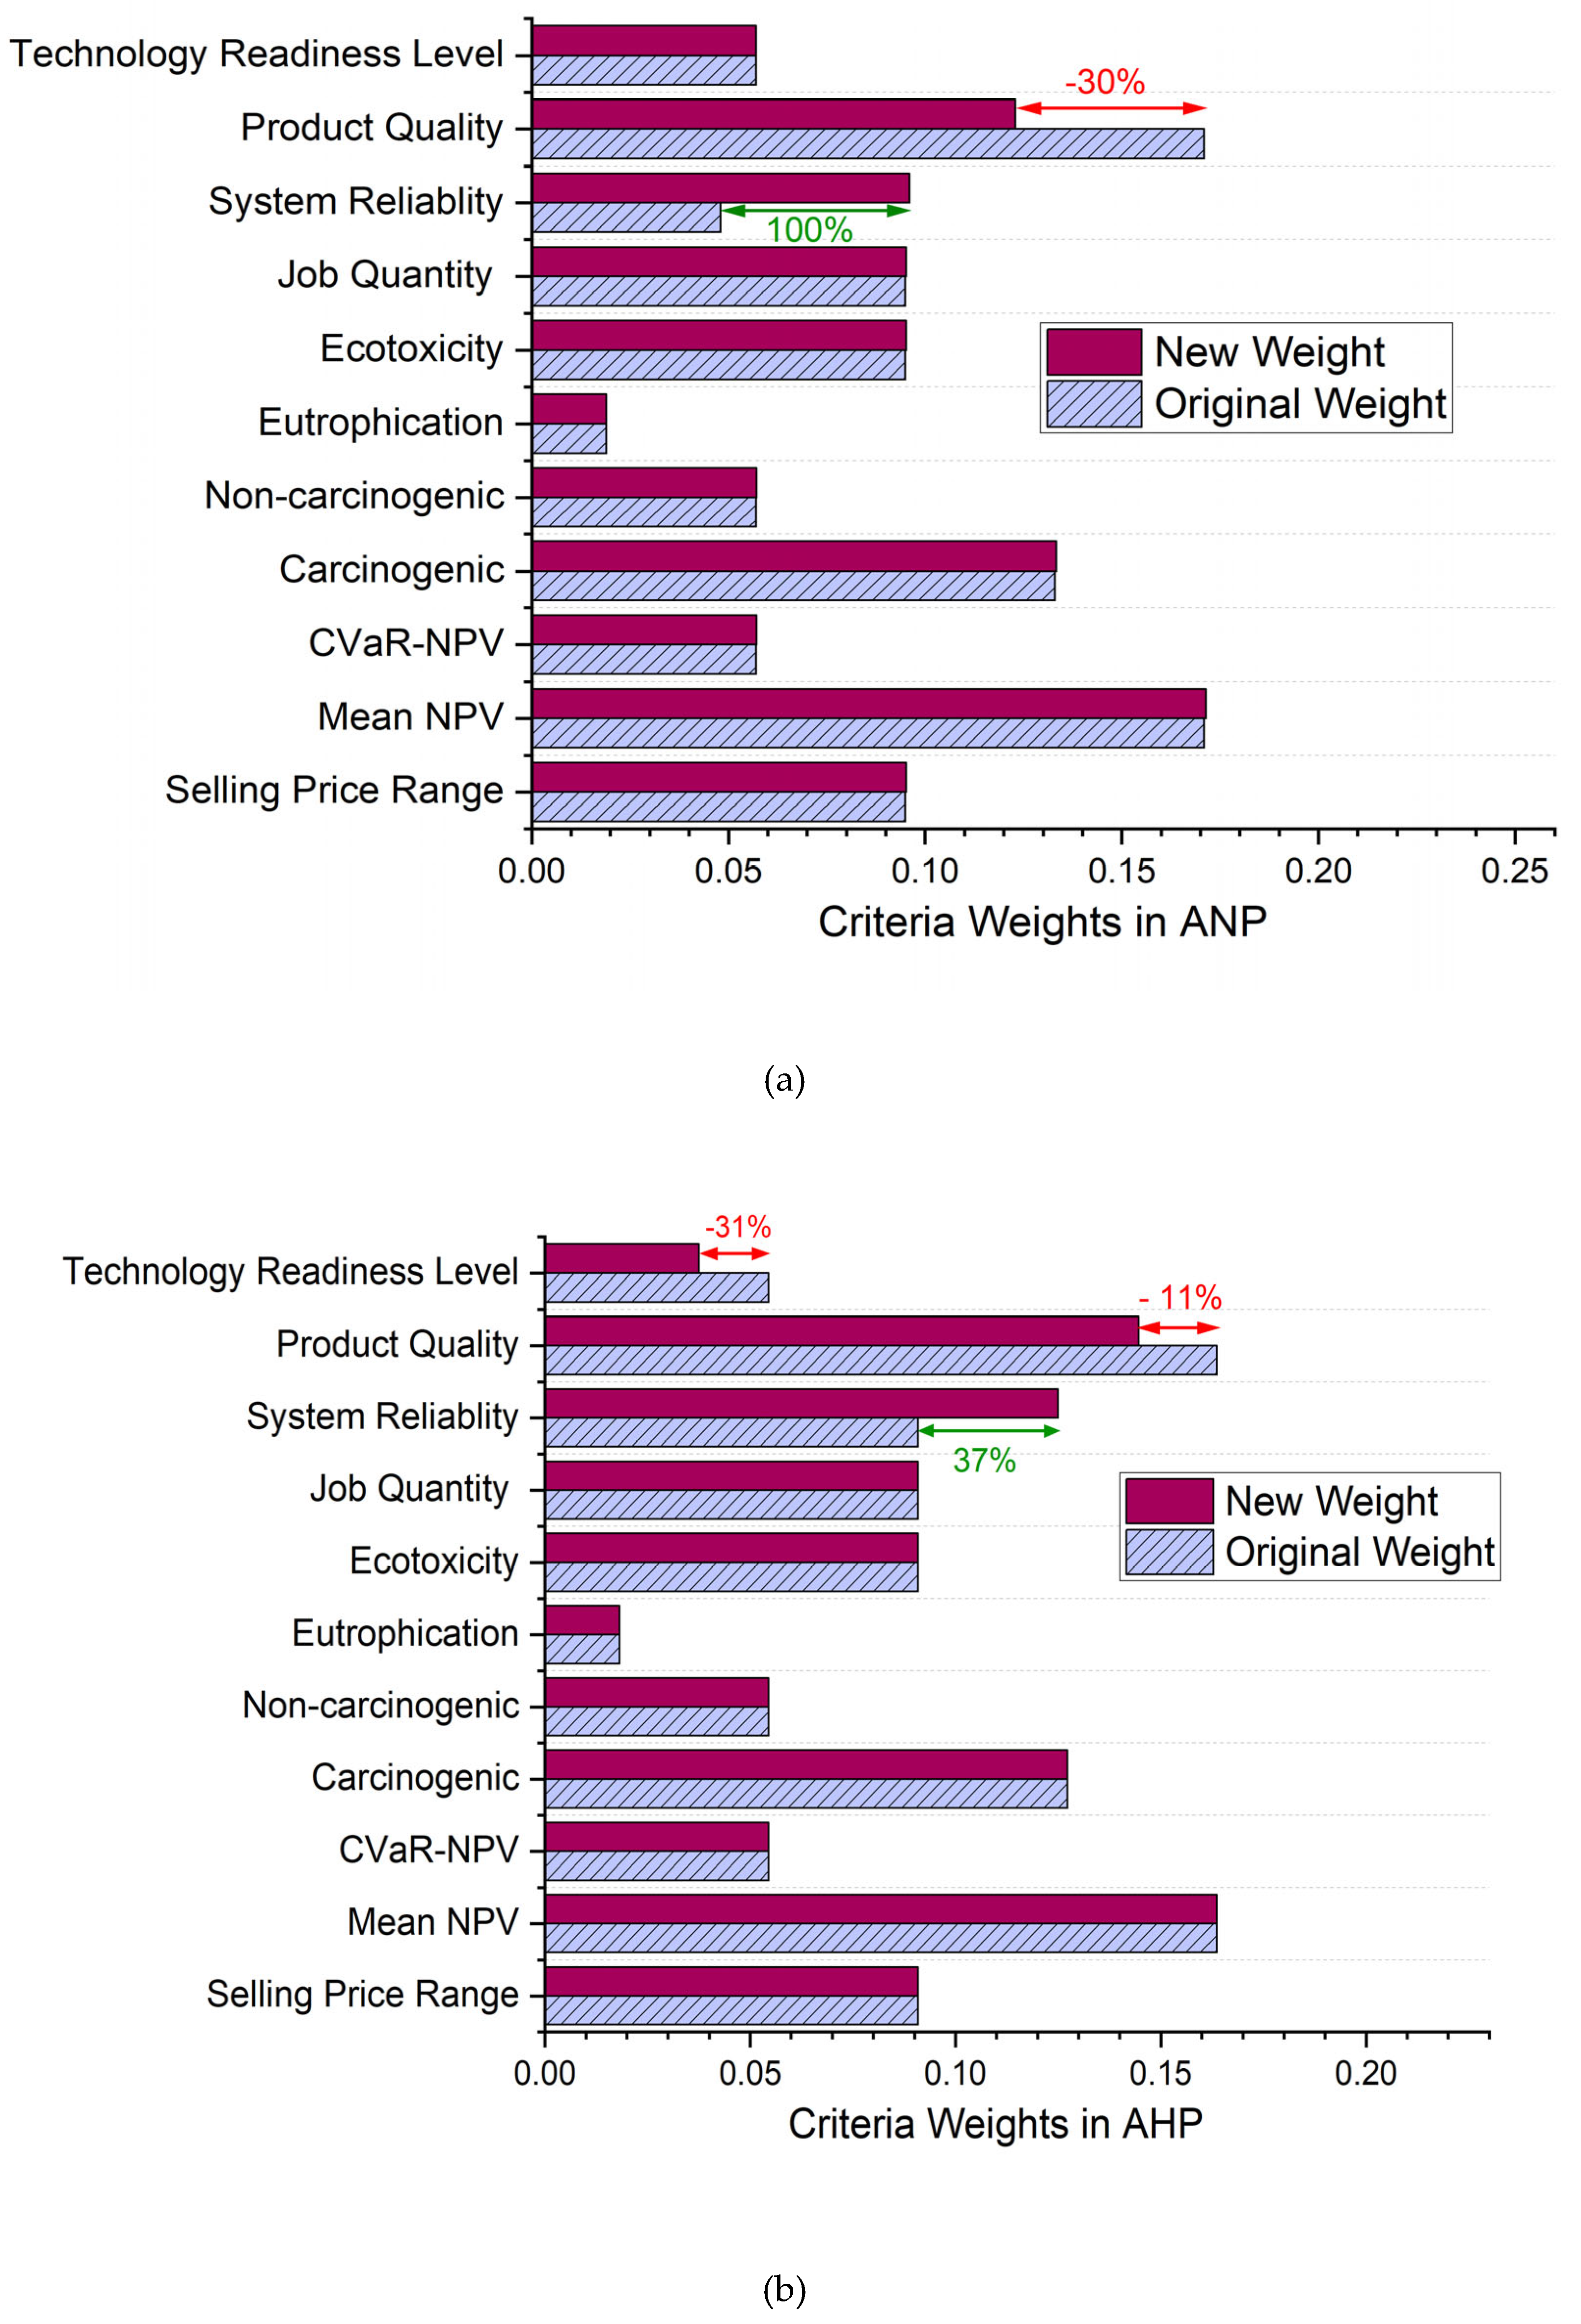
Table 1.
Parameter values for each baler and hammer mill type.
| Alternatives | Capacity | Efficiency |
Energy consumption (diesel/electricity) |
| Full-screen hammer mill | 3.5 (tonne/hour)1 | 90% [72] | 160 (KWh/tonne) [69] |
| Half-screen hammer mill | 1.5 (tonne/hour)1 | 70% [72] | 900 (KWh/tonne) [69] |
| Round baler | 7.2 (tonne/hour)1 | 50% [65] | 20 (liter/tonne)1 |
| Square baler | 37.5 (tonne/hour)1 | 65% [65] | 1 (liter/tonne)1 |
1Data is retrieved from industry experts or adjusted based on the daily productions.
Table 2.
The decision matrix with criteria values for the four selected SC alternatives.
| Metrics | A: Full-Round | B: Full-Square | C: Half-Round | D: Half-Square | Type of Criteria1 |
| Economic [60] | |||||
| Selling Price (SP) Range ($) (C1) | 5,531 | 4,604 | 5,948 | 4,990 | - (cost-like) |
| Mean Net Present Value (NPV) (Million $) (C2) | 61.65 | 53.96 | 65.28 | 57.25 | + (benefit) |
| Conditional Value at Risk (CVaR) - NPV (Million $) (C3) | -11.18 | -9.73 | -11.26 | -10.02 | + |
| Environmental [61] | |||||
| Carcinogenic Potential (CTUh) (C4) | 0.00076 | 0.00049 | 0.00084 | 0.00054 | - |
| Non-carcinogenic Potential (CTUh) (C5) | 0.015 | 0.0097 | 0.0175 | 0.01 | - |
| Eutrophication Potential (kg N eq) (C6) | 34.98 | 26.05 | 37.51 | 27.61 | - |
| Ecotoxicity Potential (CTUe) (C7) | 78,763 | 53,656 | 87,393 | 58,914 | - |
| Social [60] | |||||
| Job quantities (C8) | 13 | 3 | 14 | 4 | + |
| Technical (experts opinion) | |||||
| System reliability (C9) | High | Low | Medium | Very Low | + |
| Product (mechanical) quality expected (C10) | Medium | Very Low | High | Low | + |
| Technology Readiness Level (C11) | 4 | 6 | 4 | 7 | + |
1The effect (direction) of each sustainable SC parameter on the performance of SC is indicated with “+” or “-” sign. For instance, to ensure the sustainability of biocomposites upscale production, it would require a higher Mean NPV(C2+) and a lower Carcinogenic impact (C4-).
Table 3.
Saaty’s fundamental scale [91].
Table 3.
Saaty’s fundamental scale [91].
| Value | Definition | Explanation |
| 1 | Equal importance/contribution/relation | Two elements contribute equally |
| 3 | Weak importance/contribution/relation | Judgment slightly favors one activity over another |
| 5 | Strong importance/contribution/relation | Judgment strongly favors one activity over another |
| 7 | Very strong importance/contribution/relation | An activity is strongly favored, and its dominance demonstrated in practice |
| 9 | Extremely strong importance/contribution/relation | The evidence favoring one activity over another is of the highest possible order of affirmation |
Table 4.
The sets, parameters, and variables used in the mathematical model.
| Sets | Description |
|
|
Set of alternatives |
|
|
Set of criteria types |
| Parameters | Description |
| Weights of criteria under alternative or weight of criteria independent from alternative type (for ANP and AHP model respectively) | |
| Number of criteria or attributes used for the evaluation (e.g., sub-criteria of economic, environmental, social, and technical factors) | |
| Number of alternatives being evaluated (e.g., different supply chain configurations) | |
| Power of convergence of super matrix to build limit matrix in ANP | |
| Variables | Description |
| Negative deviations from the importance of criteria under alternative ; or deviations of criteria | |
| Positive deviations from the importance of criteria under alternative ; or deviations of criteria |
Table 5.
The normalized decision matrix (converted to benefit type).
| Criteria | Alternatives | Full-Round | Full-Square | Half-Round | Half-Square |
| Index | A | B | C | D | |
| Selling price range | C1 | 0.2359 | 0.2834 | 0.2193 | 0.2614 |
| Mean Net Present Value (NPV) | C2 | 0.2589 | 0.2266 | 0.2741 | 0.2401 |
| Conditional Value at Risk- NPV | C3 | 0.2348 | 0.2699 | 0.2332 | 0.2621 |
| Carcinogenic | C4 | 0.2056 | 0.3189 | 0.1860 | 0.2894 |
| Non-Carcinogenic | C5 | 0.2039 | 0.3154 | 0.1748 | 0.3059 |
| Eutrophication | C6 | 0.2202 | 0.2956 | 0.2053 | 0.2789 |
| Ecotoxicity | C7 | 0.2125 | 0.3119 | 0.1915 | 0.2841 |
| Job quantity | C8 | 0.3824 | 0.0882 | 0.4118 | 0.1176 |
| System reliability | C9 | 0.4375 | 0.0625 | 0.3125 | 0.1875 |
| Product quality | C10 | 0.3125 | 0.0625 | 0.4375 | 0.1875 |
| Technology readiness level | C11 | 0.1905 | 0.2857 | 0.1905 | 0.3333 |
Table 6.
Example of the normalized pair-wise comparison matrix for enablers under mean NPV.
| Mean Net Present Value (NPV) | Selling price range | CVaR-NPV | e-vector |
| Selling price range | 0.888 | 0.875 | 0.881 |
| Conditional Value at Risk (CVaR)-NPV | 0.111 | 0.125 | 0.118 |
Table 7.
(Weighted) supermatrix for the network of Figure 3 with feedback.
Table 7.
(Weighted) supermatrix for the network of Figure 3 with feedback.
| Definition |
|
|
|
|
|
|
|
|
|
|
|
A | B | C | D | |
| Selling price range |
|
0 | 0.441 | 0.441 | 0 | 0 | 0 | 0 | 0 | 0 | 0 | 0 | 0.099 | 0.095 | 0.095 | 0.099 |
| Mean NPV |
|
0.083 | 0 | 0.059 | 0 | 0 | 0 | 0 | 0 | 0 | 0 | 0 | 0.178 | 0.171 | 0.171 | 0.178 |
| CVaR-NPV |
|
0.416 | 0.059 | 0 | 0 | 0 | 0 | 0 | 0 | 0 | 0 | 0 | 0.059 | 0.057 | 0.057 | 0.059 |
| Carcinogenic |
|
0 | 0 | 0 | 0 | 0 | 0 | 0 | 0 | 0 | 0 | 0 | 0.139 | 0.133 | 0.133 | 0.139 |
| Non-Carcinogenic |
|
0 | 0 | 0 | 0 | 0 | 0 | 0 | 0 | 0 | 0 | 0 | 0.059 | 0.057 | 0.057 | 0.059 |
| Eutrophication |
|
0 | 0 | 0 | 0 | 0 | 0 | 0 | 0 | 0 | 0 | 0 | 0.020 | 0.019 | 0.019 | 0.020 |
| Ecotoxicity |
|
0 | 0 | 0 | 0 | 0 | 0 | 0 | 0 | 0 | 0 | 0 | 0.099 | 0.095 | 0.095 | 0.099 |
| Job quantity |
|
0 | 0 | 0 | 0 | 0 | 0 | 0 | 0 | 0 | 0 | 0 | 0.099 | 0.095 | 0.095 | 0.099 |
| System reliability |
|
0 | 0 | 0 | 0 | 0 | 0 | 0 | 0 | 0 | 0 | 0 | 0.099 | 0.048 | 0.048 | 0.099 |
| Product quality |
|
0 | 0 | 0 | 0 | 0 | 0 | 0 | 0 | 0 | 0 | 0 | 0.089 | 0.171 | 0.171 | 0.089 |
| TRL |
|
0 | 0 | 0 | 0 | 0 | 0 | 0 | 0 | 0 | 0 | 0 | 0.059 | 0.057 | 0.057 | 0.059 |
| Full-round | A | 0.118 | 0.129 | 0.117 | 0.206 | 0.204 | 0.220 | 0.212 | 0.382 | 0.438 | 0.313 | 0.190 | 0 | 0 | 0 | 0 |
| Full-square | B | 0.142 | 0.113 | 0.135 | 0.319 | 0.315 | 0.296 | 0.312 | 0.088 | 0.063 | 0.063 | 0.286 | 0 | 0 | 0 | 0 |
| Half-round | C | 0.110 | 0.137 | 0.117 | 0.186 | 0.175 | 0.205 | 0.192 | 0.412 | 0.313 | 0.438 | 0.190 | 0 | 0 | 0 | 0 |
| Half-square | D | 0.131 | 0.120 | 0.131 | 0.289 | 0.306 | 0.279 | 0.284 | 0.118 | 0.188 | 0.188 | 0.333 | 0 | 0 | 0 | 0 |
NPV: Net Present Value, CVaR: Conditional Value at Risk, TRL: Technology Readiness Level.
Table 8.
Limit matrix obtained for the network of Figure 3 with feedback.
Table 8.
Limit matrix obtained for the network of Figure 3 with feedback.
| Definition |
|
|
|
|
|
|
|
|
|
|
|
A | B | C | D | |
| Selling price range |
|
0.116 | 0.116 | 0.116 | 0.117 | 0.117 | 0.117 | 0.117 | 0.117 | 0.117 | 0.117 | 0.117 | 0.115 | 0.115 | 0.115 | 0.115 |
| Mean NPV |
|
0.074 | 0.074 | 0.074 | 0.074 | 0.074 | 0.074 | 0.074 | 0.074 | 0.074 | 0.074 | 0.074 | 0.094 | 0.094 | 0.094 | 0.094 |
| CVaR-NPV |
|
0.080 | 0.080 | 0.080 | 0.080 | 0.080 | 0.080 | 0.080 | 0.080 | 0.080 | 0.080 | 0.080 | 0.086 | 0.086 | 0.086 | 0.086 |
| Carcinogenic |
|
0.050 | 0.050 | 0.050 | 0.050 | 0.050 | 0.050 | 0.050 | 0.050 | 0.050 | 0.050 | 0.050 | 0.065 | 0.065 | 0.065 | 0.065 |
| Non-Carcinogenic |
|
0.022 | 0.022 | 0.022 | 0.022 | 0.022 | 0.022 | 0.022 | 0.022 | 0.022 | 0.022 | 0.022 | 0.028 | 0.028 | 0.028 | 0.028 |
| Eutrophication |
|
0.007 | 0.007 | 0.007 | 0.007 | 0.007 | 0.007 | 0.007 | 0.007 | 0.007 | 0.007 | 0.007 | 0.009 | 0.009 | 0.009 | 0.009 |
| Ecotoxicity |
|
0.036 | 0.036 | 0.036 | 0.036 | 0.036 | 0.036 | 0.036 | 0.036 | 0.036 | 0.036 | 0.036 | 0.047 | 0.047 | 0.047 | 0.047 |
| Job quantity |
|
0.036 | 0.036 | 0.036 | 0.036 | 0.036 | 0.036 | 0.036 | 0.036 | 0.036 | 0.036 | 0.036 | 0.047 | 0.047 | 0.047 | 0.047 |
| System reliability |
|
0.027 | 0.027 | 0.027 | 0.027 | 0.027 | 0.027 | 0.027 | 0.027 | 0.027 | 0.027 | 0.027 | 0.035 | 0.036 | 0.036 | 0.035 |
| Product quality |
|
0.048 | 0.048 | 0.048 | 0.048 | 0.048 | 0.048 | 0.048 | 0.048 | 0.048 | 0.048 | 0.048 | 0.062 | 0.062 | 0.062 | 0.062 |
| TRL |
|
0.024 | 0.024 | 0.024 | 0.022 | 0.022 | 0.022 | 0.022 | 0.022 | 0.022 | 0.022 | 0.022 | 0.028 | 0.028 | 0.028 | 0.028 |
| Full-round | A | 0.128 | 0.128 | 0.128 | 0.128 | 0.128 | 0.128 | 0.128 | 0.128 | 0.128 | 0.128 | 0.128 | 0.102 | 0.102 | 0.102 | 0.102 |
| Full-square | B | 0.099 | 0.099 | 0.099 | 0.099 | 0.099 | 0.099 | 0.099 | 0.099 | 0.099 | 0.099 | 0.099 | 0.086 | 0.086 | 0.086 | 0.086 |
| Half-round | C | 0.130 | 0.130 | 0.130 | 0.130 | 0.130 | 0.130 | 0.130 | 0.130 | 0.130 | 0.130 | 0.130 | 0.124 | 0.125 | 0.124 | 0.124 |
| Half-square | D | 0.117 | 0.117 | 0.117 | 0.117 | 0.117 | 0.117 | 0.117 | 0.117 | 0.117 | 0.117 | 0.117 | 0.094 | 0.094 | 0.094 | 0.094 |
NPV: Net Present Value, CVaR: Conditional Value at Risk, TRL: Technology Readiness Level.
Table 9.
Relative and global weights/scores in scenario 2 (without inner/outer dependence).
|
Criteria and Alts. |
|
|
|
|
|
|
|
|
|
|
|
Global weights | Ranking |
| Fixed Weights | 0.0909 | 0.1636 | 0.0545 | 0.1273 | 0.0545 | 0.0182 | 0.0909 | 0.0909 | 0.0909 | 0.1636 | 0.0545 | ||
| Alt. A | 0.2359 | 0.1847 | 0.2348 | 0.2056 | 0.2039 | 0.2202 | 0.2125 | 0.3824 | 0.4375 | 0.3125 | 0.1905 | 0.2733 | 2 |
| Alt. B | 0.2834 | 0.1888 | 0.2699 | 0.3189 | 0.3154 | 0.2956 | 0.3119 | 0.0882 | 0.0625 | 0.0625 | 0.2857 | 0.2086 | 4 |
| Alt. C | 0.2193 | 0.2689 | 0.2332 | 0.1860 | 0.1748 | 0.2053 | 0.1915 | 0.4118 | 0.4375 | 0.4375 | 0.1905 | 0.2797 | 1 |
| Alt. D | 0.2614 | 0.3576 | 0.2621 | 0.2894 | 0.3059 | 0.2789 | 0.2841 | 0.1176 | 0.1875 | 0.1875 | 0.3333 | 0.2384 | 3 |
Table 10.
Sensitivity analysis of criteria weight changes required to make an alternative the top-ranked option.
Table 10.
Sensitivity analysis of criteria weight changes required to make an alternative the top-ranked option.
| Criteria | ANP Model | AHP model | ||||
| Original | New |
|
Original | New |
|
|
| Selling Price Range | 0.095 | 0.095 | 0 | 0.090 | 0.090 | 0 |
| Mean NPV | 0.171 | 0.171 | 0 | 0.163 | 0.163 | 0 |
| CVaR-NPV | 0.057 | 0.057 | 0 | 0.054 | 0.054 | 0 |
| Carcinogenic | 0.133 | 0.133 | 0 | 0.127 | 0.127 | 0 |
| Non-carcinogenic | 0.057 | 0.057 | 0 | 0.054 | 0.054 | 0 |
| Eutrophication | 0.019 | 0.019 | 0 | 0.018 | 0.018 | 0 |
| Ecotoxicity | 0.095 | 0.095 | 0 | 0.090 | 0.090 | 0 |
| Job quantities | 0.095 | 0.095 | 0 | 0.090 | 0.090 | 0 |
| System reliability | 0.048 | 0.096 | +100 | 0.090 | 0.124 | +37.4 |
| Product quality | 0.171 | 0.123 | -30 | 0.163 | 0.144 | -11.61 |
| Technology Readiness Level | 0.057 | 0.057 | 0 | 0.054 | 0.037 | -31.16 |
| Alternatives scores | ||||||
| A (Full-round) | 0.273 | 0.267 | 0.273 | 0.278 | ||
| B (Full-square) | 0.208 | 0.222 | 0.208 | 0.204 | ||
| C (Half-round) | 0.279 | 0.266 | 0.279 | 0.278 | ||
| D (Half-square) | 0.238 | 0.243 | 0.238 | 0.235 | ||
Disclaimer/Publisher’s Note: The statements, opinions and data contained in all publications are solely those of the individual author(s) and contributor(s) and not of MDPI and/or the editor(s). MDPI and/or the editor(s) disclaim responsibility for any injury to people or property resulting from any ideas, methods, instructions or products referred to in the content. |
© 2025 by the authors. Licensee MDPI, Basel, Switzerland. This article is an open access article distributed under the terms and conditions of the Creative Commons Attribution (CC BY) license (http://creativecommons.org/licenses/by/4.0/).
Copyright: This open access article is published under a Creative Commons CC BY 4.0 license, which permit the free download, distribution, and reuse, provided that the author and preprint are cited in any reuse.


