
Submitted:
13 June 2025
Posted:
16 June 2025
You are already at the latest version
Abstract
Mechanised agricultural operations are often performed individually, under minimal supervision and across a wide range of unfavourable working conditions, resulting in a complex mixture of hazards and external stressors that severely affect safety conditions. Socio-technical and environmental constraints utterly affect safety culture and require continuous performance adjustments to overcome timing pressures, resource limita-tions, and unstable weather conditions.
This study introduces a FRAM-based safety-culture model that embeds the thorough-ness-efficiency trade-off (ETTO) in four distinct operational modes that adhere to spe-cific safety cultures, namely thoroughness, risk awareness, compliance and efficiency. The model has been instantiated for mechanised ploughing: foreground task functions were coupled with background functions that represent socio-technical constraints and environmental variability, while severity classes for potential incidents were derived from US OSHA accident database. The framework was also supported by a semi-quantitative resonance index based on severity and coupling strength, the Total Resonance Index (TRI) to assess how variability propagates in foreground functions and to identify hot-spot functions where small adjustments can escalate into high resonance and hazardous conditions.
Results showed that the negative effects on functional resonance generated by safety detriment on TRI observed between compliance and effective working modes was three times larger than the drift between risk awareness and compliance, demonstrating that efficiency comes with a way higher cost than keeping safety at compliance levels. Ex-tending the proposed approach with quantitative assessments could further support the management of socio-technical and environmental drivers in mechanised farming, strengthening the role of safety as a competitive asset for enhancing resilience and service quality.
Keywords:
FRAM
; agriculture
; risk assessment
; tractor rollover
; human factors
; safety culture
; RMF
1. Introduction
Operational safety in agricultural mechanised tasks is traditionally characterised by low supervision, adaptation to field conditions and flexibility to meet a wide variety of work organisation models [1]. This scenario often leads to compliance-based approaches that can easily generate latent hazardous conditions derived by external sources of pressure, both from the environment and from socio-technical constraints [2]. The analysis of such tasks, given the high variability of how they are performed and the large number of factors affecting them, demand a more systemic perspective to avoid labelling most of the accidents as generated by human error [3] or by lack of compliance to safety regulations. In these contexts, in fact, safety culture [4] does not stem from formal oversight but emerges from the interaction between socio-technical and environmental constraints such as weather conditions, seasonality, market demands, labour force availability etc. These background conditions continuously influence the operator’s behaviour, leading to little performance adjustments that are necessary to complete the tasks and fulfil productivity’s goals under pressure. Within these boundaries, safety culture then emerges as a product of collective behaviours, attitudes and competencies of the operators, which shape how safety is understood, prioritized, and maintained in organizations [5,6]. Rasmussen’s Risk Management Framework (RMF) [7] offers a powerful lens for understanding and evaluating safety culture, especially in dynamic, high-risk systems. RMF suggests that every organization operates within bounded spaces defined by safety limits, economic constraints, and workload or performance limits. People adaptively move within this space, often without explicit awareness of how close they are to danger. Safety culture is reflected in how these adaptations are made. To prevent drift and reinforce norms, the RMF emphasizes the need for real-time feedback and learning mechanisms from near-misses.
The adaptive navigation within constrained boundaries, as described by Rasmussen, closely aligns with the logic of the so-called the efficiency–thoroughness trade-off (ETTO) [8], which describes a work model in which operators must constantly balance the demand for efficiency with the need for thoroughness in order to perform tasks in a safe way. As proposed by Hollnagel [9,10,11], this trade-off is an intrinsic part of complex, not tractable with reliability models, work systems and contributes to the safety detriment that happens when operations drift away from ideal conditions. The same author illustrates this concept by common work practice that steadily run into latent accident conditions [12,13] in which just even a little mistake can result in accidents:
- routine checks that are skipped because they look like a waste of time if the system is reliable;
- practices that become standard only because they have always done in the same way even if they are dangerous;
- double standards, in which workers know how to carry out an activity, but they also know that, for the organisation, efficiency comes first;
- believing that, as always, verifications have been done before by others and there is no need to check again;
- overlooking of issues, that despite having possible severe consequences, are considered as not important because workers got used to them.
With such shortcuts, considering the supervision in agricultural contexts is often minimal, also limited communication can represent a challenge in delivering safety information and stressors just accumulate. The result mechanised operation made of tight tasks that only allow local small adjustments, with cumulative effects that may exceed the resilience threshold of the whole system and result in incidents.
Such examples, in the past, lead to assess most of accidents as human errors, but especially in agricultural contexts a lack of understanding and information on how accidents have happened was often present [3]. This tendency, however, did not take into account the other side of failure which is success: if all the accidents are due to human errors, then many operations are hazardous and succeed only due to human intervention. To better analyse such contexts, researchers started to look at the bigger picture including safety cultures, finding that background constraints play a key role in increasing the chances for workers to fail and by creating “tight couplings” among activities that leave little or no space for operators to mitigate risks or to perform corrective actions. But nevertheless, even a wider approach that looked at safety culture had its limits and biases: most of accident analyses started to be assessed as generated by culture [14,15,16], simply switching to that from human variability and yet remaining in a model in which accident are due to simple cause-effect dynamics rather than to a mixture of effects that, after being latent for some time, all had their share of responsibility.
To incorporate these dynamics in a risk assessment model, a FRAM-based approach (Functional Resonance Analysis Method) was adopted and a framework structured around four instantiations has been defined, describing the most important working modes: Thoroughness, risk Awareness, Compliance, and Efficiency—collectively referred to, from now on, as the TACE cycle. These modes have been considered to adhere with the ETTO principle and to include two intermediate steps which are the risk awareness, understood here as a key factor in Rasmussen’s RMF, where it governs how individuals perceive their proximity to operational boundaries and proactively influences whether their adaptive behaviour maintains or undermines safety over time, and compliance (which, in British occupational health and safety approaches, could be defined as “as low as reasonably possible” – ALARP – to indicate a cost-benefit approach to reduce risks without affecting competitiveness). Each stage of the TACE cycle reflects a distinct behavioural mode, with increasing tendency to accept variability and reduce safety margins in favour of productivity [17].
The proposed framework was applied to investigate roll-over risks, which is one of the most frequent hazards according Occupational Safety and Health Administration (OSHA) of the United States of America and from precedent research works [18], [19,20,21,22], together with mechanised ploughing operations that instead is a task with a fairly big variety of external stressors that require continuous adjustments in operations.
The resulting analysis allowed for the identification of operational hot spots in which small upstream deviations, if not properly dampened, can escalate into hazardous conditions. The introduction of targeted dampening actions, such as enforced preconditions that must be fulfilled before starting certain operations, is proposed as a low-cost, resilience-oriented countermeasure that strengthens safety culture and operational stability without compromising efficiency.
2. Materials and Methods
The aim of the methodology employed in this research was to explore how different operational modes, driven by external stressors and internal behavioural adjustments, influence functional coupling and the emergence of risk. This approach combines both safety culture factors and safety assessments into an index for ease of use [23]. Ploughing activities were selected as a representative mechanised task due to their exposure to field variability, minimal supervision, and frequent background disturbances.
To support the analysis, four FRAM instantiations were defined, corresponding to distinct safety culture modes, and used to describe how safety detriment evolves over time as critical stressors accumulate. The analysis of functional couplings within these scenarios allowed for the identification of resonance hot spots, to which a semi-quantitative index was assigned based on incident severity [24], internal variability estimations and coupling impact. While variability estimations have been assessed through a scale of values based on expected effects on the function, severity values were instead derived from OSHA real-world fatality reports, The overall quantification was consequently be based on internal variability and external sources of resonance, resulting the identification of dampening solutions to reduce risks, exploring this way any possible mitigation effects and adjustments.
Each methodological step is described in the following subsections, specifying both FRAM analysis and the quantification of its outcomes. It is worth saying that the method aims not only to identify risk conditions, but also to identify how safety deteriorates in response to external constraints: this is why the workflow includes safety cultures as instantiations and the evaluation of mitigation strategies.
2.1. Integration of Safety Cultures and Safety Detriment in Resonance Analysis
The methodology adopted in this study combines a FRAM functional modelling approach with a behavioural drift framework derived from the efficiency–thoroughness trade-off, with the purpose of investigating the most common working modes and safety cultures at once. The objective is to model how background stressors shape operator behaviour and functional variability in mechanised agricultural work, and to evaluate the effects of this variability on the potential for hazardous outcomes.
Ploughing was selected as a representative task due to its exposure to variable terrain, weather constraints, and the prevalence of solo operation. These factors make it well suited to the study of safety culture and variability under real-world conditions.
To characterise behavioural drift, four distinct instantiations of the model were constructed, corresponding to the four modes of operation defined by the TACE. The cycle represents working modes that reflect how safety and productivity are balanced in practice. Each mode implies behavioural orientation to variability, particularly under socio-technical and environmental pressures. The cycle can be seen as a continuum or drift from maximum thoroughness to maximum efficiency, shaped by external constraints and internal adjustments. Given the importance of taxonomy of socio-technical variables in FRAM [25], the four instantiations of the cycle can be defined according the “migration toward the boundary” process described by Rasmussen as follows:
- Thoroughness, which prioritises accuracy and control, where functions are executed with full attention to procedures, safety checks, and environment;
- Risk Awareness, in which an organisation is aware that a proactive approach is required but settles to reasonably achievable standards. It represents a flexible balance between thoroughness and feasibility, where operators still aim to reduce risk as much as possible, but begin to consider workload, time constraints [26], and operational demands;
- Compliance, in which the focus shifts to meeting minimum legal requirements. Safety is maintained to comply with regulations and functions omit non-mandatory checks or redundancy measures. Formally acceptable, this working mode still has vulnerabilities especially to hidden sources of external variability;
- Efficiency, that reflects a performance-oriented working mode where productivity and task completion often override safety considerations. Performance adjustments become aggressive and safety checks can be bypassed as risks become normalised like part of the job. Efficiency operations often emerge under high pressure and are susceptible to functional resonance, especially when background stressors are largely present.
Each mode is meant to reflect, in addition, different safety cultures that often generate a given number and type of hazardous patterns [27,28], behaviours [29], performance variability and resonance propagation. A drift can indeed happen from one to another, and this can be analysed to understand the reasons and the effects behind it: given that external stressors and sources of variability play a key role in the change of culture, a set of possible drifts among instantiations is represented in Table 1.
2.2. Severity Assessment
Apart from defining methods to assess the chances for incidents to happen or to assess hazard priority [31], their severity also needs to be estimated in order to produce an index of resonance. For this purpose, data from the OSHA database has been exploited, focusing on fatal tractor-related accidents relevant to turning, travelling, and field operations.
Severity values were assigned using a 5-level scale (minor, moderate, serious, severe, fatal), derived by reviewing OSHA case reports relevant to tractor overturns, field accidents, and manoeuvring incidents. Each case was categorised according to injury outcome and context and mapped to a numerical score from 1 to 5, as shown in Table 2.
2.3. Variability Propagation, Hot Spots and Resonance Index
In order to provide semi-quantitative assessments for each instantiation, a resonance index (RI) was introduced to estimate the variability associated with each function. While previous approaches focused mainly on timing-related variability, the present analysis extends the coupling impact framework to include deviations in resource availability and precondition fulfilment, in line with the original FRAM formulation. Each input to a function was characterised not only by its timing, but also by the degree to which required resources were available, preconditions were verified, and controls were in place: giving an impact value (I) to each parameter a composite impact score can be obtained. The equation for calculating function resonance index (RIf) can be described as follows:
The impact values used in (1) are meant to represent the likelihood in terms of resonance and can represent both an increase of it and dampening effects. Values have then been estimated for each scenario, since the generation of random occurrences with Monte Carlo simulations [32] was unfeasible. Consequently, adjusted for each TACE mode to reflect different behavioural tendencies: for instance, the Efficiency mode was associated with a higher probability of early or omitted inputs, while the Thoroughness mode favoured on-time performance with low deviation likelihood. These values span between 0.85 and 1.50, which represent minimum (dampening) and maximum (high resonance) variability, as shown in Table 3.
It is worth explaining that the values that express variability are not arbitrary: they are meant to keep in account no variability for tasks carried out in the proper way and to make sure that:
- maximum values for internal variability (I=5.06) would have the same weight of maximum severity (S=5);
- standard internal variability functions (I=1.00) would have the same weight of minor severity events (S=1);
- a minor severity event (S=1), with maximum internal variability (I=5.06), would be weighted slightly more than a fatal event (S=5) with standard internal variability (I=1.00);
- a moderate severity event (S=2) with some internal resonance variability (I=1.495), would be evaluated as equivalent to serious event (S=3) with standard internal variability (I=1.00);
- events that have the smallest possible internal variability (plenty of time and resources, full control and double-checked preconditions) would result in halving (I=0.52) the RI of the same function under standard conditions (I=1.00).
A map of the possible values for RI, according to variability indices and severity values, is shown in Figure 1.
After computing local resonance indices (RI) for each function, a propagation analysis was conducted by mapping inter-functional couplings and assigning weighted coefficients to each output-input link. For each coupling, the originating function’s RI was computed together with its other sources of propagation, like other background functions or foreground functions. This way, cumulative effects were analysed across the functional network to identify nodes particularly sensitive to upstream resonance, even in the absence of high local RI. This approach allowed the identification of both resonance origins and propagation amplifiers in a Total Resonance Index (TRI), which has been computed by combining intrinsic variability (local RIi) propagated resonance received from upstream functions (RIj) and the weight of background functions (Wk).
For each foreground function, propagated resonance was computed as the sum of the resonance indices (RI) from upstream foreground functions, without applying additional weights, as the intrinsic variability of each function already incorporates amplification effects. Weights for background functions have been assessed based on their occurrences as key factors in accident analysis, with values that correspond to 1.0 for variables that have no occurrences and 1.5 for those with the maximum share among accident scenarios; other cases will be determined based on such two limits according to the following formula (3).
This approach enabled the identification of functions that may not initially present high risk but are exposed to significant amplification due to systemic coupling or, instead, be safer due to the effects of dampening couplings. The computation of these indices has been consequently performed for each TACE scenario, allowing a comparative evaluation of variability amplification across different safety culture modes. As a result, functions exhibiting high resonance indices were considered hot spots, indicating areas of the process where small performance adjustments, driven by background factors, could escalate into hazardous outcomes. The combination of TACE-driven behavioural modes with FRAM coupling analysis and severity data produced a structured analytical workflow that has been implemented to identify and quantify critical points of resonance across the operational task. The overall analytical framework, including the modelling steps, severity integration, scenario definition, and identification of variability hot spots, is summarised in the flowchart shown in Figure 2.
The FRAM model was developed by identifying foreground functions related to core operational phases of the selected farming mechanised activity (e.g., tractor setup, travel to field, turning, ploughing) and background functions reflecting socio-technical and environmental stressors (e.g., soil conditions, weather instability, maintenance status, operator fatigue, time pressure, and equipment availability). These background functions were modelled as either resources or preconditions, depending on their role in enabling or constraining each operational step.
To assess the mitigation potential of dampening actions, the model also introduces precise actions in selected high-risk functions. These adjustments were simulated by reducing the associated coupling impact values, thereby limiting variability propagation and interrupting potential drift patterns. This methodological framework enables both a qualitative exploration of how safety culture affects performance variability and a semi-quantitative evaluation of risk dynamics across different operational modes.
3. Results
The first step of the analysis involved severity assessments and analyses from OSHA accident database [33]. This kind of activity was necessary to both understand fatality rates for tractor overturning hazards and other parameters that have affected the outcome of the accident of that took part in originating it. The database reported 44 cases of roll-over incidents in agriculture and data is summarised in Table 4.
Summary showed that more than one third of the accidents involving farming machinery had overturning as outcome. In most cases (68%) the accident was also fatal for the worker; most of times there was only one person involved, and the age of the tractor driver spans between 23 and 72 years old, with a homogeneous distribution in the classes younger than 40, older than 60 and between 40 and 60. Accident reports, despite being very short in many cases, reported vital information to understand which external sources of variability were present: in most cases, terrain conditions or road surface conditions proved to be a critical issue but load, weather and mechanical failures also had their share among accident causes.
The next step involved the assessment of how a transition from one safety culture to another would have affected field operations. These trade-offs affect the four selected TACE scenarios in both foreground and background functions, highlighting the risks related to resonance amplifications among functions. In the case study of ploughing under delivery time pressure or bad weather/soil conditions, background functions’ influence significantly degraded the operational safety of the foreground functions that characterise farming operations and their resilience [34], making them virtually more fragile and less able to adapt to further changes. A definition of the simplest ploughing activity can be described as a set of foreground functions that start from machinery setup, continues route to the field and starts its tasks; a set of turnings and furrow-side ploughing tasks will be performed until the tractor gests back to warehouse. In this process, a set of background functions will influence it, and they can be listed as:
- Environmental stressors and constraints;
- Socio-technical variables, such as need of maintenance, trained personnel, company constraints;
- Task-related variables related to the activities required to keep the process run smoothly, which can be considered as embedded skills of tractor drivers, such as control tractor’s path and speed while ploughing.
These background functions can have different impacts and variability toward foreground functions, given the way that they are taken into account while working. An overview of the effects of such trade-offs on background functions is shown in Table 5.
After defining how safety cultures affected the background function, foreground functions have been defined to complete the static step of the FRAM model which includes the breakdown of the six variables (input, output, control, preconditions, resources and time) related to each function. It must be remembered that not every function requires variability from each of them, but an input must be stated for each function after the first one in temporal order. The full FRAM model instantiation used in this analysis is shown in Figure 3. It includes all foreground functions, background conditions, and their couplings, with key variables expressed as labels next to the links between functions they refer to. This structure provides the basis for identifying functional variability and assessing how it propagates across different operational scenarios.
A detailed representation of the background and foreground functions is reported in Table 6, a step that was necessary to establish the relationships between them.
The definition of the internal variability on foreground functions has highlighted the effects generated of a wide number of dependencies from environmental or field-related background functions, which is already a hint on how resonance could propagate even in presence of dampening effects. Authors kept the analysis of such links to a simple description, as a “stop rule” for the whole FRAM model; the same standard has been followed previously for background function description as well (bad weather has not been further divided into, i.e., storm or snow) because it would have been difficult to precisely count these specific conditions from accident reports.
In order to assess how functional variability accumulates throughout the process and propagates among functions under different operational attitudes, the variables shown in the breakdown of FRAM functions needed to be assessed for potential resonance.
Table 7 shows the resonance analysis performed on functional couplings, illustrating how variability propagates between pairs of foreground functions under each scenario of the TACE cycle.
Combining severity, weights from background functions (W) and computed aggregated variability coming from upstream functions, TRI values can be obtained for foreground functions. Results are shown in Table 9.
Data shown in Table 9 confirmed a progressive increase in systemic variability from across the TACE scenarios. This trend is especially pronounced in operational functions, that emerge as resonance hotspots across all scenarios. To better understand how each function’s resonance evolved across the four scenarios, Figure 4 displays the TRI values for all functions across the four scenarios.
The trajectories highlight that certain activities are structurally more vulnerable to shifts in organisational priorities and can result in generating higher resonance to the whole process. Tasks related to tractor coupling, for example, despite being less influenced by environmental stressors or field conditions but also being the most influenced by socio-technical variability, were more responsible of resonance compared to other functions except ploughing activities in the efficiency scenario. Given such differences, it is worth showing also the variation of TRI for couplings in the three drifts from Thoroughness to Risk Awareness, from Risk Awareness to Compliance and from Compliance to Efficiency.
Variations shown in Table 10 demonstrate that there is a significant increase of resonance in switching from compliance to efficiency, which is more than 3 times the effect shown in the drift from Risk Awareness to compliance and nearly the 3 times more the change in variability between thoroughness and Risk Awareness working modes. Such changes were also common to all the functions in which couplings played a role in resonance propagation, reaching an even higher increase of TRI.
4. Discussion
The findings of this study highlight the central role of socio-technical and environmental variability in shaping operational safety even during mechanised agricultural tasks, which are commonly characterised by low resonance propagation and a reduced number of workers in the field at the same time. The integration of FRAM allowed to quantify, even if in terms of indices, the impact of background functions as amplifiers of resonance and the effects of safety cultures in safety detriment. Sinche changes in safety culture were observed as the TRI values escalated along resonating functions, the proposed framework might be extended to create an early-warning indicator, enabling timely managerial interventions and facilitating continuous improvement.
The analysis of TACE scenarios showed a non-linear, but steady, increase in the Total Resonance Index as the working modes drifted from thoroughness to efficiency. A particular effect has been observed in the drift from compliance to efficiency, which was also confirmed by the lower degree of total resonance variation between thoroughness and risk awareness and then the compliance-oriented mode; these effects also show how and when preventive resources should be concentrated. Results reflect, generally speaking, a pattern consistent with the RMF where safety boundaries are approached gradually and often unknowingly as performance pressures increase and risk awareness diminishes. Once these boundaries are approached, further improvements in safety become increasingly difficult to achieve, as they would require disproportionate investments to mitigate hypothetical scenarios that are unlikely to manifest within the typical operational life of agricultural machinery.
Another finding is that the performance-oriented operational modes, often prioritising productivity, incur a disproportionately high safety cost. Moreover, the inclusion in the model of background functions, such as soil conditions, weather constraints, time pressure, and availability of skilled personnel, highlighted how latent coupling effects can lead to systemic vulnerabilities that would affect any working mode scenario. These effects, being often not accounted in safety analyses, would remain invisible to most assessments and become latent causes of accidents.
Ease of use, possibility of assessing severity from accident reports and the possibility of assessing resonance propagation through an index are certainly key features of the proposed methodology. On the other hand, it is still a model that would apply to simple instantiations or in processes that can be simplified by rigid stop-rules, to prevent abnormal resonance assessments. Another limitation is given by the oversimplification of certain inputs by fuzzy logic, but additional intermediate values could overcome this issue. Lastly, the exclusive reliance on OSHA reports may limit the results to similar agricultural systems or organisational standards.
5. Conclusions
The proposed model suggests a competitive safety approach as a strategy to show how the so called efficiency wouldn’t sufficiently justify the costs that come from safety detriment and deliberate drift to safety cultures that put productivity first: the concept of compliance is confirmed not to be just a bureaucratic step to perform, but instead a necessary barrier to limit potential losses and eventually switch to proactive safety cultures through dampening functions and anticipatory measures. Solutions like enforced preconditions, targeted operational pauses, and decoupling of hazardous background function from vital foreground functions greatly improve the stability of the workflow, while maintaining high levels of performance.
The introduction of the Total Resonance Index (TRI) allows to better evaluate couplings involving socio-technical background functions under different working modes, presenting the vulnerabilities that are generated by transitions towards more efficient working modes scarifying safety.
Future research could investigate also the effects of other background functions that, instead, can provide dampening effects in real-time, detecting hazardous drifts and increasing the chances to generate dampening effects on resonance or on internal variability. Possible tests could also be run by passing the information about the increase of resonance to tractor drivers as they work, since it might generate a positive response in limiting further negative adjustments.
Author Contributions
Conceptualization, P.R. and F.C.; methodology, P.R.; software, P.R.; validation, F.C. and M.C.; formal analysis, M.C.; investigation, P.R. and F.C.; resources, P.R. and F.C.; data curation, P.R.; writing—original draft preparation, P.R.; writing—review and editing, P.R. and F.C.; visualization, M.C.; supervision, M.C.; project administration, M.C. All authors have read and agreed to the published version of the manuscript.
Funding
this research received no external funding.
Institutional Review Board Statement
not applicable.
Informed Consent Statement
not applicable.
Data Availability Statement
data and accident reports are available on request.
Acknowledgments
this research is part of the activities included in “Rome Technopole” Project (ECS 0000024), which is part of the Next Generation EU programme, Italian’s “Piano Nazionale di Ripresa e Resilienza (PNRR)”, mission 4, component 2, investment no. 1.5.
Conflicts of Interest
the authors declare no conflicts of interest.
Abbreviations
The following abbreviations are used in this manuscript:
| OSHA | Occupational Safety and Health Administration (United States of America) |
| TACE | Thoroughness-risk Awareness-Compliance-Efficiency |
| FRAM | Functional Resonance Analysis Method |
| ETTO | Efficiency Thoroughness Trade-Off |
| TRI | Total Resonance Index |
References
- D. Gattamelata, L. Vita, and M. Fargnoli, “Machinery safety and ergonomics: A case study research to augment agricultural tracklaying tractors’ safety and usability,” Int J Environ Res Public Health, vol. 18, no. 16, 2021. [CrossRef]
- C. L. Beseler and R. H. Rautiainen, “Lack of Agreement between Safety Priorities and Practices in Agricultural Operators: A Challenge for Injury Prevention,” Safety, vol. 8, no. 2, 2022. [CrossRef]
- M. Fargnoli, M. Lombardi, N. Haber, and D. Puri, “The impact of human error in the use of agricultural tractors: A case study research in vineyard cultivation in Italy,” Agriculture (Switzerland), vol. 8, no. 6, 2018. [CrossRef]
- J. C. Le Coze, “How safety culture can make us think,” Saf Sci, vol. 118, no. December 2018, pp. 221–229, 2019. [CrossRef]
- Advisory Committee on the Safety of Nuclear Installations (ACSNI) - Health and Safety Commission - London (United Kingdom), ACSNI study group on human factors. HM Stationery Office, 1993. Accessed: May 29, 2025. [Online]. Available: https://inis.iaea.org/records/fkshz-6mg06.
- M. D. Cooper Ph.D., “Towards a model of safety culture,” Saf Sci, vol. 36, no. 2, pp. 111–136, 2000. [CrossRef]
- J. Rasmussen, “Risk management in a dynamic society: a modelling problem,” Saf Sci, vol. 27, no. 2, pp. 183–213, 1997. [CrossRef]
- E. Hollnagel, The ETTO principle: Efficiency-thoroughness trade-off: Why things that go right sometimes go wrong. 2009.
- E. Hollnagel, “FRAM: The functional resonance analysis method: Modelling complex socio-technical systems,” FRAM: The Functional Resonance Analysis Method: Modelling Complex Socio-technical Systems, pp. 1–142, 2012. [CrossRef]
- E. Hollnagel, Safety-II in Practice: Developing the Resilience Potentials (1st ed.), 2017 . [CrossRef]
- E. Hollnagel, “Safety-I and safety-II: The past and future of safety management,” Safety-I and safety-II: The Past and Future of Safety Management, pp. 1–187, 2014. [CrossRef]
- E. Hollnagel, Resilience engineering in practice Vol 1, 2011, CRC Press. [CrossRef]
- E. Hollnagel, Resilience engineering in practice Vol 2, 2016, CRC Press. [CrossRef]
- T. Reiman and C. Rollenhagen, “Does the concept of safety culture help or hinder systems thinking in safety?,” Accid Anal Prev, vol. 68, pp. 5–15, 2014. [CrossRef]
- T. M. Bisbey, M. P. Kilcullen, E. J. Thomas, M. J. Ottosen, K. J. Tsao, and E. Salas, “Safety Culture: An Integration of Existing Models and a Framework for Understanding Its Development,” Hum Factors, vol. 63, no. 1, pp. 88–110, 2021. [CrossRef]
- B. Fernández-Muñiz, J. M. Montes-Peón, and C. J. Vázquez-Ordás, “Safety culture: Analysis of the causal relationships between its key dimensions,” J Safety Res, vol. 38, no. 6, pp. 627–641, 2007. [CrossRef]
- P. Rossi, M. Cecchini, D. Monarca, L. Assettati, C. Macor, and R. Alemanno, “Semi-quantitative Risk Assessment Framework for Tractor Rollover Prevention Systems Based on the Functional Resonance Analysis Method (FRAM),” in Lecture Notes in Civil Engineering, Springer Science and Business Media Deutschland GmbH, 2024, pp. 205–213. [CrossRef]
- S. R. Browning, S. C. Westneat, and R. Szeluga, “Tractor driving among Kentucky farm youth: Results from the farm family health and hazard surveillance project,” Journal of Agricultural Safety and Health, vol. 7, no. 3, pp. 155–167, 2001.
- S. R. Browning, S. C. Westneat, H. Truszczynska, D. Reed, and R. McKnight, “Farm tractor safety in Kentucky, 1995,” Public Health Reports, vol. 114, no. 1, pp. 53–59, 1999. [CrossRef]
- D. J. Murphy, J. Myers, E. A. McKenzie Jr., R. Cavaletto, J. May, and J. Sorensen, “Tractors and rollover protection in the United States,” J Agromedicine, vol. 15, no. 3, pp. 249–263, 2010. [CrossRef]
- P. L. Jenkins et al., “Prominent barriers and motivators to installing ROPS: An analysis of survey responses from Pennsylvania and Vermont,” Journal of Agricultural Safety and Health, vol. 18, no. 2, pp. 103–112, 2012.
- V. Rondelli, C. Casazza, and R. Martelli, “Tractor rollover fatalities, analyzing accident scenario,” J Safety Res, vol. 67, pp. 99–106, 2018. [CrossRef]
- P. Underwood and P. Waterson, “Systemic accident analysis: Examining the gap between research and practice,” Accid Anal Prev, vol. 55, pp. 154–164, 2013. [CrossRef]
- E. Grant, P. M. Salmon, N. J. Stevens, N. Goode, and G. J. Read, “Back to the future: What do accident causation models tell us about accident prediction?,” Saf Sci, vol. 104, no. April 2017, pp. 99–109, 2018. [CrossRef]
- T. Abreu Saurin and R. Patriarca, “A taxonomy of interactions in socio-technical systems: A functional perspective,” Appl Ergon, vol. 82, no. September 2019, p. 102980, 2020. [CrossRef]
- D. E. Weber, S. C. MacGregor, D. J. Provan, and A. Rae, “‘We can stop work, but then nothing gets done.’ Factors that support and hinder a workforce to discontinue work for safety,” Saf Sci, vol. 108, no. March, pp. 149–160, 2018. [CrossRef]
- G. A. Shirali, M. Shekari, and K. A. Angali, “Quantitative assessment of resilience safety culture using principal components analysis and numerical taxonomy: A case study in a petrochemical plant,” J Loss Prev Process Ind, vol. 40, pp. 277–284, 2016. [CrossRef]
- S. Dekker, P. Cilliers, and J. H. Hofmeyr, “The complexity of failure: Implications of complexity theory for safety investigations,” Saf Sci, vol. 49, no. 6, pp. 939–945, 2011. [CrossRef]
- D. Windridge, A. Shaukat, and E. Hollnagel, “Characterizing driver intention via hierarchical perception-action modeling,” IEEE Trans Hum Mach Syst, vol. 43, no. 1, pp. 17–31, 2013. [CrossRef]
- Diane Vaughan, “The Challenger Launch Decision,” 1996.
- M. Lombardi and M. Fargnoli, “Prioritization of hazards by means of a QFD- based procedure,” International Journal of Safety and Security Engineering, vol. 8, no. 2, pp. 342–353, 2018. [CrossRef]
- R. Patriarca, G. Di Gravio, and F. Costantino, “A Monte Carlo evolution of the Functional Resonance Analysis Method (FRAM) to assess performance variability in complex systems,” Saf Sci, vol. 91, pp. 49–60, 2017. [CrossRef]
- “US Occupational Safety and Health Administration (OSHA) - investigation summaries,” https://www.osha.gov/ords/imis/accidentsearch.search. Accessed: Jun. 12, 2025. [Online]. Available: https://www.osha.gov/ords/imis/accidentsearch.html.
- R. Patriarca, J. Bergström, G. Di Gravio, and F. Costantino, “Resilience engineering: Current status of the research and future challenges,” Saf Sci, vol. 102, no. October 2017, pp. 79–100, 2018. [CrossRef]
Figure 1.
Map of Resonance Index.
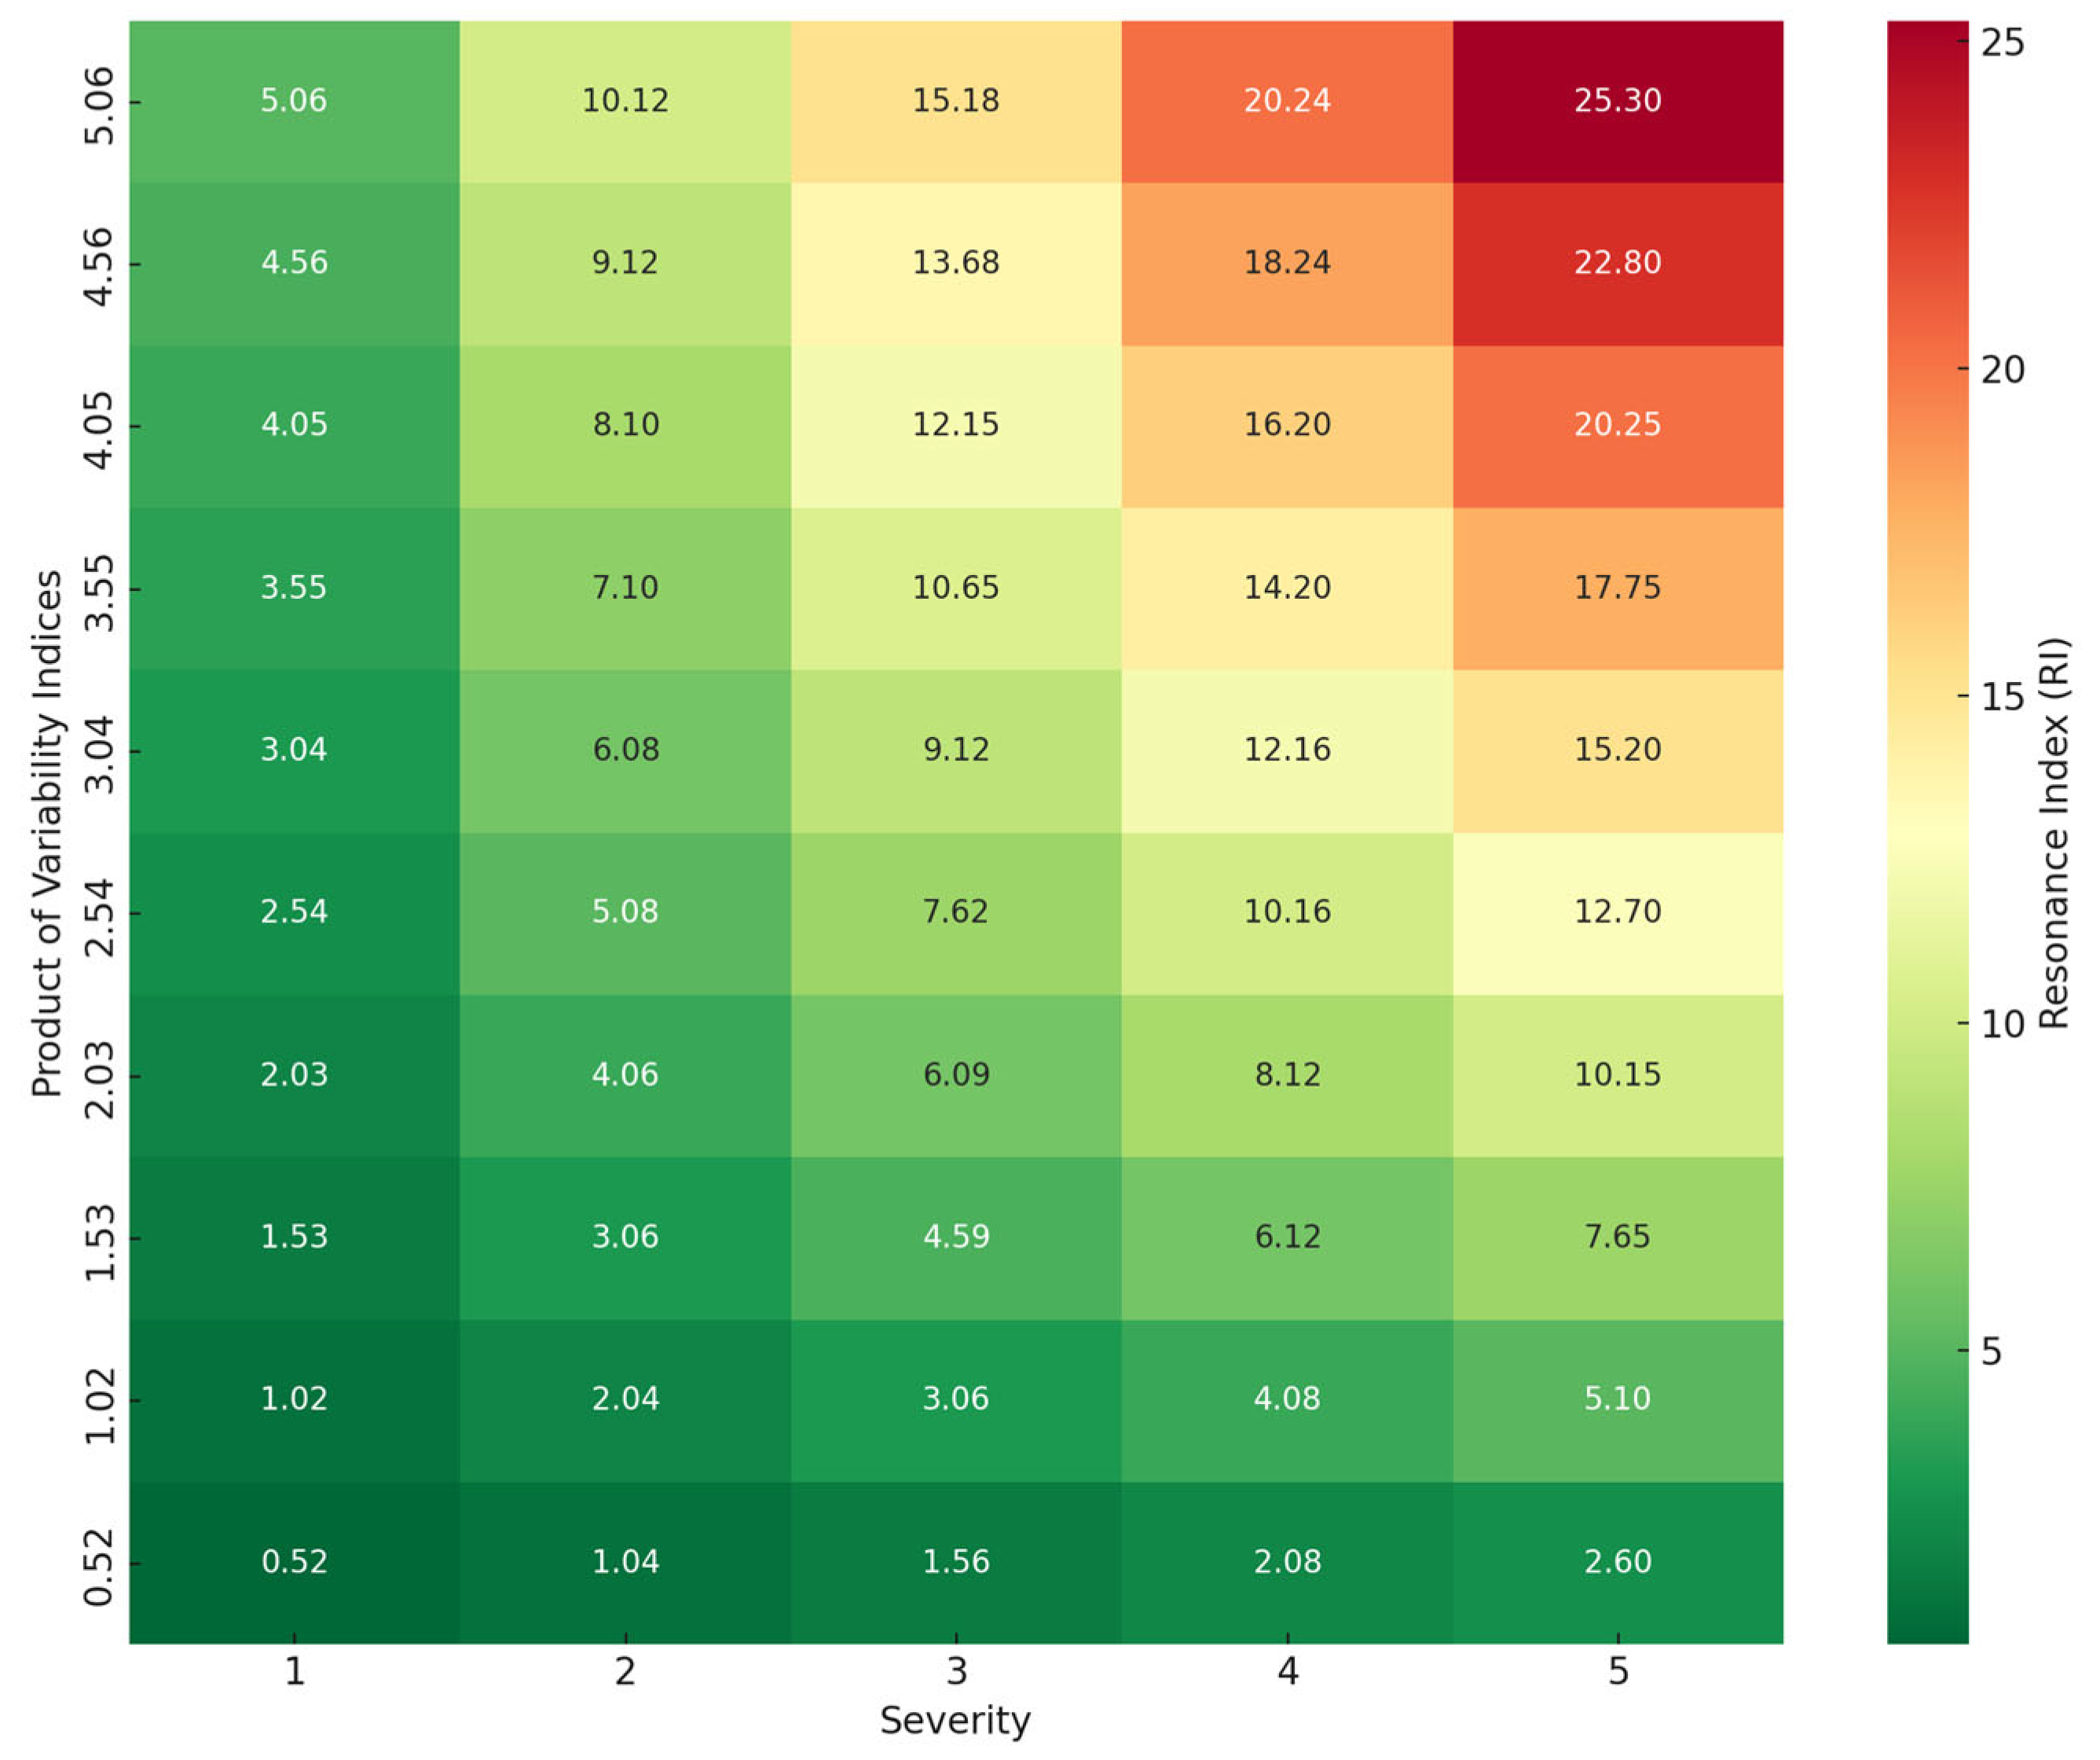
Figure 2.
Figure 2. Flowchart of the process of analysis.
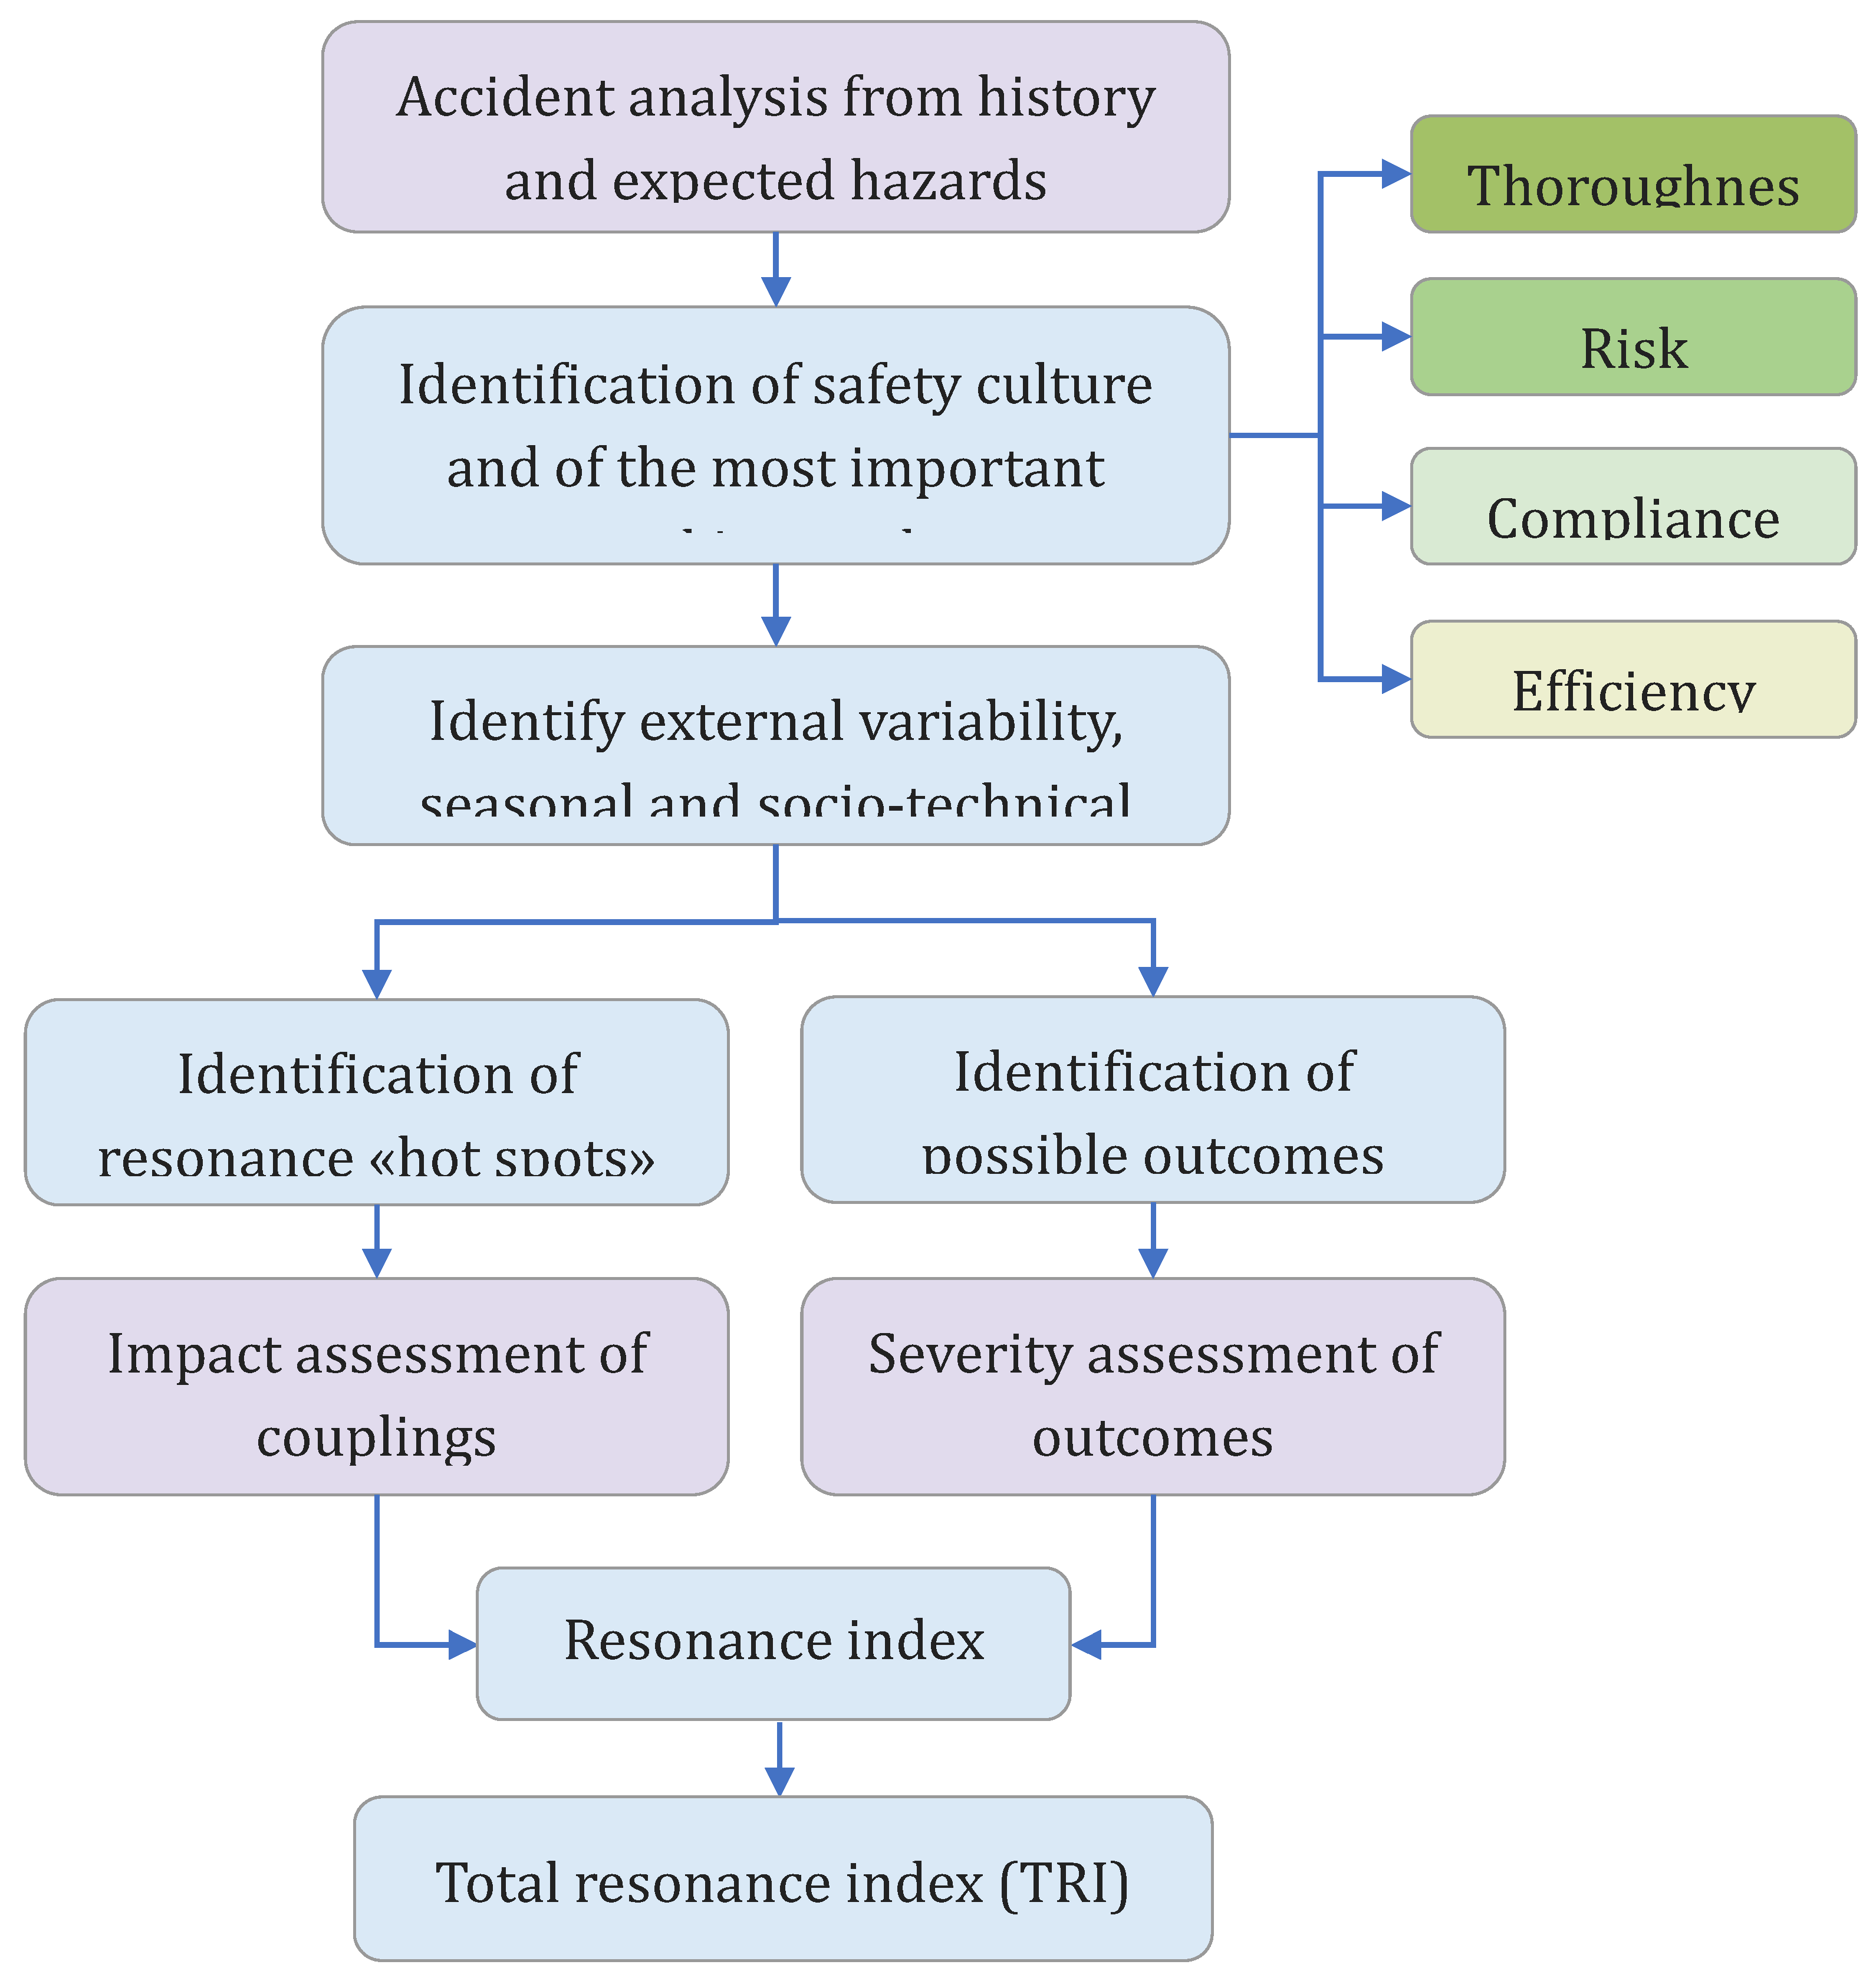
Figure 3.
FRAM instantiation of the selected mechanised ploughing activity.
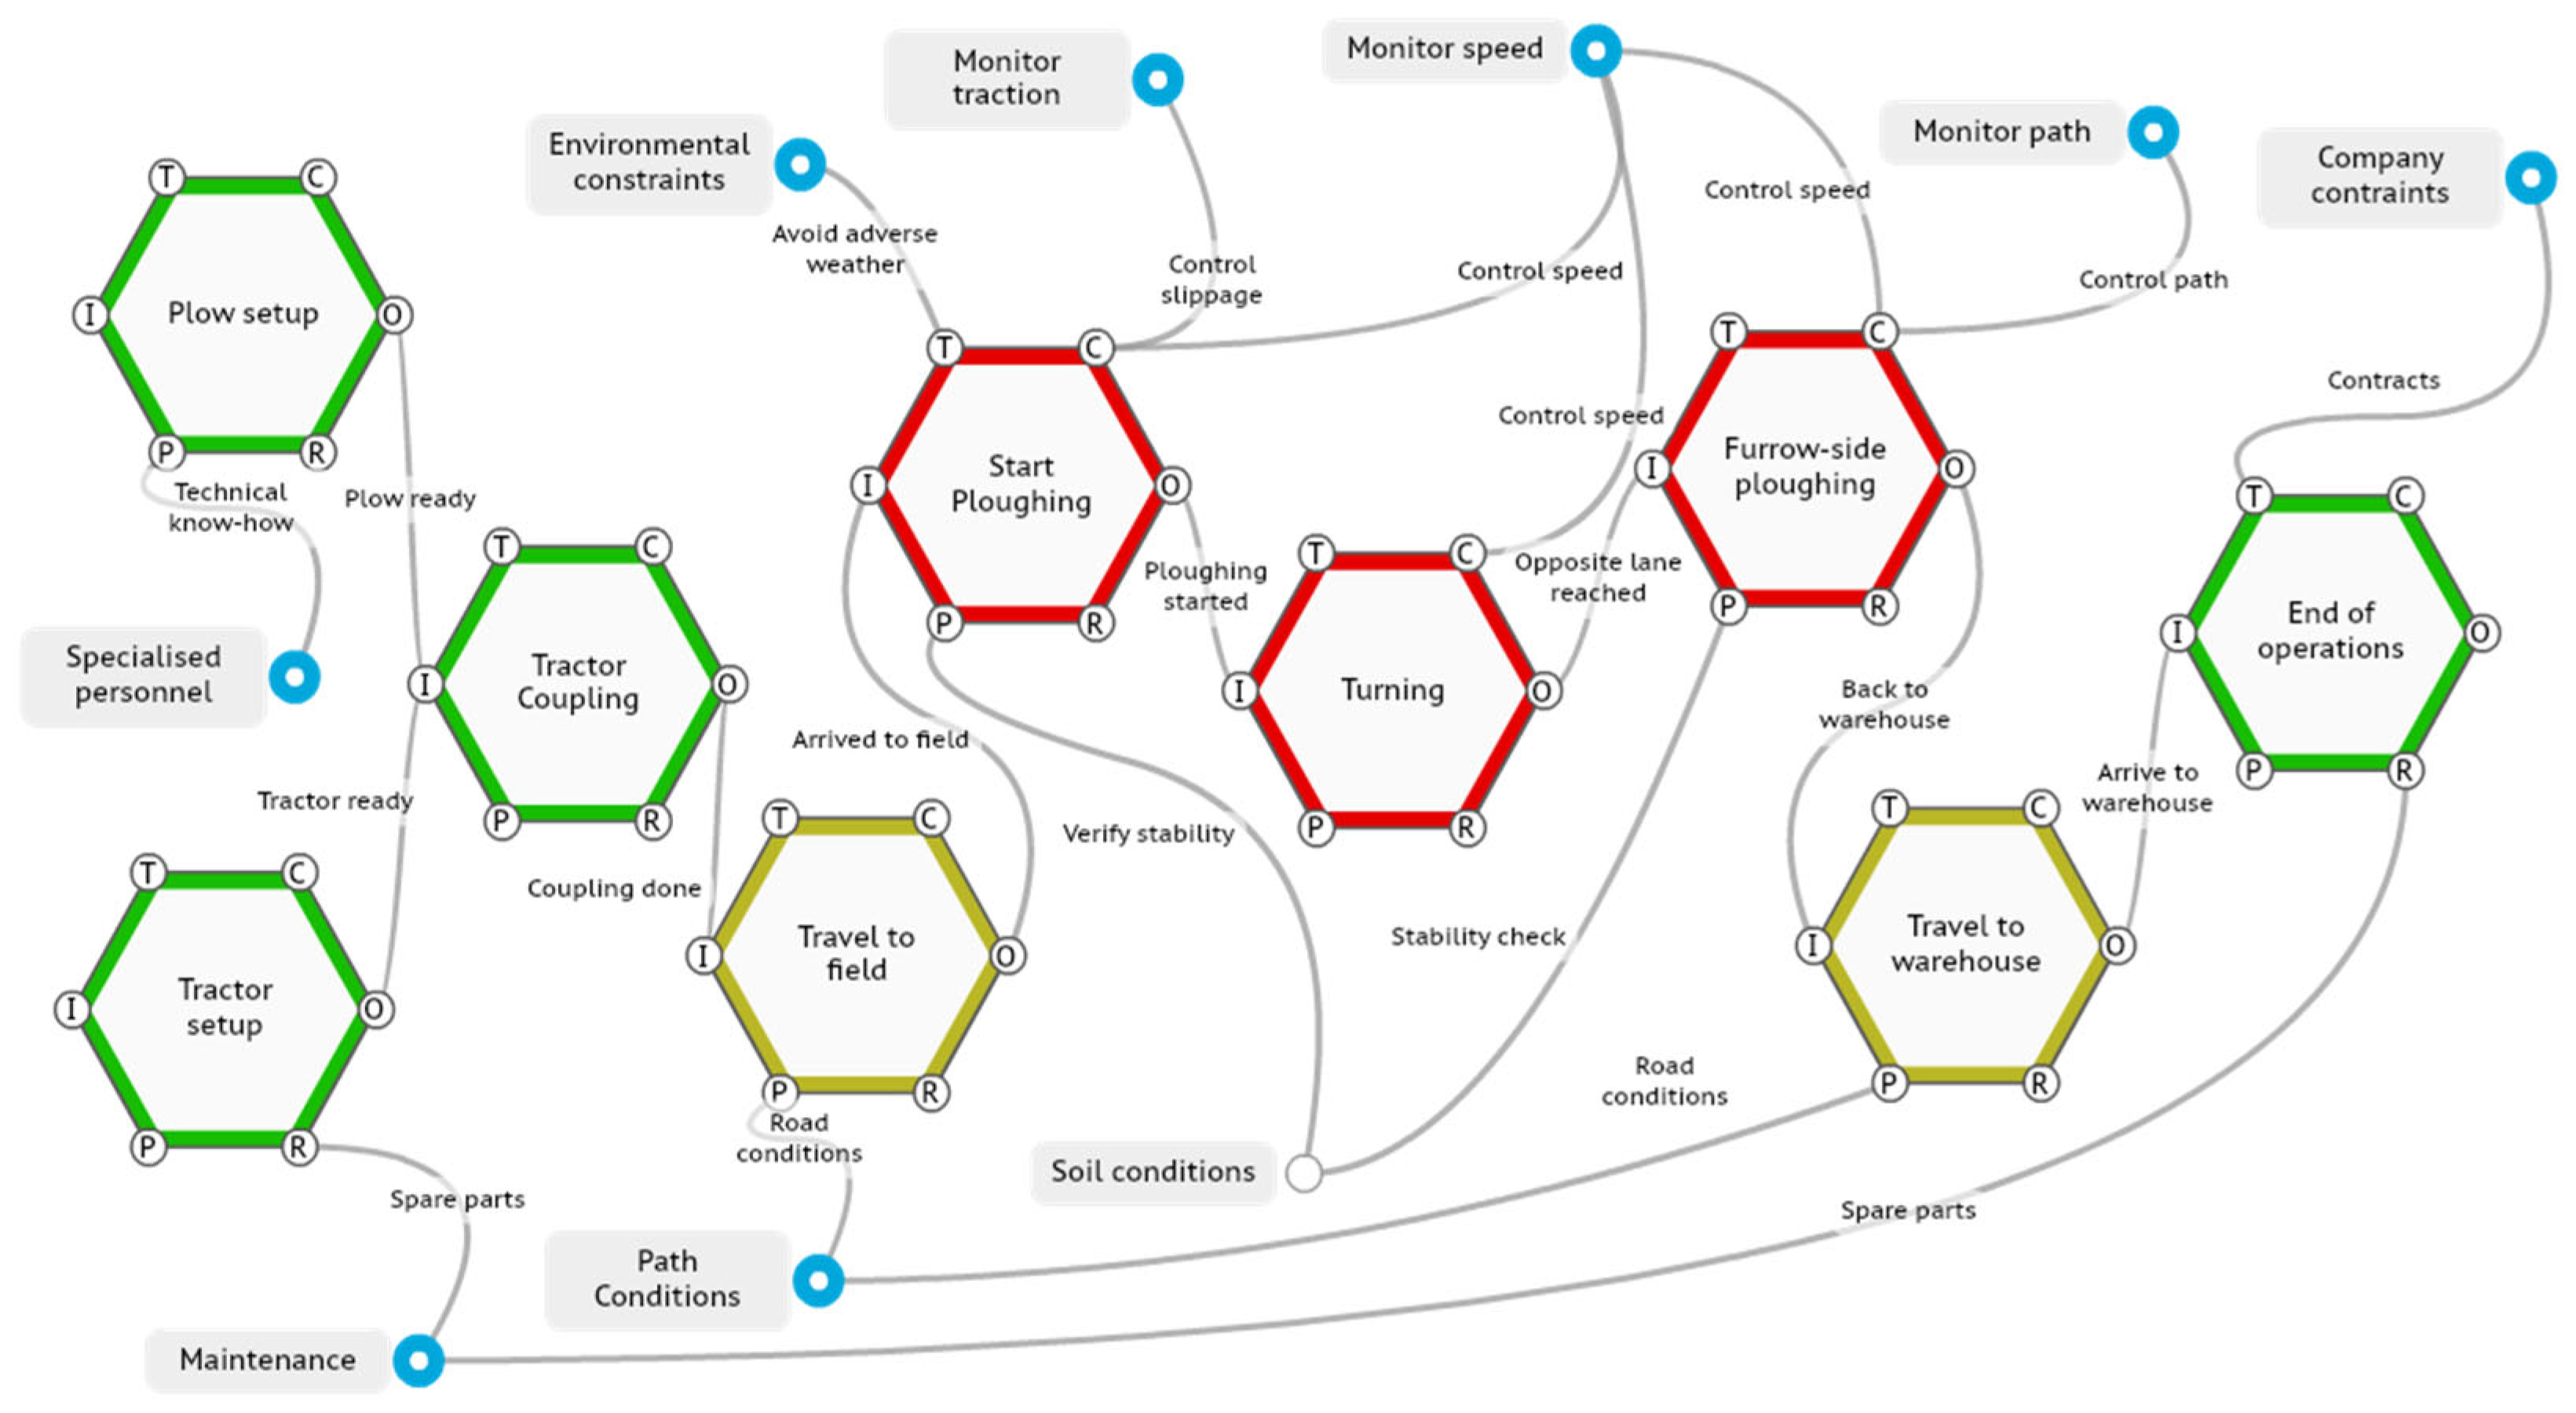
Figure 4.
TRI trends across TACE scenarios.
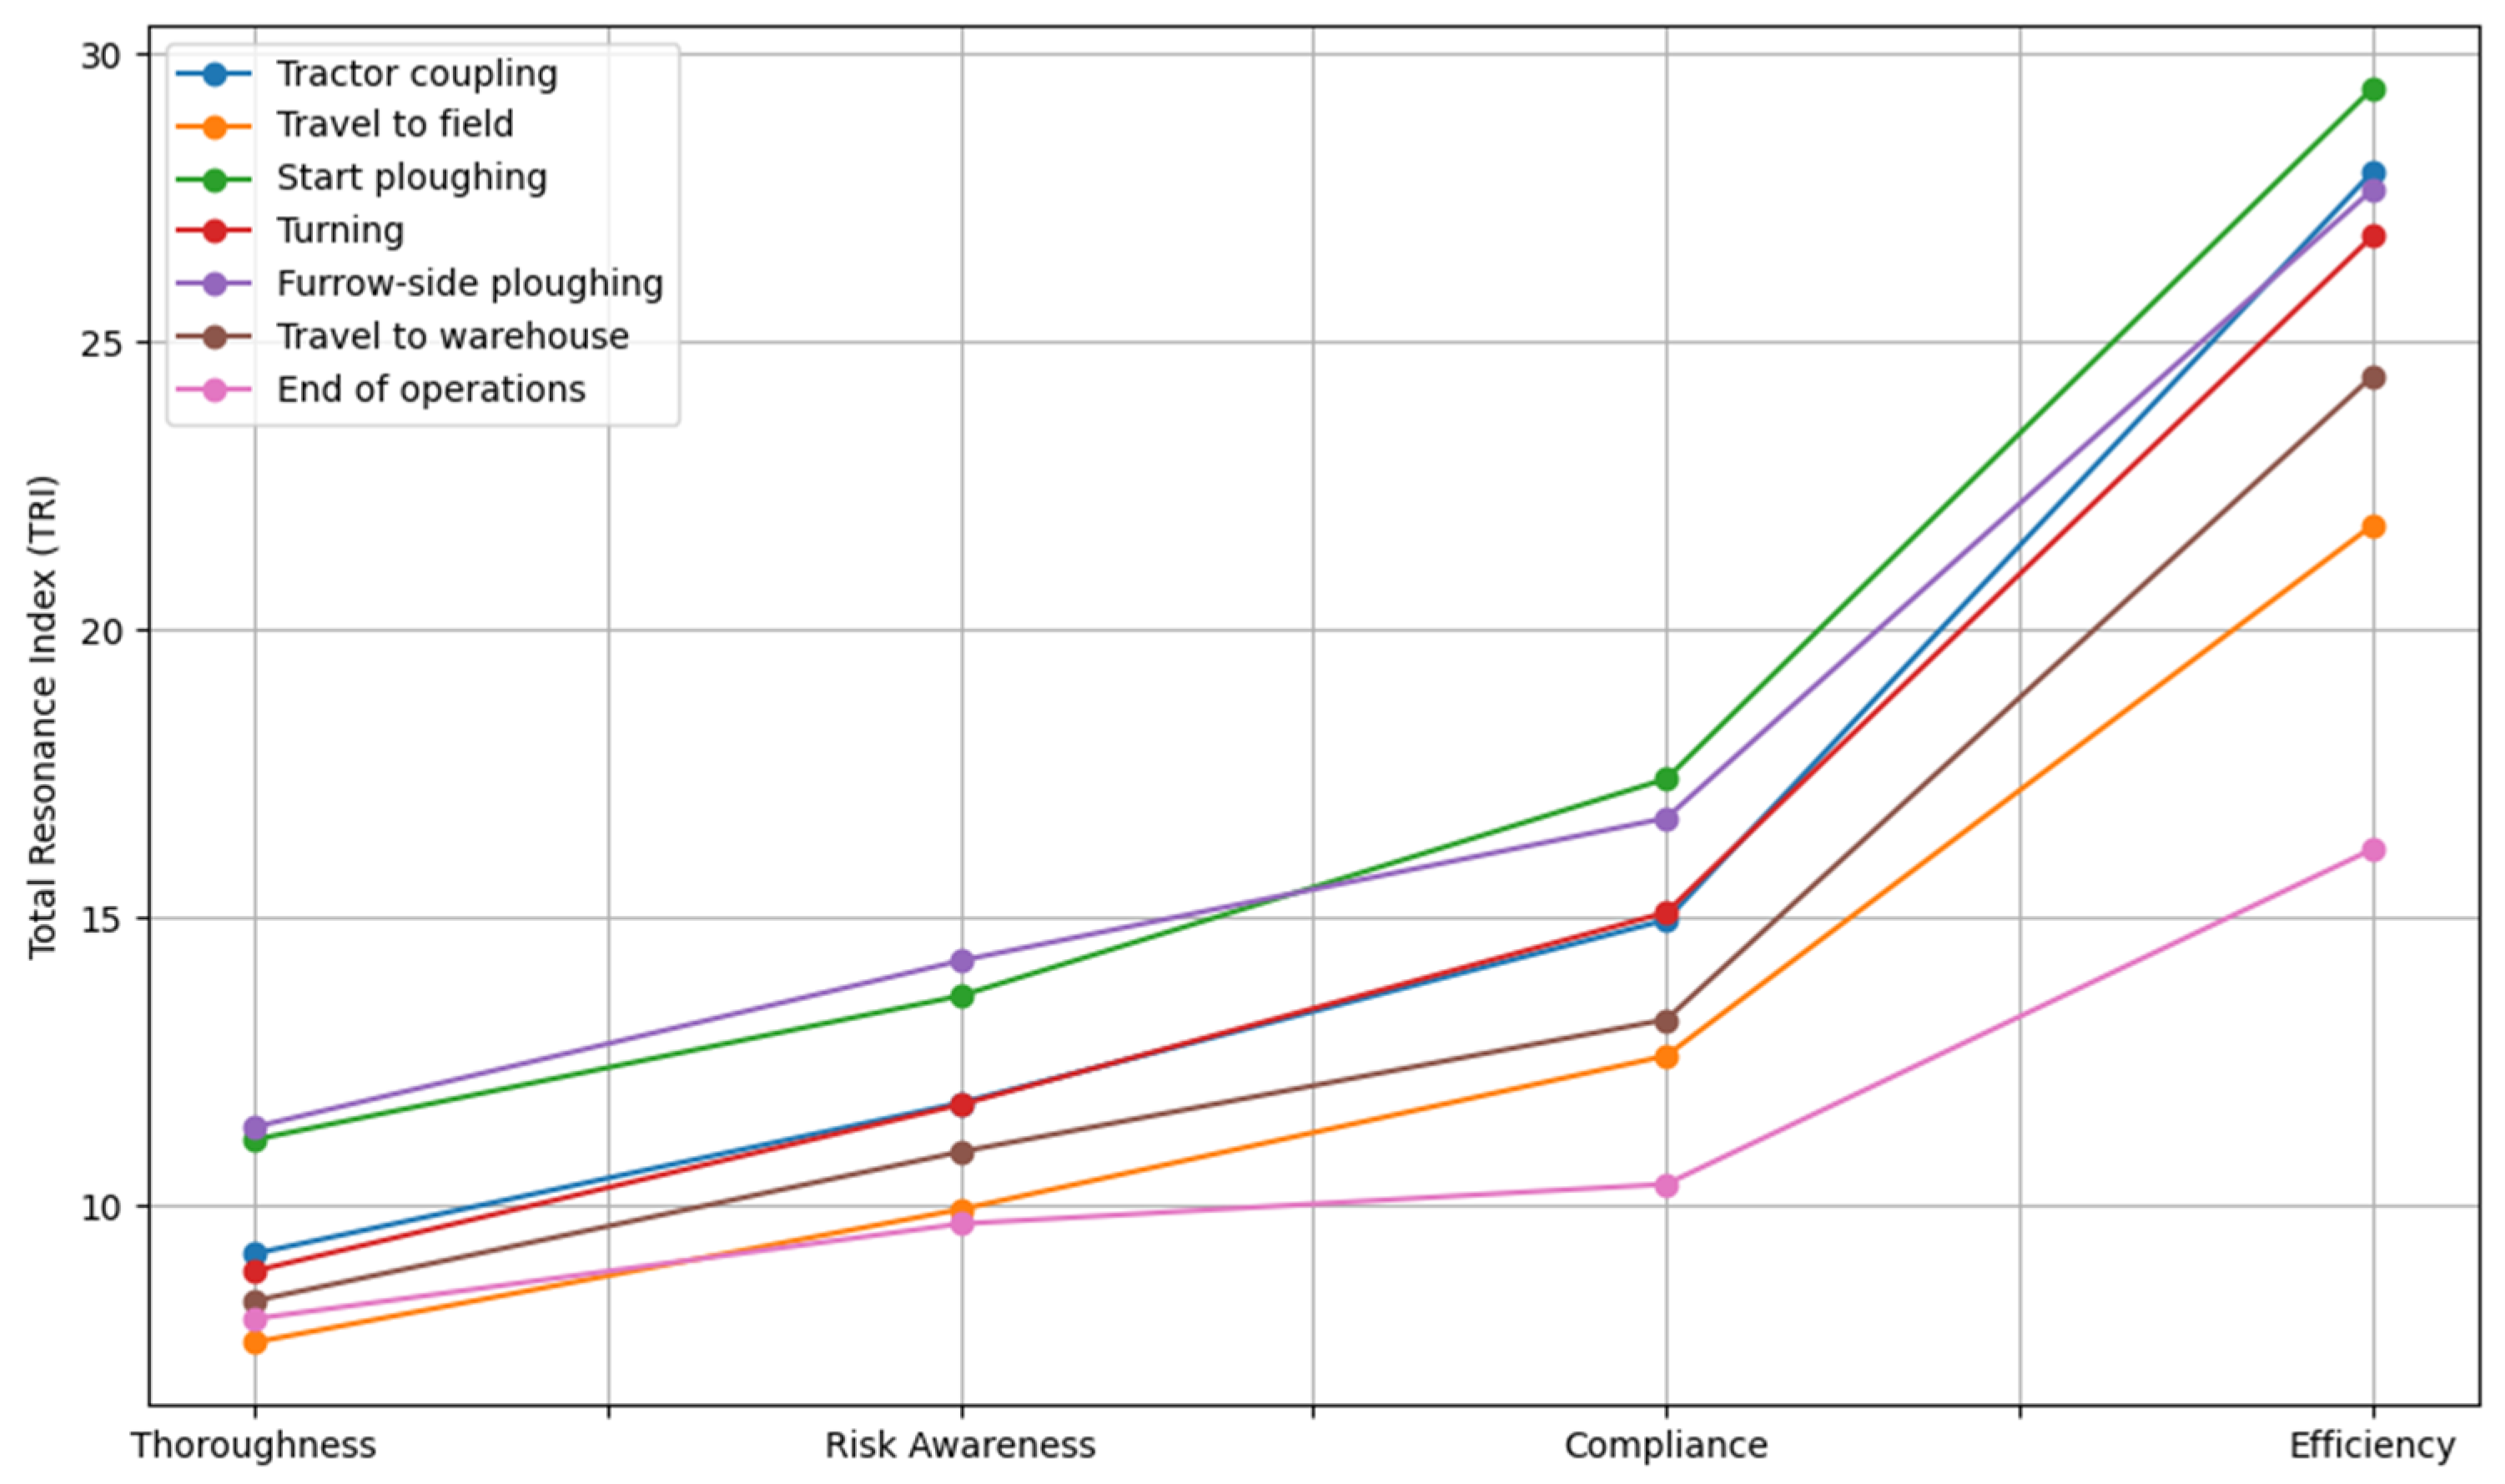

Table 1.
Possible drifts among the selected FRAM instantiations.
| From level | To level | Reason | Effect |
| Thoroughness | Risk awareness |
Economic constraints | Slight reduction in rigor but risk is kept low |
| Lack of time, deadlines | Skip of double checks | ||
| Safety detriment | Less maintenance | ||
| Risk awareness |
Compliance | Operational pressure, workload | Only legal minimum done, potential gaps appear |
| Normalisation of safety deviances [30] | Tasks that don’t follow best practices become normal | ||
| Skilled training decay or unavailability | Tasks are carried out by non-specialised workers | ||
| Compliance | Efficiency | Loss of supervision | Resonance and risks propagate unnoticed |
| Informal shortcuts | Growth of hidden failures | ||
| Performance push | Hazard normalisation |
Table 2.
Severity scale.
| Severity | Label | Description |
| 1 | Minor | Temporary inconvenience, requiring first aid |
| 2 | Moderate | Injury requiring medical treatment |
| 3 | Serious | Injury with prolongated absence or restrictions |
| 4 | Severe | Serious injury or permanent partial disability |
| 5 | Fatal | Death or catastrophic irreversible outcome |
Table 3.
Variability values for each functional parameter.
| Parameter | Variability | Impact value |
| Timing | Early | 0.85 |
| In time | 1.00 | |
| Delay | 1.15 | |
| Late | 1.30 | |
| Too early / too late | 1.50 | |
| Preconditions | Double checked | 0.85 |
| Performed | 1.00 | |
| Completely skipped | 1.50 | |
| Resources | More than enough | 0.85 |
| Enough | 1.00 | |
| Few | 1.15 | |
| Few | 1.30 | |
| Too few | 1.50 | |
| Control | Redundant | 0.85 |
| Active | 1.00 | |
| Absent | 1.50 |
Table 4.
Summary of accident data.
| Information | Count | Statistics |
| Rollover incidents | 44 | A total of 120 accidents involving farming machinery was found |
| Fatal outcomes | 30 | 68% of cases involved the death of the tractor’s driver |
| Age reported (16/44) |
4 | Age > 60 years old |
| 6 | Age between 40 and 60 years old | |
| 6 | Age < 40 years old | |
| Environmental or socio-technical factors affecting the accident | 18 | Slope or terrain conditions |
| 12 | Surface conditions | |
| 8 | Load | |
| 5 | Weather | |
| 3 | Mechanical failure |
Table 5.
Tradeoffs among safety cultures affecting background variability.
| Function | Thoroughness to Risk Awareness |
Risk awareness to Compliance |
Compliance to Efficiency | Tradeoffs / Risk Effects |
| Maintenance | Preventive inspections |
Only perform legally required checks | Postpone until breakdown | Accumulation of hidden and latent failures |
| Involvement of personnel | Senior technicians only in key activities | Setup done by general operators | Setup without validation | Increased error rate, misalignment, reduced reliability |
| Path conditions |
Less frequent path surveys | Assume paths are safe | Work with bad path conditions | Transport incidents, travel delays, vehicle damage |
| Environmental constraints | Accept margins on weather forecasts | Ignore forecasts unless extreme warnings | Work despite adverse weather |
Soil damage, machine slippage, operator stress |
| Monitor speed |
Work speeds are checked periodically | Trust operators’ judgement | Prioritize faster work | Mechanical stress, increased accident probability |
| Monitor path |
Accept minor deviations |
Path corrections done to prevent high risks | Deviations for faster operation | Field work inconsistency, increased rollover risks |
| Soil conditions |
Accept slight soil instability | Ignore soil conditions unless critical | Operate even on poor soils | Poor traction, field surface degradation |
| Company constraints |
Slightly compress work schedules | Enforce minimum procedure compliance | Rush operations | Neglected controls, risk-taking behavior |
Table 6.
Breakdown of FRAM functions.
| Functions | Input | Output | Control | Preconditions | Resources | Time |
| Tractor setup | - | Tractor ready | Maintenance policy |
Wearing PPE | Spare parts | - |
| Plow setup | - | Plow ready | - | Know-how | - | - |
| Tractor coupling |
Tractor ready, plow ready | Coupling done | - | Presence of auxiliary systems | - | - |
| Travel to field | Coupling done | Arrived at field | - | Road conditions, seatbelts fastened | - | Deadline |
| Ploughing | Arrived at field | Ploughing started | Control slippage, control speed | Check access and stability, deploy ROPS | - | Environmental constraints |
| Path Conditions |
- | Road conditions | - | Driving requirements |
- | - |
| Turning | End of strip | Opposite side reached | Control speed | - | - | - |
| Furrow-side ploughing | - | Verify field | Control path, control speed | Stability check | - | - |
| Travel to warehouse |
Verify field | Arrive to warehouse |
- | Road conditions |
- | - |
| End of operations |
Go back to warehouse |
- | - | - | - | Company constraints |
| Traction monitoring |
Ploughing started | Control slippage | - | - | - | - |
| Speed monitoring |
Ploughing started | Control speed | - | - | - | - |
| Soil conditions | Ploughing started | Verify stability, Stability check | - | - | - | - |
Table 7.
Resonance analysis of couplings.
| Function |
Expected output |
Potential variability |
Influencing aspects |
Resonance potential |
| Tractor setup | Tractor ready | Delay or incomplete setup due to missing parts | Maintenance (Control), Spare parts (Resource) | Setup delay might result in coupling delays and delayed start of operations |
| Plow setup | Plow ready | Incorrect plow setup if technical know-how is lacking | Technical know-how (Precondition) |
Incorrect setup leads to poor ploughing quality |
| Tractor coupling |
Coupling done | Misalignments | Plow ready (Input) |
Setup errors propagation to field |
| Travel to field |
Arrived at field | Travel delays due to road conditions | Road conditions (Precondition) |
Ploughing during bad weather |
| Ploughing | Ploughing started | Slippage, unstable operation, performance loss | Control slippage, Control speed (Control), Verify stability (Precondition), Environmental constraints (Time) | Variability increases and affects traction, path and speed |
| Path Conditions |
Road conditions | Inaccurate or outdated information about path status | None directly | Path uncertainties increase risk during travel phases |
| Turning | Opposite side reached | Inaccurate turning if speed control fails | End of strip (Input), Control speed (Control) | Overlapping and additional turning |
| Furrow-side ploughing | Verify field | Deviation from optimal ploughing path | Stability check (Precondition), Control path, Control speed (Control) | Poor ploughing, requiring more operation time |
| Travel to warehouse |
Arrive to warehouse |
Delayed return due to road conditions | Road conditions (Precondition) |
Extended exposure to risks or adverse weather |
| End of operations |
– | Previous delay can affect shutdown procedures | Company constraints (Time) | Missing maintenance or requiring additional maintenance in next use |
| Traction monitoring |
Control slippage | Missed detection of traction loss |
Ploughing started (Input) |
Worse soil condition and less operational safety |
| Speed monitoring |
Control speed | Failure to maintain operational speed |
Ploughing started (Input) |
Speed variability affects traction, work uniformity |
| Path monitoring |
Control path | Deviations from optimal route during ploughing | Ploughing started (Input) |
Route errors require more time |
Table 8.
Calculation of Resonance Index for the foreground functions.
| Functions | Severity | Weights | Resonance Index (RI) | |||
| Thoroughness | Risk awareness | Compliance | Efficiency | |||
| Tractor setup | 3 | 2,08 | 0.77 | 0.92 | 1.10 | 1.35 |
| Plough setup | 3 | 1,33 | 0.77 | 0.92 | 1.15 | 1.46 |
| Coupling | 4 | 4,64 | 0.85 | 0.97 | 1.20 | 1.50 |
| Travel to field | 4 | 1 | 0.85 | 0.97 | 1.23 | 1.68 |
| Ploughing | 5 | 3,5 | 0.90 | 1.05 | 1.40 | 2.04 |
| Turning | 5 | 1,33 | 0.93 | 1.07 | 1.46 | 2.08 |
| Furrow-side ploughing | 5 | 2,08 | 0.88 | 1.04 | 1.38 | 1.96 |
| Travel to warehouse |
4 | 2,08 | 0.80 | 0.95 | 1.25 | 1.66 |
| End of operations | 3 | 1,33 | 0.72 | 0.88 | 1.08 | 1.42 |
Table 9.
TRI values for TACE scenarios.
| Functions | Aggregated variability | Background functions | TRIt | TRIa | TRIc | TRIe |
| Tractor setup | Tractor setup, equipment setup | Specialised personnel, maintenance |
9.16475 | 11.78 | 14.96 | 27.955 |
| Plough setup | Tractor coupling | Path conditions | 7.62 | 9.93 | 12.6 | 21.82 |
| Coupling | Travel to field | Environmental constraints, monitor traction, monitor speed, soil conditions | 11.1425 | 13.64 | 17.405 | 29.405 |
| Travel to field | Start ploughing | Control speed | 8.8625 | 11.75 | 15.0875 | 26.8375 |
| Ploughing | Turning | Control speed, control path, Soil conditions | 11.3625 | 14.25 | 16.725 | 27.65 |
| Turning | Furrow-side ploughing | Path conditions | 8.3425 | 10.93 | 13.2325 | 24.4075 |
| Furrow-side ploughing | Travel to warehouse | Maintenance, company constraints | 8.03 | 9.68 | 10.37 | 16.1875 |
| Travel to warehouse |
Tractor setup, equipment setup | Specialised personnel, maintenance |
9.16475 | 11.78 | 14.96 | 27.955 |
| End of operations | Tractor coupling | Path conditions | 7.62 | 9.93 | 12.6 | 21.82 |
Table 10.
TRI change in TACE cycle.
| Functions | TRI variations among working modes | ||
| From thoroughness to Risk Awareness |
From Risk Awareness to compliance |
From compliance to efficiency |
|
| Tractor setup | +28.54% | +26.99% | +86.86% |
| Plough setup | +30.31% | +26.89% | +73.17% |
| Coupling | +22.41% | +27.60% | +68.95% |
| Travel to field | +32.58% | +28.40% | +77.88% |
| Ploughing | +25.41% | +17.37% | +65.32% |
| Turning | +31.02% | +21.07% | +84.45% |
| Furrow-side ploughing | +20.55% | +7.13% | +56.10% |
| Travel to warehouse | +28.54% | +26.99% | +86.86% |
| End of operations | +30.31% | +26.89% | +73.17% |
| Average variation | +27.26% | +22.21% | +73.25% |
Disclaimer/Publisher’s Note: The statements, opinions and data contained in all publications are solely those of the individual author(s) and contributor(s) and not of MDPI and/or the editor(s). MDPI and/or the editor(s) disclaim responsibility for any injury to people or property resulting from any ideas, methods, instructions or products referred to in the content. |
© 2025 by the authors. Licensee MDPI, Basel, Switzerland. This article is an open access article distributed under the terms and conditions of the Creative Commons Attribution (CC BY) license (http://creativecommons.org/licenses/by/4.0/).
Copyright: This open access article is published under a Creative Commons CC BY 4.0 license, which permit the free download, distribution, and reuse, provided that the author and preprint are cited in any reuse.


