
Submitted:
12 June 2025
Posted:
12 June 2025
You are already at the latest version
Abstract
As global pressure to reduce emissions intensifies, China is increasingly turning to digital technologies to drive sustainable industrial development, aiming to boost pro-duction while keeping carbon emissions in check. This study takes a micro-level ap-proach by dividing the industry into 17 sectors and applying an Environmental-ly-extended input-output (EEIO) model combined with structural decomposition analysis (SDA) to quantify the impact of digital transformation on carbon emissions across sectors. The results indicate that: (1) Technological improvements driven by digitalization play a key role in reducing industrial carbon emissions; and (2) While high-carbon sectors show substantial emission reductions due to digital transfor-mation, industries such as textiles—where digital adoption is more challeng-ing—exhibit only limited improvements. These findings underscore the need to fur-ther advance technological upgrading and transformation in less digitally integrated sectors.
Keywords:
Digitalization
; Carbon Emissions
; Downscale Structural Decomposition Analysis
; Environmentally-Extended Input-Output Model
; Industry Sectors
1. Introduction
As one of the important pillars of the world economy, the manufacturing industry has great contribution to both the economy growth and the employment. However, this industry also one of the main source of the global GHG(Green House Gas) emissions(Murphy, 2024)[1]. The producing and the transportation of the Manufacturing are all depend on fossil fuels, which will produce lots of GHGs like CO2. According to IEA’s (International Energy Agency) report, manufacturing carbon emissions have already accounted for more than 30% of the global greenhouse gas emissions, especially in high energy consumption sector, like steel, chemical and building materials manufactures (IEA,2024) [2].
With the global warming and climate change, as well as the continuing progress of International Environmental Agreements, lowing carbon emissions has become an international consensus. Under this background how to achieve emission reduction in the industrial sector has become an important issue in promoting sustainable development. With the advent of the Industry 4.0 era, digital technology is used by more and more countries in daily life and producing activities, including the manufacturing sector. Industrial digitization is widely recognized as a key method to solve the problem of emission reduction and promote the sustainable development of the manufacturing industry (Tang, 2024)[3]. Industrial digitalization can not only optimize the production process and improve the efficiency of energy use, but also reduce the waste of resources and achieve the goal of carbon dioxide emission reduction through the introduction of the Internet of Things (IoT), big data analysis and other technological means in the manufacturing industry in the areas of product design, production and transportation (Wang, 2023) [4].
China, as the center of global manufacturing, also faces huge pressure to reduce carbon emissions while promoting economic development. China’s carbon emissions experienced a long-term growth from 2002 to 2019, although the growth rate slowed down in 2020, carbon emissions still account for 30% of the global total (Guangyue Xu, 2022)[5]. To lower carbon emissions and foster sustainable development, China has made a plan for carbon peaking and carbon neutrality, the objective is to achieve the carbon peak by 2030, and carbon neutrality in 2060. These challenging targets call for extensive reforms and enhancements in both the industrial and energy sectors, especially within manufacturing. (The State Council of China, 2021) [6]. The “Made in China 2025” strategy also clearly emphasizes the integration and development of information technology and manufacturing technology, the development of intelligent manufacturing and green manufacturing, and the promotion of the transformation and upgrading of traditional manufacturing industries (Cui, 2022)[7]. The subsequent “New Quality Productive Forces” also proposes the construction of a “Digital China” and the use of digitalization and other science and technology to develop green productivity.
Under the guidance of this policy, China’s manufacturing enterprises are actively adopting digital technology to achieve low-carbon development while improving productivity. Especially in energy-intensive industries, digital technologies are extensively used to optimize energy and reduce emissions. However, due to the different structures of enterprises and industries sectors, there are significant differences in the performance and effectiveness of digital transformation, which is a phenomenon required in-depth study.
Figure 1.
The location of Guangdong Province.
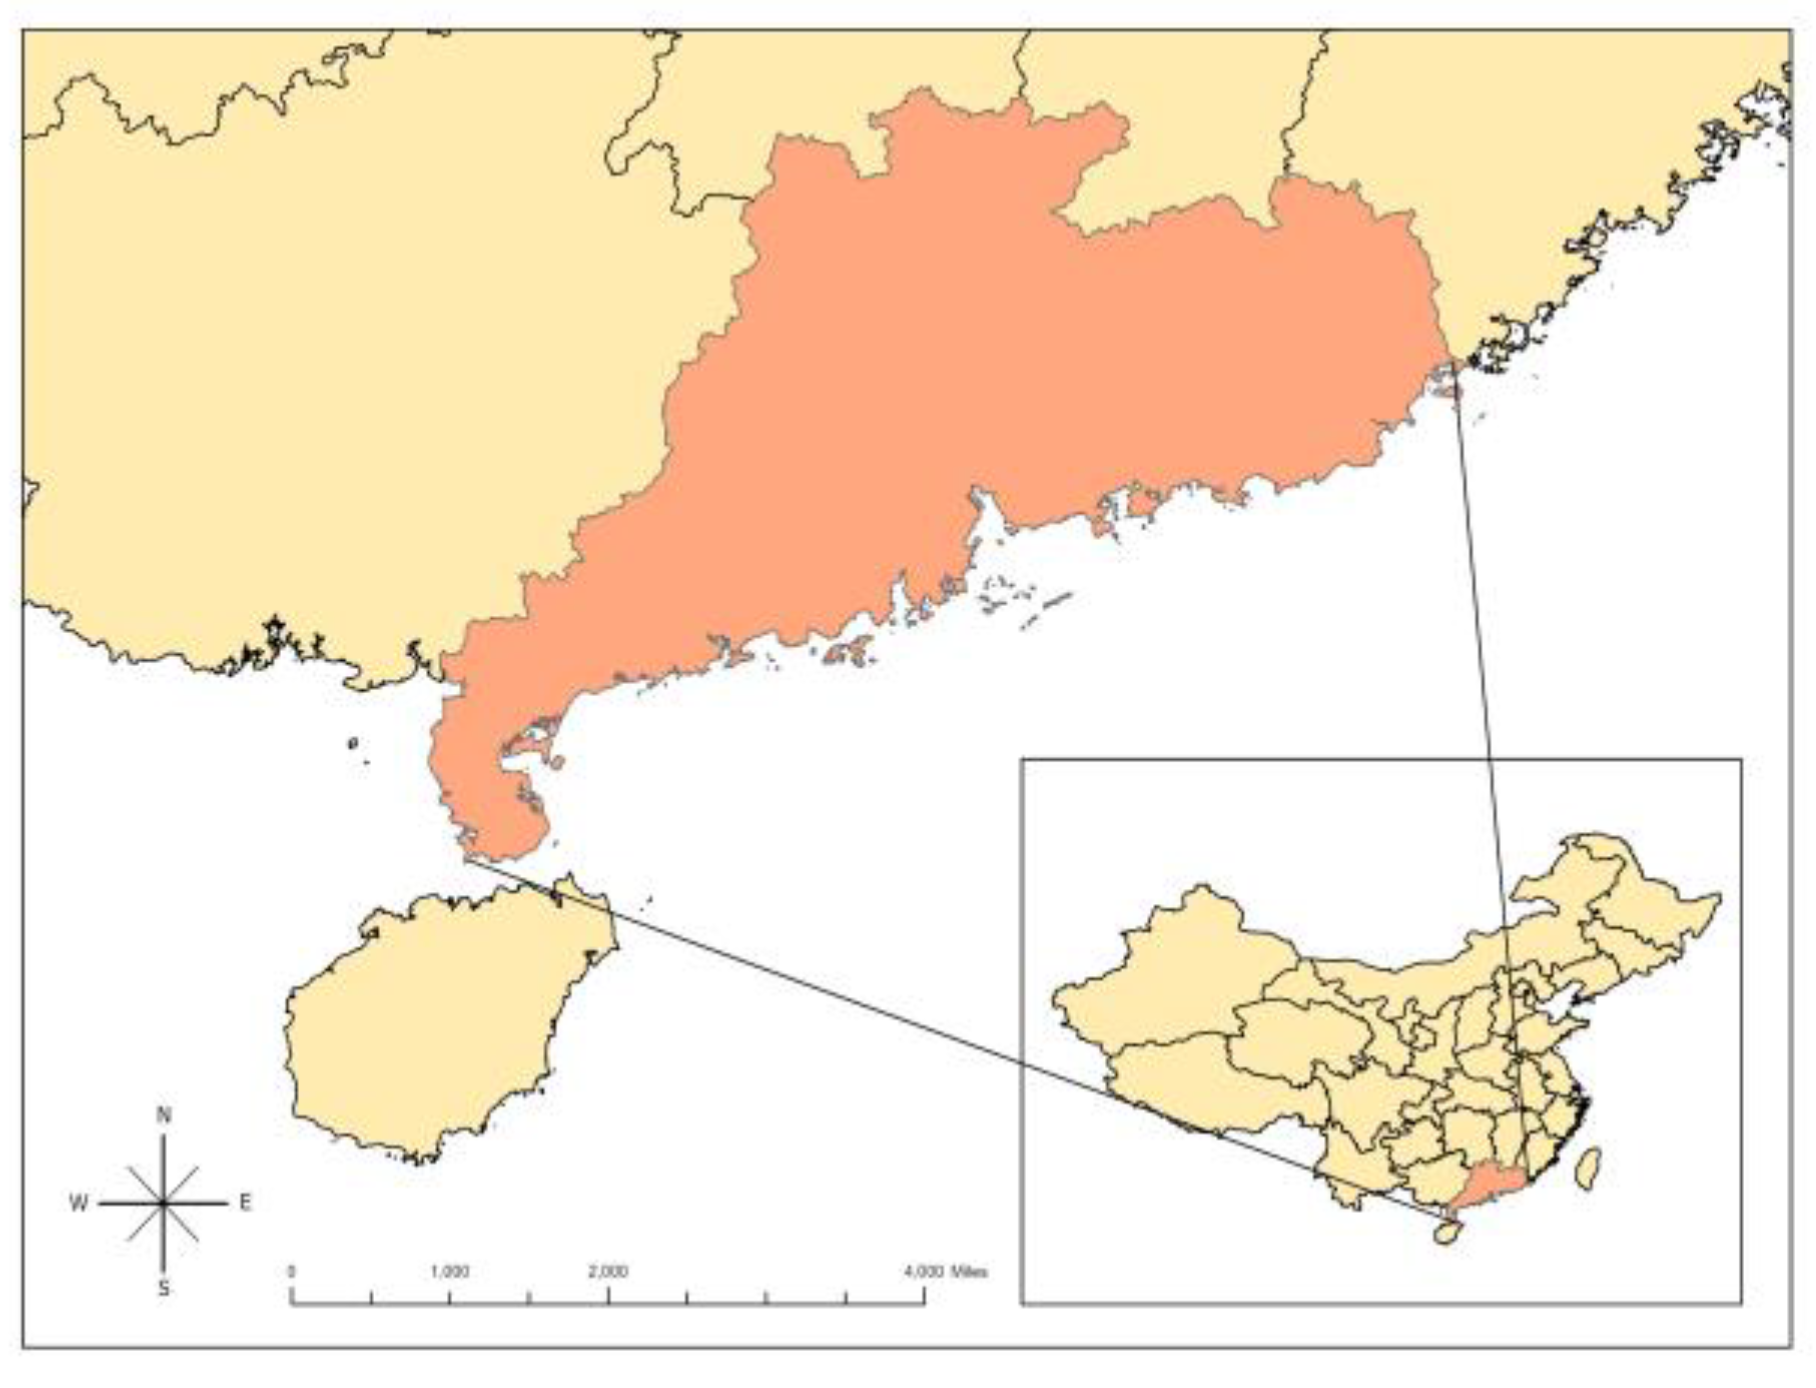
Guangdong is a major manufacturing province, accounting for nearly 4% of the world’s manufacturing industry, and it has Shenzhen, the window of China’s reform and opening up, which is not only a cluster of high-tech industries, but also a frontline of manufacturing innovation and development. Guangdong’s manufacturing industry has responded positively to the policy call for “smart manufacturing” and “green development”, vigorously promoting industrial digital transformation, and through the introduction of intelligent equipment and digital management systems, improving production efficiency and achieving carbon emission reduction targets in some industries. In 2023, the value added of Guangdong’s manufacturing industry will reach RMB 443.979 billion, accounting for 32.7% of the GDP, the second largest in China, and accounting for 13.5% of the country’s total. (Guangdong Provincial Bureau of Statistics)[8]. However, there are still differences in the breadth and depth of the application of digital technology in different industries and enterprises, which leads to different carbon emission reduction effects. As on of the pioneering region of the “dual-carbon” goal, the study of the carbon emission characteristics of Guangdong manufacturing enterprises is of great significance as a reference for low-carbon manufacturing in other regions of China.
Although there have already been some studies about the emission reduction effect of digitization, most of them mainly focus on the macro layer or a single industry, which lack a comparative analysis of the emission reduction effect of digitization among different industry sectors. Taking listed companies in the manufacturing industry of Guangzhou as the research object, this study uses the carbon emission data of different sectors in the manufacturing industry to measure the degree of digitization of enterprises through the digital input ratio, and further adopts the fixed effect model to analyze the extent of the impact of industrial digitization on the reduction of carbon emissions, as well as the difference of the impact of carbon emissions on different sectors of the manufacturing industry. Through the empirical study of Guangzhou’s manufacturing industry, this thesis aims to provide policy recommendations for the digital manufacturing transformation in Shenzhen and other regions, and to contribute data support as well as the theoretical basis for the realization of the national “dual-carbon” goal.
2. Literature Review
2.1. Industrial Digitalization and Industrial Transformation
According to the 2017 White Paper on China’s Digital Economy, the digital economy is consists of both digital industrialization and industrial digitization [21]. Digital industrialization refers to the information industry, which primarily encompasses electronic information manufacturing and software services. In contrast, industrial digitization describes the improvements in output and efficiency achieved by integrating digital technology into traditional industries. In this process, the application of digital technologies not only improves production quantity and efficiency but also adds significant value to these sectors. This study focuses on the industrial digitization aspect, widely seen as a crucial means of transforming the manufacturing sector by converting traditional industries into cleaner, more advanced, and environmentally friendly high-tech industries.
In China, the transformation and upgrading of the manufacturing industry has been widely emphasized as a focus of economic development. Made in China 2025 states that it is necessary to integrate information technology and promote industrial upgrading around key sectors of manufacturing. The digitalization of Chinese enterprises often starts from the production side, which is mainly manifested in the data and visualization of the production process, the installation of detection devices for the production equipment of enterprises, and the monitoring of their energy consumption and emissions, so as to improve the production efficiency and better manage the energy use in the production of enterprises. Li Tianren (2024) pointed out that the integration of digital technology with industry changes enterprise production models, proceeds the sharing of information and the exchange of technical expertise, thereby driving the green transition and sustainable growth of traditional industries [9].
2.2. Influence Mechanism of Digital Technology on Carbon Emission in Manufacturing Industry
Empirical analysis shows that industrial digital technology can improve production efficiency, stimulate green innovation in enterprises, significantly reduce unit energy consumption, and thus reduce carbon emissions. Especially in energy-consuming industries, smart manufacturing technologies have been shown to have greater potential for carbon emission reduction (Li Tianren) [9] .
However, as each industry has its own characteristics in terms of production mode, the investment in digitization also varies, and its emission reduction effect will also vary as a result. Zhang’s study (2021) points out that high-technology-intensive industries are more significant in achieving carbon emission reduction due to their complex production processes and better digitization foundation[10]. In contrast, labor-intensive industries and low-technology level industries have relatively limited emission reduction effects. These findings suggest that industry characteristics play an important moderating role in the relationship between digital transformation and carbon emissions.
2.2. Comparison of Digitalization Research Methods
With scholars’ research on enterprise digitization, many digitization measurement methods have also emerged, such as expert scoring method, text analysis method and digitization project input amount. One of the more mainstream method is the text analysis method, which is widely used in the measurement of the degree of enterprise digitization. It extracts the digitization keywords in the annual reports of enterprises, and analyzes the frequency of these words to derive the enterprise digitization index (Wu, 2021)[11]. However, this method is controversial in terms of accuracy, and it is difficult to take into account the actual investment of enterprises in digitization technology.
The other research method is the digitalization investment ratio. Enterprises’ digital input is an important indicator of the degree of digitization, and Liu found in his study that enterprises with a high percentage of digital input are more inclined to adopt intelligent equipment and energy-saving technologies, thus achieving lower carbon emissions (Li,2023)[12]. This study plans to analyze the degree of digitization of enterprises by using the digitization part of their intangible asset input species.
According to the definition of the Bureau of Statistics on the manufacturing industry, can be divided into a total of eighteen industry sectors, digitalization between different industries in different regions of the digitalization of the application of the difference is obvious, to the textile industry in Guangdong, the refining industry and the electronics industry, for example, many textile enterprises through the application of industrial Internet intelligent system “shuttle intelligent textile”, so that the digitization technology Many textile enterprises have applied the industrial Internet intelligent system “Shuttle Smart Spinning” to make digital technology cover the whole process from business to production. However, the textile industry in Guangdong is mainly dominated by small-scale and scattered micro enterprises, which makes it difficult to realize centralized large-scale production, and this has also caused the application of digitization to be not yet common (Zhou, 2025)[13]. And in the high carbon emission section, focusing on automated production of the refining sector, but also a wide range of digital twin technology applied to the production chain, relying on the whole domain data sharing and intelligent model, to build a series of digital scheduling command, intelligent material balance and other digital intelligence application scenarios (Huang, 2024)[14]. In addition to these two types of industries, there is also the original information technology accounted for a larger share of the electronics industry, such as electronic devices and communications equipment industry, is the basis of industrial digitization, a large number of 5G base station construction, Internet of Things management and so on infrastructure in the development of these industries continue to improve, but also these industries are the focus of government policy to support the object.
In summary, while the overall impact of industrial digitization on carbon emissions has been studied to some degree, literature still lacks a detailed differential analysis at both the regional and sector levels. Most studies focus on macro-level emission reduction effects, with insufficient exploration of the differences among specific regions or specific industries.
Based on the existing literature, this study aims to address the following research gaps:
1. It examines the relationship between digitalization investments and carbon emissions among listed manufacturing enterprises in Guangdong Province, thereby providing empirical evidence for regional-level carbon emission research.
2. It investigates the heterogeneity of carbon reduction effects across different industries during the digital transformation process, offering insights to optimize policy formulation and resource allocation.
3. Model Building
3.1. Digitalization Degree Calculation
For the calculation of the degree of digital transformation, this paper chooses the improved method of word frequency method by Li Yingmei. It is comparing the investment amount of digital projects disclosed in the special report on annual fund raising and the construction in progress and intangible assets (digital part) in the financial statements[12]. If keywords or relevant patents related to digital transformation technology, such as “software” and “network” are mentioned in the breakdown of the financial report, the item will be defined as digital technology intangible assets. Cumulative investment in digital transformation was derived and logged. The digitization data is derived from the publicly released financial statements of the companies.
3.2. Carbon Emission Accounting
The Environmentally-Extended Input-Output (EEIO) model is an extended environmental input-output model, which introduces environmental elements into the input-output model.
At the first step, this research constructs the technical coefficient matrix , where is the intermediate input of sector i to sector j, and represents the total output of sector j.
Then, we construct the base total output and base carbon emission . In this formula, Y is the final demand and F is the carbon emission factor, which is derived from the ratio between carbon emission and sectoral output.
This paper mainly focuses on the impact of digitization within the manufacturing sector, while the input-output table contains other industry sectors except manufacturing, in order to reduce the impact, so “agriculture, forestry, animal husbandry and fishery” and other sectors are merged into “other sectors”, and the remaining 17 sectors are studied individually. Since the carbon intensity of each sector varies, for example, the carbon emissions of the metal manufacturing sector are much higher than those of other sectors, the sectors are subdivided into high-carbon and non-high-carbon sectors according to whether the carbon intensity is greater than 0.1 High-carbon sectors include “Petroleum, coking products and processed nuclear fuel”, “Nonmetal Mineral Products” and “Smelting and Pressing”. and “Smelting and Pressing of Metals”.
3.3. Data Sources
In this study, the input-output data are from the 2017 Guangdong Province Input-Output Tables publicly released by China’s statistics department, which are published every five years, with 2017 being the most recent data available. Emissions from various sectors in Guangdong Province are mainly from the China Carbon Accounting Databases (CEADs), which provides statistics on carbon emissions from various sectors in Guangdong Province in 2017.
3.4. SDA Model
The structural decomposition analysis (SDA) method is often used in conjunction with input-output modeling, which is based on input-output tables and is widely used to examine the impact of drivers on carbon emissions (Hong, 2024)[15]. Using the SDA method, it is possible to analyze the role of different factors, including digitization, in reducing emissions, and to determine the contribution that digitization has made to the reduction of carbon emissions in the manufacturing sector in Guangdong Province, as well as the extent of the impact of different industries.
The SDA method usually takes two forms: weighted average method and bipolar decomposition method. In order to simplify the arithmetic steps, reduce the error, and get more reasonable results, this paper adopts the bipolar decomposition method to decompose the change ΔC of carbon emissions in the two periods of 2012 and 2017 into technological effect, structural effect, and scale effect, and to explore the role of the influence of different factors.
The basic form of the SDA model is:
From EEIO model we have:
Setting 2012 as the base period (period 0) and 2017 as the comparison period (period 1):
Therefore the change in total carbon emissions is assumed to be:
Based on the polarized average method, the decomposed form of the impact of digitization on carbon emissions in different sectors of the manufacturing industry can be written as follows:
Among the formula, reflects technological effects, that it the changes in carbon intensity per unit of production value, reflects structural change and reflects the scale change.
Tech effect, struct effect and scale effect can be written as follows:

Table 1.
Result of SDA model.
| TechEffect | Struct Effect | ScaleEffect | |
| Food and Tobacco Processing | -1523954.663 | -40273.39793 | 1554247.136 |
| Textile Industry | -6334503.097 | 2743807.047 | 4009767.908 |
| Textile Clothing Shoes and Hats Leather Down and its products | -1265568.841 | -211542.9817 | 940001.822 |
| Woodwork and Furniture | -474611.8052 | 189779.7323 | 290159.3434 |
| Paper, printing and stationery | -3456984.744 | 2259874.772 | 2784573.23 |
| Petroleum, coking products and processed nuclear fuel | 4350120.727 | -3572788.784 | 1543157.142 |
| Chemical products | -414517.3999 | 733783.2996 | 2764731.79 |
| Nonmetal Mineral Products | -38760022.87 | 87124698.11 | 70779646.35 |
| Smelting and Pressing of Metals | 7675511.848 | 76891809.72 | 126129635.2 |
| Metal Products | -1622959.736 | 335345.0404 | 1148140.695 |
| Ordinary Machinery | -120892.5008 | 140086.1948 | 1218281.694 |
| Equipment for Special Purposes | -622493.426 | -232772.5191 | 593749.7327 |
| Transportation Equipment | -768201.821 | -166827.9607 | 595702.0655 |
| Electric Equipment and Machinery | -1302721.86 | -234572.8099 | 809394.5448 |
| Telecommunications Equipment, Computers and Other Electronic equipment | -3414791.295 | -1749447.061 | 2310817.422 |
| Instrumentation Machinery | -415960.8536 | 129899.6814 | 210468.0162 |
| Other manufacturing products and scrap waste | -58676734.6 | 47202190.78 | 8200623.011 |
The technology effect mainly measures the extent to which digitalization or other technological improvements reduce or increase carbon emissions per unit of output value, while the structure effect reflects the impact of changes in the input-output relationship between industries (like changes in the Leontief inverse matrix B) on carbon emissions. This effect mainly reflects the changes in carbon emissions due to industrial restructuring, including direct and indirect (pull and push) effects, and the scale effect reflects the impact of changes in final demand or economic scale on carbon emissions, i.e., the increase in carbon emissions brought about by the expansion of economic activities. Among them, we mainly analyze the technical effect, which is negative in most industries, indicating that with the introduction of technological advances (such as digital upgrading), most industries have achieved a reduction in carbon emissions per unit of output value, thus contributing to the reduction of overall carbon emissions. The absolute value of the technology effect for industries such as food is small, indicating that the carbon reduction effect of technological improvements in this industry is weak. It is particularly noteworthy that the technology effect of “other manufacturing industries” is -58,676,734.6, which may indicate that this industry has achieved significant results in technological upgrading, significantly reducing carbon emissions per unit of output value.
3.5. Scenario Simulation
In this paper, I use a scenario simulation approach to examine how a static input-output model affects the digitalization process in an industry subject to external shocks. In their investigation of the economic and carbon emission impacts associated with electric vehicle rollout, Guo et al. (2022) employed a similar simulation strategy to replicate carbon emission shocks arising from fluctuations in electric vehicle demand. Given the sustained growth of digitization and its influence on industrial energy consumption, the model is applied to analysis the impact of industrial digitalization on carbon emissions across various manufacturing sectors[16].
In the base scenario, the digitization degree is kept constant, and the base carbon emission is .
In Scenario A, digitization decreases by 5%. In this scenario, the adjusted gross outputand carbon emissionsare expressed as the following model:
In Scenario B, digitization is increased by 5%. In this scenario, the adjusted gross output and carbon emissionsare expressed as the following model:
Adjusting the carbon emission coefficient after the change of digitization degree, it is assumed that if digitization improves energy efficiency, the carbon emission coefficient will also be reduced by a certain percentage:
Adjustment of the technical coefficient matrix to simulate digitally optimized production structures and reduce carbon emissions according to the (adjustment rate of 5%):
Recalculate total output and carbon emissions according to the model. And then analysis the carbon emissions gap.
Emission reductions of each sectors,:
Sectoral contribution rates, which is used to measure the relative contribution of each sector to the total emission reductions.:
3.6. Data Sources
In the study, the input-output data selected are from the 2017 Guangdong Province Input-Output Tables publicly released by China’s statistics department, which are published every five years, with 2017 being the most current data available. Emissions from various sectors in Guangdong Province are mainly from the China Carbon Accounting Databases (CEADs), which provides statistics on carbon emissions from various sectors in Guangdong Province in 2017.
3.7. Result
According to the results, digitization in high-carbon sectors has a more significant impact and contribution to carbon emission reduction, while in non-high-carbon sectors, the contribution value is relatively small. On the one hand, the carbon emission base of high-carbon sectors is larger and the reduction effect is significant; on the other hand, the production of high-carbon enterprises under this classification is more concentrated and it is easier to carry out digitalization.
Table 2.
The result of EEIO Scenario Simulation of High Carbon Sector.
| High Carbon Sector | |||
| Sectors | Carbon Emission Factor (tons/ten thousand yuan) | Emission Reduction(tons) | Contribution Rate |
| Petroleum, coking products and processed nuclear fuel | 0.1835 | 4004624 | 1.11% |
| Nonmetal Mineral Products | 0.9804 | 50613240 | 14.05% |
| Smelting and Pressing of Metals | 0.7129 | 114984400 | 31.91% |
Figure 2.
Emission Reduction of High Carbon Sectors.
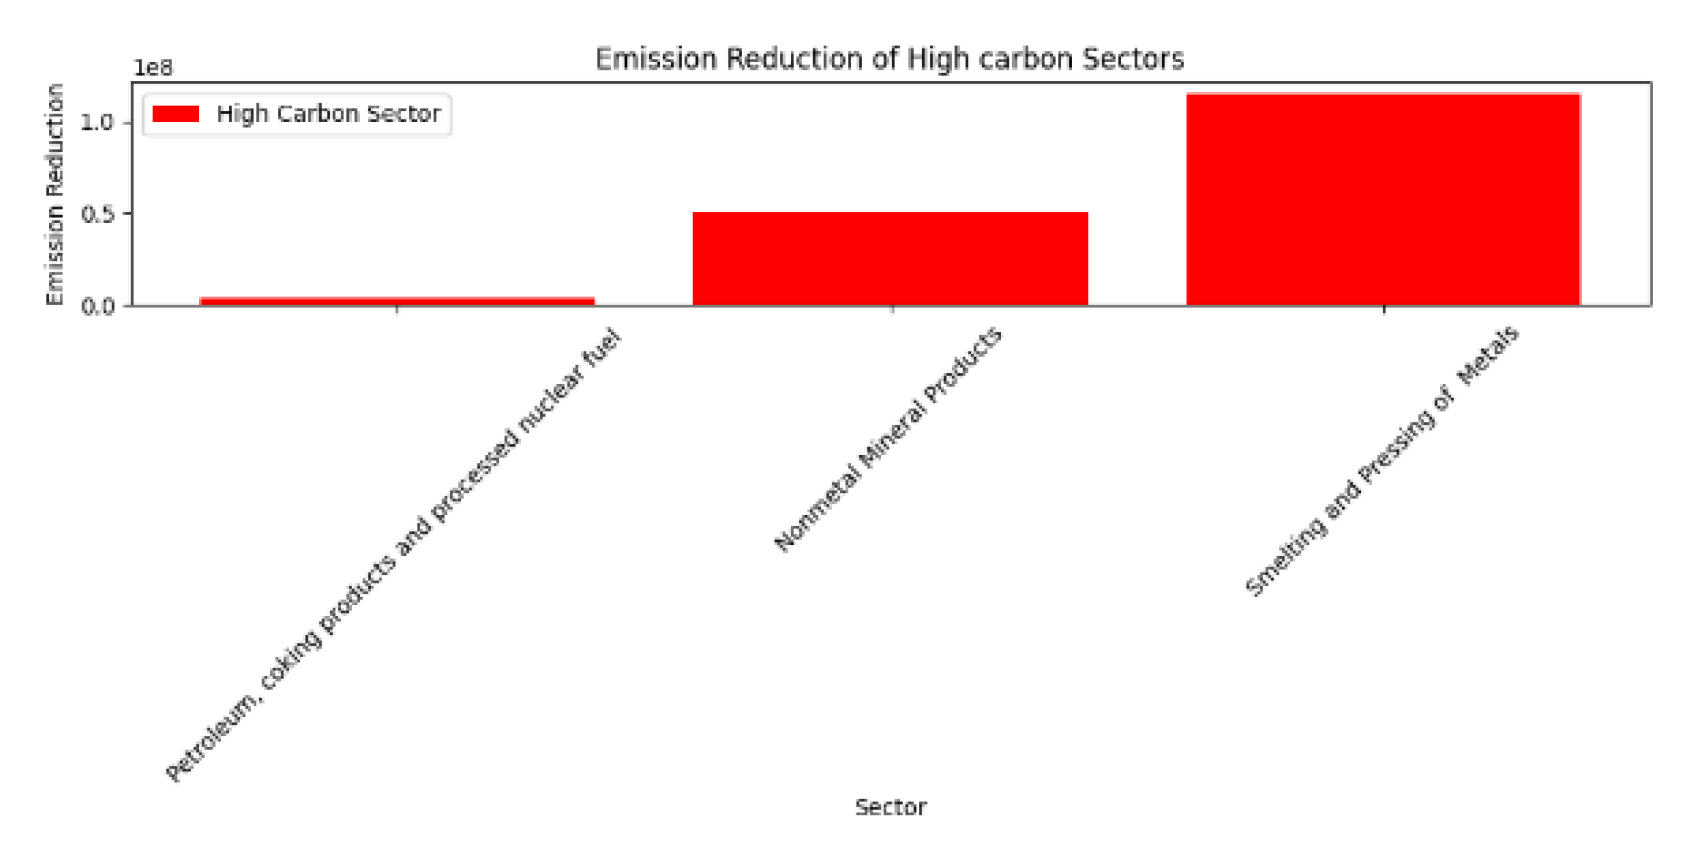
Table 3.
The result of EEIO Scenario Simulation of High Carbon Sector.
| Non-high Carbon Sector | |||
| Sectors | Carbon Emission Factor (tons/ten thousand yuan) | Emission Reduction(tons) | Contribution Rate |
| Food and Tobacco Processing | 0.0141 | 445695 | 0.12% |
| Textile Industry | 0.0548 | 1440923 | 0.40% |
| Textile Clothing Shoes and Hats Leather Down and its products | 0.0090 | 180762 | 0.05% |
| Woodwork and Furniture | 0.0063 | 100477 | 0.03% |
| Paper, printing and stationery | 0.0513 | 1965939 | 0.55% |
| Chemical products | 0.0144 | 1885076 | 0.52% |
| Metal Products | 0.0153 | 456614 | 0.13% |
| Ordinary Machinery | 0.0304 | 723410 | 0.20% |
| Equipment for Special Purposes | 0.0062 | 90056 | 0.03% |
| Transportation Equipment | 0.0065 | 164325 | 0.05% |
| Electric Equipment and Machinery | 0.0086 | 338039 | 0.09% |
| Telecommunications Equipment, Computers and Other Electronic equipment | 0.0035 | 648109 | 0.18% |
| Instrumentation Machinery | 0.0133 | 101559 | 0.03% |
| Other manufacturing products | 0.0272 | 582708 | 0.16% |
Figure 3.
Emission Reduction of None-High Carbon Sectors.

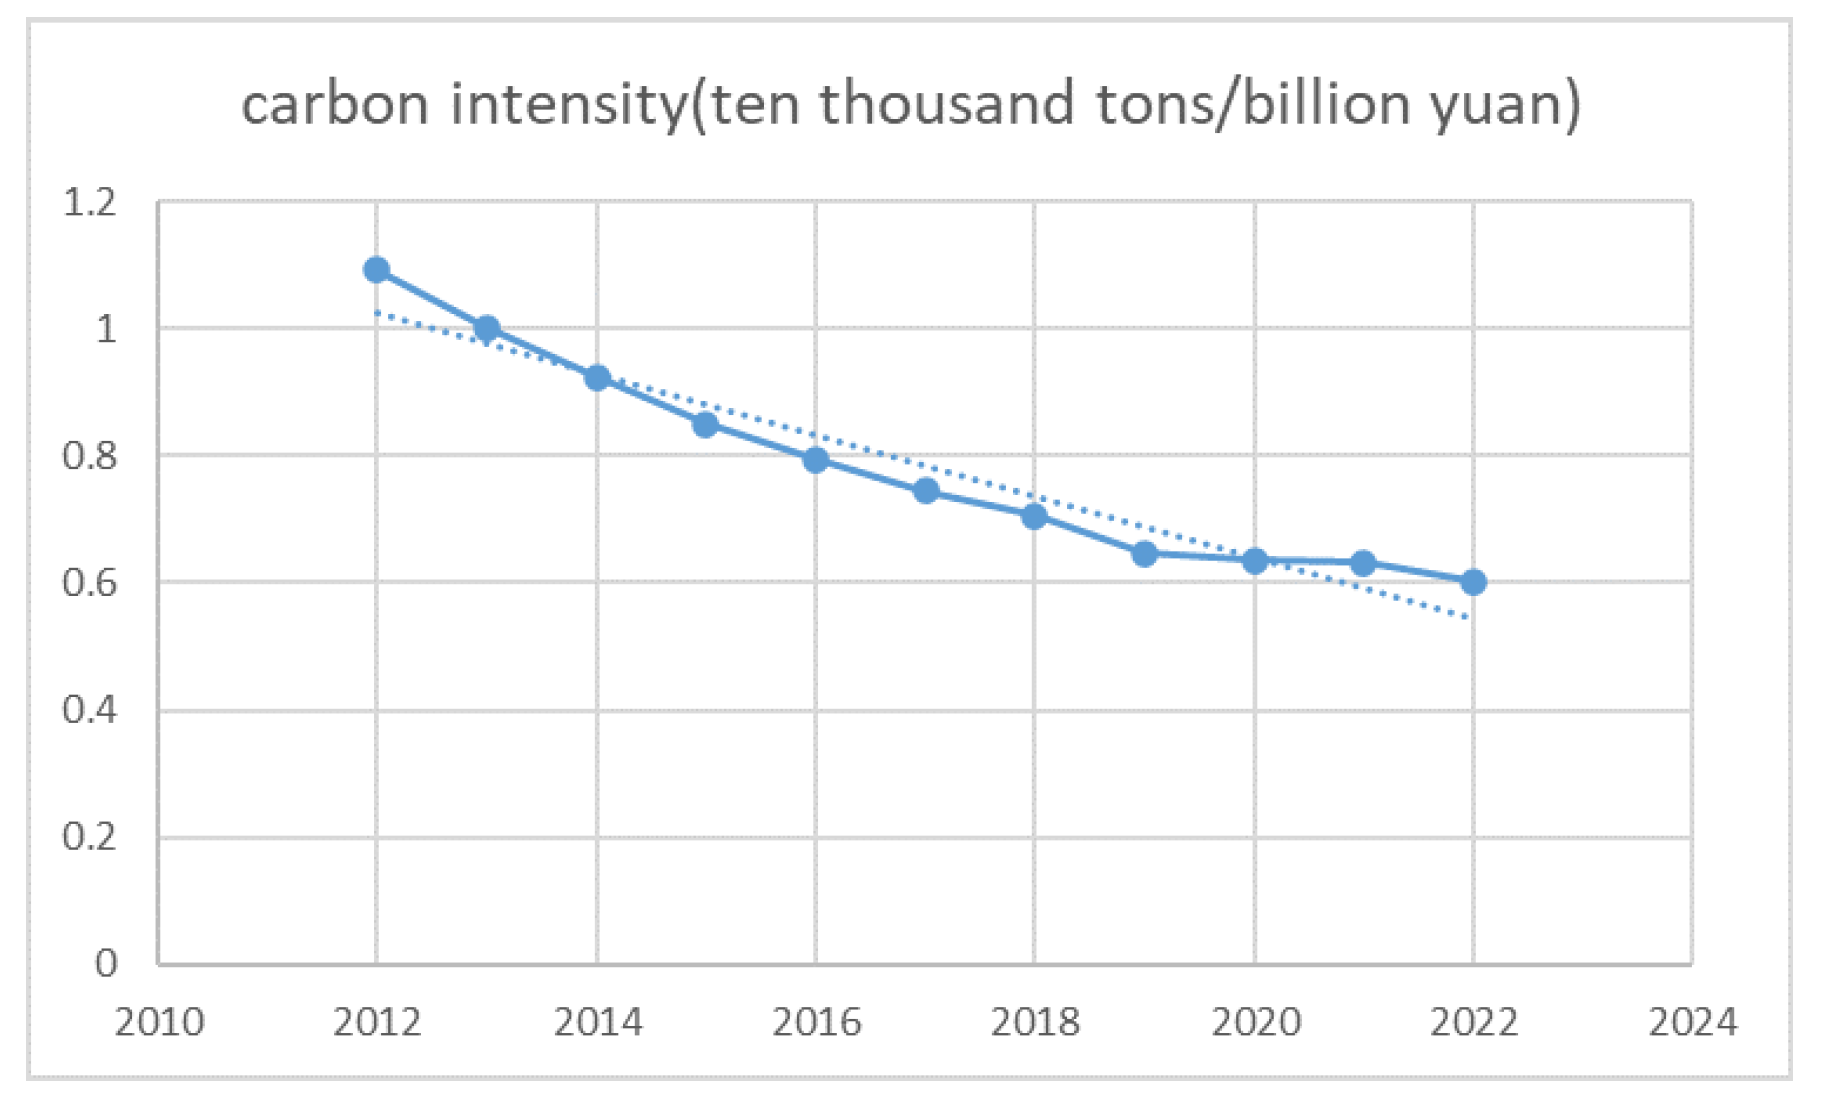
Figure 4.
Carbon Intensity of Guangdong from 2012 to 2022.
Among the high-carbon industries, the metal smelting and rolling industry has a carbon emission reduction of 114,984,400 tons, and the contribution of digitization to the reduction of carbon emissions is 31.90%, which occupies a dominant role in the overall carbon emission reduction. The smelting and rolling industry, on the other hand, has a high carbon emission intensity and usually involves energy-intensive production processes. This suggests that the digital transformation of this industry is relatively successful in reducing carbon emissions, not only in terms of having a significant impact on emissions reduction, but also in terms of leading the trend of carbon emissions for the industry as a whole.
The nonmetal mineral production industry has a carbon reduction of 50,613,240 tons in the simulation, with a digital reduction contribution of 14.05%. This industry involves the production of building materials like cement, and these processes are often accompanied by a large amount of carbon emissions, so it has a high carbon emission intensity of up to 0.98. However, the contribution rate is relatively low compared with that of metal smelting, which proves that its digitization degree needs to be improved and there is still a large space for development. Especially in the cement industry, as one of the world’s largest sources of carbon emissions, it is still difficult to reduce emissions, but through the continuous introduction of digital technology and the use of green building materials, it will further reduce the level of emissions.
As for non-high-carbon industries, including the food processing and textile industries, the carbon intensity of these industries is usually lower relative to high-carbon industries, and the contribution of digitization to carbon emission reductions is more insignificant. In the food industry and the textile industry, the carbon emission intensity is 0.0141 and 0.0548 in industry, with carbon emission reductions of 447,890.1 tons and 144,092,323 tons, contributing 0.12% and 0.4% respectively. Both industries have a relatively distribution and are difficult to achieve large-scale application of digital technology and centralized production, which restricts the role of digital technology to a certain extent. However, compared to the food industry, the textile industry involves a large number of dyeing and weaving processes, which consume a large amount of energy and have high carbon emissions. With the introduction of digital technologies such as automated production lines, smart logistics and data-driven energy management, there has been a significant reduction in emissions in the industry. However, the reduction is relatively more limited compared to high carbon industries. In industries such as furniture production and instrument and equipment production, the contribution rates are at low values, which proves that digitalization still needs to be further developed in these industries.
From the comparative analysis of high-carbon and non-high-carbon industries, although high-carbon industries face greater emission reduction challenges, their carbon emission reduction and contribution rate tend to be larger due to their higher carbon emission factors and the effectiveness of emission reduction measures. Non-high-carbon industries, on the other hand, have relatively low abatement potential, despite their low carbon emission intensity and relatively small contribution rate.
Conclusion and Policies According to the results, digitization in high-carbon sectors has a more significant impact and contribution to carbon emission reduction, while in non-high-carbon sectors, the contribution value is relatively small. On the one hand, the carbon emission base of high-carbon sectors is larger and the reduction effect is significant; on the other hand, the production of high-carbon enterprises under this classification is more concentrated and it is easier to carry out digitalization.
From the comparative analysis of high-carbon and non-high-carbon industries, although high-carbon industries face greater emission reduction challenges, their carbon emission reduction and contribution rate tend to be larger due to their higher carbon emission factors and the effectiveness of emission reduction measures. Non-high-carbon industries, on the other hand, have relatively low abatement potential, despite their low carbon emission intensity and relatively small contribution rate.
4. Conclusion and Policies
4.1. Research Conclusions and Policy Recommendations
Digitalization is a major direction for the further development of the manufacturing industry, and it is very necessary to achieve energy saving, emission reduction and production efficiency improvement. However, in order to achieve a more efficient digital transformation, specific problems should also be analyzed, and corresponding development goals and support policies should be formulated for the characteristics of different industries. In this paper, by using the EEIO model, we analyze the positive influence of digital transformation on carbon emissions and industry output value of manufacturing industries in Guangdong Province in 2012 and 2017, and quantitatively calculate the contribution rate of the two years for separate comparisons, to observe the emission reduction and output value increase of each industry as the digitalization process continues to develop.
(1) The impact of digital transformation on high-carbon enterprises is particularly significant.
Carbon emissions from manufacturing industries in Guangdong Province are mainly concentrated in the metal smelting and rolling processing and non-metal mineral products industries, and the contribution of digitization to the reduction of carbon emissions in these two industries reached 31.91% and 14.05% respectively in 2017, far exceeding that of other industries. On the one hand, this shows that the traditional heavy industry is still the main source of carbon emissions in the manufacturing industry of Guangdong Province, and on the other hand, it also shows that the introduction of digitalization technology has greatly improved the carbon emissions of this type of industry. We should pay more attention to the digitalization of these industries, carry out further industrial upgrading, optimize the production structure, and provide policy support and subsidies for the digitalization of these industries.
(2) Highly digitalized industries (such as the electronic equipment manufacturing industry) have relatively small reductions in carbon emissions, but have a greater contribution to the growth of output value.
Electronic equipment manufacturing industry itself energy-saving effect is obvious, usually using more advanced production technology and automation system, energy efficiency level is already higher, so after the digital transformation, the carbon emissions per unit of output value is not reduced; at the same time, this type of industry has a large potential for growth in output value, digital technology can significantly improve the production efficiency, optimize the management process, so that the industry’s output value has been greatly improved; has certain industrial positioning advantages, such as the chemical industry in Guangdong, the industry has a large contribution to the growth of output value. Positioning advantages, such as Guangdong’s chemical industry to pharmaceutical production, its products and processes are more in line with the high digital standards, so its performance in the low-carbon transition is more excellent.
(3) Textile and other industries are less affected by digitization.
Due to the industry’s own production characteristics, it is difficult to centralize production and standardize operations, and the textile industry faces greater challenges in introducing advanced digital management, automated equipment or smart manufacturing systems, resulting in a lower overall level of digitization. At the same time, digitalization can usually improve production efficiency, optimize resource allocation, and thus reduce carbon emissions per unit of output. For industries with a low level of digitization, this effect is weaker and the reduction in carbon emissions is relatively small.
First, digitalization is an inevitable choice for industries to adapt to sustainable development. Enterprises should actively take advantage of this opportunities by integrating digital transformation into both strategic planning and production processes. Greater importance should be placed on upgrading production systems through digital technologies, putting digitalization into long-term strategies. Simultaneously, governmental support is also essential. Continued investment in industrial digital infrastructure and policy incentives for the digital upgrading of enterprises will play a c critical role in promoting the sustainable evolution.
For high-carbon industries, the integration of digitalization and green low-carbon technologies should be strengthened. Focus on supporting high-carbon industries such as metal smelting and non-metallic mineral products to adopt more big data and IoT to assist production, improve energy efficiency, optimize efficiency, and reduce carbon emissions and waste pollution. Establish a digital platform to provide a communication platform for advanced digital technologies such as IoT and 5G, making these technologies more accessible to enterprises for business development, while promoting further enhancement of the technologies in practice. In particular, they can be applied to capacity enhancement, such as real-time monitoring and control systems at the production line. Enterprises should also take action to learn and acquire new technologies, improve their internal digitalization level, and look for technologies that are more suitable for the development of the enterprise, so as to achieve the goal of emission reduction and comply with the economic trend of sustainable development.
Meanwhile, the digital upgrades of the low-carbon industry should not be neglected, specifically, the production capacity of the low-carbon industry should be further upgraded, and its influence in the whole industrial chain should be expanded, so as to play a leading role in the low-carbon industry. Utilize new digital technology to enhance the production efficiency and added value of products in low-carbon industries, and at the same time encourage and attract talents to participate in the research and development and promotion of these new technologies, so as to land and apply advanced technologies in low-carbon industries and form a demonstration effect, thus driving the green upgrading and low-carbon transformation of the entire industrial chain. Promote the linkage policy of digitization and carbon emission, combining digitization and carbon emission together.
4.2. Research Limitations and Future Outlook
As the latest version of the 2022 input-output table has not yet been released, this study uses the make 2012 and 2017 input-output table, which fails to cover the latest digitalization change trends. In the future, the key aspects of digitization can be tracked dynamically with the latest data of 2022.
This study mainly conducts static input-output analysis and lacks comparison of changes in digitization in dynamic time. In the future, dynamic input-output models can be used, or linear regression models can be used to assist the study to explore the long-term impact of digitization on the industry’s carbon emissions and output value.
Supplementary Materials
The following supporting information can be downloaded at the website of this paper posted on Preprints.org: https://www.ceads.net.cn/; https://www.szse.cn/disclosure/index.html; https://www.csmar.com/channels/31.html
Author Contributions
Conceptualization, writing—review and editing, Jiao Jingren and Mizunoya Takeshi; Methodology, software, validation, formal analysis, investigation, resources, data curation, writing—original draft preparation, visualization, Jiao Jingren; supervision, project administration, funding acquisition, Helmut Yabar. All authors have read and agreed to the published version of the manuscript.
Funding
This research received no external funding
Data Availability Statement
We encourage all authors of articles published in MDPI journals to share their research data. In this section, please provide details regarding where data supporting reported results can be found, including links to publicly archived datasets analyzed or generated during the study. Where no new data were created, or where data is unavailable due to privacy or ethical restrictions, a statement is still required. Suggested Data Availability Statements are available in section “MDPI Research Data Policies” at https://www.mdpi.com/ethics.
Acknowledgments
In this section, you can acknowledge any support given which is not covered by the author contribution or funding sections. This may include administrative and technical support, or donations in kind (e.g., materials used for experiments).
Conflicts of Interest
The authors declare no conflicts of interest.
Abbreviations
The following abbreviations are used in this manuscript:
| GHG | Green House Gas |
| IEA | International Energy Agency |
| CEAD | China Emission Accounts and Datasets |
| SDA | Structural Decomposition Analysis |
| EEIO | Environmentally-Extended Input-Output |
Appendix A
Appendix A.1
Table A1.
Input-Output Tables for Guangdong Province, 2012 .
| Other Sectors | Food and Tobacco Processing | Textile Industry | Textile Clothing Shoes and Hats Leather Down and its products | Woodwork and Furniture | Paper, printing and stationery | Petroleum, coking products and processed nuclear fuel | Chemical products | Nonmetal Mineral Products |
| 10803122 | 18012718 | 160725 | 1766808 | 1638052 | 8600214 | 20456886 | 18243129 | 16869512.29 |
| 18012718 | 19043203 | 27310 | 578836 | 87707 | 357365 | 682 | 1021115 | 13467.83646 |
| 160725 | 20953 | 10331840 | 10627747 | 263206 | 739157 | 9326 | 442654 | 67565.12628 |
| 1766808 | 39917 | 140111 | 18050970 | 778543 | 499295 | 8644 | 213069 | 82736.45562 |
| 1638052 | 37487 | 11335 | 4226 | 6587696 | 393768 | 2550 | 25586 | 259973.9377 |
| 8600214 | 1220447 | 106319 | 690825 | 458024 | 15905058 | 14367 | 1453168 | 707554.5118 |
| 20456886 | 80183 | 61209 | 109154 | 387220 | 449664 | 8886934 | 4171999 | 1261996.291 |
| 18243129 | 1806391 | 3001232 | 5000307 | 1314942 | 7776336 | 1974371 | 55634866 | 3185942.552 |
| 16869512 | 272896 | 217 | 19544 | 620168 | 125176 | 4165 | 286628 | 9915032.929 |
| 8699518 | 10824 | 15355 | 76947 | 739963 | 13360826 | 0 | 687319 | 579556.0654 |
| 8003489 | 619058 | 116454 | 153327 | 1368905 | 548764 | 5803 | 1245068 | 295300.3958 |
| 1173533 | 34541 | 45809 | 117922 | 63430 | 147947 | 796 | 760041 | 118157.8579 |
| 3346361 | 285026 | 65846 | 530360 | 40207 | 297965 | 22466 | 2110491 | 158300.747 |
| 1755843 | 2910 | 2227 | 6201 | 1780 | 5008 | 421 | 5554 | 7675.104688 |
| 5435455 | 5594 | 1645 | 19150 | 24592 | 772354 | 240 | 202421 | 34932.76037 |
| 20359795 | 6397 | 5978 | 8788 | 46341 | 4430097 | 880 | 202954 | 35226.08003 |
| 3695275 | 1795 | 141 | 148 | 1129 | 16270 | 401 | 6839 | 44127.78412 |
| 665073.0294 | 9150.861 | 6017.922 | 26891.98 | 421.1396 | 44896.08 | 4.3191 | 4866.764 | 4298.034431 |
| Nonmetal Mineral Products | Smelting and Pressing of Metals | Metal Products | Ordinary Machinery | Equipment for Special Purposes | Transportation Equipment | Electric Equipment and Machinery | Telecommunications Equipment, | Instrumentation Machinery |
| 16869512.29 | 8699518 | 8003489 | 1173533 | 3346361 | 1755843 | 5435455 | 20359795 | 3695275 |
| 13467.83646 | 7481.968 | 23296.52 | 8780.34 | 8050.552 | 6058.593 | 27384.83 | 33155.64 | 1774.914 |
| 67565.12628 | 15639.41 | 31904.42 | 19638.51 | 5922.402 | 115082.6 | 10917.5 | 28530.14 | 1503.439 |
| 82736.45562 | 65391.51 | 160097.2 | 38331.02 | 103488.8 | 142914 | 77939.83 | 49866.2 | 17747.82 |
| 259973.9377 | 18107.97 | 253948.2 | 41898.98 | 20639.17 | 52255.25 | 83468.02 | 161478.3 | 3691.901 |
| 707554.5118 | 83730.83 | 565247.3 | 323890.3 | 62914.86 | 228018.5 | 1845824 | 538909.1 | 50901.28 |
| 1261996.291 | 983370.3 | 515997.2 | 153708.8 | 31829.55 | 102921.9 | 158789.4 | 195668.5 | 8386.591 |
| 3185942.552 | 1349378 | 2773798 | 1315258 | 1395942 | 2048274 | 6096270 | 2933351 | 141673.6 |
| 9915032.929 | 287258.4 | 181457.9 | 285560 | 41350.8 | 126221.3 | 1331555 | 2829368 | 144901.2 |
| 579556.0654 | 26809814 | 18937751 | 3956352 | 2064960 | 4048100 | 20743179 | 4055704 | 645034.8 |
| 295300.3958 | 54483.46 | 11017134 | 1539455 | 684332.2 | 261097.3 | 2843489 | 1312469 | 132774.7 |
| 118157.8579 | 215920.6 | 291790 | 8427733 | 999006.1 | 1511473 | 4935654 | 1557527 | 153509 |
| 158300.747 | 26449 | 226599.1 | 391294.6 | 4374516 | 258538.1 | 1704138 | 1830711 | 70226.54 |
| 7675.104688 | 2071.779 | 21643.84 | 3669.804 | 268989.7 | 27916297 | 7332.644 | 1711.752 | 764.4908 |
| 34932.76037 | 153899.8 | 193199.3 | 2097231 | 1046769 | 1152965 | 19586183 | 7611000 | 696607.7 |
| 35226.08003 | 5054.854 | 116142.3 | 6789660 | 2037272 | 1761126 | 15727202 | 1.65E+08 | 2343635 |
| 44127.78412 | 591.7538 | 9951.925 | 135573.3 | 172722.7 | 34520.32 | 168553.3 | 226515.1 | 867952.5 |
| 4298.034431 | 10.48424 | 36238.16 | 1167.404 | 28.1403 | 32622.88 | 22939.39 | 27411.01 | 1223.708 |
| Other manufacturing products and scrap waste | Final Demand | Total Output | f | |||||
| 665073.0294 | 456151960.9 | 6.84E+08 | 0.574927 | |||||
| 441.1856918 | 31536557.12 | 61543528.11 | 0.027075 | |||||
| 31006.59189 | 9581156.728 | 25438350.13 | 0.136994 | |||||
| 2716.082201 | 44061213.67 | 62016113.22 | 0.022447 | |||||
| 628.0850725 | 17326181.34 | 23358394.78 | 0.015434 | |||||
| 23851.76764 | 50607783.67 | 73150707.43 | 0.076928 | |||||
| 44762.41906 | 31911744.67 | 37910257.4 | 0.136139 | |||||
| 407096.08 | 53051392.37 | 119158413.9 | 0.015494 | |||||
| 2055.536838 | 13649353.09 | 39625898.36 | 1.26907 | |||||
| 277813.3173 | 19453405.62 | 54742578.09 | 0.694522 | |||||
| 418374.9577 | 28975871.39 | 54904166.08 | 0.030532 | |||||
| 6620.149463 | 35237188.28 | 38150809.13 | 0.031665 | |||||
| 1201.095382 | 16941474.39 | 21995769.23 | 0.016134 | |||||
| 102.498793 | 49319477.64 | 59469797.15 | 0.01284 | |||||
| 20265.6197 | 93466951.55 | 109239365.9 | 0.015522 | |||||
| 785942.6968 | 173076390.7 | 250432581.4 | 0.007809 | |||||
| 237.6688498 | 12438687.68 | 8262611.774 | 0.027727 | |||||
| 165208.4433 | 2508628.703 | 3250298.839 | 1.429921 | |||||
Table A2.
Input-Output Tables for Guangdong Province, 2017.
| Other Sectors | Food and Tobacco Processing | Textile Industry | Textile Clothing Shoes and Hats Leather Down and its products | Woodwork and Furniture | Paper, printing and stationery | Petroleum, coking products and processed nuclear fuel | Chemical products | Nonmetal Mineral Products | |
| 403850902 | 32881164 | 6182629 | 13367711 | 9604617 | 14418026 | 10203591 | 26099463 | 18626789.14 | |
| 21166471 | 18908530 | 68009 | 1076044 | 104889 | 74807 | 61773 | 492539 | 236314.1759 | |
| 414644 | 43624 | 14328827 | 22291025 | 871632 | 1753946 | 2587 | 511610 | 234403.9337 | |
| 2330402 | 45779 | 585540 | 13553300 | 368823 | 716691 | 21840 | 518664 | 126473.7718 | |
| 2208440 | 185635 | 160240 | 77978 | 9612795 | 1260307 | 169 | 533144 | 805449.1197 | |
| 11154357 | 1207992 | 480297 | 1595982 | 1364631 | 25996301 | 20414 | 3005962 | 1397380.122 | |
| 13946671 | 52403 | 60599 | 101475 | 135636 | 135310 | 5564807 | 4397845 | 875324.0842 | |
| 23860532 | 1753251 | 2765344 | 10343186 | 3224009 | 8050132 | 208878 | 69036210 | 6043620.967 | |
| 47306877 | 250711 | 55821 | 108176 | 325654 | 525196 | 680 | 1265490 | 13768527.63 | |
| 820860 | 6191 | 13598 | 113777 | 993932 | 6310342 | 1911 | 2899753 | 1452761.837 | |
| 10331336 | 1080390 | 220933 | 896113 | 1470489 | 1167312 | 4334 | 983823 | 843028.5798 | |
| 1374191 | 27827 | 84484 | 21520 | 319439 | 190835 | 9551 | 126551 | 995418.3862 | |
| 1099417 | 14437 | 25535 | 592969 | 190737 | 610378 | 23409 | 414208 | 93354.8344 | |
| 1326550 | 1452 | 2864 | 3299 | 2172 | 4206 | 2814 | 4237 | 6138.5632 | |
| 7504159 | 6388 | 11592 | 23436 | 61703 | 404051 | 1125 | 81821 | 60632.6828 | |
| 7002694 | 5908 | 4714 | 17536 | 8174 | 3646468 | 1693 | 889349 | 256708.1426 | |
| 3946537 | 1537 | 1157 | 59 | 64 | 35783 | 4076 | 8269 | 193674.9267 | |
| 7201298.578 | 14772.25 | 4067.437 | 209323 | 4992.34 | 5570702 | 23.9232 | 2863200 | 318935.8704 | |
| Smelting and Pressing of Metals | Metal Products | Ordinary Machinery | Equipment for Special Purposes | Transportation Equipment | Electric Equipment and Machinery | Telecommunications Equipment, Computers and Other Electronic equipment | Instrumentation Machinery | ||
| 8743253 | 10034218 | 5514641 | 5153966 | 11547822 | 17124506 | 28137998 | 1285732 | ||
| 16802.13 | 127132.3 | 94000.96 | 53675.43 | 81144.97 | 175647.9 | 699731.7 | 33560.36 | ||
| 7392.89 | 116434.4 | 61192.54 | 87548.48 | 59236.44 | 160289.1 | 287112.7 | 20534.07 | ||
| 73438.58 | 106289.2 | 50047.75 | 95100.35 | 273346.1 | 96327.15 | 199132.6 | 19928.8 | ||
| 666773.3 | 745352.1 | 163076.9 | 193029.9 | 298832.2 | 409444 | 372886.4 | 7762.236 | ||
| 74528.38 | 1329107 | 447348.9 | 428409.6 | 243500.4 | 1732980 | 2713651 | 103827.6 | ||
| 234606 | 454396.3 | 107177.8 | 75051.64 | 157488.8 | 171692.1 | 129245 | 8213.921 | ||
| 686881.2 | 4162191 | 1585620 | 1978111 | 3431477 | 9789363 | 9969751 | 173094.2 | ||
| 115175.2 | 1037865 | 953070.6 | 292118.7 | 46670.22 | 1265257 | 11618395 | 420878.8 | ||
| 35176008 | 33206339 | 8782648 | 7096128 | 10985506 | 26112504 | 7911635 | 396227.7 | ||
| 112875 | 12781977 | 3816035 | 1734535 | 1591709 | 8912062 | 2507639 | 165380.8 | ||
| 45614.37 | 3539878 | 12579541 | 3083253 | 3617492 | 3940170 | 2501799 | 360517 | ||
| 13223.82 | 52358.78 | 534028 | 4056368 | 147706.8 | 945081.7 | 4934084 | 190492.6 | ||
| 4259.311 | 61765.82 | 19732.8 | 13243.07 | 35474360 | 728288.8 | 327829.9 | 1017.049 | ||
| 124063.7 | 199962 | 3122934 | 1776934 | 1402260 | 24315263 | 8082311 | 300583.1 | ||
| 11730.04 | 222410.2 | 3167150 | 1733787 | 779849.9 | 10136994 | 2.25E+08 | 3165307 | ||
| 5744.282 | 815.1082 | 499080.9 | 801303.6 | 63783.77 | 280041.2 | 1430413 | 1624292 | ||
| 2267158 | 244364.6 | 19387.07 | 9735.512 | 634694.2 | 47758.05 | 24288.34 | 911.2901 | ||
| Other manufacturing products and scrap waste | Final Demand | Total Output | f | ||||||
| 948777.8926 | 814793447.5 | 1140800857.8622 | 0.3806171 | ||||||
| 5716.1697 | 67248633.1 | 74115326.75 | 0.014123 | ||||||
| 157415.7289 | 19454301.41 | 31625292.63 | 0.054789 | ||||||
| 183826.944 | 83975304.81 | 84192618.54 | 0.008951 | ||||||
| 23168.1139 | 32268566.2 | 37019037.26 | 0.006312 | ||||||
| 161849.3282 | 63441911.78 | 89990616.19 | 0.051325 | ||||||
| 68575.0155 | 15410153.83 | 23955106.64 | 0.183462 | ||||||
| 700132.5177 | 84802630.59 | 146100301.7 | 0.014438 | ||||||
| 10924.6678 | 25872441.34 | 59375197.87 | 0.980368 | ||||||
| 2035936.961 | 27966274.04 | 60012916.32 | 0.712886 | ||||||
| 63691.6807 | 47025205.4 | 86269872.22 | 0.015279 | ||||||
| 26881.2829 | 50777884.7 | 53066298.79 | 0.030402 | ||||||
| 12684.9635 | 49539268.61 | 39005228.58 | 0.006194 | ||||||
| 258.5803 | 81457080 | 89695566.21 | 0.00645 | ||||||
| 114156.6272 | 124722964.4 | 136206346.7 | 0.008589 | ||||||
| 562737.8609 | 279534496.5 | 382487753.7 | 0.003482 | ||||||
| 68655.8619 | 16639027.43 | 11126103.64 | 0.013292 | ||||||
| 1919490.334 | 12013111.99 | 16806188.55 | 0.027218 | ||||||
Table A3.
Carbon Emission Intensity of Guangdong Province, 2012-2022.
| year | Carbon emissions (million tons CO2e) | GDP(billion dollars) | Carbon emission intensity (tons/billion dollars) |
| 2012 | 62253.41 | 57007.7 | 1.092018 |
| 2013 | 62637.52 | 62503.4 | 1.002146 |
| 2014 | 63078.54 | 68173 | 0.925272 |
| 2015 | 63485.74 | 74732.4 | 0.849508 |
| 2016 | 65295.89 | 82163.2 | 0.79471 |
| 2017 | 68253.42 | 91648.7 | 0.744729 |
| 2018 | 70549.51 | 99945.2 | 0.705882 |
| 2019 | 69855.48 | 107987 | 0.646888 |
| 2020 | 70717.62 | 111152 | 0.636224 |
References
- Raymond Murphy, What is undermining climate change mitigation? How fossil-fuelled practices challenge low-carbon transitions, Energy Research & Social Science, Volume 108,2024,103390,ISSN 2214-6296,https://doi.org/10.1016/j.erss.2023.103390.
- IEA (2024), CO2 Emissions in 2023, IEA, Paris https://www.iea.org/reports/co2-emissions-in-2023,Licence: CC BY 4.0.
- 2024; 95, 3. Yuhong Tang, Qi Zhao, Yuheng Ren, Nexus among government digital development, resource dependence, and carbon emissions in China,Resources Policy, Volume 95, 2024, 105186, ISSN 0301-4207,https://doi.org/10.1016/j.resourpol.2024.105186. [CrossRef]
- Shanyong Wang, Rongwei Zhang, Yejun Yang, Jiusong Chen, Shu Yang, Has enterprise digital transformation facilitated the carbon performance in Industry 4.0 era? Evidence from Chinese industrial enterprises, Computers & Industrial Engineering, Volume 184, 2023, 109576, ISSN 0360-8352, https://doi.org/10.1016/j.cie.2023.109576.
- 2050; 5. Guangyue Xu, Haoyun Dong, Zhenci Xu, Nishan Bhattarai, China can reach carbon neutrality before 2050 by improving economic development quality, Energy, Volume 243,2022,123087,ISSN 0360-5442,https://doi.org/10.1016/j.energy.2021.123087. [CrossRef]
- The State Council of China, ACTION PLAN FOR CARBON DIOXIDE PEAKING BEFORE 2030[EB/OL](2021-10-24) [2025-3-28], https://en.ndrc.gov.cn/policies/202110/t20211027_1301020.html.
- Cui Huiming,Chen Lin. “Intelligent manufacturing in the strategy of ”Made in China 2025"[J]. Science and Technology Economy Market 2022,(04):7-9.
- Guangdong Provincial Bureau of Statistics Guangdong Province Fifth National Economic Census Leading Group Office. Bulletin of the Fifth National Economic Census of Guangdong Province (No. 1) [N]. Nanfang Daily, 2025-03-13(A07).
- Li Tianren, Huang Sufeng, Does digital-industrial technology integration reduce corporate carbon emissions?, Environmental Research, Volume 257,2024,119313,ISSN 0013-9351,https://doi.org/10.1016/j.envres.2024.119313.
- A: Guo, Tao Li, Bowen Shi, Hongchao Zhang, Economic impacts and carbon emissions of electric vehicles roll-out towards 2025 goal of China, 2025; 31, 10. Zhiwei Guo, Tao Li, Bowen Shi, Hongchao Zhang, Economic impacts and carbon emissions of electric vehicles roll-out towards 2025 goal of China: An integrated input-output and computable general equilibrium study, Sustainable Production and Consumption, Volume 31, 2022,Pages 165-174,ISSN 2352-5509,https://doi.org/10.1016/j.spc.2022.02.009. [CrossRef]
- WU Fei, HU Huizhi, LIN Huiyan, et al. Corporate digital transformation and capital market performance - Empirical evidence from stock liquidity[J]. Management World 2021,37(7):130-144. DOI:10.3969/j.issn.1002-5502.2021.07.010.
- LI Yingmei, JIAO Wanru, YANG Zhonghai. Enterprise digital transformation and auditor risk decision making[J]. Finance and Accounting Monthly 2023,44(19):111-119. DOI:10.19641/j.cnki.42-1290/f.2023.19.015.
- ZHOU Jinghua, HE Wanhong, LIU Jiayu. The Construction Path of Modernized Industrial System in Guangdong[J]. Sichuan Province ,2025,(01):56-58.
- Huang Lichun. Research on the Path of Digital Transformation and Development of Guangdong Manufacturing Cluster[J]. Science, Technology and Finance.2024,(07):13-19.
- Jingke Hong, He Huang, Xianzhu Wang, Bertie Dockerill, Jiexu Ye, Shihan Zhang, Structural effects of provincial digital economy on carbon emissions within China: A multi-region input-output based structural decomposition analysis, Science of The Total Environment, Volume 934,2024,173140,ISSN 0048-9697,https://doi.org/10.1016/j.scitotenv.2024.173140.
- Zhiwei Guo, Tao Li, Bowen Shi, Hongchao Zhang, Economic impacts and carbon emissions of electric vehicles roll-out towards 2025 goal of China: An integrated input-output and computable general equilibrium study, Sustainable Production and Consumption, Volume 31, 2022, Pages 165-174, ISSN 2352-5509,https://doi.org/10.1016/j.spc.2022.02.009.
- Yuanjie Li, Na Li, Zibiao Li, Evolution of carbon emissions in China’s digital economy: An empirical analysis from an entire industry chain perspective, Journal of Cleaner Production, Volume 414,2023,137419,ISSN 0959-6526,https://doi.org/10.1016/j.jclepro.2023.137419.
- Bin Dou, SongLin Guo, XiaoChen Chang, Yong Wang, Corporate digital transformation and labor structure upgrading, International Review of Financial Analysis, Volume 90, 2023, 102904, ISSN 1057-5219, https://doi.org/10.1016/j.irfa.2023.102904.
- Tingting Bai, Yong Qi, Zihao Li, Dong Xu, Digital economy, industrial transformation and upgrading, and spatial transfer of carbon emissions: The paths for low-carbon transformation of Chinese cities, Journal of Environmental Management, Volume 344, 2023, 118528, ISSN 0301-4797, https://doi.org/10.1016/j.jenvman.2023.118528.
- Minglong Zhang, Yin Liu, Influence of digital finance and green technology innovation on China’s carbon emission efficiency: Empirical analysis based on spatial metrology, Science of The Total Environment, Volume 838, Part 3, 2022, 156463, ISSN 0048-9697, https://doi.org/10.1016/j.scitotenv.2022.156463.
- China Academy of Information and Communications Technology, CHINA DIGITAL ECONOMY DEVELOPMENT WHITE PAPER[EB/OL] (2017-07-13)[2025-3-28], https://www.cac.gov.cn/files/pdf/baipishu/shuzijingjifazhan.pdf.
Disclaimer/Publisher’s Note: The statements, opinions and data contained in all publications are solely those of the individual author(s) and contributor(s) and not of MDPI and/or the editor(s). MDPI and/or the editor(s) disclaim responsibility for any injury to people or property resulting from any ideas, methods, instructions or products referred to in the content. |
© 2025 by the authors. Licensee MDPI, Basel, Switzerland. This article is an open access article distributed under the terms and conditions of the Creative Commons Attribution (CC BY) license (http://creativecommons.org/licenses/by/4.0/).
Copyright: This open access article is published under a Creative Commons CC BY 4.0 license, which permit the free download, distribution, and reuse, provided that the author and preprint are cited in any reuse.


