
Submitted:
10 June 2025
Posted:
11 June 2025
You are already at the latest version
Abstract
Seeking mastery across Key Stages Three, Four, and Five, this paper looks at the creative use of music as an educational tool for statistics teaching. Challenges with student engagement, conceptual grasp, and the perception of statistics as abstract and difficult often beset conventional statistical education. This method aims to improve cognitive processing, broaden conceptual understanding, and promote a more pleasurable and accessible learning environment by including musical components—such as rhythm, melody, harmony, and structure—into the curriculum. Based on ideas of mastery learning, cognitive psychology, and multiple intelligences, this article offers practical techniques for including music to teach main statistical ideas from basic data processing in KS3 to inferential statistics in KS5. It claims that a music-enriched strategy can revolutionize mathematics teaching, encouraging not just rote memorization but actual conceptual understanding, critical thinking, and a good attitude toward quantitative reasoning—thus embodying a genuine next-generation approach to mathematics instruction.
Keywords:
statistics education
; music integration
; mastery learning
; next-generation teaching
; key stage three
; key stage four
; key stage five
; mathematics pedagogy
; cognitive engagement
; interdisciplinary learning
1. Introduction
Particularly in courses seen as difficult or abstract, such as statistics, the environment of contemporary education calls for creative strategies that go beyond conventional ones. Although many students have problems grasping its basic ideas—often because of a lack of involvement, abstract presentation, or inadequate link to real-world applications—statistics is becoming more and more essential in a data-driven society (Rodríguez-Alveal & Aguerrea, 2024). This study argues that including music into statistics education offers a strong, multisensory, and fascinating road toward conceptual mastery throughout Key Stages Three, Four, and Five in the UK curriculum.
Building a strong grasp of challenging subjects depends on mastery learning—a pedagogical technique wherein pupils must exhibit a high level of skill in a subject before progressing to the following (McGaghie et al., 2020). Applied to statistics, mastery guarantees that fundamental ideas are firmly established, therefore averting the build-up of misunderstandings that would impede advancement at more advanced levels. But attaining proficiency in statistics necessitates a range of teaching methods suited to different learning styles and sustained motivation.
Long noted for its ability to excite cognitive processes, improve memory, and elicit emotional reactions, music—a universal language—is Its inherently mathematical fundamentals, structured character, and patterns dependence make it a somewhat harmonious partner for statistics. This study looks at how music can be used to: (1) boost student involvement and motivation, (2) offer other ways for understanding abstract statistical ideas, (3) strengthen learning through multisensory activities, (4) support the iterative process of mastery learning. We support a next-generation approach that not only increases statistical accessibility but also promotes a deeper, more long-lasting appreciation for its value and beauty by means of thorough theoretical framework and particular examples.
2. The Current State of Statistics Education and Challenges
Spanning Key Stages Three, Four, and Five, statistics instruction in the UK curriculum progressively exposes pupils to data handling, probability, summary statistics, data representation, and, at advanced levels, inferential techniques and statistical modelling (Maratos et al., 2023). Notwithstanding its significance, pupils often meet several enduring obstacles.
First, many students find statistical ideas theoretical and unrelated to their daily lives (Sestir et al., 2023). Concepts like standard deviation, p values, or correlation coefficients can appear only mathematical symbols without any obvious sense. Second, many times there is a reliance on procedural knowledge rather than conceptual understanding (Arnold & Franklin, 2021). Though they can calculate a mean or create a bar chart, students find it difficult to grasp what these measurements really stand for or when to use them appropriately. This methodical emphasis usually impedes the growth of statistical knowledge and reasoning.
Thirdly, student involvement continues to be a major obstacle. Often dominated by textbook examples and rote exercises, traditional classroom settings can fail to catch pupils’ interest, hence causing disengagement and the view of statistics as boring or unrelated (Rubin, 2022).Data anxiety, a widespread problem that can stifle learning and prevent students from choosing quantitative subjects (Onwuegbuzie & Wilson, 2004), adds to this lack of involvement.
Finally, since statistics is cumulative, deficiencies in fundamental knowledge can cause chain effects(Willingham, 2021). A KS5 student having trouble grasping basic concepts of variability in KS3 will probably run into more problems with regression analysis or hypothesis testing. This highlights the importance of methods that really advance mastery, therefore guaranteeing thorough knowledge at every stage before progression (Willingham, 2021). Though beneficial, current pedagogical techniques sometimes lack the multisensory and emotionally resonant aspects music may provide, hence restricting their capacity to successfully solve these complex problems , as visualized by both Figure 1, Figure 2 and Figure 3 (c.f., Willingham, 2021).
3. Theoretical Framework: Bridging Music and Statistics
Several strong psychological and pedagogical theories support the inclusion of music in statistical education.
3.1. Mastery Learning
Pioneered by Benjamin Bloom (1968), the idea of mastery learning is central to this proposal. Mastery learning holds that, given suitable learning environments—including enough time, clearly defined learning goals, formative assessment, and remedial teaching—almost all pupils can reach high levels of learning. Offering many and repeated exposures to ideas without boredom, music can help one to master. Through practice, performance, or composition, a statistical notion set to a melody or rhythm can be returned to several times, therefore strengthening neural pathways and enabling pupils to absorb ideas at their own speed (Fink et al., 2023). The way music’s performance component—in which mistakes offer chances for improvement—reflects the cyclic character of mastery learning, in which focused practice helps to solve initial difficulties.
3.2. Cognitive Load Theory
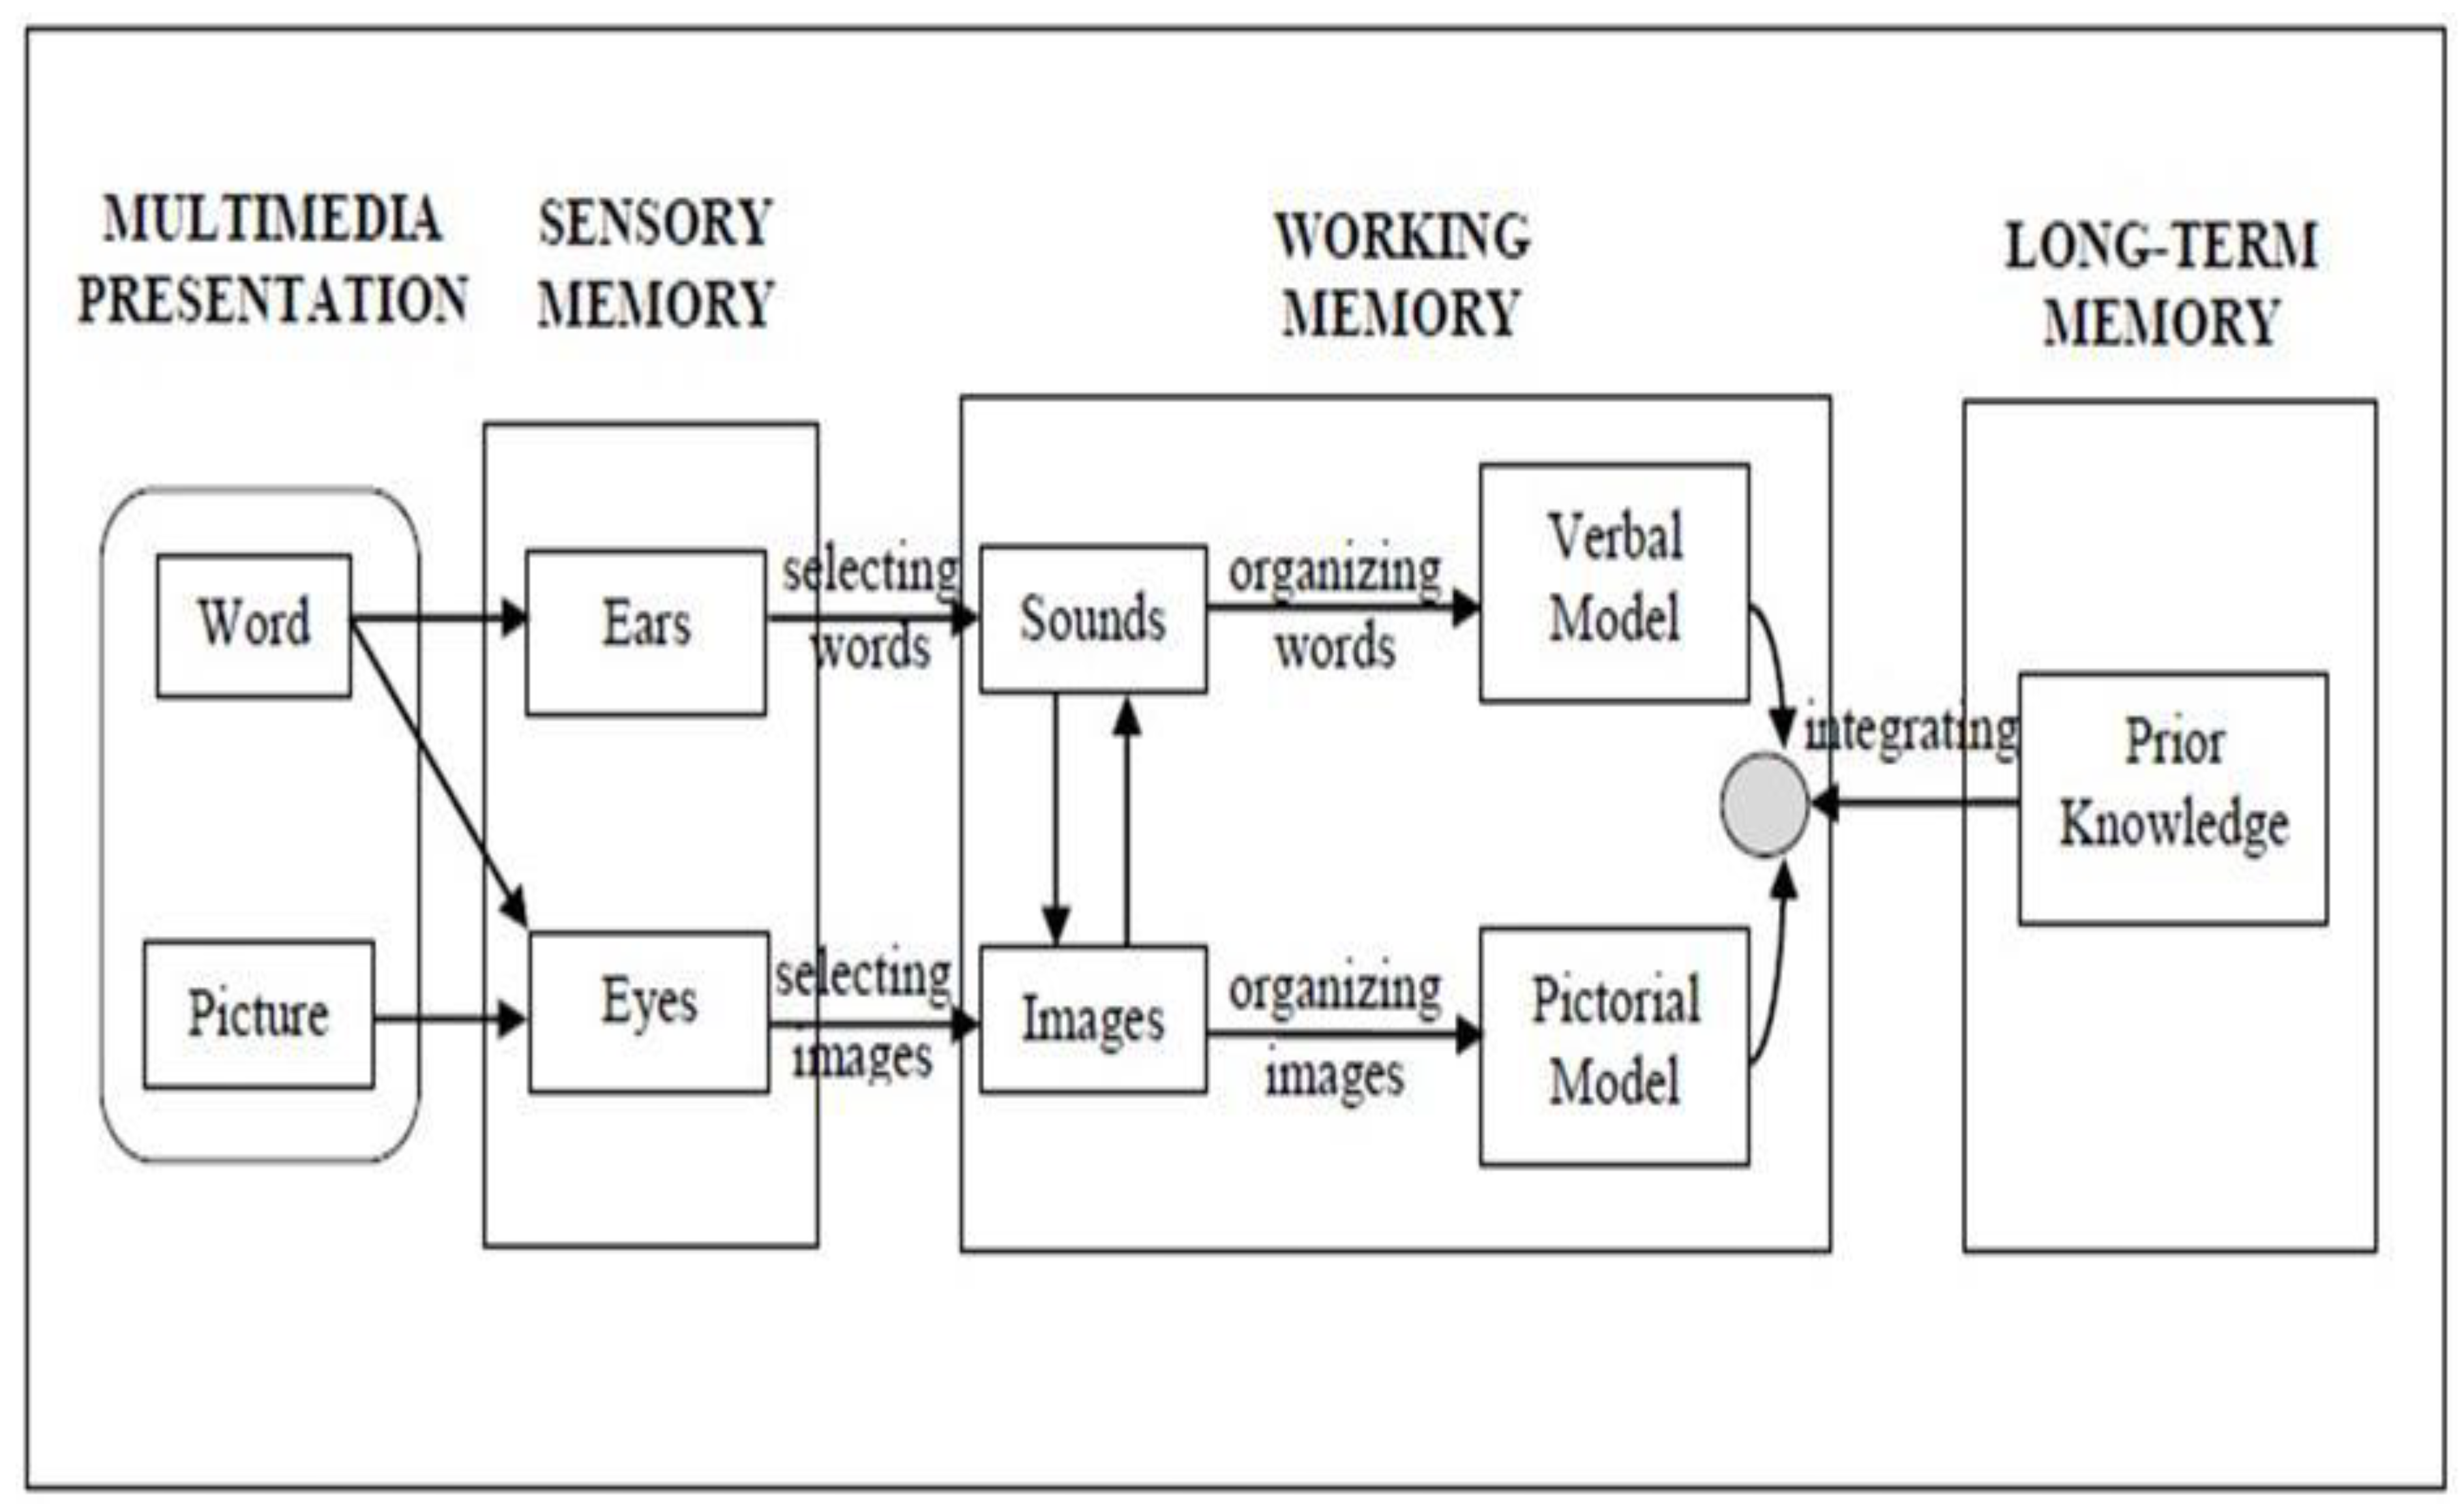
According to Cognitive Load Theory (Buchner et al., 2022), good teaching maximizes germane cognitive load and minimizes extraneous cognitive load. Carefully used music helps to lessen the abstraction of statistical ideas, therefore lowering the intrinsic cognitive load connected with unfamiliar information. Music helps difficult ideas be easier to understand by offering a memorable architecture—a catchy tune for a formula—or a tangible comparison—rhythm to represent frequency—for a formula. Furthermore, lowering extra burden by alleviating anxiety and increasing concentration, the affective advantages of music free up working memory for processing fresh statistical information, as in Figure 4 (c.f., Cheah, 2022).
3.3. Multiple Intelligences
Howard Gardner’s (Gardner, 2020) hypothesis of Multiple Intelligences emphasizes that people have varied cognitive capabilities, including musical aptitude. Conventional mathematics education often gives logical-mathematical intelligence top importance, therefore alienating pupils with great musical or bodily-kinesthetic intelligences. Incorporating music allows instructors to access these undervalued intelligences and offer substitute entry points for knowledge. Fostering success where traditional techniques could fail (Waterhouse, 2023), this inclusive approach can make statistics accessible to a greater variety of students.
3.4. Affective Domain and Embodied Cognition
According to embodied cognition theory, learning is intimately linked to bodily experience and sensory input (della Putta & Suner Munoz, 2023) rather than only abstract. Music inherently involves sensory experiences—listening, singing, movement—which can ground abstract statistical ideas in actual, kinesthetic encounters. For instance, physically showing standard deviation via musical dynamics or tempo changes can give a more natural grasp than purely abstract formulas.
Furthermore, the affective domain is very important in learning. Music affects mood and feeling profoundly with other extracurriculars(Mageed & Nazir, 2024; Mageed, 2024a; Mageed, 2024b; Mageed, 2024c; Mageed, 2024d; Mageed, 2025a; Mageed 2025b; Venohr, 2025). By making the learning process more fun and less daunting, music can lower stats anxiety, boost motivation, and create a good attitude toward the subject (Lange et al. 2021) A positive emotional condition fosters deeper learning and improved retention.
3.5. Constructivism
Constructivism holds that through experience and reflection learners actively create their understanding of the world (Winnicott, 2018). When kids participate in musical activities to represent statistical concepts (e.g., writing a song about probability, designing rhythmic patterns for datasets), they are actively constructing meaning and connections. This practical, creative process encourages deeper conceptual understanding than just passive reception of information (Jung & Hull, 2023). Collaborative musical endeavors also support social constructivism, whereby peer interaction helps to build understanding.
4. Practical Implementation: Music in Statistics Education
Incorporating music into statistics instruction calls for careful preparation and creative application suited to the Key Stage.
4.1. Key Stage Three (Ages 11–14): Foundations and Involvement
- KS3 emphasizes the introduction of probability, descriptive statistics, and fundamental data handling. One can use music to make these first meetings interesting and natural.
- Students can represent frequency distributions using rhythmic patterns. Rhythm for Mode and Frequency. For instance, a teacher could give a consistent beat (e.g., a quarter note) for every data point and students clap louder or faster for more often occurring values. The mode is the most often heard rhythm/clap. They may create brief rhythmic compositions wherein the number of occurrences a particular beat or instrument has corresponds to a frequency.
- Short, memorable jingles or songs might be developed to define and remember the central tendency metrics of Melody for Mean, Median, Mode, Range. For example, a basic tune could explain mean is average, add them up and divide, median is middle, line them up and find, and mode is most, it appears the most.
- Pitch for Data Scales: Students may use different tones to reflect various values in a dataset; higher pitches correspond to bigger numbers and lower tones correspond to smaller ones. This can audibly and visually demonstrate the dissemination of data.
- Simple probability experiments (e.g., rolling a die, flipping a coin) can be complemented with unique musical sounds for every result. Probability allows pupils to forecast noises, therefore making the idea more concrete and engaging, as visually demonstrated by Figure 5, Figure 6, Figure 7, Figure 8 and Figure 9 (c.f., Kurt, 2023).
Figure 5.
Examples of children’s bar graph representations.

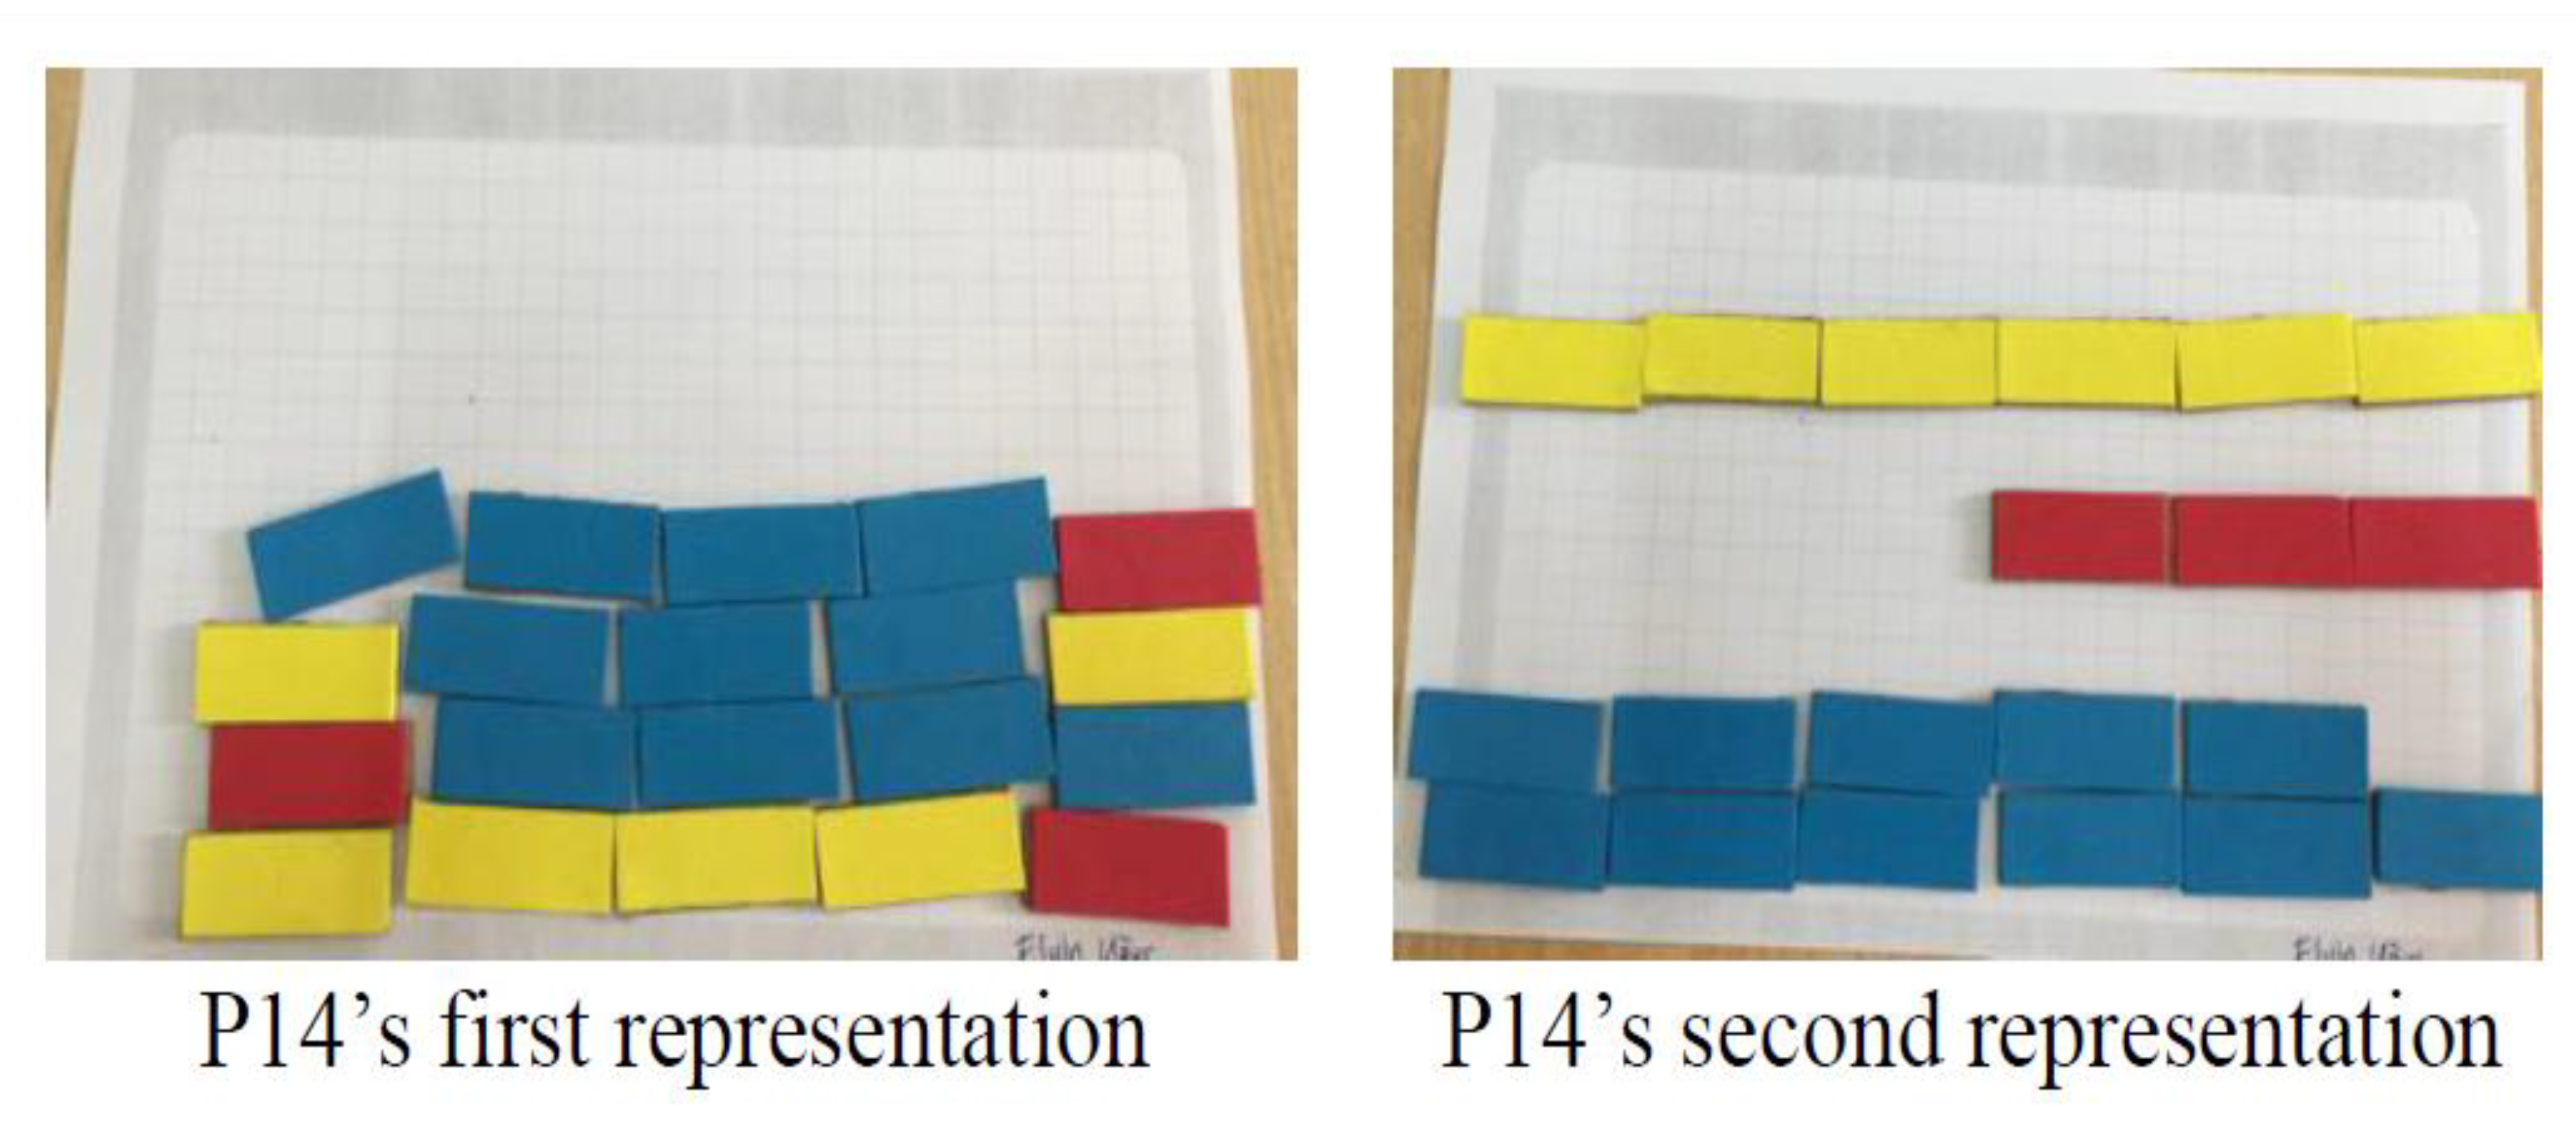
The „back and forth” between data and graphs (or shapes, displays, or representations) are the subject of another observation. The kids frequently went back to their representation and rearranged the data, sometimes three or four times, when they couldn’t respond to questions about interpreting or analysing the data. For example, P14 (Figure 7) and P13 (Figure 6) built a range of organisations. All things considered, the kids were able to answer the questions in this section of the assignment and displayed their performance using bar graphs.
Figure 6.
P13’s bar graph representations.
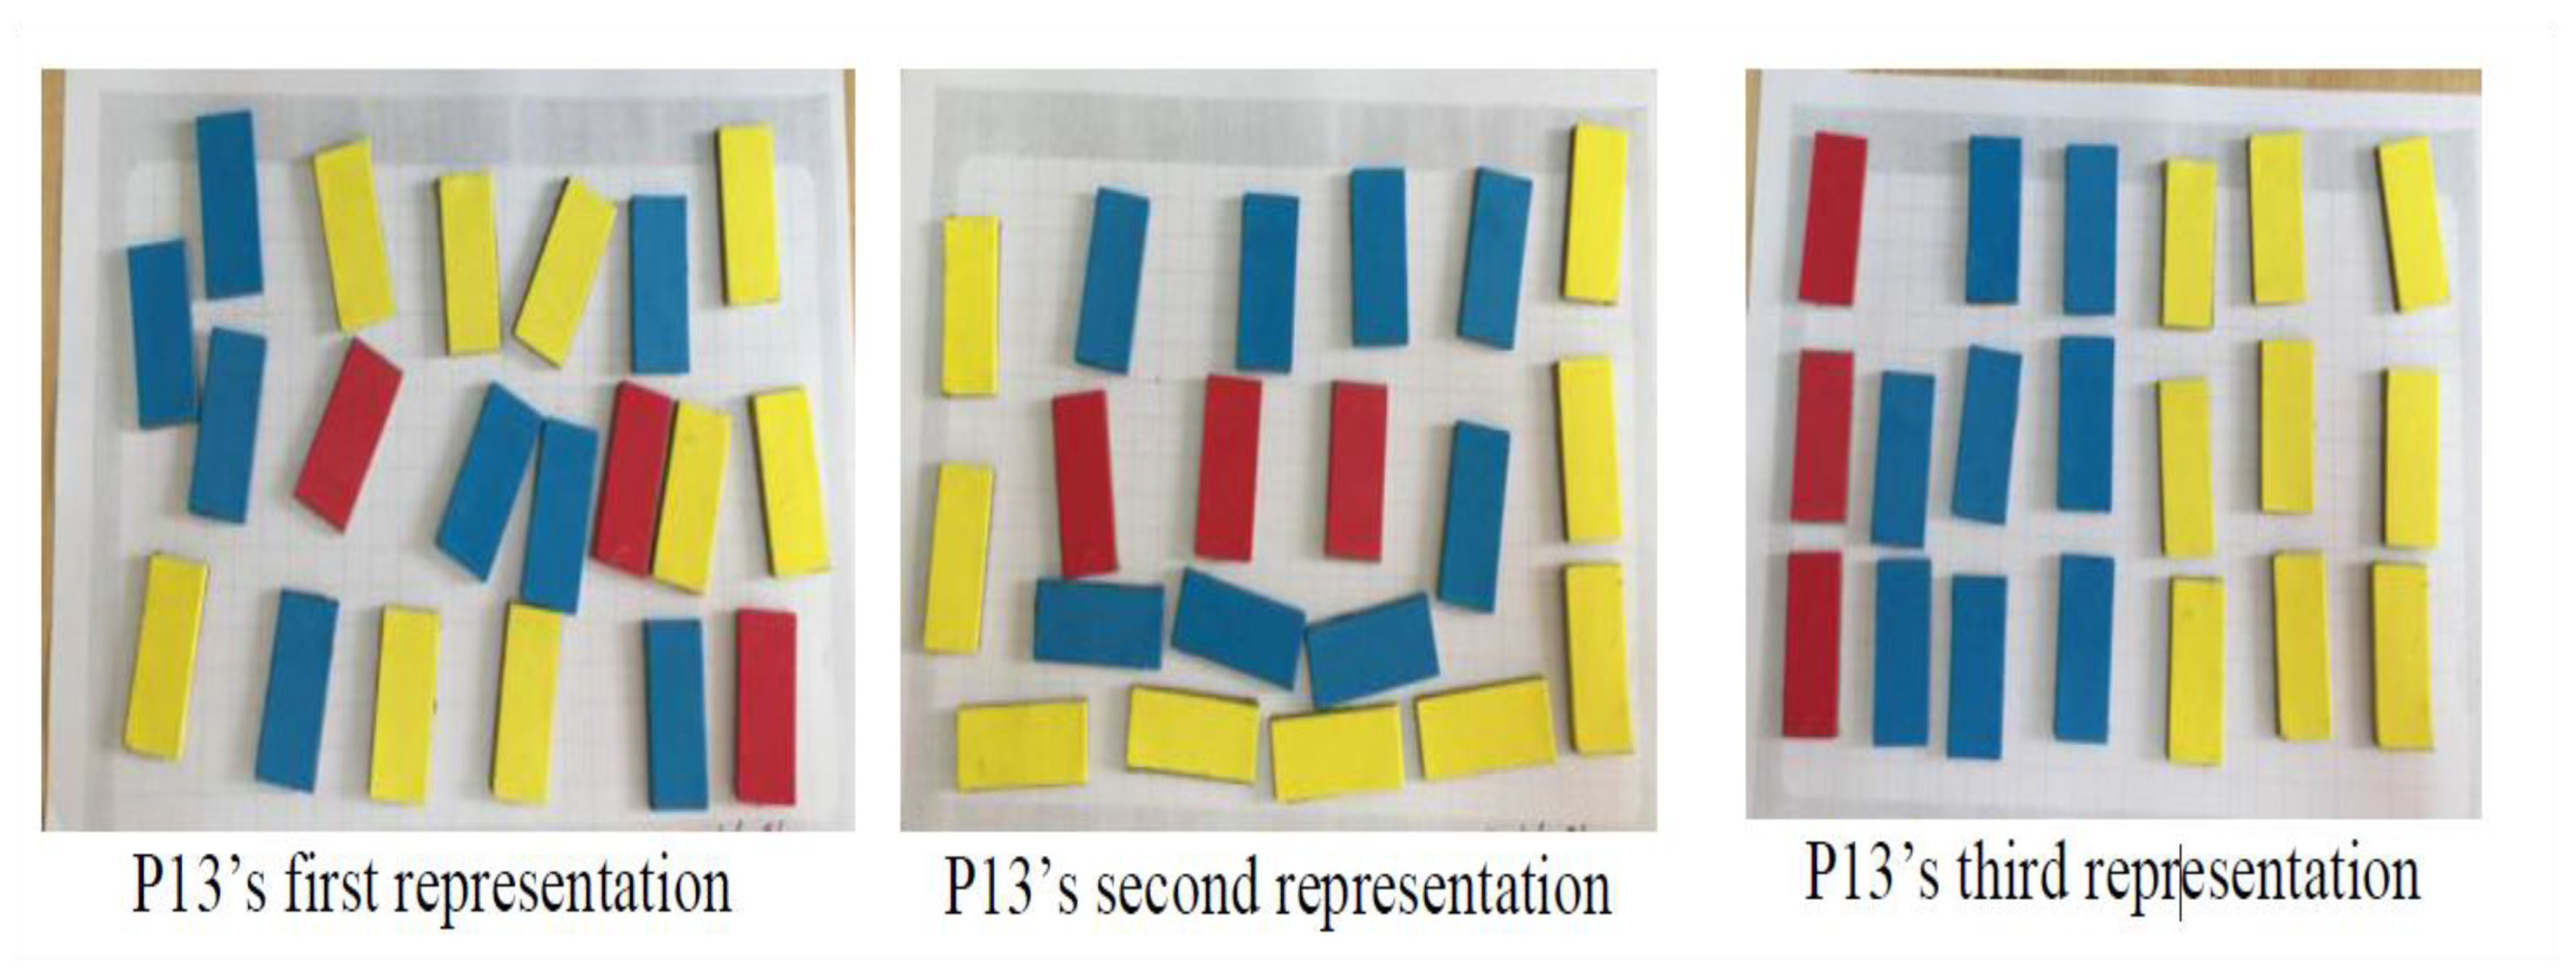
Figure 7.
P14’s bar graph representations.
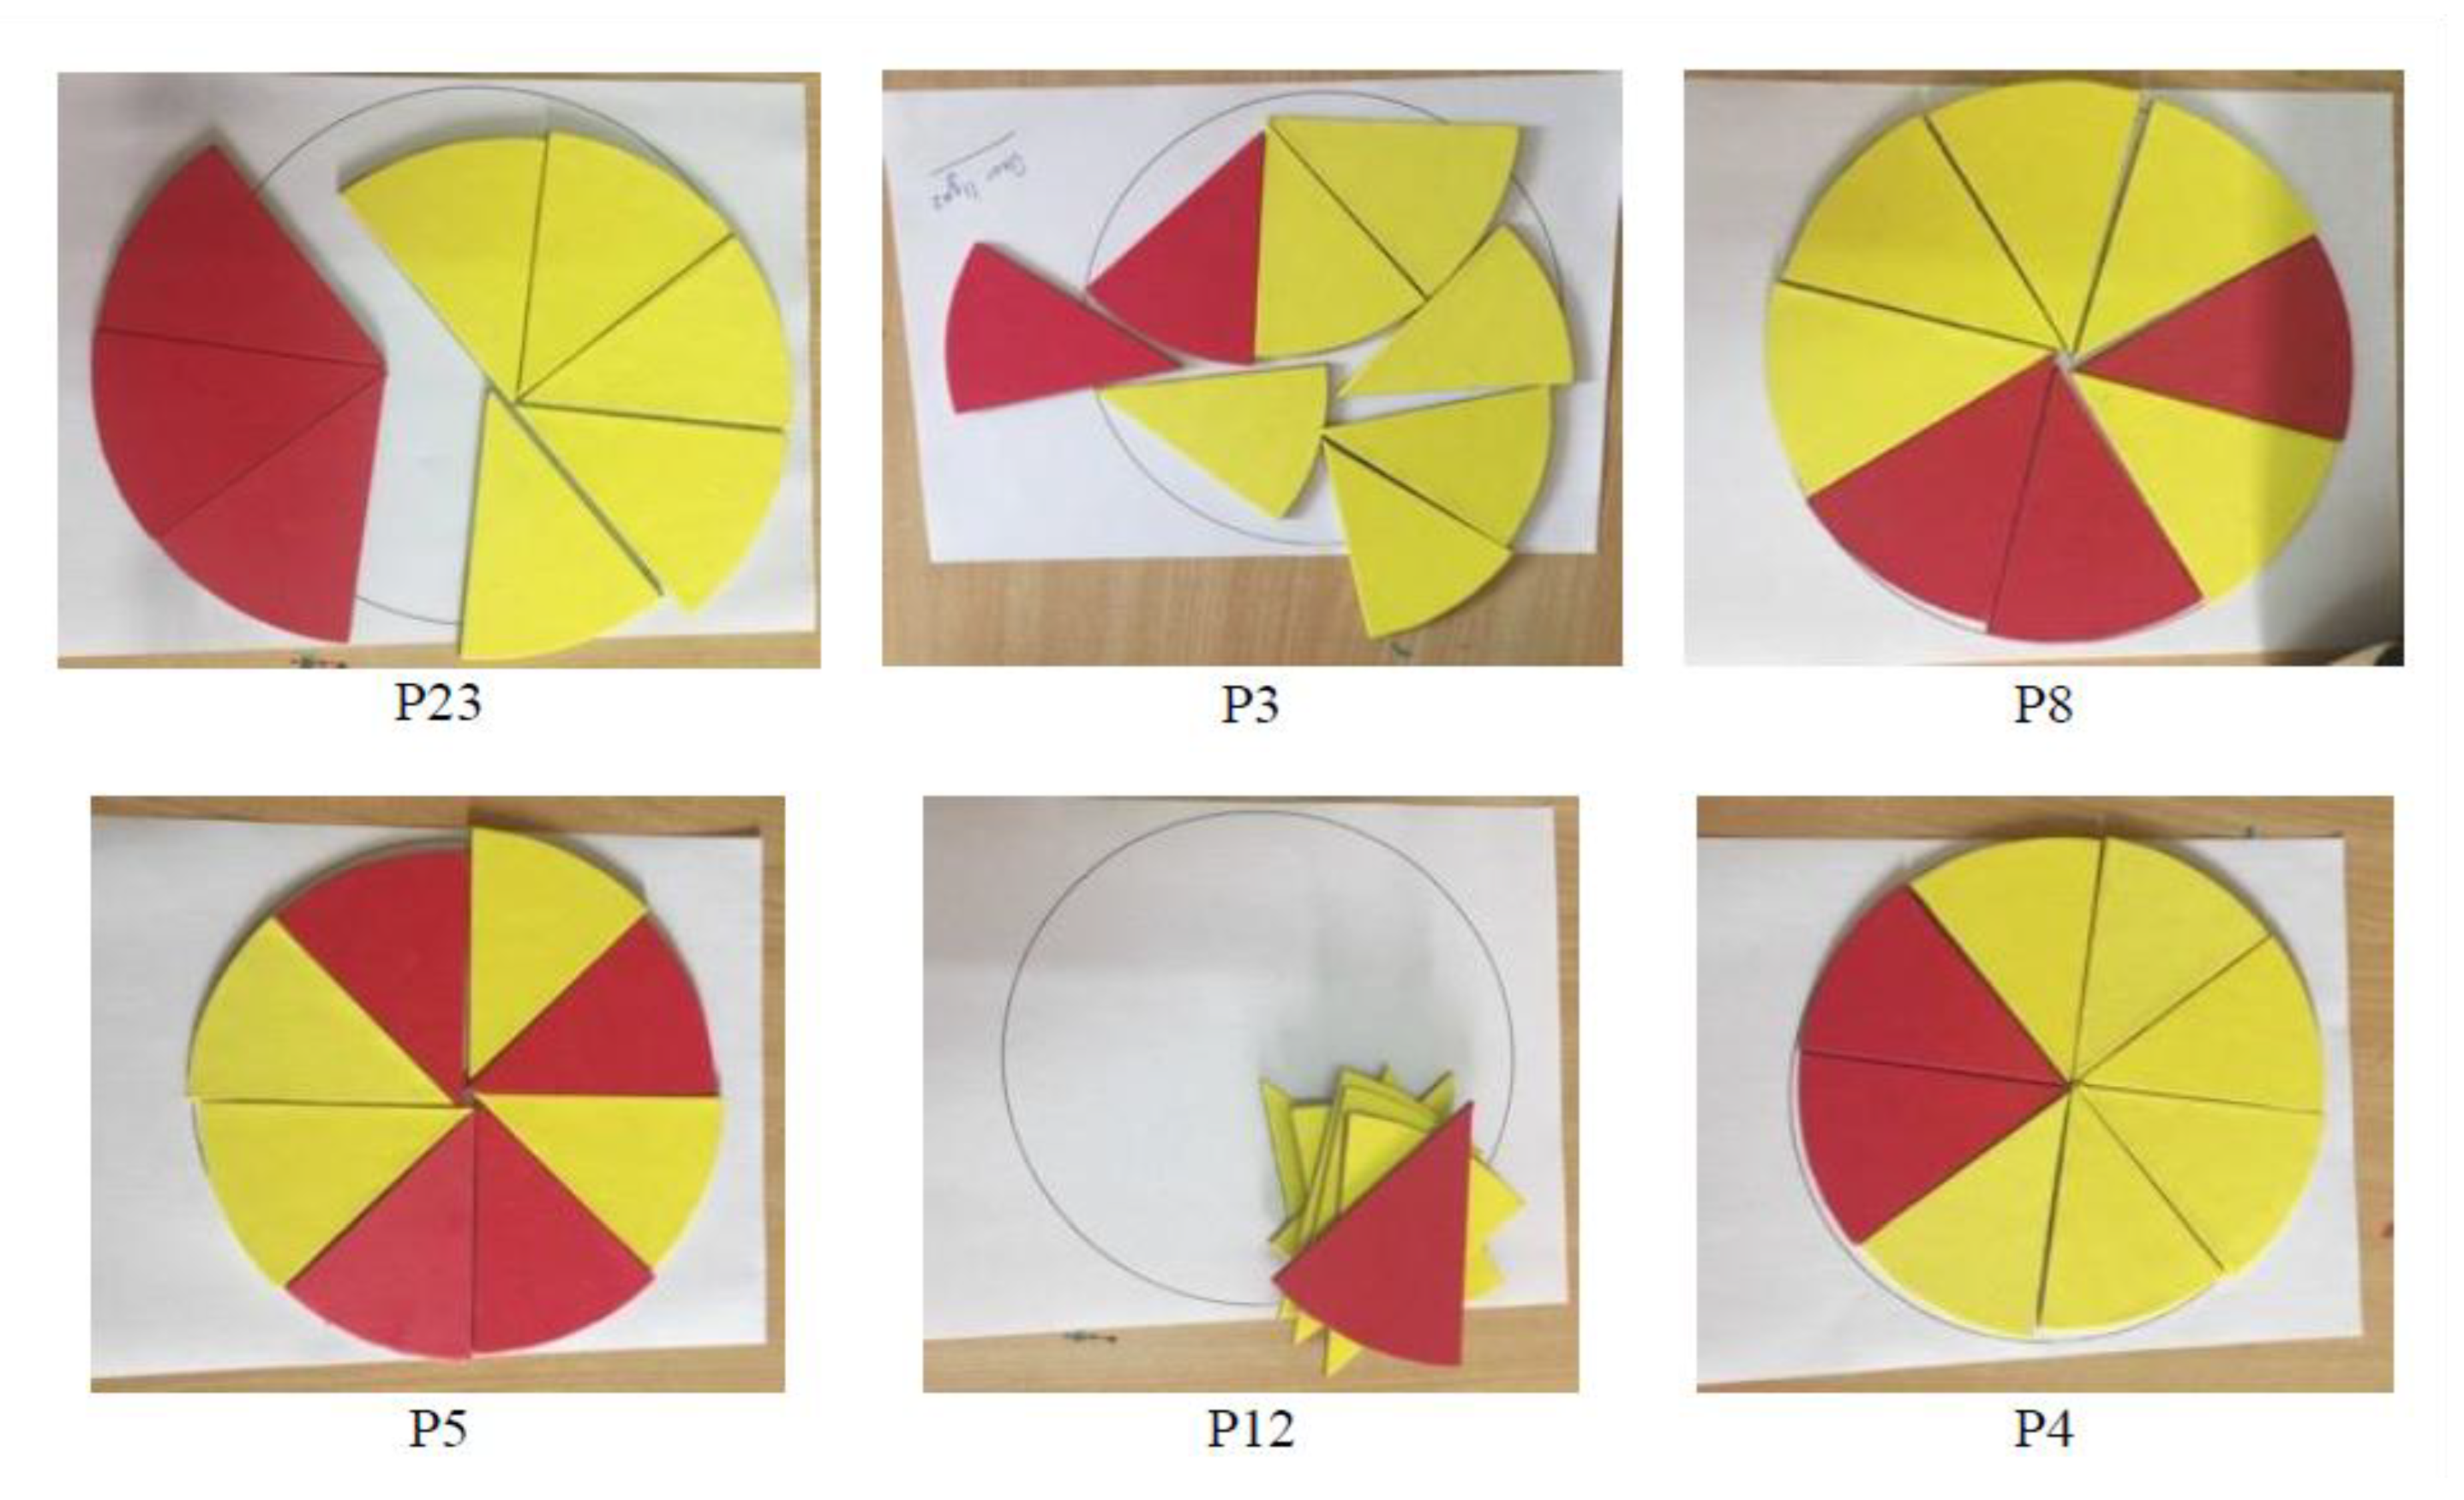
- Children were supposed to find the centre point, position the cards on the circle, and then group the cards by colour to build a pie graph. It seemed that the kids found making pie charts simpler than making bar graphs. „How can we easily determine which colour is the most and which colour is the least?” was the question posed to the kids, like the bar graph exercise. Surprisingly, most kids (n = 24 of 28) knew where the circle’s centre was. They also compared the cards to slices of pizza. „Will we play a pizza game?” was a question that many of them asked. The cards were further categorised by colour by sixteen of them. Several illustrations of children’s pie charts are shown in Figure 8.
Figure 8.
Examples of children’s pie graph representations.
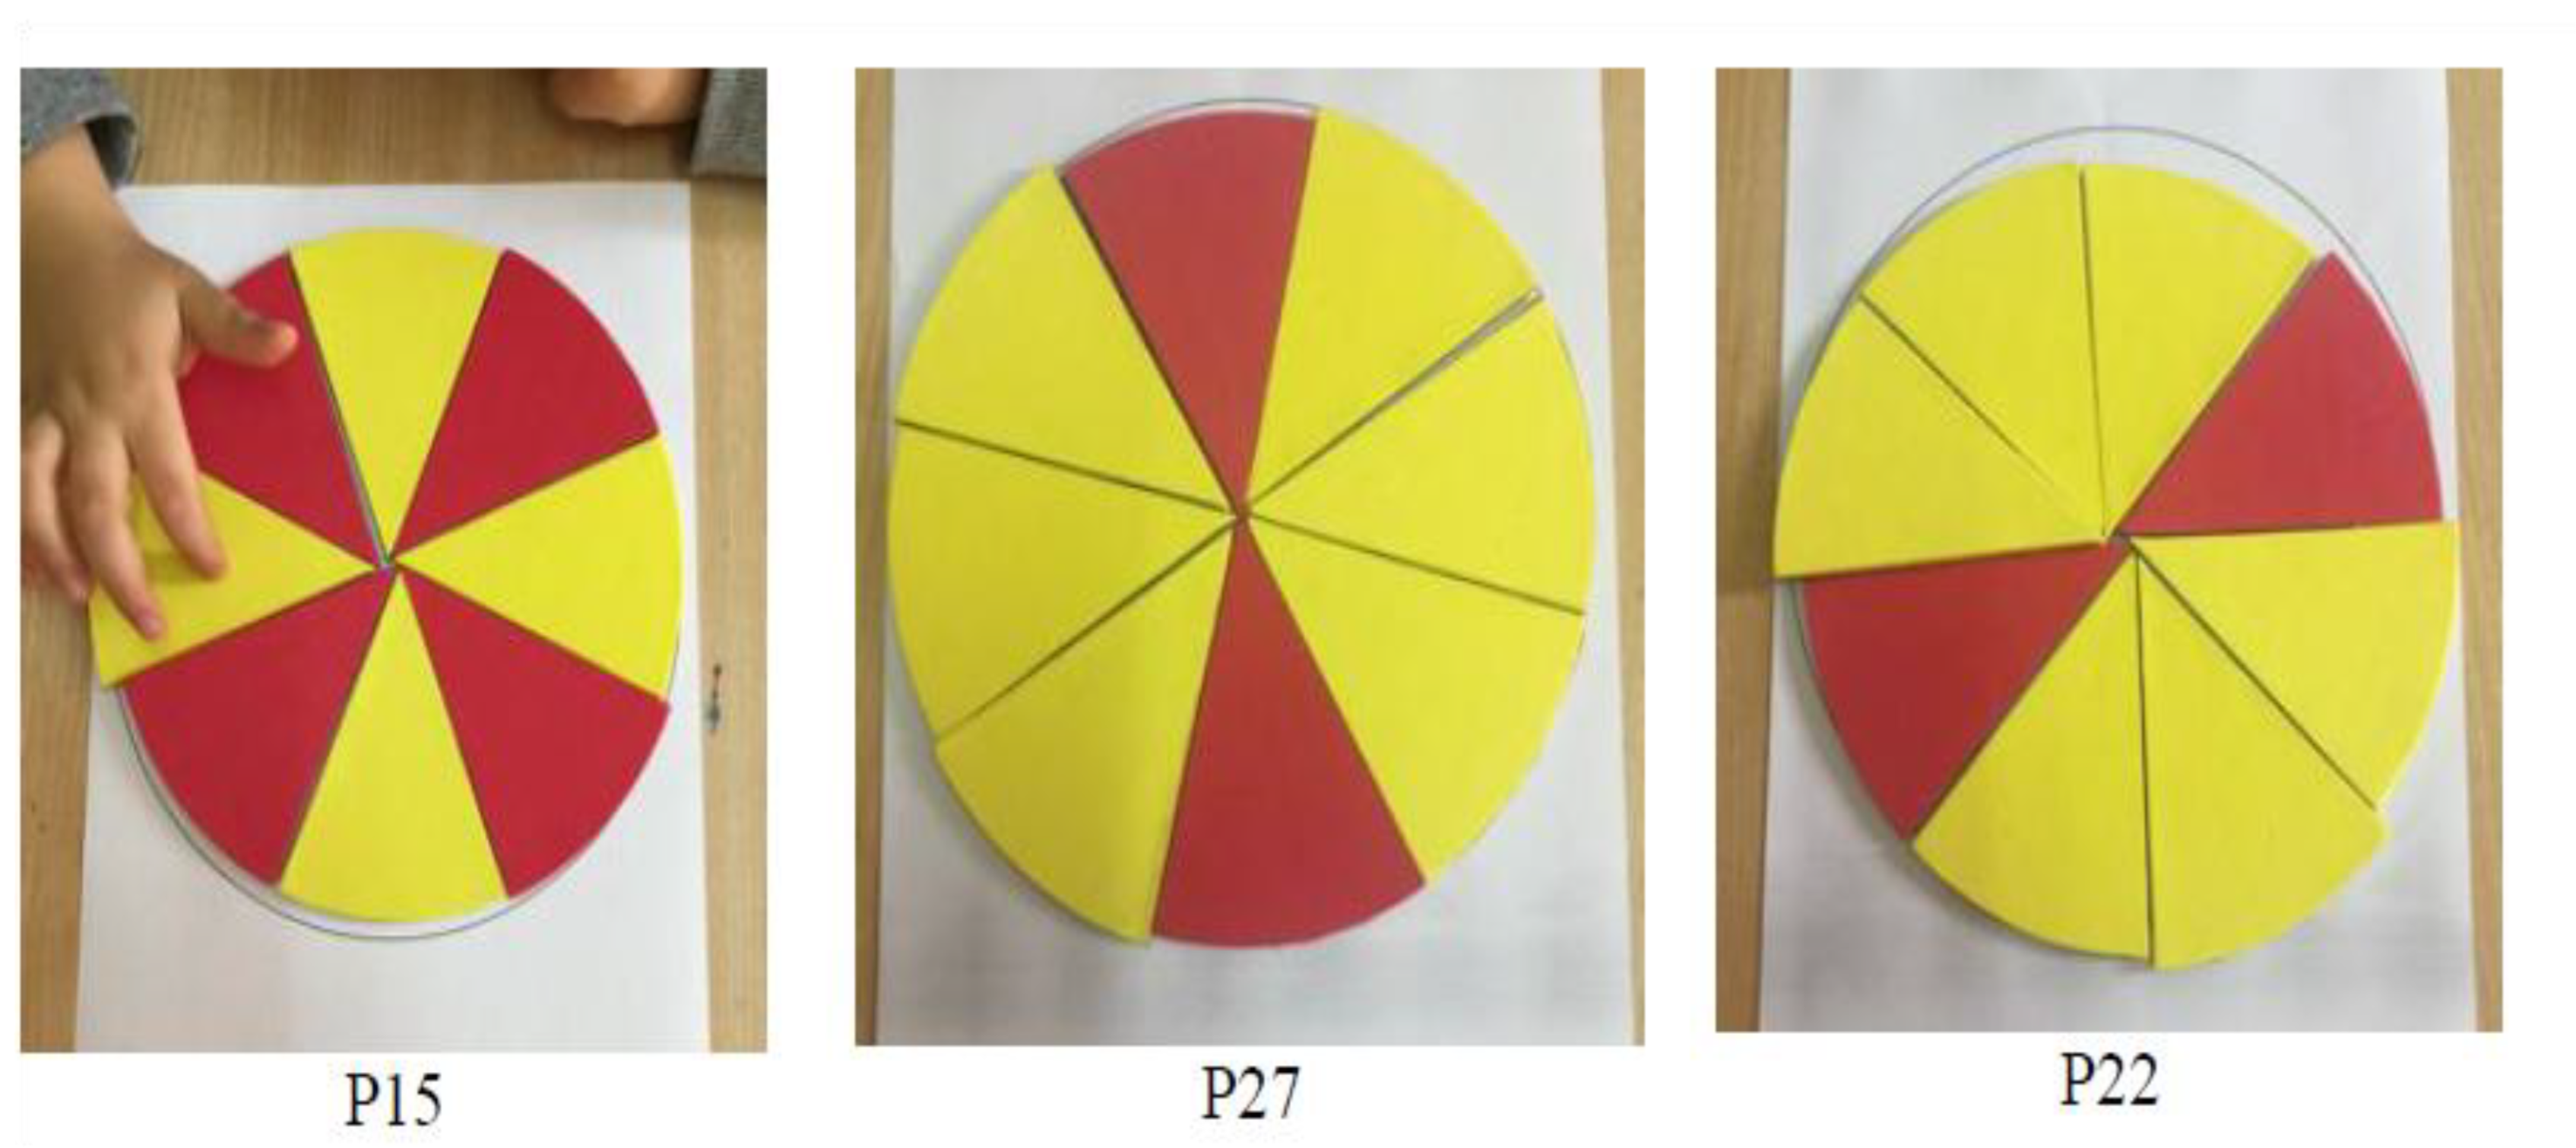
- Furthermore, some pattern reasoning was evident in the pie chart representations. As seen in the examples in Figure 9, some kids organised the cards in a recurring pattern.
Figure 9.
Pattern examples of children’s pie graph representations.
- Students could gather basic categorical data (e.g., preferred colours, pets) and connect musical phrases or instruments to each category. They then create a brief composition whereby the frequency of that category is indicated by the length or number of times a word is played. This practical development helps to clarify information representation.
4.2. Key Stage Four, Ages 14–16: Advanced Ideas and Connections.
- KS4 covers more sophisticated subjects including standard deviation, correlation, sampling, and advanced data representation. Music offers concrete illustrations for these abstract concepts as well as parallels.
- Dynamics for variability (standard deviation) can be demonstrated using musical dynamics—a concept typically hard for pupils. Little variance in loudness (piano to mezzoforte) could indicate a little standard deviation; wide dynamic swings (pianissimo to fortissimo) would indicate a big standard deviation. Students can examine musical compositions to determine and define their dynamic range, then link it to disseminated data (Hallam & Himonides, 2022).
- Harmony for Correlation: Chord progressions could symbolize correlation. Consonant chords (e.g., C major) could represent a strong positive correlation, where two variables move in the same direction harmonically. Dissonant chords (e.g., a cluster chord) might represent weak or negative correlation, where variables show little or opposing relationship. Using bivariate data, students can produce a correlation soundscape.
- By taking brief rhythmic phrases from a longer musical piece, one can show the concept of sampling from a bigger population. Students evaluate if the sampled phrases appropriately reflect the overall tempo, rhythm, and melodic patterns of the whole piece, which spurs conversations about bias and representativeness in sampling (Zayed, 2018; Mageed & Bhat 2022; Mageed & Zhang, 2022; Mageed & Zhang, 2023; Mageed, 2023; Mageed, 2024e; Mageed, 2024f, Mageed, 2024g; Mageed, 2024h; Mageed 2024i).
- Musical Patterns for Time Series Data: Time series data, such as economic trends or population growth, can be mapped onto musical patterns. A rising trend could be represented by an ascending melody, a cyclical pattern by a repeating musical phrase, and volatility by sudden changes in tempo or pitch. Students could analyze graphs of time series data and then try to musically represent them.
- Data sonification projects: Using basic audio libraries in Scratch, Python, etc., students may sonify real-world datasets. Temperature data, for instance, could be mapped to pitch; humidity to volume; then they can listen for patterns and linkages in environmental data. This links computational thinking and actual world science with statistics (Lindborg et al., 2024).
4.3. Key Stage Five (Ages 16-18): Inferential Statistics and Modelling
- KS5 learners explore probability distributions, statistical modelling, hypothesis testing, and inferential statistics. Music can aid in seeing abstract distributions and reinforcing intricate logical reasoning.
- Soundscapes enable representation of normal distribution, skewed distributions, and uniform distributions. A normal distribution might have a thick sound at the mean (middle of the pitch range) that thins out towards the extremes, while a uniform distribution would have an even spread of sound across the entire pitch range. By listening to the acoustic representation of the type of distribution, students could attempt to determine it (Grondin, 2025).
- Through a multipart musical phrase or short song, one may memorize and comprehend the organized logic of hypothesis testing (null hypothesis, alternative hypothesis, significance level, p-value, decision). Every portion of the phrase matches a step, which strengthens the procedural memory.
- Pitch for P values: It can be conceptual the idea of a p value and its connection with statistical significance. Consider a continuous pitch range denoting p values from 0 to 1. Significance might be suggested by a threshold sound (e.g., a specific note) at= 0.05. A different, more definitive sound might start to play when the p value pitch falls below this threshold. This gives a sound signal for decision making (Hales, 2023).
- Rhythmic Complexity for Model Fit: In regression analysis, the fit of a model can be illustrated by how well a simple rhythmic pattern (the model) aligns with a complex, observed rhythmic pattern (the data). A good fit would mean the model’s rhythm closely matches the data’s rhythm, while a poor fit would result in jarring or misaligned beats.
- Students could design projects to examine a data set, reach statistical conclusions, and then produce a musical composition telling the story of their results. For instance, a piece exploring social inequalities might use jarring harmonies and fluctuating tempos to represent disparities, whereas a piece about steady growth might use consistent, ascending melodies. Statistical literacy is combined here with artistic expression and narrative construction (Rumelhart & Ortony, 2017).
5. Benefits and Challenges
5.1. Advantages
- Music’s natural attractiveness may turn a dull topic into an interesting and pleasurable experience, thereby lowering worry and boosting student readiness to participate (Váradi, 2022).
- Multisensory inputs (auditory, kinesthetic, visual through musical notation) can help create more intuitive grasp of abstract statistical ideas by strengthening neural connections (Gage, 2009).
- Melodies, rhythms, and ordered musical patterns provide mnemonic tools that assist with the recall of formulas, definitions, and procedural phases (Degé et al., 2011).
- Tapping into musical intelligence widens the appeal of statistics to students with varied learning styles, therefore promoting success for those who might not prosper in conventional, entirely logical mathematical settings (Waterhouse, 2023).
- Interdisciplinary learning naturally connects math with the arts, hence fostering a whole grasp of knowledge and showing the interdependence of disciplines (Reinhardt, 2020).
- Developing Critical Thinking and Creativity: Writing and understanding musical representations of data challenges pupils to think critically about how data translates into meaning and to communicate these insights creatively (Csikszentmihalyi, 1996).
- The iterative nature of musical performance and practice—where errors offer chances for growth— fits well with the tenets of mastery learning and encourages a development attitude toward statistics challenges (Megaptche & Ramanantsoa, 2023).
5.2. Difficulties
Many math teachers lack formal musical training or the confidence to integrate music effectively; professional development will be vital (Schilling & Kühn, 2021).
- Curricular Integration and Time Restrictions: Appropriately planned and justified integration of creative musical events into an already crowded curriculum is crucial. It ought to be viewed as augmenting rather than replacing already available material (Shirley, 2017).
- Access to musical instruments, digital audio workstations (DAWs), or music education software could differ amongst schools (Third et al., 2025). Basic tools like body percussion, vocal work, and online sequencers can help to reduce this.
- Building reliable and accurate evaluation techniques that evaluate statistical understanding acquired via musical activities rather than only musical skill calls for great thought (Heritage, 2021).
- Distraction Potential: Music can become a distraction rather than a learning tool if not properly managed. Activities should be deliberate and intimately connected to statistical goals (Hanham et al., 2023).
- Student Resistance: Some students may first fight against unconventional teaching techniques or feel self-conscious about participating in music activities in a math lesson. Key is establishing a welcoming and nonjudgemental classroom atmosphere (Ntoumanis, 2023).
6. Practical Implementation Strategies
- There are several techniques necessary to properly include music into statistics instruction:
- Offer workshops for mathematics instructors concentrated on fundamental music ideas, music technology resources appropriate for use in schools, and pedagogical examples of music-statistics integration in collaboration with music department personnel (Copur-Gencturk &Thacker, 2021).
- Locate statistical learning goals where music integration could be most effective using curriculum mapping. Begin gently, maybe with one or two essential ideas per term, then progressively broaden (Richmond, 2018).
- Make use of easily accessible technology like online sequencers (e.g., Chrome Music Lab, GarageBand online), basic coding systems (e.g., Python with pydub), or even free virtual instruments. For teachers as well as students, these tools can lower the entry hurdle (Reid et al., 2023.).
- Collaborative Projects: Promote group projects in which students create or present musical pieces reflecting data together. Through shared creation, this encourages peer learning, cooperation, and more profound conceptual understanding (Alós-Ferrer & Garagnani, 2020).
- Invite musicians, data artists, or statisticians who use sound in their work to motivate pupils and show actual applications of data sonification (Wickens et al., 2021).
- Enable students to create their own musical interpretations of statistical ideas via student-led development. This supports individual tastes, fosters inventiveness, and encourages learning ownership (Papert, 2022).
- Formative Assessment Integration: See musical activities as chances for formative assessment. Watch how pupils interpret information into sound, pay attention to their justifications for their musical selections, and offer instant criticism (Jikandi, 2021).
- Help instructors and provide inspiration by compiling a shared repository of musical examples, lesson plans, templates, and student-created works.
7. Assessment and Evaluation
Evaluating statistical fluency in a music-integrated classroom calls for a sophisticated method beyond conventional tests.
- Performance-Based Assessment: Students might be judged on their capacity to produce a musical composition that accurately depicts a certain dataset, together with a lucid justification of their musical and statistical decisions. This shows conceptual as well as practical knowledge (Brown, 2017). Long-term initiatives ending in a „statistical soundscape” or a &”data-driven song” can be evaluated for statistical precision, musical inventiveness, and narrative clarity. Rubrics should clearly specify standards for musical expression as well as statistical thinking (Boss & Krauss, J.2022). Teachers can observe students during music exercises and record their level of participation, problem-solving techniques, and conceptual knowledge. Focused conversations following musical tasks can expose more profound understanding of their learning (Chappuis et al., 2020).
- Using established criteria, students can assess one another’s musical statistical projects, hence encouraging critical thought and reinforcing their own knowledge (Heritage, 2021).
- Although conventional quizzes and tests still matter, questions can include scenarios based on musical data or request students to interpret imagined musical depictions of statistical ideas. Quantitative data could include student performance on standardized tests compared to conventional approaches, attendance rates, and optional course enrolment in statistics. Qualitative data could be acquired via student and teacher surveys, focus groups, and interviews examining impressions of engagement, understanding, and enjoyment (Gregar, 2023). Evaluation of the overall program should involve collecting both quantitative and qualitative data. Longitudinal studies might monitor the long-term effects on statistical literacy and attitudes toward mathematics.
Conclusion
Incorporating music into statistics education for Key Stages Three, Four, and Five presents a powerful and creative path to conceptual mastery and encourages a genuine appreciation for quantitative reasoning. Educators can turn statistics from a difficult and abstract subject into an interesting, multi-sensory, and approachable learning experience by using the cognitive, emotional, and motivational influence of music. Modern pedagogical ideas including mastery learning, constructivism, and the theory of multiple intelligences fit with this next-generation method. Enhancing participation, deepening conceptual understanding, and offering varied entry points for learning solves persistent problems in statistics education by: Although problems connected to teacher training, resources, and assessment need careful consideration, the possible advantages—from better memory and critical thought to more positive attitude toward mathematics and increased interdisciplinary understanding—are significant. Embracing music as a strong instructional technique enables students to not only compute statistical metrics but also to really grasp, interpret, and share statistical findings. Beyond rote memorization, this technique develops statistically literate people who are confident and able to negotiate a more data-rich world, so really capturing the spirit of innovative, next-generation mathematics education.
References
- Alós-Ferrer, C. and Garagnani, M., 2020. The cognitive foundations of cooperation. Journal of Economic Behavior & Organization, 175, pp.71-85. [CrossRef]
- Arnold, P. and Franklin, C., 2021. What makes a good statistical question?. Journal of Statistics and Data Science Education, 29(1), pp.122-130.
- Bloom, B.S., 1968. Learning for Mastery. Instruction and Curriculum. Regional Education Laboratory for the Carolinas and Virginia, Topical Papers and Reprints, Number 1. Evaluation comment, 1(2), p.n2.
- Boss, S. and Krauss, J., 2022. Reinventing project-based learning: Your field guide to real-world projects in the digital age. International Society for Technology in Education.
- Brown, G.T., 2017. Assessment of student achievement. Routledge.
- Buchner, J., Buntins, K. and Kerres, M., 2022. The impact of augmented reality on cognitive load and performance: A systematic review. Journal of Computer Assisted Learning, 38(1), pp.285-303. [CrossRef]
- Chappuis, J., Stiggins, R.J., Chappuis, S. and Arter, J., 2020. Classroom assessment for student learning: Doing it right--using it well (p. 432). New York, NY, USA: Pearson.
- Cheah, C.S., 2022. The importance of multimedia elements in learning and the impact of redundancy principle in developing effective multimedia learning materials: A literature review. Journal of Educational Sciences & Psychology, 12(2), pp.3-12.
- Copur-Gencturk, Y. and Thacker, I., 2021. A comparison of perceived and observed learning from professional development: Relationships among self-reports, direct assessments, and teacher characteristics. Journal of teacher education, 72(2), pp.138-151.
- della Putta, P. and Suner Munoz, F., 2023. The present and the future of embodiment and cognitive linguistics in language teaching. In 7th International Symposium on Figurative Thought. Cognitive, bodily, and cultural processes in Figurative Thought and Language.
- Fink, L.D., Davis, J.R. and Arend, B.D., 2023. Facilitating seven ways of learning: A resource for more purposeful, effective, and enjoyable college teaching. Routledge.
- Gage, N.L. 2009. A conception of teaching. Springer Science & Business Media.
- Gardner, H. , 2020. A synthesizing mind: A memoir from the creator of multiple intelligences theory. mit Press.
- Gikandi, J.W. 2021. Enhancing E-learning through integration of online formative assessment and teaching presence. International Journal of Online Pedagogy and Course Design (IJOPCD), 11(2), pp.48-61.
- Gregar, J. 2023. Research design (qualitative, quantitative and mixed methods approaches). Research Design, 8.
- Grondin, S. 2025. Psychophysics. In Psychology of perception (pp. 1-16). Cham: Springer Nature Switzerland.
- Hales, A.H. 2023. One-tailed tests: Let’s do this (responsibly). Psychological Methods. [CrossRef]
- Hallam, S. and Himonides, E., 2022. The power of music: An exploration of the evidence. Open Book Publishers.
- Hanham, J. Castro-Alonso, J.C. and Chen, O., 2023. Integrating cognitive load theory with other theories, within and beyond educational psychology. British Journal of Educational Psychology, 93, pp.239-250. 239–250. [CrossRef]
- Heritage, M. 2021. Formative assessment: Making it happen in the classroom. Corwin Press.
- https://www.elivabooks.com/en/book/book-1450104825 (Accessed 10/06/2025).
- Jung, C.G. and Hull, R.F.C., 2023. The Complications of American Psychology 1. In Collected Works of CG Jung (pp. v10_502-v10_514). Routledge.
- Kurt, G. 2023. Young children’s probabilistic and statistical reasoning in the context of informal statistical inference. Statistics Education Research Journal, 22(2), pp.4-4.
- Lange, C. Almusharraf, N., Koreshnikova, Y. and Costley, J., 2021. The effects of example-free instruction and worked examples on problem-solving. Heliyon, 7(8). [CrossRef]
- Lindborg, P. Caiola, V., Ciuccarelli, P., Chen, M. and Lenzi, S., 2024. Re (de) fining Sonification: Project Classification Strategies in the Data Sonification Archive. AES: Journal of the Audio Engineering Society, 72(9), pp.585-602.
- Mageed, I. A. 2025a. The Hidden Poetry & Music of Mathematics for Teaching Professionals: Inspiring Students through the Art of Mathematics: A Guide for Educators. Eliva Press. https://www.elivabooks.com/en/book/book-1450104825.
- Mageed, I.A. 2025b. The Hidden Dancing & Physical Education of Mathematics for Teaching Professionals. Eliva Press. https://www.elivabooks.com/en/book/book-7724827898.
- Mageed, I.A. and Bhat, A.H., 2022. Generalized Z-Entropy (Gze) and fractal dimensions. Appl. math, 16(5), pp.829-834.
- Mageed, I.A. and Nazir, A.R., 2024. AI-Generated Abstract Expressionism Inspiring Creativity through Ismail A Mageed’s Internal Monologues in Poetic Form. Annals of Process Engineering and Management, 1(1), pp.33-85.
- Mageed, I.A. and Zhang, Q., 2022, September. An introductory survey of entropy applications to information theory, queuing theory, engineering, computer science, and statistical mechanics. In 2022 27th international conference on automation and computing (ICAC) (pp. 1-6). IEEE. [CrossRef]
- Mageed, I.A. and Zhang, Q., 2023. Formalism of the Rényian maximum entropy (RMF) of the stable M/G/1 queue with geometric mean (GeoM) and shifted geometric mean (SGeoM) constraints with potential geom applications to wireless sensor networks (WSNs). Electronic journal of computer science and information technology, 9(1), pp.31-40.
- Mageed, I.A. 2023. Cosistency axioms of choice for Ismail’s entropy formalism (IEF) Combined with information-theoretic (IT) applications to advance 6G networks. European journal of technique (ejt), 13(2), pp.207-213.
- Mageed, I.A. 2024a. Do You Speak The Mighty Triad?(Poetry, Mathematics and Music) Innovative Teaching of Mathematics. MDPI Preprints. [CrossRef]
- Mageed, I.A. , 2024b. The Mathematization of Puzzles or Puzzling Mathematics Innovative Teaching of Mathematics. Preprints. [CrossRef]
- Mageed, I.A. , 2024c. Let’s All Dance and Play Mathematics Innovative Teaching of Mathematics. Preprints. [CrossRef]
- Mageed, I.A. , 2024d. AI-Generated Abstract Expressionism Inspiring Creativity Through Ismail A Mageed’s Internal Monologues in Poetic Form. Preprints. [CrossRef]
- Mageed, I.A. 2024e. Entropy-based feature selection with applications to industrial internet of things (IoT) and breast cancer prediction. Big Data and Computing Visions, 4(3). 170–179.
- Mageed, I.A. 2024f. Entropic imprints on bioinformatics. Big Data and Computing Visions, 4(4). 245–256.
- Mageed, I.A. 2024g. Entropic Artificial Intelligence and Knowledge Transfer. Adv Mach Lear Art Inte, 5(2). 01–08.
- Mageed, I.A. 2024h. On the Rényi Entropy Functional, Tsallis Distributions and Lévy Stable Distributions with Entropic Applications to Machine Learning. Soft Computing Fusion with Applications, 1(2). 87–98.
- Mageed, I.A. , 2024i. Towards An Info-Geometric Theory Of The Analysis Of Non-Time Dependent Queueing Systems. Risk Assessment and Management Decisions, 154–197.
- Maratos, F. Byrd, J., Mosey, C. and Maratos, F., 2023. Schooling in England–An Overview. DYNAMIS. Rivista di filosofia e pratiche educative, 5(5). 21–33.
- McGaghie, W.C. Barsuk, J.H., Salzman, D.H., Adler, M., Feinglass, J. and Wayne, D.B., 2020. Mastery learning: opportunities and challenges. Comprehensive healthcare simulation: Mastery learning in health professions education, pp.375-389.
- Megaptche, Y.R.M. and Ramanantsoa, I.J., 2023. Metaphor as a key tool in personal development discourse: An extended conceptual metaphor theory approach to the study of Carol Dweck’s Mindset: The new psychology of success. Review of Cognitive Linguistics.
- Ntoumanis, N. 2023. The bright, dark, and dim light colors of motivation: Advances in conceptualization and measurement from a self-determination theory perspective. In Advances in motivation science (Vol. 10, pp. 37-72). Elsevier. [CrossRef]
- Papert, S.A. 2020. Mindstorms: Children, computers, and powerful ideas. Basic books.
- Reid, L. Button, D. and Brommeyer, M., 2023. Challenging the myth of the digital native: A narrative review. Nursing Reports, 13(2), pp.573-600. [CrossRef]
- Reinhardt, T. 2020. Geertz, Clifford: The Interpretation of Cultures: Selected Essays. In Kindlers literatur lexikon (KLL) (pp. 1-2). Stuttgart: JB Metzler. [CrossRef]
- Richmond, W.K. 2018. The school curriculum. Routledge.
- Rodríguez-Alveal, F. and Aguerrea, M., 2024. Statistical Inference in School Textbooks. An Approach to Statistical Thinking. Uniciencia, 38(1), pp.341-356. [CrossRef]
- Rubin, A. 2022. Learning to reason with data: How did we get here and what do we know?. In Situating Data Science (pp. 154-164). Routledge.
- Rumelhart, D.E. and Ortony, A., 2017. The representation of knowledge in memory 1. In Schooling and the acquisition of knowledge (pp. 99-135). Routledge.
- Schilling, R.L. and Kühn, F., 2021. Counterexamples in measure and integration. Cambridge University Press.
- Sestir, M.A. Kennedy, L.A., Peszka, J.J. and Bartley, J.G., 2023. New statistics, old schools: An overview of current introductory undergraduate and graduate statistics pedagogy practices. Teaching of Psychology, 50(3), pp.211-221.
- Shirley, D. 2017. The new imperatives of educational change. Routldege. New York.
- Third, A. Livingstone, S. and Lansdown, G., 2025. Recognizing children’s rights in relation to the digital environment: challenges of voice and evidence, principle and practice. In Research Handbook on Human Rights and Digital Technology (pp. 325-360). Edward Elgar Publishing.
- Váradi, J. 2022. A review of the literature on the relationship of music education to the development of socio-emotional learning. Sage Open, 12(1), p.21582440211068501. [CrossRef]
- Venohr, Y. 2025. Music Emotion Recognition. In Deep Learning in Personalized Music Emotion Recognition (pp. 5-19). Wiesbaden: Springer Fachmedien Wiesbaden.
- Waterhouse, L. 2023. Why multiple intelligences theory is a neuromyth. Frontiers in psychology, 14, p.1217288. [CrossRef]
- Wickens, C.D. Helton, W.S., Hollands, J.G. and Banbury, S., 2021. Engineering psychology and human performance. Routledge.
- Willingham, D.T. 2021. Why don’t students like school?: A cognitive scientist answers questions about how the mind works and what it means for the classroom. John Wiley & Sons.
- Winnicott, D.W. 2018. Ego distortion in terms of true and false self. In The person who is me (pp. 7-22). Routledge.
- Zayed, A. 2018. Advances in Shannon’s sampling theory. Routledge.
Figure 1.
A Schematic for types of non-responsive minds for thinking.
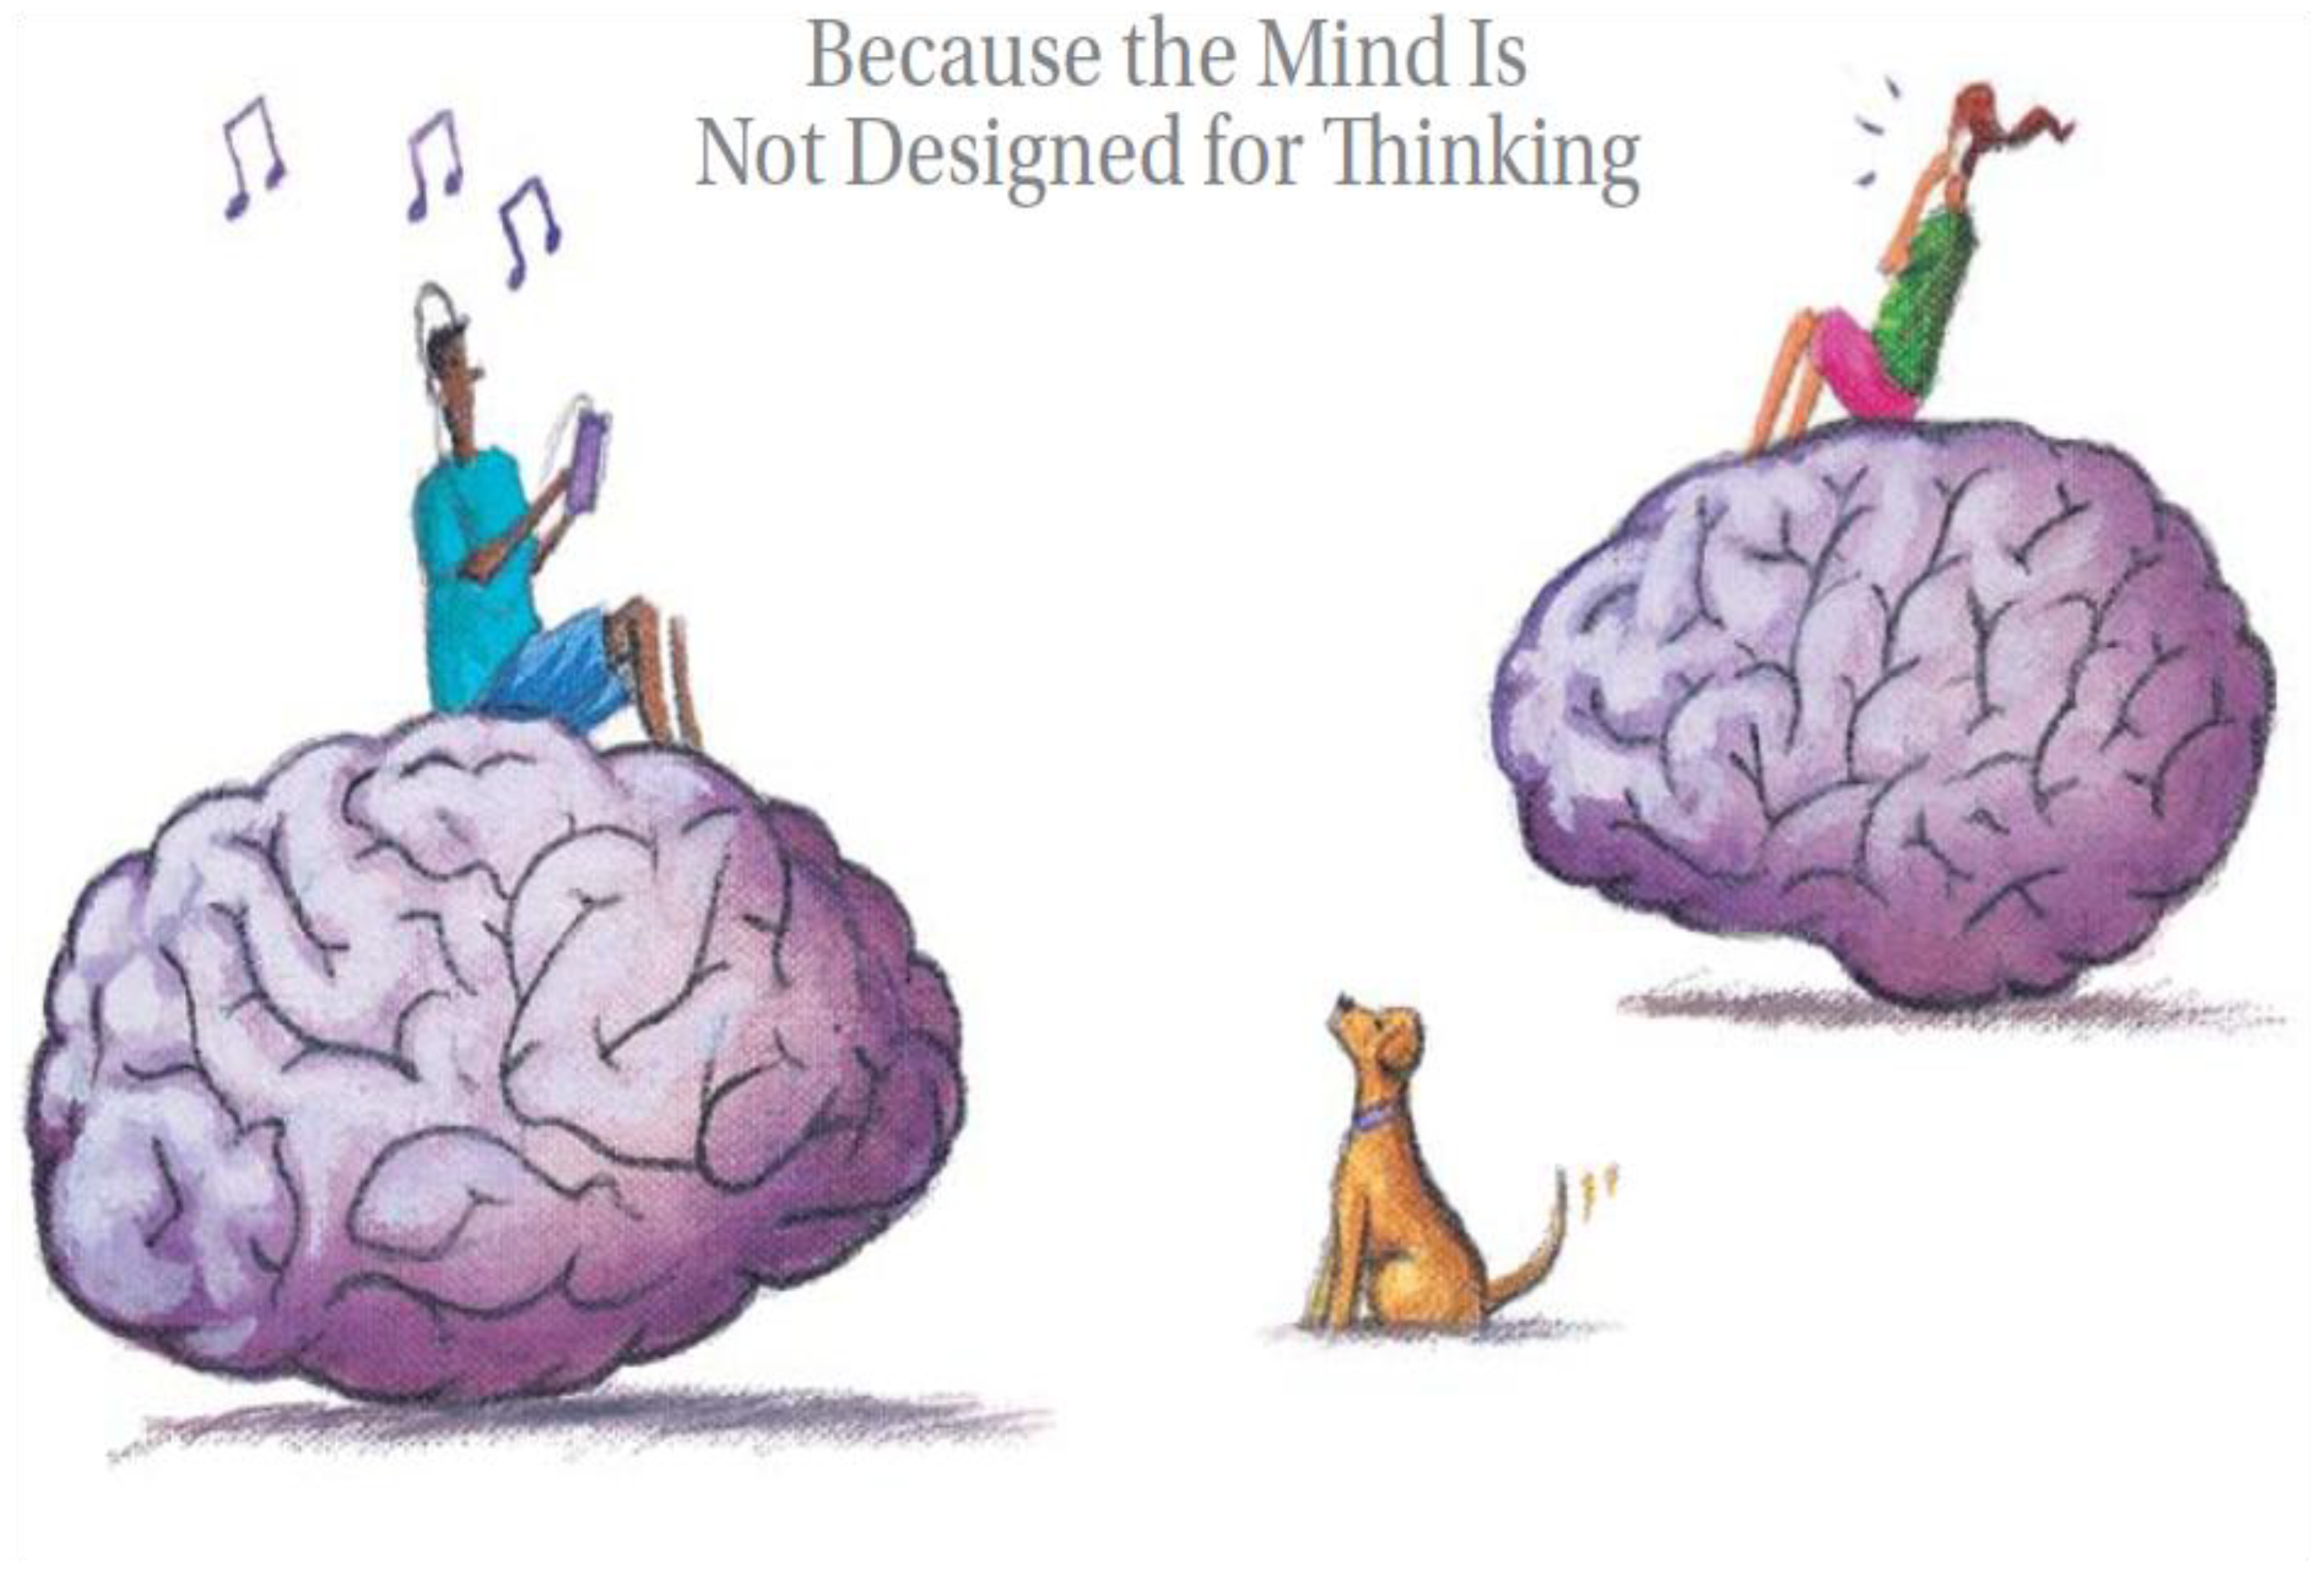
Figure 2.
A Schematic for types of distinct tastes of human reasoning.
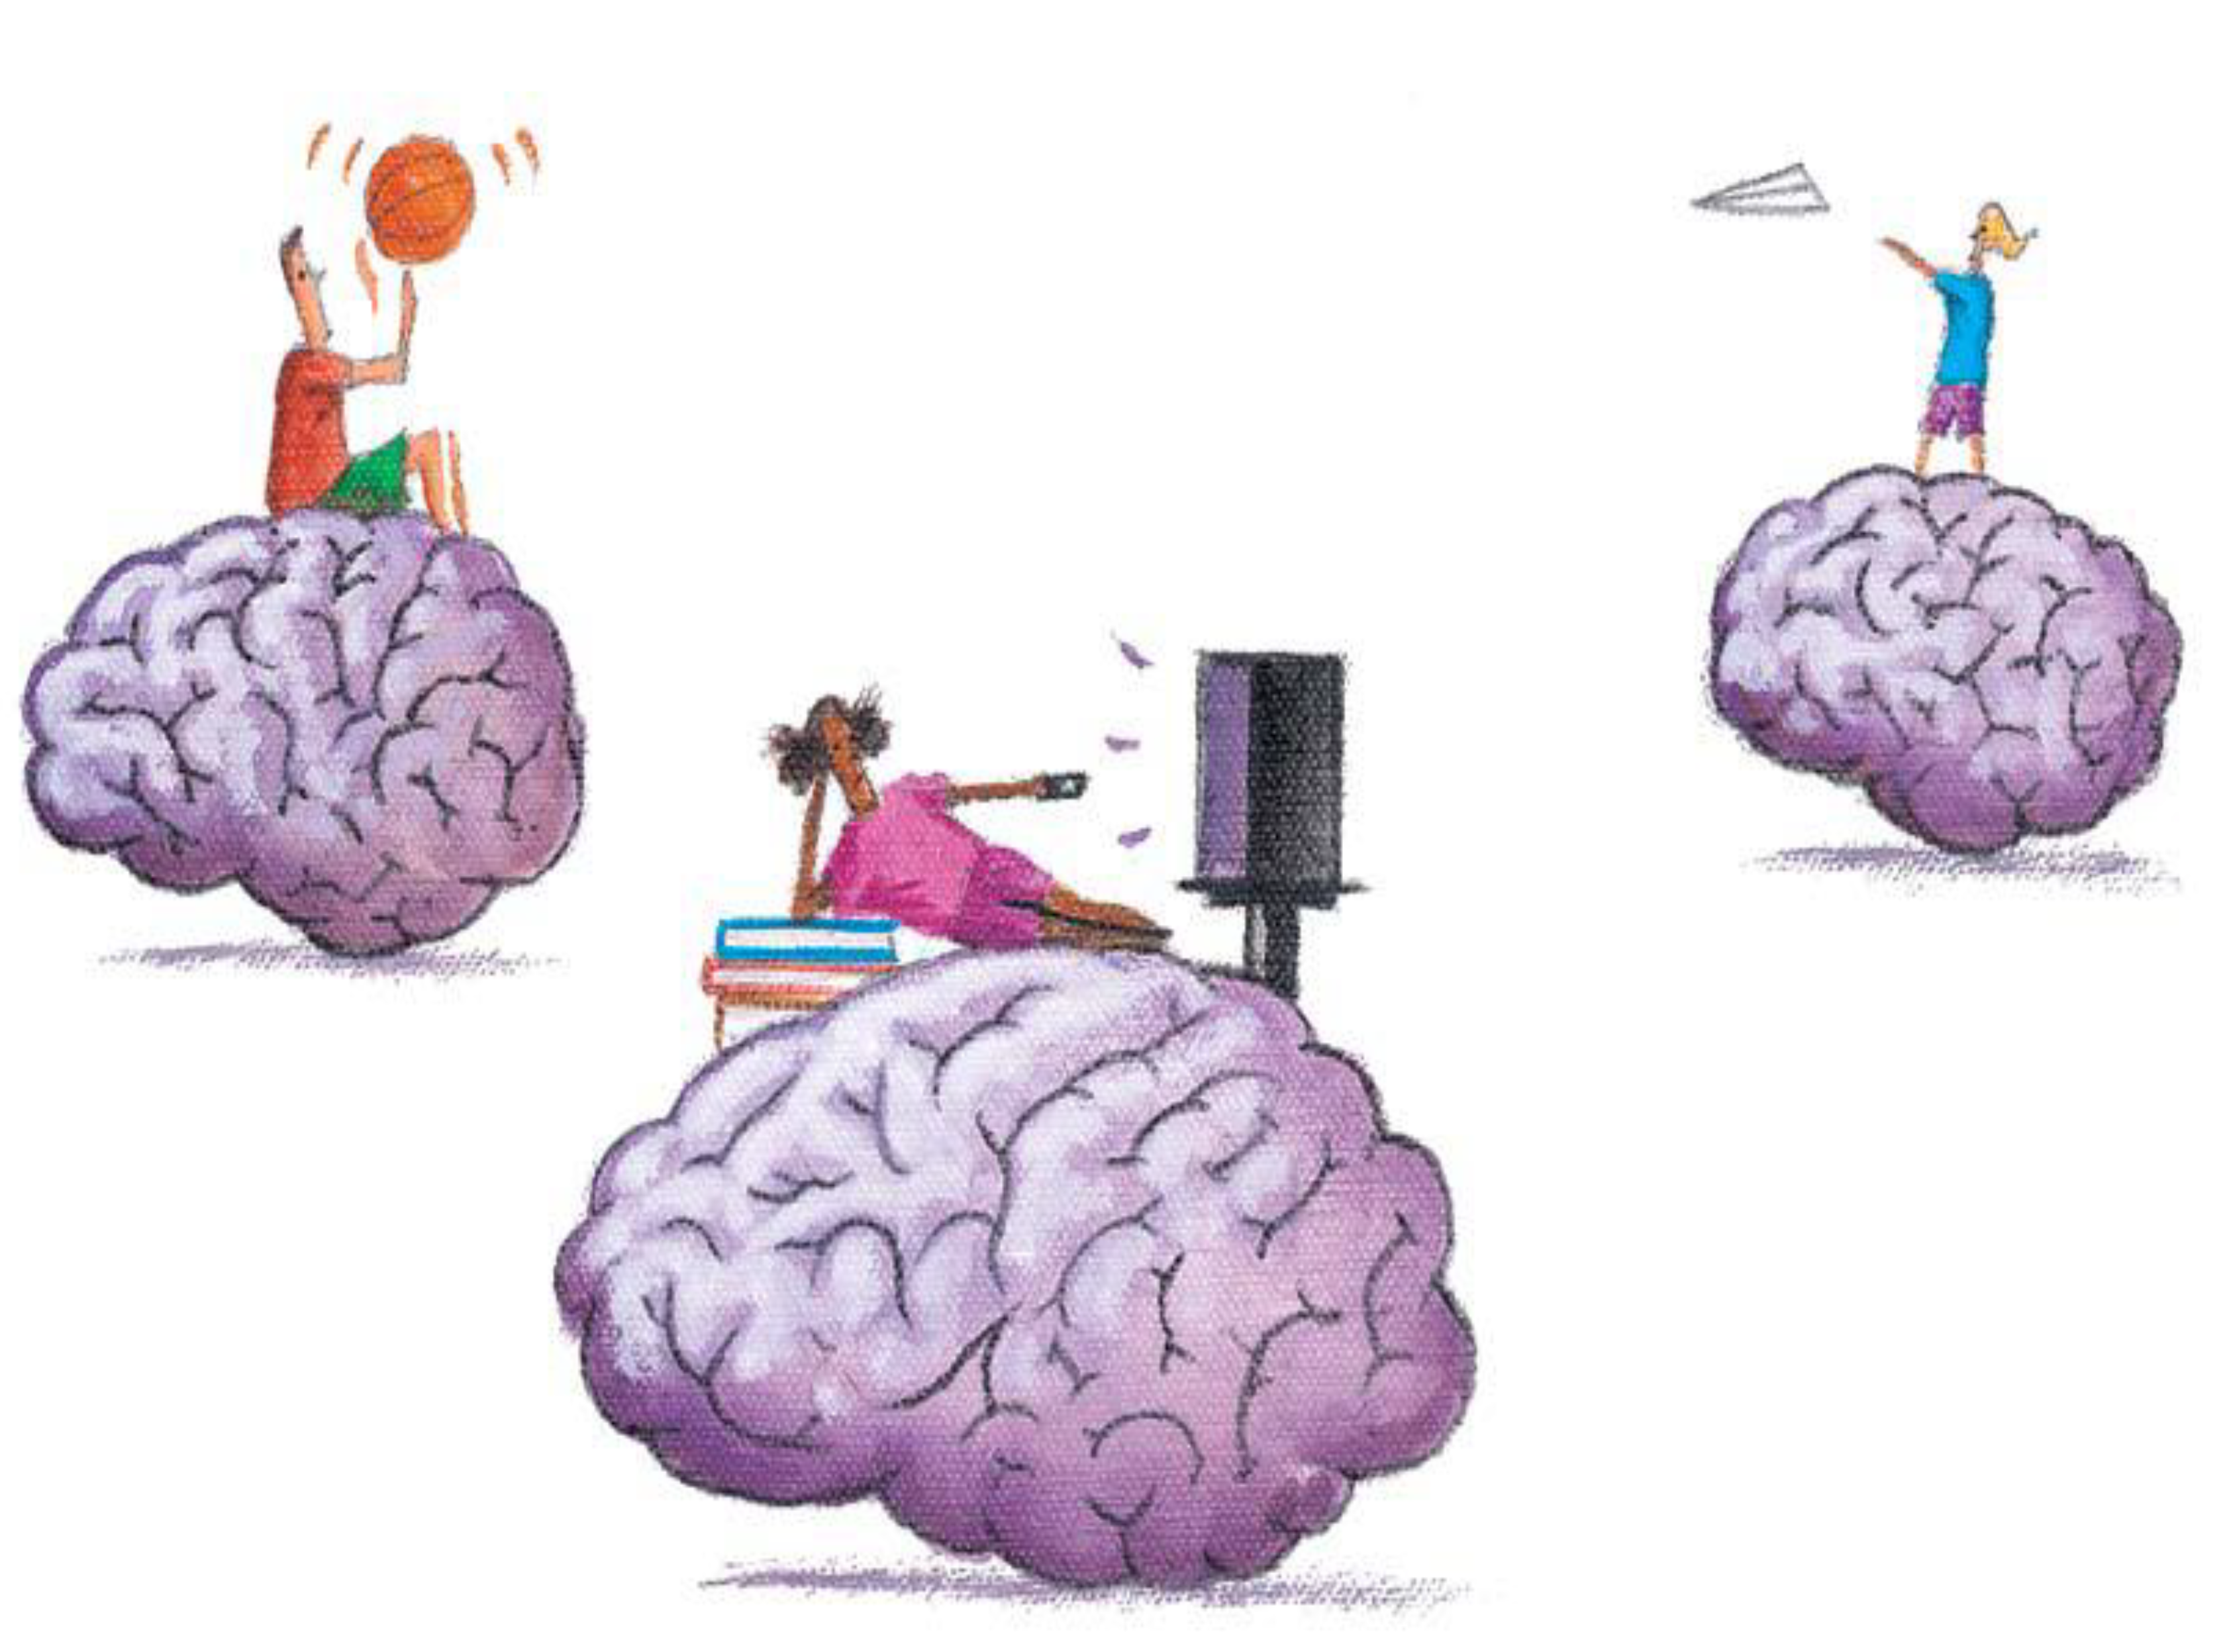
Figure 3.
How Thinking works.
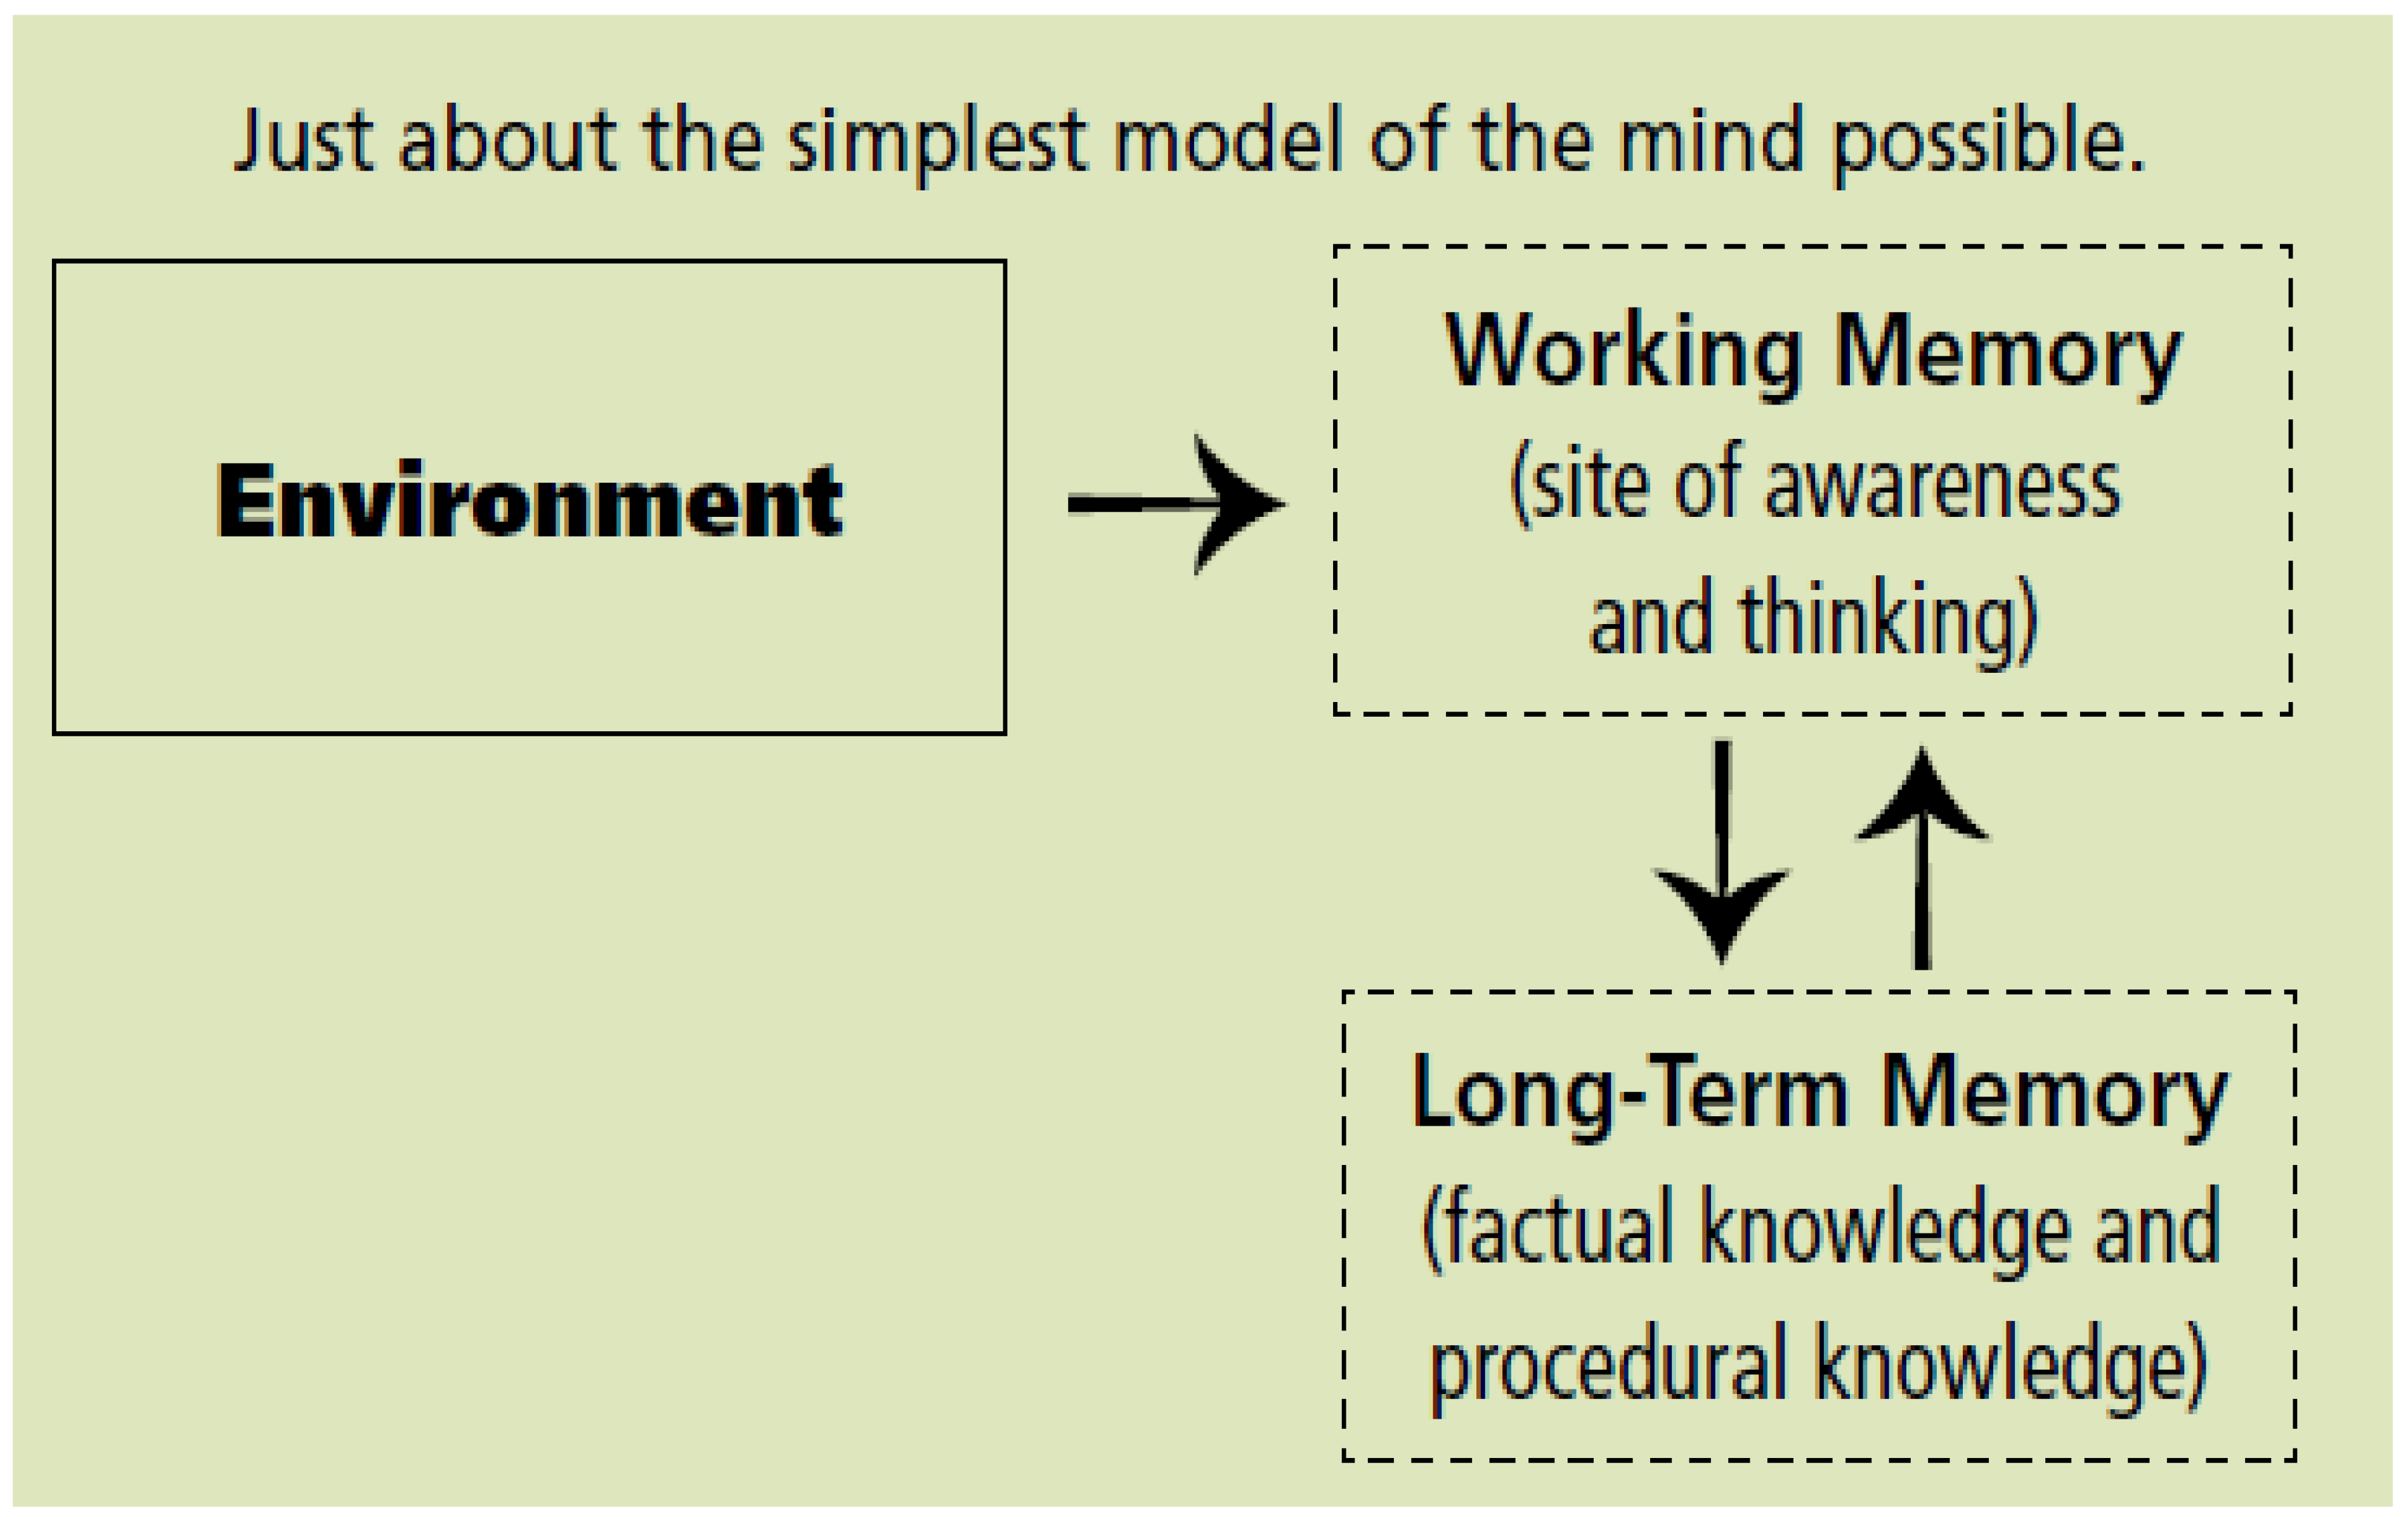
Figure 4.
Cognitive Theory of Multimedia Learning.
Disclaimer/Publisher’s Note: The statements, opinions and data contained in all publications are solely those of the individual author(s) and contributor(s) and not of MDPI and/or the editor(s). MDPI and/or the editor(s) disclaim responsibility for any injury to people or property resulting from any ideas, methods, instructions or products referred to in the content. |
© 2025 by the authors. Licensee MDPI, Basel, Switzerland. This article is an open access article distributed under the terms and conditions of the Creative Commons Attribution (CC BY) license (http://creativecommons.org/licenses/by/4.0/).
Copyright: This open access article is published under a Creative Commons CC BY 4.0 license, which permit the free download, distribution, and reuse, provided that the author and preprint are cited in any reuse.


