
Submitted:
10 June 2025
Posted:
11 June 2025
You are already at the latest version
Abstract
With the rapid development of computer and software technology, three-dimensional (3D) geological modeling has been increasingly used for mineralization prediction. In this study, based on the construction of a geological model for the Bainiuchang Ag polymetallic deposit using 3D modeling technology, an evaluation of the predicted geological factors and 3D mineralization potential were carried out using the information value method. The main favorable geological factors for mineralization in the mine area are the F3 fault, secondary faults, and middle Cambrian Tianpeng Formation. The information value of each predicted unit in the study area was calculated. Anomaly boundaries were quantified using receiver operating characteristic (ROC) curves and fractal analysis, yielding an optimal threshold (information value > 2.6) for target delineation. Three high-priority exploration targets (A1, A2, and A3) were identified, demonstrating the efficacy of combining 3D modeling with probabilistic mineral prospectivity mapping. This approach provides a robust framework for deep and peripheral exploration in structurally complex deposits.

Keywords:
3D deposit model
; 3D information value method
; mineralization prediction
; Bainiuchang Ag polymetallic deposit
; southwest China
1. Introduction
Three-dimensional (3D) geological modeling has been widely applied in the mining industry to visualize and interpret complex geological structures and predict the spatial distribution of mineralization [1,2,3,4]. This technique allows the integration of diverse datasets, including geological maps, borehole data, and geophysical surveys, into a coherent 3D framework. By constructing detailed 3D models, geologists can better understand the relationships between geological structures and mineralization, and identify potential exploration targets more accurately [5,6,7]. For example, 3D geological modeling of the Jiaojia Au deposit in China was used to reconstruct the deep 3D geometry of detachment faults in the Jiaodong Au province using a Bayesian approach, integrating multi-source information and geological constraints to estimate the uncertainty, validate models using drilling data, and identify potential Au exploration targets [8].
The information value method is another important tool for mineralization prediction, and has been widely used to evaluate the contribution of different geological factors to the occurrence of mineral deposits [9,10]. This method quantifies the relationship between geological features and known mineral occurrences, allowing calculation of the information value for each factor and the identification of areas with a high mineralization potential. Although the information value method has been widely applied in 2D mineral prospectivity mapping, few studies have attempted to undertake 3D quantitative mineral prospectivity modeling [11,12,13].
The 3D information value method offers a more realistic simulation of geological elements than the 2D information value method by incorporating the third dimension, which is crucial for accurately representing the spatial distribution and complexity of mineral deposits. This enhanced realism enables better quantification of geological factors influencing mineralization. Compared to machine learning methods, the 3D information value method is transparent and clearly defines relationships between variables. This transparency enhances the interpretability of results, providing clear insights into the geological factors influencing predictions. Moreover, the results are traceable, allowing for step-by-step verification and error correction.
In this study, we focused on the Bainiuchang Ag polymetallic deposit, which has complex geological structures and significant mineralization potential. A detailed geological model of the deposit was constructed, incorporating strata, faults, igneous rocks, and ore bodies. The 3D information value method was used to evaluate the controls of these geological elements on the spatial distribution of mineralization. Specifically, the total information value of each cell within the study area was calculated, and the boundaries of information value anomalies were delineated. Using this approach, three 3D prospecting targets were identified, thereby verifying the feasibility and effectiveness of the 3D information value method applied to this deposit. This study aimed to provide a comprehensive understanding of the geological controls on mineralization in the Bainiuchang deposit and develop a practical approach for identifying potential exploration targets in similar geological settings.
2. Geological Background and Ore Deposit Model
2.1. Geological Background
The Bainiuchang Ag polymetallic deposit is located between the Cathaysia, Yangtze, and Indochina blocks (Figure 1). The area has been affected by multiple phases of tectonism and magmatism, and had excellent conditions for mineralization. The deposit contains 6.47 thousand tons of Ag, 1.72 million tons of Zn, 1.10 million tons of Pb, and abundant Cu, Sn, and In [14,15].
The main strata in the mining area are Devonian (D) and Cambrian (∈) in age. The Devonian rocks are mainly mudstone, siltstone, and limestone (Figure 2a). The Cambrian strata comprise interbedded limestone, mudstone, and siltstone, and the dominant ore-hosting strata are in the middle Cambrian Tianpeng Formation (∈₂t). There are two sets of NW–SE-trending normal faults in the ore district. F3 is the main fault (dip to the SW at 9°–37°) and secondary, steeply dipping faults in the hanging wall of F3 (including F4–F9; dip to the SW at 40°–75°). The main ore bodies occur in the footwall of F3, which is the ore-controlling fault of the deposit (Figure 2b).
Three biotite monzogranitic porphyries are exposed in the southern part of the mining area, and there is concealed biotite monzogranite in the southeastern part of the mining area (Figure 2c). Isotopic dating of the granitic porphyries and monzogranites has yielded Late Cretaceous ages, with the monzogranite having a zircon U–Pb age of 85.26 ± 0.54 Ma [14].
Over 70 ore bodies occur as stratiform to lenticular zones, with >75% of the resources concentrated in the V₁ ore body (along-strike length = 4.8 km, along-dip extent = 2.5 km, average thickness = 5.5 m). The main ore minerals are galena, sphalerite, chalcopyrite, cassiterite, miargyrite, freibergite, and stromeyerite. The main gangue minerals are calcite, dolomite, and quartz (Figure 2d–f).
2.2. Ore Deposit Model
The Bainiuchang ore deposit was modeled in a space that includes surface elevations of 2278–1712 m and is 6.16 km from north to south and 7.00 km from east to west. Geological surveys and prospecting engineering data imported into 3Dmine software were used to determine the geological boundaries.
The modeled strata include the middle Cambrian Dayakou (∈2d), Tianpeng (∈2t), and Longha (∈2l) formations, and a Devonian (D) formation. The modeled faults include the main fault (F3) and secondary faults (F4–F9). The modeled igneous rocks include the granite and granitic porphyry. The ore body models were established with boundary grades of 40 g/t Ag, 0.30 wt.% Pb, 0.50 wt.% Zn, 0.20 wt.% Sn, and 0.30 wt.% Cu.
The cell is the carrier of mineralization information and the basic unit for mineralization prediction. Excessive refinement of cell divisions has been shown to artificially fragment geological phenomena and significantly complicate the processing of large datasets. On the other hand, overly coarse cell divisions can undermine the reliability of the morphological distribution of ore-bearing units. To address these challenges, the following factors were taken into account: the stratigraphy, geological structure, granite distribution, and the occurrence and scale of ore bodies within the deposit model, as well as the computational capacity for data processing. Based on these considerations, a 20 m×20 m×20 m cubic block was selected as the optimal unit for analysis. Based on a 20 × 20 × 20 m cube as the unit block, the modeling area contains 10,833,067 cells of which 25,735 are ore-bearing cells (Figure 3).
3. Prediction Method and Variable Selection
3.1. Information Value Method
The information value method summarizes the relevant information for mineralization prediction and then calculates and analyses the amount of information pertaining to geological factors [18,19]. The obtained information values can be used as indexes to evaluate whether the relationship between each geological factor and the research object is close, and to assess the extent to which the geological factors affect the exploration and thereby predict the location of the favorable mineralization area(s). The equation for calculating the information values is:
where I(xi, H) is the information value of the variable (i.e., geological factor) in a buffer zone, Ni is the number of ore-bearing cells in the buffer zone, N is the total number of ore-bearing cells in the study area, Si is the total number of cells in the buffer zone, and S is the total number of cells in the study area. Based on the information value theory, I(xi, H) can be positive, negative, or zero, indicating there is a positive, negative, or no association, respectively, between the known ore occurrences and buffer zone of each geological factor.
The positive information values were selected and summed to obtain the information value of the evaluation cells in the study area, which is expressed as follows:
where Ii is the information value of a given cell, and n is the number of geological factors affecting the cell. The higher the Ii value, the greater the possibility of the presence of ore.
3.2. Prediction Variable Selection and 3D Buffer Zones
The Tianpeng Formation, faults (F3 and secondary faults), granites, and granitic porphyries are closely associated with mineralization in the Bainiuchang ore deposit. The Tianpeng Formation can be divided into three lithological sequences (i.e., ∈2ta, ∈2tb, and ∈2tc in ascending stratigraphic order), and each sequence is classified as a buffer zone (Figure 4a). We assigned values to the Tianpeng Formation unit cells based on the stratigraphic thickness to obtain the thickness data for the buffer zones (Figure 4b). We searched on both sides of the fault plane to assign the fault buffer zone (F3 and secondary faults; Figure 4c–d). We searched from the granite or granitic porphyry roof to the outside of the contact zone to assign the granite buffer zone (granites and granitic porphyries; Figure 4e–f).
4. Mineralization Prediction
4.1. Information Value Calculation
Based on the buffer zone parameters of each geological factor, the number of cells (Si) and ore-bearing cells (Ni) in each zone were counted, and the values of Si/S and Ni/N in each zone were calculated based on the total number of unit blocks (S = 10,833,067) and ore-bearing cells (N = 25,735). The information values of the geological factors (I[xi,H]) in each zone were then calculated (Table 1).
The information value represents the strength of the correlation between each prediction variable and the mineralization. In terms of information values, the top-ranked geological factors are the F3 fault, secondary faults, and Tianpeng Formation. The information value for the zone that is 0–60 m from the F3 fault plane is high. Zones with distances of 0–240 m from the secondary faults were also conducive to mineralization. Zones with a thickness of 320–560 m for the Tianpeng Formation have high information values and were conducive to mineralization. ∈2tc was also a favorable location for mineralization.
Positive information values were assigned to the cells in the 3Dmine software system, and each cell has information values related to geological factors such as the Tianpeng Formation, faults, or granites. The total information value of each cell was obtained by summing the information values for each geological factor. A higher total information value indicates a greater possibility of ore occurrence.
A total of 8,953,536 cell information values were obtained, and the maximum, minimum, and mean values were 5.58, 0.02, and 0.70, respectively. The standard deviation was 0.80 and the variance was 0.63. The mean value of the 25,735 ore-bearing cells was 4.00, which is generally higher than that of the other cells. The ore-bearing rate was calculated as the ratio of the number of ore-bearing cells to the total number of cells in an interval (Table 2; Figure 5). The statistical results show that the increase in the information value in each interval with a number of cells tends to decrease (Figure 5a), while the ore-bearing rate tends to increase (Figure 5b). It is possible to reduce the extent of the exploration area based on use of the information values to identify prospecting targets.
4.2. Prediction Boundary of the Total Information Value
We calculated the information value anomaly boundaries using two methods and evaluated these using receiver operating characteristic (ROC) curves to find the best-fit boundaries [20]. The first method counts the number of ore-bearing cells that are larger than the different boundaries and calculates its percentage of the total ore-bearing cells and plots a curve (Table 2; Figure 6a). As the information value boundary increases, the curve changes from flat to steep, and the boundary information value on the curve is 3.0 (Figure 6a). The second method utilizes a 2D fractal approach, whereby an information value log–log plot of the cells was obtained, from which the boundary of the prospecting cells was calculated to be 2.6 (Figure 6b).
The ROC curve was used to evaluate the performance of the prospectivity models [21]. The AUC value is the area under the ROC curve, and a larger AUC value indicates a more effective model [22].
We used the prediction boundaries of 3.0 and 2.6 as test variables, and whether these belong to ore-bearing cells as the state variable, to construct the ROC curves (Figure 7). The AUC value of the prediction boundary of 3.0 is 0.791, and that for the boundary of 2.6 is 0.836. However, the 2D fractal method prediction boundary of 2.6 is a better fit.
4.3. Prospecting Target
A total of 376,704 cells were obtained according to the prediction boundary (information value > 2.6), amongst which 23,561 unit blocks were ore-bearing cells. The mean information value of these was 3.37, and that for the ore-bearing cells was 4.23.
The spatial concentration of anomalous cells at the periphery of the ore bodies and explored areas were selected as exploration targets. Three target areas were obtained. The A1 target has 28,405 anomalous cells, a volume of 227,240,000 m3, and a mean information value of 3.35. The A2 target has 59,932 anomalous cells, a volume of 479,456,000 m3, and a mean information value of 3.03. The A3 target has 19,226 anomalous cells, a volume of 153,808,000 m3, and a mean information value of 3.41 (Figure 8).
5. Results and Discussion
5.1. Ore-Controlling Geological Factors
The origin of the ore materials in the Bainiuchang deposit is debated, with possibilities including a submarine exhalative origin [23], magmatic–hydrothermal origin [24,25,26], or a combination of both [27,28]. The information value method evaluates the importance ranking of each geological factor for the mineralization prediction based on the spatial relationship between the prediction variables and ore bodies. The top-ranked geological factors are the F3 fault, secondary faults, and the Tianpeng Formation. The geological factor with the strongest indicative value for mineral prospecting is the F3 fault. If the deposit was of submarine exhalative origin, there would have been later displacement along the F3 fault due to differences in physical properties between the ore body and overlying strata. If the deposit was magmatic–hydrothermal in origin, then F3 may have been the channel for the ore-forming hydrothermal fluids and provided the space for the precipitation of ore materials and the formation of the ore body.
The statistical results show there is a close spatial relationship between the ore bodies and secondary faults. The ore bodies occur mainly in the Tianpeng Formation (∈2tc), and areas with a thickness of 320–560 m exhibit good mineralization, suggesting that structural permeability and lithological competency controlled the mineralization.
5.2. Information Value Distribution
The statistical results show that the mean information value of the ore-bearing cells is 4.00, whereas the mean value of all cells is 0.70. A higher information value characterizes a smaller number of cells and is associated with a higher ore-bearing rate (Table 2; Figure 5). This indicates that we can identify prospecting targets based on the total information value and thus improve the mineralization prediction in the study area.
5.3. Prediction Boundary and Target
The ROC curve evaluation results show the best prediction boundary of 2.6 (AUC = 0.836) was obtained using the 2D fractal method. Three prospecting targets—A1, A2, and A3—are located in the Tianpeng Formation. A1 is closer to granites in the southeast of the mining area, and the granites may have provided the thermal driving force for the migration of mineralizing fluids. A2 and A3 are spatially related to F3 and secondary faults.
6. Conclusions
In this study, a 3D geological model of the Bainiuchang Ag polymetallic deposit was successfully constructed using advanced 3D modeling technology. This model provides a comprehensive and detailed representation of the geological structures and spatial relationships within the deposit. It serves as a framework for the subsequent evaluation of geological factors and mineralization potential. The model not only integrates various types of geological data, but also enhances our understanding of the geological setting of the deposit, which is crucial for accurate mineralization prediction.
The information value method was used to evaluate the importance of different geological factors in the mineralization process. The results indicate that the F3 fault, secondary faults, and middle Cambrian Tianpeng Formation are the most significant geological factors controlling mineralization in the study area. In particular, the F3 fault is the geological factor with the greatest significance for mineral prospecting. This finding highlights the key role of structural features and specific stratigraphic units in controlling the formation and distribution of mineral deposits. The close spatial relationship between ore bodies and these geological factors underscores the importance of incorporating such factors into mineralization prediction models.
A statistical analysis of the information value distribution revealed that the mean information value of ore-bearing cells is significantly higher (4.00) than that of all cells (0.70). This suggests that areas with higher information values are more likely to contain mineralization. The inverse relationship between the information values and number of cells indicates that high-value cells are relatively rare, but are associated with a higher ore-bearing rate. This characteristic can be utilized to identify potential exploration targets by focusing on areas with high total information values. This approach can effectively improve the accuracy of mineralization prediction in the study area and optimize exploration efforts.
The ROC curve was used to determine the optimal prediction boundary, which was found to be 2.6 with an AUC value of 0.836 using the 2D fractal method. This boundary effectively distinguishes between areas with high and low mineralization potential. Based on this boundary, three exploration target areas (A1, A2, and A3) were identified within the Tianpeng Formation. These target areas are spatially associated with key geological factors, such as F3 and secondary faults. Specifically, A1 is closer to the granite, while A2 and A3 are related to F3 and secondary faults. These target areas represent the most promising locations for further exploration and have the potential to yield significant mineral discoveries.
The modeling results have important implications for the Bainiuchang and other similar deposits. They can be used to guide deep and peripheral exploration activities, helping to identify new mineralization zones and expand the resource base. The successful integration of 3D geological modeling and the information value method shows that this approach is robust and effective for mineralization prediction. This approach can be adapted and applied to other mineral deposits with similar geological settings, providing a valuable tool for the exploration industry to enhance the efficiency and success of mineral exploration.
Author Contributions
Methodology, F.J., J.G., G.Z., and H.C.; formal analysis, F.J., G.M., L.J., P.P., Z.W., and C.Y.; investigation, F.J., L.J., H.C., and P.P.; resources, F.J., G.Z., G.M., and L.J.; data curation, F.J., Z.W., and C.Y.; writing—original draft preparation, F.J.; funding acquisition, G.Z., J.G., and H.C.; All authors have read and agreed to the published version of the manuscript.
Funding
This research was funded by a Research Fund Project of the Yunnan Provincial Department of Education (Grant 2025J1389), the Doctoral Research Start-up Fund of Kunming Metallurgy College in 2021 (Grant Xxrcxm202102), and a Yunnan Provincial Major Science and Technology Special Program Project (Grant 202402AB080006).
Data Availability Statement
Not applicable.
Acknowledgments
We thank Jiaxi Zhou of Yunnan University for valuable suggestions.
Conflicts of Interest
The authors declare that the research was conducted without any commercial or financial relationships that could be perceived as a potential conflict of interest.
References
- Chen, J.P.; Shi, R.; Chen, Z.P.; Wang, L.M.; Sun, Y. 3D positional and quantitative prediction of the Xiaoqinling gold ore belt in Tongguan, Shaanxi, China. Acta Geol. Sin. 2012, 86, 653–660. [Google Scholar] [CrossRef]
- Li, X.H.; Yuan, F.; Zhang, M.M.; Jia, C.; Jowitt, S.M.; Ord, A.; Zheng, T.K.; Hu, X.Y.; Li, Y. Three-dimensional mineral prospectivity modeling for targeting of concealed mineralization within the Zhonggu iron orefield, Ningwu Basin, China. Ore Geol. Rev. 2015, 71, 633–654. [Google Scholar] [CrossRef]
- Mohammadpour, M.; Bahroudi, A.; Abedi, M. Three dimensional mineral prospectivity modeling by evidential belief functions, a case study from kahang porphyry cu deposit. J. Afr. Earth Sci. 2021, 174, 104098. [Google Scholar] [CrossRef]
- Li, C.; Liu, B.L.; Xiao, K.Y.; Kong, Y.H.; Wang, L.; Tang, R.; Xie, M.; Wu, Y.X. Metallogenic Prediction of the Zaozigou Gold Deposit Using 3D Geological and Geochemical Modeling. Minerals 2023, 13, 1205. [Google Scholar] [CrossRef]
- Payne, C.E.; Cunningham, F.; Peters, K.J.; Nielsen, S.; Puccioni, E.; Wildman, C.; Partington, G.A. From 2D to 3D: Prospectivity modelling in the Taupo Volcanic Zone, New Zealand. Ore Geol. Rev. 2014, 71, 558–577. [Google Scholar] [CrossRef]
- Nielsen, S.H.H.; Cunningham, F.; Hay, R.; Partington, G.; Stokes, M. 3D prospectivity modelling of orogenic gold in the Marymia Inlier, Western Australia. Ore Geol. Rev. 2015, 71, 578–591. [Google Scholar] [CrossRef]
- Mao, X.C.; Zhang, B.; Deng, H.; Zou, Y.H.; Chen, J. Three-dimensional morphological analysis method for geologic bodies and its parallel implementation. Comput. Geosci. 2016, 96, 11–22. [Google Scholar] [CrossRef]
- Huang, J.X.; Deng, H. , Mao, X.C.; Chen, G.H.; Yu, S.Y.; Liu, Z.K. 3D modeling of detachment faults in the Jiaodong gold province, eastern China: a Bayesian inference perspective and its exploration implications. Ore Geol. Rev. 2023, 154, 105307. [Google Scholar] [CrossRef]
- Porwal, A.; Carranza, E.J.M. Introduction to the Special Issue: GIS-based mineral potential modelling and geological data analyses for mineral exploration. Ore Geol. Rev. 2015, 71, 477–483. [Google Scholar] [CrossRef]
- Roshanravan, B.; Aghajani, H.; Yousefi, M.; Kreuzer, O. An improved prediction-area plot for prospectivity analysis of mineral deposits. Nat. Resour. Res. 2019, 28, 1089–1105. [Google Scholar] [CrossRef]
- Mao, X.C.; Ren, J.; Liu, Z.K.; Chen, J.; Tang, L.; Deng, H.; Bayless, R.C.; Yang, B.; Wang, M.J.; Liu, C.M. Three-dimensional prospectivity modeling of the Jiaojia-type gold deposit, Jiaodong Peninsula, Eastern China: A case study of the Dayingezhuang deposit. J. Geochem. Explor. 2019, 203, 27–44. [Google Scholar] [CrossRef]
- Xiao, K.Y.; Xiang, J.; Fan, M.J.; Xu, Y. 3D mineral prospectivity mapping based on deep metallogenic prediction theory: A case study of the Lala Copper Mine, Sichuan, China. J. Earth Sci. 2021, 32, 348–357. [Google Scholar] [CrossRef]
- Zhang, Q.P.; Chen, J.P.; Xu, H.; Jia, Y.L.; Chen, X.W.; Jia, Z.; Liu, H. Three-dimensional mineral prospectivity mapping by XGBoost modeling: A case study of the Lannigou gold deposit, China. Nat. Resour. Res. 2022, 31, 1135–1156. [Google Scholar] [CrossRef]
- Zhang, H.P.; Liu, J.S.; Li, X.B.; Zhang, X.L. Relationship of granites to tin, silver, copper, lead, zinc, polymetallic deposits in southeastern Yunnan China. Contrib. Geol. Miner. Resour. Res. 2006, 21, 87–90. [Google Scholar]
- Du, S.J.; Wen, H.J.; Liu, S.R.; Qin, C.J.; Yan, Y.F.; Yang, G.S.; Feng, P.Y. Mineralogy and Metallogenesis of the Sanbao Mn–Ag (Zn-Pb) Deposit in the Laojunshan Ore District, SE Yunnan Province, China. Minerals 2020, 10, 650. [Google Scholar] [CrossRef]
- Wang, Q.; Li, J.W.; Jian, P.; Zhao, Z.H.; Xiong, X.L.; Bao, Z.W.; Xu, J.F.; Li, C.F.; Ma, J.L. Alkaline syenites in eastern Cathaysia (South China): Link to Permian–Triassic transtension. Earth Planet. Sci. Lett. 2005, 230, 339–354. [Google Scholar] [CrossRef]
- Yang, G.S.; Wang, K.; Yan, Y.F.; Jia, F.J.; Li, P.Y.; Mao, Z.B.; Zhou, Y. Genesis of the ore-bearing skarns in Laojunshan Sn-W-Zn-In polymetallic ore district, southeastern Yunnan Province, China. Acta Petrol. Sin. 2019, 35, 3333–3354. [Google Scholar] [CrossRef]
- Yin K, L. Statistical prediction model for slope instability of metamorphosed rocks. Proceedings of the 5th International Symposium on Landslides. 1988, 2, 1269–1272. [Google Scholar]
- Zêzere, J.L. Landslide susceptibility assessment considering landslide typology, a case study in the area north of Lisbon (Portugal). Nat. Hazards Earth Syst. Sci. 2002, 2, 73–82. [Google Scholar] [CrossRef]
- Hanley, J.A.; Mcneil, B.J. A method of comparing the areas under receiver operating characteristic curves derived from the same cases. Radiology 1983, 148, 839–843. [Google Scholar] [CrossRef]
- Yang, N.; Zhang, Z.K.; Yang, J.H.; Hong, Z.L. 2022. Applications of data augmentation in mineral prospectivity prediction based on convolutional neural networks. Computers and Geosciences. [CrossRef]
- Fawcett, T. An introduction to ROC analysis. Pattern Recognit. Lett. 2006, 27, 861–874. [Google Scholar] [CrossRef]
- Zhu, C.H.; Zhang, Q.; He, Y.L. The characteristics of mineralizing elements of the Bainiuchang silver Polymetallic deposit in southeastern Yunnan. Bull. Mineral. Petrol. Geochem. 2005, 24, 327–332. [Google Scholar]
- Liu, J.S.; Zhang, H.P.; Fang, W.X.; Guo, J.; Zhang, X.L. Problems pertaining to Bainiuchang silver, polymetallic deposit in Mengzi country Yunan China. Strateg. Study CAE. 2005, 7, 238–244. [Google Scholar]
- Zhang, Y.H.; Zhang, S.T.; Liu, H.W. A Comparative Study on Ore- Controlling Factors of Large- Scale Polymetallic Ore Deposits in Bozhushan Area of Southeast Yunnan. J. Kunming Univ. Sci. Technol. (Sci. Technol.) 2012, 37, 1–7. [Google Scholar]
- Li, K.W.; Zhang, Q.; Wang, D.P.; Cai, Y.; Liu, Y.P. LA-ICP-MS U-Pb zircon dating of the Bozhushan granite in Southeast Yunnan. Chin. J. Geochem. 2013, 32, 170–180. [Google Scholar] [CrossRef]
- Chen, X.C.; Hu, R.Z.; Bi, X.W.; Zhong, H.; Lan, J.B.; Zhao, C.H.; Zhu, J.J. Zircon U–Pb ages and Hf–O isotopes, and whole-rock Sr–Nd isotopes of the Bozhushan granite, Yunnan province, SW China: Constraints on petrogenesis and tectonic setting. J. Asian Earth Sci. 2015, 99, 57–71. [Google Scholar] [CrossRef]
- Jian, L. Superimposed Mineralization System and Metallogenic Model of Bainiuchang Super Large Polymetallic Deposits, Southeastern Yunnan, China. Kunming University of Science and Technology. Ph.D. Dissertation, Kunming University of Science and Technology, Kunming, China, 2016. [Google Scholar]
Figure 1.
Tectonic setting and regional geological map of the Bainiuchang deposit. (a) Simplified map of eastern Asia showing major tectonic units (after [16]). (b) Regional geological map (after [17]).
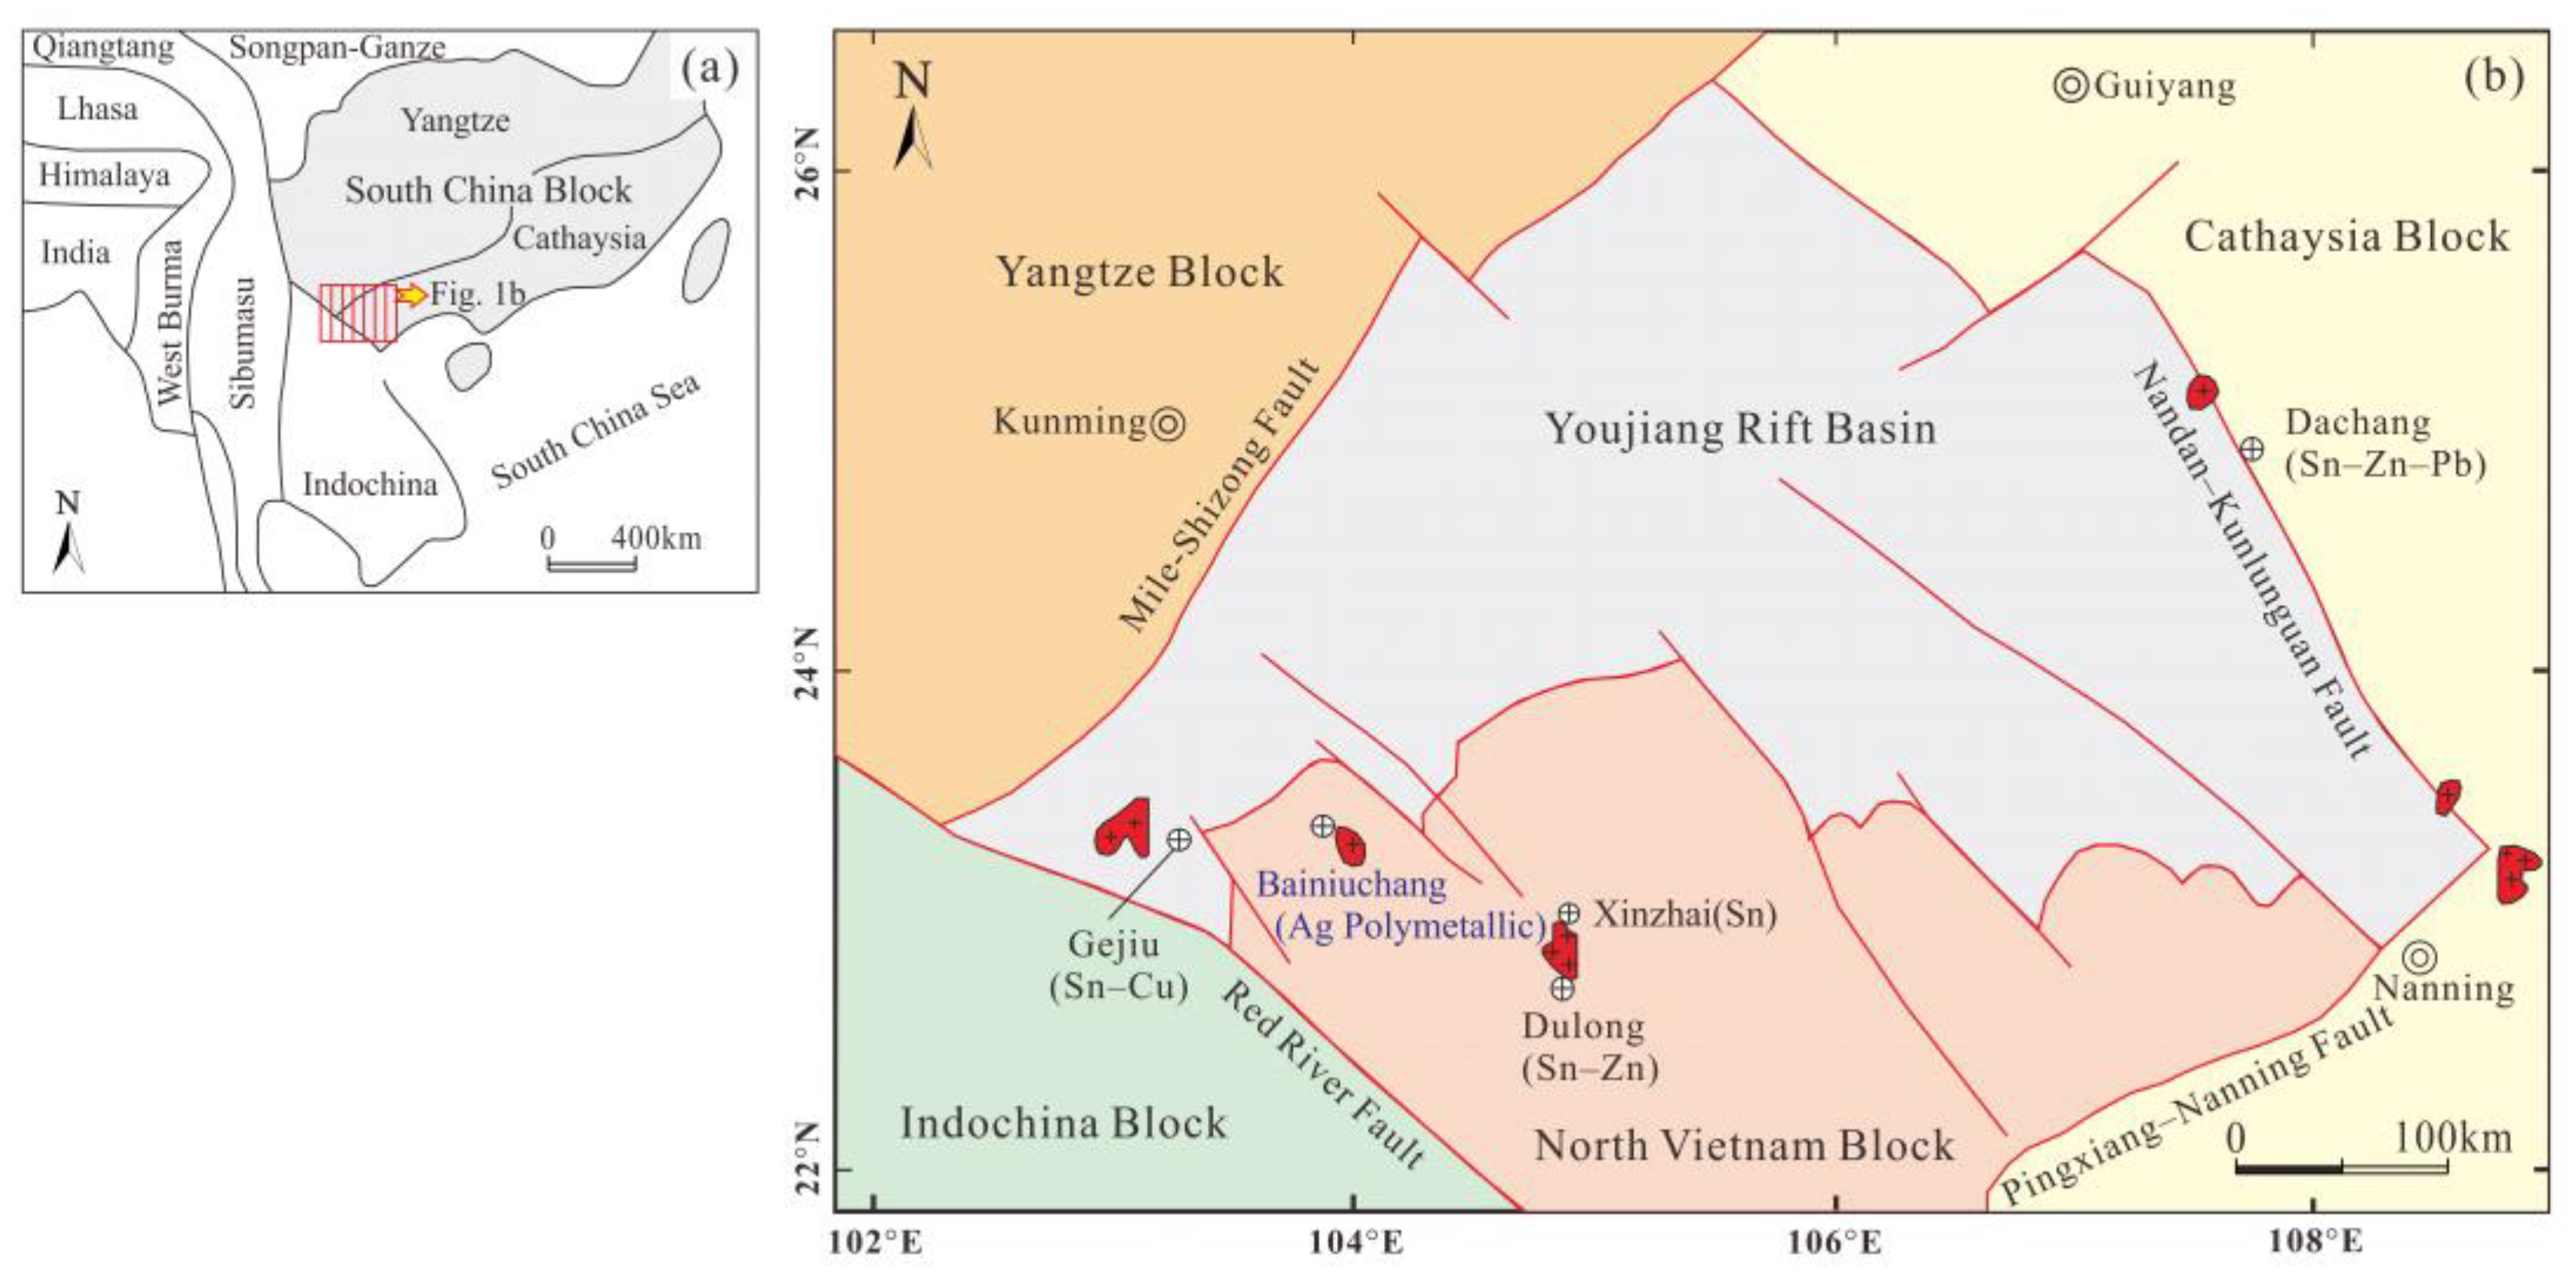
Figure 2.
Strata, fault, granite, and ore body at Bainiuchang ore deposit. (a) The Devonian (D) and Cambrian (∈) formations are in parallel unconformity contact. (b) The fault plane of the F3 fault is consistent with the strata. (c) The granite intrudes into the Cambrian limestone (∈) in the form of dikes. (d) Massive polymetallic sulfide ore body. (e) The contact interface between the ore body and the Cambrian limestone (∈) is distinct. (g) Microfolds in polymetallic sulfide ore.
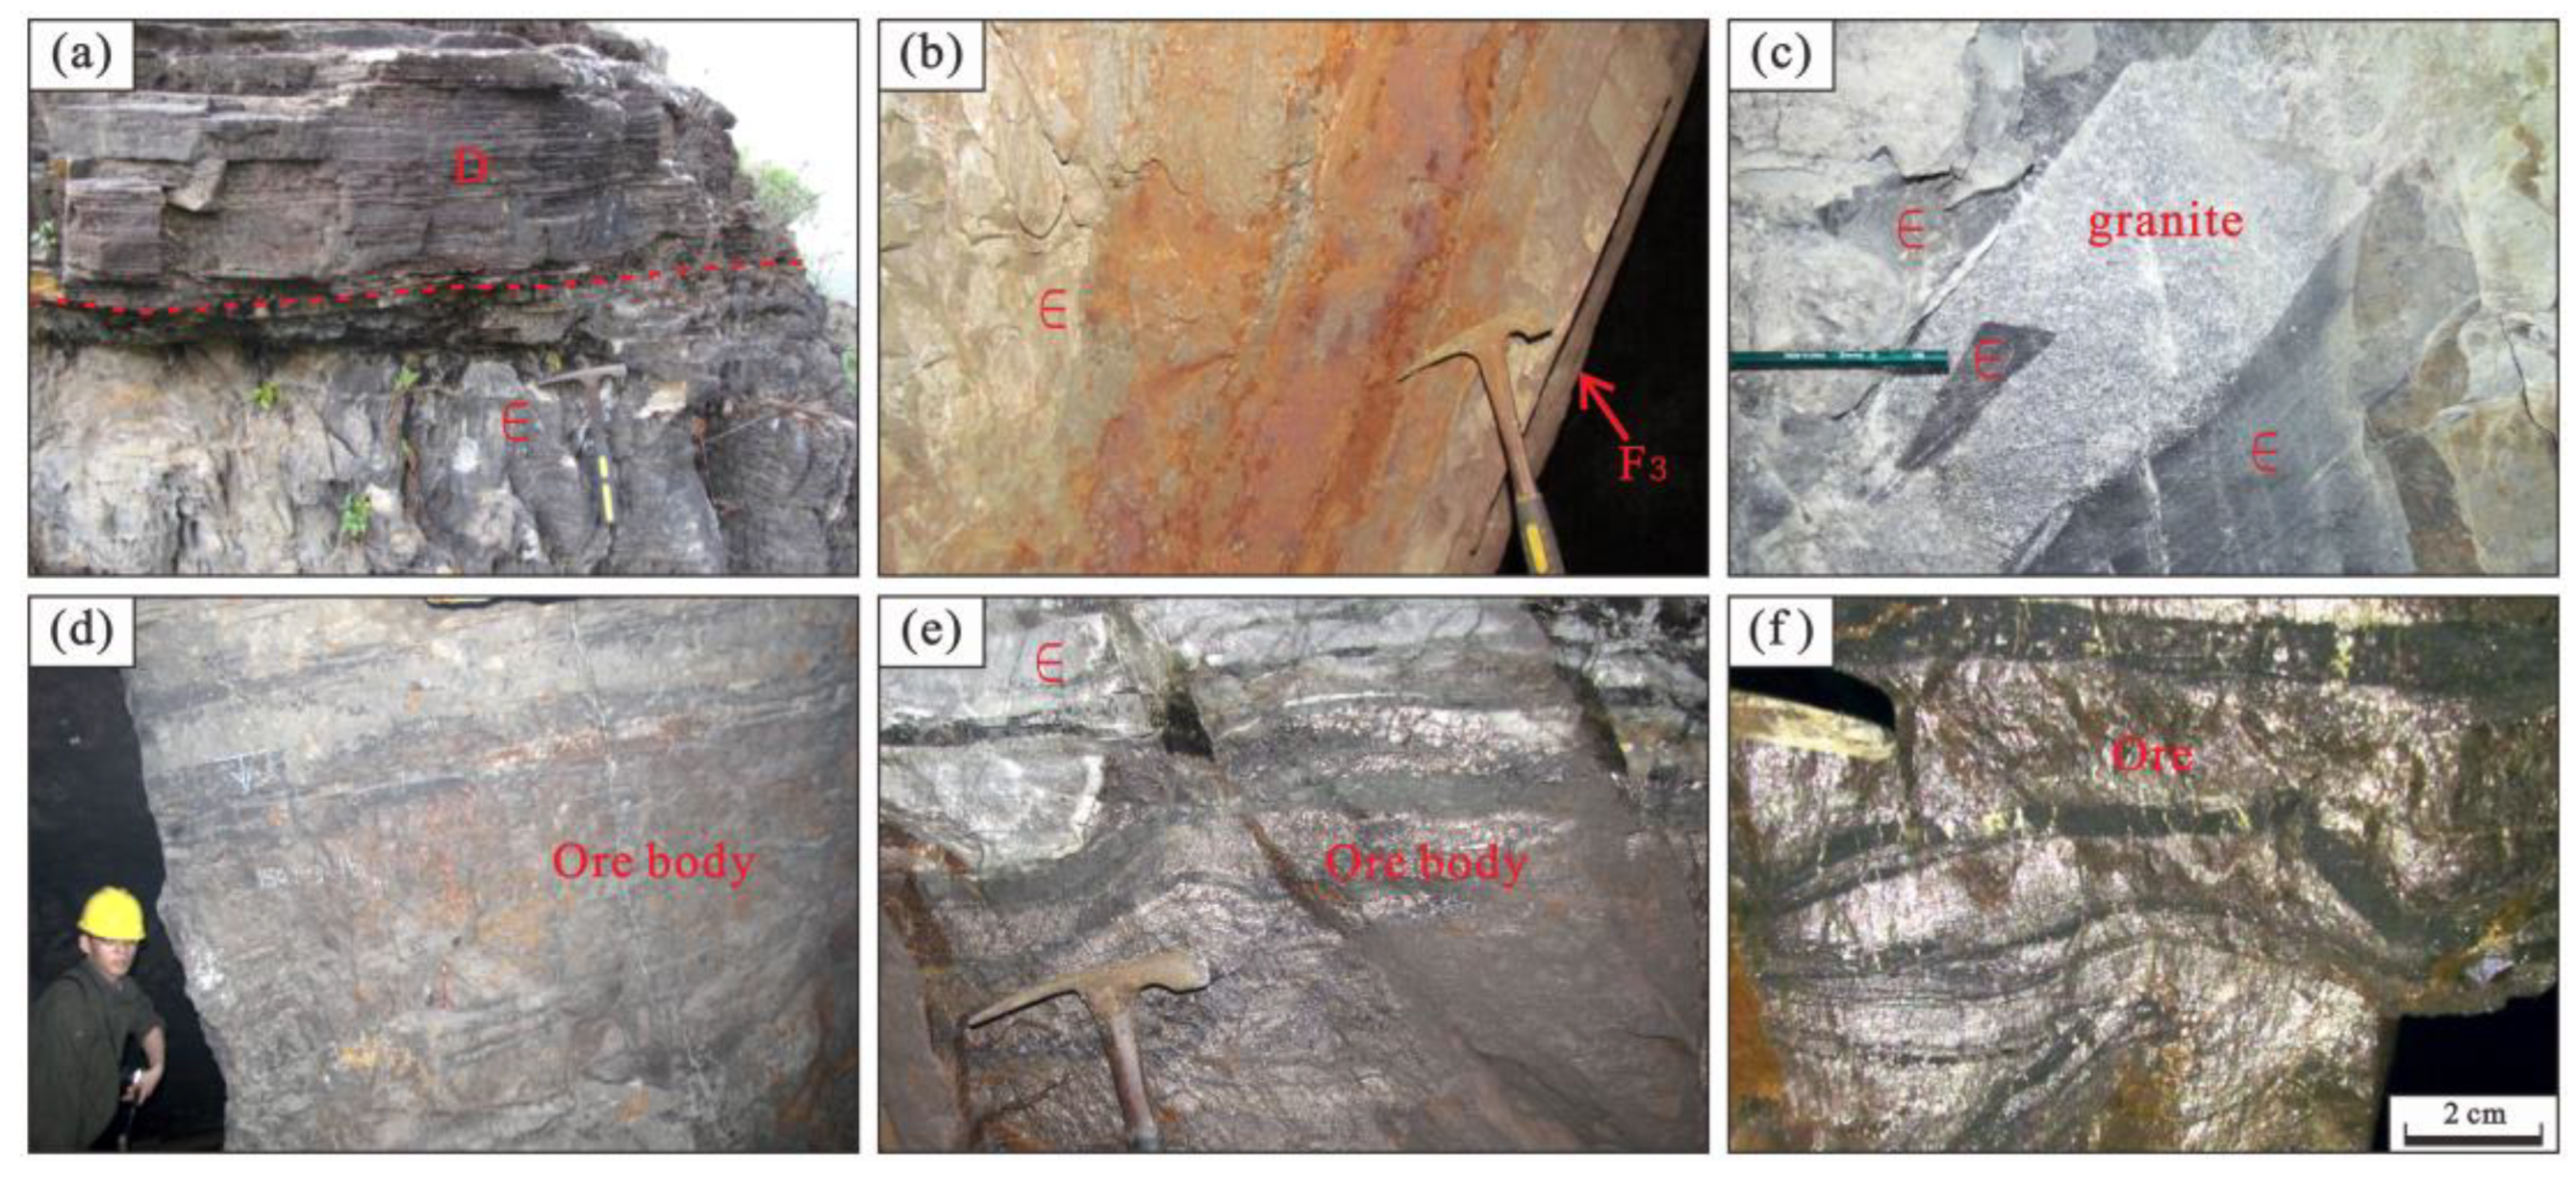
Figure 3.
Geological model of the Bainiuchang ore deposit. (a) Geological model of the strata, granite, and granitic porphyry. (b) Model of the faults and ore bodies. ∈2d—middle Cambrian Dayakou Formation; ∈2t—middle Cambrian Tianpeng Formation; ∈2l—middle Cambrian Longha Formation; D—Devonian formation; F3—F3 fault; F4–F9—secondary faults.
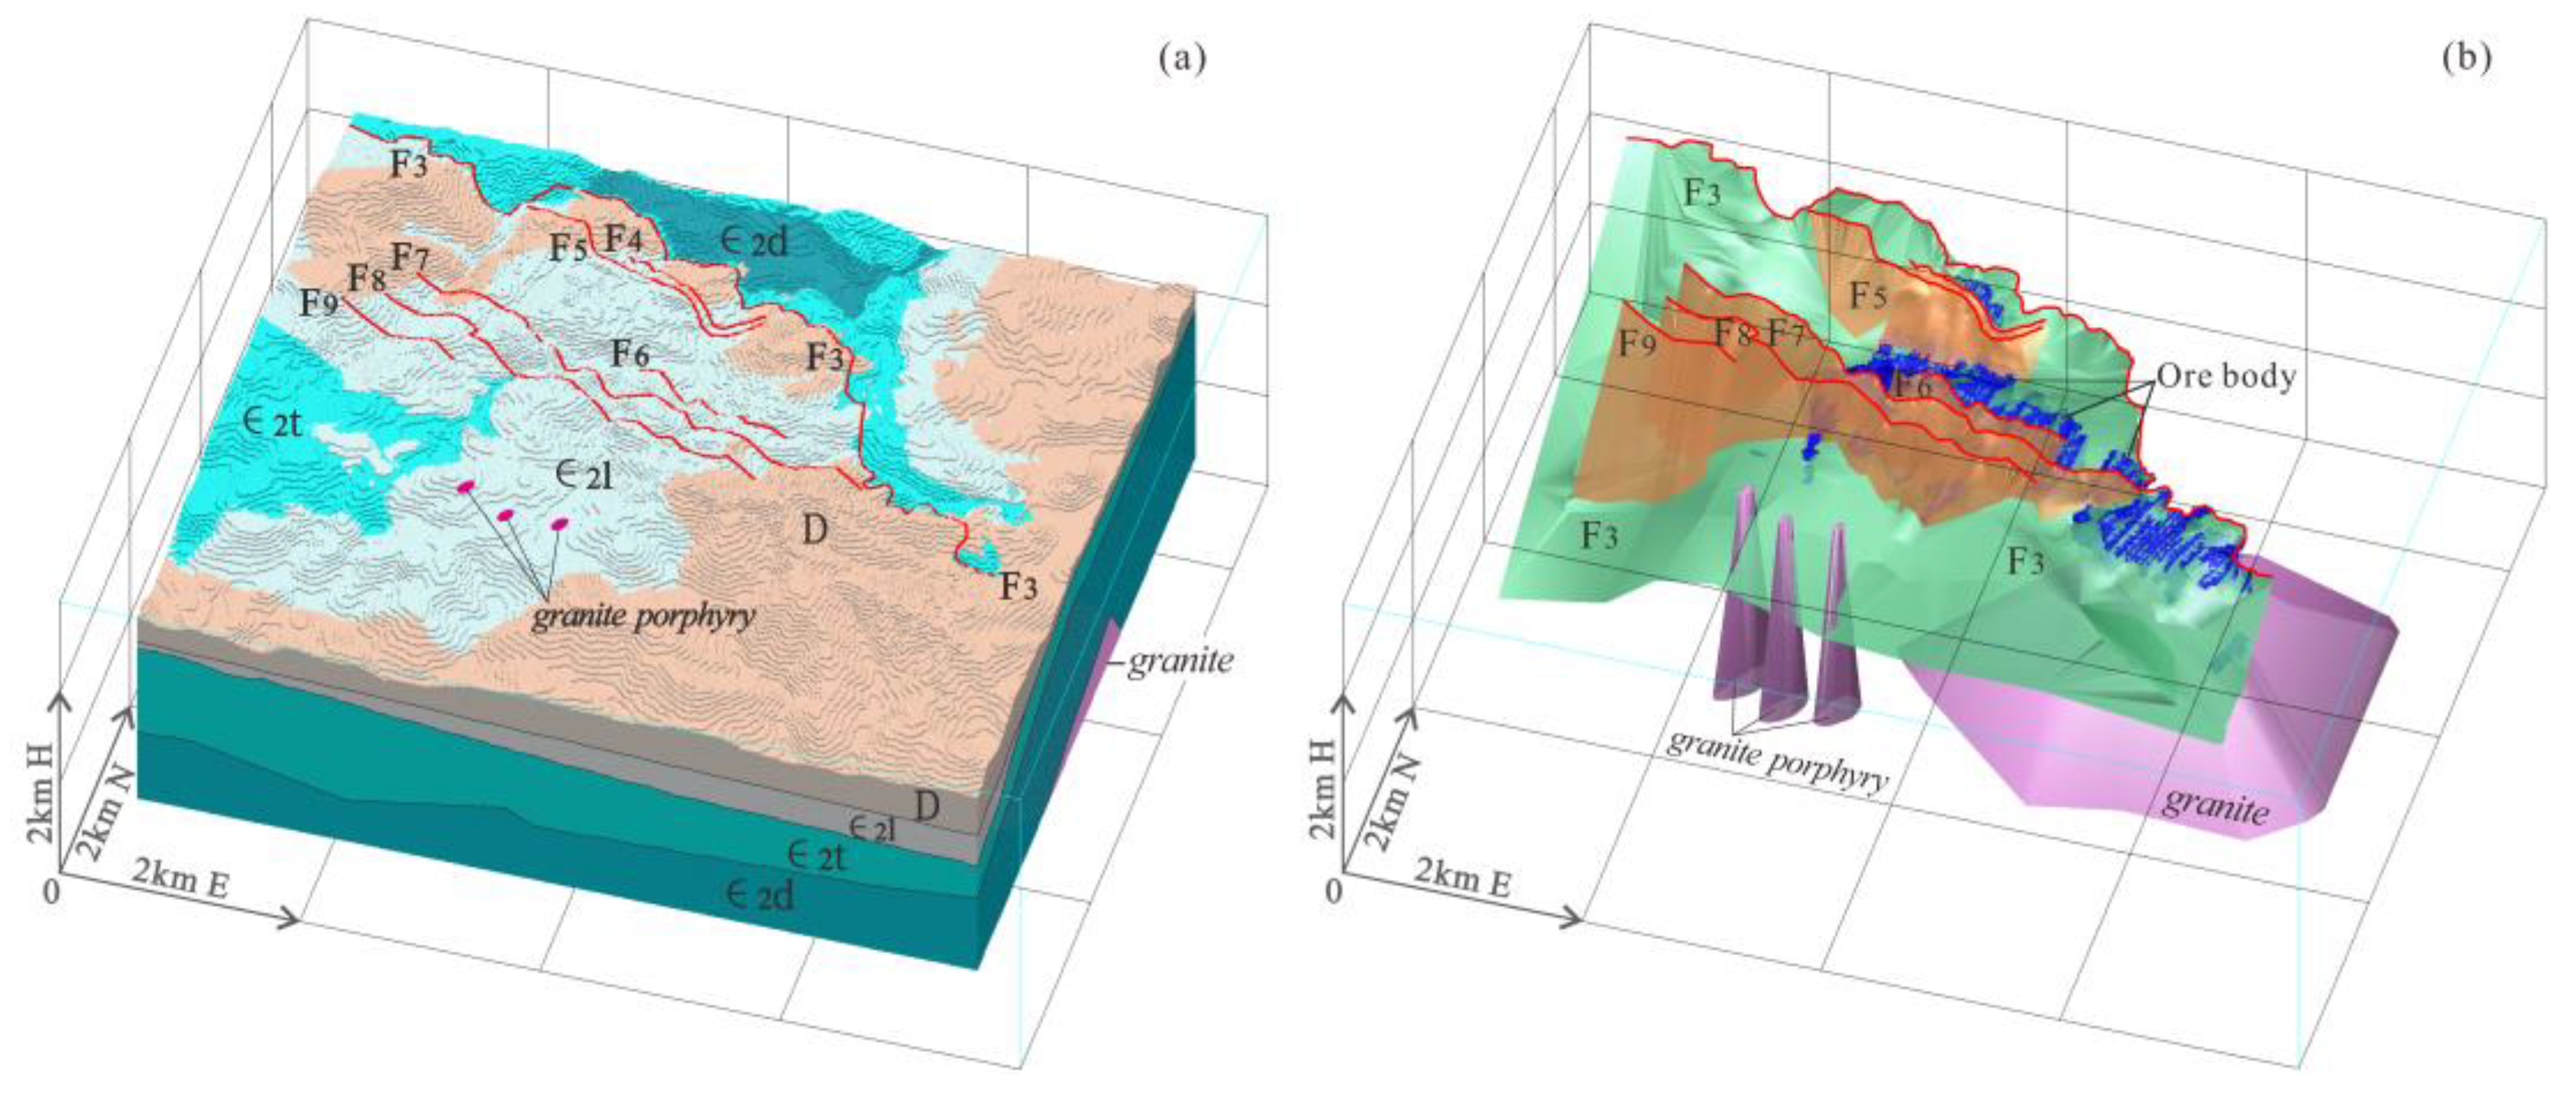
Figure 4.
The 3D buffer zones of the ore-controlling geological factors. (a–b) Buffer zone of the middle Cambrian Tianpeng Formation (∈2t). (c–d) Buffer zone of the faults (F3 and secondary faults). (e–f) Buffer zone of the granites and granite porphyries.
Figure 4.
The 3D buffer zones of the ore-controlling geological factors. (a–b) Buffer zone of the middle Cambrian Tianpeng Formation (∈2t). (c–d) Buffer zone of the faults (F3 and secondary faults). (e–f) Buffer zone of the granites and granite porphyries.
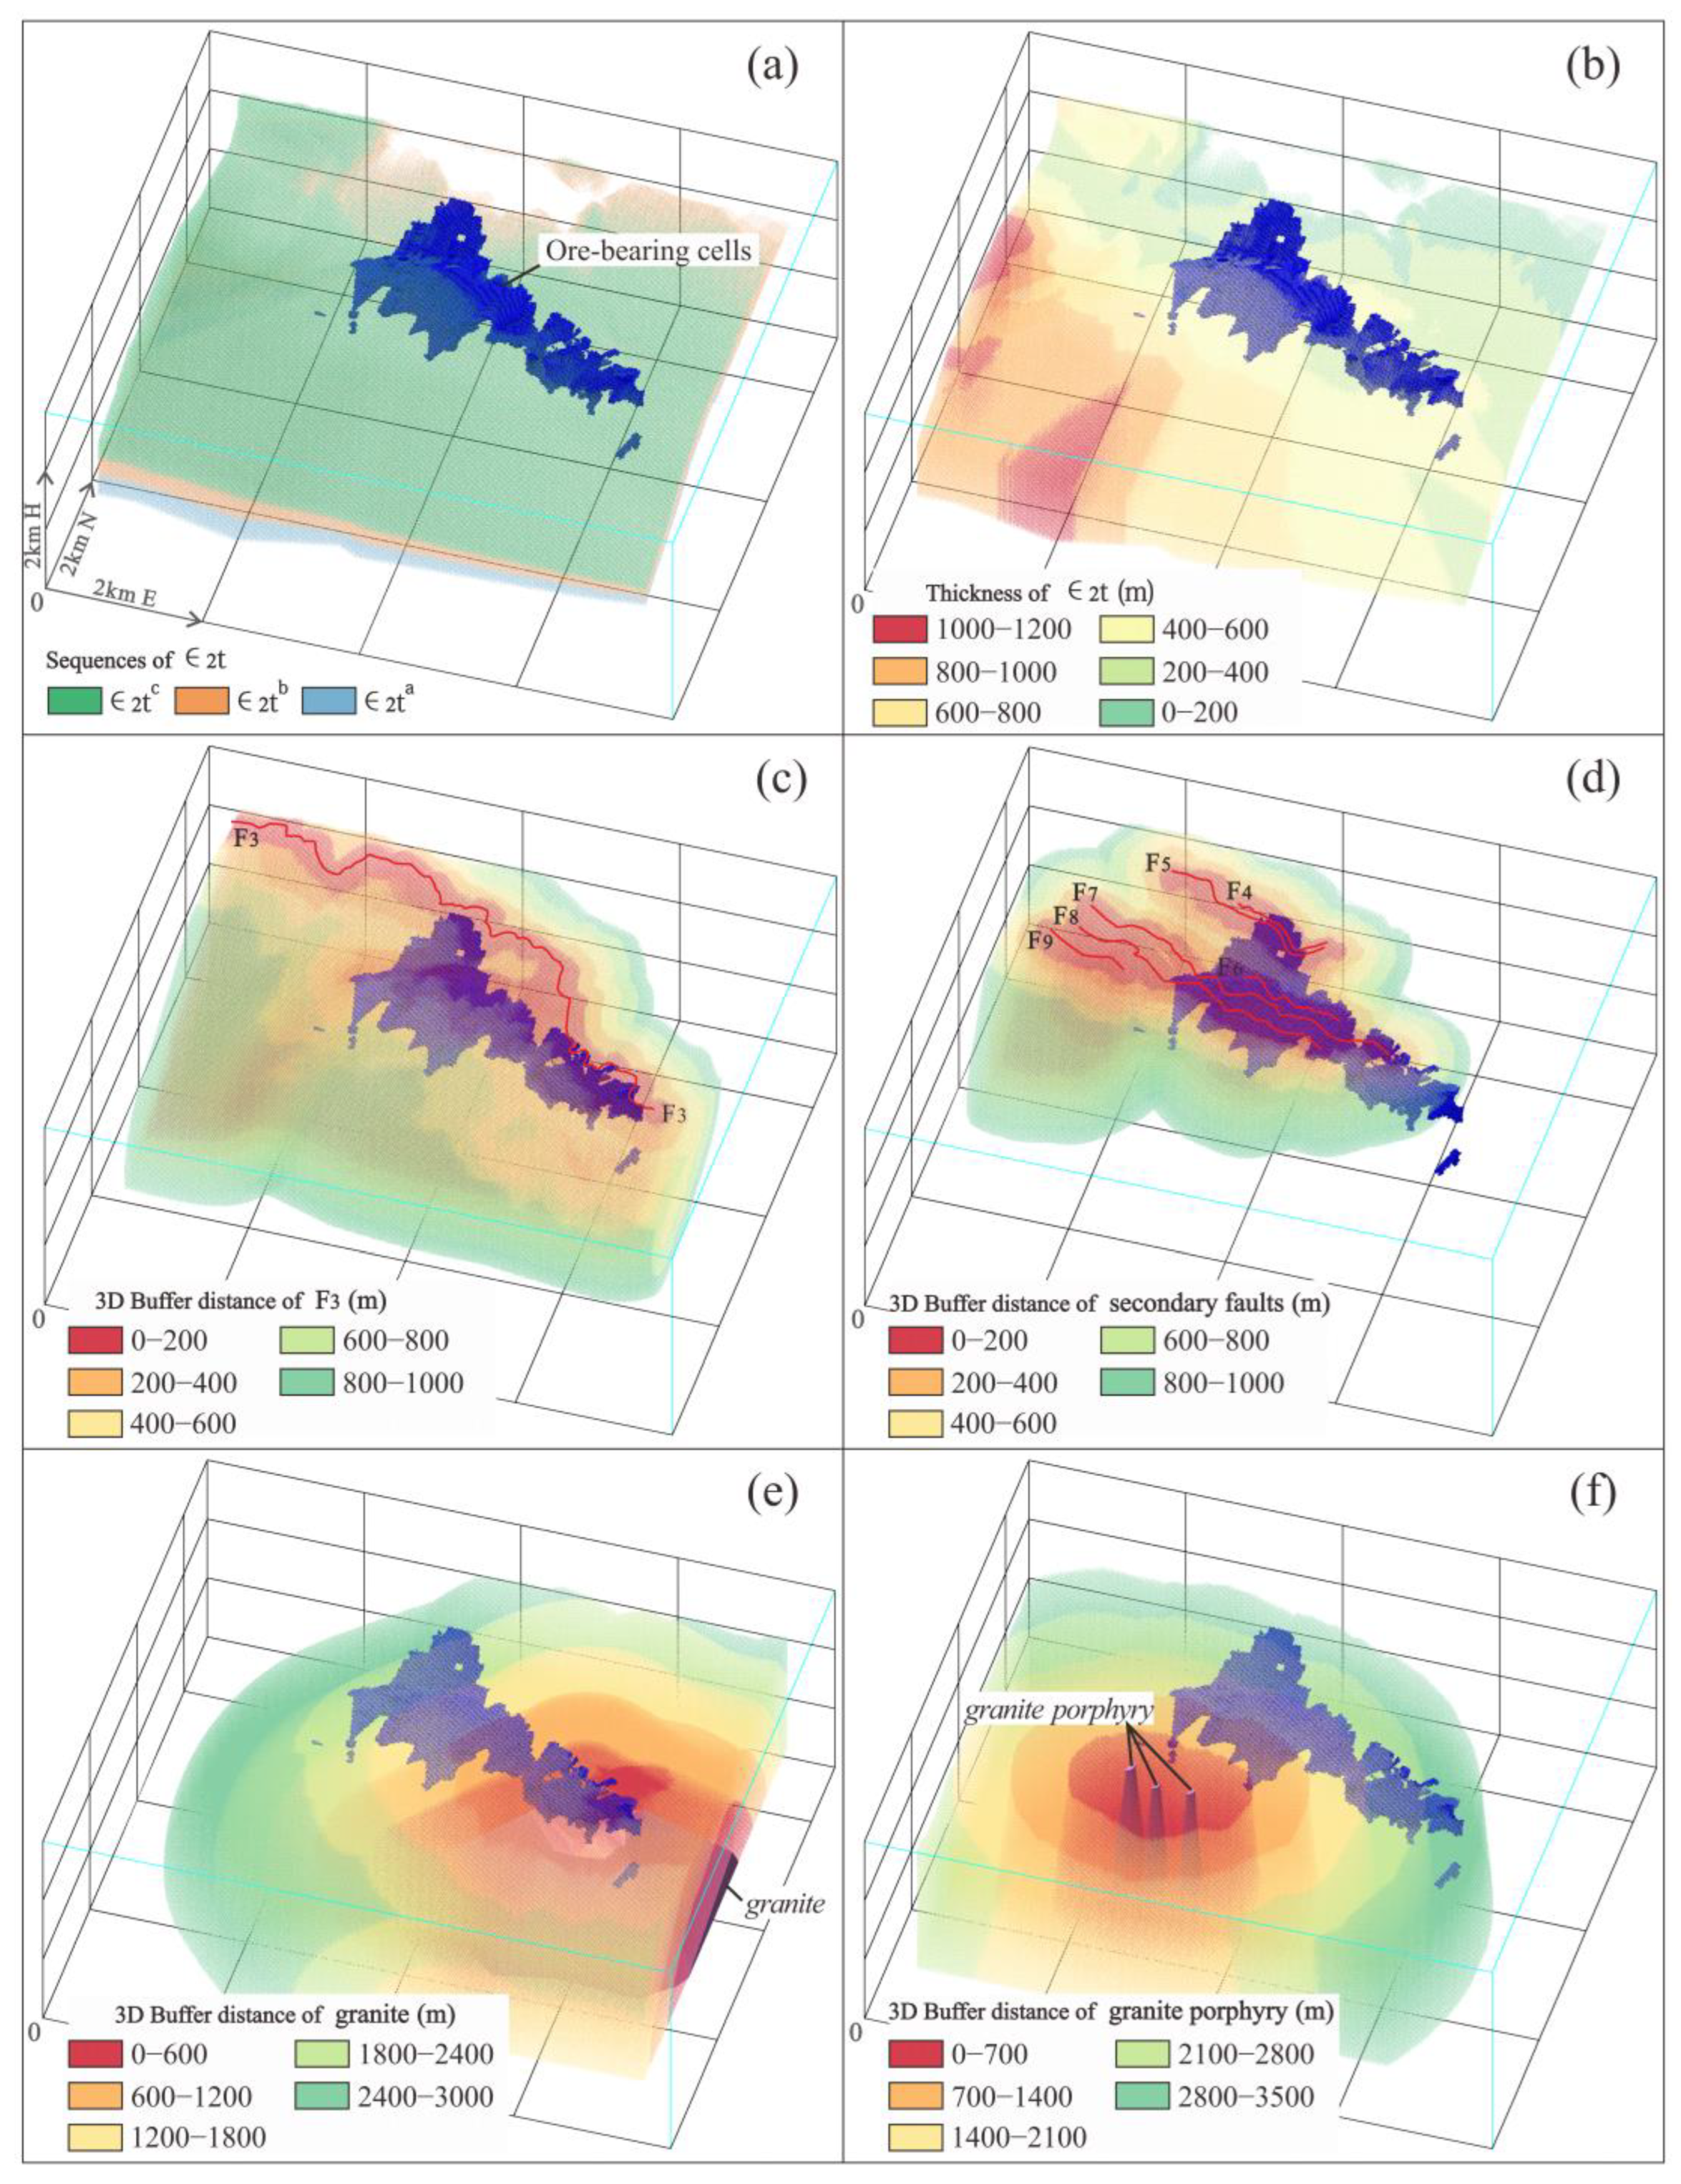
Figure 5.
Mineralization prediction based on the weight of evidence method. (a) Information values versus the number of cells. (b) Information values versus the ore-bearing rate.
Figure 5.
Mineralization prediction based on the weight of evidence method. (a) Information values versus the number of cells. (b) Information values versus the ore-bearing rate.
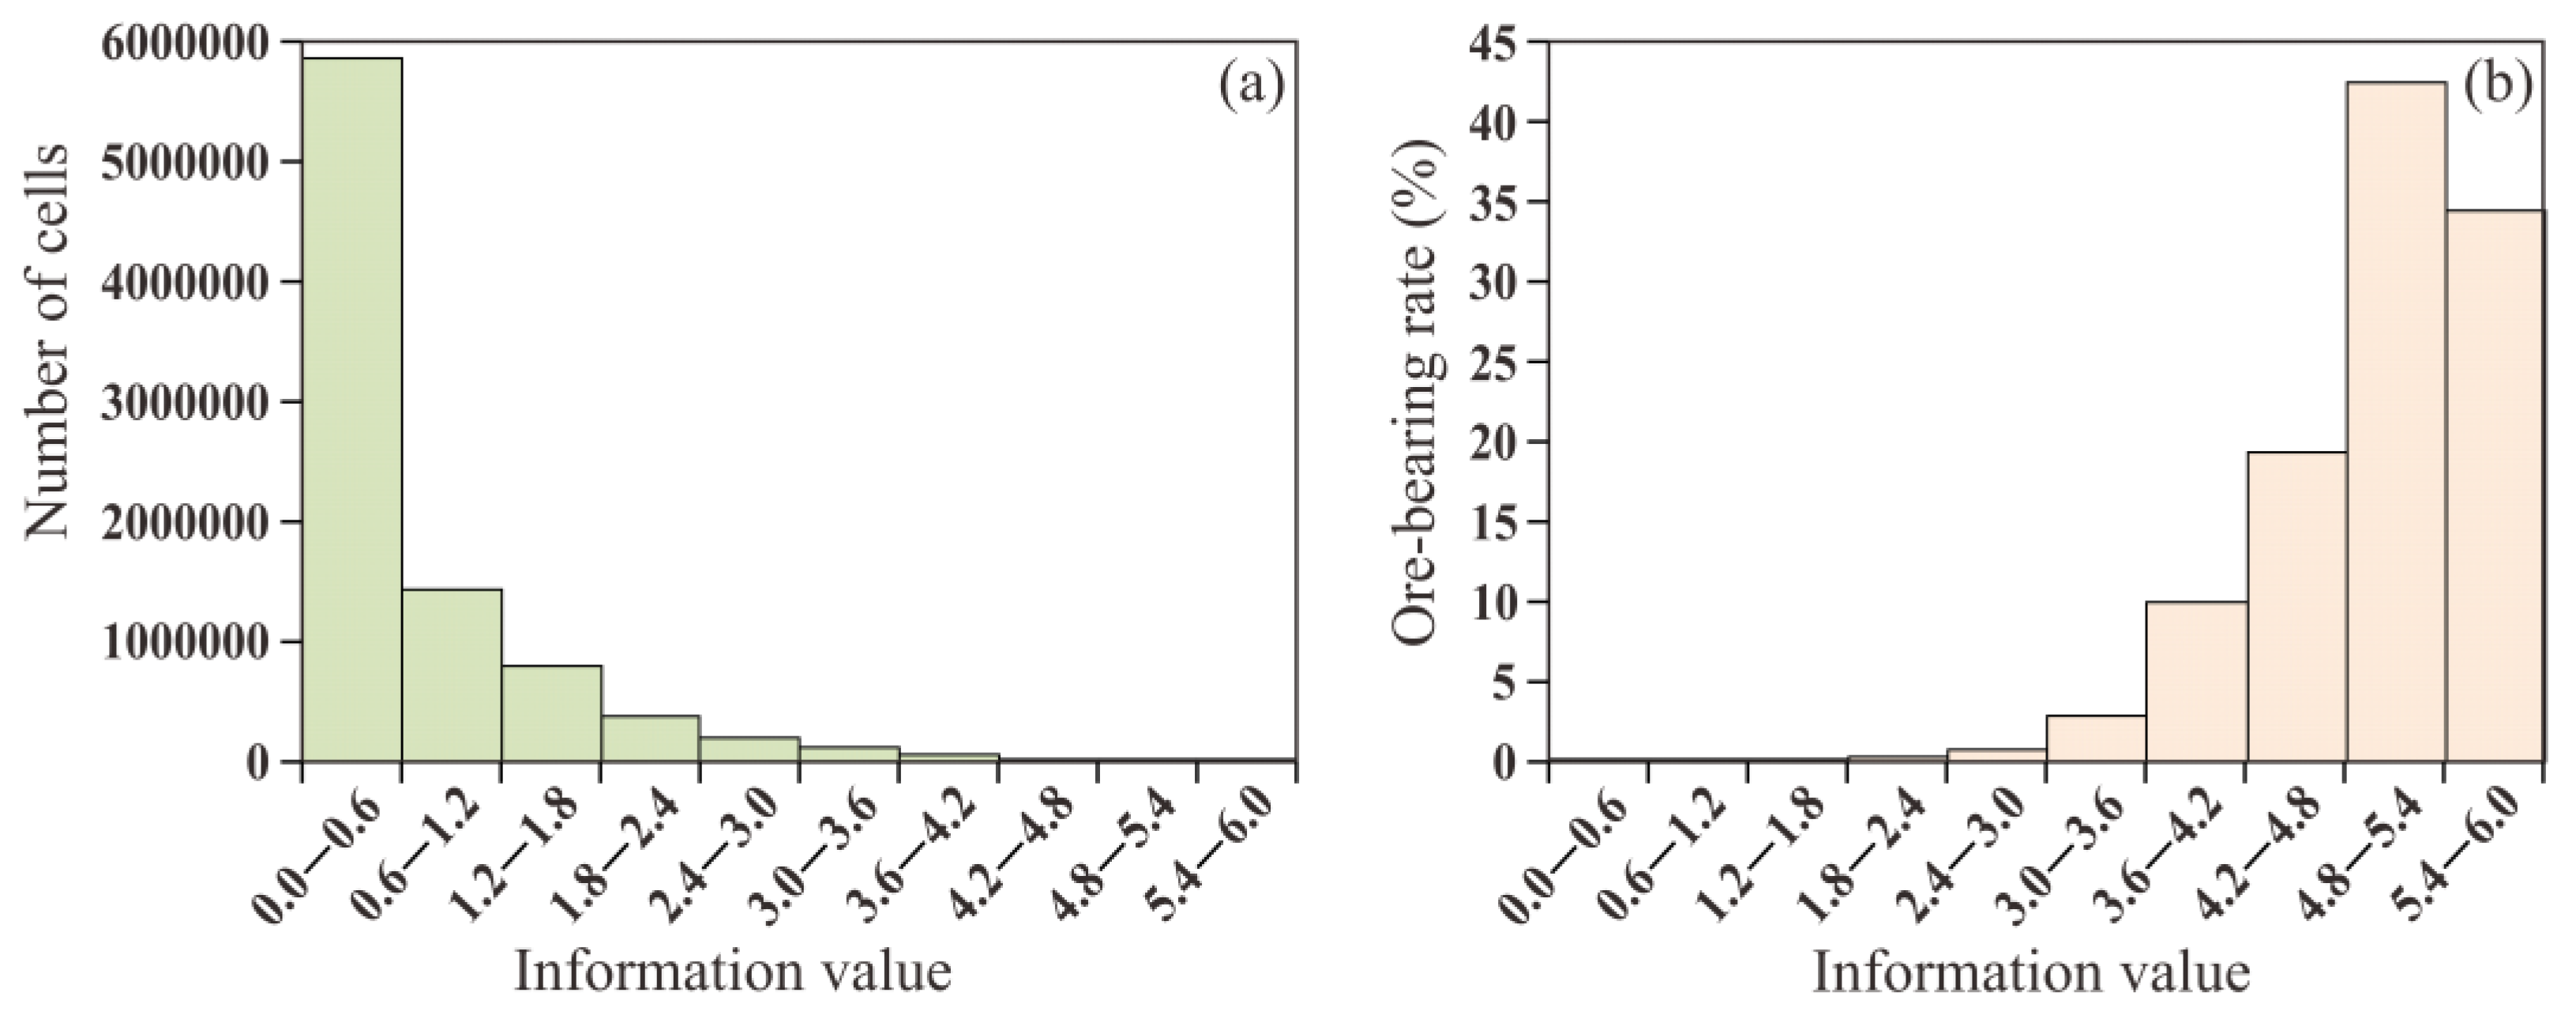
Figure 6.
Information value distribution and anomaly boundary calculation curves. (a) Anomalous boundary of the information value versus the percentage of ore-bearing cells. (b) Information value log–log plot of the cells in the study area.
Figure 6.
Information value distribution and anomaly boundary calculation curves. (a) Anomalous boundary of the information value versus the percentage of ore-bearing cells. (b) Information value log–log plot of the cells in the study area.
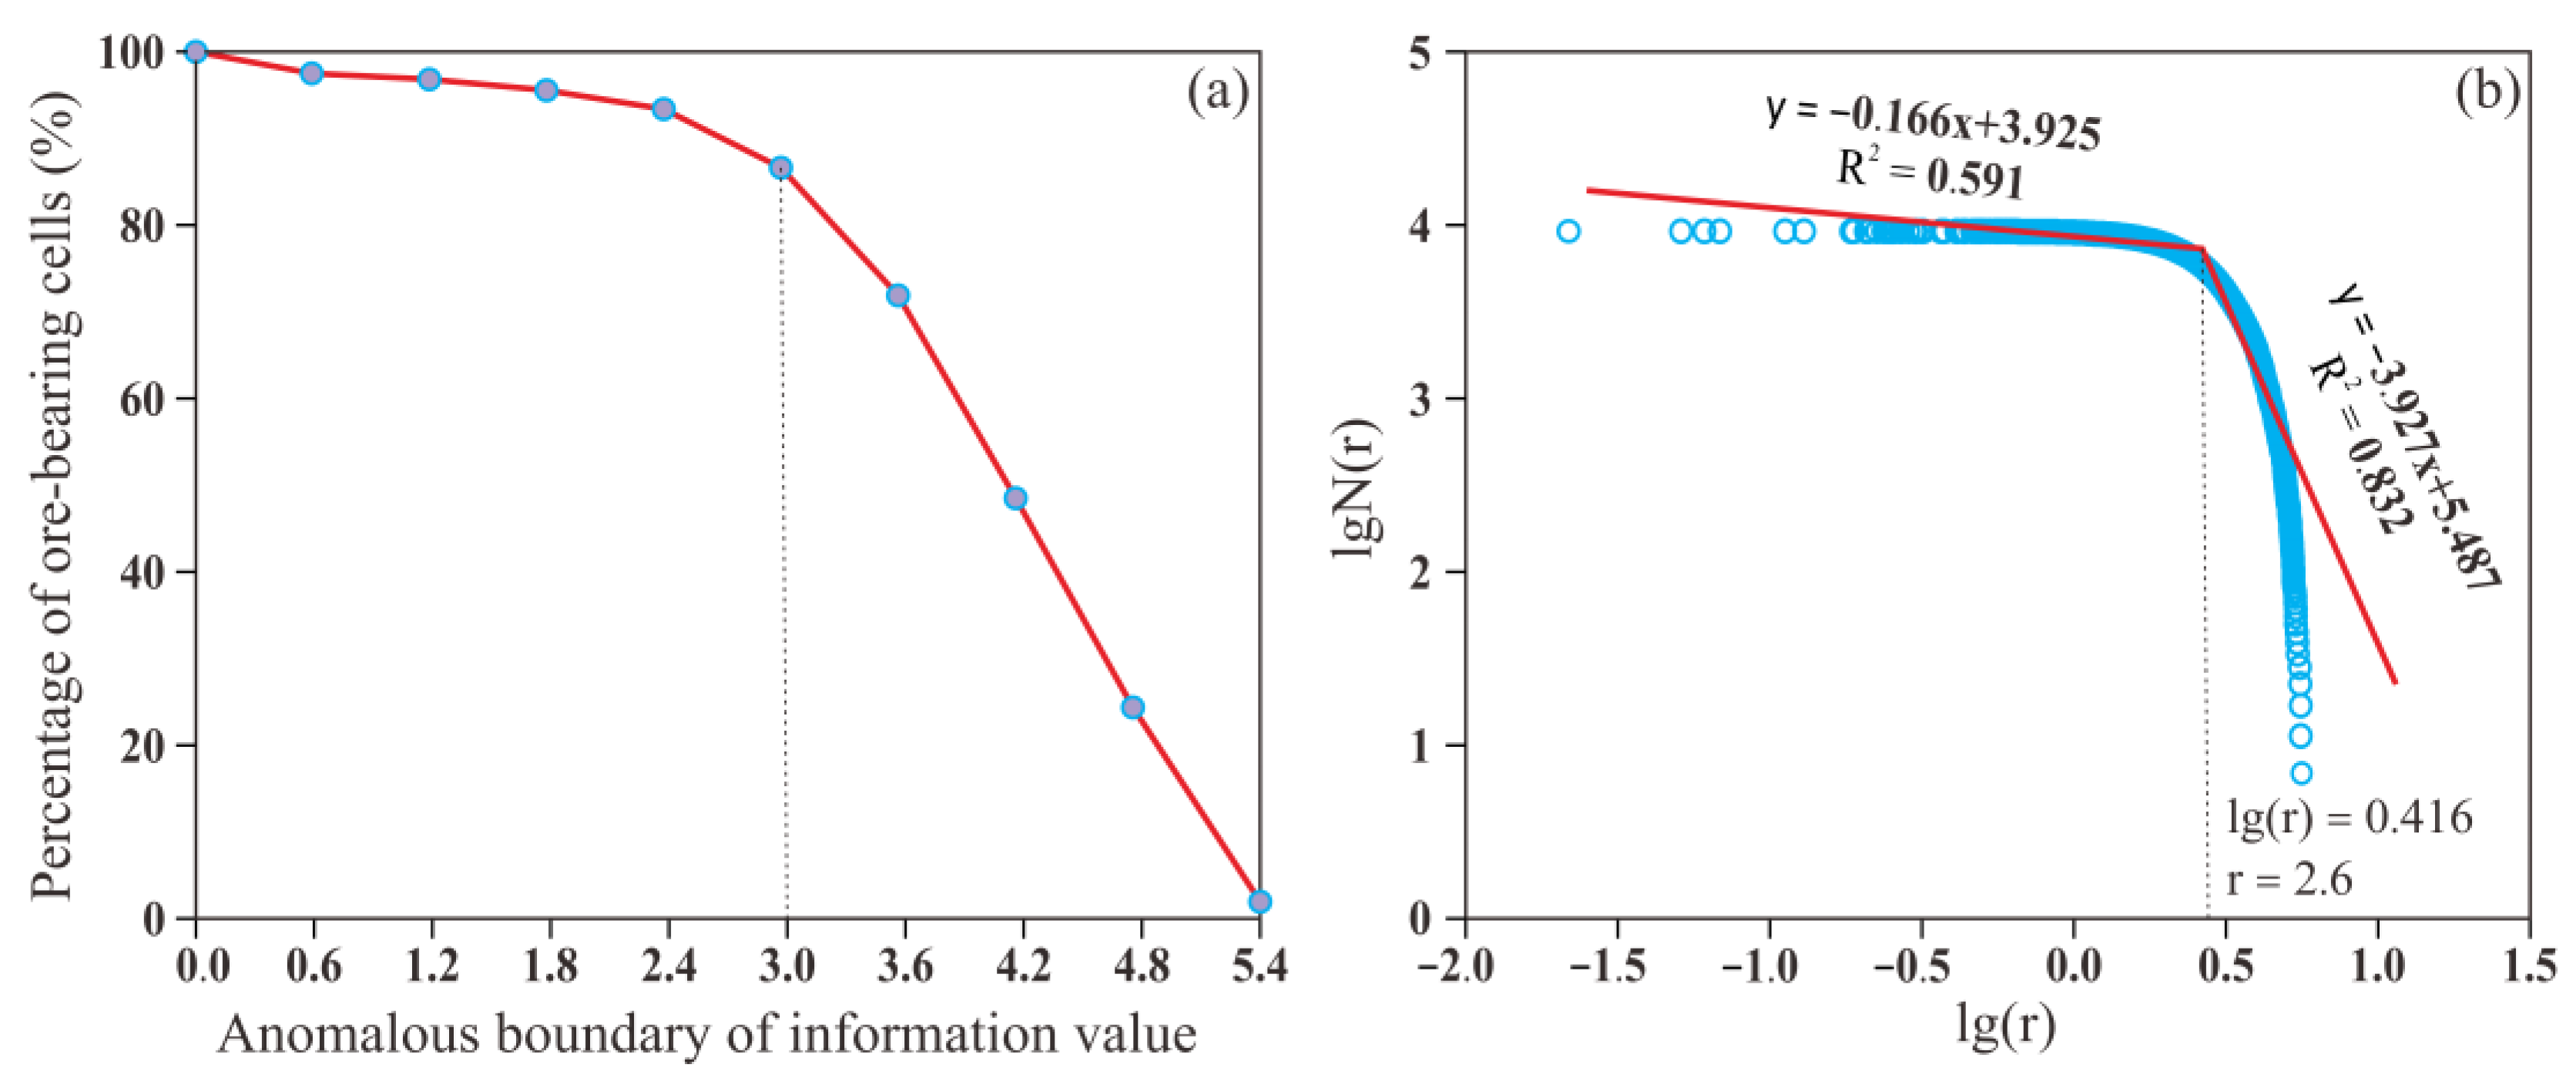
Figure 7.
ROC graph for the prediction boundaries.
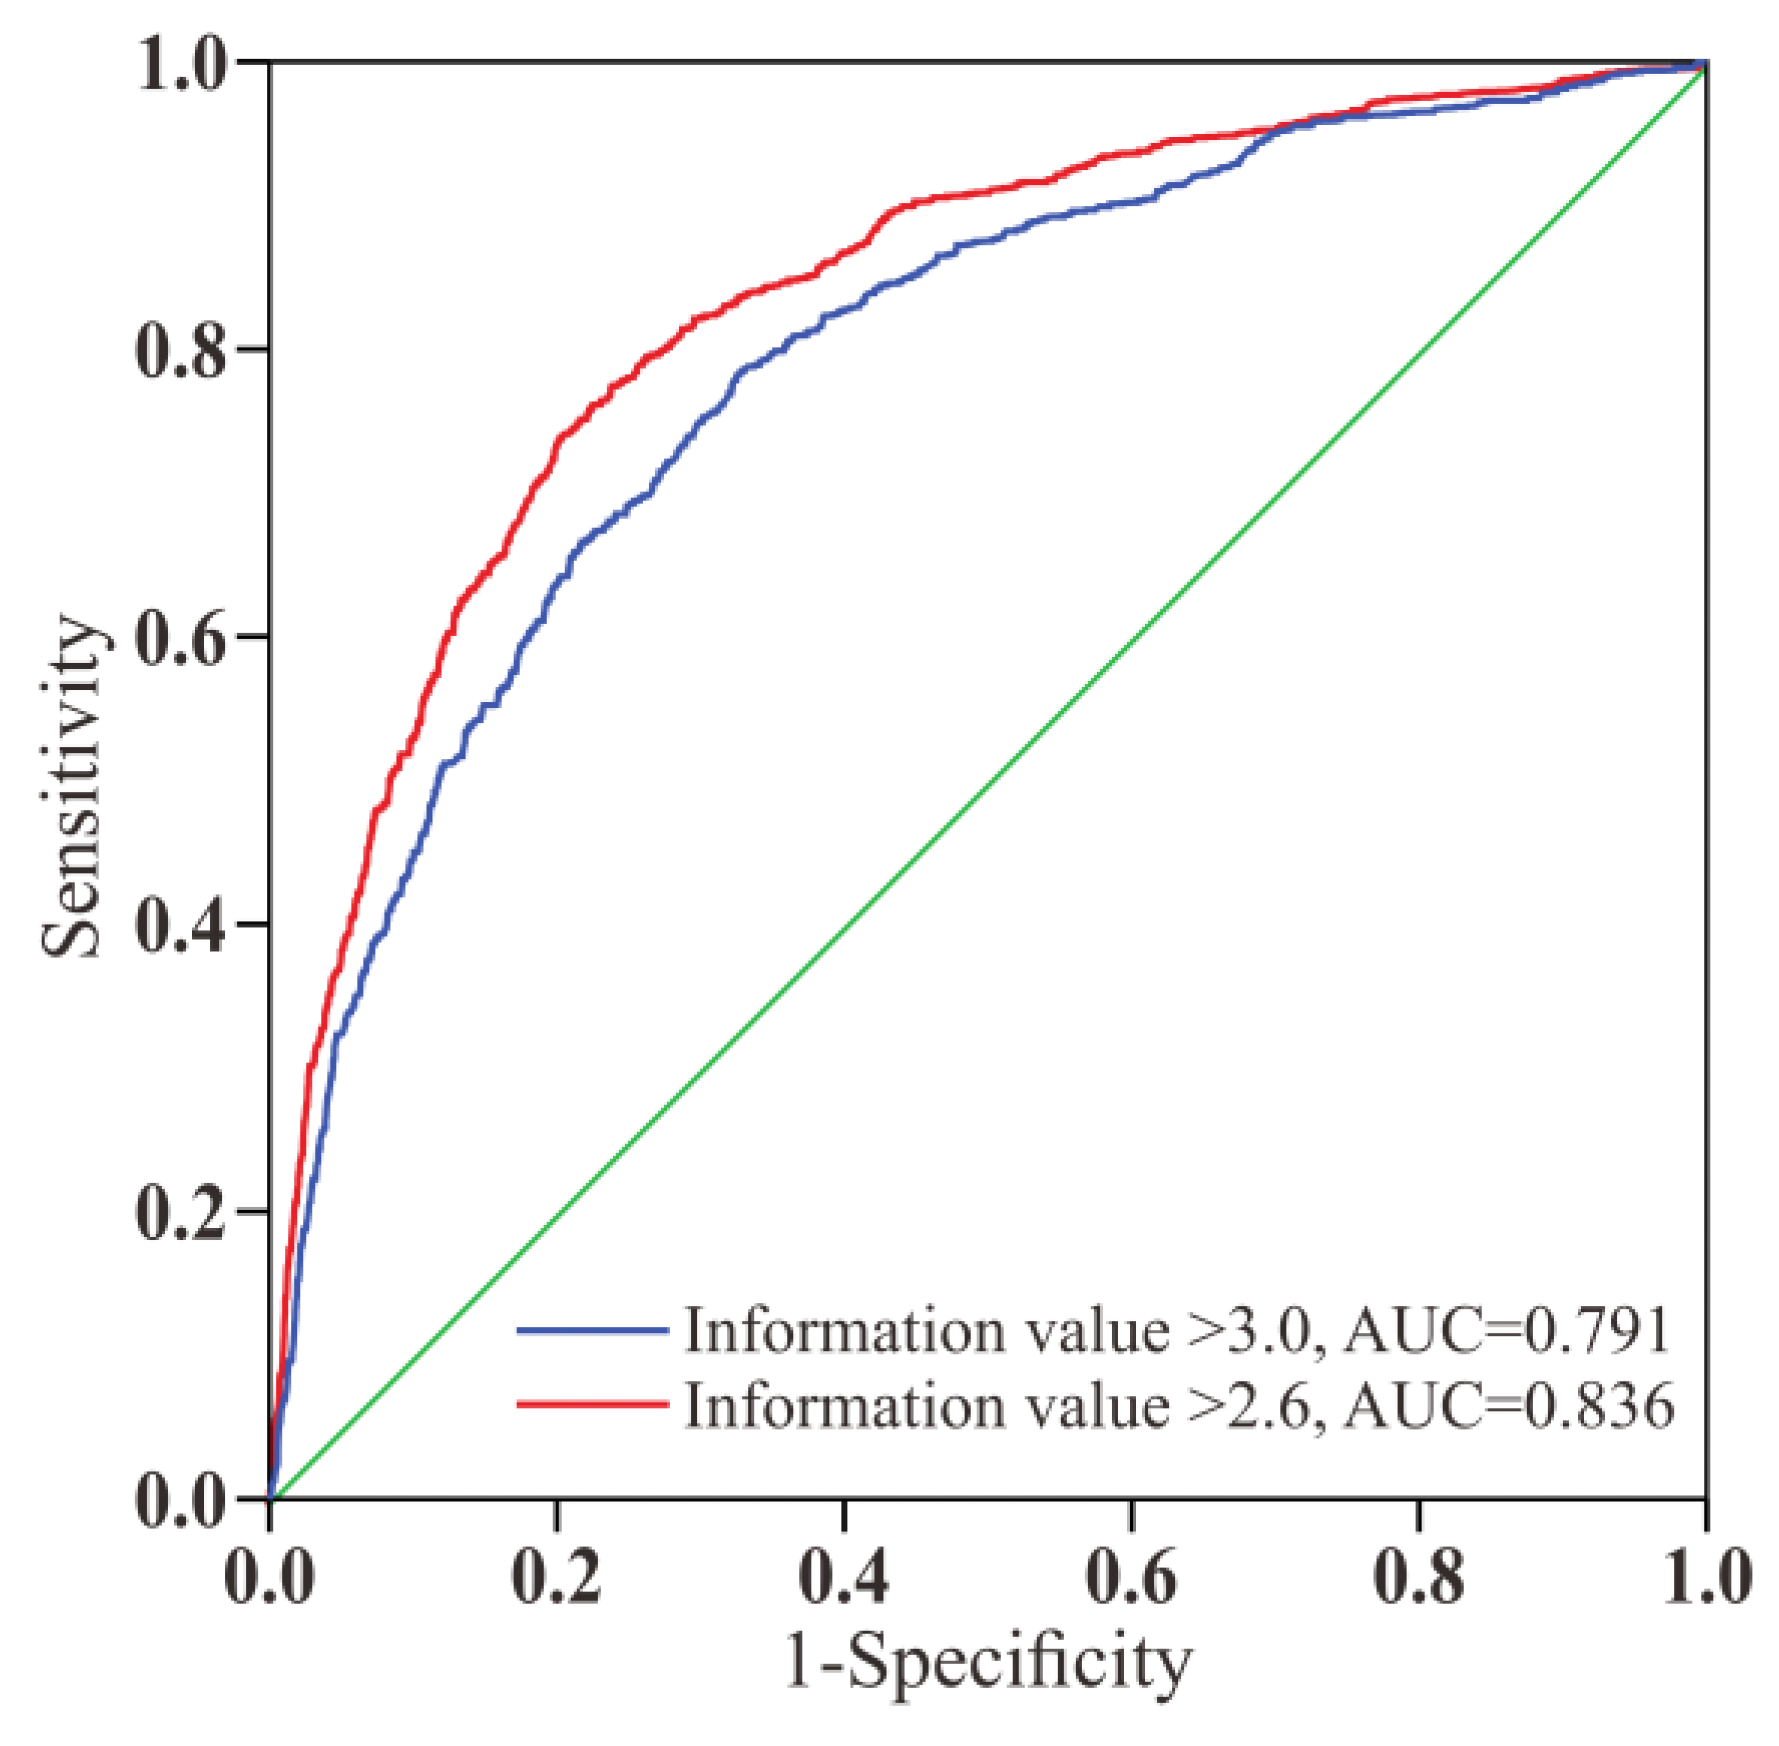
Figure 8.
Mineralization prediction map of the study area (information value > 2.6).
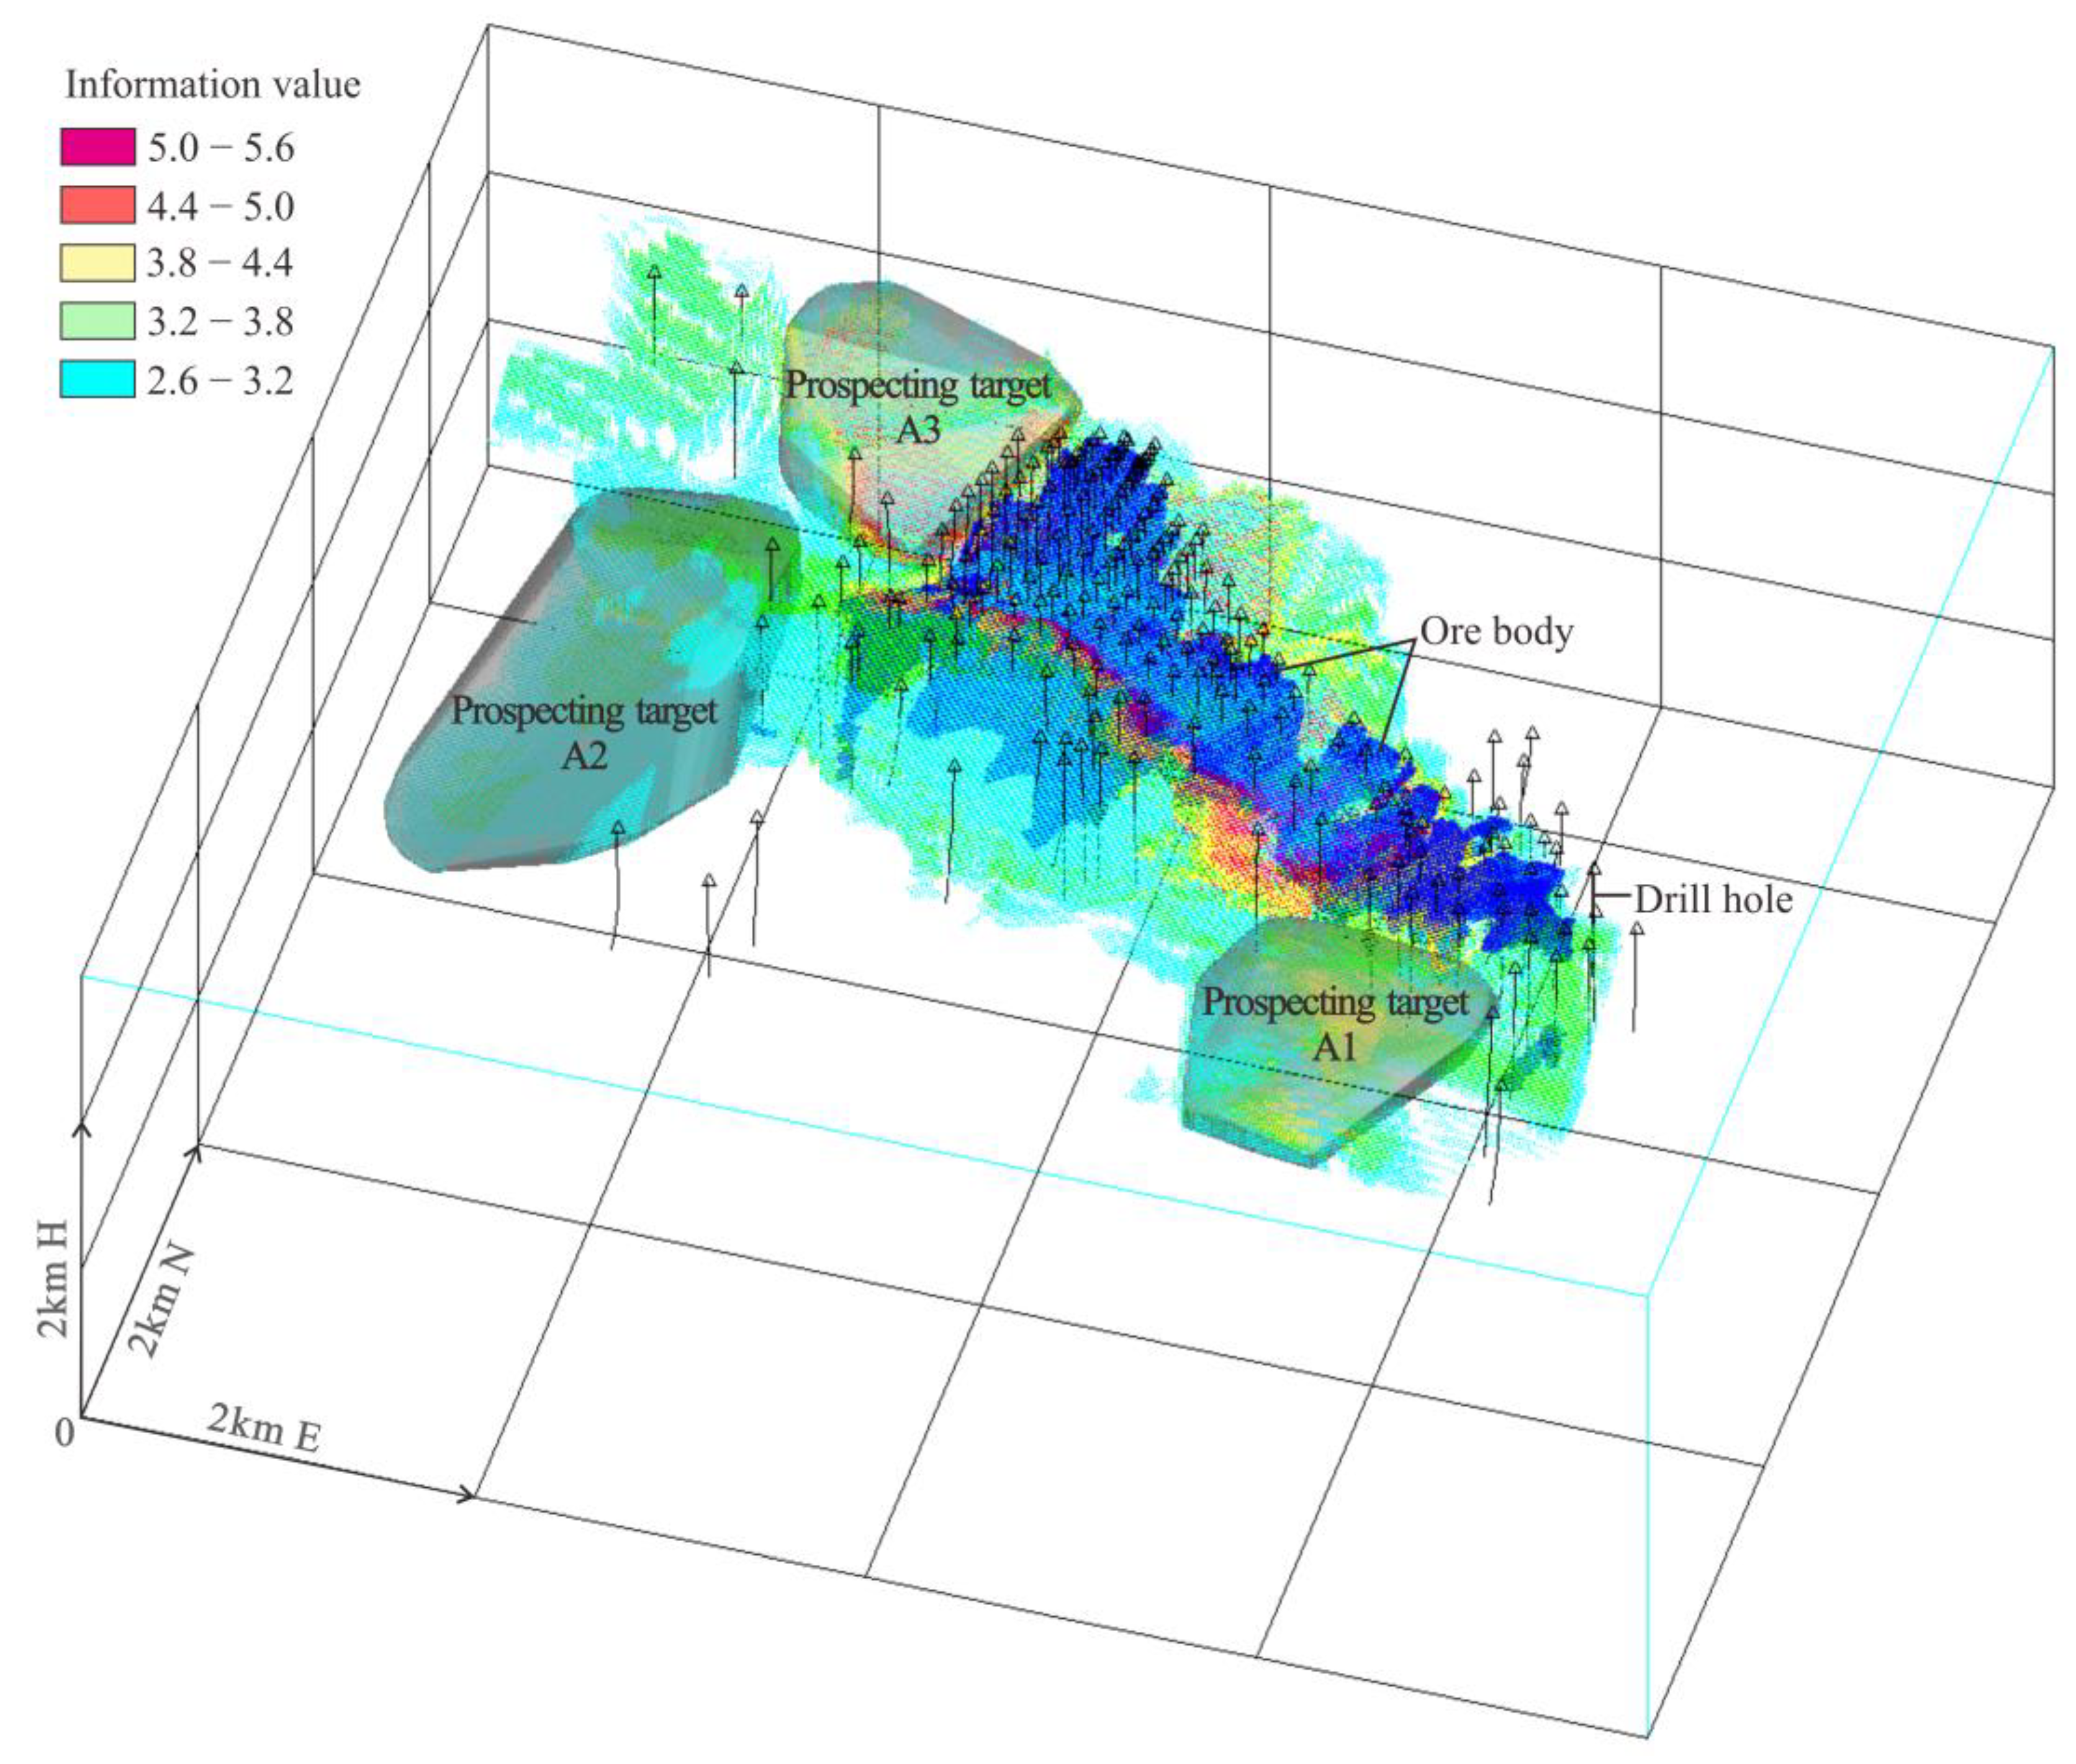

Table 1.
Statistical information.
| Geological variables | Distance interval | Number of cells in the zone (Si) | Number of ore cells in the zone (Ni) | Si/S | Ni/N | Information value I(xi,H) |
Sort |
|---|---|---|---|---|---|---|---|
| ∈2 t | ∈2 tc | 839 830 | 15 359 | 0.078 | 0.597 | 0.8864 | 10 |
| ∈2 tb | 895 587 | 6 859 | 0.083 | 0.267 | 0.5084 | 18 | |
| ∈2 ta | 832 884 | 1 337 | 0.077 | 0.052 | −0.1702 | 37 | |
| Thickness of ∈2 t | 0–80 m | 6 942 | 5 | 0.0006 | 0.0002 | −0.5183 | 40 |
| 80–160 m | 32 413 | 422 | 0.0030 | 0.0164 | 0.7388 | 15 | |
| 160–240 m | 86 821 | 1 521 | 0.0080 | 0.0591 | 0.8677 | 11 | |
| 240–320 m | 122 421 | 2 029 | 0.0113 | 0.0788 | 0.8437 | 12 | |
| 320–400 m | 230 732 | 6 415 | 0.0213 | 0.2493 | 1.0683 | 5 | |
| 400–480 m | 324 007 | 6 709 | 0.0299 | 0.2607 | 0.9403 | 9 | |
| 480–560 m | 271 514 | 5 625 | 0.0251 | 0.2186 | 0.9406 | 8 | |
| 560–640 m | 195 065 | 827 | 0.0180 | 0.0321 | 0.2516 | 24 | |
| F3 | 0–20 m | 103 076 | 10 191 | 0.0095 | 0.4218 | 1.6467 | 1 |
| 20–40 m | 126 674 | 6 848 | 0.0117 | 0.2835 | 1.3845 | 2 | |
| 40–60 m | 119 777 | 3 108 | 0.0111 | 0.1286 | 1.0658 | 6 | |
| 60–80 m | 120 352 | 1 761 | 0.0111 | 0.0729 | 0.8170 | 13 | |
| 80–100 m | 121 098 | 1 165 | 0.0112 | 0.0482 | 0.6349 | 16 | |
| 100–120 m | 122 199 | 731 | 0.0113 | 0.0303 | 0.4285 | 20 | |
| 120–140 m | 122 850 | 239 | 0.0113 | 0.0099 | −0.0593 | 33 | |
| 140–160 m | 123 735 | 116 | 0.0114 | 0.0048 | −0.3764 | 39 | |
| Secondary faults | 0–80 m | 203 605 | 5 536 | 0.0188 | 0.2291 | 1.0861 | 4 |
| 80–160 m | 240 655 | 7 330 | 0.0222 | 0.3034 | 1.1354 | 3 | |
| 160–240 m | 213 277 | 4 420 | 0.0197 | 0.1829 | 0.9681 | 7 | |
| 240–320 m | 233 314 | 3 210 | 0.0215 | 0.1329 | 0.7902 | 14 | |
| 320–400 m | 255 572 | 2 089 | 0.0236 | 0.0865 | 0.5641 | 17 | |
| 400–480 m | 266 628 | 684 | 0.0246 | 0.0283 | 0.0608 | 30 | |
| 480–560 m | 278 598 | 532 | 0.0257 | 0.0220 | −0.0674 | 34 | |
| 560–640 m | 293 090 | 359 | 0.0271 | 0.0149 | −0.2603 | 38 | |
| Granites | 0–300 m | 616 985 | 1 541 | 0.0570 | 0.0599 | 0.0218 | 32 |
| 300–600 m | 814 483 | 3 878 | 0.0752 | 0.1507 | 0.3020 | 23 | |
| 600–900 m | 941 029 | 1 893 | 0.0869 | 0.0736 | −0.0722 | 35 | |
| 900–1 200 m | 1 000 305 | 3 640 | 0.0923 | 0.1414 | 0.1852 | 27 | |
| 1 200–1 500 m | 1 049 528 | 2 804 | 0.0969 | 0.1090 | 0.0510 | 31 | |
| 1 500–1 800 m | 1 005 089 | 2 795 | 0.0928 | 0.1086 | 0.0684 | 29 | |
| 1 800–2 100 m | 907 978 | 5 530 | 0.0838 | 0.2149 | 0.4089 | 21 | |
| 2 100–2 400 m | 758 781 | 3 021 | 0.0700 | 0.1174 | 0.2243 | 25 | |
| Granite porphyries | 0–400 m | 460 560 | 0 | 0.0425 | 0.0000 | - | - |
| 400–800 m | 657 393 | 0 | 0.0607 | 0.0000 | - | - | |
| 800–1 200 m | 912 176 | 449 | 0.0842 | 0.0174 | −0.6836 | 41 | |
| 1 200–1 600 m | 1 166 113 | 3 266 | 0.1076 | 0.1269 | 0.0715 | 28 | |
| 1 600–2 000 m | 1 279 996 | 7 749 | 0.1182 | 0.3011 | 0.4063 | 22 | |
| 2 000–2 400 m | 1 119 395 | 8 372 | 0.1033 | 0.3253 | 0.4981 | 19 | |
| 2 400–2 800 m | 1 022 832 | 4 033 | 0.0944 | 0.1567 | 0.2201 | 26 | |
| 2 800–3 200 m | 1 020 623 | 1 717 | 0.0942 | 0.0667 | −0.1499 | 36 |
Table 2.
Information value distribution of the cells in the study area.
| Information value interval | Number of cells | Number of ore-bearing cells | Ore-bearing rate (%) | Information value boundary | Number of ore-bearing cells | Percentage |
|---|---|---|---|---|---|---|
| 0.0–0.6 | 5 873 875 | 652 | 0.01 | ≥0.0 | 25 735 | 100.00 |
| 0.6–1.2 | 1 441 356 | 169 | 0.01 | ≥0.6 | 25 083 | 97.47 |
| 1.2–1.8 | 801 747 | 334 | 0.04 | ≥1.2 | 24 914 | 96.81 |
| 1.8–2.4 | 377 923 | 553 | 0.15 | ≥1.8 | 24 580 | 95.51 |
| 2.4–3.0 | 217 822 | 1 739 | 0.80 | ≥2.4 | 24 027 | 93.36 |
| 3.0–3.6 | 133 292 | 3 794 | 2.85 | ≥3.0 | 22 288 | 86.61 |
| 3.6–4.2 | 60 247 | 6 002 | 9.96 | ≥3.6 | 18 494 | 71.86 |
| 4.2–4.8 | 32 122 | 6 211 | 19.34 | ≥4.2 | 12 492 | 48.54 |
| 4.8–5.4 | 13 644 | 5 764 | 42.25 | ≥4.8 | 6 281 | 24.41 |
| 5.4–6.0 | 1 508 | 517 | 34.28 | ≥5.4 | 517 | 2.01 |
Disclaimer/Publisher’s Note: The statements, opinions and data contained in all publications are solely those of the individual author(s) and contributor(s) and not of MDPI and/or the editor(s). MDPI and/or the editor(s) disclaim responsibility for any injury to people or property resulting from any ideas, methods, instructions or products referred to in the content. |
© 2025 by the authors. Licensee MDPI, Basel, Switzerland. This article is an open access article distributed under the terms and conditions of the Creative Commons Attribution (CC BY) license (http://creativecommons.org/licenses/by/4.0/).
Copyright: This open access article is published under a Creative Commons CC BY 4.0 license, which permit the free download, distribution, and reuse, provided that the author and preprint are cited in any reuse.


