
Submitted:
07 June 2025
Posted:
09 June 2025
You are already at the latest version
Abstract
The Chikugo River, the longest river on Kyushu Island, originates on Mount Aso and flows into the Ariake Sea, serving as a vital freshwater resource that supports marine ecology and regional water management. The basin experiences frequent heavy rainfall from typhoons and seasonal precipitation, making hydrological modeling essential for understanding water movement and variability. However, integrated hydrological studies in the Chikugo Catchment Area are relatively scarce. This study evaluated the performance of the Soil and Water Assessment Tool (SWAT) in simulating the streamflow, water balance, and seasonal hydrological variability in the Chikugo River basin from 2007 to 2021. Model calibration and uncertainty analysis were conducted using the Sequential Uncertainty Fitting Version 2 (SUFI-2) approach. The results indicated that the SWAT effectively captured streamflow dynamics, demonstrating strong reliability in hydrological simulations. Sensitivity analysis identified surface runoff, baseflow, and channel flow characteristics as the key factors influencing model performance. Water balance analysis revealed that evapotranspiration and baseflow play dominant roles in basin hydrology, whereas runoff remains consistently lower than precipitation because of significant water retention. These findings provided valuable insights into the hydrological processes of the Chikugo River Basin and offer a scientific basis for improved water resource management, allocation, and planning in temperate climate catchments.
Keywords:
Chikugo river
; hydrological modeling
; seasonal
; streamflow
; SWAT
; watershed
; water balance
1. Introduction
Water resources are fundamental to human survival, agricultural productivity, and industrial development; however, their availability is increasingly constrained by growing demands and environmental changes [1]. Hydrology, particularly the study of water balance and rainfall-runoff processes, is pivotal in effective water resource management, flood mitigation, and environmental planning [2]. However, these processes are under significant stress due to anthropogenic activities and environmental factors. Global climate change, extreme weather events, deforestation, urban expansion, and intensified agricultural practices have disrupted natural hydrological cycles, reducing groundwater replenishment, increasing surface runoff, and frequent floods and droughts [3]. These disruptions seriously threaten water security, particularly in regions with unpredictable or seasonal rainfall patterns, where fluctuations in water availability can exacerbate food insecurity and hinder sustainable development [4,5].
To address these challenges, a comprehensive understanding of hydrological processes is essential. This involves evaluating watershed characteristics through quantitative assessments of inputs (e.g., precipitation), outputs (e.g., runoff and evapotranspiration), and changes in water storage [6]. Such analyses are particularly critical in arid and semi-arid regions, where hydrological events are highly variable and heavily influenced by irregular precipitation patterns. However, even in temperate regions, such as the Chikugo River catchment in Japan, climate variability, rapid urbanization, and intensive agricultural practices have created complex hydrological dynamics that require urgent attention.
Streamflow modeling is a vital tool for addressing these issues because it supports reservoir management, water distribution planning, and flood and drought mitigation. Several hydrological models have been developed to simulate streamflow, including the Soil and Water Assessment Tool (SWAT), Python TOPographic Kinematic APproximation and Integration (PyTOPKAPI), and Hydrologic Modeling System- Hydrologic Engineering Center (HEC-HMS) [7,8,9]. The SWAT model is notable because of its versatility, robustness, and widespread applicability across diverse river basins and environmental conditions [10,11,12]. The strength of SWAT lies in its ability to simulate key hydrological processes, such as precipitation, runoff, evapotranspiration, and groundwater recharge, while incorporating the impacts of climate change, land use changes, and urban growth on watershed dynamics [13]. Furthermore, its integration with Geographic Information System (GIS) technology enhances its capacity to analyze water movement patterns across spatial and temporal scales, making it particularly suitable for complex catchments, such as the Chikugo River basin [14]. Despite these challenges, integrated hydrological studies in the Chikugo catchment Area remain limited, leaving critical knowledge and planning gaps.
This study addressed the critical need for integrated hydrological modeling in the Chikugo River catchment by employing the SWAT model to simulate long-term streamflow and quantify the water balance components. The three primary objectives of this study were to: (i) quantify key water balance components, including precipitation, evapotranspiration, runoff, and groundwater recharge; (ii) examine the seasonal variability of these hydrological processes; and (iii) estimate water availability in the Chikugo catchment over the study period. By providing insights into the hydrological dynamics of the region, this study aimed to inform land-use planning, nature conservation, and the management of hydrological hazards such as floods and droughts. Additionally, it aimed to address transboundary water security challenges arising from urbanization, thereby supporting the development of interventions to ensure the long-term sustainability of the Chikugo River basin. This study underscored the importance of scientific understanding and management of hydrological processes in promoting regional development, ecological balance, and water security.
2. Materials and Methods
2.1. Study Area
The Chikugo River basin (Figure 1.), encompassing approximately 2,860 km2 with an elevation ranging from 0 m above sea level (masl) in the downstream region to 1,524 masl in the upstream mountainous areas, is located in northern Kyushu Island, Japan. It extends across Fukuoka, Saga, Kumamoto, and Oita Prefectures, with most of the basin area located in Fukuoka and Saga. The Chikugo River, with a total length of 143 km, is the longest river on Kyushu Island. It originates from Mount Aso and discharges into the Ariake Sea. The upper reaches of the river are important for forestry, whereas the middle and lower reaches are crucial for local agriculture, providing irrigation water for 400 km2 of rice fields on the Tsukushi Plain. The river is also vital for industry, with 20 electrical power plants situated along its banks, and the major city of Kurume in Fukuoka Prefecture, thus contributing to the local economic sustainability of the study area [15]. The mean freshwater inflow into the estuary is 54 m3 s−1 during the dry season, and it exceeds 2800 m3 s−1 during the rainy season [16]. The annual mean precipitation in the watershed is 2180 mm, reaching a maximum of 3000 mm in the mountainous areas.
The Chikugo River estuary is one of the most productive aquatic systems in Japan and supports numerous semi-endemic species [17]. The Chikugo River catchment, a vital water resource for the Fukuoka metropolitan area, faces significant challenges owing to population growth, economic development, and climate variability. Industrialization and modernization have intensified water usage, necessitating careful planning to balance the competing demands of domestic, industrial, and agricultural consumers [18]. Historically, the region has experienced severe droughts caused by unprecedentedly low rainfall events, such as those in 1978 and 1994. More recen tly, abnormally low rainfall during critical periods, such as the autumn of 1999 and 2006 and the rainy seasons of 2002 and 2005, has led to sharp declines in the water volume of the Chikugo River, prompting the implementation of drought countermeasures. The basin has also experienced extreme runoff events, such as the high historical water levels recorded at the Senoshita Observatory in 2020, highlighting the region’s vulnerability to both floods and droughts.2.2. General Data Processing
The Q-GIS 3.16 was used as an interface to run the SWAT 2012 model. In this study, key input data including digital elevation model (DEM), soil, land use and weather data were processed using QSWAT to define the watershed, create hydrological response units (HRUs), and generate input files. A 30-m resolution DEM from the United States Geological Survey (USGS) Shuttle Radar Topography Mission (SRTM) was used to delineate subbasins and stream networks. The soil map (Figure 2a.) shows 12 soil types, including Andosols, Cambisols, Acrisols, and Gleysols. The land-use map (Figure 2b.) shows that forests dominate the catchment (57.47%), primarily in the upper and midstream regions, whereas agricultural land (27%) is concentrated in lowland areas. Urban areas (10.41%) are mainly downstream, with the remaining 7% comprising grasslands, infrastructure, and water bodies. Slope classes were categorized into five ranges (0–10%, 10–20%, 20–30%, 30–45%, and >45%) to account for variations in runoff and erosion potential. The catchment was divided into 28 subbasins and 3,151 HRUs. Land-use and soil data were obtained from the Ministry of Land, Infrastructure, and Transport (MLIT), whereas daily weather data (2004–2021) from 13 meteorological stations were sourced from the Japan Meteorological Agency (JMA). Streamflow data from the Senochita station (2004–2021) were used for calibration and validation and accessed via the MLIT water information system (Table 1).
2.3. Model Performance and Sensitivity Analysis
Model calibration and validation were conducted using the Sequential Uncertainty Fitting algorithm (SUFI-2) in the SWAT-CUP. The initial parameter ranges were defined based on the SWAT user manual and refined through iterative optimization. SUFI-2 employs a stochastic approach, running simulations per iteration to minimize errors and assess parameter uncertainty [24]. Calibration was primarily automatic, with manual adjustments made to avoid overfitting and ensure physical relevance. The simulation period ran from 2004 to 2021 and included a warming period (2004–2006). The calibration phase occurred between 2007 and 2014, and the validation phase lasted from 2015 to 2021. These two durations were selected based on the average daily observed streamflows during the two periods, which did not differ significantly. The SWAT model in this study replicated the rainfall-runoff connection using the modified Soil Conservation Service (SCS) curve number technique. Given the limited meteorological data in the research area, we employed the Hargreaves potential evapotranspiration (PET) approach, which is appropriate for areas with limited meteorological data [25]. To avoid over-parameterization and to determine the sensitive parameters, we performed a sensitivity analysis for several parameters that control the hydrological processes in the SWAT prior to the calibration phase [26]. In this study, we ran 100 simulations per iteration, and an uncertainty analysis was conducted together with calibration. The optimization process of the sensitivity analysis of the flow parameters is determined by multiple regression methods against the objective function that reverts the Latin hypercube-created parameters [27]. Approximately 17 parameters related to management, soil, and groundwater were tested using the absolute parameter range provided in the SWAT CUP and then ranked according to their sensitivity based on t-stat and p-values. The model parameter with the largest t-distribution (i.e., the most sensitive) and the lowest p-value (i.e., the most significant) was assigned. Here, the parameter was significant if the P values were close to zero. Subsequently, the best-fit value of each parameter was run once in the validation period. Model performance was evaluated using the coefficient of determination (R²), Nash-Sutcliffe Efficiency (NSE), and percentage bias (PBIAS). Satisfactory model performance was achieved, with R² and NSE values above 0.80 and PBIAS within acceptable ranges during both calibration and validation [28]. The formula for the three parameters (Equations 1-3) were as follows:
 where X represents the observed data; Y represents the SWAT simulation results; X and Y represent the observed and simulated data means, respectively; and i represents the number of observed and simulated data points.
where X represents the observed data; Y represents the SWAT simulation results; X and Y represent the observed and simulated data means, respectively; and i represents the number of observed and simulated data points.2.4. Principal Component Analysis of Land Use, Soil Type, and Slope Band on Water Balance
Principal Component Analysis (PCA) is one of the most widely used statistical techniques across many research fields [29]. It simplifies complex data by reducing their dimensionality and transforming multidimensional datasets into smaller numbers of principal components. This makes it easier to analyze and reveal the relationships within the data. In this study, PCA was used to examine the relationships between land use, soil type, slope band, surface runoff, groundwater recharge, evapotranspiration, and water yield. Our objective was to identify and compare the potential correlations among these factors. The analysis was conducted using Origin Pro 2025 software.
2.5. Water Supply, Population and Domestic Water Consumption Data
Data on the water supply population and domestic water consumption were obtained from the Water Resources Planning Division, Water Resources Department, Water Management and Land Conservation Bureau, MLIT [30]. Specifically, we used data on the average water supply per person per day and the water supply population, which are available on the MLIT website. The retrieved data only covered 2007–2019, as these were the years available at the time of the study. Using this data, we computed the water supply population in relation to domestic water consumption (measured in millimeters) and groundwater availability (in millimeters) as part of the water balance calculation. Furthermore, we analyzed domestic water consumption as a percentage of the total groundwater flow, which allowed us to better understand the relationship between water usage and groundwater resources. This analysis provided valuable insights into the impact of domestic water consumption on groundwater availability over the study period.
3. Results and Discussion
3.1. Model Performance and Uncertainty Analyses
During calibration (2007–2014), the model performed exceptionally well, with an NSE of 0.81 and R² of 0.81, showing strong accuracy, and a PBIAS of -3.6%, indicating a slight underestimation (Table 2). Validation (2015–2021) maintained this reliability, with an NSE of 0.80 and R² of 0.80; however, the fitting results slightly decreased. The PBIAS increased to -5.7%, which was still within an acceptable range. The model ignored the contribution of reservoirs and their impact because they did not directly affect the results [31]. Semi-distributed models also face input data challenges, especially in mountainous regions, where localized climate variations can introduce errors. Despite these challenges, the Chikugo catchment calibration produced excellent results, demonstrating high-quality input data and a well-structured model.
Figure 3. shows the relationship between the observed and simulated streamflows over the study period, providing insights into the model performance and hydrological dynamics in the Chikugo River basin. The simulated peak discharge exhibited a significant variation when the model underestimated the peak flow during extreme flooding events. However, the observed and simulated discharges corresponded to the precipitation patterns of the basin. Figure 3 shows that the cumulative discharge was higher in the observed data than in the simulated data during both calibration and validation periods. Overall, the SWAT model consistently produced high and moderate flows, particularly during rainy months. However, the streamflow was underestimated during the water stress months from October to November (following the monsoon season) and December to January. Asakura City experienced floods and severe heavy rainfall landslide disasters in 2017, owing to major extreme flow events in the summer of 2012 [32]. In 2020, another flood was considered to have the second highest observed maximum daily peak discharge, reaching 6, 590 m3 s−1 from July 5 to July 7, 2020, after the 1953 flood in the Chikugo catchment [33].
The observed temporal trends indicated the responsiveness of the basin to rainfall events, with sharp increases in streamflow following peak precipitation, reflecting the rapid runoff generation and transport characteristics of the basin. The inaccuracy of peak discharge in the Chikugo catchment were possibly due to limited meteorological stations; the distance between stations; and uncertainty in GIS data for the spatial distribution of slope, land use, and soil [34]. Moreover, the ability of observed data to accurately record the peak discharge during extreme flooding periods may be limited, leading to uncertainty [35]. The major limitation was that rainfall intensity/duration was not accounted for. Runoff generated by short-duration, high-intensity storms may not be all be simulated to a large extent [36,37]. The agreement between the observed and simulated flows during low-flow periods indicated that the model captured baseflow contributions that are critical for maintaining streamflow during dry periods, thereby ensuring water availability for ecological and human needs [38].
3.2. Sensitive Parameter Analysis
Accurate parameterization is crucial in the calibration of a semi-distributed model characterized by many parameters and must be based on knowledge of the hydrological processes in the system (Arnold et al. 2012). The values of the 17 calibrated model parameters and their relative rank order of model performance based on the t-test and p-value are listed in Table 3. The model parameters CN2, CH_N2, and ALPHA_BF were more significant (p < 0.01) than other parameters at the catchment-scale. Among these, the SCS runoff curve number (CN2) was among the most sensitive parameters for the Chikugo catchment. The next sensitive parameter was CH_N2, which represents Manning’s “n” value for the main channel and is used to describe the channel’s roughness, which affects water flow velocity. This parameter is important in hydrological modeling because it influences the rate at which water flows through the channel network [39]. Parameters such as the baseflow recession coefficient (ALPHA_BF) are important in hydrological modeling, especially in temperate climate catchments such as the Chikugo River basin. Its sensitivity originates from its role in regulating the groundwater discharge into streams, which are affected by seasonal precipitation patterns and subsurface characteristics. Variations in ALPHA_BF significantly impact the simulation of baseflow and overall water balance in temperate regions, affecting streamflow predictions during the dry and wet seasons [40,41,42]. Accurate parameter calibration was critical for accurate hydrological modeling in the Chikugo River basin, where seasonal rainfall and groundwater interactions play significant roles in hydrology.
3.3. Analysis of Annual Water Balance Components
Figure 4. shows the annual temporal variability across the water balance components of the Chikugo River basin from 2007 to 2021, indicating the influence of climatic fluctuations and anthropogenic activities. Surface runoff varied significantly between years, ranging from approximately 236 mm in 2012 to 123 mm in 2013, highlighting its sensitivity to precipitation intensity [43]. However, baseflow varied significantly over time, serving as an important component in maintaining streamflow during dry periods while also reflecting fluctuations in groundwater contributions and recharge patterns. Recharge to deep aquifers remained relatively stable over time, indicating a less immediate impact of short-term climatic fluctuations on deep groundwater storage, as in most Japanese catchments [44,45]. Evapotranspiration (ET), which consistently accounted for the largest proportion of the water balance, highlighted the dominant role of vegetation and climatic factors in driving hydrological processes in the basin [46,47,48]. The dominance of ET, which consistently exceeded 43% of precipitation, demonstrated the basin’s semi-humid climate and the significant influence of vegetation and atmospheric moisture demand [49]. This high ET directly impacted water resource availability, limiting the proportion of accessible water for surface runoff and groundwater recharge and necessitating efficient water management practices [50], particularly for agriculture in the midstream and downstream Chikugo catchment. Precipitation variability was critical in shaping the interannual trends of all components, with wetter years, such as 2012, 2016, and 2021, showing elevated values across ET, baseflow, and runoff. However, drier years, such as 2007, 2008, and 2017, exhibited suppressed values (Figure 4.), particularly in surface runoff and baseflow patterns. The combined trends of baseflow and recharge to deep aquifers revealed the dynamics of groundwater contributions and storage, with higher baseflow years, such as 2012, 2016, 2020, and 2021 (846.96-913.75 mm), exhibiting increased groundwater contributions following significant recharge periods [51]. Recharge to deep aquifers varied only slightly in all years, indicating that long-term groundwater reserves remained stable despite interannual climatic changes. Surface runoff variability demonstrated the sensitivity of the basin to extreme precipitation events, with high runoff years, such as 2012, 2016, 2020, and 2021, possibly resulting from intense rainfall or reduced infiltration capacities, and lower runoff years possibly reflecting enhanced soil retention or decreased rainfall [52].
3.4. Analysis of Seasonal Variation of Water Balance Components
The seasonal variation in the water balance components for the Chikugo River basin (Figure 5.) revealed the distinct hydrological dynamics across winter, spring, summer, and autumn, reflecting the interplay of climatic factors and watershed processes. The dominance of ET in all seasons underscored its significant role in the hydrological cycle, driven by atmospheric demand and vegetation activity, with the highest ET values observed in summer (354.92 mm), followed by spring (231.30 mm), autumn (202.68 mm), and winter (101.15 mm), suggesting the influence of temperature and solar radiation patterns on ET dynamics [53,54,55]. Baseflow exhibited the highest values in summer (379.11 mm), followed by autumn (186.03 mm), spring (179.73 mm), and winter (126.53 mm), indicating seasonal variability of groundwater discharge into the river system and its correlation with precipitation recharge and soil moisture conditions. Recharge to deep aquifers remained relatively consistent across seasons, with values ranging from 40.82 mm in winter to 51.76 mm in autumn, highlighting the stability of long-term groundwater replenishment despite seasonal fluctuations in precipitation and runoff [56,57]. Surface runoff (SURFQ) showed pronounced seasonal variation, with the highest value in summer (103.74 mm), reflecting the impact of intense rainfall and reduced infiltration during this period, followed by spring (37.33 mm), autumn (33.35 mm), and winter (23.87 mm), demonstrating the influence of precipitation intensity, soil saturation, and land use on runoff generation.
The seasonal trends revealed that summer was the most hydrologically active season, characterized by high surface runoff, baseflow, and ET driven by increased precipitation, which enhanced ET rates and soil water movement. The substantial surface runoff during summer underscores the need for effective flood management strategies to mitigate the potential risks associated with intense rainfall and reduced infiltration, whereas elevated baseflow and ET values reflect the dynamic interaction between surface and subsurface water processes during this period [58]. In contrast, winter was marked by the lowest values for ET and surface runoff, indicative of reduced atmospheric demand and lower precipitation intensity. This, in turn, influenced recharge and baseflow dynamics, emphasizing the seasonal disparity in hydrological contributions to the river system. The observed seasonal dynamics highlighted the influence of climatic factors such as precipitation, temperature, and solar radiation on hydrological processes within the Chikugo River basin, with potential implications for water resource management under changing climatic conditions [59,60].
3.5. Relationship Between Land Use, Soil Type, and Slope Band on Water Balance
Based on the PCA results (Figure 6.), PC1 explained 29.54% of the variance, whereas PC2 accounted for 15.89%, capturing a cumulative 45.42% of the total variance. The extracted eigenvectors indicated that groundwater (GWQmm) and ET (ETmm) contributed positively to PC1 (0.58296 and 0.49859, respectively), suggesting that areas with higher groundwater recharge and vegetation cover aligned with PC1. On the other hand, surface runoff (SURQmm) and water yield (WYLDmm) were negatively correlated with PC1 (-0.61757 and -0.16867, respectively), emphasizing that higher runoff reduced groundwater infiltration and ET. Slope band strongly influenced PC2 (-0.66043), indicating that steeper slopes were linked to increased runoff and reduced water retention. Land use (0.69155) was strongly positively correlated with PC2, indicating that different land cover types significantly impacted hydrological processes. Soil type exhibited a lower contribution (0.02772 for PC1 and 0.17672 for PC2), suggesting a relatively minor but still relevant role in water balance. These results indicated that forested or vegetated areas enhanced infiltration and ET, whereas agricultural and developed lands with steeper slopes led to higher runoff and lower groundwater recharge. This underscored the importance of land-use planning and slope management in watershed hydrology to optimize the water balance and mitigate flood risks.
3.6. Domestic Water Use for Sustainable Water Resource Management
The Chikugo River provides water essential for both domestic and agricultural use, benefiting the lives of many people. Domestic water intake from the river is distributed across three main areas: the Eastern Saga Water Supply Authority, the Greater Southern Fukuoka Water Supply Authority, and Fukuoka District Water Supply (Fukuoka Canal), also extending to other regions. According to data from the MLIT, over 3.6 million people rely on the Chikugo River for their water supply. This represents approximately 83.26% of the population of Fukuoka Prefecture, 14.16% of the population of Saga Prefecture, 1% of the population of Kumamoto, and 1.6% of the population of Oita Prefecture. Domestic water use remained relatively stable, averaging 142.4 mm/year over the study period. The highest recorded consumption was 147.84 mm/year in 2011, whereas the lowest was 136.95 mm/year in 2014, exhibiting a 7.4% variation. The temporary decline during 2012–2014 may be attributed to improved water efficiency measures or climate-related factors affecting demand. Groundwater availability showed significant interannual variability, fluctuating between 629.90 mm/year (2007) and 872.08 mm/year (2016), reflecting a 38.4% difference (Table 4). The highest groundwater availability in 2016 (872.08 mm/year) coincided with an increase in domestic water use (142.02 mm/year), suggesting a potential correlation with recharge conditions and extraction levels. However, after 2016, groundwater availability declined by 14.8% in just one year (to 743.15 mm/year in 2017), remaining below 800 mm/year for the subsequent years as (Figure 7.). The contrasting trends in domestic water use and groundwater availability highlighted the importance of integrated water resource management. Although domestic consumption remained relatively stable, the declining groundwater levels in recent years have raised concerns regarding long-term sustainability. Future strategies should focus on improving groundwater recharge, reducing dependence on groundwater sources, and implementing demand-side conservation measures to ensure water security for the increasing population.
4. Conclusions
This study provided critical insights into the hydrological dynamics of the Chikugo River catchment and offered a scientific basis for sustainable water resource management. The SWAT model demonstrated high reliability in streamflow simulations with strong calibration and validation performances, reinforcing its applicability for hydrological assessments in similar river basins. Sensitivity analysis revealed the dominant influences of land use and channel characteristics, emphasizing the need to integrate land management strategies into water resource planning. The water balance assessment highlighted ET as the primary hydrological component, indicating the strong influence of climate and vegetation on water availability. The substantial contribution of baseflow underscored the role of groundwater in sustaining river discharge and emphasized the importance of aquifer conservation and recharge enhancement. Seasonal variations, particularly the sharp decline in rainfall and runoff after August, highlighted the need for adaptive strategies for irrigation, reservoir management, and drought mitigation. For water resource management, domestic water consumption accounted for 16.29%–22.80% of the total groundwater flow, which fluctuated significantly at different periods. When the water demand declined, groundwater variability required continuous monitoring to ensure long-term resource sustainability and climate resilience. These findings contribute to advancing hydrological modeling applications, improving flood and drought resilience, and guiding long-term resource planning. Lastly, limitations and future studies should improve data quality, incorporate climate change scenarios, and integrate human activities. Additionally, exploring sub-basin dynamics and using advanced modeling techniques will enhance water resource management.
Supplementary Materials
The following supporting information can be downloaded at the website of this paper posted on Preprints.org, Table S1. Meteorological station distribution and its average annual precipitation (2007-2021); Table S2. Annual Mean Observed and Simulated Precipitation in the Chikugo Catchment; Figure S1. Comparison of Annual Mean Observed and Simulated Precipitation in the Chikugo Catchment; Table S3. Correspondence between MLIT and SWAT land use code classification; Table S4. Distribution of Soil Types by Area and Percentage in the Watershed; Figure S3. Scatter plots for stream flow calibration (2007-2014); Figure S4. Scatter plots for stream flow validation (2015-2021).
Author Contributions
Conceptualization: S.-i.O., M.S., K.W.; Methodology: K.W.,F.-J.M.; Validation: F.J.M.; Investigation: Y.N., M.Y.; Resources: S.-i.O., M.S., Y.N., M.Y.; Writing—original draft: F.-J.M.; Writing - Review & Editing: K.W.,Y.W.N.,S.-i.O.,M.S.; Supervision: S.-i.O., K.W., M.S.,Y.W.N.; Project administration: S.-i.O., Y. N., M.Y.; Funding acquisition: S.-i.O., Y. N.
Funding
Not Applicable.
Data Availability Statement
The data presented in this study are available on request from the corresponding author.
Acknowledgments
This manuscript is based on data generated during the PhD research of Francis Jhun Macalam, supported by the Philippine Department of Science and Technology – Foreign Graduate Scholarship Program and his home institution, the University of Science and Technology of Southern Philippines. This study was conducted with the assistance of data provided by the Project of Mountain Conservation Research, in Ariake Sea Catchments supported by Forestry Agency, Japan.
Conflicts of Interest
The authors declare no conflicts of interest.
References
- van Vliet, M.T.H.; Jones, E.R.; Flörke, M.; Franssen, W.H.P.; Hanasaki, N.; Wada, Y.; Yearsley, J.R. Global Water Scarcity Including Surface Water Quality and Expansions of Clean Water Technologies. Environmental Research Letters 2021, 16(2), 024020. [Google Scholar] [CrossRef]
- Han, Z.Y.; Han, P.F.; Huang, Q.; Du, M.D.; Hou, A.Z. An Improved Modeling of Precipitation Phase and Snow in the Lancang River Basin in Southwest China. Science China Technological Sciences 2021, 64(7), 1513–1527. [Google Scholar] [CrossRef]
- Kamamia, A.W.; Vogel, C.; Mwangi, H.M.; Feger, K.H.; Sang, J.; Julich, S. Using Soil Erosion as an Indicator for Integrated Water Resources Management: A Case Study of Ruiru Drinking Water Reservoir, Kenya. Environmental Earth Sciences 2022, 81(21). [CrossRef]
- Safeeq, M.; Bart, R.R.; Pelak, N.F.; Singh, C.K.; Dralle, D.N.; Hartsough, P.; Wagenbrenner, J.W. How Realistic Are Water-Balance Closure Assumptions? A Demonstration From the Southern Sierra Critical Zone Observatory and King’s River Experimental Watersheds. Hydrological Processes 2021, 35(5). [CrossRef]
- Gupta, L.; Dixit, J. Estimation of Rainfall-Induced Surface Runoff for the Assam Region, India, Using the GIS-Based NRCS-CN Method. Journal of Maps 2022, 18(2), 428–440. [Google Scholar] [CrossRef]
- Ding, T.; Gao, H. The Record-Breaking Extreme Drought in Yunnan Province, Southwest China During Spring-Early Summer of 2019 and Possible Causes. Journal of Meteorological Research 2020, 34(5), 997–1012. [Google Scholar] [CrossRef]
- Sinclair, S.; Pegram, G.G.S. A Comparison of ASCAT and Modelled Soil Moisture Over South Africa, Using TOPKAPI in Land Surface Mode. Hydrology and Earth System Sciences 2010, 14(4), 613–626. [Google Scholar] [CrossRef]
- Arnold, J.G.; Kiniry, J.R.; Srinivasan, R.; Williams, J.R.; Haney, E.B.; Neitsch, S.L. Soil and Water Assessment Tool: Theoretical Documentation Version 2009 (Technical Report No. 406). Texas Water Resources Institute, Texas A&M University, 2011. https://www.researchgate.net/publication/306205252.
- Halwatura, D.; Najim, M.M.M. Application of the HEC-HMS Model for Runoff Simulation in a Tropical Catchment. Environmental Modelling & Software 2013, 46, 155–162. [Google Scholar] [CrossRef]
- Tan, M.L.; Gassman, P.W.; Yang, X.; Haywood, J. A Review of SWAT Applications, Performance and Future Needs for Simulation of Hydro-Climatic Extremes. Advances in Water Resources 2020, 143, 103662. [Google Scholar] [CrossRef]
- Wang, K.; Onodera, S.I.; Saito, M. Evaluation of Nitrogen Loading in the Last 80 Years in an Urbanized Asian Coastal Catchment Through the Reconstruction of Severe Contamination Period. Environmental Research Letters 2022, 17(1). [CrossRef]
- Wang, K.; Onodera, S.I.; Saito, M.; Ishida, T. Assessment of Long-Term Phosphorus Budget Changes Influenced by Anthropogenic Factors in a Coastal Catchment of Osaka Bay. Science of the Total Environment 2022, 843, 156833. [Google Scholar] [CrossRef]
- Neitsch, S.L.; Arnold, J.G.; Kiniry, J.R.; Williams, J.R. Soil & Water Assessment Tool: Theoretical Documentation Version 2009. Texas Water Resources Institute, 2011. https://swat.tamu.edu/media/99192/swat2009-theory.pdf.
- Dile, Y.T.; Daggupati, P.; George, C.; Srinivasan, R.; Arnold, J. Introducing a New Open Source GIS User Interface for the SWAT Model. Environmental Modelling & Software 2016, 85, 129–138. [CrossRef]
- Chinh, L.V.; Iseri, H.; Hiramatsu, K.; Harada, M. A GIS-Based Distributed Parameter Model for Rainfall Runoff Calculation Using Arc Hydro Tool and Curve Number Method for Chikugo River Basin in Japan. Journal of Faculty of Agriculture, Kyushu University 2010, 55(2), 313–310. [CrossRef]
- Azhikodan, G.; Yokoyama, K. Seasonal Morphodynamic Evolution in a Meandering Channel of Macrotidal Estuary. Science of the Total Environment 2019, 684, 281–295. [Google Scholar] [CrossRef]
- Suzuki, K.W.; Nakayama, K.; Tanaka, M. Horizontal Distribution and Population Dynamics of the Dominant Mysid Hyperacanthomysis longirostris Along a Temperate Macrotidal Estuary (Chikugo River Estuary, Japan). Estuarine, Coastal and Shelf Science 2009, 83(4), 516–528. [CrossRef]
- Saquib, S.; Gupta, A.; Joshi, A. Emerging Water Crisis: Impact of Urbanization on Water Resources and Constructed Wetlands as a Nature-Based Solution (NbS). In Current Directions in Water Scarcity Research 2022, 6, 447–468. [Google Scholar] [CrossRef]
- U.S. Geological Survey. Earth Explorer. U.S. Department of the Interior, 2023. https://earthexplorer.usgs.gov/.
- Ministry of Land, Infrastructure, Transport and Tourism. National Land Classification Survey Data [Shapefile], 2023. https://nlftp.mlit.go.jp/kokjo/inspect/landclassification/download.html.
- Ministry of Land, Infrastructure, Transport and Tourism. Land Use Subdivision Mesh Data (L03-b), 2023. https://nlftp.mlit.go.jp/ksj/gml/datalist/KsjTmplt-L03-b-v3_1.html.
- Japan Meteorological Agency. Weather Map and AMeDAS Observation Data, 2023. https://www.jma.go.jp/jma/index.html.
- Ministry of Land, Infrastructure, Transport and Tourism. Water Level Observation Site Information [CSV/Excel], 2023. http://www1.river.go.jp/cgi-bin/SiteInfo.exe?ID=309061289901190.
- Abbaspour, K.C.; Vejdani, M.; Haghighat, S.; Yang, J. SWAT-CUP Calibration and Uncertainty Programs for SWAT. In MODSIM 2007 International Congress on Modelling and Simulation, 2007, 1596–1602. https://scholar.google.com/scholar?cluster=7621557009645148872.
- Hargreaves, G.H.; Samani, Z.A. Estimating Potential Evapotranspiration. Journal of Irrigation and Drainage Engineering (ASCE) 1982, 108(3), 223–230. [Google Scholar] [CrossRef]
- Arnold, J.G.; Moriasi, D.N.; Gassman, P.W.; Abbaspour, K.C.; White, M.J.; Srinivasan, R.; Santhi, C.; Harmel, D.; van Griensven, A.; Van Liew, M.W.; Kannan, N.; Jha, M.K. SWAT: Model Use, Calibration, and Validation . Transactions of the ASABE 2012, 55, 1491–1508, http://refhub.elsevier.com/S2214-5818(22)00147-1/sbref6. [Google Scholar] [CrossRef]
- Abbaspour, K.C.; Vejdani, M.; Haghighat, S.; Yang, J. SWAT-CUP Calibration and Uncertainty Programs for SWAT. In MODSIM 2007 International Congress on Modelling and Simulation, 2007, 1596–1602. https://scholar.google.com/scholar?cluster=7621557009645148872.
- Moriasi, D.N.; Arnold, J.G.; Van Liew, M.W.; Bingner, R.L.; Harmel, D.R.; Veith, T.L. Model Evaluation Guidelines for Systematic Quantification of Accuracy in Watershed Simulations. Transactions of the ASABE 2007, 50, 885–900. [Google Scholar] [CrossRef]
- Abdi, H.; Williams, L.J. Principal Component Analysis. Wiley Interdisciplinary Reviews: Computational Statistics 2010, 2(4), 433–459. [CrossRef]
- Ministry of Land, Infrastructure, Transport and Tourism. Water Resources Data Summary [Excel File], 2023. https://view.officeapps.live.com/op/view.aspx?src=https%3A%2F%2Fwww.mlit.go.jp%2Fmizukokudo%2Fmizsei%2Fcontent%2F001593175.xlsx.
- Wang, K.; Onodera, S.I.; Saito, M.; Okuda, N.; Okubo, T. Estimation of Phosphorus Transport Influenced by Climate Change in a Rice Paddy Catchment Using SWAT. International Journal of Environmental Research 2021, 15(4), 759–772. [Google Scholar] [CrossRef]
- Japan Society of Civil Engineers. Heisei 29 July Kyushu Northern Heavy Rain Disaster Investigation Report, 2020. https://committees.jsce.or.jp/report/node/209.
- Phyu, P.E.; Azhikodan, G.; Yokoyama, K. Effects of Past Human Activities and Recent Disasters on Riverbed Morphology of the Chikugo River Estuary. Journal of JSCE 2024, 12(2), Article ID: 23-16019. [CrossRef]
- Kibet, K.B.; Takeuchi, J.; Fujihara, M. Applicability of SWAT Model for Streamflow Simulation in a Highly Managed Agricultural Watershed. Journal of Rainwater Catchment Systems 2018, 23(2), 19–29. https://www.jstage.jst.go.jp/article/jrcsa/23/2/23_23_2_19/_pdf/-char/ja.
- Wang, K.; Onodera, S.I.; Saito, M.; Shimizu, Y. Assessment of Nitrogen Budget in Detailed Spatial Pattern Using High Precision Modeling Approach With Constructed Accurate Agricultural Behavior. Science of the Total Environment 2024, 912, 169631. [Google Scholar] [CrossRef] [PubMed]
- King, K.W.; Arnold, J.G.; Bingner, R.L. Comparison of Green-Ampt and Curve Number Methods on Goodwin Creek Watershed Using SWAT. Transactions of the ASAE 1999, 42(4), 919–925. [Google Scholar] [CrossRef]
- Nang, Y.W.; Onodera, S.I.; Wang, K.; Shimizu, Y.; Saito, M. Slope Gradient Effects on Sediment Yield of Different Land Cover and Soil Types. Water 2024, 16(10), 1419. [Google Scholar] [CrossRef]
- Schlef, K.E.; François, B.; Brown, C. Comparing Flood Projection Approaches Across Hydro-Climatologically Diverse United States River Basins. Water Resources Research 2021, 57(1). [CrossRef]
- Boithias, L.; Sauvage, S.; Lenica, A.; Roux, H.; Abbaspour, K.; Larnier, K.; Dartus, D.; Perez, J.M.S. Simulating Flash Floods at Hourly Time-Step Using the SWAT Model. Water 2017, 9(12), 929. https://www.mdpi.com/2073-4441/9/12/929.
- Lee, J.; Kim, S.; Park, J.; Arnold, J.G. Enhancing Sustainability in Watershed Management: Spatiotemporal Assessment of Baseflow Alpha Factor in SWAT. Sustainability 2024, 16(21), 9189. [Google Scholar] [CrossRef]
- Sharma, R.; Singh, S. Streamflow and Sediment Simulation in the Song River Basin Using SWAT. Frontiers in Water 2025, 3, 1500086. [Google Scholar] [CrossRef]
- Aboelnour, M.; Gitau, M.W.; Engel, B.A. A Comparison of Streamflow and Baseflow Responses to Land-Use Change and the Variation in Climate Parameters Using SWAT. Water 2020, 12(1), 191. [Google Scholar] [CrossRef]
- Kubota, S.; Nishida, K.; Yoshida, S. Plant Hydraulic Resistance Controls Transpiration of Soybean in Rotational Paddy Fields Under Humid Climates. Paddy and Water Environment 2023, 21(2), 219–230. [Google Scholar] [CrossRef]
- Lu, Z.; Feng, Q.; Xie, J.; Yin, Z.; Zhu, M.; Xu, M. The Reallocation of Water and Ecosystem Service Values in Arid Ecosystems With the Implementation of an Ecological Water Diversion Project. Applied Water Science 2023, 13(4). [CrossRef]
- Wu, D.; Fang, S.; Tong, X.; Wang, L.; Zhuo, W.; Pei, Z.; Wu, Y.; Zhang, J.; Li, M. Analysis of Variation in Reference Evapotranspiration and Its Driving Factors in Mainland China From 1960 to 2016. Environmental Research Letters 2021, 16(5), 054016. [Google Scholar] [CrossRef]
- Lo, M.-H.; et al. Intense Agricultural Irrigation Induced Contrasting Precipitation Changes in Saudi Arabia. Environmental Research Letters 2021, 16(6), 064049. [Google Scholar] [CrossRef]
- Scanlon, B.R.; Rateb, A.; Pool, D.R.; Sanford, W.; Save, H.; Sun, A.; Long, D.; Fuchs, B. Effects of Climate and Irrigation on GRACE-Based Estimates of Water Storage Changes in Major US Aquifers. Environmental Research Letters 2021, 16(9), 094009. [Google Scholar] [CrossRef]
- Xiong, J.; Abhishek, Y.; Xu, L.; Chandanpurkar, H.A.; Famiglietti, J.S.; Zhang, C.; Ghiggi, G.; Guo, S.; Pan, Y.; Vishwakarma, B.D. ET-WB: Water Balance-Based Estimations of Terrestrial Evaporation Over Global Land and Major Global Basins. arXiv 2023. [Google Scholar] [CrossRef]
- Yi, W.; Feng, Y.; Liang, S.; Kuang, X.; Yan, D.; Wan, L. Increasing Annual Streamflow and Groundwater Storage in Response to Climate Warming in the Yangtze River Source Region. Environmental Research Letters 2021, 16(8), 084011. [Google Scholar] [CrossRef]
- Wang, K.; Onodera, S.I.; Saito, M.; Shimizu, Y.; Iwata, T. Effects of Forest Growth in Different Vegetation Communities on Forest Catchment Water Balance. Science of the Total Environment 2022, 809, 151159. [Google Scholar] [CrossRef]
- Kebede, S.; Charles, K.; Godfrey, S.; MacDonald, A.; Taylor, R. Regional-Scale Interactions Between Groundwater and Surface Water Under Changing Aridity: Evidence From the River Awash Basin, Ethiopia. Hydrological Sciences Journal 2021, 66(3), 450–463. [Google Scholar] [CrossRef]
- Xu, L.; Sun, S.; Chen, H.; Chai, H.; Wang, R.; Zhou, Y.; Ma, Q.; Chotamonsak, C.; Wangpakapattanawong, P. Changes in the Reference Evapotranspiration and Contributions of Climate Factors Over the Indo–China Peninsula During 1961–2017. International Journal of Climatology 2021, 41(15), 6511–6529. [Google Scholar] [CrossRef]
- KanthaRao, B.; Rakesh, V. Observational Evidence for the Relationship Between Spring Soil Moisture and June Rainfall Over the Indian Region. Theoretical and Applied Climatology 2017, 132(3–4), 835–849. [CrossRef]
- Matheswaran, K.; Khadka, A.; Dhaubanjar, S.; Bharati, L.; Kumar, S.; Shrestha, S. Delineation of Spring Recharge Zones Using Environmental Isotopes to Support Climate-Resilient Interventions in Two Mountainous Catchments in Far-Western Nepal. Hydrogeology Journal 2019, 27(6), 2181–2197. [Google Scholar] [CrossRef]
- Rezaei, A. Chemistry of the Karst Sarabkalan Spring, Iran, and Controls of PDO and ENSO Climate Indices on It. Groundwater 2020, 59(2), 236–244. [Google Scholar] [CrossRef] [PubMed]
- Ferede, M.; Haile, A.T.; Walker, D.; Gowing, J.; Parkin, G. Multi-Method Groundwater Recharge Estimation at Eshito Micro-Watershed, Rift Valley Basin in Ethiopia. Hydrological Sciences Journal 2020, 65(9), 1596–1605. [Google Scholar] [CrossRef]
- Harrison, H.; Hammond, J.C.; Kampf, S.; Kiewiet, L. On the Hydrological Difference Between Catchments Above and Below the Intermittent-Persistent Snow Transition. Hydrological Processes 2021, 35(11). [CrossRef]
- Wang, K.; Onodera, S.I.; Saito, M.; Shimizu, Y.; Iwata, T. Long-Term Variations in Water Balance by Increase in Percent Imperviousness of Urban Regions. Journal of Hydrology 2021. [Google Scholar] [CrossRef]
- Trancoso, R.; Larsen, J.R.; McVicar, T.R.; Phinn, S.R.; McAlpine, C.A. CO₂-Vegetation Feedback and Other Climate Changes Implicated in Reducing Base Flow. Geophysical Research Letters 2017, 44(5), 2310–2318. [Google Scholar] [CrossRef]
- Sabathier, R.; Ainger, M.B.; Stella, J.C.; Roberts, D.A.; Caylor, K.K.; Jaeger, K.L.; Olden, J.D. High Resolution Spatiotemporal Patterns of Flow at the Landscape Scale in Montane Non-Perennial Streams. River Research and Applications 2022, 39(2), 225–240. [Google Scholar] [CrossRef]
Figure 1.
Distribution of meteorological and hydrological stations and location map of Chikugo catchment.
Figure 1.
Distribution of meteorological and hydrological stations and location map of Chikugo catchment.
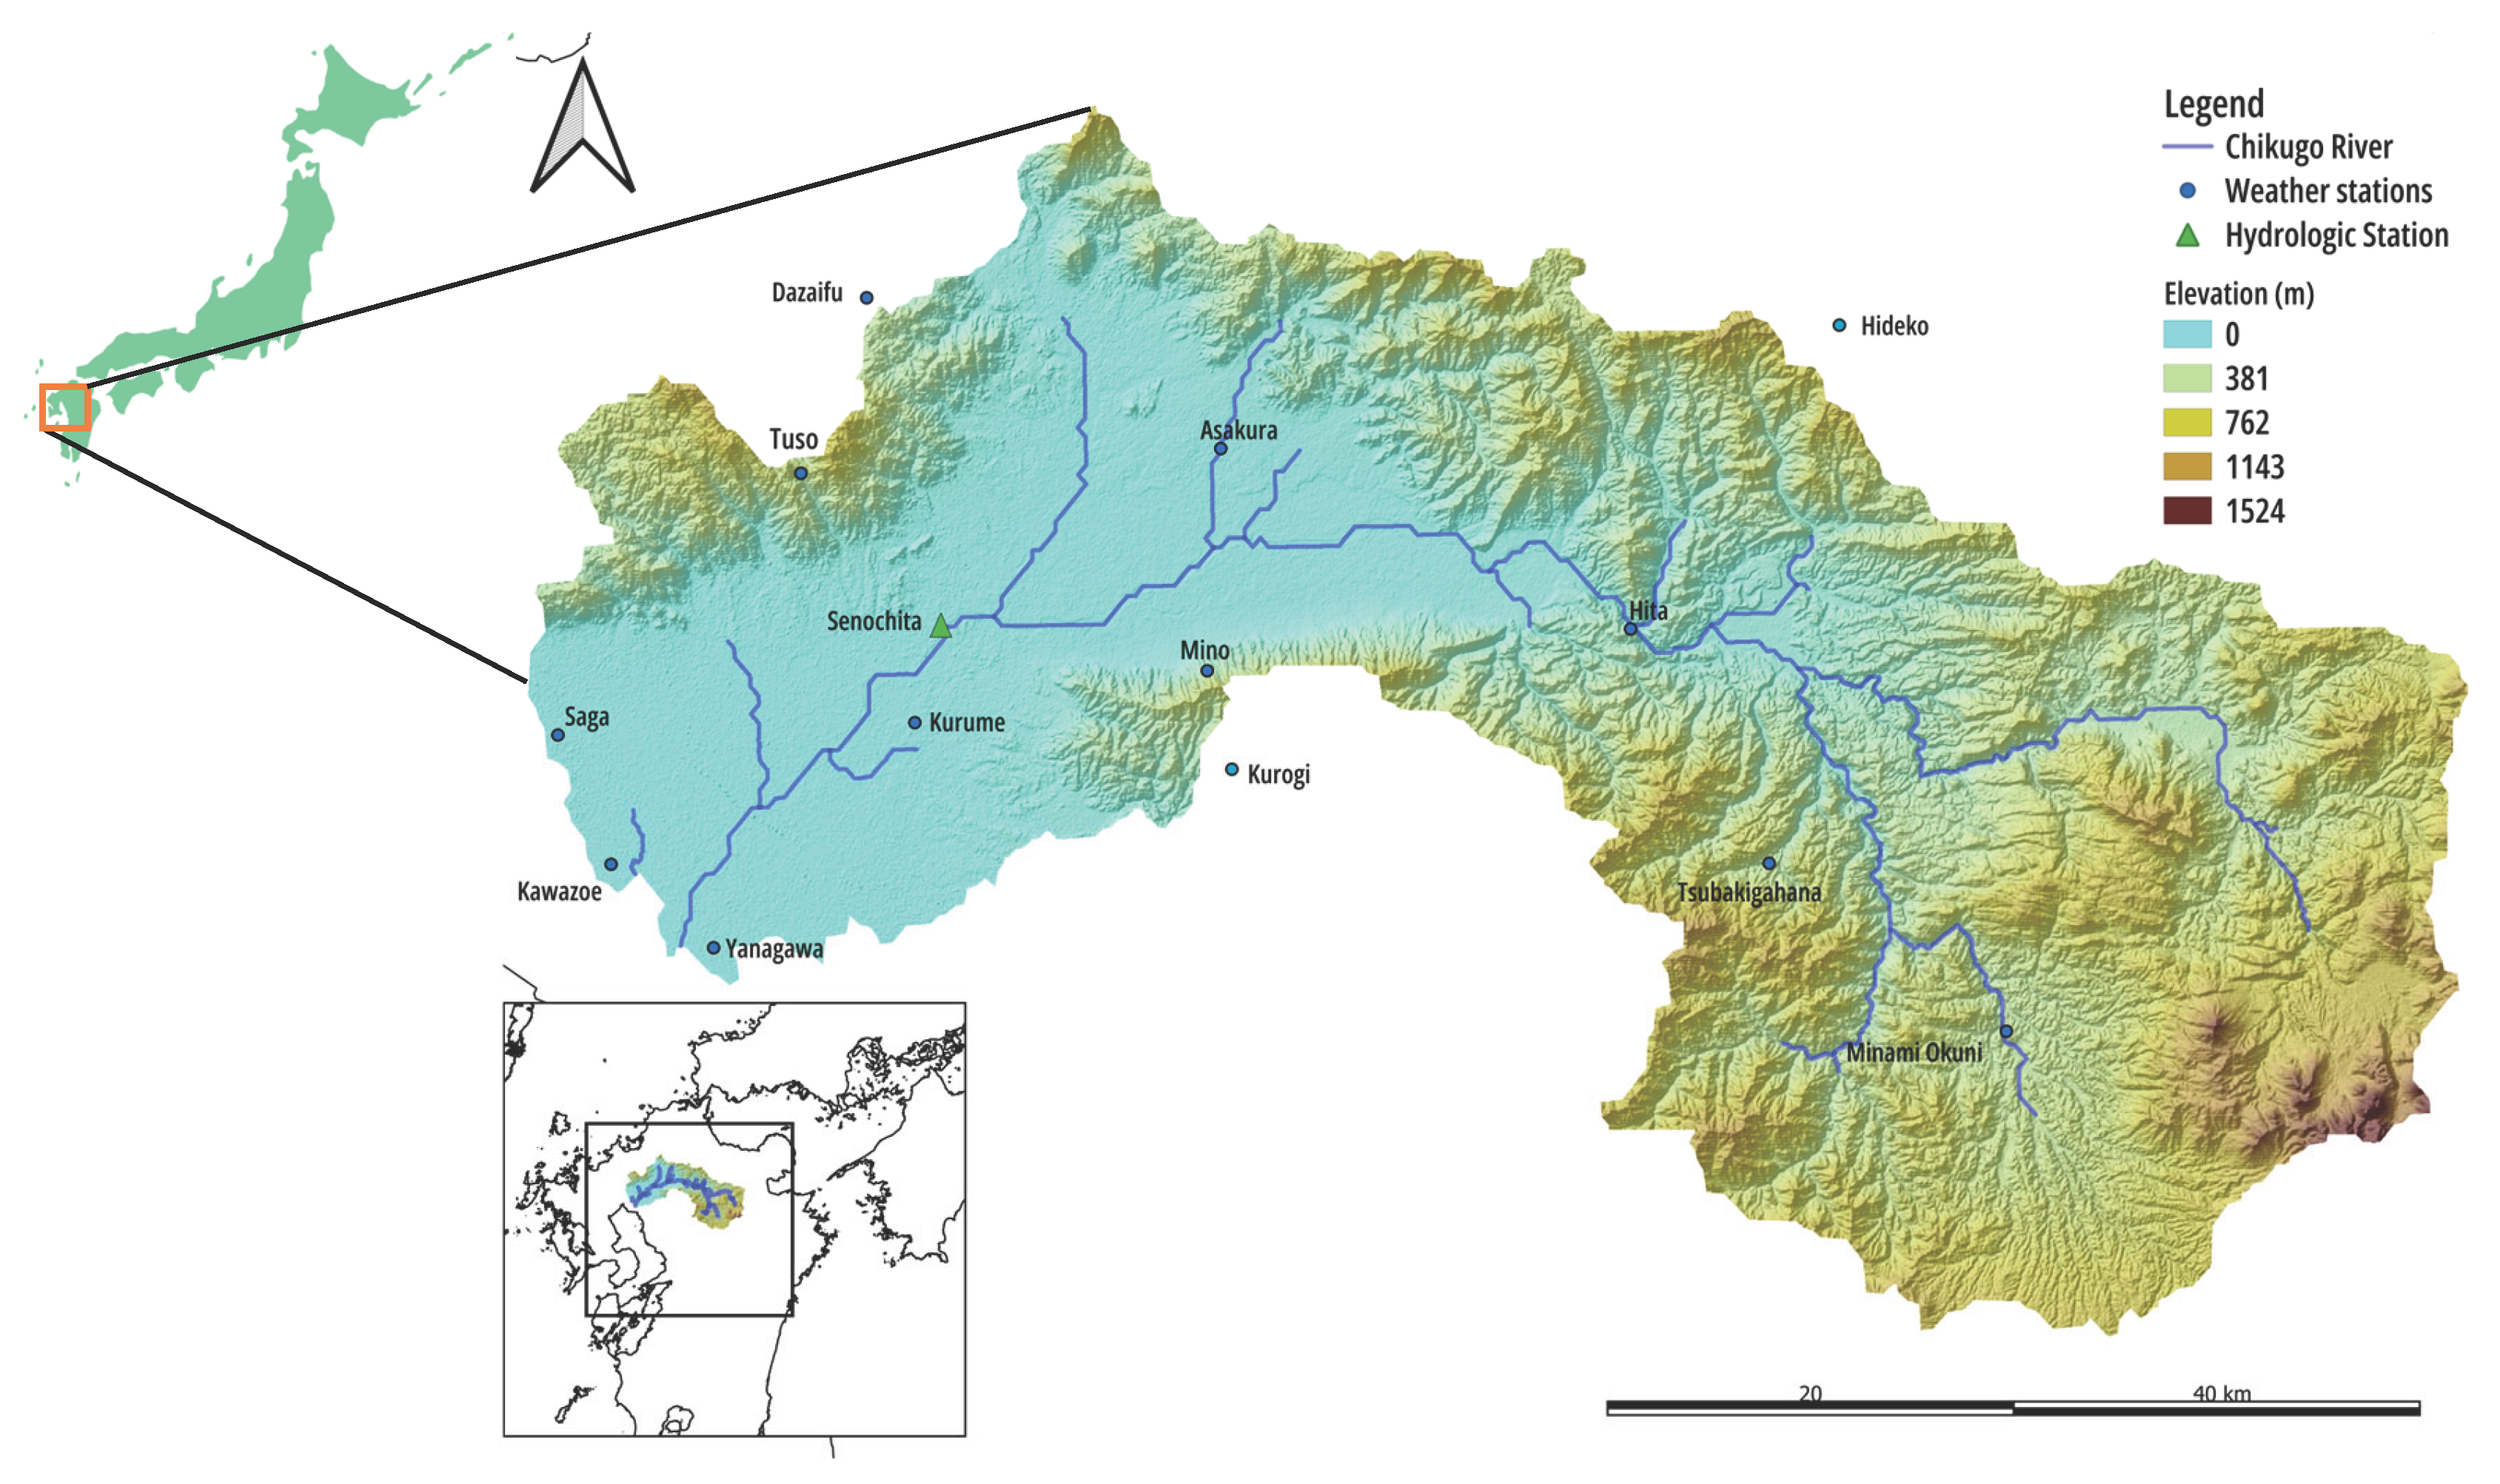
Figure 2.
(a) Soil type map, and (b) Land use map of Chikugo catchment in 2014 extracted from Ministry of Land Infrastructure, Transport and Tourism (MLIT).
Figure 2.
(a) Soil type map, and (b) Land use map of Chikugo catchment in 2014 extracted from Ministry of Land Infrastructure, Transport and Tourism (MLIT).
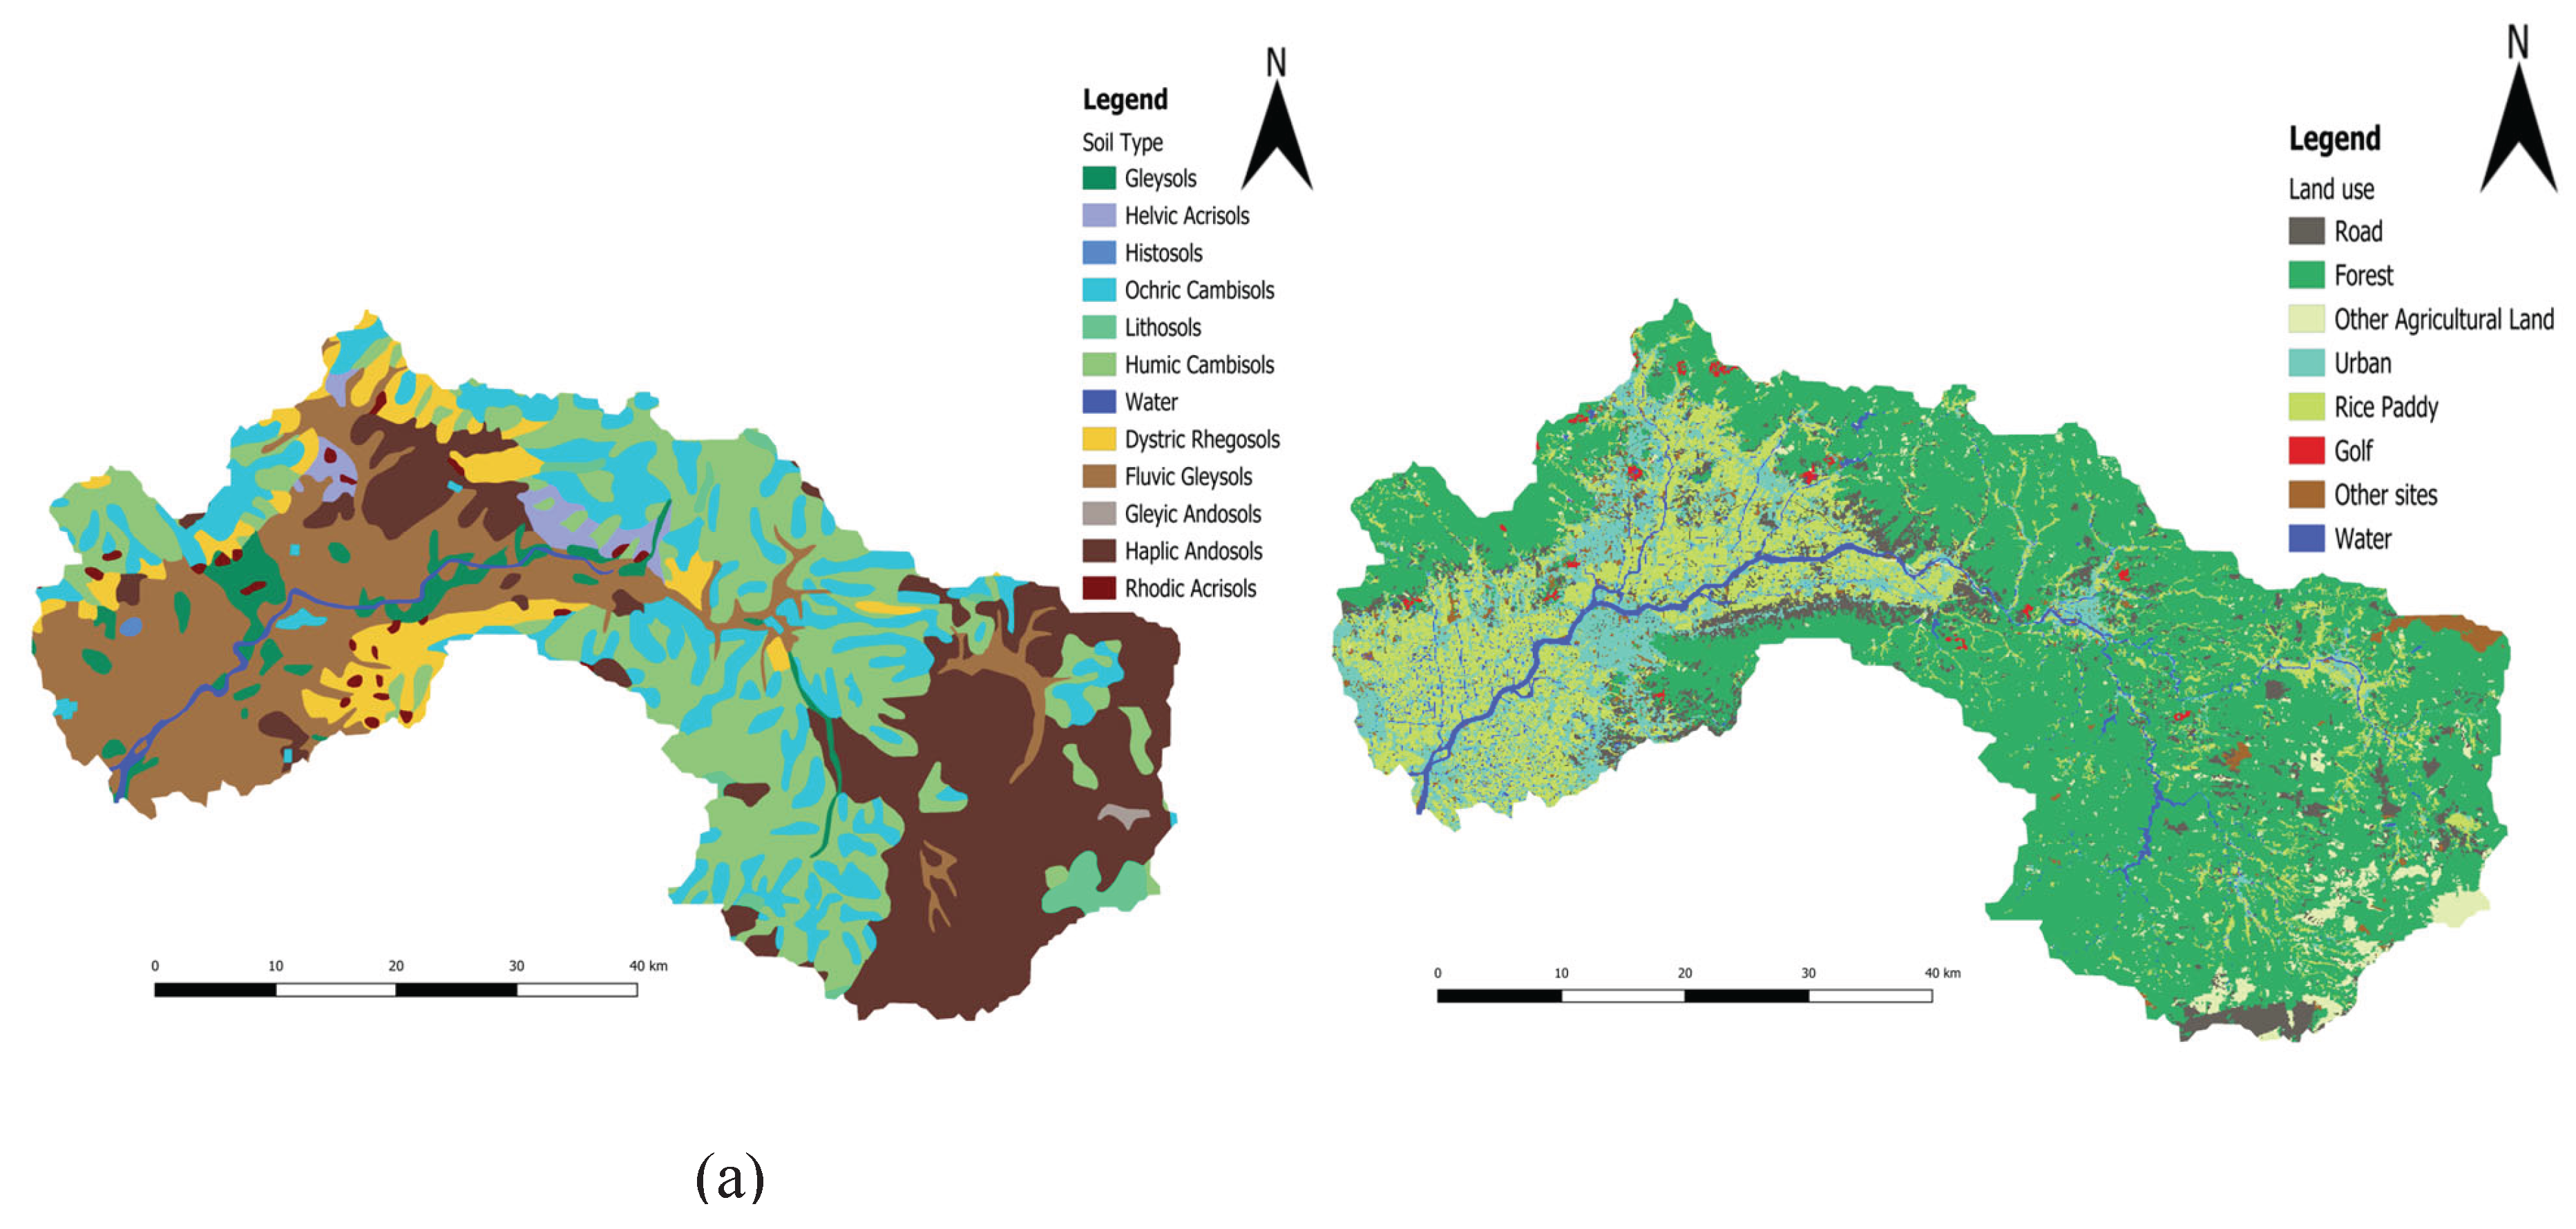
Figure 3.
Comparison between observed and simulated daily streamflow vs precipitation.

Figure 4.
Average annual water balance ratio between 2007 and 2021.
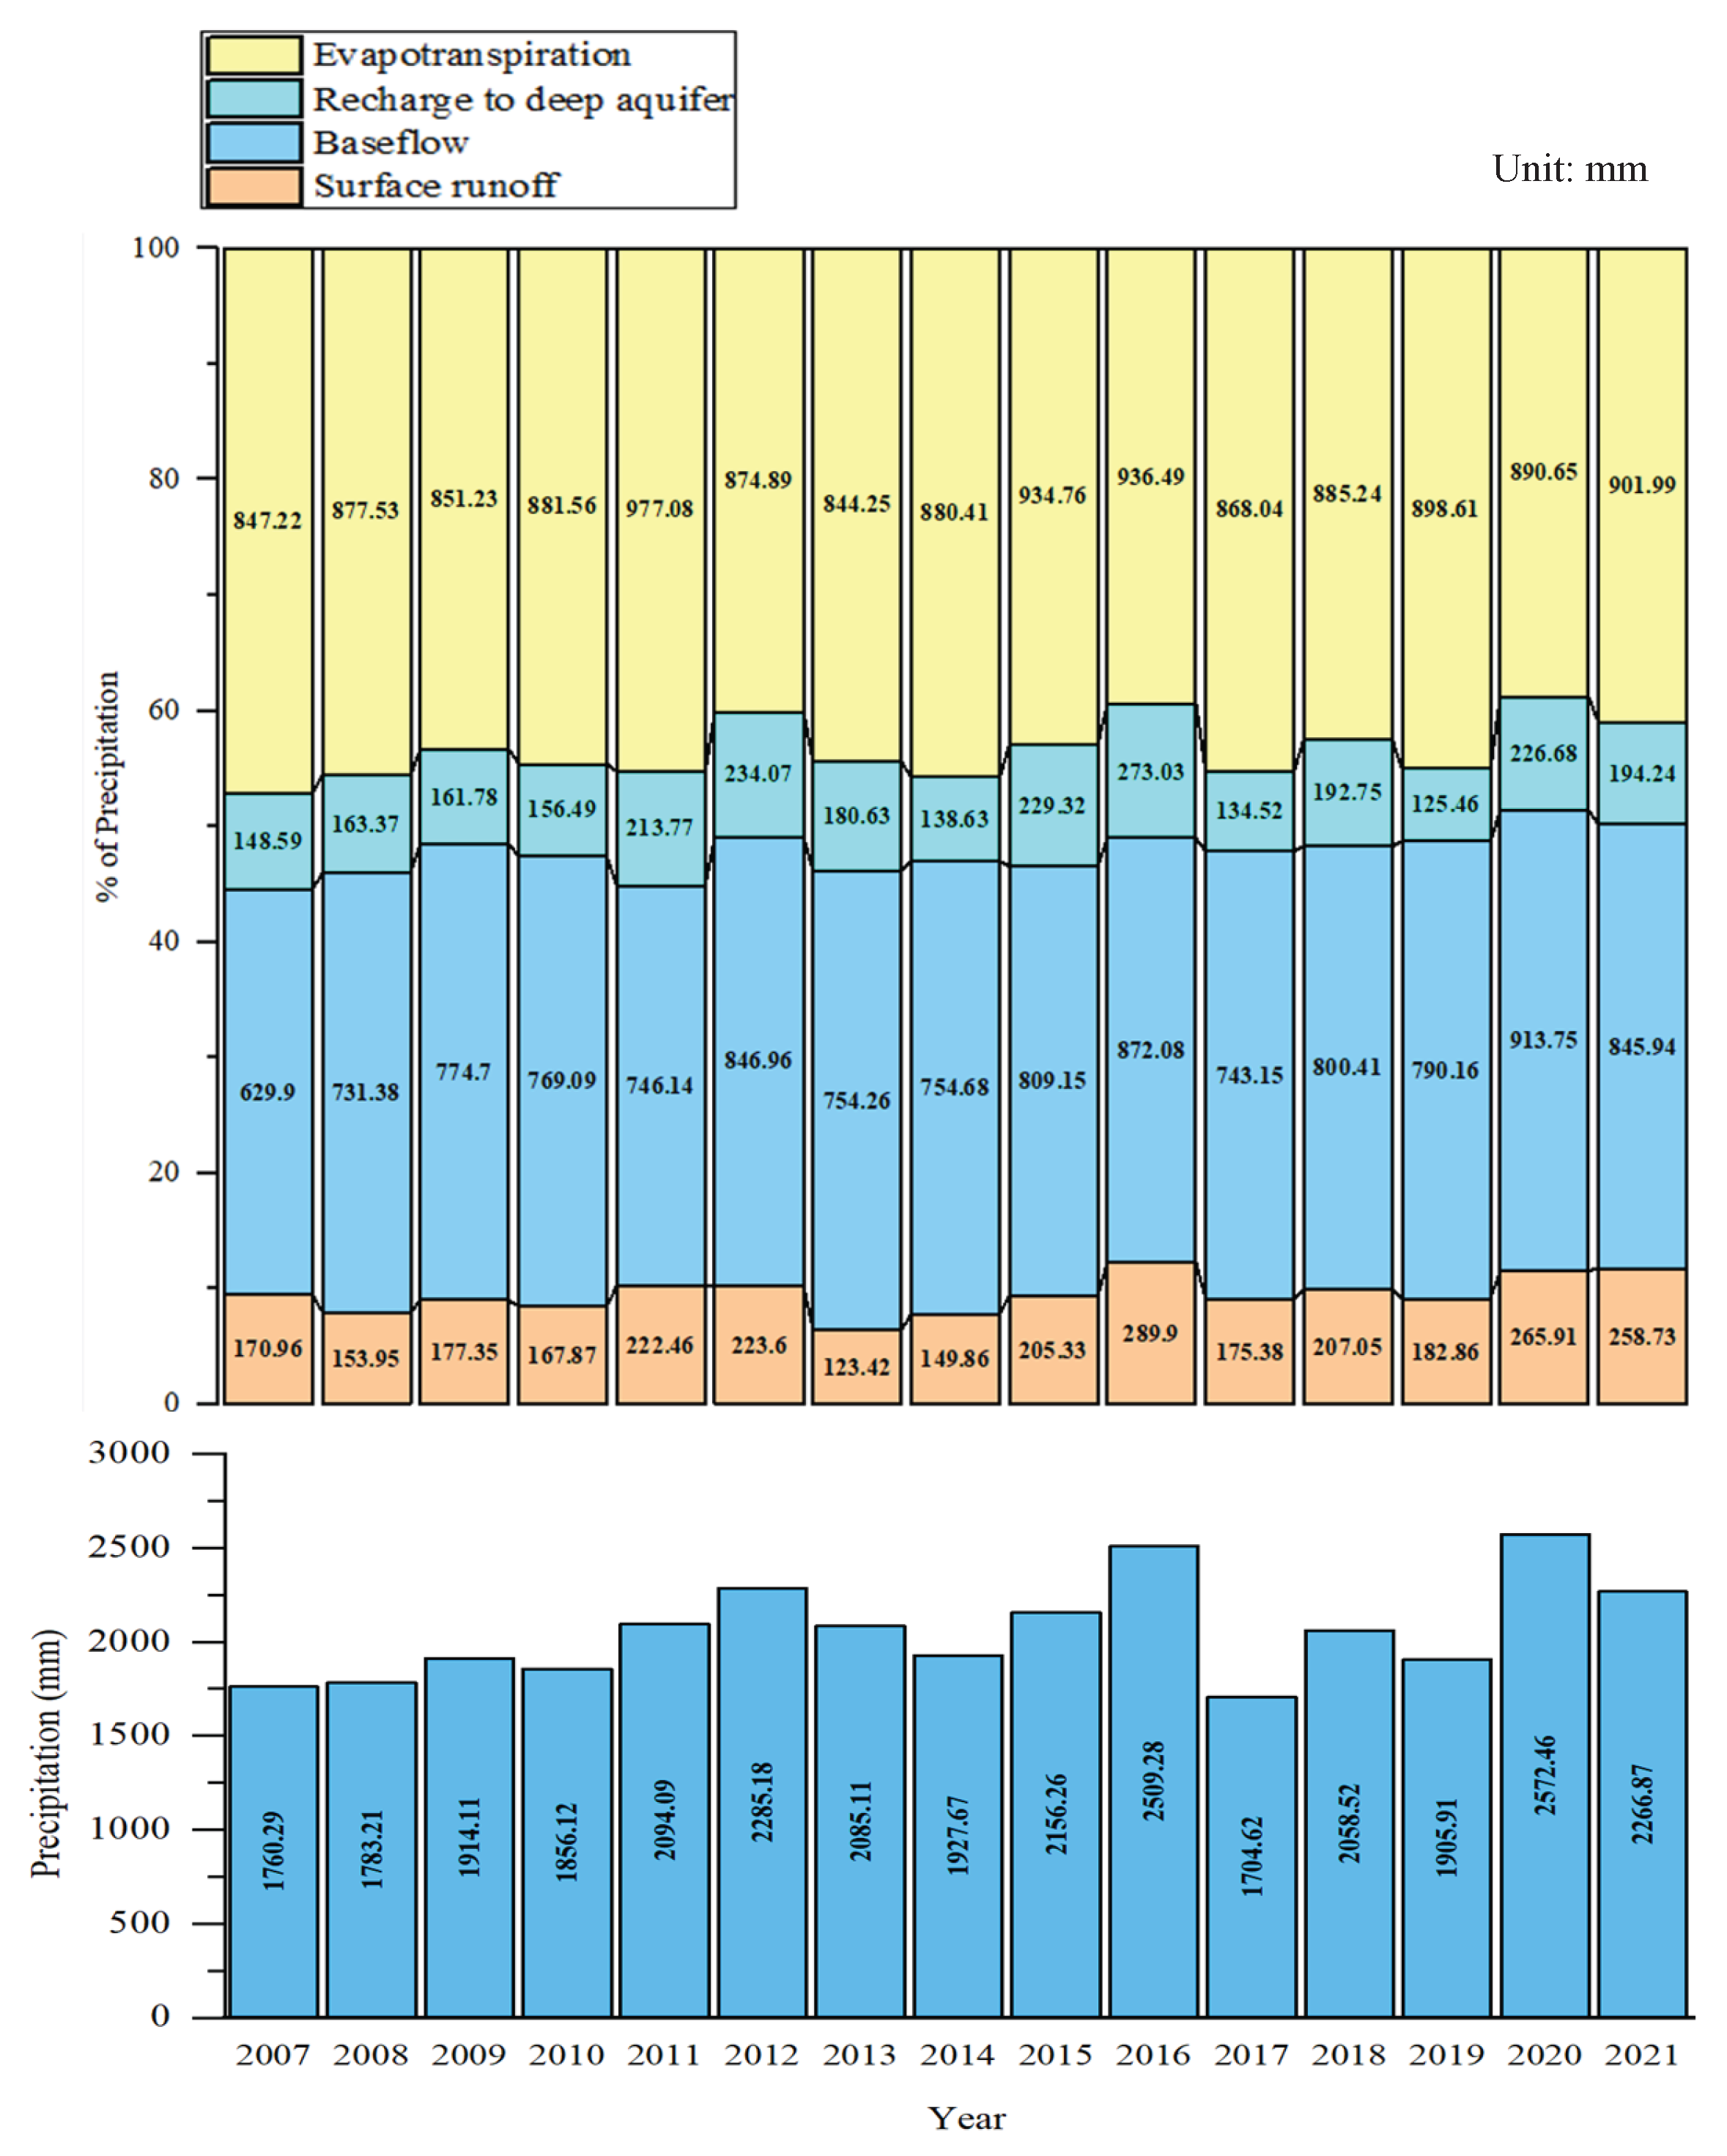
Figure 5.
Seasonal distribution of catchment hydrological components.
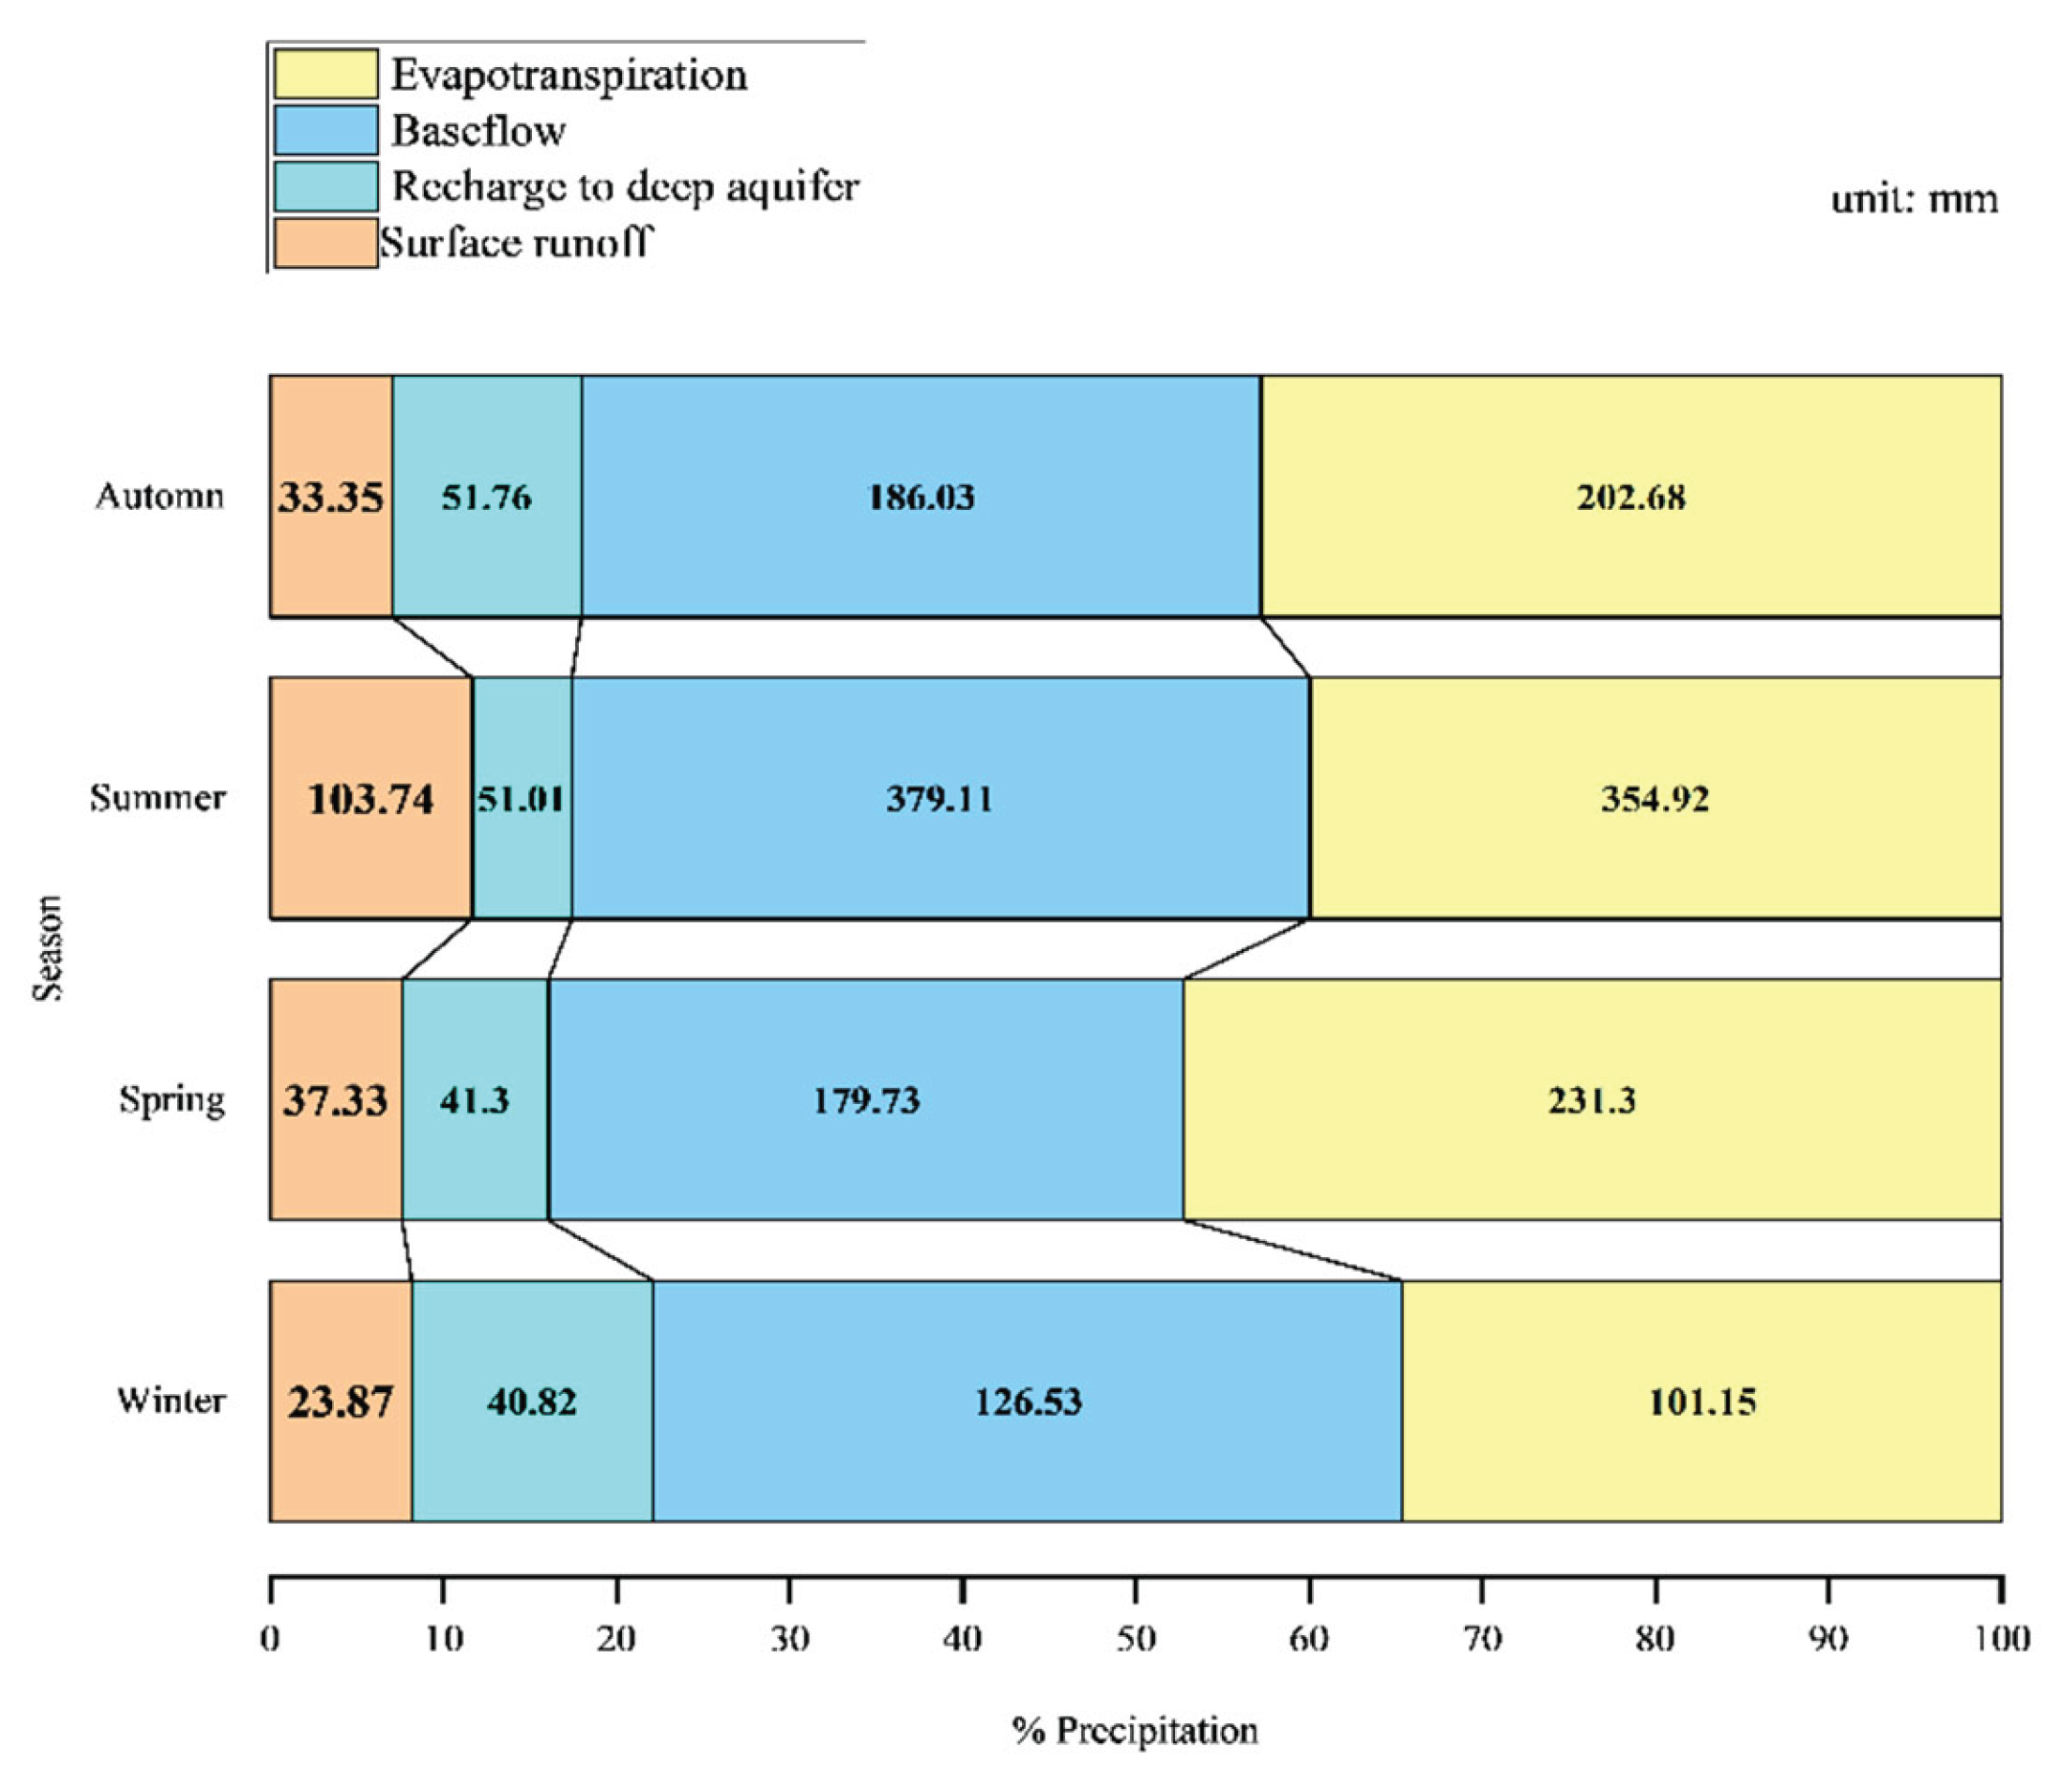
Figure 6.
Principal Component Analysis of land use, soil type, and slope band influences on hydrological processes.
Figure 6.
Principal Component Analysis of land use, soil type, and slope band influences on hydrological processes.
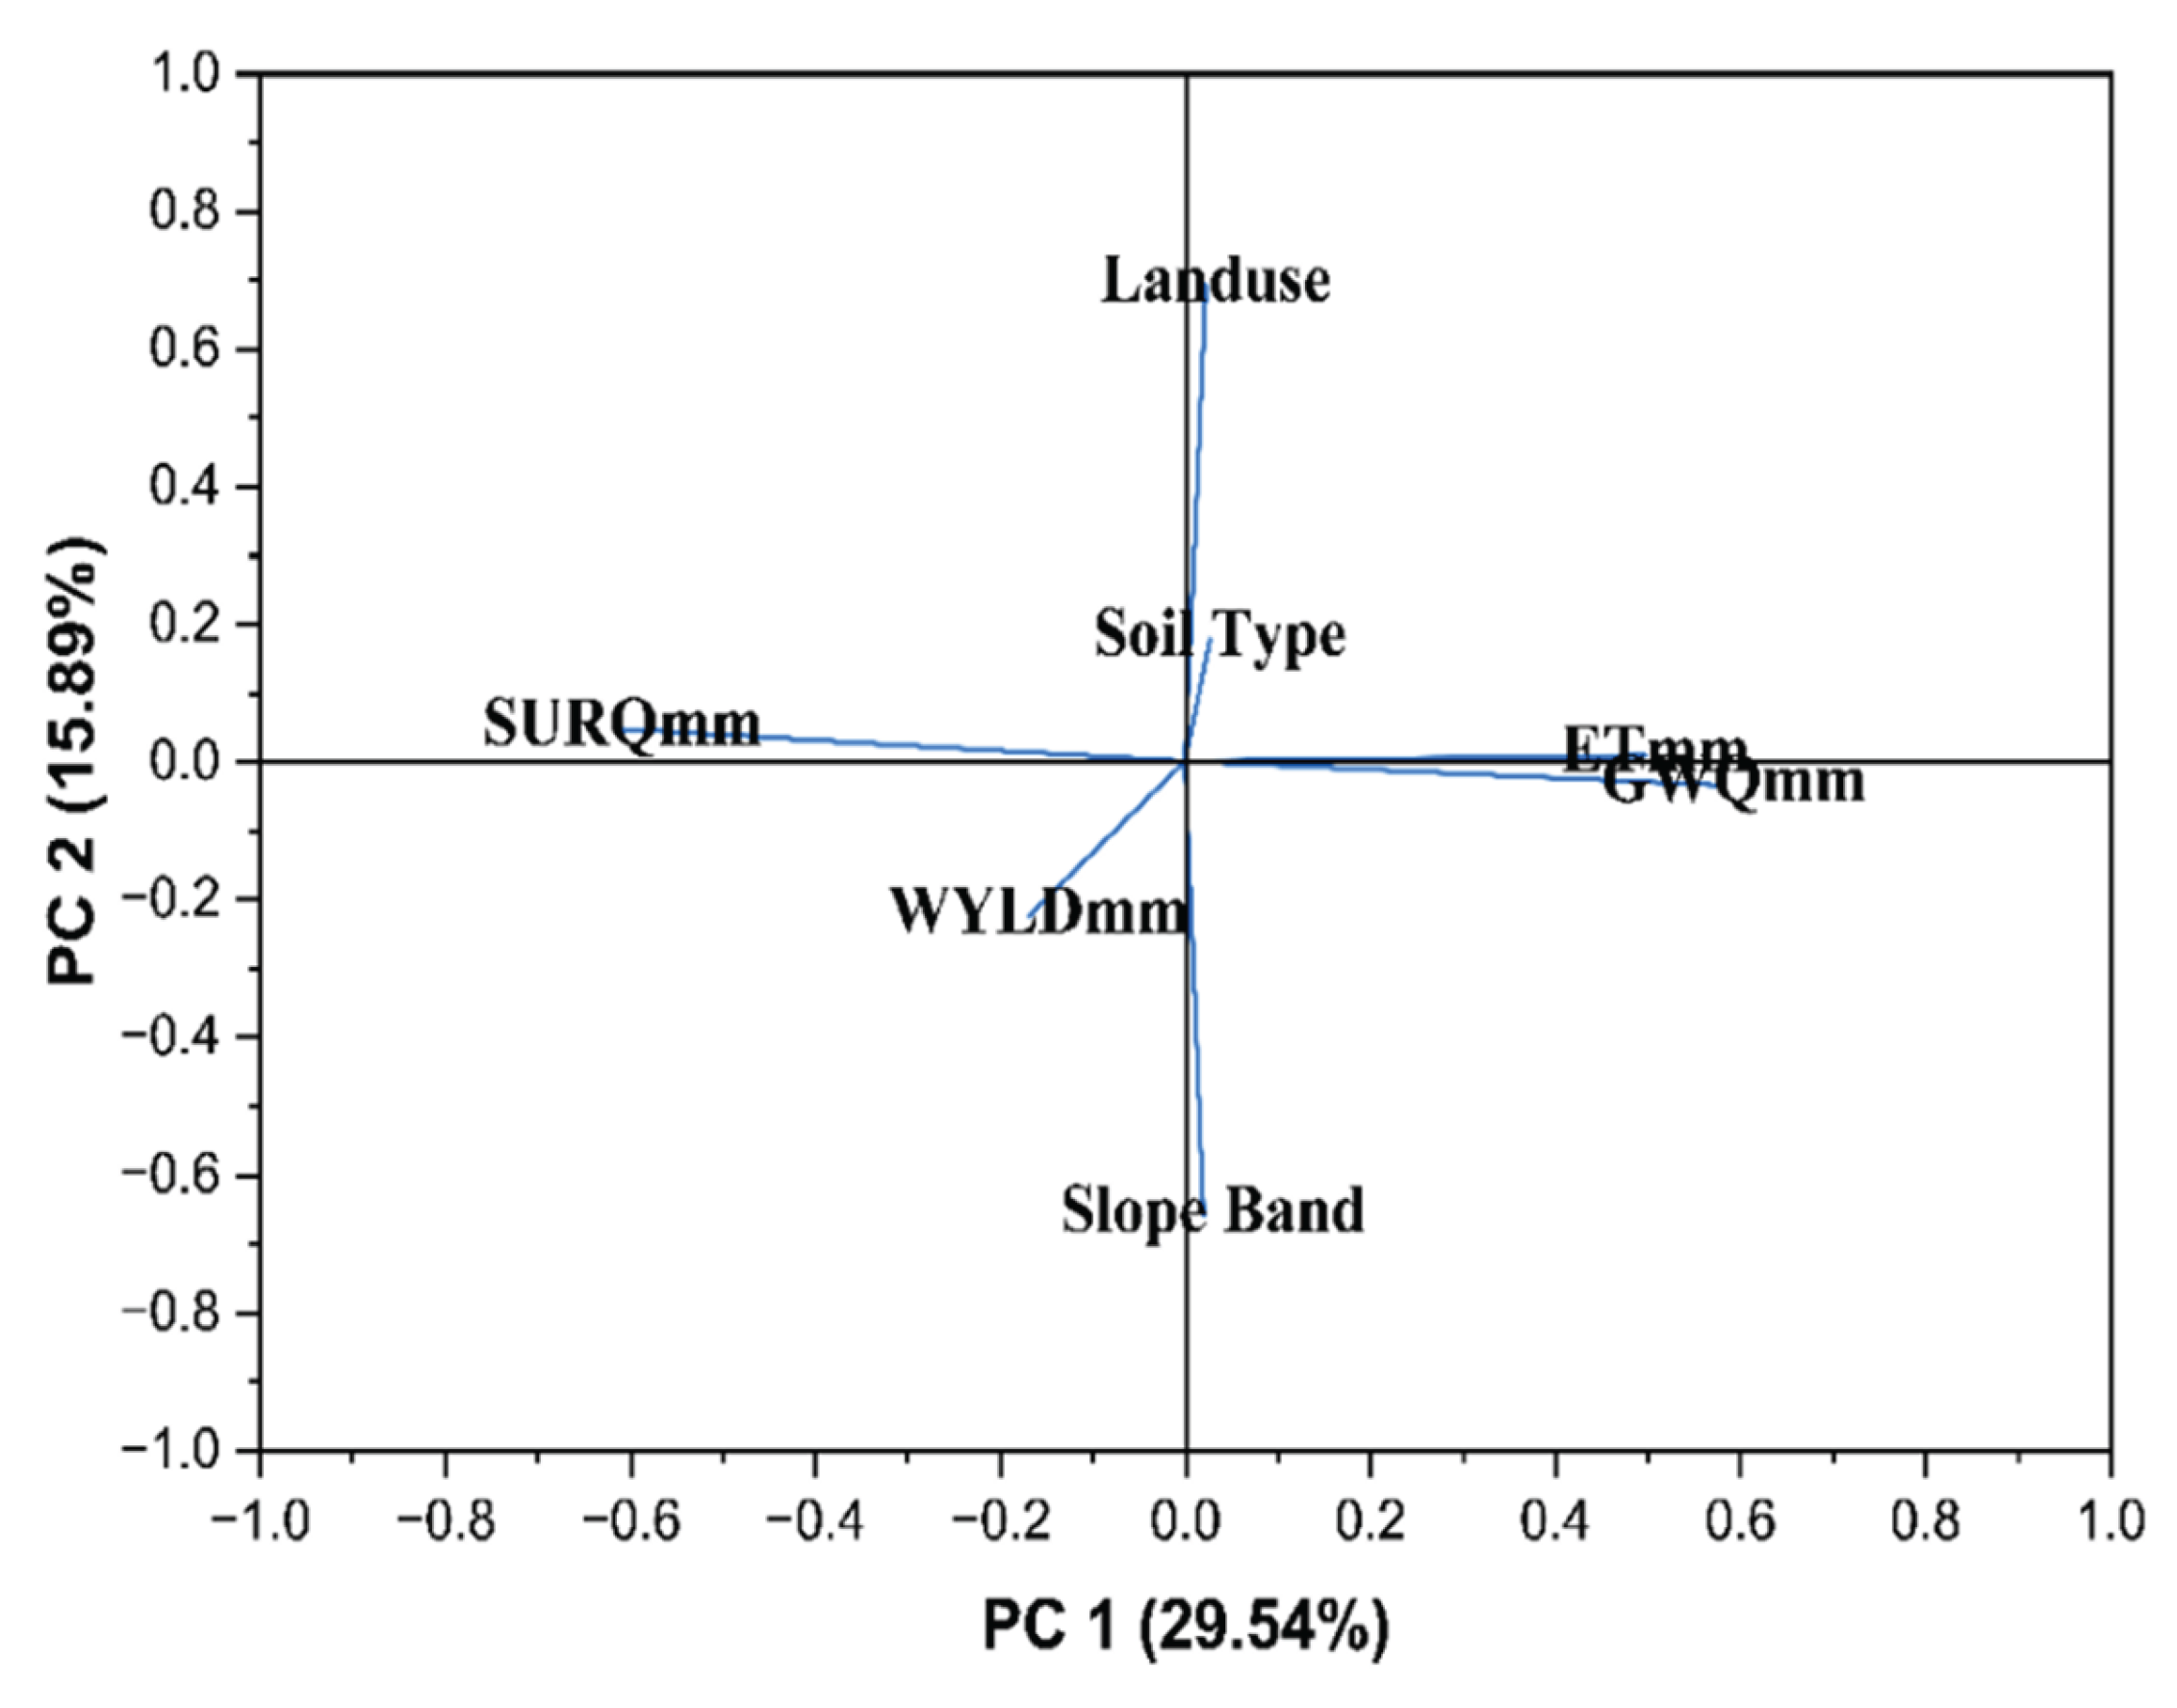
Figure 7.
Trends in domestic water use and groundwater flow within Chikugo catchment.
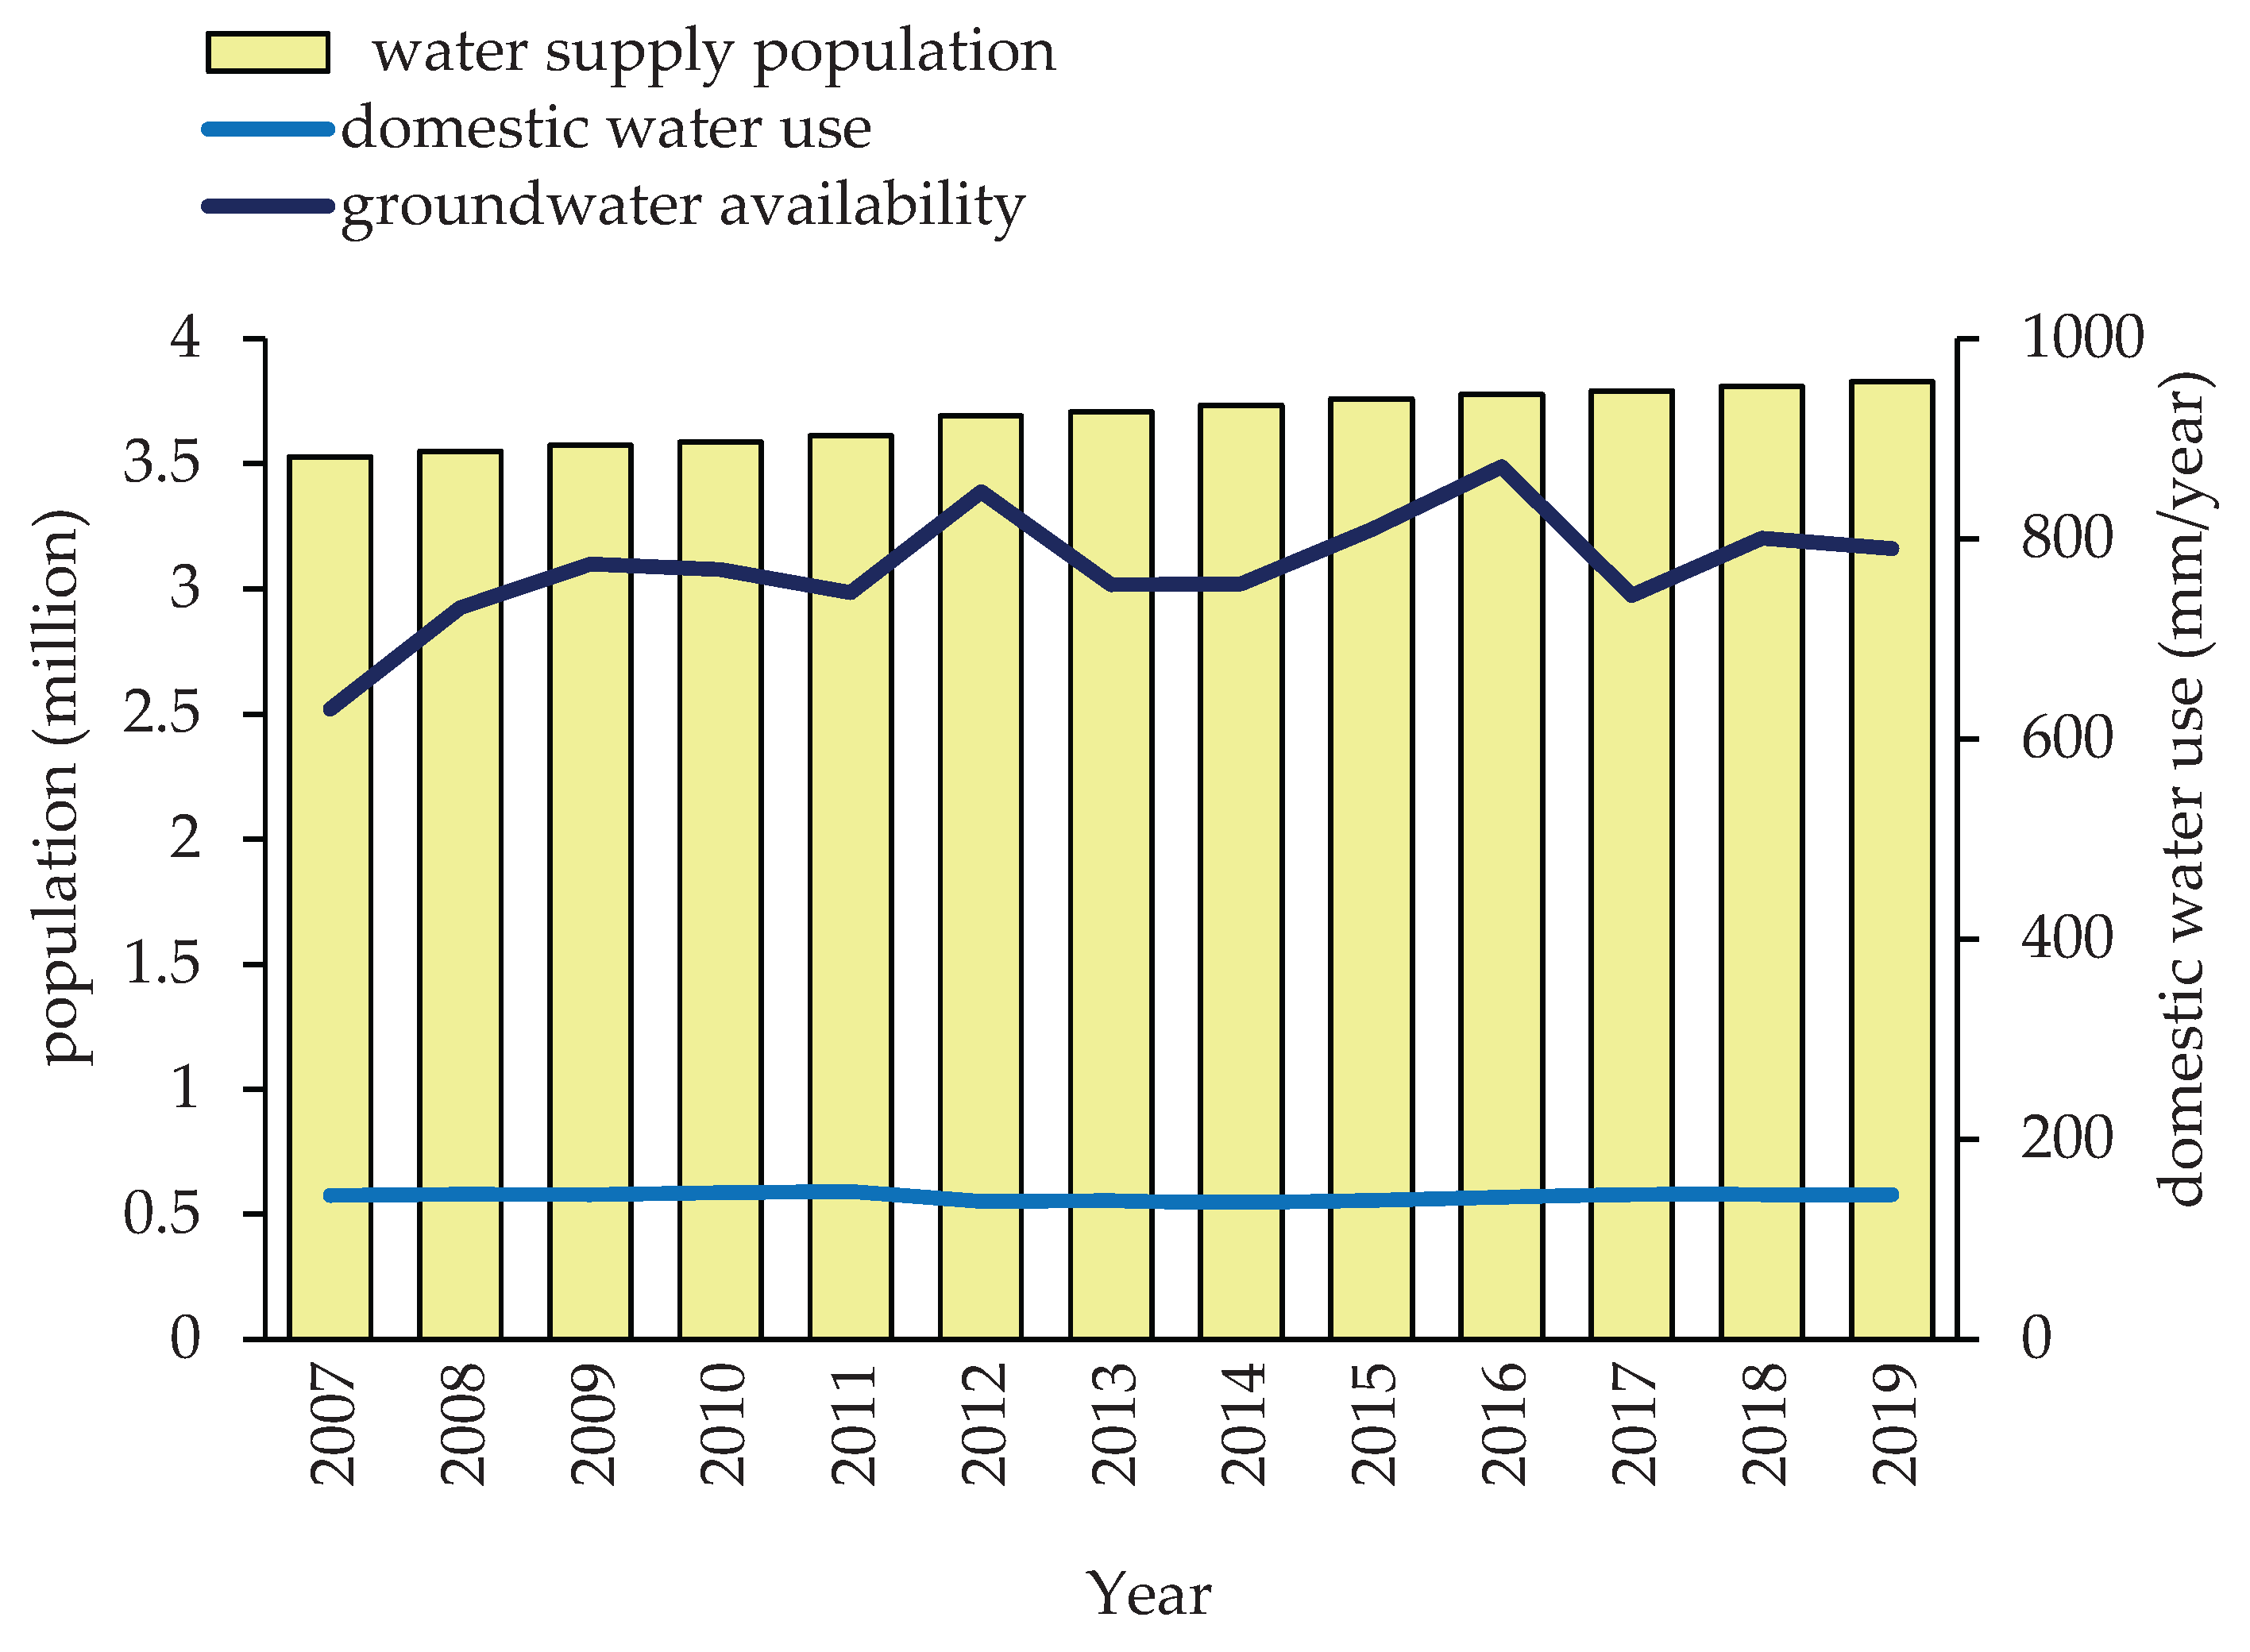

Table 1.
Spatial datasets and their sources.
| Data set | Format | Temporal/ Spatial resolution |
Data Source |
|---|---|---|---|
| Digital Elevation Model (DEM) | raster | 30 m | [19] |
| Soil type | shapefile | 1:500,000 | [20] |
| Land use (2014) | shapefile | 100 m (grid cells) | [21] |
| Weather Data | .csv | Daily (2004-2021) | [22] |
| Discharge (m³ sec-1) | .csv | Daily (2004-2021) | [23] |
Table 2.
Model performance statistics calibration and validation results.
| Model performance evaluation and uncertainty |
Modeling Period |
R2 | NSE | PBIAS |
|---|---|---|---|---|
| Calibration | 2007-2014 | 0.81 | 0.81 | -3.6 |
| Validation | 2015-2021 | 0.80 | 0.80 | -5.7 |
Note: NSE, Nash Sutcliffe efficiency; R2, Regression; PBIAS, Percent of Bias.
Table 3.
List of sensitive parameters, minimum and maximum values, and statistical value according to rank.
Table 3.
List of sensitive parameters, minimum and maximum values, and statistical value according to rank.
| Parameter | File ext. | Method | Description | Min_ Value |
Max_ Value |
P-value | t-stat | Rank |
|---|---|---|---|---|---|---|---|---|
| CN2 | . mgt | r | Initial SCS-CN moisture condition II | -0.003 | 0.088 | 0.000 | 90.56 | 1 |
| CH_N2 | . hru | v | Manning’s n value for the main channel | 0.040 | 0.078 | 0.000 | -5.79 | 2 |
| ALPHA_BF | . bsn | v | Baseflow alpha factor | 0.500 | 0.600 | 0.009 | 2.68 | 3 |
| LAT_TTIME | . hru | v | Lateral flow travel time | 159 | 162 | 0.022 | -2.33 | 4 |
| CANMX | . hru | v | Maximum canopy storage(mm) | 32 | 35 | 0.026 | -2.26 | 5 |
| CH_K2 | . hru | v | Effective hydraulic conductivity in main channel alluvium | 28 | 29 | 0.058 | -1.92 | 6 |
| GWQMN | .gw | v | Threshold depth of water in the shallow aquifer required for return flow to occur | 2230 | 2240 | 0.070 | -1.83 | 7 |
| GW_DELAY | .gw | v | Groundwater delay | 440 | 445 | 0.121 | -1.567 | 8 |
| OV_N | . hru | r | Manning’s “n” value for overland flow | -0.20 | -0.070 | 0.131 | -1.526 | 9 |
| ESCO | . hru | v | Soil evaporation compensation factor | 0.85 | 0.95 | 0.2776 | 1.096 | 10 |
| SOL_K | .sol | r | Soil Saturated hydraulic conductivity | -0.057 | 0.129 | 0.288 | -1.070 | 11 |
| HRU_SLP | . hru | r | Average slope steepness | -0.560 | -0.570 | 0.335 | -0.971 | 12 |
| GW_REVAP | .gw | v | Groundwater “revap” coefficient | 9.1 | 9.3 | 0.418 | 0.813 | 13 |
| SLSUBBSN | . hru | r | Average slope length | 0.440 | 0.451 | 0.528 | -0.634 | 14 |
| SOL_AWC | .sol | r | Available water capacity of the soil layer | -0.609 | -0.135 | 0.573 | -0.565 | 15 |
| REVAPMN | .gw | v | Threshold depth of water in the shallow aquifer for “revap” to occur | 751 | 752 | 0.736 | -0.338 | 16 |
| SOL_BD | .sol | r | Moist bulk density | -0.609 | -0.135 | 0.998 | -8.843 | 17 |
Note: r indicates that the parameter value is changed relatively, and v indicates that the default parameter is replaced.
Table 4.
Trends in Water Supply Population, Domestic Water use, and Groundwater Availability in Chikugo catchment.
Table 4.
Trends in Water Supply Population, Domestic Water use, and Groundwater Availability in Chikugo catchment.
| Year | Water Supply Population | Domestic water use (mm) | Groundwater availability (mm) | Domestic water use as a proportion of total groundwater availability (%) |
|---|---|---|---|---|
| 2007 | 3,526,639 | 143.64 | 629.90 | 22.80 |
| 2008 | 3,549,397 | 145.44 | 731.38 | 19.89 |
| 2009 | 3,572,898 | 144.41 | 774.70 | 18.64 |
| 2010 | 3,587,076 | 146.81 | 769.09 | 19.09 |
| 2011 | 3,611,393 | 147.84 | 746.14 | 19.81 |
| 2012 | 3,691,441 | 137.95 | 846.96 | 16.29 |
| 2013 | 3,706,755 | 139.00 | 754.26 | 18.43 |
| 2014 | 3,733,906 | 136.95 | 754.68 | 18.15 |
| 2015 | 3,759,987 | 139.69 | 809.15 | 17.26 |
| 2016 | 3,776,419 | 142.02 | 872.08 | 16.29 |
| 2017 | 3,791,811 | 144.99 | 743.15 | 19.51 |
| 2018 | 3,809,469 | 144.79 | 800.41 | 18.09 |
| 2019 | 3,827,654 | 144.99 | 790.16 | 18.35 |
Disclaimer/Publisher’s Note: The statements, opinions and data contained in all publications are solely those of the individual author(s) and contributor(s) and not of MDPI and/or the editor(s). MDPI and/or the editor(s) disclaim responsibility for any injury to people or property resulting from any ideas, methods, instructions or products referred to in the content. |
© 2025 by the authors. Licensee MDPI, Basel, Switzerland. This article is an open access article distributed under the terms and conditions of the Creative Commons Attribution (CC BY) license (http://creativecommons.org/licenses/by/4.0/).
Copyright: This open access article is published under a Creative Commons CC BY 4.0 license, which permit the free download, distribution, and reuse, provided that the author and preprint are cited in any reuse.


