Submitted:
03 June 2025
Posted:
03 June 2025
You are already at the latest version
Abstract
Landscape ecological security refers to the overall integrity and health of an ecosystem, as well as the condition and capacity of the ecological environment and the ecosystem services that effectively support economic development. It is essential to identify the factors influencing ecological security, generate landscape ecological security maps, and simulate various scenarios of urban expansion, which can provide valuable insights for urban and regional spatial planning. This article focuses on the coastal areas of Jiangsu Province as a case study, introduces the theory of landscape ecological security, and selects ecological factors such as geological hazards, flood and drinking water availability, biodiversity protection, and recreational safety. It also employs the Minimum Cumulative Resistance (MCR) model to simulate different scenarios of urban spatial expansion. The results indicate that the "coordinated development" scenario is an effective development strategy that can better balance ecological, social, and economic benefits. We suggest that the government optimize the regional spatial structure, scientifically plan economic and ecological spaces, strengthen control over urban expansion, and further improve land use efficiency.
Keywords:
landscape ecological security
; urban spatial expansion
; scenario simulation
; coastal areas in Jiangsu Province
1. Introduction
China is currently experiencing a period of rapid urbanization, characterized by significant economic growth and industrial restructuring. This has resulted in the expansion of construction land, which is the most evident indicator of the urbanization process [1,2]. However, the sprawling growth of urban space has led to a series of adverse effects on ecological security, including the destruction of animal and plant habitats, a reduction in biodiversity, and the degradation of watershed ecosystems [3,4,5,6]. Furthermore, since the areas surrounding urban built-up regions are predominantly farmland, forests, and other agricultural landscapes, the expansion of urban space will inevitably result in a decline in the quality of the ecological environment [7,8]. residential houses and buildings. The newly added forest land and gardens are mostly single structured artificial forests and economically managed plantations, which have limited ecological value. In 2020, the area of forest land in the coastal regions of Jiangsu was 15,390.7 hectares, accounting for only 56.2% of the total forest area. However, scrubland and sparse forest combined accounted for 40.9%. Additionally, heavy metal pollution is a significant concern, with local pollution such as cadmium, mercury, lead, and arsenic posing serious ecological security risks. In Lianyungang, the proportion of soil heavy metal pollution classified as mild is 45.18%, which is more than double the average level of 21.02% for Jiangsu Province. Consequently, the expansion of urban space in the coastal areas of Jiangsu presents a substantial threat to landscape ecological security. How to manage urban sprawl and the expansion of construction land has become a significant challenge for many developing countries and must be addressed seriously from the perspective of landscape ecological security [9].
Landscape ecological security refers to the overall integrity and health of an ecosystem, as well as the condition and capacity of the ecological environment and ecosystem services that effectively support economic development. When ecological systems are compromised, it is crucial to ensure that people's lives and health remain unharmed. There is relatively limited research on evaluating the effects of ecological security during urbanization, particularly regarding the analysis of changes in urban land area from the perspective of landscape patterns. Additionally, there is a need to explore the changes in landscape ecological security resulting from urban spatial expansion and their interrelated dynamics. Research on landscape ecological security offers new theories and methodologies for examining the ecological and environmental impacts of regional urbanization. The study investigates the relationship between urban spatial expansion and landscape ecological security, highlighting the impact of human activities on landscape ecosystems. It serves as a reference for promoting the coordination between urban development and ecological protection, as well as for fostering sustainable development and effective management [10,11]. In characterizing and quantifying the driving forces behind urban expansion, Couch et al has studied the factors contributing to urban spatial growth in urban areas, suburbs, and outer suburbs of European cities. Building on this foundation, the study analyzed issues related to urban mixed landscapes and sustainability, and compared the driving forces behind mixed landscapes. Yan, Y. [13] conducted an empirical study based on the theory of urban agglomerations, analyzing the relationship between economic performance and the degrees of urban expansion in American metropolitan areas. In recent years, some Chinese scholars have begun to investigate the mechanisms of social development, regional economy, and the natural environment on urban expansion through the process of urban spatial growth. Madahi, J.F. [14] examined the relationship between the expansion of urban built-up areas and economic growth at various levels in the Yangtze River Delta region, as well as land use strategies, based on the spatiotemporal changes in urban land use efficiency over the past 20 years.Some scholars have employed advanced methods, such as constrained ACO-CA (ant colony optimization-cellular automata) models [15], RF-CA (random forest-cellular automata) models [16], and neural network analysis [17], to investigate scenario analyses of urban spatial structures, simulate urban spatial expansion, and compare various urban expansion strategies. However, most of the existing literature focuses solely on designing urban spatial growth models based on historical data [18,19,20]. There is relatively little discussion regarding the impact of factors such as urban ecological security demands, urban growth drivers, and urban planning policies on the expansion of construction land. This results in a lack of exploration of urban expansion mechanisms and related theories. If ecological security theory is employed as a methodological framework to study urban spatial expansion in China, it could significantly contribute to guiding the healthy development of urbanization and provide essential support for the spatial development of urban land.
Overall, traditional methods such as the equivalent factor method and the InVEST (Integrated Valuation of Ecosystem Services and Trade-offs) model have informed improvements to the SolVES (Social Values for Ecosystem Services) model, enhancing its ability to accurately assess the value of ecosystem services. By summarizing the phenomena and causes of urban diseases both domestically and internationally, five key functions of urban ecosystem health have been identified: carrying capacity, support capacity, attractiveness, sustainability, and development capacity. These functions have been collectively referred to as the CSAED (Carrying Capacity, Supporting Power, Attracting Power, Continuity Power, and Developing Power) model. The corresponding bottlenecks that restrict urban functions were analyzed. Additionally, dynamic monitoring of urban expansion utilizing big data has been widely adopted, offering a new analytical perspective for the development of regional landscape ecological security patterns.
Overall, supported by 3S fusion technology, geographic process simulation, spatial optimization models, and other methodologies, the multidimensional perspective of ecological security protection and urban spatial development analysis has been expanded. The significance of studying the coordination and constraint effects between these two systems has been clarified. Due to the diversity and complexity of analytical methods and landscape ecosystem types, research has primarily focused on the impact of optimizing urban land use on ecological security patterns. However, insufficient attention has been given to the development modes of urban construction land under ecological security constraints. Particularly from the perspective of landscape ecological security pattern constraints, further research is needed on urban spatial layout and development models. At the spatial scale, individual cities are often used as case studies, resulting in a lack of research on the coordination of ecological protection and urban spatial development at the regional scale. Therefore, this study uses the coastal areas of Jiangsu as a case example, constructing a landscape ecological security pattern at the regional scale based on the protection of multiple ecological elements, and exploring a coordinated urban spatial expansion model that balances ecological protection with economic development.
2. Materials and Methods
2.1. Landscape Ecological Security Based on Single Factors
1) Geological Hazard Safety. This study evaluates geological hazard safety based on existing literature on geological hazard assessments [21] and the specific characteristics of the study area. It considers factors such as seismic intensity, active fault zones, points of collapse and landslide disasters, vegetation coverage, ground subsidence, and the degree of disaster impact. A classification method for ecological safety levels concerning geological hazards has been developed (see Table 1). The significance of each factor in geological hazard analysis has been preliminarily established based on ratings from multiple authoritative experts in the field. Additionally, the entropy weight method is employed to reconfirm the weights of the indicators. Ultimately, the Analytic Hierarchy Process (AHP) combined with the entropy weight method is comprehensively applied to determine the weights of each factor. The grid embedding method is then utilized to create the layout for each factor, followed by spatial overlapping to generate the geological hazard safety map (see Figure 1a). The results indicate that in the northern part of the study area, characterized by mountainous and hilly terrain, complex geological conditions and significant topographical variations make it susceptible to geological disasters such as landslides and collapses, resulting in lower safety levels. In contrast, the southern part of the research area, specifically Nantong City, exhibits a relatively low safety level primarily due to its location on a fault zone and unstable geological conditions. In other regions, the risk of geological disasters is comparatively minimal.
2) Water Safety. The flood inundation area is defined as a region below a specified water level, determined using precipitation data, digital elevation models, and GIS hydrological analysis tools [22]. This study relies on historical flood data and urban flood control standards, employing hydrological models to simulate the "open-source inundation" of natural flood processes [23]. Flood inundation ranges are categorized based on three risk frequencies: 10 years, 20 years, and 50 years, as illustrated in Table 2. Drinking water sources are designated as low-level safety areas, wetland areas are classified as intermediate safety areas, the 500-meter buffer zones surrounding the wetlands are identified as high safety areas, and all other regions are categorized as higher safety areas. Ultimately, this study combined the distribution maps of floods and drinking water sources with equal weights to create a comprehensive water security map (Figure 1b).
3) Biological Safety. Focal species analysis is an effective tool in conservation and landscape ecology projects [24]. In this study, the focal species analysis method was employed to assess the safety of both migratory and resident birds [25]. The protection of migratory birds is based on their habitat suitability, using Egretta garzetta as a focal species, which is a common migratory bird in the coastal areas of Jiangsu Province. Rivers, lakes, and ponds are frequent habitats for this species. By utilizing habitat suitability evaluations, we can identify suitable buffer zones and ecological corridors, ultimately generating a habitat safety map for migratory birds (Table 3). Protection of resident birds based on resistance surface: taking the gray magpie (Cyanopeca-cyanus) as the focal species. Considering that the survival radius is about 3 km, forest land area that are greater than 10 hm2 is set as the habitat for resident birds. Convert the land use map into raster data, with land cover types with different resistance coefficients as constraint factors, generate the minimum cumulative resistance surface for the horizontal movement of resident birds, distinguish buffer zones and ecological corridors, and obtained a resident bird protection map. As migratory and resident birds are equally threatened, two species are set with equal weights, and using the disjunction algorithm to obtain the cumulative resistance surface of the biological security (Figure 1c).
4) Recreational Safety. With the development of the economy and advancements in traffic and communication technologies, the recreational spaces available to metropolitan residents have expanded from urban areas to surrounding regions. Recreation in and around metropolitan areas has become a fundamental necessity and a new norm for residents' daily leisure activities [26]. Tourist and recreational source areas encompass natural and cultural landscapes that possess significant tourism and sightseeing value. These include coastal wetlands, mountains with distinct elevation features, forests with high canopy density, and other natural landscapes, as well as local cultural heritage sites and other cultural landscapes. Table 4 illustrates the accessibility of tourism and leisure activities based on water systems, wetlands, and various land cover types. Based on expert recommendations, the influencing factors and their corresponding resistance coefficients have been appropriately established to construct a resistance surface, thereby generating a recreational safety pattern (Figure 1d).
2.2. Quantitative Simulation of Urban Spatial Expansion
1) Identification of ecological Ecological source areas are extensive ecological patches that provide significant ecological services within a region, such as large areas of water, forests, and grasslands. Serving as the "source" of landscape ecological flow, these areas are fundamental to the stability of various ecosystems in the region. Smaller ecological patches connected to ecological source areas often exhibit high biodiversity and resilience to disturbances, allowing them to recover quickly after being impacted. It is essential to select source areas where various ecological processes occur, taking into account different ecological environmental issues. The ecological sources associated with distinct ecological processes possess unique characteristics, and the identification of protection sources must be grounded in a thorough analysis of regional ecological environmental challenges.
2) Minimum Cumulative Resistance (MCR), which is the total cost accumulated from various resistance factors on a spatial surface. The MCR model is widely utilized in ecological fields, including species conservation and landscape spatial analysis [27]. Different models offer distinct advantages; the minimum cumulative resistance model integrates factors such as source, distance, and landscape interface. This integration demonstrates that the magnitude of resistance is influenced not only by distance but also by the varying impacts of different interfaces, effectively capturing the spatial challenges of ecological processes. Consequently, employing the minimum cumulative resistance model to analyze the resistance surface of ecological processes presents several advantages. Some Chinese scholars have begun exploring its applications in social and economic fields, such as urban spatial growth, land use, and tourism planning. For instance, they have simulated the spatial evolution of urban expansion [28], evaluated the ecological suitability of urban land [29], and assessed ecological connectivity [30]. This study will utilize the MCR model to introduce resistance and driving factors that influence urban expansion and simulate the spatial expansion process from the source to surrounding areas. Based on the outward expansion capability of different sources [31], the resistance weight coefficient Sj can be calculated. The formula can be expressed as:
As above, MCR is the minimum cumulative resistance when source j is spatial expansion; Si is the resistance coefficient of landscape unit i to urban construction land; Dij is the Euclidean distance from the extended source j to the landscape unit i; min is the minimum cumulative resistance obtained by the expansion of landscape units for various types of sources; Ri is the resistance coefficient of unit i; n is the number of landscape units; m is the number of extended source locations; f is a monotonically increasing positive function that represents the functional relationship between ecological processes and the minimum cumulative resistance [32].
3) Scenario simulation method: Urban expansion has uncertainty when its background changes, so different scenarios that may occur in the future. Scenario setting is considered according to the factors that affect urban space expansion, which are mainly: ① economic factors, including GDP growth, fixed assets investment increase, industrial structure upgrading, etc.; ② Social factors, including the increase in the total permanent population, the increase in the income of urban residents; ③ Ecological factors, including ecological red line restrictions, protection of ecological land such as forests and grasslands, etc. Based on the above factors, the author mainly set three scenario models in the study of urban spatial expansion, including ecological security, economic growth, and coordinated development, covering the basic situation of urban spatial expansion. Therefore, based on simulation results of urban spatial expansion, extract urban spatial expansion characteristics under different scenarios, summarize relevant development strategies, which can provide evidence for identifying urban expansion hotspots and optimizing spatial structure.
2.3. AHP-Entropy Weight Evaluation Method
Due to the advantage of combining subjective and objective factors, AHP-entropy weight evaluation method is adopted for determining indicator weights. Firstly, AHP model is used to calculate the weight coefficients of each indicators, which are specifically divided into: ① Five experts in the field of land resource management, including Nanjing University, Nanjing Agricultural University and the Chinese Academy of Sciences, were invited. ② Please anonymously seek their opinions on the importance of geological safety factors and habitat suitability factors. ③ Analyze and summarize the opinions of the above experts, and provide feedback on the statistical results of the importance of the influencing factors to the experts. ④ Experts revise their opinions based on feedback results. ⑤ After multiple rounds of anonymous consultation and feedback, the final analysis conclusion is formed.
Then, entropy technology is used to correct the calculated weight coefficients of each indicator, in order to better grasp the scale, improve the credibility and information content. The specific correction formula is:
① If there are i evaluation indicators and j evaluation objects to construct judgment matrix , normalize according to the formula to obtain a standard matrix , then the entropy outputof the indicators is: ,,Among them: is the original value of the jth evaluation object on the ith evaluation unit, is its standardized value, and if , let .
② Calculate the deviation degree and information weight of the indicator : ,③ Using information weights to modify the weight coefficient obtained by AHP method, obtain the modified weight coefficient : Thus obtain a reasonable weight coefficient vector . The revised information has increased in quantity, with a significant improvement in credibility compared to before the revision, and is more in line with the actual situation. It can reasonably calculate the weights of ecological security factors for geological hazards, resistance to urban spatial expansion, and dynamic factors in the coastal areas of Jiangsu.
2.4. Research Area and Data Sources
The coastal areas of Jiangsu extend south to the north bank of the Yangtze River, north to the border between Jiangsu and Shandong, west to Xuzhou, Huaiyin, Yangzhou, and Taizhou, and east to the Yellow Sea. Including Lianyungang, Yancheng, and Nan-tong, with a coastline of 962 km and a land area of 3.25 × 10⁴ km2. It belongs to the inter-section of the three major productive axes of China's coastal areas, along the Yangtze River, and along the Longhai Lanxin Line, with unique geographical advantages, prominent strategic position, and enormous development potential. With the implementation of a new round of development strategy along the coast, the urbanization and industri-alization process in coastal areas has accelerated, and the demand for construction land development has significantly increased. It poses a threat to regional ecological security, including geological hazards, water resource ecological issues, biodiversity loss, and damage to recreational water and soil landscapes. The contradiction between economic development and ecological protection has become prominent, and ecological security has become an unavoidable reality [33]. Therefore, this article will use high-resolution multi-source remote sensing images to extract land use data, combined with GIS spatial correlation, distance analysis and other methods, and conduct empirical research by taking the coastal areas of Jiangsu province as the case area.
In this study, collect panchromatic and multispectral remote sensing images from China's Gaofen-2 satellite between 2000 and 2015, with a spatial resolution of 0.8 meters. And the specific source database is sourced from the National Earth System Science Data Center (http://www.geodata.cn/data/publisher.html). The basic geographic data is sourced from a 1:250000 Chinese electronic map (http://www.data.ac.cn/info/983a5). Data on provincial boundaries, county boundaries, government locations at cities or counties, roads and railways, rivers, etc. are sourced from the National Basic Geographic Information System’s 1:4 million database nationwide( http://nfgis.nsdi.gov.cn). The socio-economic data are sourced from the Jiangsu Statistical Yearbook [34]. It should be noted that there is large mudflat land in the coastal areas of Jiangsu, which is different from other regions. In order to make a comparative analysis of urban spatial expansion, we took the land use in 1995 as the benchmark, considered the natural growth of the coastal mudflat, made shear interpretation processing, and surveyed the site of the case area, carefully proofread the interpretation results. In addition, satellite remote sensing monitoring methods are used to identify high-resolution images at different time periods, process and analyze the sedimentation rate, and then accurately evaluate the changes in tidal flat area.
3. Landscape Ecological Security of Coastal Areas in Jiangsu Province
3.1. Comprehensive Method of Landscape Ecological Security
There is a static method on landscape ecological security, which focuses on vertical ecological processes and mainly uses overlapping factors to quantitatively generate landscape ecological safety maps based on land use or ecological importance and suitability evaluation [22,23,24,25]. Among them, Vertical ecological processes mainly refer to the ecological processes that occur within a certain geographical unit. And the state of the process directly reflects the distribution of the resources it depends on, such as geological disasters, water resource security, biodiversity, and recreational landscape security. The landscape ecology profession has developed a complete set of ecological planning methods, which are mainly reflected in suitability and feasibility analysis models, directly completed through the spatial superposition of resources themselves, also known as the "thousand layer cake" model [35].
Based on the land use, ecological security, and human settlement in the coastal areas of Jiangsu, regional ecological security issues are identified, and four important factors are selected, namely geological hazard safety, water safety, biological safety, and recreational safety. If we take the distribution map of biodiversity conservation as an example, we use ecological flow migration space to simulate the migration of key species between different ecological source areas or the diffusion of ecosystems from source areas to surrounding areas. Then, we determine ecological corridors and strategic points, integrate source areas, channels, strategic points, etc., and finally generate a layout map for biodiversity conservation [36]. Other single ecological security map of horizontal process can also be generated by using similar methods. Among them, horizontal ecological processes are used by spatial flow, diffusion, and interaction between landscape units, and four maps of single ecological security are made; Vertical ecological processes are used to integrate four types of single ecological security. Finally, a comprehensive security pattern is constructed using spatial overlapping method with equal weights.
3.2. Landscape Map of Comprehensive Ecological Security
Based on the theory of landscape ecology security, the "comprehensive low" grid analysis method is used to calculate the grid pixel values of each single ecological security pattern, extract the minimum grid unit, and construct landscape ecological security patterns of different levels in the coastal areas of Jiangsu (Figure 2). On the whole, the northern forest land, the central water system, lakes and inland mudflat are the ecological source areas, and the river and lake water networks, irrigation canals, transportation road networks and other linear elements constitute the ecological security channels. The formed natural landscape and ecological security hinterland play a supporting role in urban expansion and serve as the foundation for urban spatial expansion. The formation of four levels of ecological security patterns, namely the low-level ecological security pattern area of 4409.7 km2, accounting for 12.6% of the total area, is the foundation for ensuring ecological security and requires strict protection. The medium level pattern and the high security pattern total 22052.6 km2, accounting for 62.9% of the total. They are the main body of the regional security pattern and the peripheral buffer zone of the low security zone. The high ecological security zone covers an area of 8633.6 km2, accounting for 24.6% of the total area, and is a key area for future urban spatial expansion.
4. Scenario Simulation of Urban Spatial Expansion Based on MCR Model
4.1. Source of Urban Spatial Expansion
The expansion of urban space is significantly influenced by the sources of urban growth at the regional scale [40]. In this article, it is defined by factors such as administrative grade, future planning, land use intensity, population density, and the economic level of the city where the expansion source is situated (Table 5). The central urban areas of Nantong, Yancheng, and Lianyungang are classified as first-level sources (Ⅰ). As prefecture-level cities and growth poles in the coastal regions of Jiangsu Province, they exhibit higher land use intensity, population density, and economic size compared to other areas, resulting in the strongest demand for expansion. Urban areas such as Haimen, Qidong, and Dongtai, along with other county-level cities are classified as second-level sources (Ⅱ), as they are important hubs within the region, facilitating the interaction between “port-industry-city”, coordinating connections between the mainland and coastal areas. Additionally, urban areas such as Rudong, Xiangshui, Funing, and other counties are classified as third-level sources (Ⅲ), as they are potential hubs in the future, attracting industries that are relocating from developed areas and larger cities. The varying levels of expansion sources dictate different demands for urban spatial expansion.
4.2. Resistance of Urban Spatial Expansion
This study used the AHP method to calculate the weights of the influencing factors of urban spatial expansion in coastal areas of Jiangsu Province (Table 6). The test coefficient was CR=0.054 7<0.1, and the fuzzy judgment matrix passed the consistency test. According to the steps of the MCR model, set the resistance surface for urban spatial expansion: ①use the ecological security as the constraint resistance. If there are constraints such as ecological security and topography, the resistance value will increase. ②use transportation infrastructure such as main roads, central business district, ports, and airports as driving factors, analyze the driving forces for urban spatial expansion, and take them as a basis to construct a planar cost distance grid layer. ③Resample by a grid size of 2 km x 2 km, identify urban spatial expansion sources, simulate development areas from 2000 year to 2015 year, and get the policy factor resistance surface characterized by development areas. ④Embed a grid layer with a single factor, get the minimum cumulative resistance surface for urban spatial expansion with distinct differential features (Figure 3).
At the regional scale, urban spatial expansion is influenced by multiple factors, with policy guidance and regulatory regulation becoming increasingly prominent in current factor analysis. Therefore, drawing on the national spatial planning of the coastal areas in Jiangsu, identify the hotspots of urban development, and introduce the policy guidance role (development agglomeration areas) into the factor analysis. Using AHP analysis method to determine the weights of the influencing factors of urban spatial expansion (Table 6), the test coefficient is CR=0.0547<0.1, and the fuzzy judgment matrix passes the consistency test. Meanwhile, determine the magnitude of the effect of resistance factors on source expansion. It can be applied to the assignment of resistance coefficients and the construction of resistance surfaces for urban spatial expansion. ① Taking the ecological security pattern as the resistance surface, there are significant differences in the spatial resistance changes of the base surface. When subjected to key factors such as ecological security and topography, the resistance value will undergo a sudden change and jump increase. ② Due to the developed economy in the coastal areas of Jiangsu, the spatial layout of urban construction land is greatly affected by economic development. Considering the special geographical environment of the coastal zone, driving factors such as transportation arteries, urban commercial centers, major ports and airports are selected. Analyze the degree of impact on urban spatial expansion and use it as a basis to construct a planar cost distance grid layer. ③ Using spatial hotspot analysis, 2km × 2km grid is selected for resampling to identify the source of urban spatial expansion. Key development areas are simulated from 2000 to 2015, and the policy factor resistance surface characterize by development agglomeration areas is obtained. ④ According to the classification standards and weights of the resistance coefficients of expansion factors, calculate the minimum value of the grid unit. By embedding the grid layer of a single factor, obtain the minimum cumulative resistance surface of urban spatial expansion (Figure 3).
4.3. Scenario of Urban Spatial Expansion
1) The Scenario of Ecological Security. In this scenario, the inflection point value in the line graph, which represents the relationship between the number of grid units and the number of resistance pixels in the urban built-up area, is identified. Resistance is determined by the change points in the grid pixel values at 1.26, 4.26, 11.23, and 18.93, and the spatial expansion range of each level of urban areas is delineated (Figure 4a). By employing spatial subtraction, non-constructible lake and river surfaces, steep rock areas, and forested regions with slopes greater than 15% are removed from the total area of the region. Subsequently, the areas of built-up zones and permanent basic farmland are also subtracted. The actual land area available for urban spatial development under a high safety level is 452.87 km². Based on an estimated per capita urban construction land requirement of 110 m² per person, this area can accommodate the transfer of 4.117 million non-agricultural residents in the future, resulting in a potential increase in the urbanization level by 20.16%. The expansion area of construction land available under a medium safety level is 287.23 km², while the scale of construction land available for urban spatial expansion at a low safety level is only 86.78 km², which prohibits large-scale development. Overall, the northern part of the Jiangsu coastal area is predominantly hilly, whereas the eastern part is primarily characterized by mudflats. Areas with significant ecological function protection value, such as coastal wetlands for rare bird conservation and the Elk National Nature Reserve, are located here, resulting in high spatial resistance. The development of construction land must avoid these critical areas. The planning and allocation of new urban construction land tend to favor the southern cities of Nantong, Qidong, Rugao, and Dongtai. These cities should pursue differentiated development paths. Lianyungang, as the eastern bridgehead of the Eurasian Continental Bridge, possesses a geographical advantage for developing an outward-oriented economy and precise positioning, focusing on industrial upgrading and structural adjustment. Meanwhile, Yancheng and Nantong leverage their abundant water and soil resources to develop the marine chemical industry, enhancing their capacity to absorb industries relocating from Shanghai and southern Jiangsu, thereby promoting leapfrog economic development.
2) The Scenario of Economic Growth. In this scenario, cumulative resistance, derived from the combination of four driving factors, serves as the benchmark for urban spatial expansion, while the minimum ecological security level is identified as the breakthrough point. Rapid economic development, accelerated urbanization, industrialization, and the influence of major projects will significantly increase the demand for construction land. Therefore, analyzing the impact of economic factors on urban expansion is of utmost importance. Based on the growth rate of construction land from the year 2000 to 2015, it is predicted that construction land will reach 1,536.42 km² by 2025 and 1,609.52 km² by 2035 (Figure 4b). According to the simulation results, newly added urban spaces are primarily concentrated around the built-up areas of cities such as Lianyungang, Yancheng, and Nantong. Additionally, urban space expansion in districts and counties such as Ganyu, Dafeng, and Haimen is rapidly forming a circular structural layout, characterized distinctly by the "core-periphery" theory. It can be anticipated that, due to the concentration of activities such as capital, technology, and population, there will be increased economic agglomeration effects. Furthermore, the cost of land use is relatively low, allowing for the realization of significant economic benefits from spatial expansion. In contrast, counties such as Binhai, Sheyang, and Xiangshui experience slow economic development, low levels of industrialization, and limited aggregation of the migrant population, resulting in low demand for construction land and consequently slow urban spatial expansion.
3) The Scenario of Coordinated Development of Ecology and Economy. This scenario advocates for a shift away from the previous focus on economic growth, urging a thorough examination of ecological security and policy orientation. It aims to establish a spatial expansion that harmonizes "ecological security "economic development" (Figure 4c). The high ecological security zone and low development suitability zone encompass critical ecological areas, nature reserves, ecological corridors, and drinking water sources, which serve to restrict unregulated urban construction. Covering an area of 3,135.43 km², this type of zone is primarily located along the eastern coast, in regions with concentrated wetlands and mudflats. The reclamation of mudflats should be strictly controlled. Economic development should prioritize "land and sea integration, adjust the current development strategy that favors large-scale heavy chemical industries, and designate these areas as restricted or prohibited zones in future land-use planning. The actual area that can be used for development in the suitable area is 236.42 km2, which can meet the land demand of 2.15 million new urban population. However, the distribution of rivers and lakes in such areas is dense, and the possibility of converting them into construction land in the short term is small, and the available land area for development is limited. High suitability areas are mainly distributed around the central urban area, with abundant human resources, good industrial foundation, and complete infrastructure. The development and construction costs are low, and the negative impact on ecological security is minimal. They can be planned as key areas for future urban spatial development. Subtracting the built-up areas, basic farmland, and lake and river surfaces within the region, the construction land area that meets urban development needs is 485.75 km2, accounting for 1.38% of the total area. In the future, it can ensure the land requirements for 4.42 million urban residents. In terms of space, it is mainly distributed on both sides of transportation axes such as G204 Yanhu Line and Ningqi Railway (Nantong section), while the planar layout is concentrated in the outskirts of central cities such as Nantong, Yancheng, Lianyungang, and some key developed counties and cities, showing a clear trend of expansion.
5. Conclusion and Discussion
This article focuses on the coastal areas of Jiangsu Province as the study area, introduces the theory of landscape ecological security and employs the MCR model to simulate urban spatial expansion under various scenarios, including "ecological security "economic growth and "coordinated development The conclusions are as follows:
1) By simulating various landscape processes, such as flood routing and species dispersal, four distinct ecological security patterns were developed. These patterns include geological hazard management, flood regulation and storage, drinking water source protection, biodiversity conservation, and recreational resource safety. Based on the "minimum maximum constraint" criterion, a comprehensive ecological security framework was constructed at different levels through mosaic operations. The low-level pattern encompasses an area of 4,409.7 km², which accounts for 12.6% of the total area and serves as a foundation for ensuring regional ecological security, necessitating strict protection. In contrast, the high ecological security level zone covers an area of 8,633.6 km², representing 24.6% of the total area, and is identified as a critical area for future urban spatial expansion.
2) The expansion of urban space is influenced by multiple factors. It is essential to move beyond the previous one-sided emphasis on social and economic development and to re-examine the factors of ecological security and policy orientation. This article employs the MCR model to determine the weights and resistance coefficients of various levels of and compares three urban spatial expansion models: "ecological security protection type "economic growth leading type and "ecological and economic coordination type”. the research findings indicate that the "ecological protection and economic development" coordination type model can more effectively balance ecological, social, and economic benefits. It also facilitates the urban construction and industrial development space while systematically expanding the capacity of central cities to accommodate their populations. This approach is of great significance for optimizing urban spatial layouts and enhancing the comprehensive benefits of land development.
The study examines the ecological security patterns and modes of urban spatial expansion. It holds significant relevance for balancing ecological security protection with urban land development in the coastal areas of Jiangsu. By integrating ecological security factors into the simulation of urban spatial expansion, this approach provides a more accurate representation of land use changes compared to traditional methods that primarily focus on macro-level land demand and micro-level land supply [37]. Jiang et al. employed the minimum cumulative resistance model to identify the functional zoning and ecological components of land use, exploring the ecological optimization of land resource spatial patterns in southwestern Yunnan [38]. This approach effectively reflects the current demands for green development. The research area has progressively expanded from a single city [39] and a singular quantitative dimension [40] to encompass the regional scale of the coastal areas of Jiangsu, incorporating multidimensional perspectives such as ecology, space, and time. Furthermore, the minimum cumulative resistance model utilized in this study, in contrast to the constraint-based system dynamics model [41] and the CLUE-S model [42], employs a spatial superposition method to integrate multiple elements into the simulation scenario. This significantly enhances the accuracy of urban spatial expansion and layout.
However, this study has certain limitations and suggests directions for future research. Firstly, due to the limited availability of materials, only four aspects are considered: geological hazard safety, water safety, biological safety, and recreational safety. There is a lack of comprehensive consideration for farmland protection, green space preservation, and other relevant factors, which affects the scientific validity of the research results. In the future, it is essential to conduct an in-depth analysis of the rational selection of ecological factors and the scientific construction of the pattern system, as well as to explore the effectiveness of ecological barriers in the rigid constraints of urban land expansion. Secondly, in the use of the minimum cumulative resistance model, there is still a significant subjectivity in the selection of urban expansion sources and the determination of weights. In future research, we should innovate the MCR model algorithm, introduce policy factors into the resistance factor evaluation system, and comprehensively utilize historical data and statistical methods to determine weights. Finally, the simulation of urban spatial expansion is a static study that does not take into account the regional ecological security impacts is developed and utilized. This research result has certain limitations. Therefore, the ecological economic comparative advantages of current construction land development and utilization should be taken as the basis. And the regional ecological security impact brought about by the development and utilization of construction land should be considered. Reasonable layout and optimization control of urban spatial expansion should be carried out [43].
Funding
This work was supported by the National Natural Science Foundation of China (No.4247010799), the Humanities and Social Sciences Foundation of the Ministry of Education in China (No.17YJC630115), the Fundamental Research Funds for the Central Universities in China (No. B230207026) and Project of Philosophy and Social Science Research in Colleges and Universities of Jiangsu Province, China (No. 2019SJA0246).
Conflicts of Interest
The authors declare no conflicts of interest.
References
- Jia, K.; Huang, X.; Qiao, W.; Zhong, S. Unpacking divergent rural-urban land use dynamics in county urbanization: A com-parative socio-spatial analytics approach. Cities 2024, 154, 105343. [Google Scholar] [CrossRef]
- Zhang, C.; Chen, D.; Yang, Q.; Sun, X.; Zheng, W. Rural land consolidation as an instrument for decreasing farmers' de-pendence on ecosystem services: Heterogeneity analysis based on consolidation modes and topographic types. Ecol. Infor. 2024, 82, 102715. [Google Scholar] [CrossRef]
- Liu, Z.; Liu, S.; Qi, W.; Jin, H. Urban sprawl among Chinese cities of different population sizes. Habitat Int. 2018, 79, 89–98. [Google Scholar] [CrossRef]
- Peng, J.; Liu, Y.; Li, T.; Wu, J. Regional ecosystem health response to rural land use change: A case study in Lijiang City, China. Ecol. Indic. 2017, 72, 399–410. [Google Scholar] [CrossRef]
- Pérez-Ramírez, I.; Requena-Mullor, J. M.; Castro, A. J.; García-Llorente, M. Land transformation changes people´s values of ecosystem services in Las Vegas agrarian landscapes of Madrid Spain. Land Use Policy 2023, 134, 106921. [Google Scholar] [CrossRef]
- Li, F.; Wu, S.; Liu, H.; Yan, D. Biodiversity loss through cropland displacement for urban expansion in China. Sci. Total Environ. 2024, 907, 167988. [Google Scholar] [CrossRef]
- Warren, P. S.; Ryan, R. L.; Lerman, S. B.; Tooke, K. A. Social and institutional factors associated with land use and forest con-servation along two urban gradients in Massachusetts. Landscape Urban Plan. 2011, 102, 82–92. [Google Scholar] [CrossRef]
- Liu, Y.; Song, W.; Deng, X. Understanding the spatiotemporal variation of urban land expansion in oasis cities by integrating remote sensing and multi-dimensional DPSIR-based indicators. Ecol. Indic. 2019, 96, 23–37. [Google Scholar] [CrossRef]
- Qiao, E.; Reheman, R.; Zhou, Z.; Tao, S. Evaluation of landscape ecological security pattern via the “pat-tern-function-stability” framework in the Guanzhong Plain Urban Agglomeration of China. Ecol. Indic. 2024, 166, 12325. [Google Scholar] [CrossRef]
- Tang, L.; Liang, G.; Gu, G.; Xu, J.; Duan, L.; Zhang, X.; Yang, X.; Lu, R. Study on the spatial-temporal evolution characteristics, patterns, and driving mechanisms of ecological environment of the ecological security barriers on China's land borders. Environ. Impact Asses. 2023, 103, 107267. [Google Scholar] [CrossRef]
- Pan, N.; Du, Q.; Guan, Q.; Tan, Z.; Sun, Y.; Wang, Q. Ecological security assessment and pattern construction in arid and semi-arid areas: A case study of the Hexi Region, NW China. Ecol. Indic. 2022, 138, 108797. [Google Scholar] [CrossRef]
- Pinna, S. Cartographic erasure of landscape as a social concept: Changes in ancient rural practices and land-use policy behind the study of toponyms. A case study from Sardinia. CATENA 2023, 229, 107229. [Google Scholar] [CrossRef]
- Yan, Y.; Liu, X.; Wang, F.; Li, X.; Ou, J.; Wen, Y.; Liang, X. Assessing the impacts of urban sprawl on net primary productivity using fusion of Landsat and MODIS data. Sci. Total Environ. 2018, 613, 1417–1429. [Google Scholar] [CrossRef]
- Madahi, A.; Palau, E.; Ortega, C. M. What's favoring the expansion of new built-up areas? The correlation between transportation infrastructure and land development in Spain from 2006 to 2018. Transportation Research Procedia 2023, 71, 211–218. [Google Scholar] [CrossRef]
- Liu, M.; An, G.; Li, C. Urban land use simulation based on ACO-CA model embedded dynamic neighborhood theory: A case study of Shapingba District in Chongqing. Geography and Geo-Information Science 2016, 32, 74–80. [Google Scholar]
- Kamusoko, C.; Gamba, J. Simulating urban growth using a random forest-cellular automata (RF-CA) model. Int. J. Geo-Inf. 2015, 4, 447–470. [Google Scholar] [CrossRef]
- Chotchaiwong, P.; Wijitkosum, S. Predicting urban expansion and urban land use changes in Nakhon Ratchasima City using a CA-Markov model under two different scenarios. Land 2019, 8, 1–16. [Google Scholar] [CrossRef]
- Ye, L.; Zhao, S.; Yang, H.; Chuai, X.; Zhai, L. Urban land use simulation and carbon-related driving factors analysis based on RF-CA in Shanghai, China. Ecol. Indic. 2024, 166, 112555. [Google Scholar] [CrossRef]
- Wei, G.; He, B.; Liu, Y.; Li, R. How does rapid urban construction land expansion affect the spatial inequalities of ecosystem health in China? Evidence from the country, economic regions and urban agglomerations. Environ. Impact Asses. 2024, 106, 107533. [Google Scholar] [CrossRef]
- Wu, H.; Yang, Y.; Li, W. Spatial optimization of land use and carbon storage prediction in urban agglomerations under climate change: Different scenarios and multiscale perspectives of CMIP6. Sustain. Cities Soc. 2024, 116, 105920. [Google Scholar] [CrossRef]
- Eslami, M.; Shadfar, S.; Mohammadi-Torkashvand, A.; Pazira, E. Assessment of density area and LNRF models in land-slide hazard zonation (Case study: Alamout watershed, Qazvin Province, Iran). Acta Ecol. Sinica 2019, 39, 173–180. [Google Scholar] [CrossRef]
- Rindsfüser, N.; Zischg, A. P.; Keiler, M. Monitoring flood risk evolution: A systematic review. iScience 2024, 27, 110653. [Google Scholar] [CrossRef] [PubMed]
- Chang, C.; Rahmad, R.; Wu, S.; Hsu, C.; Chung, P. Enhancing flood verification using Signal Detection Theory (SDT) and IoT Sensors: A spatial scale evaluation. J. Hydrol. 2024, 636, 131308. [Google Scholar] [CrossRef]
- Hagen, C. A.; Taylor, K. A.; Bartuszevige, A. M.; Daniels, A. B.; De Leon, M. T; Bogaerts, M. Slowing the tide of mesquite invasion: Using a bioindicator species to deliver conservation triage. J. Arid Environ. 2019, 168, 46–55. [Google Scholar] [CrossRef]
- Hou, Y.; Liu, Y.; Wu, Z.; Zeng, H. Construction of regional multi-scenario spatially balanced ecological security pattern based on self-organizing feature map: A case study of Guangzhou, China. Ecol. Infor. 2024, 82, 102690. [Google Scholar] [CrossRef]
- Wang, B.; Chen, X.; Shi, C. Analysis of recreational spatial features of Wuhan city based on multi-source data. Chinese Land-scape Architecture 2021, 37, 49–54. [Google Scholar]
- Liu, P.; Hu, Y.; Jia, W. Land use optimization research based on FLUS model and ecosystem services–setting Jinan City as an example. Urban Clim. 2021, 40, 100984. [Google Scholar] [CrossRef]
- Pu, J.; Liu, X. Optimization of urban expansion spatial layout and its ecological effects based on minimum cumulative re-sistance Model: A case study of Wuhan City. Modern Business 2017, 6, 152–155. [Google Scholar]
- Liu, X.; Shu, J.; Zhang, L. Research on applying minimal cumulative resistance model in urban land ecological suitability assessment: as an example of Xiamen City. Acta Ecol. Sinica 2010, 30, 421–428. [Google Scholar]
- Yu, Q.; Yue, D.; Wang, J.; Zhang, Q.; Li, Y.; Yu, Y.; Chen, J.; Li, N. The optimization of urban ecological infrastructure network based on the changes of county landscape patterns: a typical case study of ecological fragile zone located at Deng Kou (Inner Mongolia). J. Clean. Prod. 2017, 163, S54–S67. [Google Scholar] [CrossRef]
- Yao, Y.; Ma, L.; Che, X.; Dou, H. Simulation study of urban expansion under ecological constraint—Taking Yuzhong County, China as an example. Urban For. Urban Gree. 2021, 57, 126933. [Google Scholar] [CrossRef]
- Yin, H.; Kong, F.; Yang, X.; James, P.; Dronova, I. Exploring zoning scenario impacts upon urban growth simulations using a dynamic spatial model. Cities 2018, 81, 214–229. [Google Scholar] [CrossRef]
- Chen, Y.; Li, G.; Cui, L.; Li, L.; He, L.; Ma, P. The effects of tidal flat reclamation on the stability of the coastal area in the Jiangsu Province, China, from the perspective of landscape structure. Land 2022, 11, 1–20. [Google Scholar] [CrossRef]
- National Bureau of Statistics. Jiangsu statistical yearbook. Beijing, China Statistical Publishing House 2016.
- McHarg, I. L. Human ecological planning at Pennsylvania. Landscape Planning 1981, 8, 109–120. [Google Scholar] [CrossRef]
- Li, Z.; Li, M.; Xia, B. Spatio-temporal dynamics of ecological security pattern of the Pearl River Delta urban agglomeration based on LUCC simulation. Ecol. Indic. 2020, 114, 106319. [Google Scholar] [CrossRef]
- Zhang, P.; Liu, L.; Yang, L.; Zhao, J.; Li, Y.; Qi, Y.; Ma, X.; Cao, L. Exploring the response of ecosystem service value to land use changes under multiple scenarios coupling a mixed-cell cellular automata model and system dynamics model in Xi'an, China. Ecol. Indic. 2023, 147, 110009. [Google Scholar] [CrossRef]
- Jiang, Z.; Wu, H.; Lin, A.; Shariff, A. R. .; Hu, Q.; Song, D.; Zhu, W. Optimizing the spatial pattern of land use in a prominent grain-producing area: A sustainable development perspective. Sci. Total Environ. 2022, 843, 156971. [Google Scholar] [CrossRef]
- Song, M.; An, M.; He, W.; Wu, Y. Research on land use optimization based on PSO-GA model with the goals of increasing economic benefits and ecosystem services value. Sustain. Cities Soc. 2025, 119, 106072. [Google Scholar] [CrossRef]
- Gao, P. P.; Li, Y. P.; Gong, J. W.; Huang, G. H. Urban land-use planning under multi-uncertainty and multiobjective considering ecosystem service value and economic benefit - A case study of Guangzhou, China. Ecol. Complex. 2021, 45, 100886. [Google Scholar] [CrossRef]
- Jiang, X.; Li, B.; Zhao, H.; Zhang, Q.; Song, X.; Zhang, H. Examining the spatial simulation and land-use reorganisation mechanism of agricultural suburban settlements using a cellular-automata and agent-based model: Six settlements in China. Land Use Policy 2022, 120, 106304. [Google Scholar] [CrossRef]
- Kiziridis, D. A.; Mastrogianni, A.; Pleniou, M.; Tsiftsis, S.; Xystrakis, F.; Tsiripidis, I. Improving the predictive performance of CLUE-S by extending demand to land transitions: The trans-CLUE-S model. Ecol. Model. 2023, 478, 110307. [Google Scholar] [CrossRef]
- Yin, H.; Kong, F.; Yang, X.; James, P.; Dronova, I. Exploring zoning scenario impacts upon urban growth simulations using a dynamic spatial model. Cities 2018, 81, 214–229. [Google Scholar] [CrossRef]
Figure 1.
Four single ecological security maps in the coastal area of Jiangsu Province.

Figure 2.
Comprehensive ecological security map in the coastal area of Jiangsu.
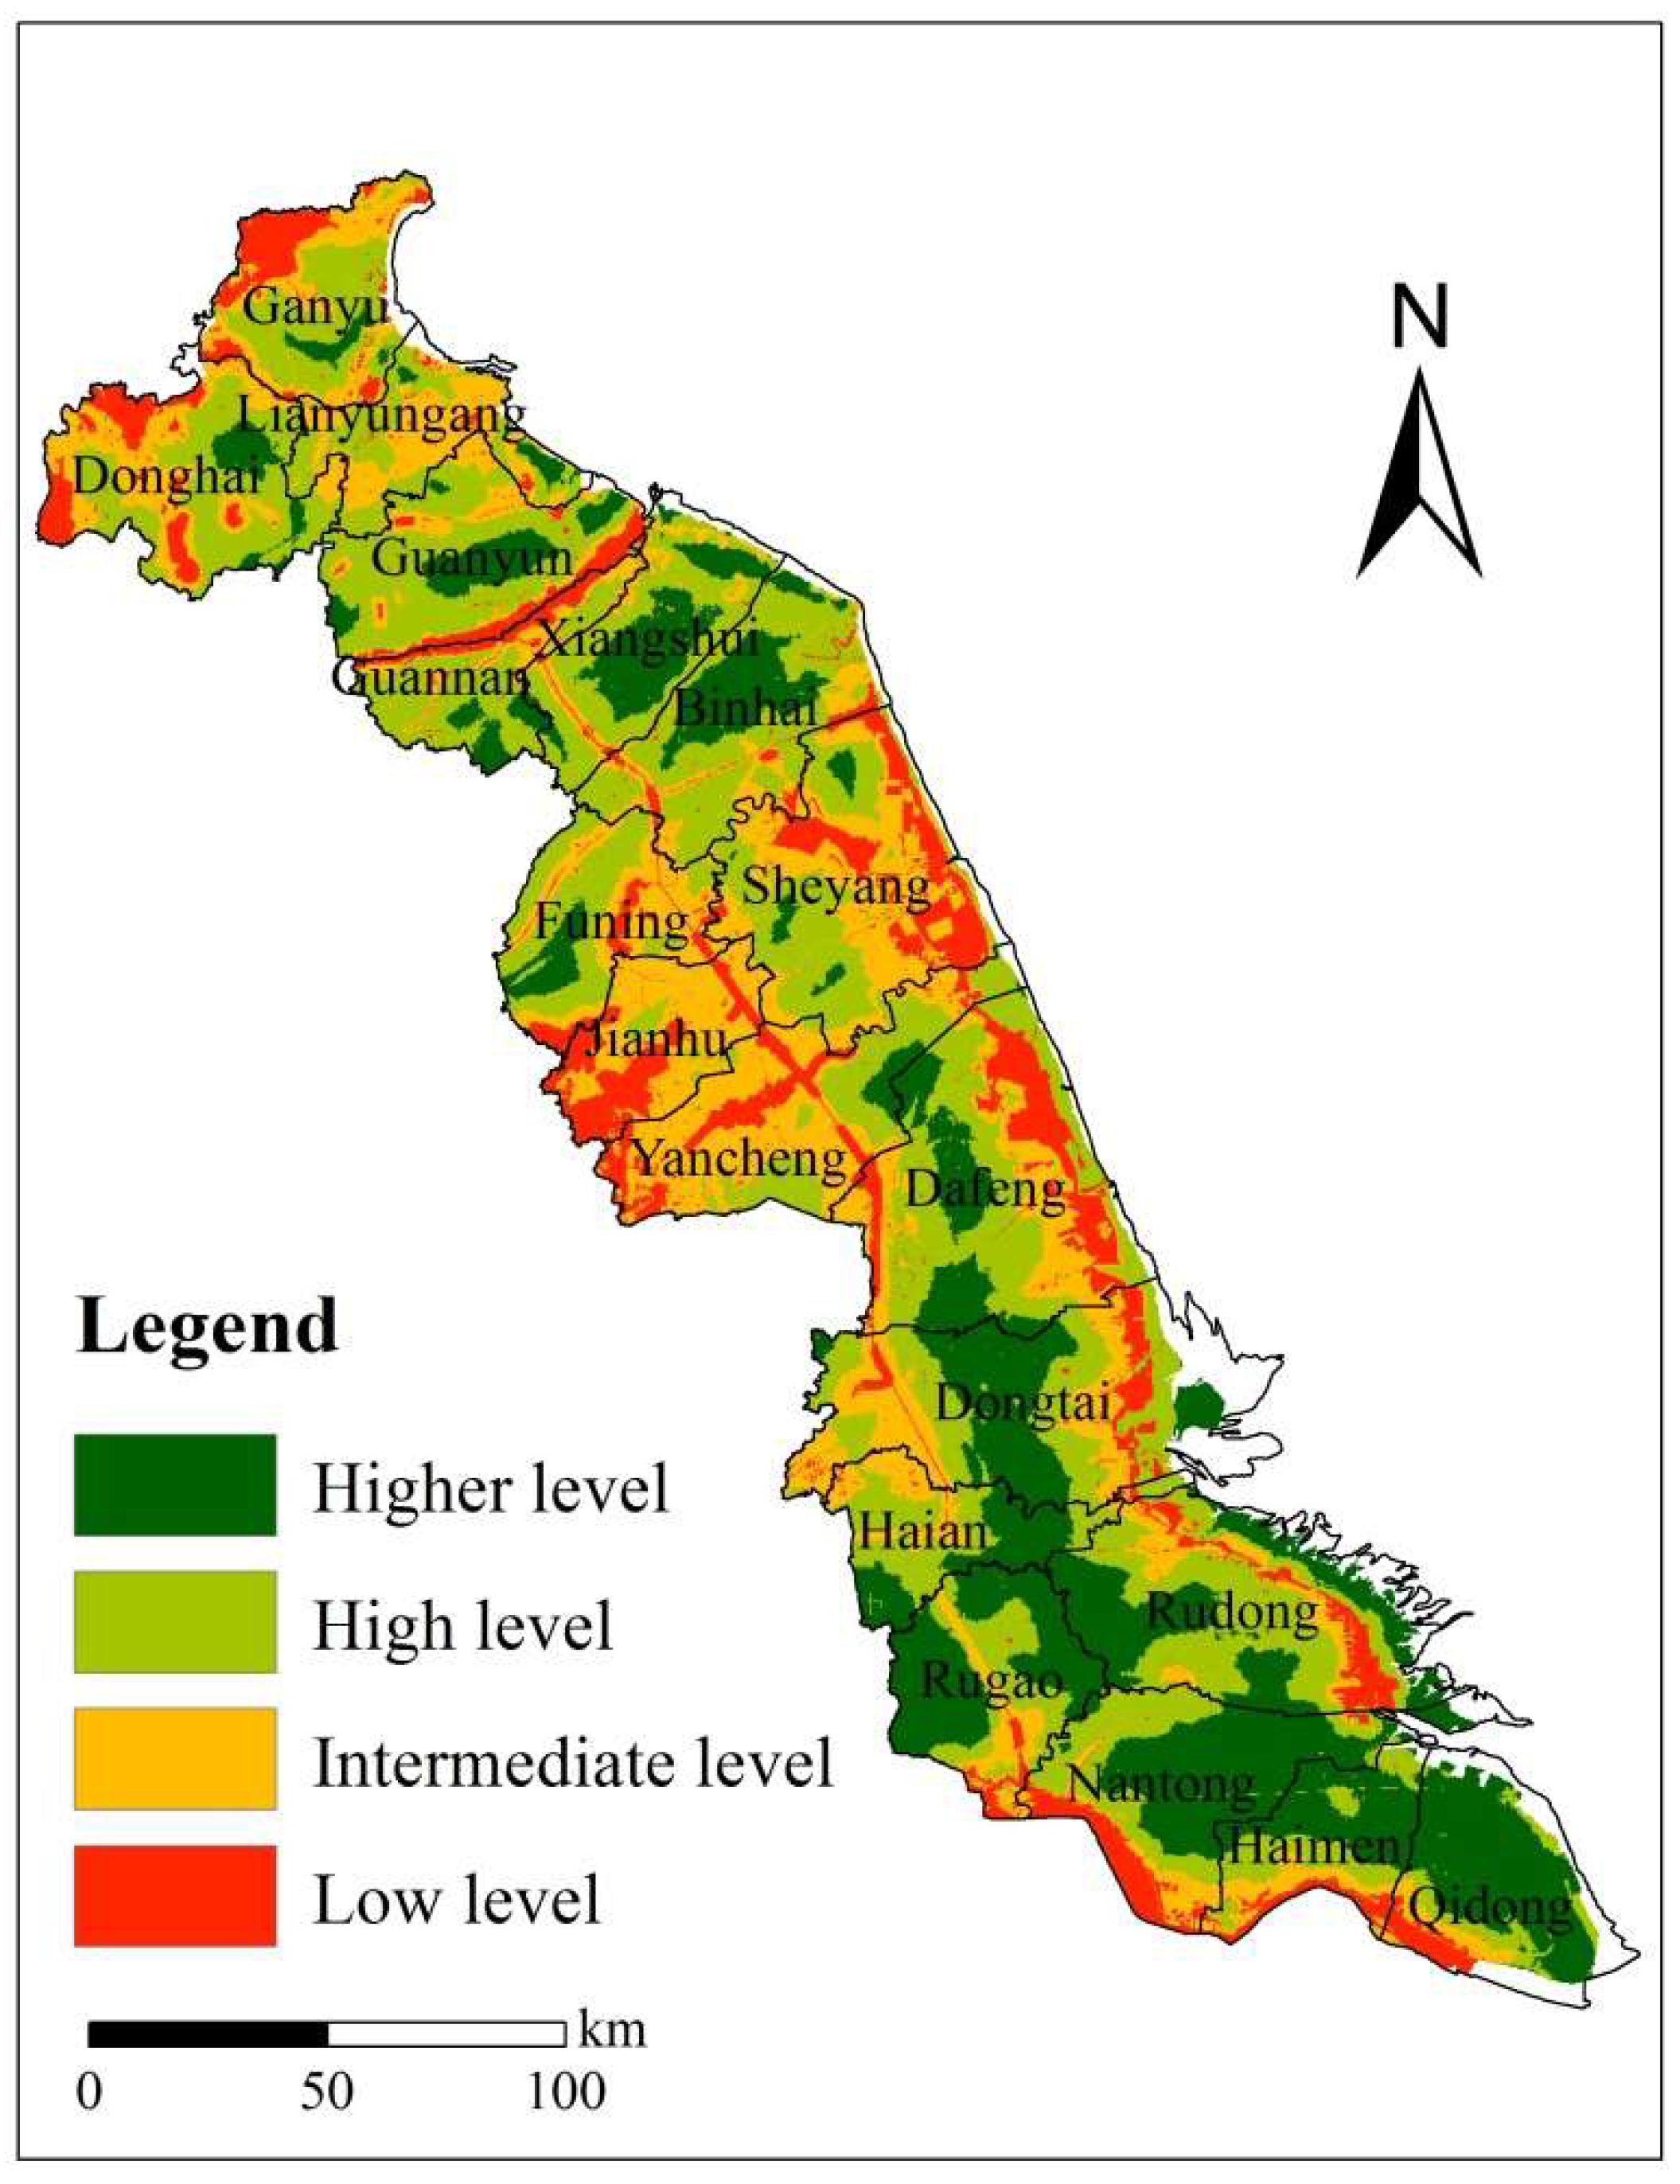
Figure 3.
Comprehensive minimal cumulative resistance surface of urban spatial expansion.
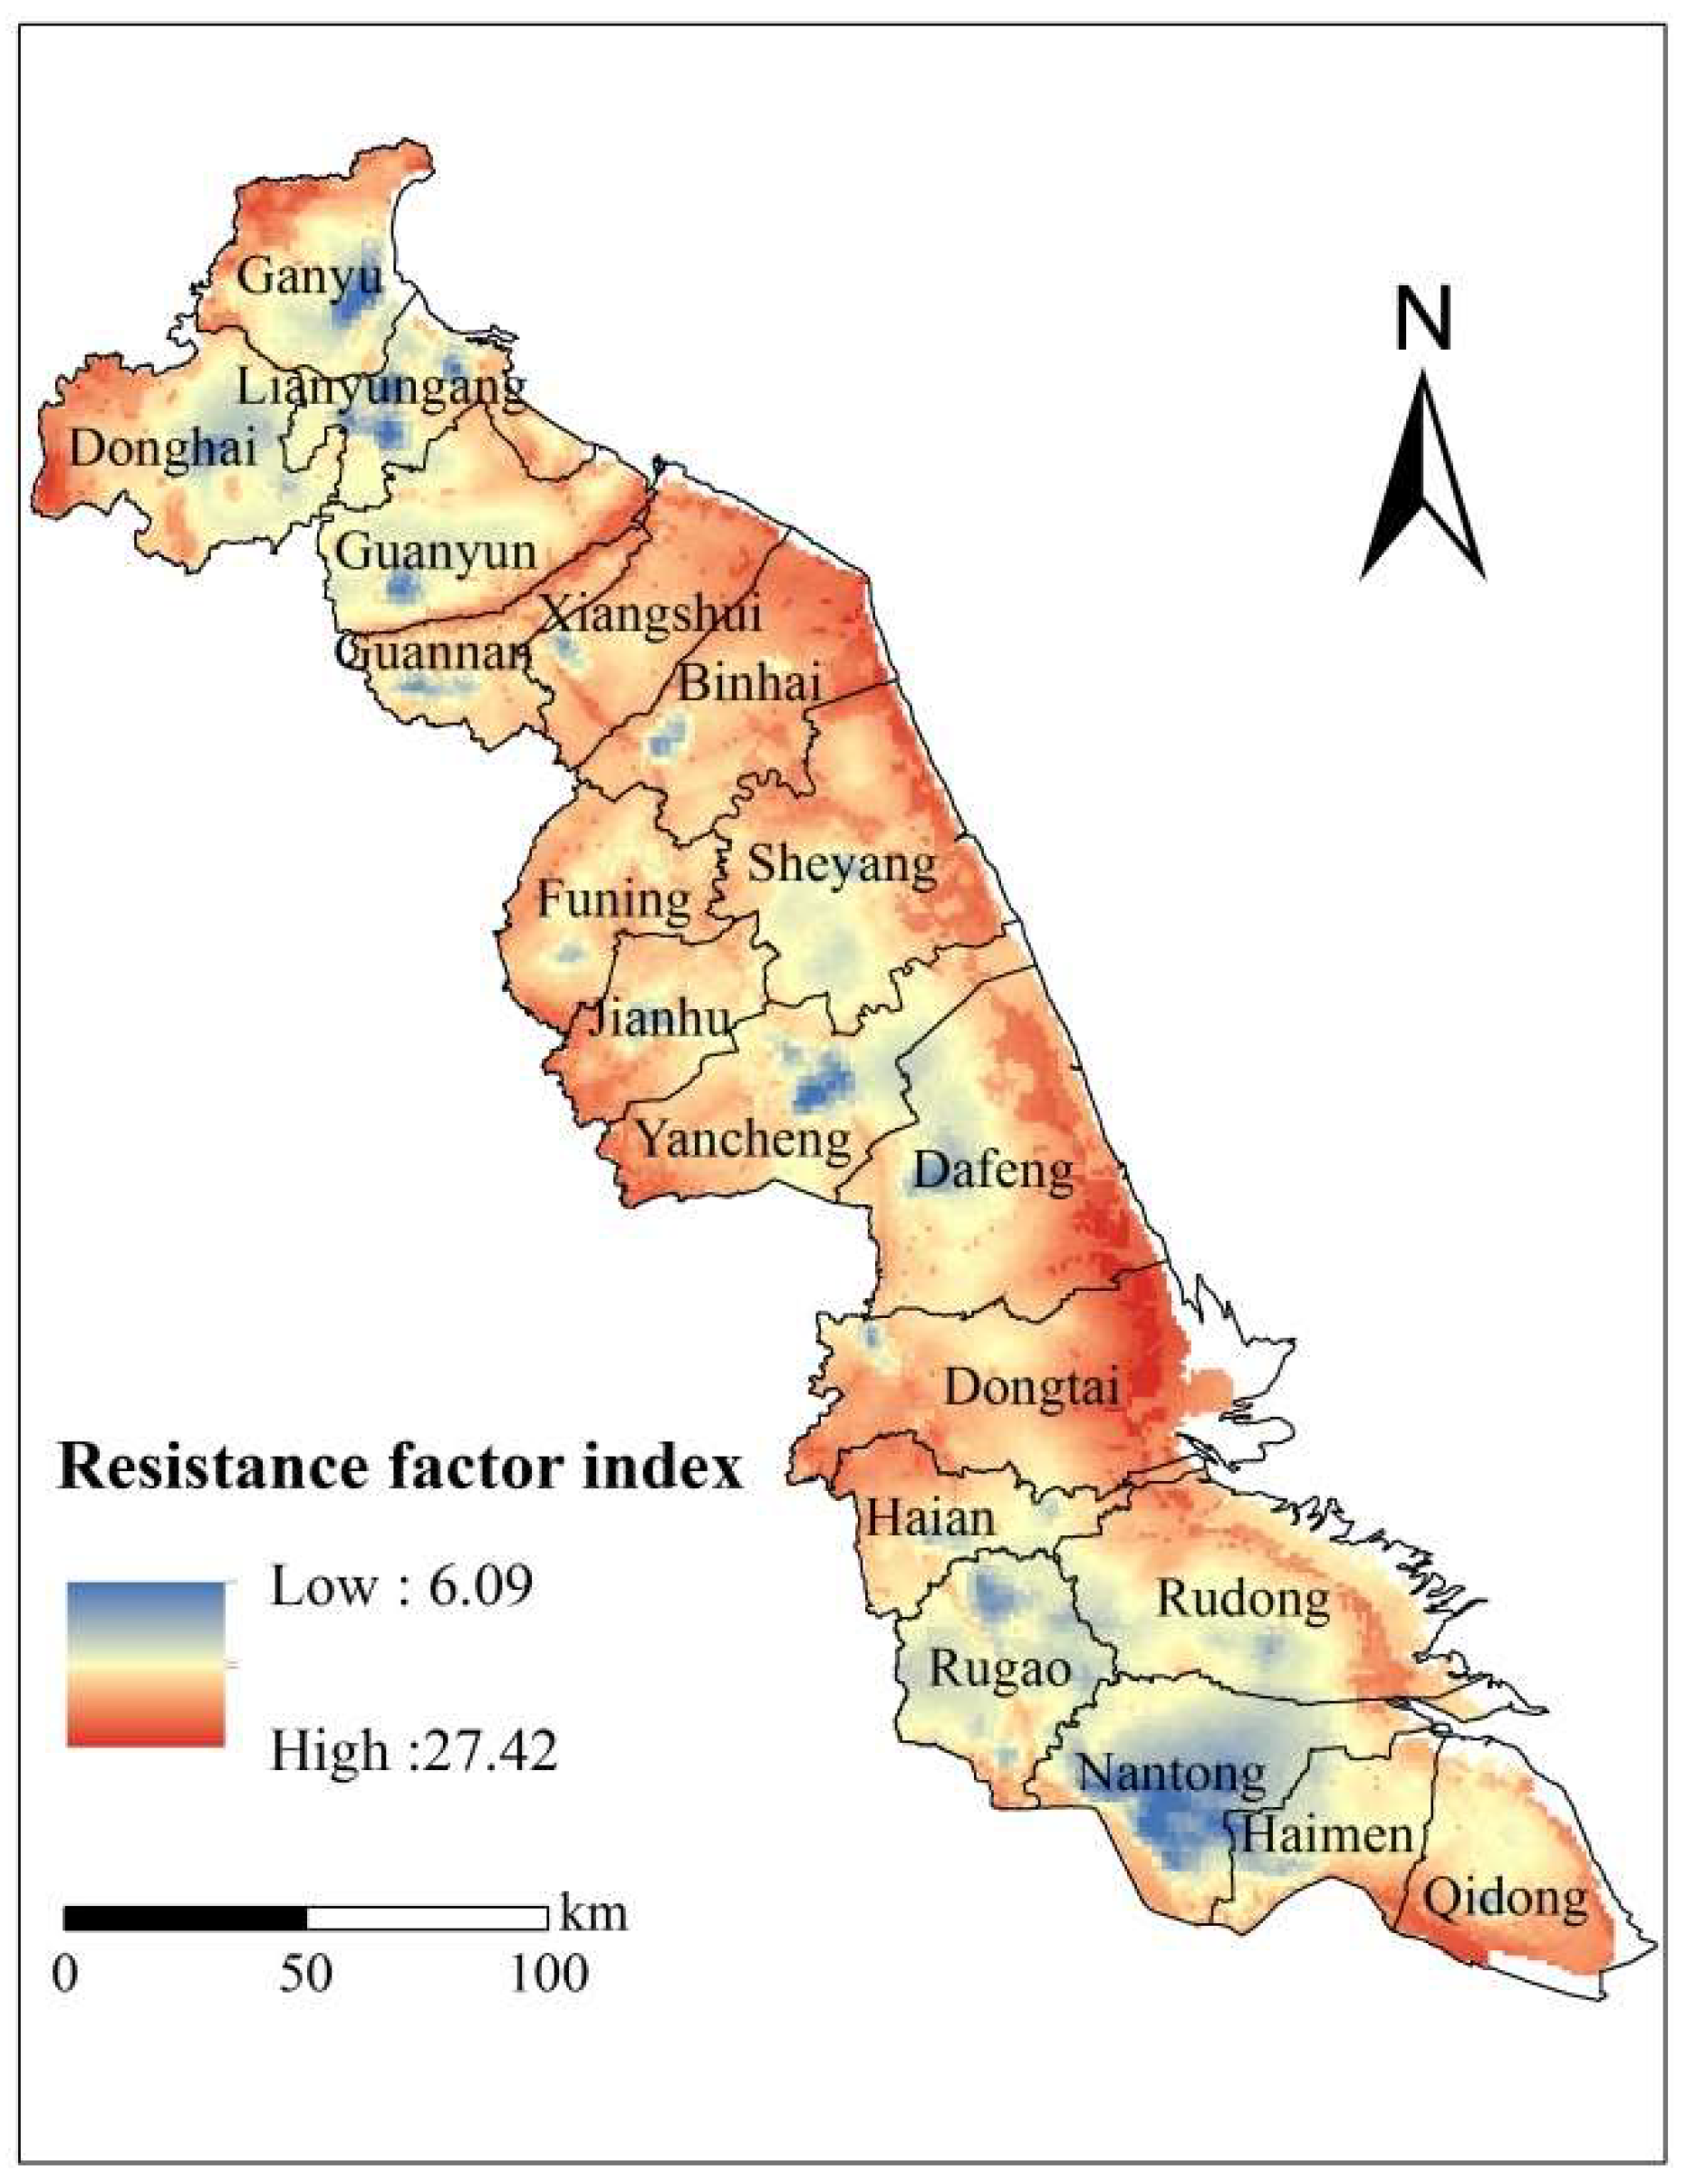
Figure 4.
Urban spatial expansion simulation of the coastal area in Jiangsu.
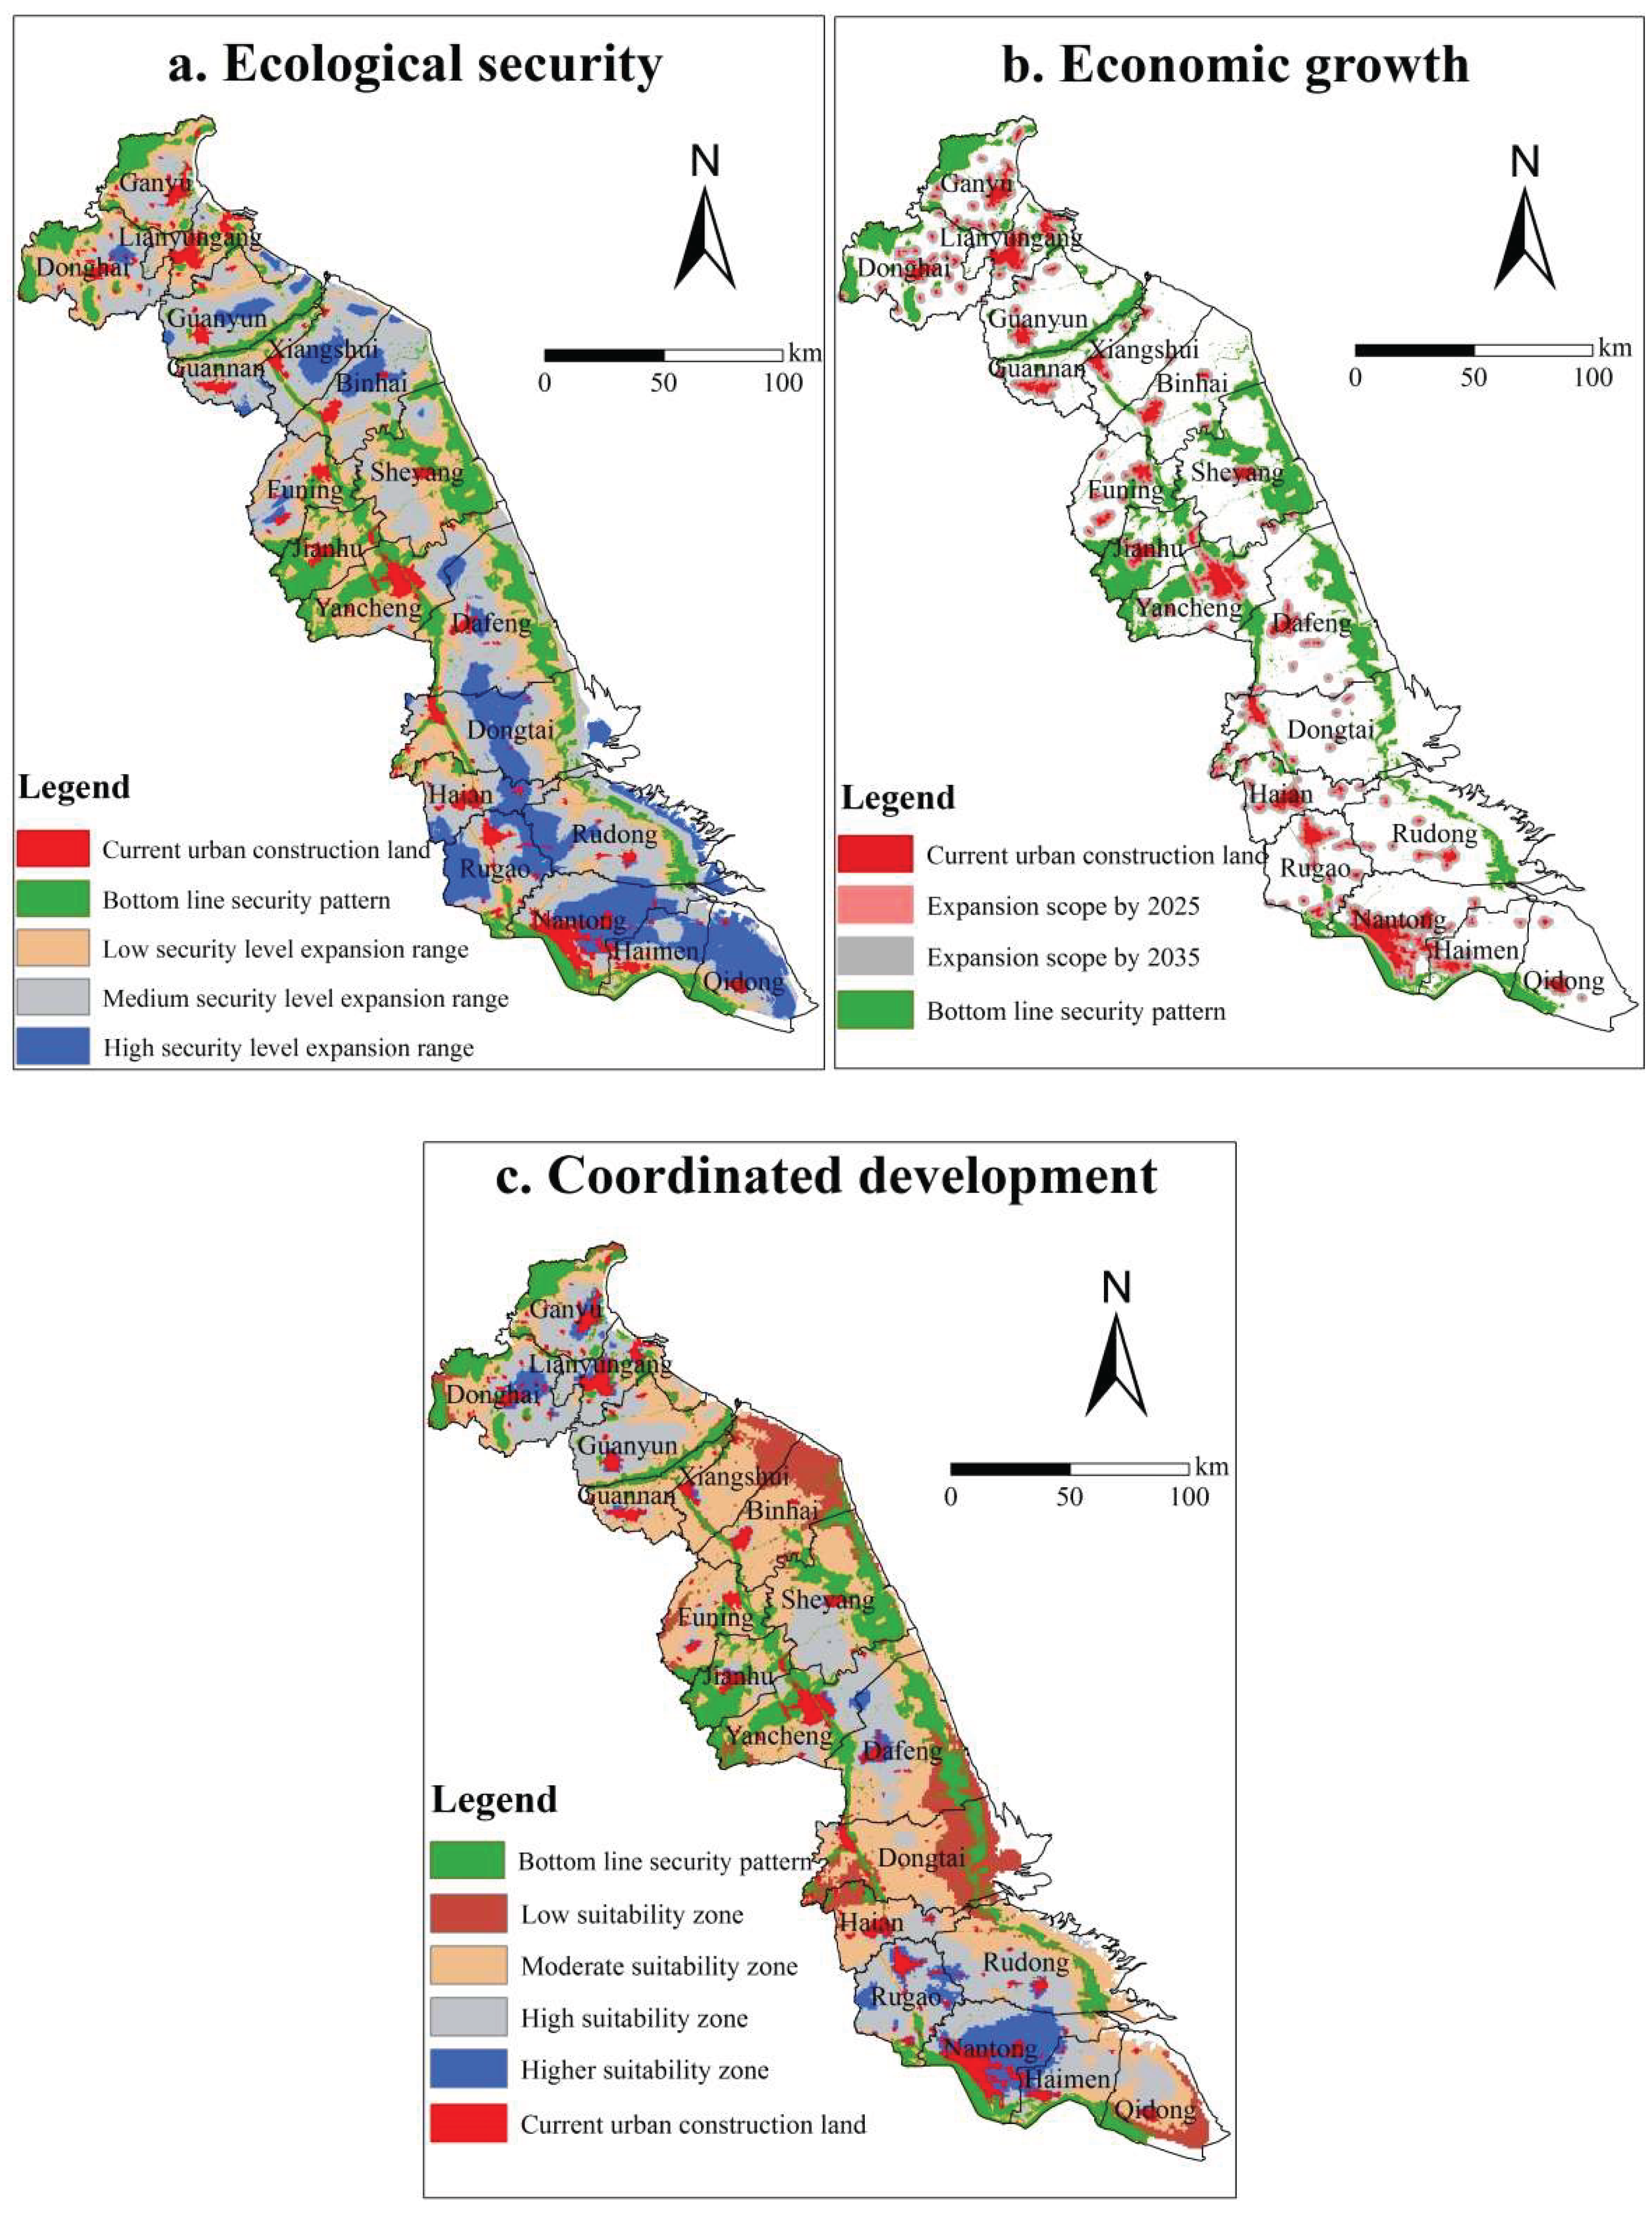

Table 1.
Resistance factors and coefficients in geological hazards safety.
| Geological Safety Factors | Ecological Security Level | weight Coefficient | |||
|---|---|---|---|---|---|
| Low | Intermediate | High | Higher | ||
| Seismic intensity | 6° | 7° | 8° | >8° | 0.2345 |
| Active fault plate | 0~2 km | 2~5 km | 5~10 km | >10 km | 0.1324 |
| Collapse-landslide disaster | >8 | 3~8 | 1~2 | <1 | 0.0633 |
| Plant coverage | NDVI<0.1 | 0.1≤NDVI<0.3 | 0.3≤NDVI<0.5 | NDVI≥0.5 | 0.1768 |
| Ground Subsidence | >1 m | 0.2~1 m | 0.1~0.2 m | <0.1 m | 0.2834 |
| Degree of sand desertification | Serious | Moderate | Light | None | 0.1095 |
Table 2.
Resistance factors and coefficients in flood safety.
| Flood Security Level | Risk of Flooding | Flood Size | Buffer range /m |
Buffer Value /m |
|---|---|---|---|---|
| Low | Every 10 years | Small | 0~50 | 30 |
| Intermediate | Every 10 years | Middle | 50~80 | 70 |
| High | Every 10 years | Big | 80~150 | 120 |
| Higher | No floods | |||
Table 3.
Resistance factors and coefficients in biological safety.
| Habitat Suitability Factors | Classification | Resistance Coefficient | weight Coefficient |
|---|---|---|---|
| Types of land use | Rivers, lakes, mudflat | 10 | 0.5 |
| Reservoirs, ponds, and ditches | 8 | ||
| Forests and other shrubs | 6 | ||
| Rice paddies, irrigated land, and dry land | 5 | ||
| Tea trees, fruit trees, gardens, and other grasslands | 4 | ||
| Agricultural land, farmland, rural roads, scenic spots | 3 | ||
| Traffic road land | 2 | ||
| Urban land, industrial and mining land, and hydraulic building land | 1 | ||
| Distance from residential areas | >1 000 m | 10 | 0.3 |
| 500~1 000 m | 6 | ||
| 0~500 m | 1 | ||
| Slope of terrain | 0°~5° | 10 | 0.2 |
| 5°~15° | 8 | ||
| 15°~25° | 4 | ||
| 25°~60° | 2 | ||
| 60°~90° | 1 |
Table 4.
Resistance factors and coefficients in recreation safety.
| Recreation Safety Factors | land-Use Classification | Resistance Coefficient |
|---|---|---|
| Types of land use | Rivers, lakes, reservoirs, wetlands | 0 |
| Forest land and grassland | 10 | |
| Mudflat in coastal areas | 15 | |
| Other forests and other grasslands | 20 | |
| Agricultural land, rural roads, ridges, ditches, ponds, and water surfaces | 25 | |
| Rice paddies, irrigated land, dry land, tea gardens, orchards | 30 | |
| Urban land, industrial and mining land, and hydraulic building land | 50 |
Table 5.
Influence factors and its classification of urban expansion sources.
| Urban expansion sources (K) | Space | City’s grade | Land use intensity /% |
Population density/ (Persons/km2) |
GDP /100 million RMB |
|---|---|---|---|---|---|
| Ⅰ(0.6) | The central urban areas of Nantong, Yancheng, and Lianyungang | prefecture level cities | 23.15 | 649.75 | 6 344.78 |
| Ⅱ(0.8) | The urban areas such as Haimen, Qidong, and Dongtai | county-level cities | 18.19 | 634.3 | 4 835.32 |
| Ⅲ(1.0) | The urban areas such as Rudong, Xiangshui, Binghai, Funing,Sheyang,Jianhu,Guannan,Donghai,Guanyun |
counties | 17.66 | 509.72 | 4 277.53 |
Table 6.
Influencing factors and resistance coefficient of urban space expansion.
| Expansion Type | Influencing Factors | Weight Coefficient | Classification | Reducing Distance |
|---|---|---|---|---|
| Resistance factor | Ecological security | 0.305 | low | 400 |
| middle | 250 | |||
| higher | 100 | |||
| Highest | 10 | |||
| Driving factors | Distance from road | 0.091 | 0~200 m | 10 |
| 200~500 m | 50 | |||
| 500~1 500 m | 200 | |||
| >1 500 m | 400 | |||
| Distance from CBD | 0.128 | 0~500 m | 10 | |
| 500~1 500 m | 50 | |||
| 1 500~2 500 m | 200 | |||
| >2 500 m | 400 | |||
| Distance from port | 0.052 | 0~1 km | 1 | |
| 1~2 km | 50 | |||
| 2~4 km | 100 | |||
| >4 km | 500 | |||
| Distance from airport | 0.085 | 0~1 km | 10 | |
| 1~2.5 km | 50 | |||
| 2.5~5 km | 100 | |||
| >5 km | 500 | |||
| Policy factors | Economic Development Zone | 0.338 | best | 1 |
| good | 20 | |||
| middle | 50 | |||
| lower | 100 | |||
| lowest | 300 |
Disclaimer/Publisher’s Note: The statements, opinions and data contained in all publications are solely those of the individual author(s) and contributor(s) and not of MDPI and/or the editor(s). MDPI and/or the editor(s) disclaim responsibility for any injury to people or property resulting from any ideas, methods, instructions or products referred to in the content. |
© 2025 by the authors. Licensee MDPI, Basel, Switzerland. This article is an open access article distributed under the terms and conditions of the Creative Commons Attribution (CC BY) license (http://creativecommons.org/licenses/by/4.0/).
Copyright: This open access article is published under a Creative Commons CC BY 4.0 license, which permit the free download, distribution, and reuse, provided that the author and preprint are cited in any reuse.


