
Submitted:
02 June 2025
Posted:
02 June 2025
You are already at the latest version
Abstract
Potato (Solanum tuberosum L.), an important food and economic crop, has significant potential for the utilization of leaf waste. In this work, crude extracts and purified extracts of steroidal glycoalkaloid (SGA) derived from potato leaves were chemically characterized by LC-MS/MS techniques. Untargeted results revealed that 1,761 metabolites were identified in the two samples, and both had higher content of SGA compounds (solanidine and α-chaconine) among the tested extracts. The two compounds did not significantly differ between TQW and CHW. In the CHW_vs_TQW comparison group, 960 metabolites exhibited no significant differences, including alkaloids, terpenoids, and steroids, etc. Overall, this study provides extensive data on the metabolite composition of SGA extracts from potato leaves, providing useful information for the discovery of bioactive compounds. The extract has the potential to serve as an effective natural crop protection agent, though further optimization may be needed for broader application.

Keywords:
potato leaves extracts
; main component analysis
; steroidal alkaloids
; terpenoids
; steroids
1. Introduction
Medicinal plants have often been selected for the phytochemicals extraction [1]; however, the residues of cultivated plants have been also investigated for the production of raw antifungal extracts in a view of circular economy and agricultural waste valorization. Examples of non-edible plant parts used as source of phytochemicals for anti-pathogenic applications were reported for pepper and eggplant leaves [2,3]. Potato is an important food and economic crop worldwide, ranking first in both yield and planting areas. In recent years, research on potatoes has increased significantly; however, handling the leaf waste generated after planting remains a challenging issue. Although some of this waste can be used as silage, a significant portion is still discarded, leading to the waste of valuable plant resources and causing severe environmental harm. Therefore, research and development on the resource utilization of potato leaves has great practical importance. Studies have shown that the aerial parts of potatoes, namely, their leaves, contain various chemical components, primarily protein compounds, alkaloids, phenolic compounds, and flavonoids [4,5,6,7]. Plants produce various metabolites with bactericidal, fungicidal, insecticidal, and nematocidal properties to protect themselves against phytophagous organisms and diseases [8]. Several studies have demonstrated the potential of these natural substances to be integrated with traditional crop management practices, addressing the urgent need for sustainable agriculture, safe food production, and organic farming [9,10,11].
Steroidal glycoalkaloids (SGAs) categorized as alkaloids, are a class of secondary metabolites with multiple biological activities in potatoes [12,13]. In potato, these compounds are found mainly in the leaves, stems, buds, and tuber skin. Notably, their content can significantly increase when tubers are mechanically damaged, exposed to light, or sprout [14]. In potato tubers, α-chaconine and α-solanine constitute more than 90% of the total SGA content [15]. However, more than 50 different SGAs, including solanidine, leptines, demissine, and tomatine, have been identified in various wild potato species and commercial cultivars [16,17]. However, the main components of steroidal alkaloids in potato leaves have rarely been reported. As natural defense substances against pests and diseases, SGAs are potential raw materials for the development of plant-based pesticides [18]. In addition to SGAs, terpenoids also play crucial roles in potato leaves. Although numerous terpenoids have been identified in plants [19], the specific composition of the compounds present in potato leaves remains unclear.
Thanks to the development of advanced analytical technologies, it is now possible to better characterize the complex composition of many plants’ raw materials, with a focus on understanding their biologically active compounds. SGA biosynthesis is a complex enzymatic process that shares common synthetic pathways, substrates, and intermediates with terpenes, saponins, and phytosterols [20]. SGAs exhibit weak basicity. When exposed to acids and heat, their glycosidic bonds are cleaved, releasing solanine and sugars. Under alkaline conditions, they form precipitates that can be separated. Owing to these properties, weakly acidic solutions and organic solvents are commonly used to extract SGAs [21]. Building on existing SGA extraction techniques, we employed an optimized method to extract SGAs from potato leaves, obtaining a crude extract [22]. A C18 purification column was used to isolate purified products. To date, research on the factors affecting SGA levels has focused primarily on α-solanine and α-chaconine, neglecting other naturally occurring SGAs. Therefore, the work aims to explore scientific knowledge on the content of the main metabolites, focusing on the group of main compounds present in different extracts from potato leaves. We analyzed the crude extracts and purified extracts from potato leaves through LC-MS/MS technology, systematically characterized the phytochemical properties of both crude extracts and purified extracts. The main components of the extracts were identified and screened by untargeted metabolomics, providing foundational data for future investigations into the biological activities of these metabolites.
2. Materials and Methods
2.1. Plant Materials
The potato variety used in the experiment was 'Jizhangshu No. 12', which was collected from the Potato Experimental Base of the Agricultural and Forestry Science Research Institute in Ulanqab, Inner Mongolia. During the late growth stage, potato leaves were harvested. The fresh samples were weighed, dried, crushed, sieved, and then stored in sealed bags for later use.
2.2. Preparation of Steroidal Alkaloid Extracts
The potato leaf powder (5 g) was weighed and mixed with 1.5% cellulase in a sealed container. Next, 40 mL of acidic aqueous solution (adjusted to pH 5 with 0.02 mol/L hydrochloric acid in distilled water) was added. The mixture was vortexed and extracted via ultrasonic treatment in a water bath at 45°C for 30 min. Subsequently, the enzymatic extraction was performed in a water bath for 1.5 hours. After enzymatic hydrolysis, the mixture was heated to 95°C to deactivate cellulase. Anhydrous ethanol was added until the total volume reached 70%, and the mixture was left to stand for 18 h. The mixed solution was then filtered under reduced pressure, and the filtrate was transferred to a rotary evaporator for concentration. The remaining residue was dissolved in 30 mL of 5% H2SO4 and filtered, and the pH of the filtrate was adjusted to 10.0-10.5 with concentrated ammonia water. The solution was stored overnight in a refrigerator at 4°C. The sample was subsequently centrifuged at 4000 r/min for 20 min, after which the supernatant was discarded. The precipitate was washed several times with 1% aqueous ammonia until the washing solution became clear. The resulting precipitation was used as the crude extract. This crude extract was dissolved in 5 mL of methanol and decolorized using activated carbon, yielding a 5 mL methanol extract (steroidal alkaloid extract), referred to as TQW, for LC‒MS/MS detection.
2.3. Purification of Steroidal Alkaloid Crude Extracts
The purification was performed via a C18 solid-phase extraction column. First, the column was activated by adding 5 mL of methanol, followed by vacuum application to remove the eluent. The column was then reactivated by adding 5 mL of distilled water, and the eluent was discarded. Next, 6 mL of the crude extract was loaded onto the column and vacuumed, and the waste liquid was discarded. The column was washed with 5 mL distilled water, and the elusion was discarded under vacuum. A collection tube was placed under the column, and 5 mL of methanol was added to the column. The eluent was vacuum-collected, yielding purified steroidal alkaloids, referred to as CHW, for LC‒MS/MS detection.
2.4. Detection Methods
2.4.1. Liquid Samples
The sample was removed from the -80°C refrigerator, thawed until there was no ice in the sample, vortexed for 10 s, and mixed thoroughly. One hundred microlitres of each sample was added to a corresponding 1.5 mL centrifuge tube, and 100 μL of 70% methanol was added to the internal standard extraction mixture (less than 100 μL of extraction mixture was added at a ratio of 1:1 (v/v)). The mixture was vortexed for 15 min at 12000 r/min at 4°C and centrifuged for 3 min. The supernatant was removed, filtered through a microporous membrane (0.22 μm pore size), and stored in an injection vial for LC‒ MS/MS detection.
2.4.2. HPLC Conditions
All the samples were subjected to two LC‒MS methods. One aliquot was analyzed under positive ion conditions and eluted from a T3 column (Waters ACQUITY Premier HSS T3 Column 1.8 µm, 2.1 mm * 100 mm) using 0.1% formic acid in water as solvent A and 0.1% formic acid in acetonitrile as solvent B in the following gradient: 5 to 20% in 2 min, increased to 60% in the following 3 min, increased to 99% in 1 min and held for 1.5 min, then returned to 5% mobile phase B within 0.1 min, held for 2.4 min. The analytical conditions were as follows: column temperature, 40°C; flow rate, 0.4 mL/min; injection volume, 4 μL; and another aliquot, which used negative ion conditions and was the same as the elution gradient of positive mode.
2.4.3. MS Conditions (AB)
The data acquisition was performed in information-dependent acquisition (IDA) mode via Analyst TF 1.7.1 software (Sciex, Concord, ON, Canada). The source parameters were set as follows: ion source gas 1 (GAS1), 50 psi; ion source gas 2 (GAS2), 50 psi; curtain gas (CUR), 25 psi; temperature (TEM), 550°C; declustering potential (DP), 60 V, or −60 V in positive or negative mode, respectively; and ion spray voltage floating (ISVF), 5000 V or −4000 V in positive or negative mode, respectively. The TOF MS scan parameters were set as follows: mass range, 50–1000 Da; accumulation time, 200 ms; and dynamic background subtraction, on. The product ion scan parameters were set as follows: mass range, 25-1000 Da; accumulation time, 40 ms; collision energy, 30 or −30 V in positive or negative mode, respectively; collision energy spread, 15; resolution, UNIT; charge state, 1--1; intensity, 100 cps; excluding isotopes within 4 Da; mass tolerance, 50 ppm; and maximum number of candidate ions to monitor per cycle, 18.
2.4.4. UPLC Conditions
The sample extracts were analyzed via a UPLC‒ESI‒MS‒MS‒MS system (UPLC, ExionLC™ AD, https://sciex.com.cn/) and a tandem mass spectrometry system (https://sciex.com.cn/). The analytical conditions were as follows: UPLC: column, Agilent SB-C18 (1.8 µm, 2.1 mm * 100 mm). The mobile phase consisted of solvent A, pure water with 0.1% formic acid, and solvent B, acetonitrile with 0.1% formic acid. Sample measurements were performed with a gradient program that employed the starting conditions of 95% A, 5% B. Within 9 min, a linear gradient to 5% A, 95% B was programmed, and a composition of 5% A, 95% B was maintained for 1 min. Subsequently, a composition of 95% A, 5.0% B was adjusted within 1.1 min and maintained for 2.9 min. The flow velocity was set as 0.35 mL per minute. The column oven was set to 40°C, and the injection volume was 2 μL. The effluent was alternatively connected to an ESI-triple quadrupole-linear ion trap (QTRAP)-MS.
2.5. Analysis Methods
2.5.1. PCA
Unsupervised PCA (principal component analysis) was performed via the statistics function prcomp within R (www.r-project.org). The data was subjected to unit variance scaling before unsupervised PCA.
2.5.2. Hierarchical Cluster Analysis
The HCA (hierarchical cluster analysis) results of the samples and metabolites are presented as heatmaps with dendrograms, whereas the Pearson correlation coefficients (PCCs) between samples were calculated via the cor function in R and are presented as heatmaps. Both HCA and PCC were carried out via the R package Complex Heatmap. For HCA, normalized signal intensities of metabolites (unit variance scaling) are visualized as a color spectrum.
2.5.3. Differentially Abundant Metabolites Selected
For two-group analysis, differentially abundant metabolites were determined by VIP (VIP > 1) and absolute Log2FC (|Log2FC| ≥ 1.0). VIP values were extracted from the OPLS-DA results, which also contain score plots and permutation plots, generated via the R package MetaboAnalystR. The data were log transformed (log2) and mean centered before OPLS-DA. To avoid overfitting, a permutation test (200 permutations) was performed.
2.5.4. Metabolite Annotation
The qualitative analysis of primary and secondary mass spectrometry data, as well as the quantification of widely targeted metabolites, was performed by MetWare Biotechnology (Wuhan, China) with the custom-built MWDB database and publicly available metabolite databases. The analysis software used for substance identification was developed by MetWare Biotechnology. According to the priority of data analysis, the first is the search algorithm of the local high-resolution database built by the company (MS2-search-local), followed by the public online libraries Metlin (http://metlin.scripps.edu/index.php), HMDB (https://hmdb.ca/), Mona (https://mona.fiehnlab.ucdavis. edu/), MassBank (http://www.massbank.jp/), etc. (MS2-search-DB), and finally the prediction library based on machine learning (MS2-In silico). In addition, for substances that have not been identified at the second level, a first-level close result is given as a reference on the basis of the Q1 error (MS1).
3. Results
3.1. Qualitative and Quantitative Analysis of Metabolites in Crude Extract and Purified Extract from Potato Leaves
To analyze the main components of steroidal alkaloid extract from potato leaves, this study conducted untargeted metabolomic detection of the extracts using LC-MS/MS technology, focusing on the metabolites identified in the crude extract (TQW) and the purified extract (CHW) from potato leaves.
By overlapping the total ion current chromatograms of different quality control (QC) samples, it was found that the curves of the total ion current for metabolite detection had a high degree of overlap, indicating that both the retention time and peak intensity were consistent. This suggested that the signal stability of the mass spectrometer was good when the same sample was detected at different times (Figure 1a,b). The blank samples showed no significant peaks corresponding to the internal standards, indicating that very few residual substances remained during the detection process (Figure 2a, b). Pearson correlation analysis of the quality control (QC) samples revealed a high correlation between the samples. The higher the correlation of the QC samples (|r| closer to 1) is, the better the stability and reproducibility of the data quality throughout the detection process (Figure 3).
3.2. PCA and Orthogonal Partial Least Squares -Discriminant Analysis (OPLS-DA) of Different Samples
In the principal component analysis (PCA) model analysis, the first principal component (PC1) and the second principal component (PC2) accounted for 51.81% and 23.15% of the total variation in the model, respectively, totaling 74.96%. The data points for the two groups of samples were clearly distinguished in the PCA score plot (Figure 4a), indicating a distinct difference between the two groups. The greater the proportion of substances with a lower coefficient of variation (CV) value in the QC samples, the more stable the experimental data: the proportion of substances with a CV value less than 0.5 in the QC samples was greater than 85%, indicating that the experimental data were relatively stable (Figure 4b). All samples fell within the 75% confidence interval, indicating that the analysis data of the metabolomics had high reliability.
To acquire differential profiles between the CHW and TQW samples, a supervised OPLS-DA model was constructed. Points of two samples were distributed in different regions and clearly divided into different clusters (Figure 5a), indicating that there were differences in the types and contents of metabolites between the two samples. Cross-validation revealed that R2Y and Q2 were greater than 0.9 (the closer to 1, the more stable and reliable the model) (Figure 5b,c), indicating that the established OPLS-DA model was stable and reliable, laying the foundation for screening differentially abundant metabolites.
3.3. Screening and Identification of Differential Abundant Metabolites (DAMs)
A total of 1761 metabolites (Table S1) were detected in all the samples, including 1316 metabolites in the positive ion mode of T3 and 445 in the negative ion mode. Among the metabolites, amino acids and their derivatives accounted for 21.22%, organic acids 10.61%, lipids 8.98%, benzene and its derivatives 8.37%, terpenes 6.94%, alkaloids 4.9%, alcohols and amines 2.24%, steroids 1.22%, and others 35.52% (Figure 6a). All the metabolites exhibiting the highest relative content (top 10) included: glucocerebrosides, 13E-docosenamide, N-entadecylcyclohexanecarboxamide, 1-hydroxyanthraquinone, 1-linoleoyl-3-docosahexaenoyl-sn-glycerol, solanidine, N-[(3S)-2-oxothiolan-3-yl]butanamide, α-chaconine, schisandrin, and dalpanin. The majority of compounds belong to lipid, solanidine and α-chaconine belong to steroidal alkaloids among these metabolites, indicating that the two compounds were main components of potato leaves in the steroidal alkaloids.
To visualize between-group differences and accurately identify differential metabolites, we integrated partial least squares discriminant analysis (PLS-DA) for in-depth discriminatory analysis. In this study, PLS-DA was employed as a supervised learning approach to conduct further discriminant analysis, enabling comprehensive characterization of metabolic disparities among different sample groups (Figure 6b). In the CHW_vs_TQW comparison group, we employed a screening criterion of |log2FoldChange| > 1 and a significance threshold of VIP > 1 to identify differential metabolites. A total of 800 differential metabolites were screened (Table S2), of which 162 metabolites were upregulated, and 638 metabolites were downregulated in the CHW, indicating a greater proportion of downregulated differential metabolites (Figure 6c). To elucidate patterns in metabolite relative content, we performed cluster analysis of differential metabolites. The results revealed distinct metabolic clustering patterns between CHW and TQW samples (Figure 7). The most significantly upregulated DAMs (Log2FC>6.0) in the CHW were 2-hydroxyvaleric acid, 2-phenylbutyramide, and 1-palmitoyl-2-oleoyl-sn-glycero-3-phosphate, classified as organic acids, Benzene and substituted derivatives and Glycerophospholipids, whereas downregulated metabolites were mainly sulfonic acid, Val-His-Leu-Asp and L-Lysine, L-valyl-L-histidyl-, classified as organic acids, amino acids and derivatives.
In the CHW_vs_TQW comparison group, a total of 960 metabolites showed no significant differences (Table S3). Among these metabolites, 268 amino acids and derivatives, 86 lipids, 78 glycerophospholipids and glycerides, 76 organic acids, 72 benzene and substituted derivatives, 53 alcohol and amines, 48 alkaloids, including steroidal alkaloids, such as solanine, α-chaconine, β-chaconine, solanidine, and solasodine; 37 terpenes, including atractyloside C, rhododendrin, and glycyrrhizic acid (β-type); and 9 steroids, including salvianoside VI, ophiopogonin D, and diosgenin, were identified. These results demonstrate that the purification method for steroidal alkaloid extracts is effective, with the relative content of main components of steroidal alkaloid remaining consistent with the extracts after purification.
3.3.1. Alkaloid Metabolites Analysis
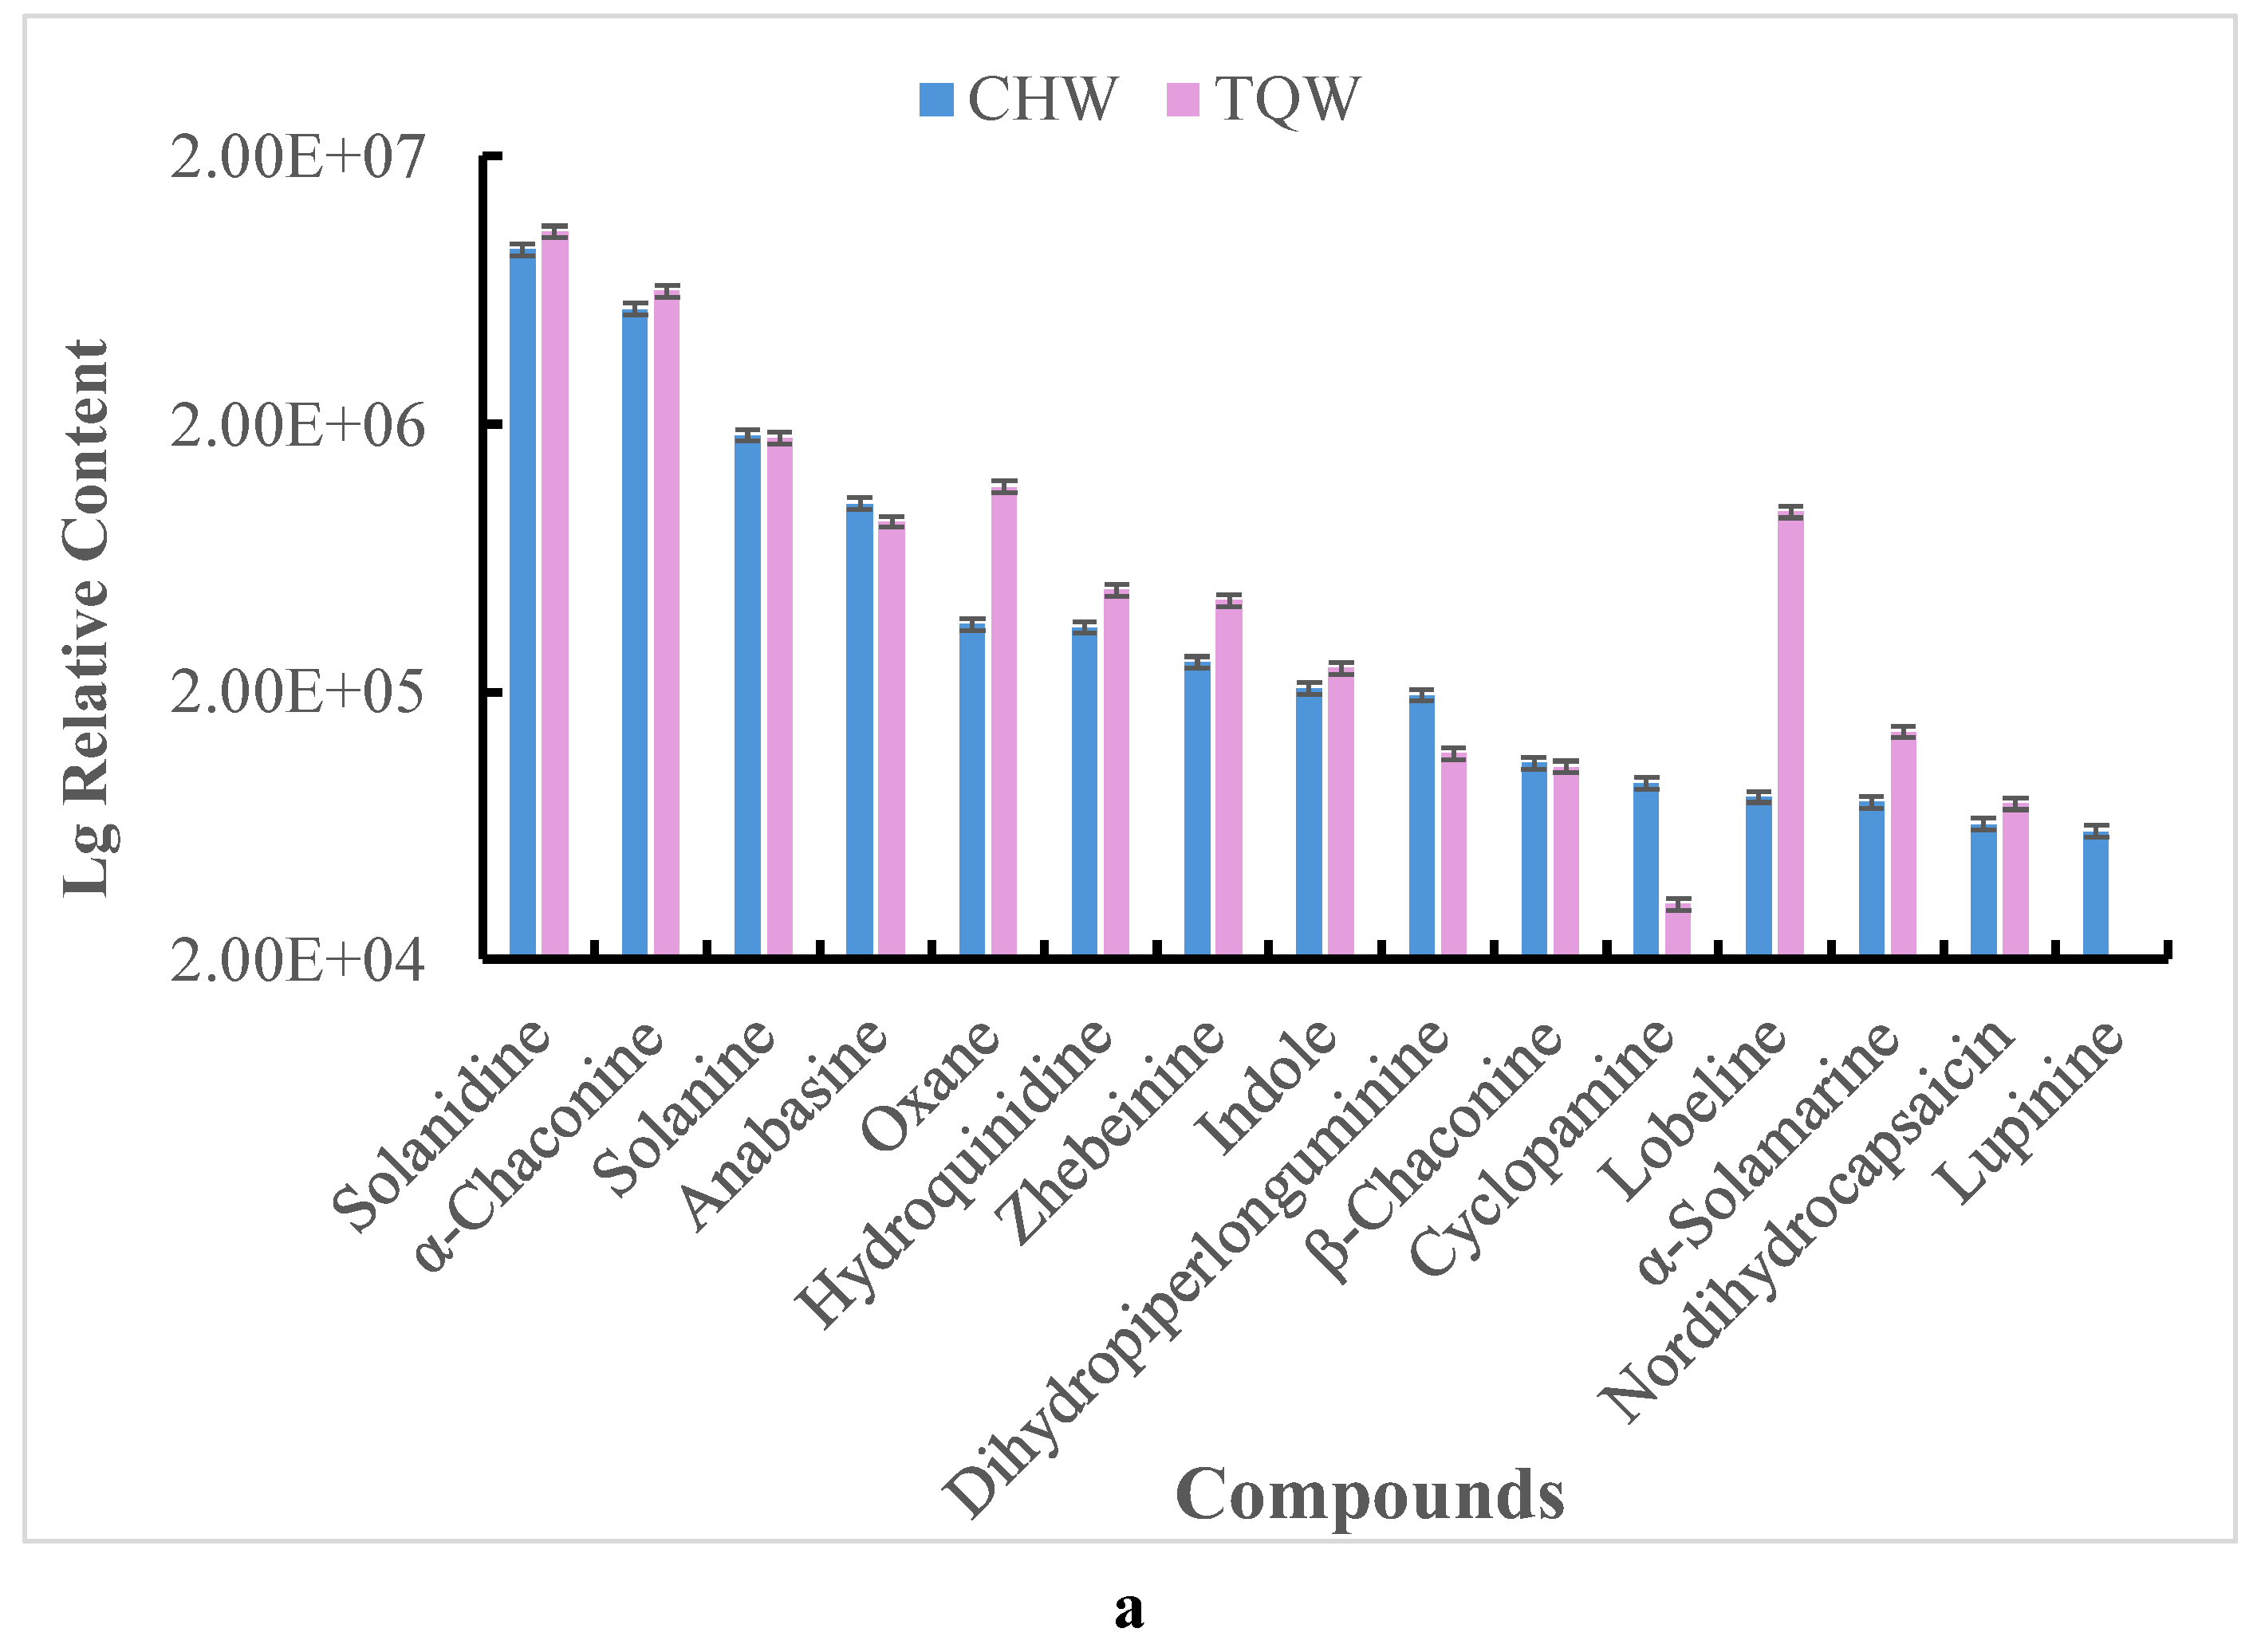
Alkaloids possess various biological activities, including antimicrobial, anti-inflammatory, and antitumor properties [23]. To understand the types and relative contents of alkaloids in the potato leaf, 84 alkaloids were screened in all the metabolites (Table S4). These include 7 steroidal alkaloids (solanidine, α-chaconine, α-solanine, etc.), 7 terpenoid alkaloids, 6 quinoline and isoquinoline alkaloids, and 46 other alkaloids. In the CHW_vs_TQW comparison group, the significant upregulated alkaloids were Lupinine, cyclopamine and geissospermine, while the downregulated were 2'-norberbamunine, deserpidine and 5,6-dimethylbenzimidazole. However, 48 alkaloids showed no significant differences, the main components were steroidal alkaloids among the metabolites, such as solanine, α-chaconine, β-chaconine, solanidine, and solasodine (Figure 8a). In the CHW samples, the higher mean content among the alkaloids included solanidine, α-chaconine, and solanine acted as core components. Similarly, the mean content of solanidine, α-chaconine, and solanine were relatively higher in the TQW samples. These findings indicated that the purification method for steroidal alkaloid extracts is effective. The study further confirmed that the main steroidal alkaloids in potato leaves are solanidine, α-chaconine, and solanine.
3.3.2. Terpenes Metabolite Analysis
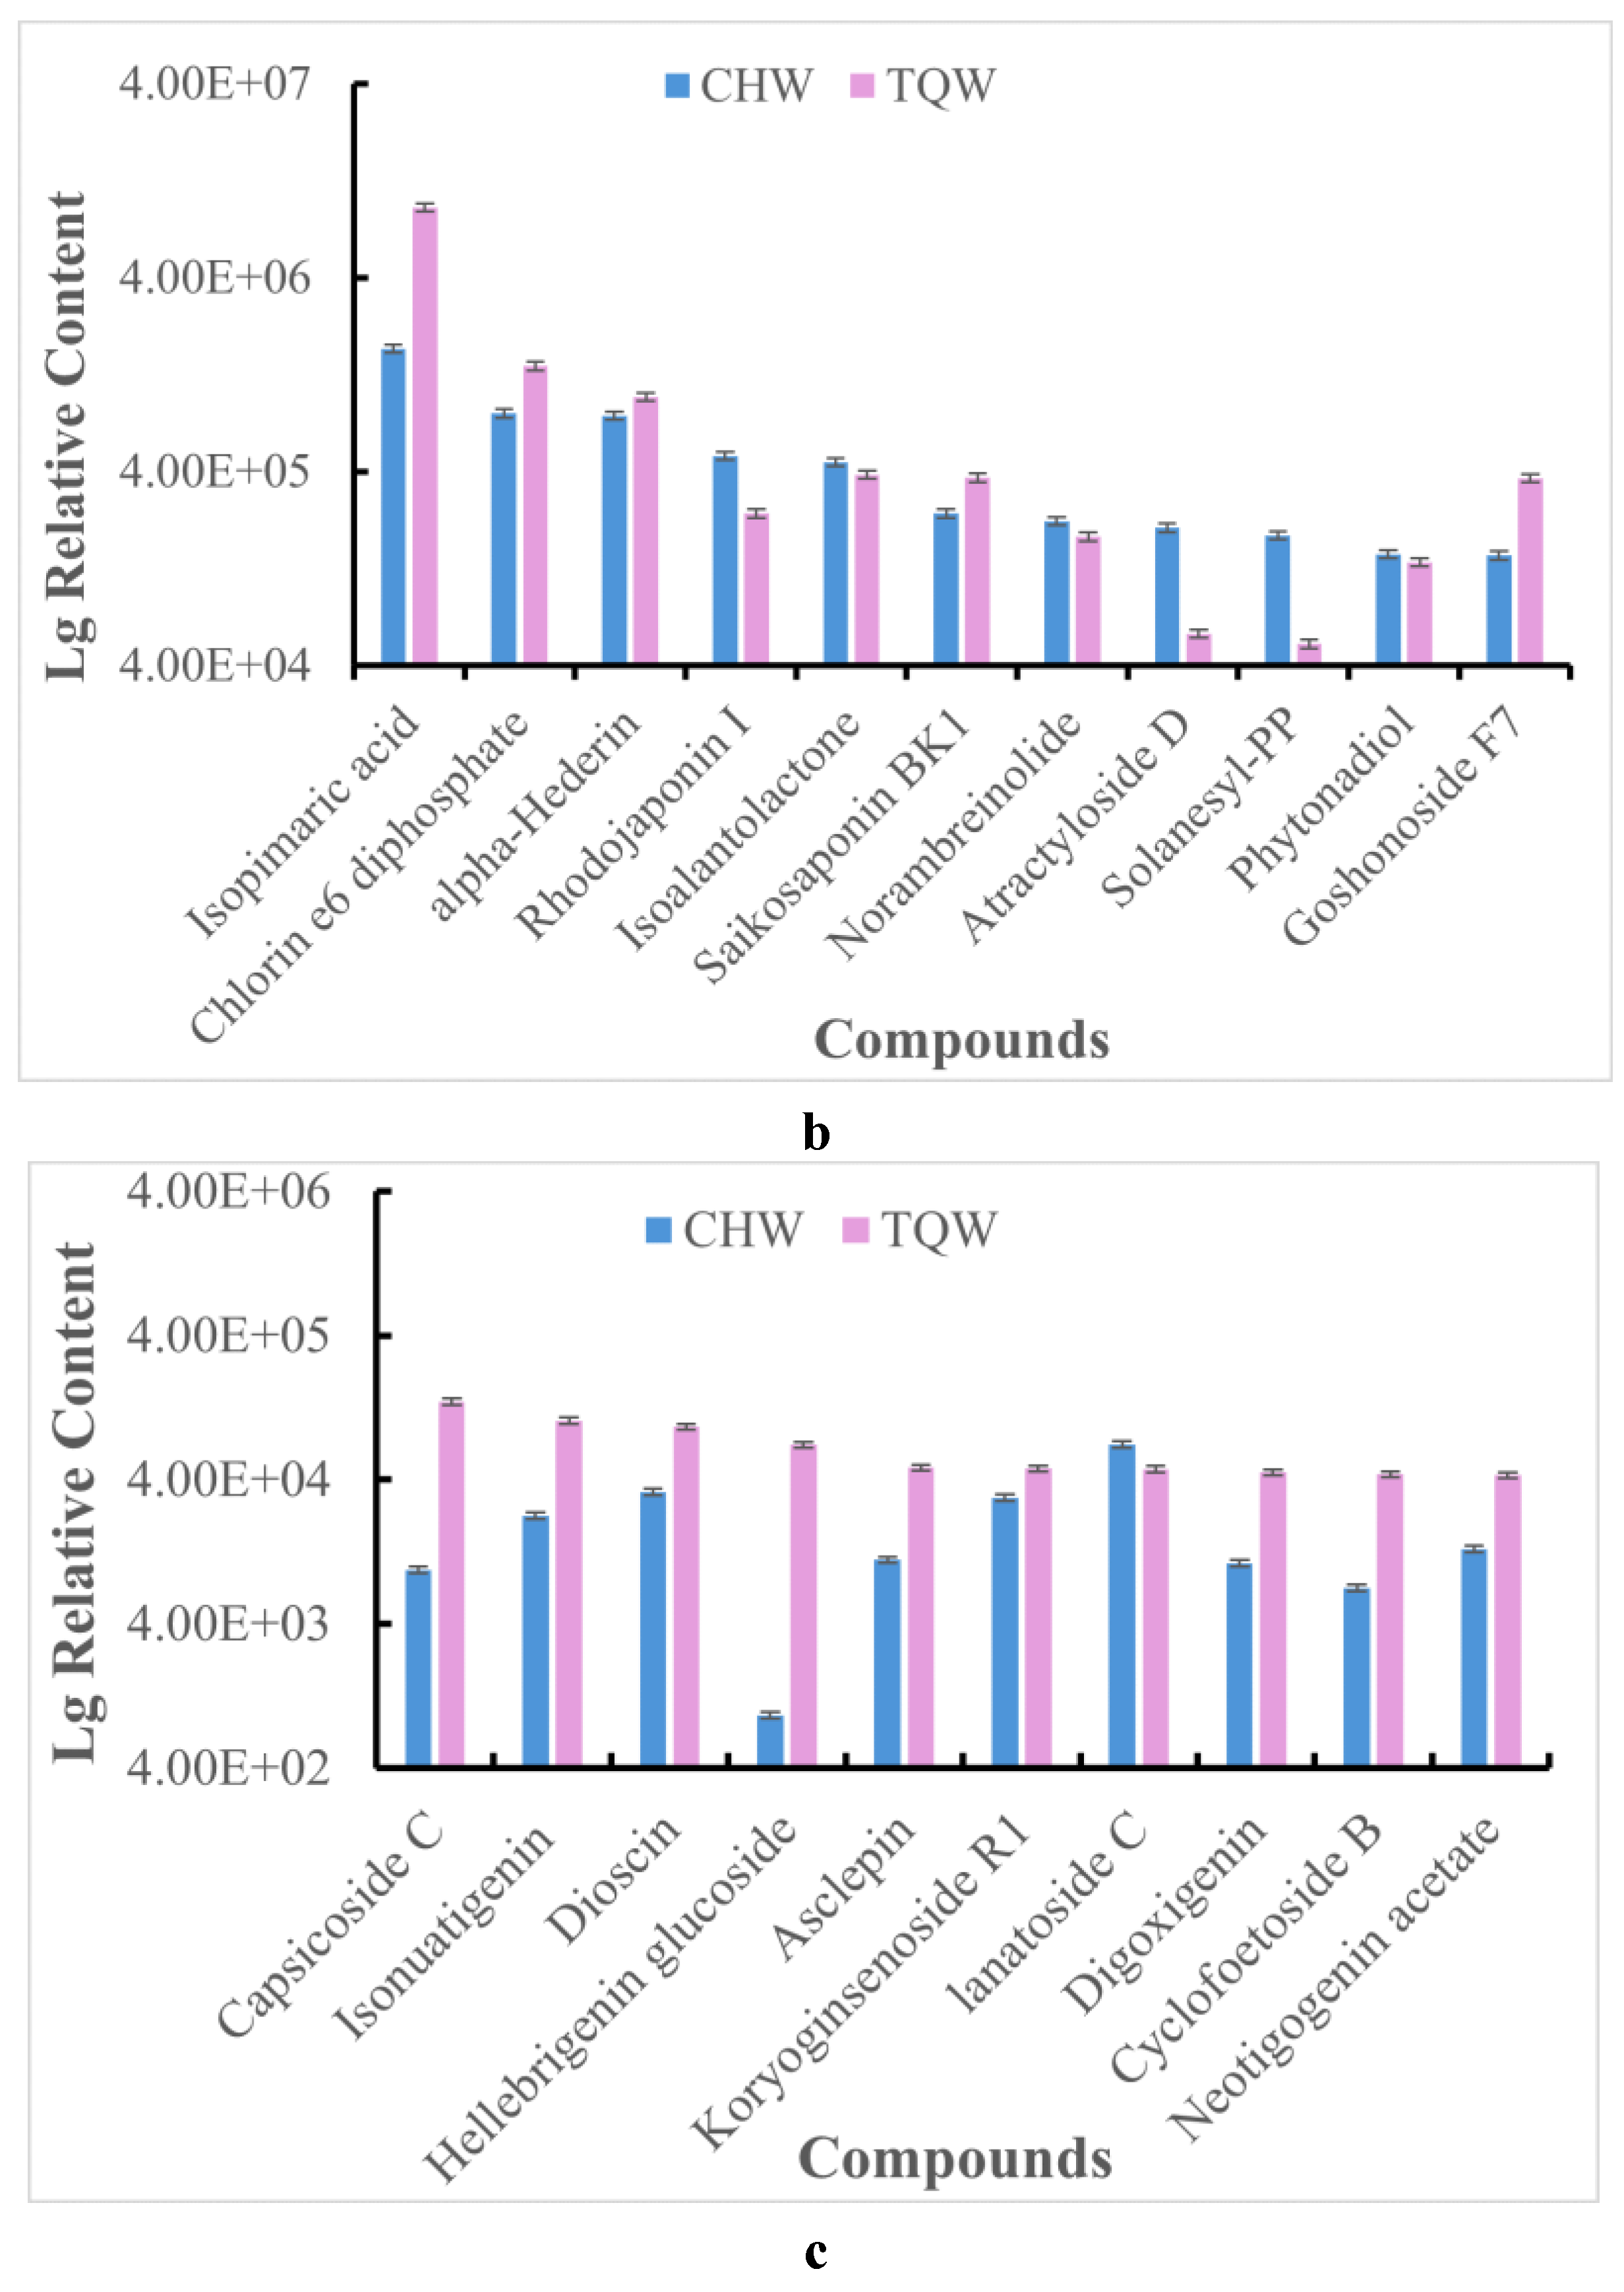
Another main group of phytochemicals present in extracts were terpenoids. Terpenes are the most abundant class of natural compounds. Owing to their diverse types and biological activities, they are widely used in food, pharmaceuticals, chemicals, and new fuels [24]. Terpenes are effective components of many traditional Chinese medicines, and most of them exhibit anticancer effects [25]. Additionally, terpenes have pharmacological properties, such as anti-inflammatory, antimicrobial, antimalarial, and cardiovascular disease prevention properties, and can reduce blood sugar levels [26,27]. 74 terpene compounds were detected in the CHW and TQW samples, including 21 diterpenes, 13 triterpenoid saponins, 12 sesquiterpenes, 11 triterpenes, and 11 other terpenes (Table S5). In the CHW_vs_TQW comparison group, 38 terpenes compounds presented significant differences. The significantly upregulated compounds included crocin, carvyl acetate, and solanesyl-PP, whereas the downregulated compounds included capsianoside II, phytyl diphosphate, and pulegone in the CHW. Among the detected terpenoids, 36 showed no significant differences in the CHW_vs_TQW group. The highest content of the upregulated compound was atractyloside D in the CHW. The terpenes present at relatively high levels in the CHW included chlorin e6 diphosphate, α-hederin, rhodojaponin I, isoalantolactone, saikosaponin BK1, norambreinolide and phytonadiol, whereas included isopimaric acid, chlorin e6 diphosphate, alpha-hederin in the TQW (Figure 8b). The identification and exploration of terpene compounds in potato leaves provides scientific evidence for the development of anticancer, cardiovascular, and psychiatric drugs that use these compounds as raw materials.
3.3.3. Steroids Metabolites Analysis
The presence of steroids was also observed in both extracts. Steroids are an important class of natural organic compounds that are widely found in living organisms, including cardiac glycosides, steroidal saponins, sterols, steroidal alkaloids, and ecdysteroids. These compounds exhibit biological activities, such as anticancer, antitumor, cholesterol reduction, anti-inflammatory, and antitussive effects [28]. A total of 21 steroids were detected in the CHW and TQW samples (Table S6). Among these, 4 steroidal saponins were identified, including ophiopogon saponin D, heike saponin, diosgenin saponin, and capsaicin C; 4 cardiac glycosides, including malachite glycoside, isohydroxy digoxin, cineraria glycoside C, and onion sugar; and 12 other steroids. In the CHW_vs_TQW comparison group, 12 steroids were significantly different, 9 showed no significant differences. The steroids of higher content included lanatoside C, chikusetsusaponin III, carnosifloside III, dioscin and koryoginsenoside R1 in the CHW, and capsicoside C, isonuatigenin, dioscin, hellebrigenin glucoside and asclepin in the TQW. Mean content of Capsicoside C in the TQW samples was significantly higher than in the CHW (Figure 8c).
4. Discussion
Plant extracts are a blend of bioactive molecules, which can work synergistically in counteracting harmful microorganisms [29,30]. Potato leaves contain a variety of primary and secondary metabolites, including sugars, proteins, alkaloids, terpenoids, phenolic acids, flavonoids and organic acids [31]. The main components of the extract and other unknown metabolites can be clearly identified by specifically extracting the main component from leaves. LC-MS/MS analysis conducted here putatively identified a set of possible antifungal compounds into the extracts, namely solanidine, α-chaconine, solanine, isopimaric acid, chlorin e6 diphosphate, α-hederin, capsicoside C, lsonuatigenin and dioscin. etc. Moreover, solanidine, α-chaconine and solanine are steroidal alkaloids with a presumable role in potato protection from phytopathogens. The main glycoalkaloids in potato, α-solanine, and α-chaconine showed potent antimicrobial activity to a wide range of organisms; for this reason, they are considered as defensive allelochemicals [32]. The experimental results revealed that the chemical composition of the extract not only contained steroidal alkaloids, but also included other alkaloids, terpenoids, phenolic acids, flavonoids and organic acids, steroids, lipids, etc., and a total of 1,761 metabolites. The conducted research was the first comparative analysis providing phytochemical profiling of different extracts obtained from raw potato leaf materials. steroidal alkaloids (solanidine, α-chaconine and solanine) were identified as the major compound responsible for antimicrobial activity, especially, solanidine was found to content with a relatively high level. Therefore, untargeted metabolomics can comprehensively reveal the types and relative contents of these metabolites, providing a scientific basis for the development of anti-inflammatory, anticancer, and antibacterial functional components.
Through untargeted detection and comparison of the CHW_vs_TQW groups for all the obtained metabolites, 800 significantly different metabolites were screened, whereas 960 metabolites were not significantly different. The metabolites with significant differences were mainly amino acids and derivatives, organic acids, benzene and substituted derivatives and lipids. The metabolites with no significant difference and relatively higher contents were mainly lipids, steroidal alkaloids (solanidine, α-chaconine and solanine). The purification process showed no significant effect on the content of the main component. The purified extract can be fully applied to agricultural, medical, and other industrial products.
Potatoes are rich in nutrients and contain a variety of active ingredients, making them an important source of various active components in the human diet [33]. If the various effective components of potatoes can be extracted, separated, and utilized, they can have greater health benefits. Current research on the extraction of bioactive components from potato tubers has focused mainly on polysaccharides, proteins, and polyphenols, which have relatively high contents and mature extraction methods. However, research on the active components of potato leaves was limited. The results of this study show that steroidal alkaloids, especially solanidine, α-chaconine, and solanine are the primary bioactive compounds in the leaves. These secondary metabolites have antibacterial, antitumor, cholesterol-lowering, antimalarial, anti-inflammatory, cardiotonic, anti-inflammatory, and analgesic effects [34,35]. Researchers have demonstrated that α-solanine and α-chaconine have inhibitory effects on the proliferation of HCT-8 tumor cells and that the 6-OH of the glycoside alkaloid sugar chain was crucial for its antitumor effect [36]. The application of potato glycoalkaloids to treat phlebitis caused by tumor drugs has shown that these compounds have anti-inflammatory effects [37]. Terpenoids also have anti-inflammatory, antibacterial, and anticancer effects [38,39]. Terpenoids in potatoes, especially sesquiterpenes, have good cytotoxic and antitumor effects [40]. Song et al. [41] evaluated the in vitro antiviral activity of pentacyclic triterpene glycosides in potatoes on the basis that terpenoids can inhibit the recognition and binding of hemagglutinin (HA) protein to sialic acid receptors on the surface of host cells and reported that the antiviral activity of ursane-type pentacyclic triterpene glycosides were the strongest. In this study, high contents of terpenoids, including isopimaric acid, chlorin e6 iphosphate and α-hederin, were detected in the extracts of potato leaves. Recently, a non-targeted metabolite profiling of potato leaves carried out using HPLC-ESI-QTOF-MS, tentatively identified 109 compounds, including organic acids, amino acids and derivatives, phenolic acids, flavonoids, iridoids, oxylipins and other polar and semi-polar compounds, demonstrating that they are an important source of bioactive molecules putatively responsible for the observed antifungale ects [7,42]. Researchers believe that steroidal alkaloids and terpenoids coexist in potatoes [43], and this study also confirms this conclusion. At present, there are no systematic studies on terpenoids in potatoes, which is a future direction for the study of the active components in potatoes.
Steroidal saponins could be found in many species of the solanum, and they are an important group of natural products exhbiting a number of potent beneficent properties, such as anti-tumor, antibacterial, antifungal, anti-inflammatory, antiviral, antioxidant, hypoglycemic, and antihyperlipidemic effects [44,45]. In the study, A total of 21 steroids were detected in the extracts from potato leaves. The steroids of higher content included lanatoside C, chikusetsusaponin III, carnosifloside III, dioscin and koryoginsenoside R1 in the CHW sample, and capsicoside C, isonuatigenin, dioscin, hellebrigenin glucoside and asclepin in the TQW. The current isolation process obtained a wide variety of steroidal compounds, demonstrating that potato leaves contain abundant amounts of steroidal substances. Therefore, we conclude that steroidal compounds are also contributors to the antimicrobial bioactive substances in potato leaves.
5. Conclusions
This study comprehensively analyzed the secondary metabolites of steroidal glycoalkaloid (SGA) extracts from potato leaves. The results revealed that the SGA extracts contained 1,761 metabolites, with solanidine, α-chaconine and solanine as the main components, and that their relative contents did not significantly differ between TQW and CHW. In the overall analysis of the metabolites, the majority (960 metabolites), including alkaloids, terpenoids, and steroids, exhibited no significant differences. We conclude that all these compounds may be contributors to the antimicrobial bioactive substances in potato leaves. However, we cannot exclude the contribution in the disease control mechanisms of other undetected metabolites. Future experiments are necessary to demonstrate the resistance of these compounds against pathogenic bacteria. Taken together, the results of this study provide critical data for the development of bioactive compounds from potato leaves, contributing to the optimization of production and harvesting processes and increasing the economic value of potatoes for medicinal or natural crop protection agents.
Supplementary Materials
The following supporting information can be downloaded at the website of this paper posted on Preprints.org.
Author Contributions
Conceptualization, Y.C. and Y.F.; methodology, Y.H.; software, Y.H.; validation, Y.C. and Y.F.; formal analysis, Y.C.; investigation, Z.Z.; resources, R.X.; data curation, J.F.; writing—original draft preparation, Y.C.; writing—review and editing, Y.F.; visualization, Y.C. and Y.F.; supervision, R.W. and X.X.; project administration, L.N.; funding acquisition, L.N. All authors have read and agreed to the published version of the manuscript.
Funding
This study was supported by the Inner Mongolia Science and Technology Project (2024MS03036) and the Inner Mongolia Agriculture and Animal Husbandry Innovation Foundation (2022CXJJN07).
Data Availability Statement
The data presented in this study is available on request from the corresponding author.
Conflicts of Interest
The authors declare no conflicts of interest.
References
- Aqil F., Ahmad I. Broad-spectrum antibacterial and antifungal properties of certain traditionally used Indian medicinal plants. World J. Microbiol. Biotechnol. 2003; 19:653-657. [CrossRef]
- Pane C., Francese G., Raimo F., Mennella G., Zaccardelli M. Activity of foliar extracts of cultivated eggplants against Sclerotinia lettuce drop disease and their phytochemical profiles. Eur. J. Plant Pathol. 2017, 148:687-697. [CrossRef]
- Pane C., Fratianni F., Raimo F., Nazzaro F., Zaccardelli M. Efficacy of phenolic-rich extracts from leaves of pepper landraces against Alternaria leaf blight of tomato. J. Plant Pathol. 2017, 99:239-244.
- Xing, Y., Xue, W. J., Xu, H. D., Wang, D., Research Progress on Chemical Constituents and Biological Activities of Stems and Leaves of Potato. Science and Technology of Food Industry. 2022, 43, 457-466.
- Cárdenas P., Sonawane P., Pollier J., Vanden Bossche R., Dewangan V., Weithorn E., Tal L., Meir S., Rogachev I., Malitsky S.,Giri A.P.,Goossens A.,Burdman S., Aharoni A. GAME9 regulates the biosynthesis of steroidal alkaloids and upstream isoprenoids in the plant mevalonate pathway. Nat Commun. 2016, 7, 10654; 10.1038/ncomms10654.
- Im H.W.,Suh B.S.,Lee S.U.,Kozukue N.,Ohnisi-Kameyama M.,Levin C.E.,Friedman M. l. Analysis of phenolic compounds by high-performance liquid chromatography and liquid chromatography/mass spectrometry in potato plant flowers, leaves, stems, and tubers and in home-processed potatoes. Journal of Agricultural and Food Chemistry. 2008, 56, 3341-3349.
- Rodríguez-Pérez C.,Gómez-Caravaca A.M.,Guerra-Hernández E.,Cerretani L.,García-Villanova B.,Verardo V. Comprehensive metabolite profiling of Solanum tuberosum L.(potato) leaves by HPLC-ESI-QTOF-MS. Food Research International. 2018, 112, 390-399. [CrossRef]
- Koš´cak L., Lamovšek J., Ðermi´c E., Prgomet I., Godena S. Microbial and plant-based compounds as alternatives for the control of phytopathogenic bacteria. Horticulturae. 2023, 9, 1124.
- Jiménez-Reyes M.F., Carrasco H., Olea A., Silva-Moreno E. Natural compounds: A sustainable alternative for controlling phytopathogens. J. Chil. Chem. Soc. 2019, 64, 4459-4465.
- Kursa W., Jamiołkowska A. Wyrostek J., Kowalski R. Antifungal effect of plant extracts on the growth of the cereal pathogen Fusarium spp.—An in vitro study. Agronomy. 2022, 12, 3204.
- Stegli´nska A., Bekhter A., Wawrzyniak P., Kunicka-Styczy´nska A., Jastrz abek K., Fidler M., Smigielski K., Gutarowska B. Antimicrobial activities of plant extracts against Solanum tuberosum L. phytopathogens. Molecules. 2022, 27, 1579.
- Al Sinani, S. S. S. & Eltayeb, E. A. The steroidal glycoalkaloids solamargine and solasonine in Solanum plants. South African Journal of Botany. 2017, 112, 253-269. [CrossRef]
- Cárdenas P.D.,Sonawane P.D.,Heinig U.,Bocobza S.E.,Burdman S.,Aharoni A. The bitter side of the nightshades: Genomics drives discovery in Solanaceae steroidal alkaloid metabolism. Phytochemistry, 2015, 113, 24-32. [CrossRef]
- Ginzberg, I., Tokuhisa, J. G. & Veilleux, R. E. Potato steroidal glycoalkaloids: biosynthesis and genetic manipulation. Potato Researc.h 2009, 52, 1-15. [CrossRef]
- Wang W., Xiao G., Du G., Chang L., Yang Y., Ye J., Chen B. Glutamicibacter halophytocola-mediated host fitness of potato tuber moth on Solanaceae crops. Pest Manag Sci. 2022, 78, 3920-3930.
- Zhao, D.K., Zhao, Y., Chen, S.Y. & Kennelly, E. J. Solanum steroidal glycoalkaloids: structural diversity, biological activities, and biosynthesis. Natural product reports. 2021, 38, 1423-1444.
- Xiang M.L., Hu B.Y., Qi Z.H., Wang X.N.., Xie T.Z., Wang Z.J., Ma D.Y., Zeng Q., Luo X.D. Chemistry and bioactivities of natural steroidal alkaloids. Natural Products and Bioprospecting. 2022, 12, 23.
- Zhang C., Chen W., Wang B., Wang Y., Li N., Li R., Yan Y., Sun Y., He J. Potato glycoside alkaloids exhibit antifungal activity by regulating the tricarboxylic acid cycle pathway of Fusarium solani. Frontiers in Microbiology. 2024, 15, 1390269.
- Yu G., Ge X.,Wang Y.,Mo X.,Yu H.,Tan L.,Yang S. Discovery of novel terpenoids from the basidiomycete Pleurotus ostreatus through genome mining and coculture optimization. Journal of Agricultural and Food Chemistry. 2023, 71, 11110-11123.
- Akiyama R., Umemoto N., Mizutani M. Recent advances in steroidal glycoalkaloid biosynthesis in the genus Solanum. Plant Biotechnol (Tokyo). 2023, 40, 185-191. [CrossRef]
- Petrova, I., Ivanova-Petropolus, V. & Koleva-Gudeva, L. HPLC-DAD method for analysis of glycoalkaloids ALPHA-SOLANINE and ALPHA CHACONINE in conventional potato. Agriculture and Food. 2023, 11, 312-320. [CrossRef]
- Nie, L.Z., Hao, Y.T., Chang, Y., Xi, X.M., et.al. Optimization study on extraction methods of solanine in the potato peel. Journal of Northern Agriculture, 2024, 52, 47-59.
- Sebastian, B., Nicole, B., Hans H., Sebastian, W., Sebastian W., et al. Quantitation of Toxic Steroidal Glycoalkaloids and Newly Identified Saponins in Post-Harvest Light-Stressed Potato (Solanum tuberosum L.) Varieties. Journal of Agricultural and Food Chemistry. 2022, 70, 8300-8308.
- Pichersky, E. & Raguso, R. A. Why do plants produce so many terpenoid compounds? New Phytologist. 2018, 220, 692-702.
- Aharoni, A., Jongsma, M. A. & Bouwmeester, H. J. Metabolic engineering of terpenoids in plants. Trends Plant Sci. 2005, 10, 594-602. [CrossRef]
- Balahbib A.,El Omari N.,Hachlafi N.E.,Lakhdar F.,El Menyiy N.,Salhi N.,Mrabti H.N.,Bakrim S.,Zengin G., Bouyahya A. Health beneficial and pharmacological properties of p-cymene. Food Chem Toxicol. 2021, 153, 112259. [CrossRef]
- Putta S.,Yarla N.S.,Kilari E.K.,Surekha C.,Aliev G.,Divakara M.B.,Santosh M.S.,Ramu R.,Zameer F.,Mn N.P., Chintala R.,Rao P.V.,Shiralgi Y.,Dhananjaya B.L. Therapeutic Potentials of Triterpenes in Diabetes and its Associated Complications. Curr Top Med Chem. 2016, 16, 2532-2542. [CrossRef]
- Xu C., Xia B., Zhang Z., Lin Y., Li C., Lin L. Research progress in steroidal saponins from the genus Polygonatum: chemical components, biosynthetic pathways and pharmacological effects. Phytochemistry. 2023, 213, 113731.
- Palmer-Young E.C., Sadd B.M., Irwin R.E., Adler L.S. Synergistic effects of floral phytochemicals against a bumble bee parasite. Ecol. Evol. 2017, 7:1836-1849. [CrossRef]
- Zeng S.L., Duan L., Chen B.Z., Li P., Liu E.H. Chemicalome and metabolome profiling of polymethoxylated flavonoids in Citri Reticulatae Pericarpium based on an integrated strategy combining background subtraction and modified mass defect filter in a Microsoft Excel Platform. J. Chromatogr. A. 2017, 1508, 106-120.
- Taihua M.U., Penggao L.I. Bioactive components of potato and their functions. Food Science. 2016, 37, 269-276.
- Friedman M., McDonald G.M. Potato glycoalkaloids: Chemistry, analysis, safety, and plant physiology. Crit. Rev. Plant Sci. 1997, 16:55-132.
- Burlingame, B., Mouillé, B. & Charrondiere, R. Nutrients, bioactive nonnutrients and anti-nutrients in potatoes. Journal of food composition and analysis. 2009, 22, 494-502.
- Friedman, M. Potato glycoalkaloids and metabolites: roles in the plant and in the diet. Journal of agricultural and food chemistry. 2006, 54, 8655-8681. [CrossRef]
- Mitchell G., Lafrance M., Boulanger S.,Séguin D.L.,Guay I.,Gattuso M.,Marsault E.,Bouarab K.,Malouin F. Tomatidine acts in synergy with aminoglycoside antibiotics against multiresistant Staphylococcus aureus and prevents virulence gene expression. Journal of antimicrobial chemotherapy. 2012, 67, 559-568. [CrossRef]
- Li S.Y. Modification of sugar chains in steroidal saponins and structure-anticancer activity relationship. Changchun: Northeast Normal University, China, 2007.
- Wang, N., Jiang, D., Zhou, C. & Han, X. Alpha-solanine inhibits endothelial inflammation via nuclear factor kappa B signaling pathway. Adv Clin Exp Med. 2023, 32, 909-920. [CrossRef]
- Chudzik, M., Korzonek-Szlacheta, I. & Król, W. Triterpenes as potentially cytotoxic compounds. Molecules. 2015, 20, 1610-1625. [CrossRef]
- Li X.J., Tang S.Q., Huang H., Luo J., Zhang X.D., Yook C.S., Whang W.K., Kim Y.C., Liu X.Q. Acanthopanax henryi: Review of botany, phytochemistry and pharmacology. Molecules. 2021, 26, 2215.
- Brindle, philip A., Kuhn, P. J. & Threlfall, D. R. Biosynthesis and metabolism of sesquiterpenoid phytoalexins and triterpenoids in potato cell suspension cultures. Phytochemistry. 1988, 27, 133-150. [CrossRef]
- Song, G., Shen X., Li S., Li Y., Fan J., Liang Q., Liu S. Inhibitory activities of 3-O-β-chacotriosyl pentacyclic triterpenoids against the entry of H5N1 influenza viruses in vitro. Chinese Pharmacological Bulletin. 2015, 12, 647-654.
- Pane C., Caputo M., Francese G., Manganiello G., Lo Scalzo R., Mennella G., Zaccardelli M. Managing rhizoctonia damping-off of rocket (Eruca sativa) seedlings by drench application of bioactive potato leaf phytochemical extracts. Biology (Basel). 2020, 9, 270. [CrossRef]
- Kuc, J. Steroid glycoalkaloids and related compounds as potato quality factors. American Potato Journal. 1984, 61, 123-139. [CrossRef]
- Yassin N., Melek F., Selim M., Kassem I. Pharmacological activities of saponin containing fraction derived from Gleditsia caspica Desf. methanolic fruit extract. Der Pharm. Lett. 2013, 5, 247-253.
- Yan L., Zhang Y., Gao W., Man S., Wang Y. In vitro and in vivo anticancer activity of steroid saponins of Paris polyphylla var. yunnanensis. Exp. Oncol. 2009, 31, 27-32.
Figure 1.
Total ion chromatogram (TIC) overlay plot of QC sample(a,b) in mass spectrometry analysis by LC-MS/MS detection. a. maps- positive. b, maps- negative.
Figure 1.
Total ion chromatogram (TIC) overlay plot of QC sample(a,b) in mass spectrometry analysis by LC-MS/MS detection. a. maps- positive. b, maps- negative.
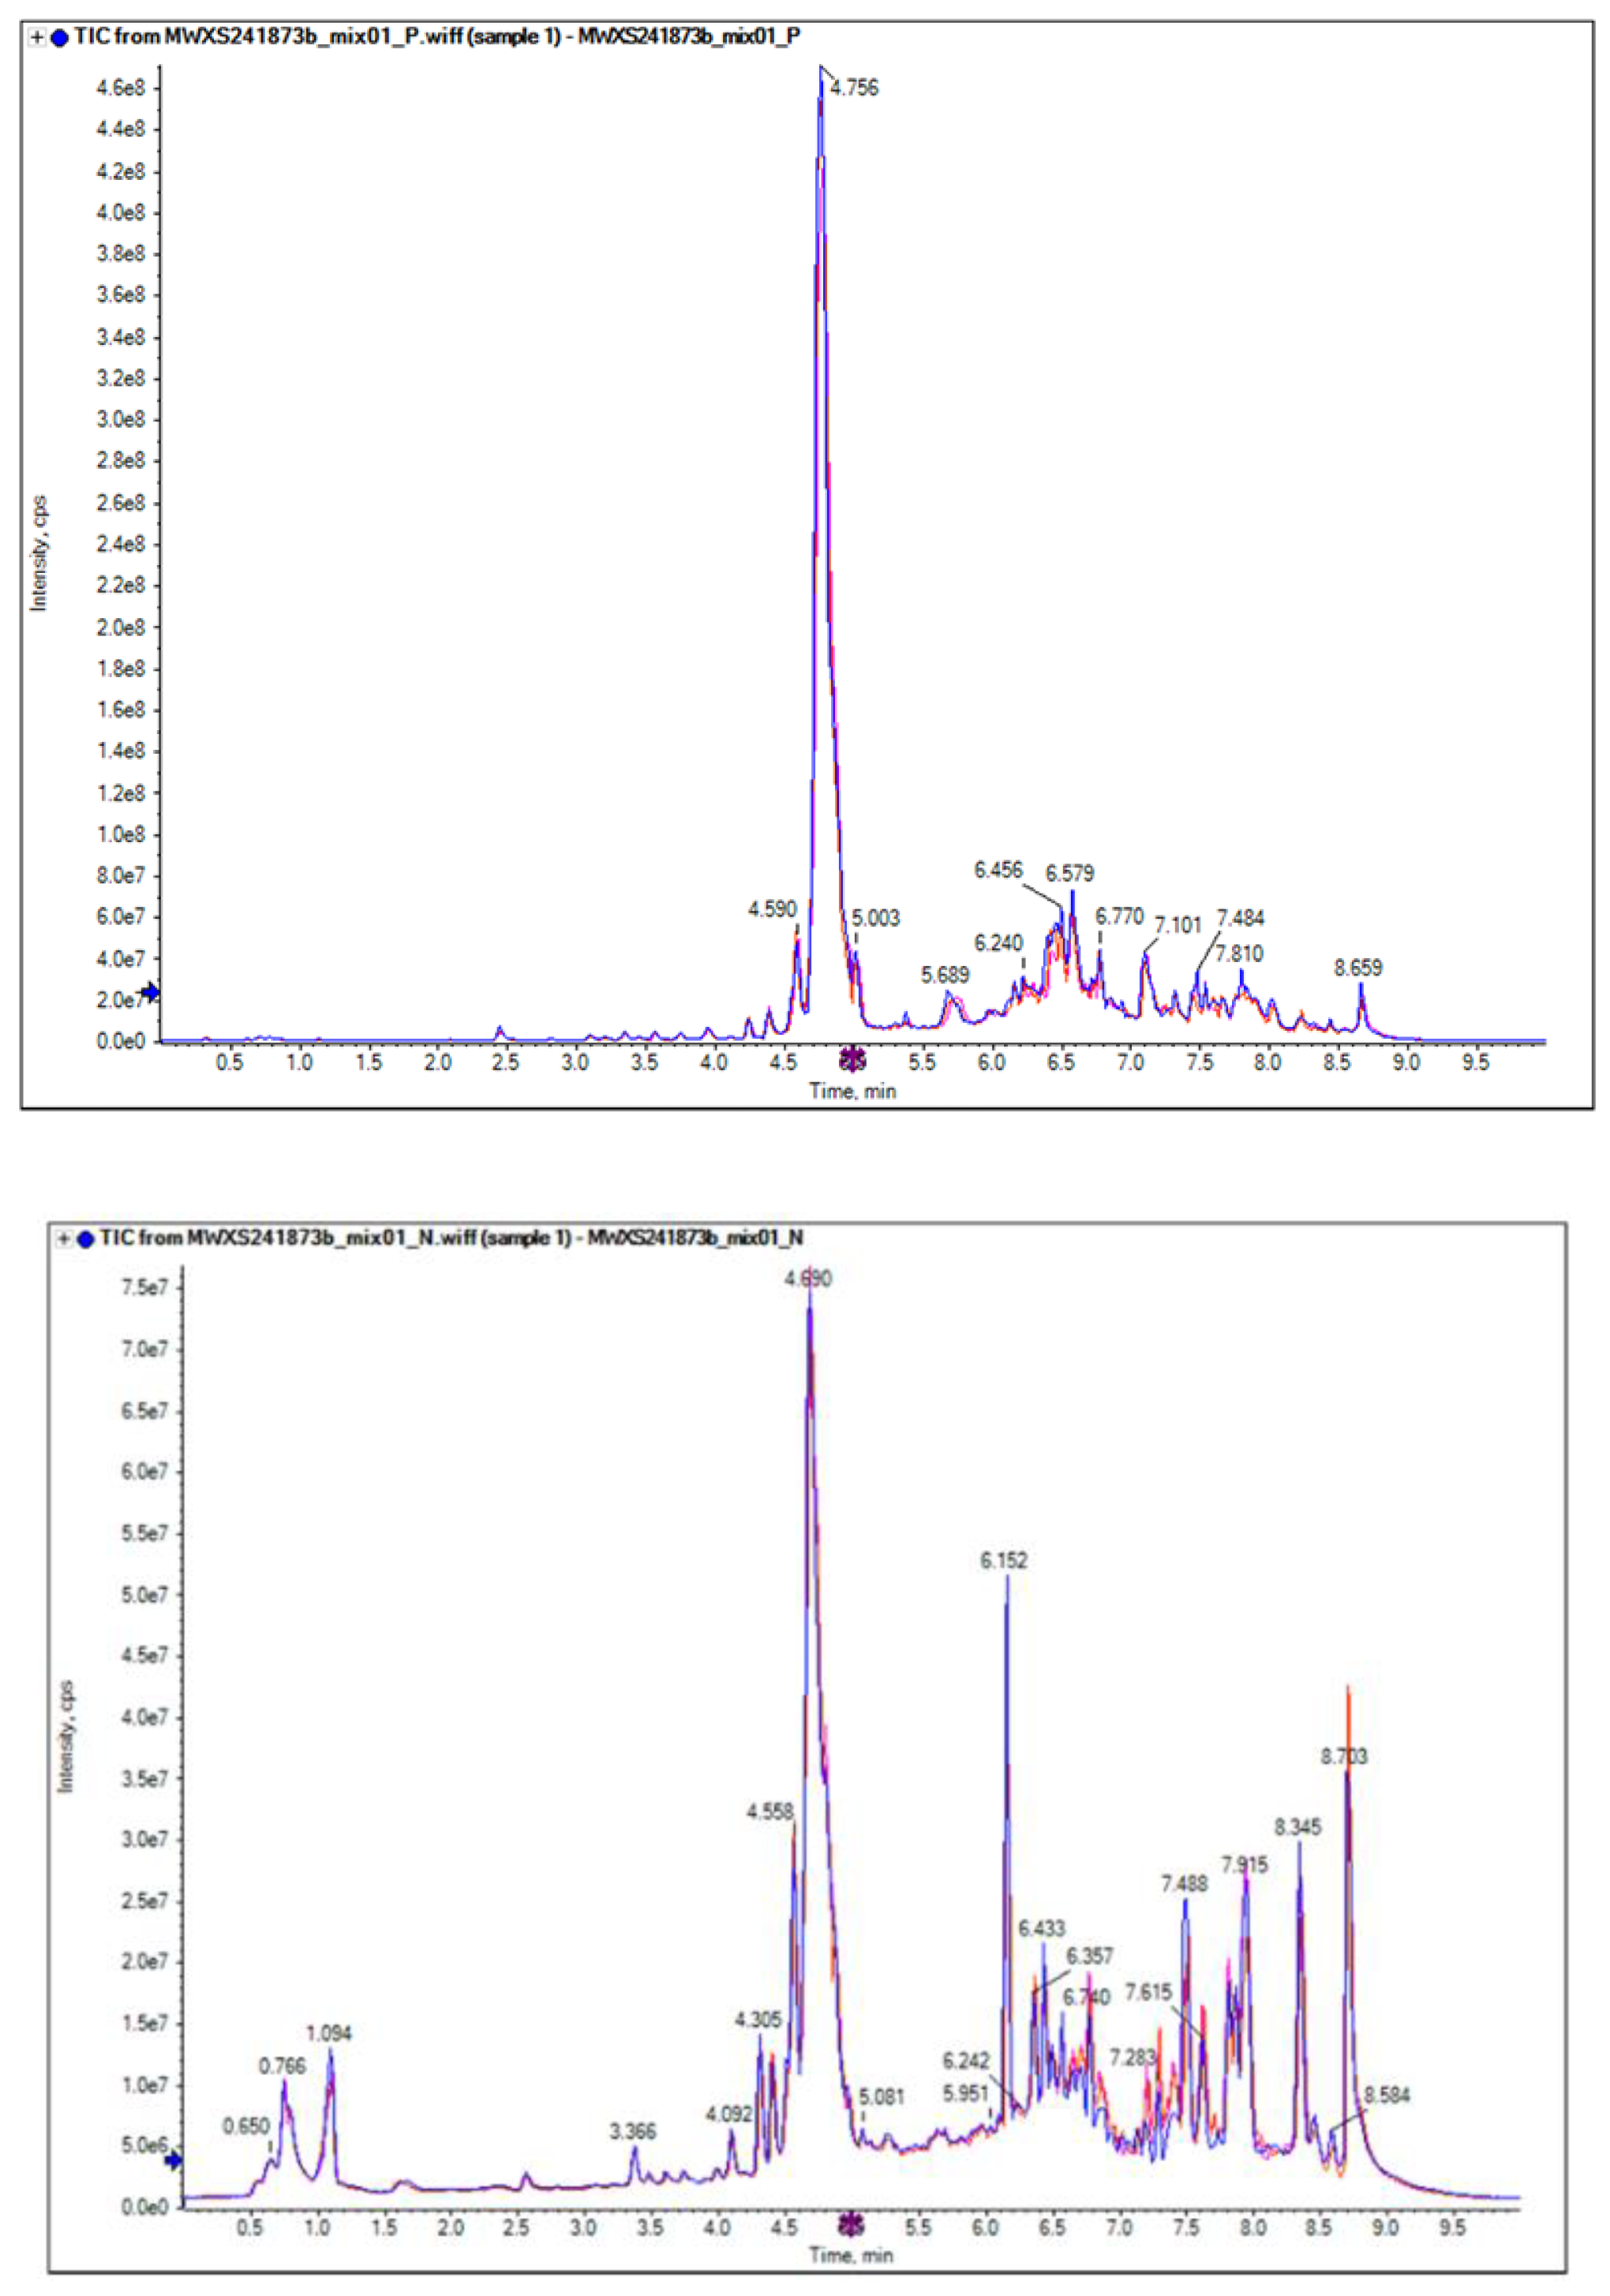
Figure 2.
Extracted ion chromatogram (EIC) of blank samples(a,b) in mass spectrometry analysis by LC-MS/MS detection. a. maps- positive. b, maps- negative.
Figure 2.
Extracted ion chromatogram (EIC) of blank samples(a,b) in mass spectrometry analysis by LC-MS/MS detection. a. maps- positive. b, maps- negative.
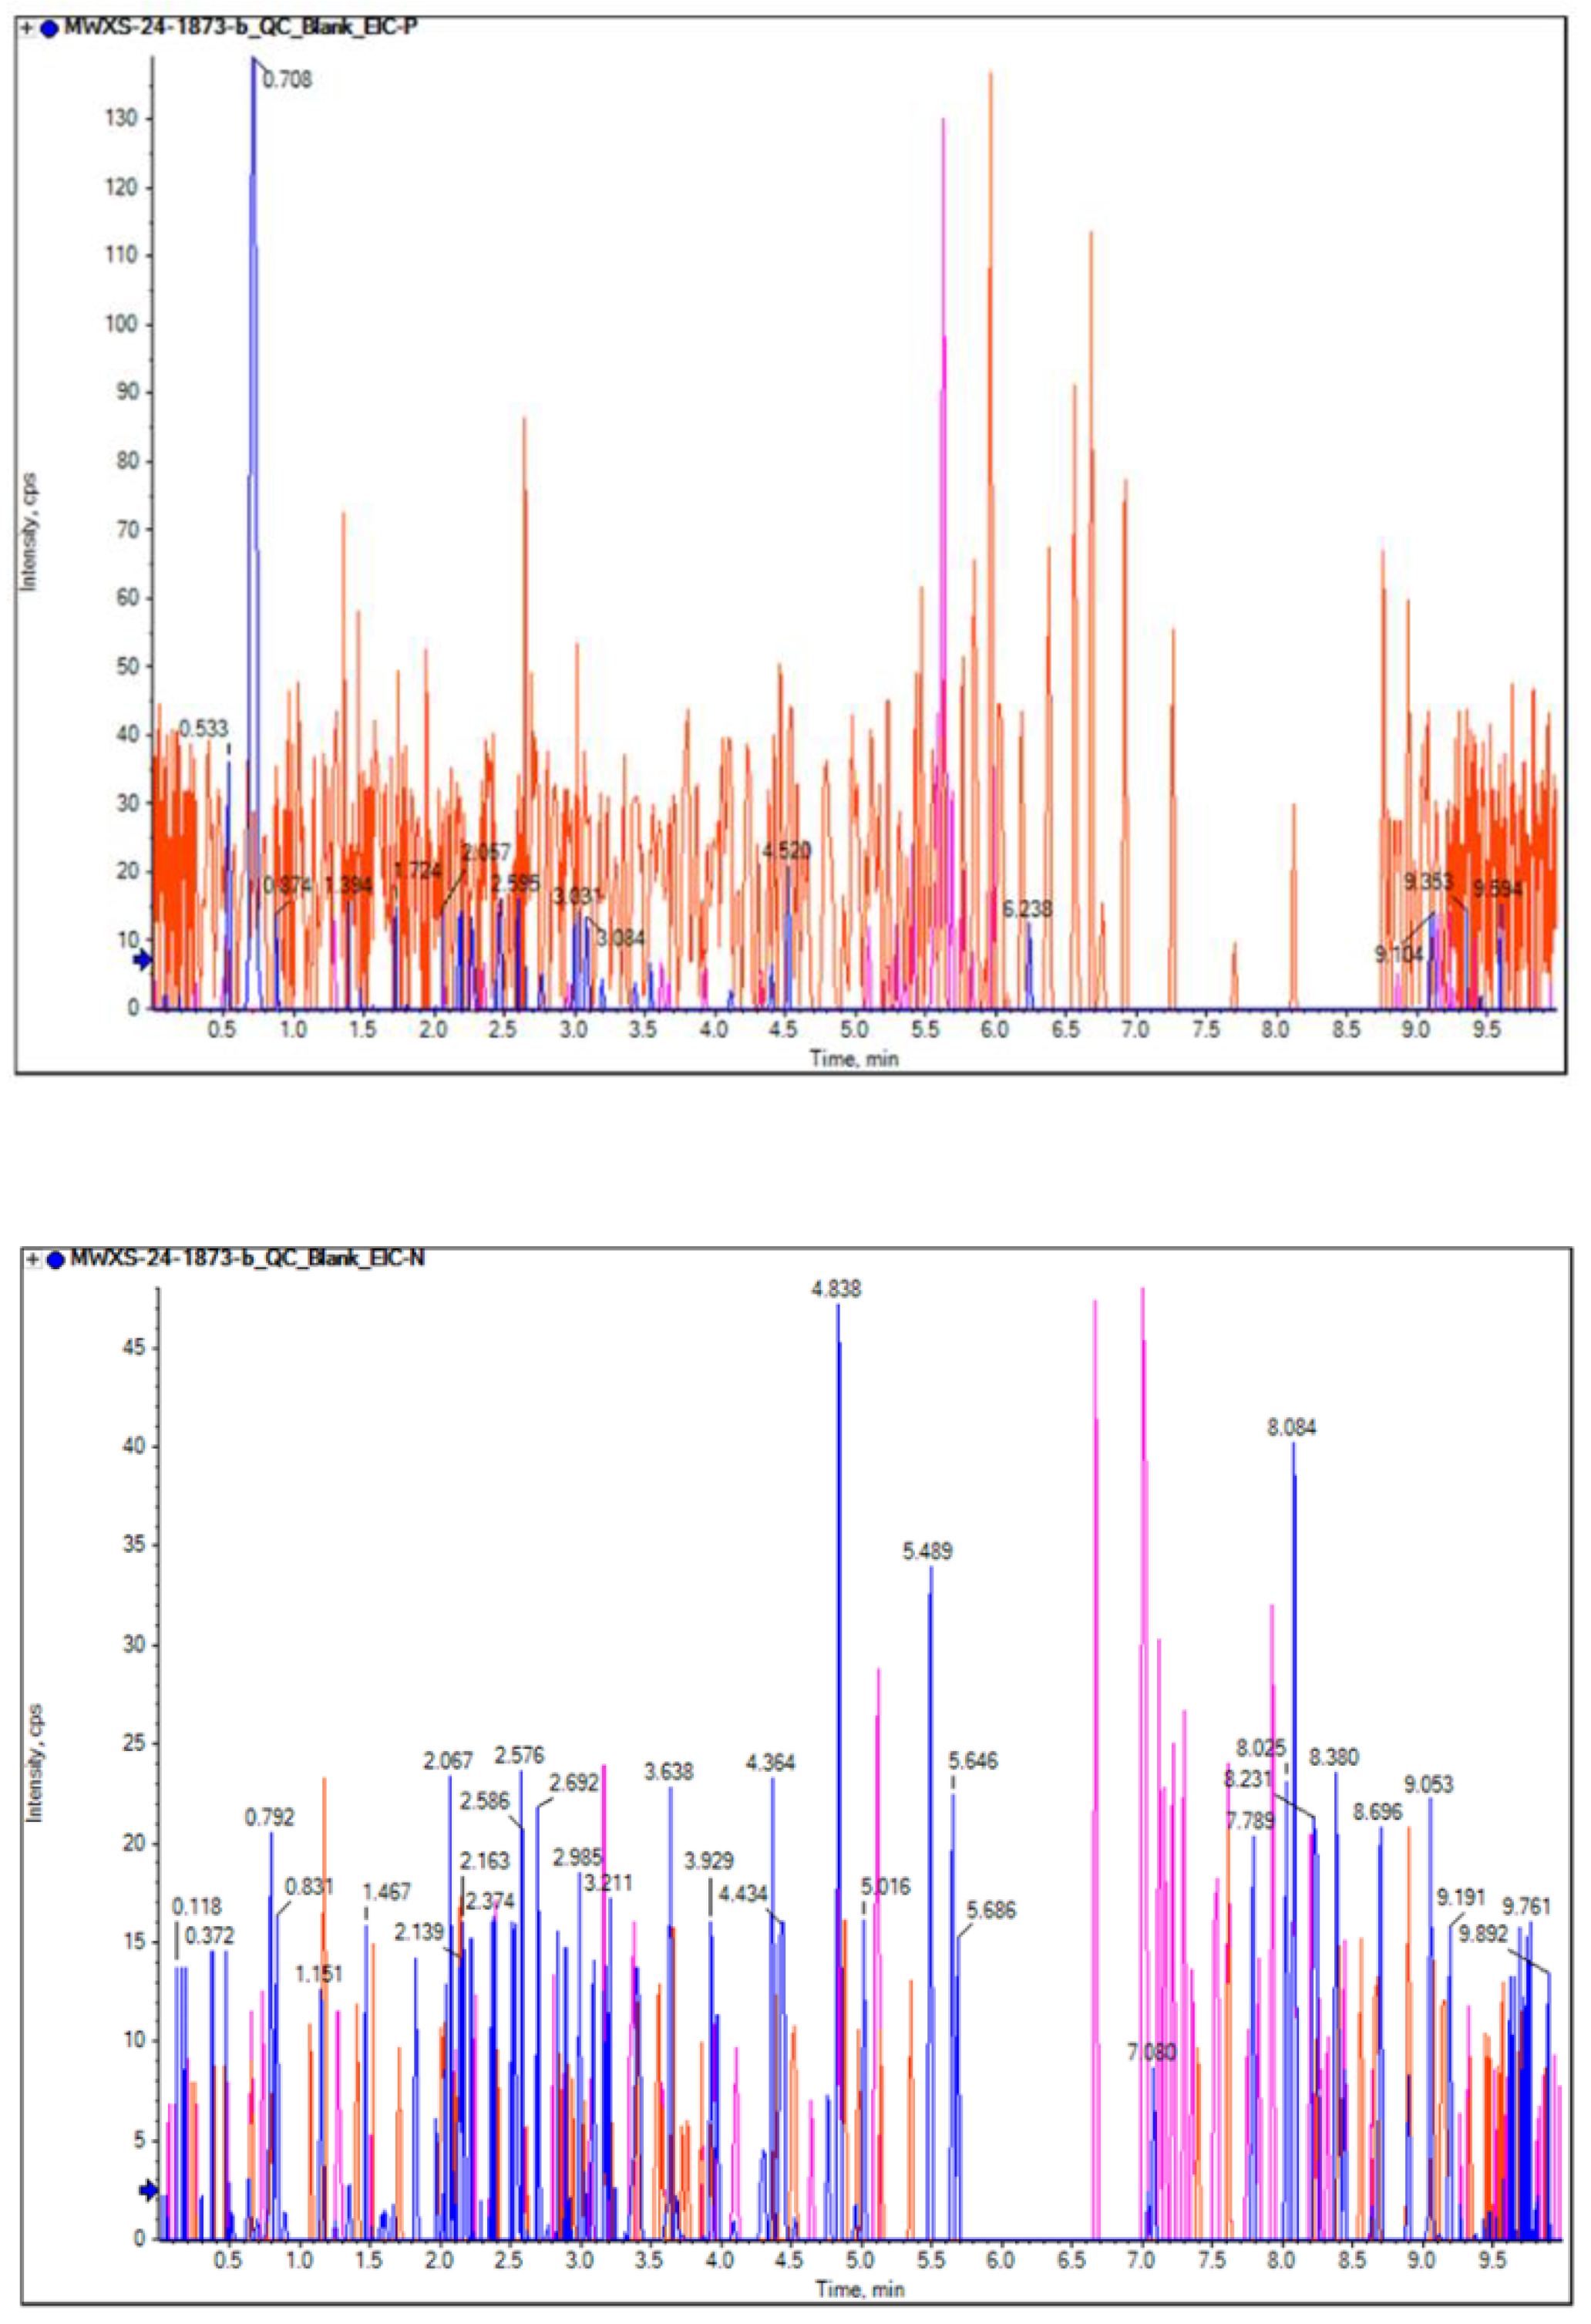
Figure 3.
Correlation analysis plot of quality control (QC) samples for the two samples with three biological replicates by LC-MS/MS. The chart shows the correlation matrix of QC samples (QC01, QC02, QC03). The lower left square of the diagonal line is the correlation scatter plot of the corresponding QC samples, the horizontal and vertical coordinates are the metabolite contents (with Log treatment), and each point in the plot represents one metabolite; the upper right square of the diagonal line is the Pearson correlation coefficient of the corresponding QC samples (e.g., the correlation coefficient between QC01 and QC02 is 0.9989).
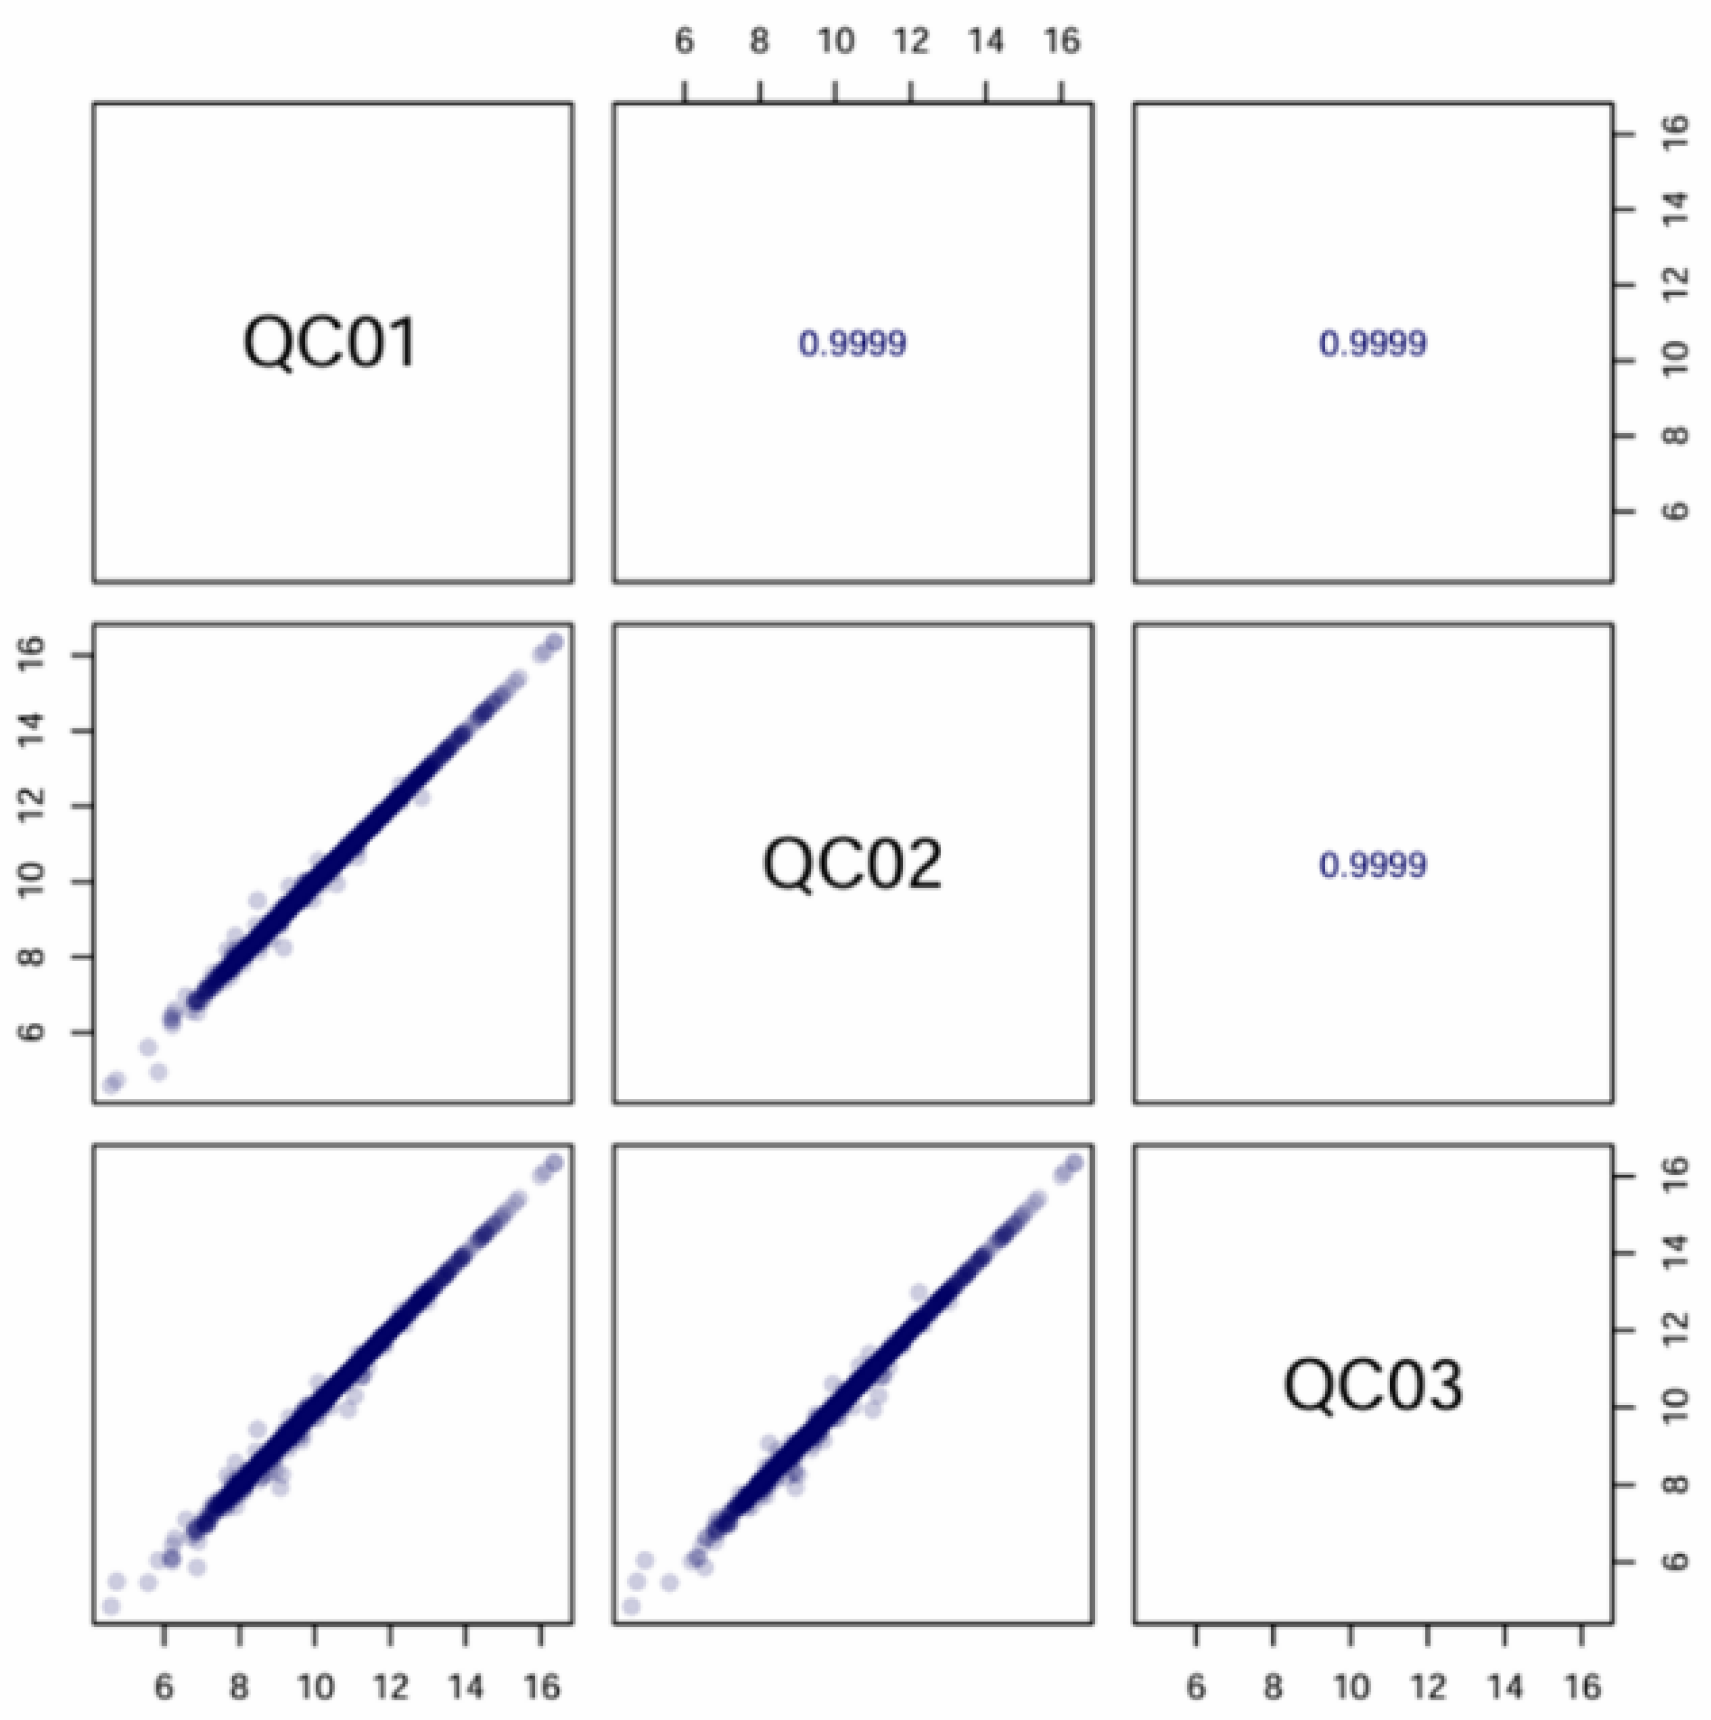
Figure 4.
PCA analysis of metabolites (a) and CV distribution diagram of samples (b) for the two samples. a. PC1 denotes the first principal component, PC2 denotes the second principal component, and the percentage denotes the rate of explanation of the data set by this principal component. b. The horizontal coordinate represents the CV value, and the vertical coordinate indicates the proportion of the number of substances smaller than the corresponding CV value to the total number of substances, with different colors representing different grouped samples, and QC is the quality control sample, in which the two reference lines perpendicular to the X-axis correspond to CV values of 0.3 and 0.5, and the two reference lines parallel to the X-axis correspond to the number of substances accounting for 75% and 85% of the total number of substances.
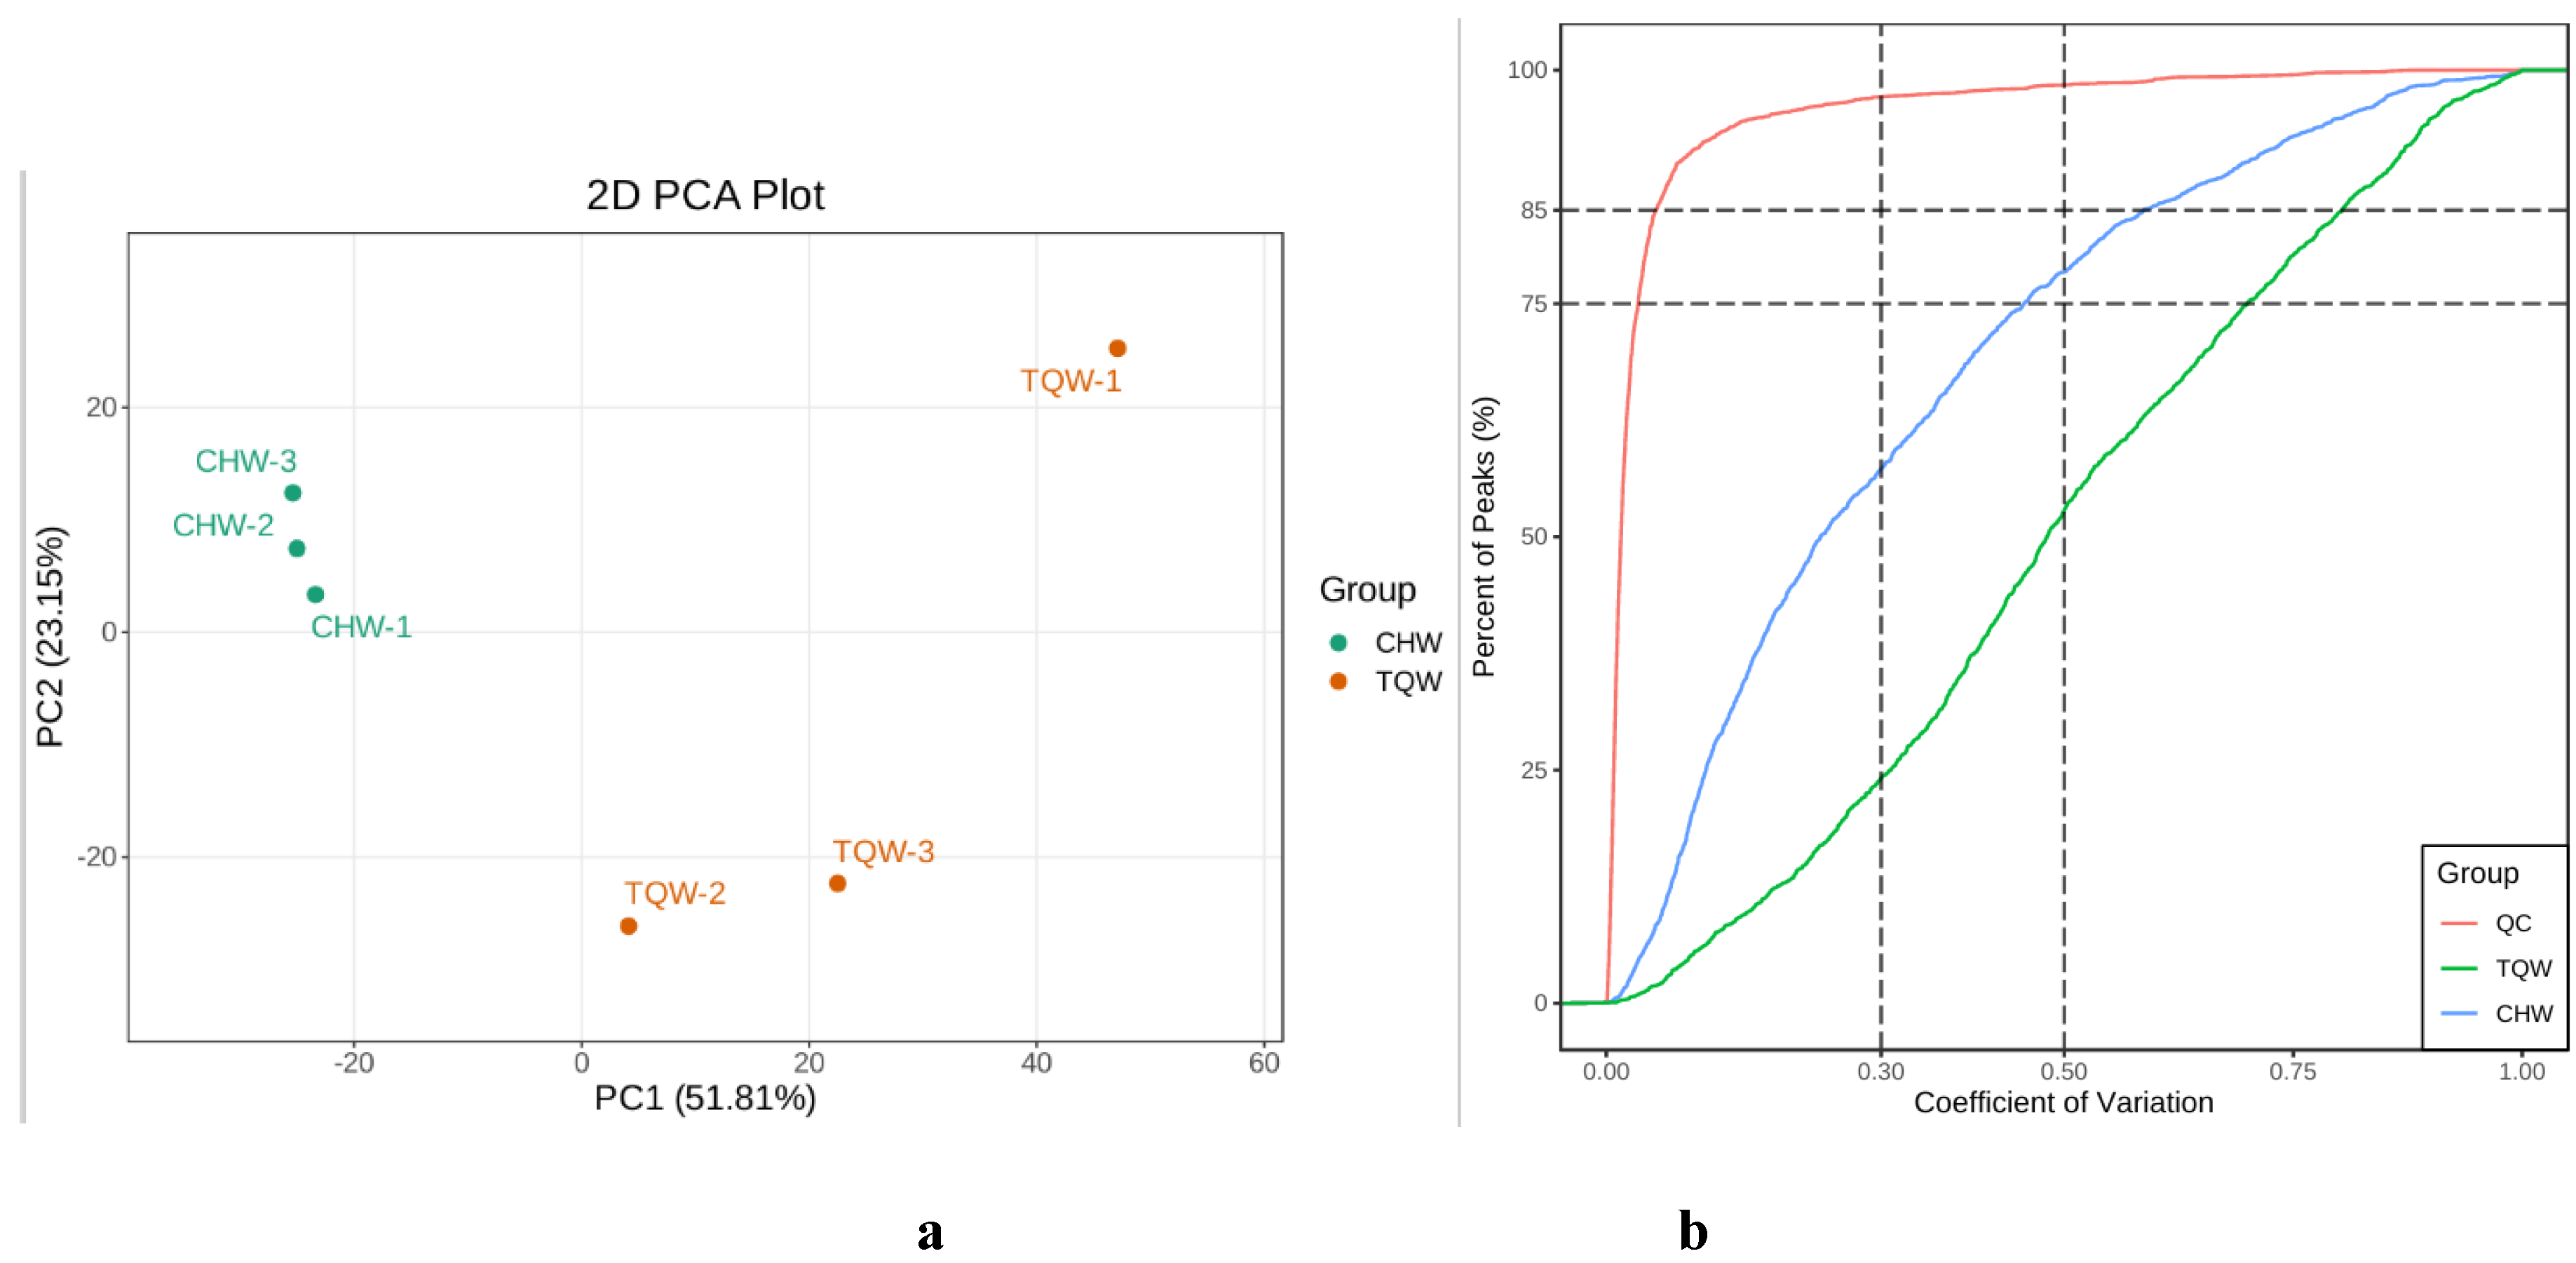
Figure 5.
An overview of the principal component analysis results for the CHW and TQW samples. a. PCA of metabolites for two samples with three biological replicates. The horizontal axis represents the predictive principal components, indicating intergroup differences in this direction. The vertical axis represents the orthogonal principal components, reflecting intragroup variations in this direction. The percentages indicate the contribution of each component to the dataset. Different colors represent different samples. b. Evaluation parameters of OPLS-DA models. R2X and R2Y represent the model's explained variance, and Q2 represents the model's predictive ability. c. Orthogonal partial least squares-discriminant analysis validation plot. X-axis: Values of the model's goodness-of-fit (R²Y) and predictive ability (Q²). Y-axis: Frequency of occurrence for classification performance metrics across 200 random permutation tests. Orange, Distribution of R²Y values from permuted (randomly shuffled) models (goodness-of-fit). Purple, Distribution of Q² values from permuted models (predictive ability). Black arrow, Actual values of the original (non-permuted) model (R²X, R²Y, and Q²).
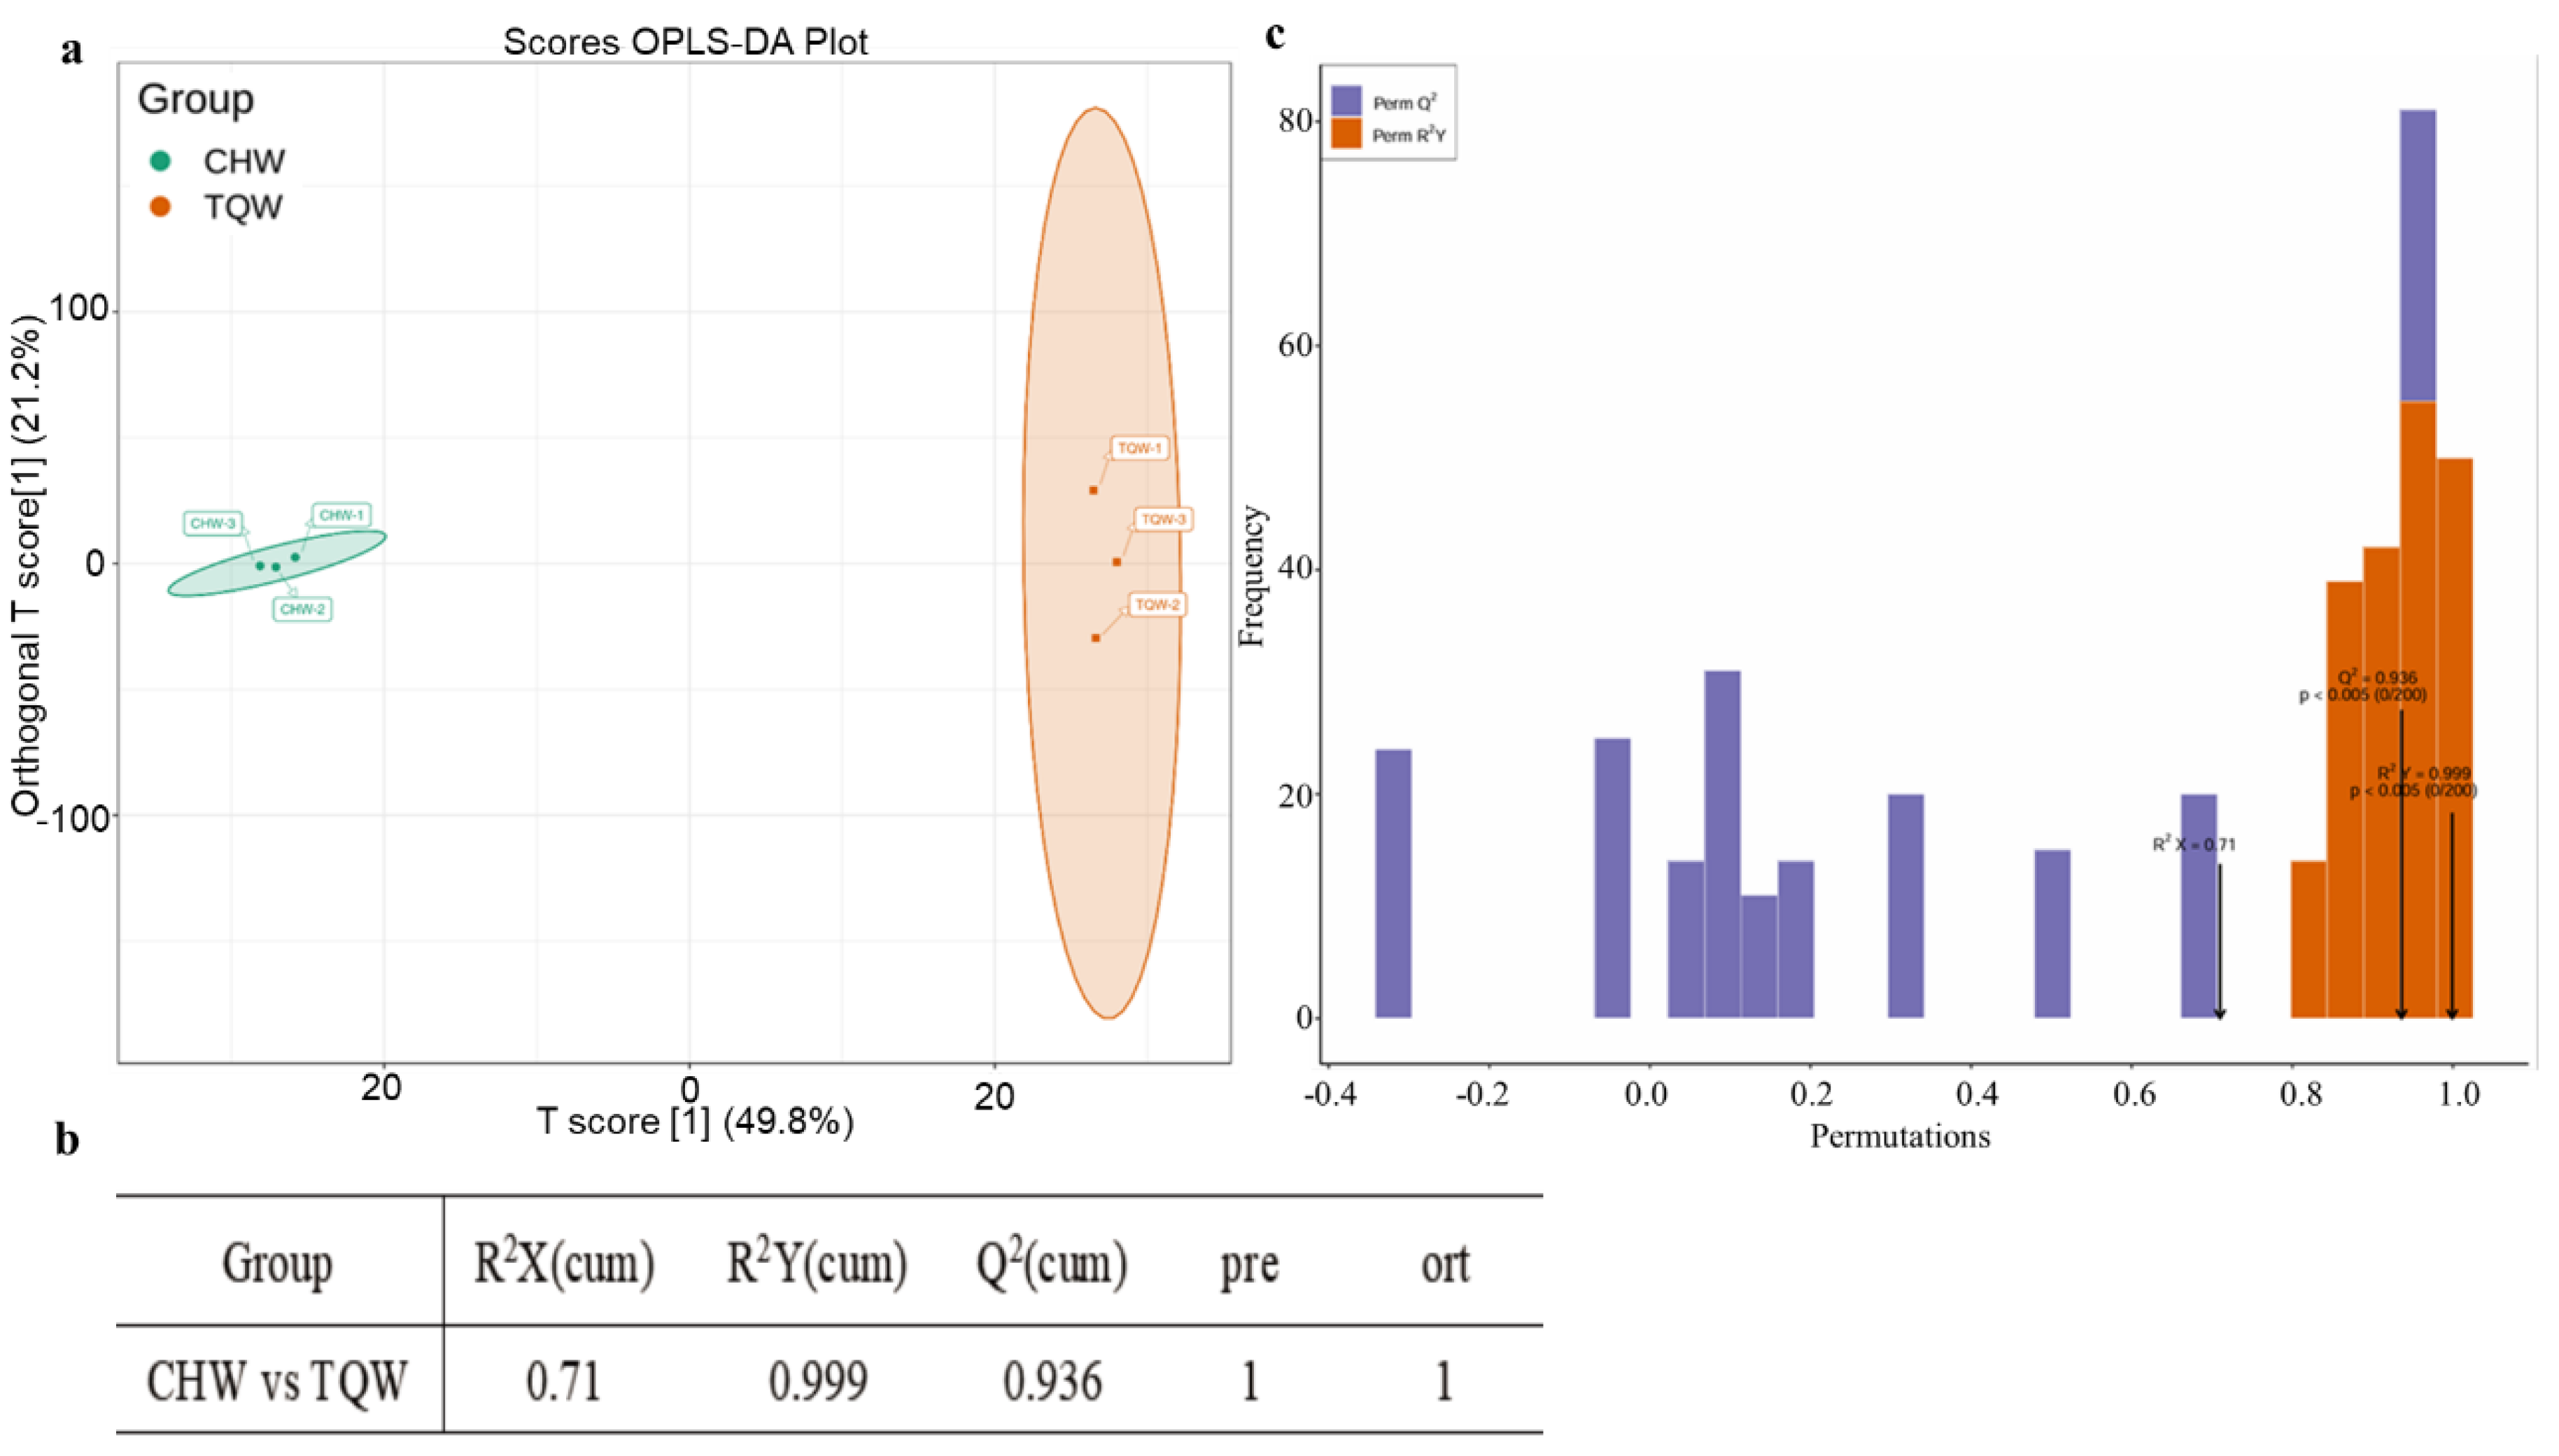
Figure 6.
Metabolites analysis among CHW and TQW samples. a. Composition analysis of metabolite classes. The colored sections in the outer ring represent the relative proportions of each class, whereas the legend on the right provides the class labels and their percentages. b. OPLS-DA S-plot. X-axis represents the covariance between principal components and metabolites; y-axis indicates their correlation coefficients. Metabolites positioned closer to the upper-right or lower-left corners demonstrate more significant differences. Red dots denote metabolites with the variable importance in projection (VIP) values >1, green dots represent those with VIP values ≤1. OPLS-DA S-plot. c. Volcano plot of DAMs in the CHW_vs_TQW compare group. The plot shows the distribution of DAMs, with the x-axis representing Log₂ (fold change) and the y-axis representing the VIP value. Red dots indicate upregulated metabolites (Up, 162), green dots represent downregulated metabolites (Down, 638), and gray dots denote metabolites with no significant change (Insignificant, 960). The vertical and horizontal dashed lines indicate thresholds for significance and fold change, respectively.
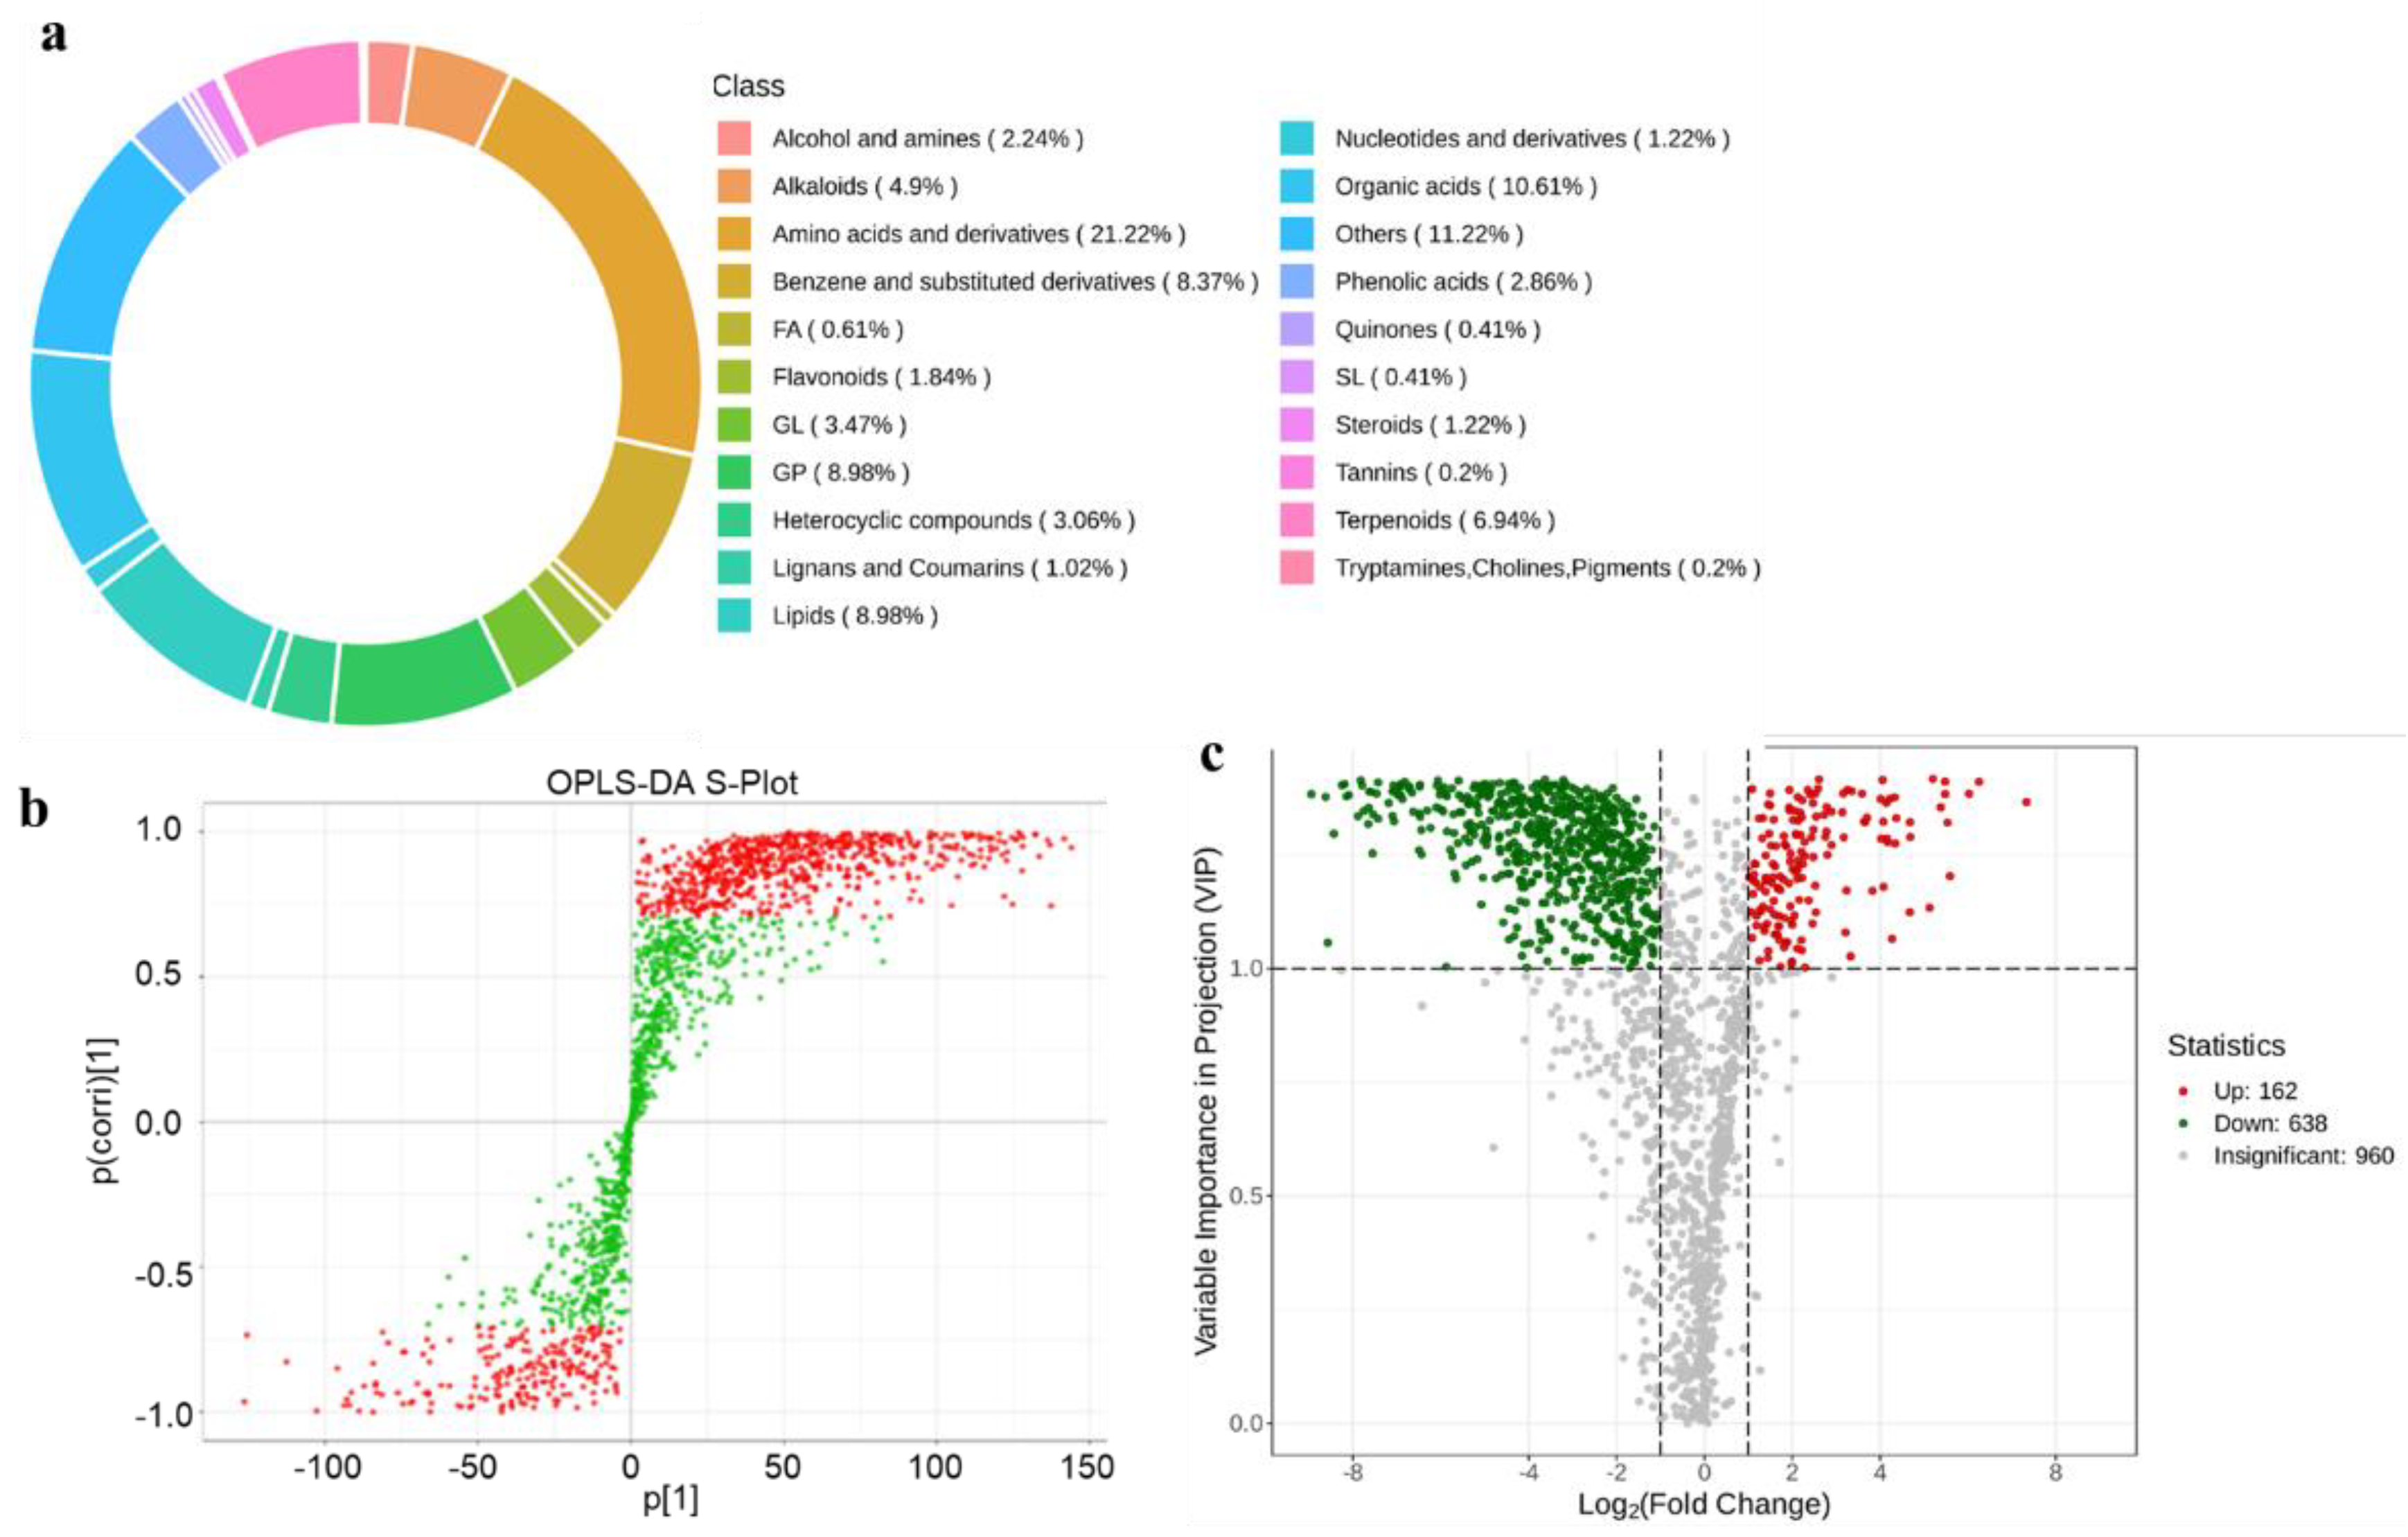
Figure 7.
Heatmap of hierarchical clustering of the DAMs. Different colors represent values obtained after standardizing the relative content, with red indicating high content and green indicating low content.
Figure 7.
Heatmap of hierarchical clustering of the DAMs. Different colors represent values obtained after standardizing the relative content, with red indicating high content and green indicating low content.
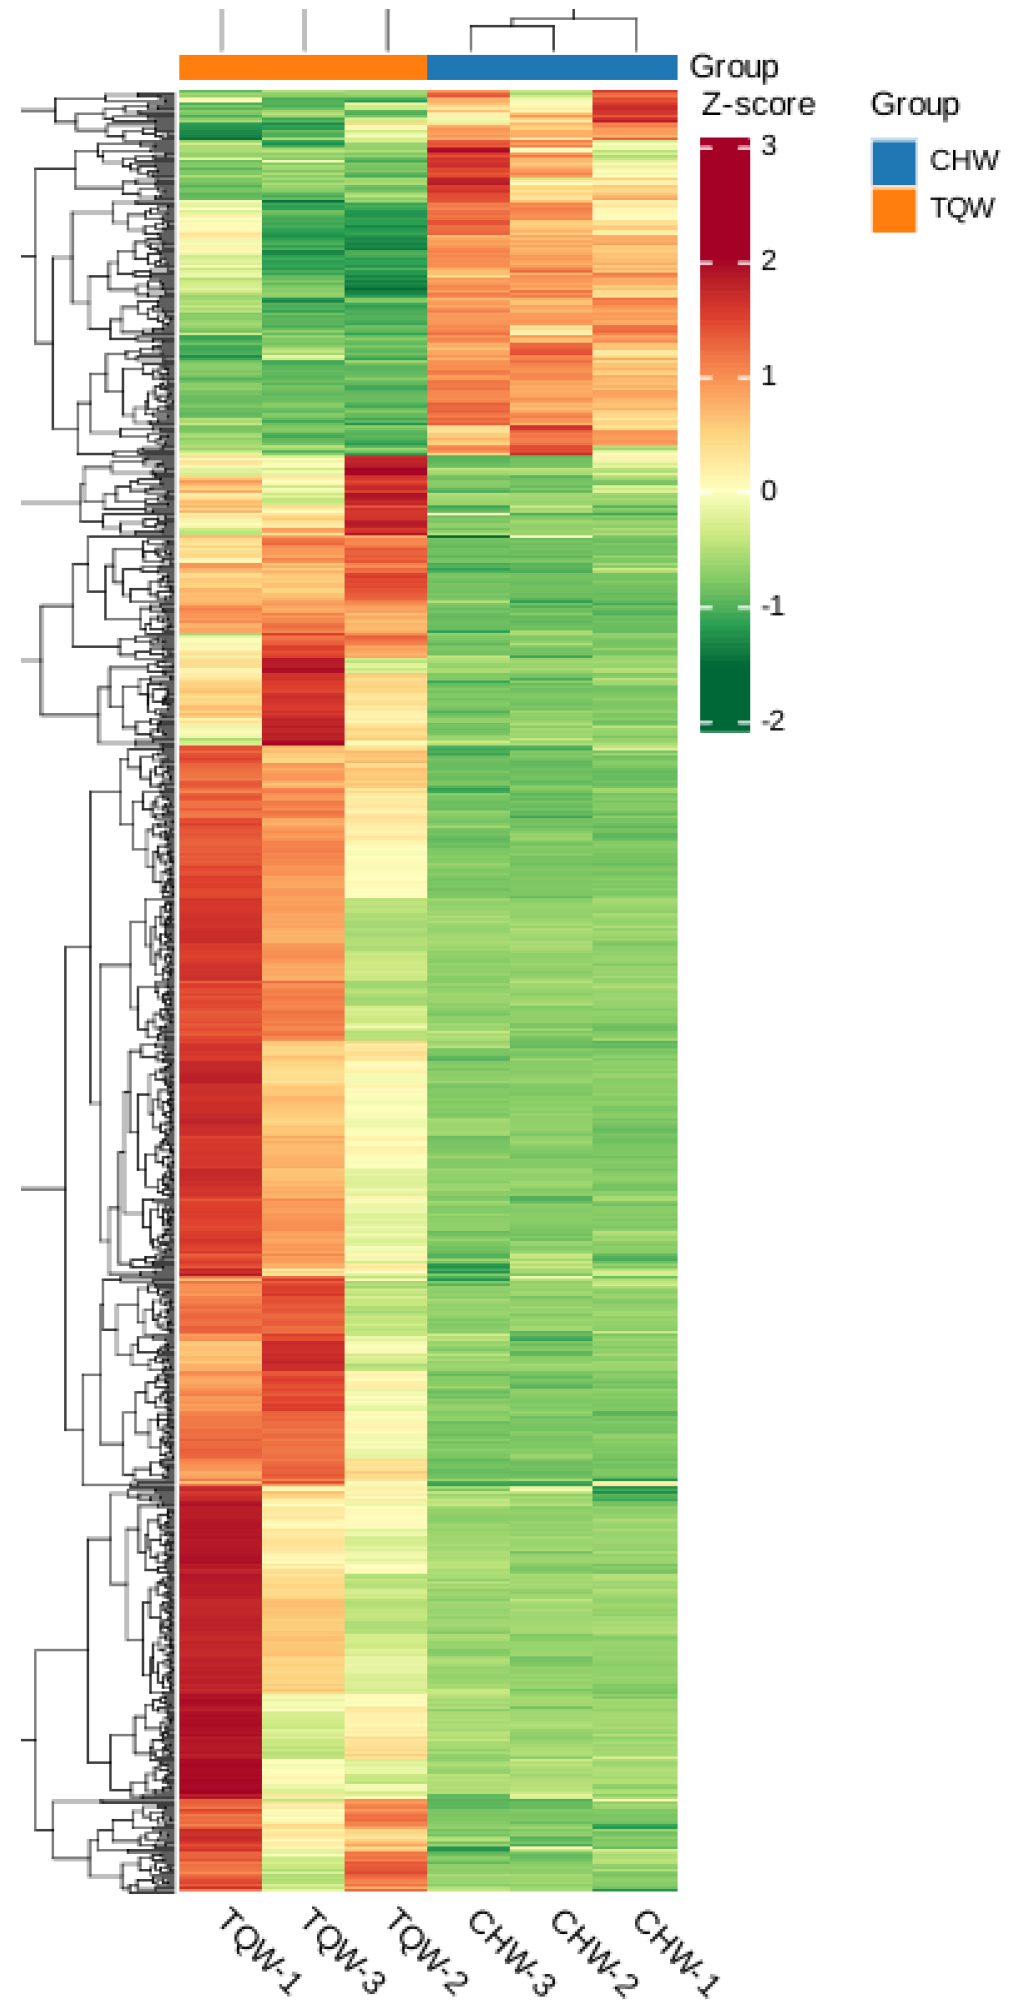
Figure 8.
Comparison of the mean relative contents of metabolites in both the TQW and CHW samples. a. steroidal alkaloids, b. Terpenes metabolites, c. Steroids metabolites.
Figure 8.
Comparison of the mean relative contents of metabolites in both the TQW and CHW samples. a. steroidal alkaloids, b. Terpenes metabolites, c. Steroids metabolites.
Disclaimer/Publisher’s Note: The statements, opinions and data contained in all publications are solely those of the individual author(s) and contributor(s) and not of MDPI and/or the editor(s). MDPI and/or the editor(s) disclaim responsibility for any injury to people or property resulting from any ideas, methods, instructions or products referred to in the content. |
© 2025 by the authors. Licensee MDPI, Basel, Switzerland. This article is an open access article distributed under the terms and conditions of the Creative Commons Attribution (CC BY) license (http://creativecommons.org/licenses/by/4.0/).
Copyright: This open access article is published under a Creative Commons CC BY 4.0 license, which permit the free download, distribution, and reuse, provided that the author and preprint are cited in any reuse.


