Submitted:
31 May 2025
Posted:
04 June 2025
You are already at the latest version
Abstract
Anthropogenic climate change is a reality driven by unrelenting global fossil fuel usage and resulting emissions. The United Nations has declared that in addition to technological solutions, enhancing climate literacy can play an essential role in advancing climate mitigation, adaptation as well as promoting wellbeing. Yet, there is a lack of empirical research showing the effects of climate education on human behavior. Here, we analyzed the effects of the climate solutions focused University of California Bending the Curve (BtC) course on: 1) climate change beliefs, 2) personal pro-environmental actions, and 3) psychological health, using baseline and post-course surveys. 374 youth (median age 21 ± 1.7 years, 63% female) participated in the study. We observed that the BtC course enhanced climate change beliefs. Specifically, at post relative to pre-course, we observed significantly increased belief that global warming will impact individuals personally as well as impact our future generations; it tripled the number of students who believe that humans can and will act to reduce global warming; it significantly increased the number of individuals who believe in a scientific basis for climate change. Notably, climate literacy also enhanced belief in the efficacy of personal climate action, and increased agreement amongst youth that many of their friends also share the same views on global warming. With regard to personal pro-environmental actions, the solutions focused education significantly improved self-reported actions including waste reduction, making food choices with reduced emissions and purchase of carbon offsets. These actions reduced carbon footprint per student at post vs. pre-course by a significant 0.3 ± 0.1 CO2 tons/year, which is equivalent to CO2 absorbed by about 15 trees per year. Psychological health outcomes did not show any significant post vs. pre-course change. Overall, our findings provide evidence that solutions-based climate education can be an important strategy to enhance individual climate change awareness as well as personal pro-environmental actions that lead to significant individual carbon footprint reduction, with potential for widespread scale-up.
Keywords:
climate change beliefs
; pro-environmental actions
; carbon footprint
; climate education
; climate solutions
1. Introduction
Anthropogenic climate change refers to the unsustainable fossil-fuel dependent human growth practices that have accelerated global warming and heightened the frequency and intensity of weather extremes and natural disasters such as wildfires, floods, and sea level rise [1]. Over the last four decades, the planet’s temperature has increased by over 0.5°C and will continue to rise with continued emissions, leading to worsening risks to health, livelihoods, food and water security, and economic costs [1]. Studies have documented the negative consequences of natural disasters and climate change related weather events not just on human physical health but also on mental health [2,3,4,5]. People affected by climate disasters suffer from higher rates of anxiety, depression, post-traumatic stress disorder, stress, sleep disruption, substance abuse, and even suicidal behaviors [6,7,8,9,10,11,12,13]. Furthermore, these physical and mental impacts can persist months to years after a climate disaster event [12]. Given accelerated warming and frequent climate disasters, there is a ‘chronic fear of environmental doom’ in the general population defined as eco-anxiety, which is particularly pronounced in youth [5,14] . Indeed, a recent survey of 10,000 youth across 10 countries confirmed that climate change is associated with climate anxiety and distress in youth globally and is threatening their health and wellbeing [15]. Given this scenario, there is an urgent need to build climate resilience including mitigation approaches that rapidly curb emissions and reduce future risks as well as adaptation approaches that protect us in the face of unavoidable climate risks [16].
The United Nations has identified climate education for the public as an essential element for building awareness and support for climate resilience globally [17]. As a result, climate change education courses have expanded to focus on both the science behind global warming as well as climate change solutions [18,19,20]. Yet, there is still a dearth of quantitative evidence to show the utility of climate change education, specifically how it changes individual behaviors [21,22]. Few prior climate education studies have been small pilots evaluating course feasibility or have focused on post-course evaluations but without baseline data, which leaves unanswered how climate education specifically shapes outcomes relative to prior knowledge [23,24,25]. Also it hasn’t been answered whether climate education, particularly solutions focused learning empowers the mental health of learners, which can be crucial in the current times of widespread climate distress [26].
Here, we conducted baseline as well as post-course evaluations for a climate solutions focused course, specifically surveying climate change beliefs, pro-environmental decision-making and psychological health. Ultimately, we aimed to gain insight into how to best stimulate individual sustainability behaviors, reduce carbon footprint, and improve personal wellbeing and resilience.
2. Methods
The study was conducted over two years in 374 students, with data primarily obtained from those enrolled in the BtC course at the University of California San Diego (UCSD) (n=370) and a handful of students enrolled at the University of California Riverside (UCR) (n=4). All students were surveyed at two time points: baseline (i.e., pre-course) and post-course. The UCSD IRB committee approved this human subject research, and all participants consented to the survey.
2.1. University Course
During the two-year study period, participation in the study was offered to every University of California student who took Bending the Curve (BtC) - a climate solutions focused course created in 2018 [27]. BtC focuses on climate change solutions to “bend the warming curve” and accelerate resilience and climate justice for our planet’s most vulnerable people. Climate resilience is the ability of an individual, family, organization, and/or community to withstand, respond to, recover, and learn from the impacts of climate change [25]. The course introduces ten solutions that fall under six categories: science, societal transformation, governance, economics, technology, and ecosystem management. Together, these foci create an integral approach to designing climate change solutions across multiple disciplines.
The BtC interdisciplinary curriculum consists of a large multimedia content library co-created by a team of researchers, educators, and designers at the University of California, and led by UC San Diego climate scientist Veerabhadran Ramanathan, UC San Diego political theorist, Fonna Forman and online education innovator, based at UC Online, Scott Friese. Uniquely, the course uses a flipped classroom teaching style where students watch pre-recorded multimedia lectures at home, recorded by dozens of researchers across disciplines, with class time dedicated to activities and discussions facilitated by the course professors and teaching assistants [28]. BtC was designed this way to enhance engagement and deepen understanding via active discussion, and to support individual learning paces.
The course is taught over one 10-15 week long quarter/semester. It is taught by thirty-nine professors and experts across the UC campuses, with expertise pertaining to different aspects of climate change solutions. The full curriculum is divided into 47 modular units, each featuring a studio-produced video lecture, assignments and in-class activities, quizzes, supplemental readings, and instructor resources. Resources also include an open-access digital textbook with dedicated chapters for each of the modules [29].
The curriculum was initially launched across five UC campuses and is now offered on seven of the nine undergraduate campuses and more than 2,000 UC students have completed the course. Further, the course is available as a massive online open course (MOOC), and has been licensed by six other universities, and other institutions that prioritize climate education for its members and students, including the American Medical Association [30], the One Health Workforce Academies [31] and most recently, the Los Angeles Unified School District.
2.2. Surveys
A set of surveys was delivered at two time points – pre (within the first week of the start of the course) and post (during the last week of course completion) -- using the online HIPAA-compliant Research Electronic Data Capture (REDCap) quantitative survey system. The surveys were divided into three sections, assessing (1) Climate Change Beliefs, (2) Personal Pro-environmental Actions, and (3) Psychological Health.
(1) Climate Change Beliefs (CCB). CCB was based on a published assessment [23]. It queried knowledge and beliefs about climate change and energy consumption; all questions and response summaries are shown in Results Table 2.
(2) Personal Pro-environmental Actions (PA). This survey was also based on a published assessment [23], and probed students’ individual actions to mitigate climate change; all questions and response summaries are shown in Results Table 3. Personal actions include (a) reduce-reuse-recycle practices to check the amount of personal waste produced; (b) practices to reduce energy consumption at home such as use of renewable energy and use of energy-efficient lighting; (c) dietary choices to reduce carbon emissions; (d) transportation choices with reduced emissions; and (e) purchase of carbon offsets for flights travel. Depending on the question type, responses were made either as multiple choice selection (questions 1, 2, and 4) or on a 5-point Likert scale (questions 3 and 5).
Quantitative personal action data from the PA survey was also used to calculate the approximate carbon footprint reduction relative to emissions made by an average person residing in California. Carbon footprint reduction was calculated for each individual at each time point (pre- vs. post-), per details provided in Appendix Table A1 [23]. Specifically, each personal action was correlated with a certain carbon footprint reduction from the norm that was used to calculate overall carbon footprint reduction at pre- and post- time points. Percentage carbon footprint reduction was also calculated for each personal action at both pre- and post- time points. This percentage was assessed as the relative contribution of each action to the overall carbon footprint reduction for each student. The percentage reduction attributable to each action was calculated such that the combined total across all five actions summed to 100% for each student.
(3) Psychological Health. Three standard surveys were used to probe psychological health, specifically the Short Warwick-Edinburgh Mental Wellbeing Scale (SWEMWS) [32] was used to assess well-being, the Perceived Stress Scale (PSS) was used to measure psychological stress over the past month [33] , and the Brief Resilience Scale (BRS) was used to assess participants’ ability to bounce back from stressors, i.e., their stress resilience [34].
2.3. Data Analyses
Data were analyzed using JASP, MATLAB, Jupyter notebook, and Google sheets. Pre vs. post-course survey data were not normally distributed, hence, were summarized as median and median absolute deviation (MAD) of responses across all subjects. Percent responses for each response category were also calculated. Pre vs. post-course data were statistically compared using the nonparametric sign-rank test with false discovery rate (fdr) corrections applied for multiple comparisons.
3. Results
3.1. Demographics
Students’ demographic data are shown in Table 1. A total of 374 students completed both pre and post surveys.

Table 1.
Demographics of youth participating in the Bending the Curve Climate solutions course during 2023-2025. mad: median absolute deviation.
Table 1.
Demographics of youth participating in the Bending the Curve Climate solutions course during 2023-2025. mad: median absolute deviation.
| Demographics | N = 374 |
|---|---|
| Age (years, median ± mad) | 21 (1.7) |
| Gender n (%) | |
| Male | 140 (37) |
| Female | 234 (63) |
| Ethnicity n (%) | |
| Caucasian | 136 (36) |
| Black/African American | 7 (2) |
| Asian | 136 (36) |
| Native Hawaiian or Other Pacific Islander | 1 (0) |
| American Indian / Alaska Native | 6 (2) |
| More than one ethnicity | 41 (11) |
| Other | 47 (13) |
3.2. Climate Change Beliefs
A summary of results of the CCB survey is provided in Table 2. Among the 8 CCB questions, 6 showed significant change in participants’ beliefs and these are illustrated in Figure 1. Specifically, CCB1 asked students if they believed climate change would impact future generations. We found that 93.3% of students believed climate change would have a great deal of impact (response option 4) after taking the BtC course in comparison with 89.8% who made this choice before taking the course.
CCB2 assessed whether students believed climate change would harm them personally. Based on our data, there was an increase of nearly 10 percentage points in the number of students who believed climate change could impact them a great deal: 33.2% to 42.8% (response option 4).
CCB3 assessed whether students believed global warming was occurring and whether humans could reduce it. We found that the number of students who believed that humans are unwilling to change their behavior decreased by more than half: 28.9% to 13.6% (response option 3). Simultaneously, the number of students who believed that humans were going to successfully reduce global warming tripled: 5.4% to 15.8% (response option 5).
CCB4 assessed whether students agreed with the following statement: “The actions of a single individual will not make any difference in global warming”. Here, we found an increase of over 12 percentage points in students who disagreed with this statement: 58.0% to 70.1% (response options 4 and 5).
Table 2.
Climate Change Beliefs (CCB) across 374 course participants. CCB question statements and responses to anchors are shown as percentages (%) of total responses, alongside pre and post median and median absolute deviation (MAD) of responses. Sign-rank p-values (P-val) comparing pre vs. post responses are shown and are fdr-corrected for multiple comparisons. Response anchors discussed in the results text are highlighted in grey.
| Statement | Not at all (1) / Only a little (2) | A moderate amount (3) | A great deal (4) | Don't know (5) | Pre Median (MAD) |
Post Median (MAD) |
P- Val |
||||
| Pre % | Post % | Pre % | Post % | Pre % | Post % | Pre % | Post % | ||||
| CCB1: How much do you think global warming will harm future generations? | 1.9 | 0.5 | 8.0 | 5.6 | 89.8 | 93.3 | 0.3 | 0.5 | 4 (0.2) | 4 (0.1) | 0.013 |
| CCB2: How much do you think global warming will harm you personally? | 12.3 | 8.3 | 53.7 | 47.9 | 33.2 | 42.8 | 0.8 | 1.1 | 3 (0.6) | 3 (0.6) | <0.001 |
| Statement | 1/2 | 3 | 4 | 5 | Pre Median (MAD) |
Post Median (MAD) |
P- Val |
||||
| Pre % | Post % | Pre % | Post % | Pre % | Post % | Pre % | Post % | ||||
| CCB3: Which of the following statements come closest to your view? | 1.3 | 0.8 | 28.9 | 13.6 | 64.4 | 69.8 | 5.4 | 15.8 | 4 (0.5) |
4 (0.3) |
<0.0001 |
| CCB3 key - 1. Global warming is not happening. 2. Humans cannot reduce global warming, even if it is happening. 3. Humans could reduce global warming, but people are not willing to change their behavior, so we are not going to. 4. Humans could reduce global warming, but it is unclear at this point, whether we will do what is needed. 5. Humans can reduce global warming, and we are going to do so successfully. | |||||||||||
| Statement | Strongly agree (1) / Somewhat agree (2) | Neutral (3) | Somewhat disagree (4) / Strongly Disagree (5) | Pre Median (MAD) |
Post Median (MAD) |
P- Val |
|||||
| Pre % | Post % | Pre % | Post % | Pre % | Post % | ||||||
| CCB4: The actions of a single individual will not make any difference in global warming. | 24.9 | 17.9 | 17.1 | 12.0 | 58.0 | 70.1 | 4 (1.0) |
4 (0.9) |
<0.0001 | ||
| CCB5: New technologies can solve global warming, without individuals having to make big changes in their lives. | 30.7 | 33.2 | 19.0 | 15.5 | 50.3 | 51.3 | 4 (1.1) | 4 (1.2) | n. s. | ||
| CCB7: I have personally experienced the effects of global warming. | 71.9 | 76.2 | 15.0 | 13.4 | 13.1 | 10.4 | 2 (0.8) | 2 (0.7) | n. s. | ||
| Statement | 1 | 2 | 3 | 4 | Pre Median (MAD) |
Post Median (MAD) |
P- Val |
||||
| Pre % | Post % | Pre % | Post % | Pre % | Post % | Pre % | Post % |
||||
| CCB6: Which of the following statements come closest to your view? (Fig. 1B) | 84.8 | 93.9 | 1.3 | 1.1 | 8.0 | 4.6 | 5.9 | 0.5 | 1 (0.6) |
1 (0.2) |
<0.0001 |
| CCB6 key – 1. Most scientists think global warming is happening. 2. Most scientists think global warming is not happening. 3. There is a lot of disagreement among scientists about whether or not global warming is happening. 4. Don't know enough to say. | |||||||||||
| None (1) | A Few (2) | Many (3) | Pre Median (MAD) |
Post Median (MAD) |
P- Val |
||||||
| Pre % | Post % | Pre % | Post % | Pre % | Post % | ||||||
| CCB8: How many of your friends share your views on global warming? | 4.3 | 1.6 | 25.4 | 24.6 | 70.4 | 73.8 | 3 (0.5) | 3 (0.4) | 0.023 | ||
CCB6 assessed students’ beliefs regarding scientific consensus about whether global warming is happening. We found an increase in the number of students who believed in the scientific consensus that global warming is occurring: 84.8% to 93.9% (response option 1).
Finally, CCB8 determined if participants’ friends shared their beliefs, and here, we found an increase of three percentage points for the category of many friends with shared beliefs at post- relative to pre-course: 70.4% to 73.8% (response option 3).
The remaining two CCB questions had insignificant changes between pre and post-course; these were CCB5: New technologies can solve global warming, without individuals having to make big changes in their lives, and CCB7: I have personally experienced the effects of global warming.
3.3. Personal Pro-Environmental Actions
The second section of the survey focused on personal pro-environmental actions to reduce carbon emissions (Table 3). Significant pre vs. post-course change was observed for 4 of 5 categories, i.e., for waste reduction, energy savings, low carbon emission food choices and purchasing carbon offsets but not for transportation emissions.
For waste reduction, buying products with less packaging was significantly reduced by 13 percentage points. In energy savings, BtC course students took many actions not listed in the survey including being mindful of energy consumption, reducing energy use in peak hours, and switching off lights and appliances with a significant 7 percentage points reduction in energy use. Regarding food choices, we found that BtC students making low emission food choices increased by about 15 percentage points. Finally, regarding carbon offsets, percentage of BtC students who sometimes, often, or always purchased offsets when flying increased by 11 percentage points. Figure 2 shows plots for the significant personal action changes.
Table 3.
Students’ Pre and Post responses for Personal Pro-environmental Actions. Response anchors that showed significant change are highlighted in grey. Sign-rank tests were applied to questions 1, 2, 4 and 2 testing was used for questions 3, 5. P-values are fdr corrected for multiple comparisons. *Other Energy Savings responses included being mindful of energy consumption, reducing energy use especially in peak hours, switching off lights and appliances in unused rooms, installing auto on/off light sensors, hang drying clothes.
| (1) Waste Reduction | Pre % | Post | P-val | |
|---|---|---|---|---|
| Recycle more often | 90.1 | 91.7 | n.s. | |
| Buy products that have less packaging | 52.4 | 65.5 | <0.001 | |
| Compost food scraps or food waste | 40.9 | 44.9 | n.s. | |
| Donate products so that they can be reused | 76.5 | 74.3 | ||
| Other | 8.8 | 7.0 | ||
| No Actions Taken | 1.3 | 1.1 | ||
| (2) Energy Savings | Pre % | Post | P-val | |
| Purchased renewable energy from utilities | 21.7 | 24.1 | n.s. | |
| Purchased energy saving appliances | 40.4 | 44.1 | ||
| Installed Solar Panels | 21.1 | 19.5 | ||
| Installed Solar hot water | 4.8 | 5.1 | ||
| Changed traditional light bulbs to energy-efficient light bulbs | 54.6 | 61.0 | ||
| Other* | 3.7 | 10.7 | <0.001 | |
| No Actions Taken | 23.5 | 20.3 | n.s. | |
| (3) Food Choices | ||||
|
Never / Occasionally |
Sometimes / Often / All the Time |
|||
| Pre % | Post % | Pre % | Post % | P-val |
| 52.1 | 37.2 | 47.9 | 62.8 | <0.001 |
| (4) Transportation Emissions | Pre % | Post | P-val | |
| Purchased a hybrid car | 18.7 | 16.8 | n.s. | |
| Carpool regularly | 45.2 | 52.7 | ||
| Purchased a more gas-efficient car | 23.8 | 24.6 | ||
| Used public transportation more often | 58.8 | 64.2 | ||
| Used a bicycle instead of a car as transportation | 17.9 | 20.1 | ||
| No Actions Taken | 16.0 | 13.4 | ||
| (5) Carbon offsets | ||||
|
Never / Occasionally |
Sometimes / Often / All the Time |
|||
| Pre % | Post % | Pre % | Post % | P-val |
| 88.0 | 76.7 | 12.0 | 23.3 | <0.001 |
3.4. Carbon Footprint
Calculation of individual carbon footprint reduction from the norm, i.e., relative to an average person in California, was based on the personal pro-environmental action survey data (Table 4). Three of the five categories of personal action showed significant carbon footprint reduction at post- relative to pre-BtC. Specifically, improvements were observed for waste reduction, food choices, and purchase of carbon offsets (Table 4).
We additionally calculated the cumulative student carbon footprint pre-BtC and post-BtC, which was 7835.7 CO2 tons/year vs. 7726.6 CO2 tons/year, respectively. Thus, we found a cumulative carbon footprint reduction of 112.1 CO2 tons/year by BtC course students. On a per student basis, our data demonstrates an average pre-BtC carbon footprint of 21.0 CO2 tons/year and a post-BtC carbon footprint of 20.7 CO2 tons/year; this equals an average reduction of 1.4% per student or 0.3 ± 0.1 CO2 tons/year.
3.5. Behavioral Changes: Stress, Resilience, and Wellbeing
The final section of the survey assessed participants’ perceived stress, wellbeing, and resilience per standard surveys. No significant changes were detected for these measures.
Table 5.
Students’ self-reported psychological health outcomes measured at pre vs. post-course. Median ± median absolute deviation (MAD) of responses are shown. There were no significant pre vs. post changes in these measures.
Table 5.
Students’ self-reported psychological health outcomes measured at pre vs. post-course. Median ± median absolute deviation (MAD) of responses are shown. There were no significant pre vs. post changes in these measures.
| Outcome | Pre (Median ± MAD) | Post (Median ± MAD) | P-val |
|---|---|---|---|
| Perceived Stress | 20 ± 4.84 | 20 ± 5.00 | n.s. |
| Wellbeing | 3.43 ± 0.46 | 3.29 ± 0.45 | |
| Resilience | 3.33 ± 0.55 | 3.33 ± 0.55 |
4. Discussion
To the best of our knowledge, this is the first study that attempts to objectively quantify the immediate impacts of a solutions-based climate education course on youth climate change beliefs and personal pro-environmental actions, as well as assess changes in psychological health. We found that the course significantly positively affected student beliefs and pro-environmental actions, and even led to significant reductions in individual carbon footprint, but with no changes in psychological health.
According to the first climate change beliefs survey, after taking the course, 93.3% of students believed climate change would greatly affect future generations. The course also increased the number of students who believed that climate change will personally affect them a great deal by 9.6 percentage points (33.2% to 42.8%). Based on our data, the course also tripled the number of students who believe that humans are going to successfully reduce global warming (5.4% to 15.8%), and more than halved the number of youth who were skeptical that humans can reduce global warming (28.9% to 13.6%). Importantly, the course also led a significant increase in number of youth who disagreed with the belief that individual actions don’t matter by 12.1 percentage points (58.0% to 70.1%). While the baseline of students who believed in a scientific basis for climate change was already high, BtC further increased the number of students who believe there is a scientific basis for global warming, 84.8% to 93.9% – an increase of 9.1 percentage points. Finally, there was also a small but significant increase in the number of students who said that many of their friends share their views on global warming, 70.4% to 73.8% - an increase of 3.4 percentage points.
Per the second survey section on personal pro-environmental actions, students reported making more environmentally conscious food choices, from 47.9% to 62.8% – an increase of 14.9 percentage points. They also contributed to waste reduction particularly by buying products with less packaging, 52.4% vs. 65.5% - an increase of 13.1 percentage points. Energy savings were made by students in the Other category, from 3.7% to 10.7% - an increase of 7 percentage points, with specific responses including being mindful of energy consumption, reducing energy use especially in peak hours, switching off lights and appliances in unused rooms, installing auto on/off light sensors, hang drying clothes etc. Finally, a significant change was also observed for purchase of carbon offsets when flying, from 12.0% to 23.3% – an increase of 11.3 percentage points.
We translated the student-reported personal actions into reduction of carbon footprint made by each student relative to an average Californian, and found that students significantly reduced their carbon footprint at post-course relative to pre-course by 0.3 CO2 tons/year on average. This reduction in emissions per person is considered to have moderate impact and is equivalent to CO2 absorbed by about 15 trees per year [35,36]. The University of California education system currently has over 295,000 students enrolled across their campuses [37]. If every student took the Bending the Curve course then at 0.3 CO2 tons/year reduction in emissions, there would be an overall CO2 reduction of over 88,500 tons per year, which is substantial and equivalent to removing annual CO2 emissions from approximately 20,000 households or 400,000 miles of driving. Based on CO2 equivalents calculations, this is also roughly equivalent to curbing the annual CO2 emissions from a medium-sized city [38], which emphasizes the importance of such climate solutions based education.
Finally, in times when the climate crisis is associated with widespread distress especially among our youth [5,14], the final section of our survey focused on psychological health, specifically probing perceived stress, well-being and resilience. We did not find any significant change in these measures. Indeed, dedicated psychosocial eco-resilience curricula may be needed to improve psychological well-being in the context of climate change [39]. To address this unmet need, the senior author recently co-led design and implementation of the “Climate Resilience” course focusing on mental health resilience offered across all University of California campuses, which showed several robust benefits to psychological well-being [26]. Yet, this required dedicated contemplative education curricula in mindfulness, empathy, compassion, active listening, nature connectedness, and other important inner resilience skills taught by expert mindfulness teachers. Built on the science of personal and social resilience and climate action, students in this course were also required to engage in a collective action project in groups, fostering a sense of belonging, and motivating empowerment and collective self-efficacy. Thus, different climate education course materials may benefit different aspects of personal action vs. personal resilience.
Overall, the Bending the Curve course that was implemented in California - a leader in climate change and sustainability policies in the USA [40] - demonstrated that education focused on climate solutions can lead to meaningful and measurable outcomes. While the study was conducted in a region with relatively high acceptance of climate change, our findings raise important questions about how such education might impact regions with greater climate skepticism. As the course is now available as a massive online open course (MOOC), future research may explore its effects in different cultural/socio-political contexts. A version of this course has now also been approved by the Los Angeles Unified School District (LAUSD), the second largest school district in the United States with over 500,000 K-12 students. It will soon be part of a content library of climate-related educational resource materials for specific LAUSD high school educators called “Climate Literacy Champions” to develop age-appropriate classroom education. This study has provided initial data that as climate change impacts more people, education, particularly when it emphasizes solutions, can be a powerful and cost-effective method at bending the emissions curve.
The study has several limitations. First, it was conducted exclusively among college-aged students, of median age 21 years (range 18-44 years), and primarily at 1 University of California campus situated in San Diego. It is not yet known how the results might generalize to students in other states, regions, or of differing ages. Second, while we can reasonably believe that the personal pro-environmental action results and reduction in CO2 emissions was driven by the BtC course given that the surveys were taken by students in the first week (pre) and last week (post) of class, without a control group we cannot completely rule out spontaneous change or other external factors. Third, the course was optional, leading to potential selection bias. If student enrollment preferentially consisted of students who had previous interest in the subject matter, then these students may have been more open to changing their behaviors and actions due to an already present awareness, investment and interest in the environment. This suggests that the findings and outcomes of the study may be biased and may not be representative of students who would not choose to enroll in such a course. Finally, it has been shown that without broader changes, for example in the physical infrastructure and political landscape, it is unclear whether changes in climate behaviors and beliefs will be sustained [20,41,42].
Despite study limitations, these outcomes provide very encouraging data and insights into how climate education, particularly solution-based education, has the possibility to be a successful and powerful strategy for carbon emission reductions. Although this education still needs to be tested on a large scale, with careful implementation and tailoring for regional/cultural relevance, such education could have wide-ranging impacts on climate change mitigation. As an example mentioned above, if the BtC course were taken by all University of California students, the emissions reduction when scaled up from the current results would be equivalent to curbing emissions of a mid-sized city. For future initiatives, we recommend to integrate climate change solutions education into all climate emissions reduction efforts. Further objective studies will be necessary to assess the impacts of such education at scale.
Acknowledgements
This study was funded by a Varela grant award made by the Mind and Life Institute (JM). We are grateful to all the students for their participation in the survey and study. We are also grateful to James Manchanda for help with study set up and initiation of data collection.
Appendix A
Appendix A1: Description of the assumptions and reductions in carbon emissions for each of the personal proenvironmental actions survey responses.
Appendix A1: Description of the assumptions and reductions in carbon emissions for each of the personal proenvironmental actions survey responses.
| Survey response | CO2 reduction (tons/year) | Assumptions used in CoolClimate calculator |
|---|---|---|
| Buy renewable energy | 1.36 | 100% electricity from renewables |
| Buy energy star appliances | 0.04 | Energy star fridge or other products |
| Install solar panels | 0.68 | 50% electricity from renewables |
| Install solar hot water | 0.4 | 50% of heating of water from solar hot water |
| Change light bulbs | 0.16 | 5 bulbs used 5 hours per day |
| Buy hybrid/electric car | 4.22 | average of hybrids (40 mpg*2/3) + electric vehicles (99 mpg*1/3)) = 59.67 mpg |
| Recycle more often, buy products with less packaging, compost food scraps, give away/donate products | 0.42 | Reduce waste by 25% for each action |
| Carpool regularly | 0.85 | 3 times/week |
| Buy more fuel-efficient vehicle | 2.08 | 32 mpg vs. 22 mpg for 13,100 miles/yr. |
| Use public transit more | 0.42 | 20 miles/week in bus instead of 22 mpg in car |
| Use bike for transportation | 0.53 | 20 miles/week instead of 22 mpg in car |
| Make food choices to reduce emissions | 0.69 | Response of ‘all the time’ or ‘often’ is default setting for ‘low carbon version of American diet’ (0.69 tons/year). Response of ‘sometimes’ or ‘occasionally’ is a reduction of 0.46 tons/year through increase in meat consumption from 244 calories (default) to 353 calories. |
| Buy carbon offsets for flying | 0.93 | Response of ‘all the time’ or ‘often’ is 80% of flights purchased offsets (0.93 tons/yr.). Response of ‘sometimes’ or ‘occasionally’ is 40% of flights purchased offsets (0.46 tons/yr.). |
References
- Intergovernmental Panel On Climate Change (Ipcc). Climate Change 2022—Impacts, Adaptation and Vulnerability: Working Group II Contribution to the Sixth Assessment Report of the Intergovernmental Panel on Climate Change, 1st ed.Cambridge University Press, 2023. [Google Scholar] [CrossRef]
- Burrows, K.; Denckla, C.A.; Hahn, J.; Schiff, J.E.; Okuzono, S.S.; Randriamady, H.; et al. A systematic review of the effects of chronic, slow-onset climate change on mental health. Nat Ment Health. 2024, 2, 228–243. [Google Scholar] [CrossRef]
- Cianconi, P.; Betrò, S.; Janiri, L. The Impact of Climate Change on Mental Health: A Systematic Descriptive Review. Front Psychiatry. 2020, 11, 74. [Google Scholar] [CrossRef]
- To, P.; Eboreime, E.; Agyapong, V.I.O. The Impact of Wildfires on Mental Health: A Scoping Review. Behav Sci. 2021, 11, 126. [Google Scholar] [CrossRef]
- Clayton, S.; Manning, C.; Meighen, S.; Hill, A.N. Mental Health and Our Changing Climate: Impacts, Inequities, Responses; American Psychological Association, 2021. [Google Scholar]
- Berry, H.L.; Bowen, K.; Kjellstrom, T. Climate change and mental health: A causal pathways framework. Int J Public Health. 2010, 55, 123–132. [Google Scholar] [CrossRef]
- Flory, K.; Hankin, B.L.; Kloos, B.; Cheely, C.; Turecki, G. Alcohol and Cigarette Use and Misuse Among Hurricane Katrina Survivors: Psychosocial Risk and Protective Factors. Subst Use Misuse. 2009, 44, 1711–1724. [Google Scholar] [CrossRef]
- Fullerton, C.S.; McKibben, J.B.A.; Reissman, D.B.; Scharf, T.; Kowalski-Trakofler, K.M.; Shultz, J.M.; et al. Posttraumatic Stress Disorder, Depression, and Alcohol and Tobacco Use in Public Health Workers After the 2004 Florida Hurricanes. Disaster Med Public Health Prep. 2013, 7, 89–95. [Google Scholar] [CrossRef] [PubMed]
- Grennan, G.K.; Withers, M.C.; Ramanathan, D.S.; Mishra, J. Differences in interference processing and frontal brain function with climate trauma from California’s deadliest wildfire. Jia F, editor. PLOS Clim. 2023, 2, e0000125. [Google Scholar] [CrossRef]
- Obradovich, N.; Migliorini, R.; Paulus, M.P.; Rahwan, I. Empirical evidence of mental health risks posed by climate change. Proc Natl Acad Sci. 2018, 115, 10953–10958. [Google Scholar] [CrossRef] [PubMed]
- Palinkas, L.A.; Wong, M. Global climate change and mental health. Curr Opin Psychol. 2020, 32, 12–16. [Google Scholar] [CrossRef]
- Schwartz, R.M.; Gillezeau, C.N.; Liu, B.; Lieberman-Cribbin, W.; Taioli, E. Longitudinal Impact of Hurricane Sandy Exposure on Mental Health Symptoms. Int J Environ Res Public Health. 2017, 14, 957. [Google Scholar] [CrossRef]
- Silveira, S.; Kornbluh, M.; Withers, M.C.; Grennan, G.; Ramanathan, V.; Mishra, J. Chronic Mental Health Sequelae of Climate Change Extremes: A Case Study of the Deadliest Californian Wildfire. Int J Environ Res Public Health. 2021, 18, 1487. [Google Scholar] [CrossRef] [PubMed]
- Lewandowski, R.E.; Clayton, S.D.; Olbrich, L.; Sakshaug, J.W.; Wray, B.; Schwartz, S.E.O.; et al. Climate emotions, thoughts, and plans among US adolescents and young adults: A cross-sectional descriptive survey and analysis by political party identification and self-reported exposure to severe weather events. Lancet Planet Health. 2024, 8, e879–e893. [Google Scholar] [CrossRef] [PubMed]
- Hickman, C.; Marks, E.; Pihkala, P.; Clayton, S.; Lewandowski, R.E.; Mayall, E.E.; et al. Climate anxiety in children and young people and their beliefs about government responses to climate change: A global survey. Lancet Planet Health. 2021, 5, e863–e873. [Google Scholar] [CrossRef] [PubMed]
- Ramanathan, V.; Von Braun, J. (Eds.) The proceedings of the Conference on Resilience of people and ecosystems under climate stress: 13-14 July 2022. Città del Vatican; Libreria editrice vaticana, 14 July 2023. [Google Scholar]
- United Nations Framework Convention on Climate Change; United Nations, 1992.
- Monroe, M.C.; Plate, R.R.; Oxarart, A.; Bowers, A.; Chaves, W.A. Identifying effective climate change education strategies: A systematic review of the research. Environ Educ Res. 2019, 25, 791–812. [Google Scholar] [CrossRef]
- Ramanathan, V.; Aines, R.; Auffhammer, M.; Barth, M.; Cole, J.; Forman, F.; et al. Bending the Curve: Climate Change Solutions. 2019. Available online: https://escholarship.org/uc/item/6kr8p5rq.
- Vlasceanu, M.; Doell, K.C.; Bak-Coleman, J.B.; Todorova, B.; Berkebile-Weinberg, M.M.; Grayson, S.J.; et al. Addressing climate change with behavioral science: A global intervention tournament in 63 countries. Sci Adv. 2024, 10, eadj5778. [Google Scholar] [CrossRef]
- Anderson, A. Climate Change Education for Mitigation and Adaptation. J Educ Sustain Dev. 2012, 6, 191–206. [Google Scholar] [CrossRef]
- Mochizuki, Y.; Bryan, A. Climate Change Education in the Context of Education for Sustainable Development: Rationale and Principles. J Educ Sustain Dev. 2015, 9, 4–26. [Google Scholar] [CrossRef]
- Cordero, E.C.; Centeno, D.; Todd, A.M. The role of climate change education on individual lifetime carbon emissions. Pausata FSR, editor. PLoS ONE. 2020, 15, e0206266. [Google Scholar] [CrossRef]
- Grabow, M.; Bryan, T.; Checovich, M.M.; Converse, A.K.; Middlecamp, C.; Mooney, M.; et al. Mindfulness and Climate Change Action: A Feasibility Study. Sustainability. 2018, 10, 1508. [Google Scholar] [CrossRef]
- Zautra, A.J.; Arewasikporn, A.; Davis, M.C. Resilience: Promoting Well-Being Through Recovery, Sustainability, and Growth. Res Hum Dev. 2010, 7, 221–238. [Google Scholar] [CrossRef]
- Epel, E.; Mishra, J.; Ekman, E.; Ogunseitan, C.; Fromer, E.; Kho, L.; et al. Effects of a Novel Psychosocial Climate Resilience Course on Climate Distress, Self-Efficacy, and Mental Health in Young Adults. Sustainability. 2025, 17, 3139. [Google Scholar] [CrossRef]
- Ramanathan, V.; Forman, F.; Suárez-Orozco, M.; Roper, A.; Friese, S.; Flammer, K.; et al. CLIMATE CHANGE AND EDUCATION FOR ALL: BENDING THE CURVE EDUCATION PROJECT. In Education; Suárez-Orozco, M., Suárez-Orozco, C., Eds.; Columbia University Press, 2022; pp. 211–229. [Google Scholar] [CrossRef]
- Promoting Active Learning through the Flipped Classroom Model; Keengwe, J., Onchwari, G., Oigara, J.N., Eds.; IGI Global, 2014. [Google Scholar] [CrossRef]
- Ramanathan, V.; Aines, R.; Auffhammer, M.; Barth, M.; Cole, J.; Forman, F.; et al. Bending the Curve: Climate Change Solutions. 2019. Available online: https://escholarship.org/uc/item/6kr8p5rq.
- Association, A.M. Bending the Curve Video Series. [cited ]. 30 May. Available online: https://edhub.ama-assn.org/university-of-california-climate-health-equity/pages/bending-the-curve-video-series.
- Bending the Curve: Climate Education for All. In: OHWA [Internet]. 5 Apr 2024 [cited]. 30 May. Available online: https://onehealthworkforceacademies.org/training/bending-the-curve-adaptation/.
- Tennant, R.; Hiller, L.; Fishwick, R.; Platt, S.; Joseph, S.; Weich, S.; et al. The Warwick-Edinburgh Mental Well-being Scale (WEMWBS): Development and UK validation. Health Qual Life Outcomes. 2007, 5, 63. [Google Scholar] [CrossRef] [PubMed]
- Cohen, S.; Kamarck, T.; Mermelstein, R. A Global Measure of Perceived Stress. J Health Soc Behav. 1983, 24, 385. [Google Scholar] [CrossRef] [PubMed]
- Smith, B.W.; Dalen, J.; Wiggins, K.; Tooley, E.; Christopher, P.; Bernard, J. The brief resilience scale: Assessing the ability to bounce back. Int J Behav Med. 2008, 15, 194–200. [Google Scholar] [CrossRef]
- What’s Your Carbon Footprint? | Center for Science Education. 14 Aug 2024 [cited 14 Aug 2024]. Available online: https://scied.ucar.edu/learning-zone/climate-solutions/carbon-footprint.
- Franklin, S.; Pindyck, R. A Supply Curve for Forest-Based CO₂ Removal. In A Supply Curve for Forest-Based CO₂ Removal; Report No.: w32207; National Bureau of Economic Research: Cambridge, MA, 2024; p. w32207. [Google Scholar] [CrossRef]
- About, us. In: University of California [Internet]. 14 Aug 2024 [cited 14 Aug 2024]. Available online: https://www.universityofcalifornia.edu/about-us.
- What Exactly Is 1 Tonne Of CO2? | Anthesis Group. 31 Jul 2023 [cited ]. 13 May. Available online: https://www.anthesisgroup.com/insights/what-exactly-is-1-tonne-of-co2/.
- Home/. In: Climate Resilience [Internet]. [cited ]. 13 May. Available online: https://www.climateresilience.online.
- Bureau, U.C. State Population Totals and Components of Change: 2020-2023. In: Census.gov [Internet]. 21 Aug 2024 [cited 21 Aug 2024]. Available online: https://www.census.gov/data/tables/time-series/demo/popest/2020s-state-total.html.
- Composto, J.W.; Weber, E.U. Effectiveness of behavioural interventions to reduce household energy demand: A scoping review. Environ Res Lett. 2022, 17, 063005. [Google Scholar] [CrossRef]
- Nisa, C.F.; Bélanger, J.J.; Schumpe, B.M.; Faller, D.G. Meta-analysis of randomised controlled trials testing behavioural interventions to promote household action on climate change. Nat Commun. 2019, 10, 4545. [Google Scholar] [CrossRef]
Figure 1.
Raincloud plots for specific Climate Change Beliefs (CCB) showing significant change. The distributions with peaks at each response anchor indicate the response density for that anchor; pre-course vs. post-course distributions are shown in red and blue, respectively. (A) Results of CCB1 that assessed student belief whether global warming will harm future generations. (B) Results of CCB2 that assessed student belief that global warming will personally affect them. Both CCB1 and CCB2 show more students selecting ‘a great deal’ of harm at post relative to pre-course. (C) Results of CCB3 that assessed student belief that global warming is happening and to what extent humans can reduce it, showing more students selecting ‘Humans could reduce global warming, but it is unclear at this point, whether we will do what is needed’ at post relative to pre-course. (D) Results of CCB4 that assessed student belief that the actions of a single individual will not make any difference in global warming, showing more students selecting ‘Somewhat disagree’ at post relative to pre-course. (E) Results of CCB6 that assessed students’ beliefs regarding scientific consensus about whether global warming is happening, showing greater number of students believing in the scientific consensus for climate change at post vs. pre-course. (F) Results of CCB8 that assessed student belief that their friends shared their views on global warming, showing greater number of students who chose ‘many friends’ at post vs. pre-course.
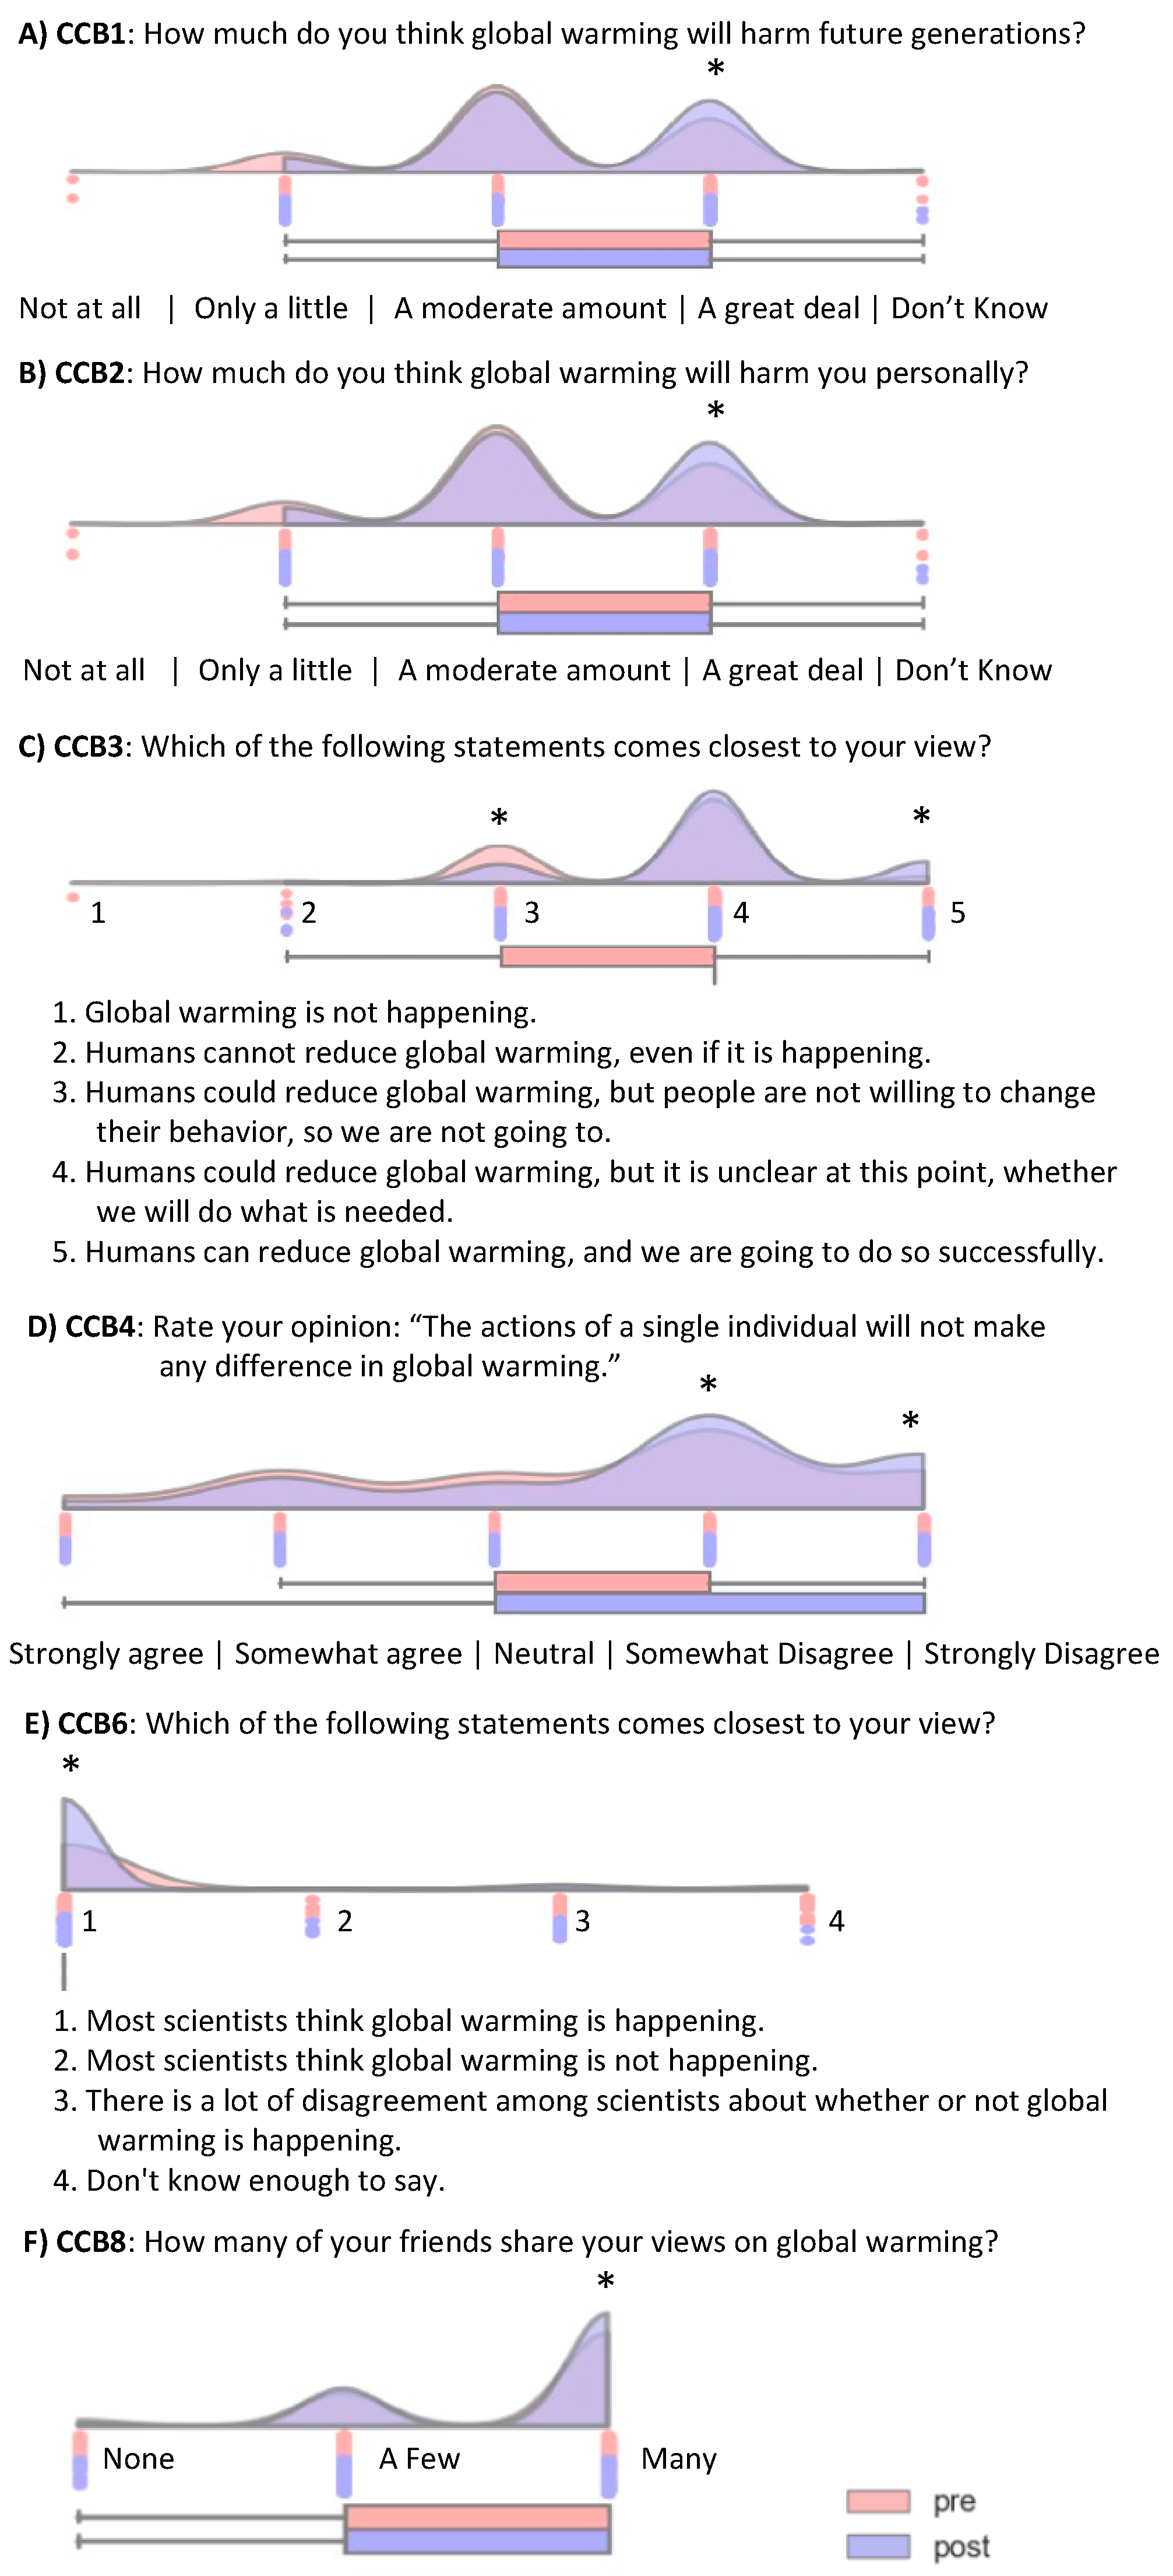
Figure 2.
Raincloud plots for specific personal actions (PA) showing significant change. The distributions with peaks at each response anchor indicate the response density for that anchor; pre-course vs. post-course distributions are shown in red and blue, respectively. (A) Results of PA1 show that significant waste reduction was observed for purchase of less packaged products. (B) Results of PA2 show that significantly more students adopted energy savings at post- relative to pre-course in the ‘Other’ category including mindful use of energy, reducing energy use especially in peak hours, switching off lights and appliances in unused rooms, installing auto on/off light sensors, hang drying clothes. (C) Results of PA3 show a shift in students’ food choices towards reduced emission choices at post- relative to pre-course. (D) Results of PA5 show that more students considered purchasing carbon offsets when flying at post- relative to pre- course.
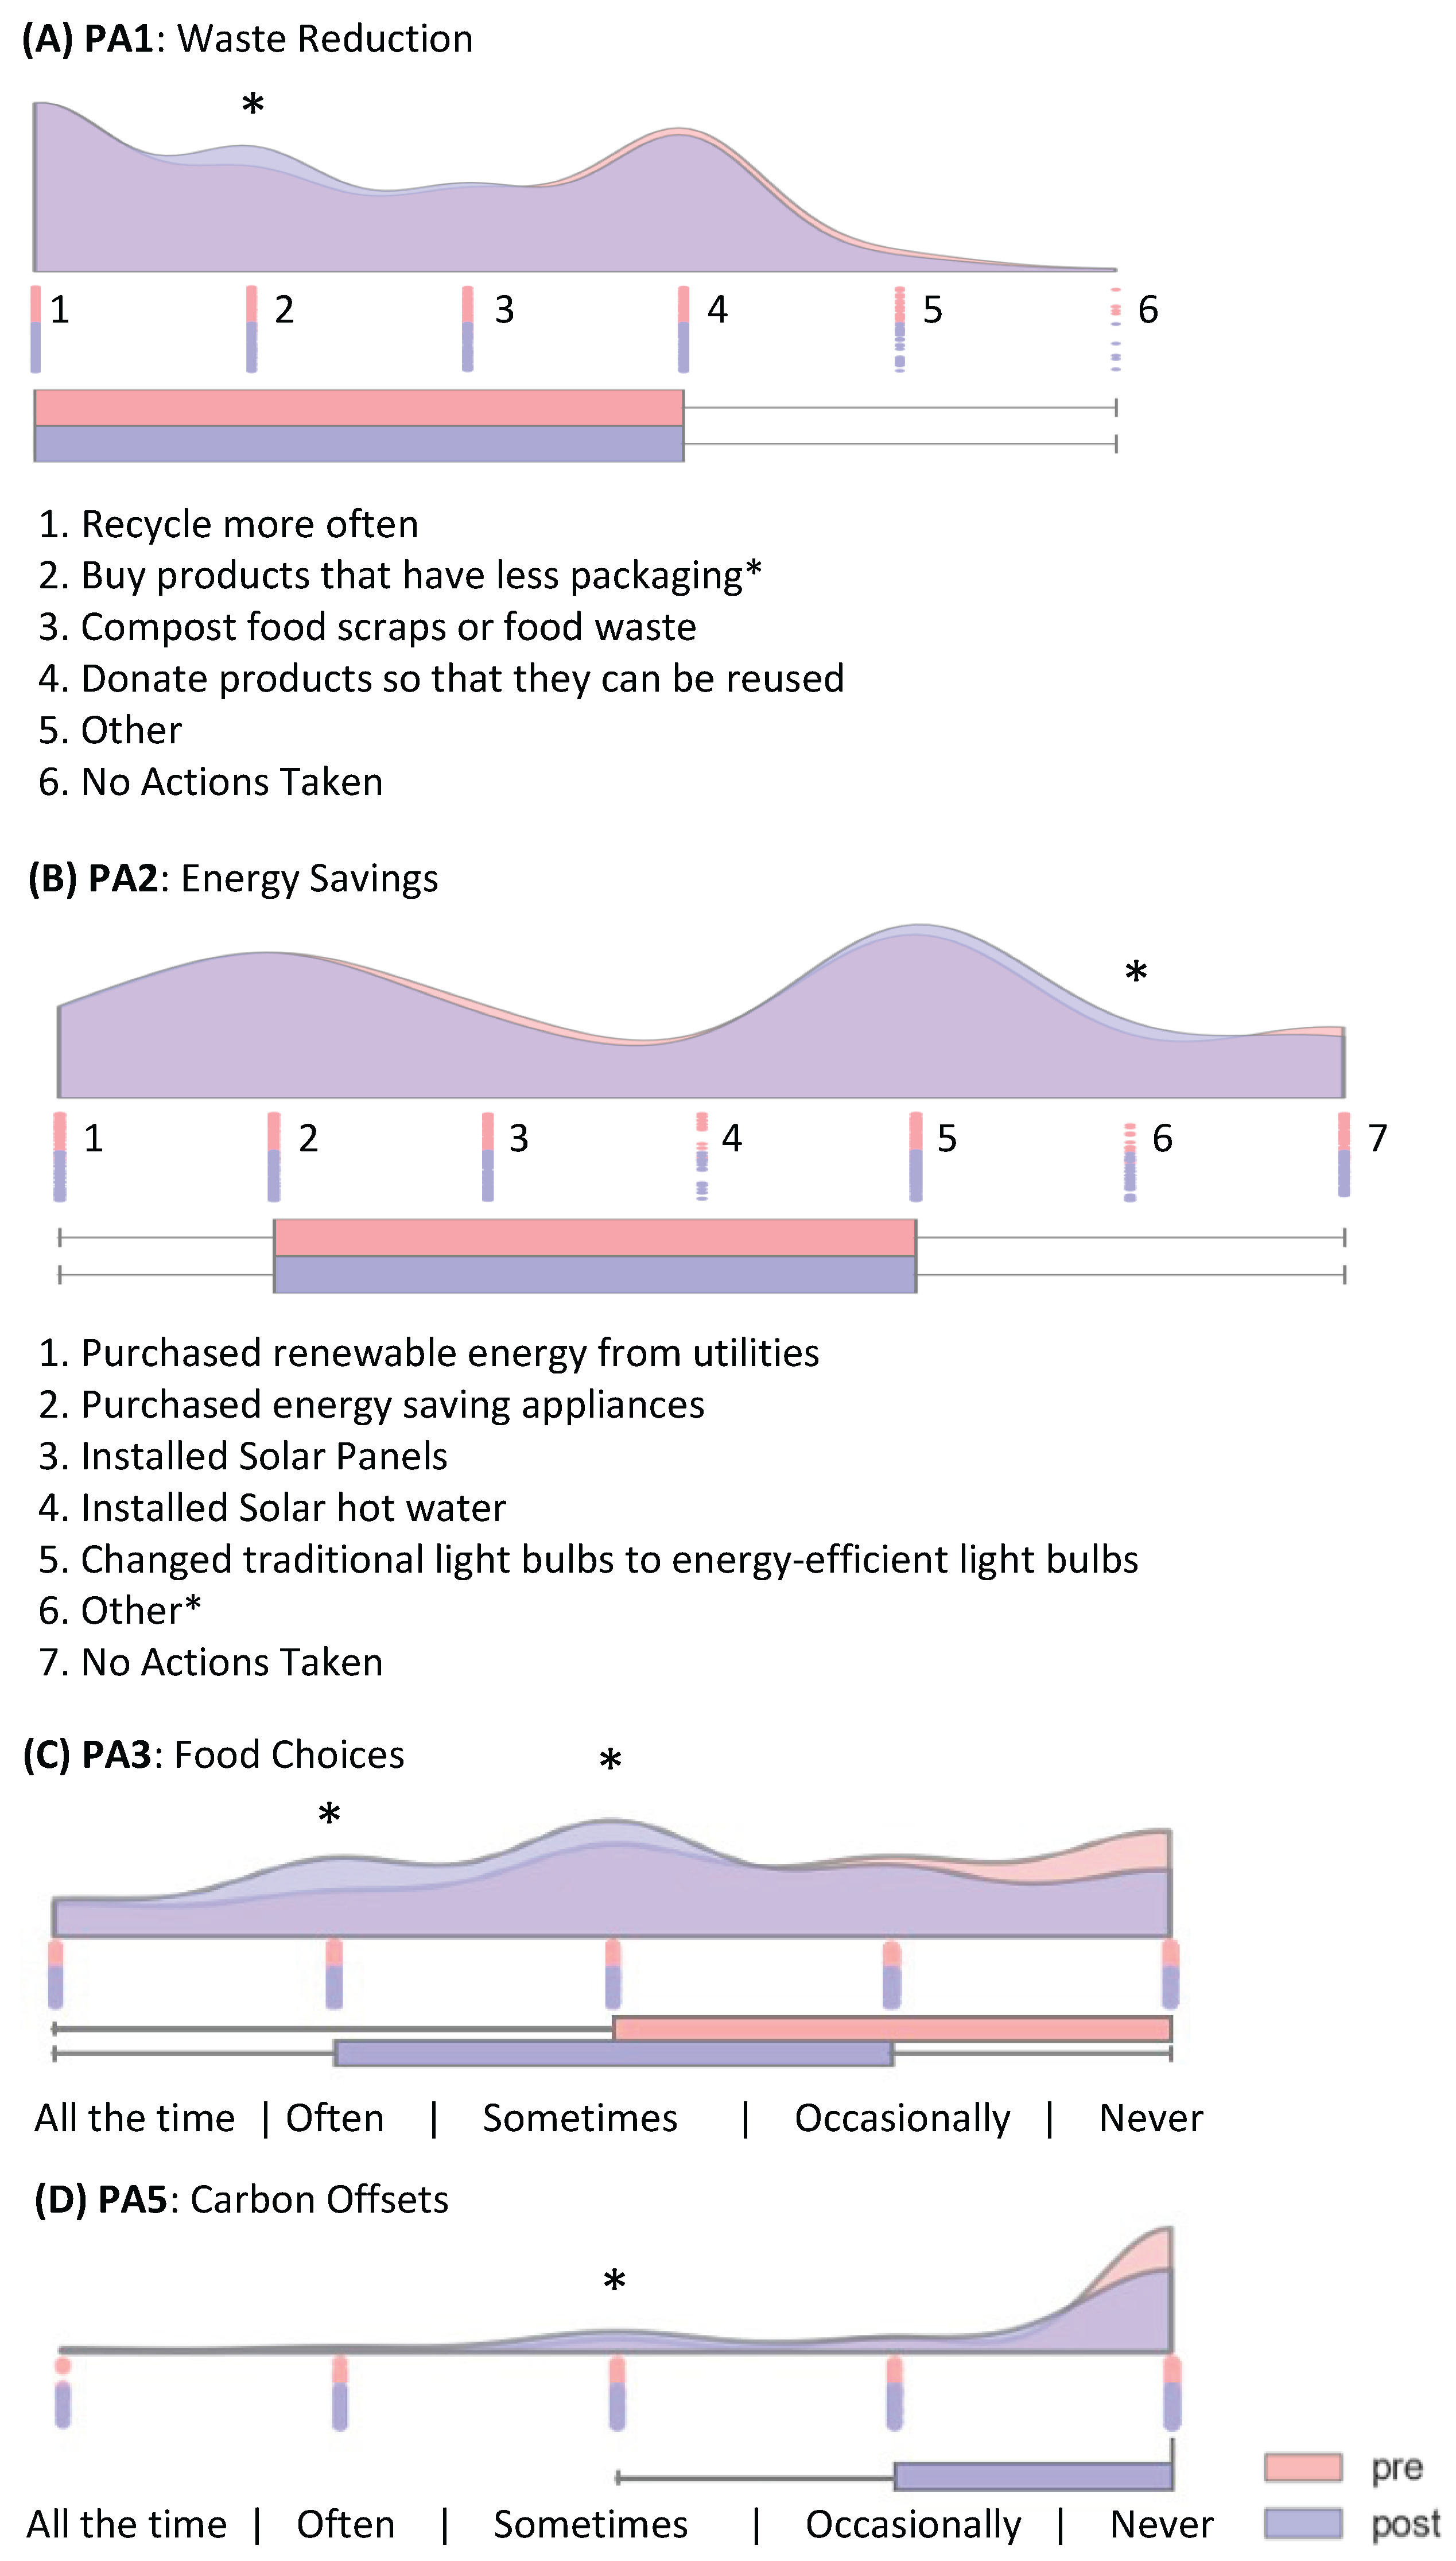
Table 4.
Individual carbon footprint reduction from the norm based on personal actions. Carbon footprint reduction was measured for each student at pre and post-course, shown in average (standard deviation) units of CO2 tons/year per student. Percentage of carbon footprint reduction for each personal action relative to the total carbon footprint reduction was also calculated at pre- and post-course for each student and is shown as average (standard deviation) percentage across all students. The overall carbon footprint reduction percentage is always 100% hence left blank. Significant pre vs. post changes observed for waste reduction, food choices and carbon offsets are highlighted. P-values are fdr-corrected for multiple comparisons across all five personal action categories. The overall carbon footprint reduction per student at post vs. pre-course was 0.3 ± 0.1 CO2 tons/year and was significant.
| Carbon Footprint Reduction per student CO2 tons/year (SD) | |||||
|---|---|---|---|---|---|
| Pre | Post | Pre % | Post % | P-val | |
| Waste Reduction | 1.1 (0.4) | 1.2 (0.4) | 26.3 (22.5) | 26.1 (18.5) | 0.0017 |
| Energy Savings | 0.6 (0.7) | 0.6 (0.7) | 13.5 (14.8) | 13.4 (15.3) | n.s. |
| Food Choices | 0.4 (0.3) | 0.5 (0.2) | 8.9 (11.2) | 10.1 (10.5) | <0.001 |
| Transport Emissions | 2.0 (2.2) | 2.0 (2.1) | 48.5 (25.1) | 46.1 (22.5) | n.s. |
| Carbon Offsets | 0.1 (0.2) | 0.2 (0.3) | 2.8 (5.8) | 4.3 (6.4) | <0.001 |
| Overall | 4.2 (2.7) | 4.5 (2.6) | - | - | 0.0013 |
Disclaimer/Publisher’s Note: The statements, opinions and data contained in all publications are solely those of the individual author(s) and contributor(s) and not of MDPI and/or the editor(s). MDPI and/or the editor(s) disclaim responsibility for any injury to people or property resulting from any ideas, methods, instructions or products referred to in the content. |
© 2025 by the authors. Licensee MDPI, Basel, Switzerland. This article is an open access article distributed under the terms and conditions of the Creative Commons Attribution (CC BY) license (http://creativecommons.org/licenses/by/4.0/).
Copyright: This open access article is published under a Creative Commons CC BY 4.0 license, which permit the free download, distribution, and reuse, provided that the author and preprint are cited in any reuse.


