
Submitted:
20 May 2025
Posted:
21 May 2025
You are already at the latest version
Abstract
This paper introduces the Potential Payback Period (PPP) as a dynamic generalization of the traditional price-to-earnings (P/E) ratio, addressing the limitations of static valuation multiples in modern equity markets. The PPP integrates expected earnings growth and investor-required return into a unified metric that expresses the time required for an investor to recoup their initial investment. Unlike the P/E or PEG ratios, PPP remains defined even when earnings are low or negative and offers a coherent, time-based framework for valuation, screening, and return forecasting. The article formalizes the PPP model mathematically, compares it with existing valuation tools, and explores its practical implementation. Through case illustrations and applications, the paper demonstrates that PPP bridges relative and absolute valuation approaches while improving analytical rigor and usability in volatile, growth-sensitive environments. The author, who is also the originator of the PPP concept, presents this framework for the first time in academic literature.
Keywords:
Potential Payback Period (PPP)
; price-to-earnings ratio
; stock valuation
; earnings growth
; discount rate
; dynamic valuation
; internal rate of return
1. Introduction
The price-to-earnings (P/E) ratio has long served as a cornerstone of equity valuation, offering investors a simple yet powerful lens through which to interpret market expectations. By relating a company's stock price to its earnings per share, the P/E ratio distills complex financial information into an accessible multiple that facilitates comparisons across firms, sectors, and time periods. However, the very simplicity that lends the P/E ratio its widespread appeal also contributes to its analytical limitations — most notably, its static nature.
Traditional uses of the P/E ratio assume constant earnings, negligible growth, and a stable risk environment. These assumptions rarely hold in practice. Earnings are dynamic, often volatile; growth trajectories vary widely across companies and market cycles; and the risk profile of an equity investment is anything but constant. In such dynamic financial environments, the P/E ratio provides only a partial picture, potentially leading to misleading conclusions, especially when applied mechanically or across dissimilar firms.
Attempts to address the P/E ratio’s static shortcomings have led to the development of alternative metrics such as the price/earnings-to-growth (PEG) ratio, which adjusts for earnings growth, and more complex models like discounted cash flow (DCF) and the Gordon Growth Model (GGM). While these approaches add layers of sophistication, they often compromise on clarity, usability, or stability of inputs. Moreover, they rarely succeed in reconciling the intuitive appeal of the P/E ratio with the forward-looking rigor required in dynamic financial analysis.
This paper proposes a solution to this valuation impasse: a generalized framework that retains the interpretability of the P/E ratio while embedding it in a dynamic context. At the core of this framework lies the Potential Payback Period (PPP) — a metric that captures the time it would take for an investor to recoup their investment through earnings, adjusted for both growth and risk. Mathematically rigorous yet conceptually intuitive, the PPP transforms the P/E ratio from a static snapshot into a dynamic, operational valuation tool.
The author of this article is also the originator of the Potential Payback Period (PPP) concept, and presents here its formalization and theoretical foundation for the first time in academic literature.
The remainder of the article is structured as follows: Section 2 reviews the relevant literature on valuation metrics and their limitations. Section 3 introduces the theoretical foundation of the PPP and demonstrates its derivation. Section 4 provides comparative analysis and practical illustrations. Section 5 discusses implementation issues, while Section 6 explores broader applications. Section 7 addresses limitations and directions for future research, and Section 8 concludes.
2. Literature Review
Valuation is central to financial analysis, investment decision-making, and corporate finance. Among the wide array of tools available to practitioners and scholars alike, the price-to-earnings (P/E) ratio remains one of the most enduring and widely applied. Yet its popularity often conceals fundamental limitations — particularly in its handling of growth and risk dynamics. This section surveys key valuation frameworks that have attempted to address these shortcomings, setting the stage for the introduction of the Potential Payback Period (PPP) as a more comprehensive alternative.
2.1. The P/E Ratio and Its Constraints
The P/E ratio offers a quick indication of how many years it would take, at current earnings levels, for an investor to recoup the price paid for a stock — assuming no growth and no risk. While the ratio’s simplicity makes it attractive for relative valuation, its implicit assumptions render it inappropriate in cases of high growth, earnings volatility, or structural shifts in business fundamentals.
Scholars such as Penman (1996), Damodaran (2002), and Lee (2004) have highlighted the P/E ratio’s sensitivity to accounting practices, cyclical earnings, and investor sentiment. Moreover, the ratio becomes undefined or misleading in cases where earnings are zero or negative, often prompting analysts to exclude such firms or rely on adjusted proxies. These weaknesses underscore the need for more robust, dynamic valuation frameworks.
2.2. The PEG Ratio: A Partial Adjustment for Growth
In response to the P/E ratio’s growth insensitivity, the price/earnings-to-growth (PEG) ratio was introduced, most notably by Lynch (1989) in practitioner circles and later formalized by academic researchers. Defined as

where g represents the expected earnings growth rate, the PEG ratio attempts to normalize the P/E by incorporating forward-looking dynamics.
However, the PEG ratio has its own limitations. It assumes a linear relationship between valuation and growth, ignoring the time value of money and the impact of risk. Moreover, it becomes unstable when growth is low or negative, and it lacks theoretical foundation when applied across companies with different risk profiles. As pointed out by Easton (2004), the PEG ratio often fails to reconcile the discounting process inherent in long-term valuation.
2.3. Discounted Cash Flow and the Gordon Growth Model
Valuation theory more rigorously incorporates time, growth, and risk through models such as the discounted cash flow (DCF) model and the Gordon Growth Model (GGM). These approaches estimate intrinsic value by forecasting future cash flows and discounting them to present value.
The GGM, for example, expresses the value of a perpetually growing dividend stream as:

where:
- P is the intrinsic value of the stock
- D1 is the dividend expected in the next period
- r is the required rate of return or discount rate
- g is the expected constant growth rate in dividends
This has a structural parallel to the cash flow-based DCF model:

where:
- P is the present value of the stock
- FCFt is the expected free cash flow in year t
- r is the discount rate reflecting time value of money and risk.
These models provide a more theoretically grounded alternative to simple valuation multiples. However, they are often criticized for their extreme sensitivity to input assumptions — especially long-term growth and discount rates. Small variations in these inputs can lead to large differences in estimated value. Moreover, they usually require detailed multi-year forecasts, which limits their ease of use in screening and broad market comparison.
2.4. The Case for Generalization
Recent literature has emphasized the need to reconcile the interpretability of multiples-based valuation (e.g., P/E) with the analytical rigor of discounted models. Hybrid approaches, such as those explored by Nissim and Penman (2001) and Ohlson (1995), attempt to bridge this gap using residual income and value driver frameworks. Yet these models often remain confined to academic use due to their complexity.
What is missing is a valuation metric that:
- Generalizes the P/E ratio to include earnings growth and discounting;
- Retains simplicity and intuitive interpretation;
- Applies even when earnings are low, negative, or volatile.
This gap motivates the introduction of the Potential Payback Period (PPP) — a generalization of the P/E ratio that transforms it into a forward-looking, risk-aware, and operationally useful tool. The next section formalizes the PPP and shows how it addresses the limitations of prior approaches while preserving their strengths.
3. Theoretical Framework
This section develops the conceptual and mathematical foundation of the Potential Payback Period (PPP) as a generalization of the traditional P/E ratio. We begin by revisiting the assumptions embedded in the P/E ratio, then derive the PPP to accommodate dynamic growth and risk, and finally demonstrate its reduction to the static P/E under specific limiting conditions. The result is a unified framework that maintains the intuitive interpretability of the P/E ratio while enabling its application in more complex financial environments.
3.1. Revisiting the P/E Ratio
At its core, the P/E ratio reflects how much investors are willing to pay today for one unit of current earnings:

This static multiple is often interpreted as the number of years it would take for the investor to recover their investment through earnings, assuming:
- Earnings remain constant in perpetuity,
- There is no time value of money (no discounting),
- Growth is absent or negligible,
- Earnings are positive and reliably estimated.
These assumptions are rarely valid in practice. Firms experience variable growth, investors require compensation for risk, and the present value of future earnings diminishes over time. The P/E ratio thus becomes increasingly fragile as a valuation tool in dynamic environments.
3.2. Defining the Potential Payback Period (PPP)
To overcome these limitations, we define the Potential Payback Period (PPP) as the time required for an investor to recoup their initial investment through discounted, growing earnings. This approach blends the temporal dimension (time to payback), growth expectations (earnings expand at rate g), and risk-adjusted discounting (using a rate r).
Formula:

where:
- P is the current stock price
- E is the current earnings per share
- g is the expected constant earnings growth rate
- r is the discount rate (typically derived from CAPM or investor-required return).
This expression calculates the time horizon required for the sum of discounted, growing earnings to equal the initial investment. It assumes reinvestment is not required (consistent with earnings-based valuation), and growth occurs at a steady rate over the payback period.
3.3. Derivation and Interpretation
The PPP is derived by solving for T in the following equation, where the present value of a growing annuity equals the stock price:

This sum can be expressed as:

Rearranging this expression and solving for T = PPP, we obtain the logarithmic formula above.
3.4. The PPP as a Generalization of P/E
The elegance of the Potential Payback Period (PPP) lies in how it collapses back to the traditional P/E ratio under static conditions, thereby revealing the P/E ratio as a special case of the more comprehensive PPP formula:
- If g = 0 and r = 0, then:
PPP = P/E
This recovers the traditional P/E interpretation as the number of years required to recover the stock price assuming no earnings growth and no discounting — a static, idealized scenario.
-
If g = r, then both the numerator and denominator of the full PPP formula approach zero. This results in an indeterminate form 0/0, where L’Hôpital’s Rule applies. Taking derivatives with respect to g confirms that:

This result holds whether g = r = 0 or g = r > 0, and shows that even in more general conditions with time value and growth balanced, the PPP converges precisely to the P/E ratio.
This important mathematical property demonstrates that the PPP is not a replacement for the P/E ratio, but a natural extension and generalization of it. The PPP retains the intuitive "years-to-payback" interpretation while embedding growth, interest rate, and risk — all essential elements in realistic financial valuation.
Thus, the P/E ratio can be viewed as the limiting case of the PPP when the world is static (no growth, no risk, no time discounting), and the PPP provides a dynamic framework for valuation in all other, more realistic, scenarios.
3.5. Conceptual Advantages
- Forward-looking: Unlike P/E, PPP naturally incorporates expectations of earnings growth and required returns.
- Time-sensitive: Expressed in years, PPP provides an intuitive time horizon for investment recovery.
- Universally applicable: Unlike P/E, PPP remains defined even when earnings are low, volatile, or negative (as shown later).
- Integrative: PPP bridges the gap between relative valuation (multiples) and absolute valuation (discounted earnings).
In the next section, we compare the behavior and informational value of PPP relative to traditional metrics like P/E and PEG through both theoretical and numerical illustrations.
4. Comparative Analysis
This section explores how the Potential Payback Period (PPP) compares with traditional valuation metrics such as the P/E ratio and the PEG ratio, both conceptually and quantitatively. We examine key behavioral differences under varying assumptions of growth and risk, and demonstrate PPP’s analytical power through case illustrations and simulations. These comparisons reinforce the PPP’s value as a dynamic, unifying metric that preserves interpretability while improving accuracy and applicability.
4.1. Static vs. Dynamic Valuation Metrics
The table below summarizes the key properties of the three metrics:
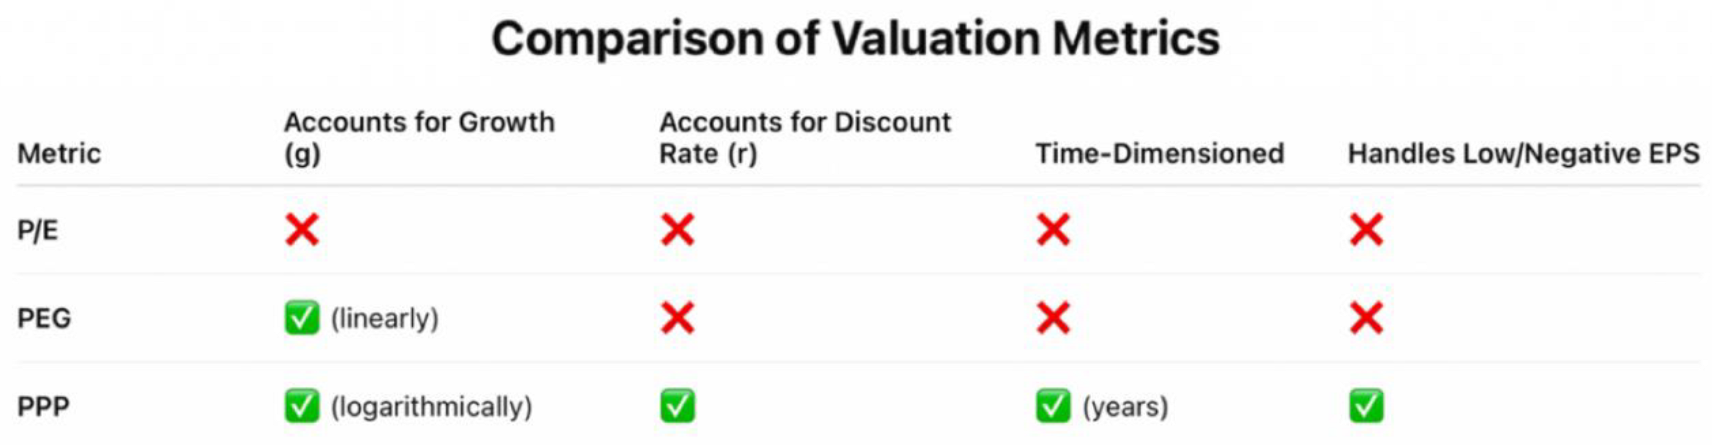
- The P/E ratio is static and forward-agnostic.
- The PEG ratio improves on the P/E by incorporating earnings growth, but not the time value of money or risk.
- The PPP incorporates both key dynamic elements — growth and discounting — while preserving an intuitive unit: time to payback.
4.2. Illustrative Case: Impact of Growth and Risk on Valuation Metrics
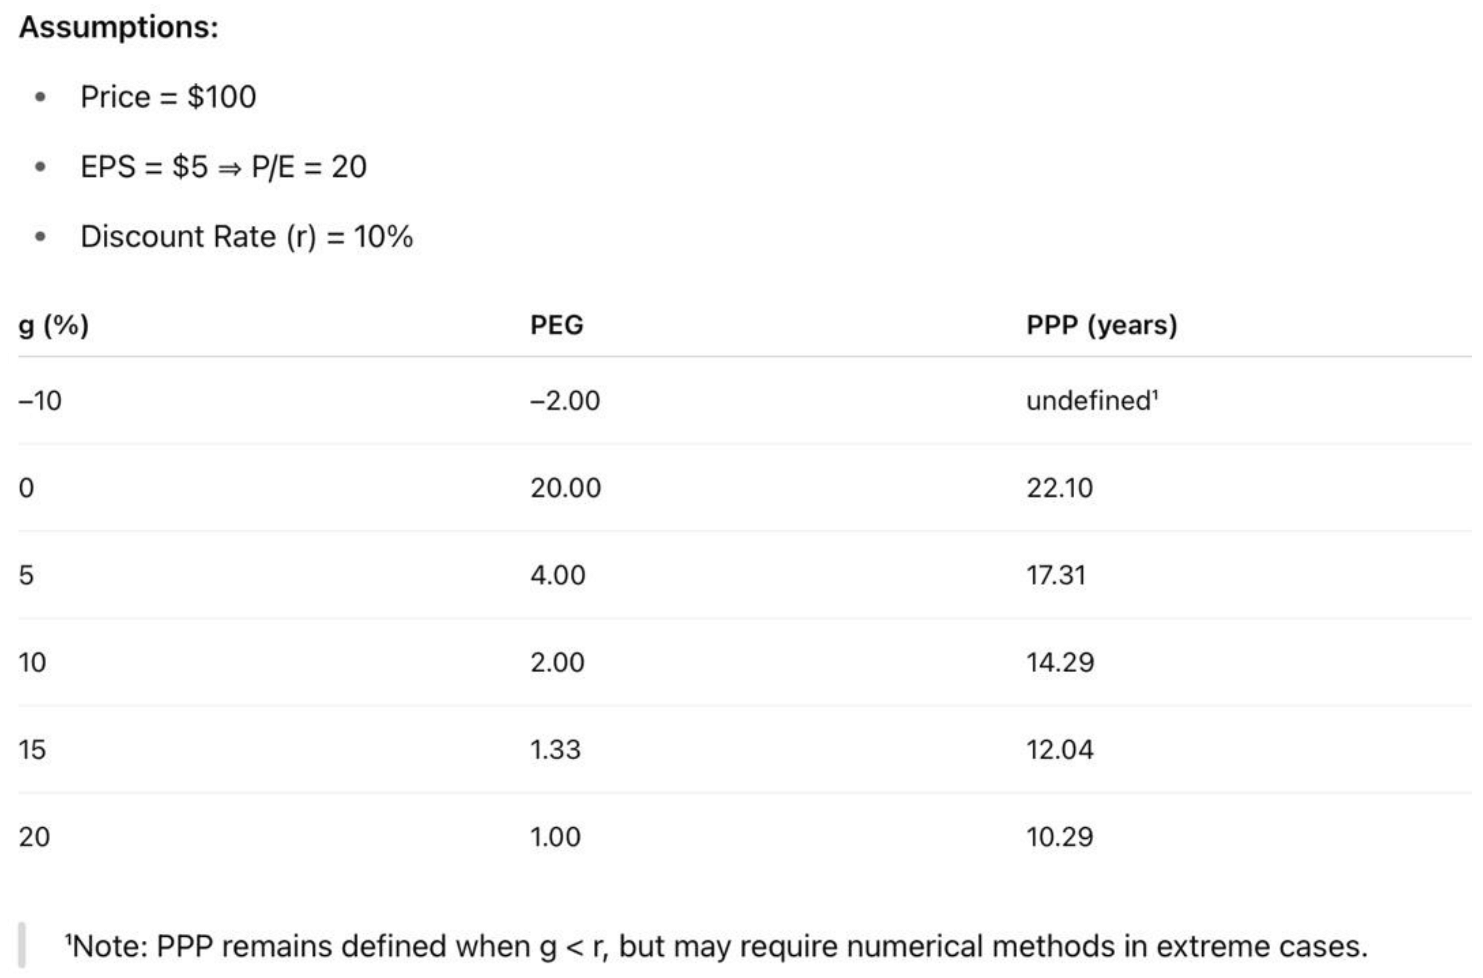
This simple illustration shows that PEG declines linearly, while PPP declines logarithmically with increasing g, reflecting diminishing marginal benefits of growth as it converges toward r. PPP also extends the payback horizon for low-growth or high-risk scenarios — revealing dynamics that P/E and PEG cannot capture.
4.3. Application Across Risk Profiles
Now fix g = 10%, and vary the discount rate r:
Impact of Risk on PPP
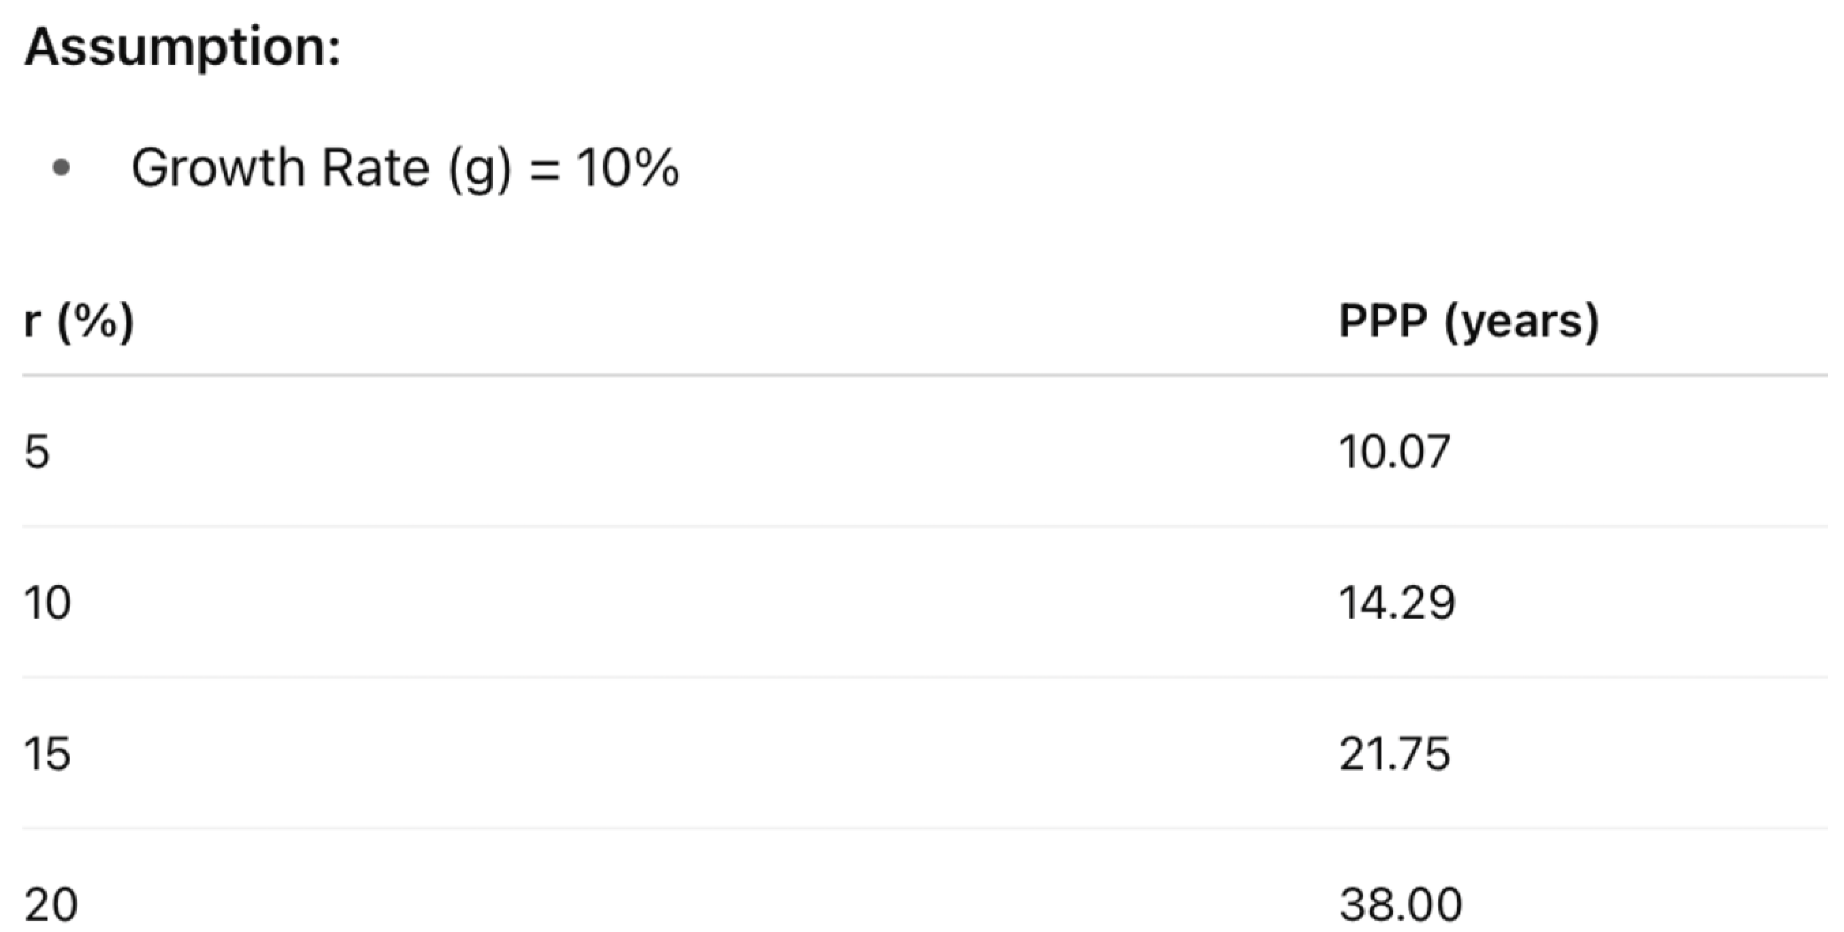
As risk rises, the PPP lengthens, reflecting the investor’s rational demand for faster return in higher-risk environments. Neither P/E nor PEG adjusts for this shift, making PPP more sensitive to real-world risk-return tradeoffs.
4.4. Special Cases: When P/E Fails and PPP Persists
PPP remains defined and useful when:
- EPS is near zero or negative: P/E becomes undefined or misleading, while PPP can still estimate time to payback based on future expected earnings and discounting.
- Earnings are expected to recover: PPP accommodates forward-looking growth even when current metrics fail.
- Volatile sectors or early-stage companies: PPP enables a time-based view of recovery and return, aiding in scenario analysis and portfolio weighting.
4.5. Summary of Comparative Insights
- Interpretability: P/E and PPP both use a time-based frame. But PPP embeds richer assumptions.
- Adaptability: PPP dynamically adjusts to changes in growth and risk, unlike PEG or P/E.
- Completeness: PPP bridges relative and intrinsic valuation, combining the practical interpretability of multiples with the rigor of discounted models.
In the next section, we explore how PPP can be implemented in practice, including input estimation, treatment of growth curves, and its application in equity screening and long-term return forecasting.
5. Practical Implementation
While the Potential Payback Period (PPP) offers strong theoretical and analytical advantages, its effectiveness depends on accurate input estimation and sound methodological execution. This section addresses the key considerations for practitioners applying the PPP in real-world equity valuation: estimating inputs, handling variable growth, and integrating PPP into investment workflows. It also highlights the metric’s flexibility in both screening applications and detailed valuation assessments.
5.1. Estimating Key Inputs: Growth Rate and Discount Rate
5.1.1. Growth Rate (g)
The expected growth rate of earnings is a forward-looking assumption, and several approaches can be used:
- Analyst forecasts: Aggregated EPS growth estimates from institutional sources (e.g., Bloomberg, FactSet).
- Historical average: Compounded EPS growth over 3–5 years, adjusted for mean reversion.
- Top-down projections: Sector or macro-level growth outlooks allocated to firms proportionally.
- Company guidance: Management’s stated earnings targets or strategic plans.
Best practice involves triangulation—using multiple sources to test the robustness of the assumption.
5.1.2. Discount Rate (r)
The discount rate should reflect the required return for the investor, adjusted for risk:
- CAPM-derived rate r:

- Hurdle rate: Used in private equity or institutional settings where a minimum return is prescribed.
- Implied market premium: Calibrated to current market valuations or investor sentiment.
In all cases, r should reflect both systematic risk and the opportunity cost of capital.
5.2. Incorporating Declining or Variable Growth
PPP can be adapted for cases where earnings growth is not constant:
- Linearly declining growth: Approximate average growth using:

Then use gavg in the standard PPP formula.
-
Multi-stage growth models: Extend the PPP framework to accommodate piecewise growth assumptions. For example:
- o
- High growth (5 years)
- o
- Transition phase (3 years)
- o
- Terminal growth (stable thereafter)
These variations preserve PPP’s structure but require iterative computation or numerical modeling, particularly for long-duration equities.
5.3. Implementation in Screening and Valuation
5.3.1. Screening Use Case
PPP can serve as a comparative screening metric across a large universe of stocks:
- Rank stocks by shortest PPP (fastest return of capital)
- Filter by sector, risk level, or growth band
- Identify asymmetric opportunities where PPP is low despite high headline P/E.
This dynamic valuation filtering is especially powerful in volatile or growth-sensitive environments.
5.3.2. Full Valuation Integration
PPP also supports detailed investment appraisal when combined with:
- Exit Price estimates: Using terminal EPS and a justified exit P/E
- IRR calculation: Deriving SIRR (Stock Internal Rate of Return) and SIRRIPA (SIRR Including Price Appreciation) directly from PPP and projected earnings streams
- Scenario analysis: Stress-testing changes in g and r to assess valuation robustness.
This positions PPP not merely as a multiple, but as a foundational element in modern valuation models.
5.4. Implementation Tools
Practitioners can implement PPP using:
- Excel or Google Sheets: Straightforward application of the logarithmic formula.
- Python or R: Useful for batch processing and automated screening.
- Plug-ins for valuation platforms: Integration with tools like FactSet, Bloomberg, or Capital IQ via APIs.
For institutional use, PPP can be embedded in factor models, quantitative ranking systems, or portfolio allocation algorithms.
In the next section, we explore how the PPP framework extends naturally into applications such as equity forecasting, risk-adjusted return estimation, and the evaluation of companies with non-traditional or non-linear earnings profiles.
6. Applications in Equity Valuation
The Potential Payback Period (PPP) serves not only as a valuation multiple but also as a versatile analytical tool across several layers of equity investment analysis. This section outlines key use cases of PPP in real-world finance, demonstrating how it can enhance screening, forecasting, portfolio construction, and valuation of firms with atypical earnings profiles.
6.1. PPP as a Screening Metric
PPP enables investors to screen equities based on a time-based return horizon that is both growth- and risk-adjusted. Unlike P/E, which tends to reward short-term profitability regardless of sustainability, PPP emphasizes recoverability of capital through future earnings.
Use Cases:
- Growth investing: Identify companies with short PPPs despite high P/Es, signaling strong forward earnings potential.
- Deep value: Surface overlooked firms with long PPPs caused by temporarily depressed earnings, but favorable long-term recovery dynamics.
- Cross-sector comparison: Normalize valuation across industries with different growth-risk profiles by translating price and earnings into a common time-based scale.
6.2. Long-Term Return Forecasting (SIRR and SIRRIPA)
PPP can be converted into forward-looking return estimates:
6.2.1. Stock Internal Rate of Return (SIRR) – Based on Cumulative Earnings:

This formula expresses the implicit IRR an investor would earn if the present value of all future earnings exactly equals the initial stock price. It leverages the doubling logic embedded in PPP to quantify return without needing an explicit DCF projection.
6.2.2. Stock Internal Rate of Return Including Price Appreciation (SIRRIPA) – Incorporates Both Cumulative Earnings and an Estimated Exit Price:

This extension reflects total economic return, allowing investors to forecast both income-based and capital gain-based components of equity return within a unified model.
6.3. Application to Nontraditional Cases
PPP’s most powerful feature may be its resilience in scenarios where traditional metrics fail:
6.3.1. Low or Negative Earnings
- P/E becomes undefined when EPS is near zero or negative.
- PPP remains defined so long as forward growth in earnings is positive and forecastable.
- Allows valuation of firms in transition, early-stage innovators, or cyclical industries.
6.3.2. Declining Earnings or Negative Growth
- PPP naturally extends to cases where g < r, indicating longer payback periods.
- This behavior flags deteriorating investment prospects in real time, avoiding optimism bias in PEG or static P/E comparisons.
6.3.3. Asymmetric Growth Paths
- Through modifications (e.g., multi-stage growth models), PPP can model complex earnings curves.
- Particularly useful for tech startups, turnaround stories, or firms undergoing restructuring.
6.4. Integration with Institutional Valuation Frameworks
PPP can be embedded in institutional investment processes:
- Quantitative models: Used as a factor in alpha models or ranking algorithms.
- Risk-adjusted valuation: PPP offers a direct link between valuation and cost of capital — providing a consistent metric across varied investment mandates.
- Relative value: Use PPP alongside sector — or index-level averages — to identify over- or under-valued securities.
6.5. Communication and Reporting
Because PPP is expressed in years, it communicates clearly with:
- Portfolio managers seeking payback visibility
- Clients and stakeholders needing intuitive justification for investment decisions
- Boards or investment committees evaluating strategic capital allocation.
It thus bridges the gap between technical rigor and communicable insights.
7. Limitations and Future Research
While the Potential Payback Period (PPP) offers a compelling generalization of the traditional P/E ratio, its application is not without limitations. This section critically examines the assumptions, constraints, and potential challenges in using PPP for valuation and decision-making. It also outlines key avenues for further research and development to enhance its robustness, accuracy, and usability across diverse market conditions.
7.1. Limitations of the PPP Framework
7.1.1. Dependence on Input Accuracy
-
Like all forward-looking models, PPP relies heavily on estimated inputs:
- o
- Growth rate g is inherently uncertain, subject to forecasting errors, optimism bias, or cyclicality.
- o
- Discount rate r, although grounded in CAPM or other models, varies with market sentiment and risk assessments.
- Small changes in g and r can materially affect PPP, particularly when the difference g − r narrows.
7.1.2. Assumption of Constant Growth
- The base PPP formula assumes constant earnings growth over the payback period.
- Real-world companies rarely grow linearly or consistently. Multi-stage or non-linear growth requires adaptation of the model and more complex assumptions.
7.1.3. Interpretation Under Extreme Values
When inputs approach extremes—such as very high discount rates or near-zero growth—the PPP becomes highly sensitive and may require scenario-based modeling to ensure stability.
7.1.4. Sensitivity in High-Volatility Sectors
- In highly volatile sectors (e.g., biotech, early-stage tech), short-term earnings are unstable, making PPP inputs less reliable.
- PPP may still function as a long-term indicator, but results must be interpreted with caution and scenario analysis.
7.2. Practical Challenges
- Lack of widespread adoption: PPP is not yet available in mainstream financial terminals or screening tools, limiting its adoption among practitioners.
- Education curve: Investors accustomed to static multiples may require training to understand PPP’s logic, especially its logarithmic and time-value components.
- Computational effort: While formulaic, PPP requires logarithmic computation that may deter use in low-tech or high-frequency contexts without spreadsheet templates or automated tools.
7.3. Future Research Directions
7.3.1. Empirical Validation
- Large-scale empirical studies can compare PPP-based valuation signals to subsequent realized returns.
- Testing across sectors, market cycles, and macroeconomic regimes will clarify its predictive power and robustness.
7.3.2. Multi-Stage PPP Models
-
Extend the framework to accommodate:
- o
- High-growth early phase
- o
- Transitional growth stage
- o
- Mature, stable phase
- This mirrors the structure of DCF modeling but retains PPP’s interpretability.
7.3.3. Stochastic Modeling
- Introduce probabilistic frameworks that allow g and r to follow distributions rather than fixed values.
- This would improve sensitivity analysis and accommodate uncertainty in forecasting.
7.3.4. Behavioral Calibration
∙ Study how investors interpret PPP intuitively, and whether they align more closely with its insights than with traditional metrics.
∙ Explore its value in behavioral finance contexts, such as overreaction to short-term earnings news or mispricing of growth.
7.3.5. Integration with ESG and Intangibles
Incorporate non-financial indicators (e.g., sustainability scores, brand equity, innovation pipelines) into adjusted earnings growth forecasts, enhancing PPP’s ability to value modern firms.
7.4. Toward Standardization
To maximize its impact, PPP should be:
- Codified into investment platforms and valuation tools
- Included in financial education curricula
- Explored in academic and policy research as a bridge between market efficiency and valuation rationality.
8. Conclusion: From P/E to PPP — A Dynamic Shift in Equity Valuation
The enduring popularity of the price-to-earnings (P/E) ratio lies in its simplicity, accessibility, and intuitive time-based interpretation. Yet, as this article has shown, that simplicity comes at a cost: the P/E ratio fails to account for the fundamental realities of financial markets — earnings growth, the time value of money, and risk. In a world of accelerating change and complex investment environments, reliance on static valuation multiples is increasingly inadequate.
The Potential Payback Period (PPP) offers a compelling solution. By generalizing the P/E ratio through the integration of expected growth and required return, PPP restores interpretive clarity while adding analytical depth. It retains the P/E’s intuitive appeal — measuring time to recover an investment — but does so in a way that is forward-looking, risk-aware, and mathematically grounded. More than just a valuation multiple, PPP provides a versatile framework applicable to screening, forecasting, and the valuation of both conventional and unconventional equities.
Through its logarithmic formulation, PPP offers a unifying metric that reconciles relative valuation with absolute models, and functions even when earnings are low, negative, or highly variable. It facilitates the derivation of intrinsic return metrics such as the Stock Internal Rate of Return (SIRR) and SIRR Including Price Appreciation (SIRRIPA), supporting long-term investment planning in a way that static multiples cannot.
Of course, no model is without limitations. PPP is sensitive to assumptions about growth and discount rates, and its reliance on a constant-growth framework may not always reflect reality. Yet these limitations are not disqualifying; rather, they present opportunities for refinement — through empirical validation, multi-stage modeling, and stochastic simulation.
In conclusion, this article has proposed and demonstrated the PPP as a generalized evolution of the P/E ratio, one better suited to the complexities of modern equity markets. Just as the PEG ratio extended the P/E ratio by incorporating growth, the PPP completes the transformation by integrating growth, risk, and time into a coherent and operational metric. For academics, practitioners, and policymakers alike, the PPP offers a pathway toward more nuanced, accurate, and forward-compatible valuation.
- 1 .Remark
As the Potential Payback Period (PPP) is a concept solely initiated and developed by Rainsy Sam (the author of the above article), there are currently no other published books or articles on this methodology by other authors. The references listed below include essential works on fundamental financial theories and valuation principles — such as discounted cash flow, dividend discount models, and earnings-based valuation — from which the PPP concept is conceptually and mathematically derived. Each source is accompanied by a brief explanation of its relevance to the PPP framework.
- 2.
- Sources directly cited in the article
- Penman, S. H. (1996). The Articulation of Price-Earnings Ratios and Market-to-Book Ratios and the Evaluation of Growth. Journal of Accounting Research, 34(2), 235–259.— Provides a framework connecting P/E and market-to-book ratios with growth expectations, forming a theoretical foundation for equity valuation metrics later refined by models like the PPP.
- Damodaran, A. (2002). Investment Valuation: Tools and Techniques for Determining the Value of Any Asset. Wiley.— Offers comprehensive valuation techniques, including discounted cash flow models, which underpin the theoretical logic extended by the PPP methodology.
- Lee, C. M. C. (2004). Accounting-Based Valuation: Impact on Business Practices and Research. Accounting Horizons, 18(3), 153–157.— Discusses how accounting-based valuation, particularly through P/E and book value, affects both research and practice, which the PPP addresses with a more dynamic framework.
- Easton, P. D. (2004). PE Ratios, PEG Ratios, and Estimating the Implied Expected Rate of Return on Equity Capital. The Accounting Review, 79(1), 73–95.— Analyzes how P/E and PEG ratios imply expected returns, showing limitations that the PPP overcomes through its logarithmic integration of growth, risk, and interest rate.
- Nissim, D., & Penman, S. H. (2001). Ratio Analysis and Equity Valuation: From Research to Practice. Review of Accounting Studies, 6(1), 109–154. — Bridges theoretical valuation ratios and their use in practice, paving the way for enhanced models like the PPP that aim to address empirical shortcomings.
- Ohlson, J. A. (1995). Earnings, Book Values, and Dividends in Equity Valuation. Contemporary Accounting Research, 11(2), 661–687.— Develops a valuation model based on earnings and book values, laying groundwork for more comprehensive approaches like the PPP that incorporate time value and growth.
- 3.
- Other works inspiring the Potential Payback Period (PPP) methodology(Foundational texts that conceptually influenced the development of the PPP)
- Gordon, M. J., & Shapiro, E. (1956). Capital Equipment Analysis: The Required Rate of Profit. Harvard Business Review, 34(5), 102–110.— Provides the foundation for the Gordon Growth Model (GGM), which the PPP extends and surpasses under limiting conditions.
- Gordon, M. J. (1962). The Investment, Financing, and Valuation of the Corporation. Richard D. Irwin, Inc.— Develops the dividend discount model that influenced PPP’s time-discounting structure.
- Sam, R. (2025). Proving that the P/E Ratio is Just a Limiting Case of the Potential Payback Period (PPP) When Earnings Growth and Interest Rate are Ignored.Preprints.— Provides the mathematical proof that PPP generalizes and reduces to the P/E ratio under static conditions.
- Sam, R. (2025). How to Adjust the P/E Ratio for Earnings Growth in Equity Valuation: PEG or PPP? Preprints. — Compares PPP with PEG to show how PPP better integrates growth into valuation.
- Sam, R. (2025). Revisiting the Gordon-Shapiro Model: How the Potential Payback Period (PPP) Refines and Operationalizes a Foundational Framework in Stock Valuation. Preprints. — Demonstrates how PPP refines the structure of the Gordon-Shapiro model by making it applicable in modern contexts.
- Sam, R. (2025). Extending the P/E and PEG Ratios: The Role of the Potential Payback Period (PPP) in Modern Equity Valuation. Preprints. — Positions PPP as a superior alternative to both P/E and PEG ratios in dynamic valuation environments.
- Sam, R. (2025). SIRRIPA: The Stock-Tailored Yield to Maturity (YTM) and the Emergence of a Cross-Asset Valuation Metric. Preprints. — Introduces SIRRIPA as a complement to PPP, bridging equity and fixed-income valuation methodologies.
- Sam, R. (2025). How the Potential Payback Period (PPP) Bridges the Gap Between Stocks and Bonds — and Revolutionizes Portfolio Management. Preprints. — Expands on PPP’s role in creating a unified valuation framework across asset classes.
- Sam, R. (2025). Why SIRRIPA is Set to Replace the P/E Ratio in Modern Equity Valuation. Preprints. — Advocates for a cross-metric valuation system that builds upon PPP-derived logic.
- Sam, R. (2025). Challenging Conventional Wisdom in Stock Valuation with the Potential Payback Period (PPP). SSRN. — Critiques legacy valuation metrics and positions PPP as a more rational, time-sensitive alternative.
- Sam, R. (2025). Breaking the Valuation Deadlock: Replacing the P/E Ratio with the Potential Payback Period (PPP) for Loss-Making Companies – A Case Study on Intel (2025). SSRN. — Applies PPP in contexts where P/E is inapplicable due to negative earnings, showing its practical advantages.
- Damodaran, A. (2012). Investment Valuation: Tools and Techniques for Determining the Value of Any Asset (3rd ed.). Wiley.— Provides foundational DCF and risk-pricing frameworks that underpin PPP’s treatment of discounting.
- Penman, S. H. (2010). Financial Statement Analysis and Security Valuation (4th ed.). McGraw-Hill/Irwin.— Offers techniques for earnings-based valuation, aligned with PPP’s focus on EPS recovery.
- Brealey, R. A., Myers, S. C., & Allen, F. (2017). Principles of Corporate Finance (12th ed.). McGraw-Hill Education.— Covers key principles in financial theory including discounting, capital costs, and valuation logic integral to PPP.
- Bodie, Z., Kane, A., & Marcus, A. J. (2018). Investments (11th ed.). McGraw-Hill Education.— Discusses risk-return relationships and valuation methodologies that conceptually support PPP's discount-rate framework.
- Copeland, T. E., Koller, T., & Murrin, J. (2000). Valuation: Measuring and Managing the Value of Companies(3rd ed.). Wiley Finance.— Emphasizes practical DCF techniques and cost of capital, both central to PPP computation.
- Siegel, J. J. (2014). Stocks for the Long Run (5th ed.). McGraw-Hill Education.— Advocates for long-term valuation strategies, compatible with PPP’s time-recovery approach.
- Greenwald, B., Kahn, J., Sonkin, P. D., & van Biema, M. (2001). Value Investing: From Graham to Buffett and Beyond. Wiley.— Reinforces intrinsic value investing principles that PPP seeks to quantify more rigorously.
- Graham, B., & Dodd, D. L. (2008). Security Analysis (6th ed.). McGraw-Hill Education.— A foundational text on valuation that influenced PPP’s emphasis on earnings and intrinsic value.
- Miller, M. H., & Modigliani, F. (1961). Dividend Policy, Growth, and the Valuation of Shares. Journal of Business, 34(4), 411–433.— Established valuation equivalence principles that underlie PPP's sensitivity to growth and discounting.
- Fama, E. F., & French, K. R. (1992). The Cross-Section of Expected Stock Returns. Journal of Finance, 47(2), 427–465.— Provides empirical insights on return factors, supporting PPP’s incorporation of discount-rate-driven expectations.
- Arnott, R. D., & Bernstein, P. L. (2002). What Risk Premium Is “Normal”? Financial Analysts Journal, 58(2), 64–85.— Explores variability in equity risk premiums, essential for interpreting PPP's discounting logic.
- Koller, T., Goedhart, M., & Wessels, D. (2020). Valuation: Measuring and Managing the Value of Companies (7th ed.). McKinsey & Company / Wiley.— Offers contemporary valuation frameworks that PPP helps to extend under extreme or unconventional conditions.
- Sam, R. (2025). Stock Internal Rate of Return — The Official Website on the Potential Payback Period (PPP) Methodology. www.stockinternalrateofreturn.com— Serves as the central hub for the PPP methodology, providing comprehensive resources, conceptual foundations, practical tools, and ongoing updates related to PPP, SIRR, SPARR, SIRRIPA, and SRP valuation metrics.
Disclaimer/Publisher’s Note: The statements, opinions and data contained in all publications are solely those of the individual author(s) and contributor(s) and not of MDPI and/or the editor(s). MDPI and/or the editor(s) disclaim responsibility for any injury to people or property resulting from any ideas, methods, instructions or products referred to in the content. |
© 2025 by the authors. Licensee MDPI, Basel, Switzerland. This article is an open access article distributed under the terms and conditions of the Creative Commons Attribution (CC BY) license (http://creativecommons.org/licenses/by/4.0/).
Copyright: This open access article is published under a Creative Commons CC BY 4.0 license, which permit the free download, distribution, and reuse, provided that the author and preprint are cited in any reuse.


