
Submitted:
20 May 2025
Posted:
20 May 2025
You are already at the latest version
Abstract
The fig (Ficus carica L.) is one of the oldest fruit crops cultivated in arid and semi-arid regions, valued for both its nutritional and economic importance. Thus, ensuring sustainable fig production under climate change conditions is very important as water scarcity increasingly affects fruit quality and production. This study assessed the physiological and biochemical parameters in the leaves of four fig varieties (Fassi, Ghouddane, Nabout, and Ounq Hmam) grown in three different locations (Chefchaouen, Taounate and Taza) in northern Morocco. The combined effects of location, variety, and interactions were determined on chlorophyll fluorescence (Fv/Fm), SPAD index, total chlorophyll Content (ChlT), canopy temperature depression (CTD), proline content, protein content, total soluble sugar (TSS), Hydrogen peroxide (H2O2) and malondialdehyde (MDA). Significant variation was observed among varieties and locations, with the variety effect being the main source of variability. The results showed that Nabout variety exhibited the greatest photosynthetic efficiency as indicated by its elevated SPAD index, ChlT, and Fv/Fm values, and showed lower sensitivity to oxidative stress (low proline content, H2O2, and MDA levels). In contrast, Ghouddane had the highest values of oxidative stress markers. Among locations, Chefchaouen showed the highest protein, TSS, H₂O₂, and MDA levels, reflecting active metabolic adjustments and stress mitigation. These variations were confirmed by principal component analysis, which revealed a clear separation between photosynthetically efficient varieties (Nabout and Ounq Hmam) and stress-tolerant varieties (Ghouddane and Fassi). In conclusion, local varietal selection is essential for optimizing fig production in regions subject to climatic variability.
Keywords:
Ficus carica
; physiological traits
; chlorophyll fluorescence
; Northern Morocco
1. Introduction
The fig (Ficus carica L.) is one of the oldest cultivated fruit crops, known for its ecological adaptability and its economic and nutritional importance [1,2]. Originally native from the Mediterranean region, fig trees expanded to warm temperate zones [3] due to their adaptability to diverse climates [4] and capacity to grow under various soil types [5,6]. Generally, warm-temperate and arid Mediterranean regions seem to provide the greatest conditions for producing high-quality fig fruit [7,8,9,10]. According to the latest FAOSTAT data, figs were cultivated in 302,347 hectares in the world, producing about 1,318,974 tons in 2023 [11]. Following these statistics, Turkey is the top producer (356,000 tons) followed by Egypt (193,057 tons), Morocco (119,166 tons), Algeria (116,183 tons) and Iran (73,483 tons). Indeed, Moroccan fig agriculture covers 69,737 hectares [11] and is concentrated in the northern regions of the country, including Taounate, Taza, Chefchaouen, Al Hoceima, Ouazzane, and Tetouane [12,13].
The fig tree represents a rich and varied phylogenetic heritage, reflected in its many varieties that are well adapted to different eco-geographical conditions and have good agronomic and ecological characteristics. As one of the world’s major fig producers, Morocco holds important fig genetic resources, including several international varieties [14,15,16,17]. A study conducted in the provinces of Taounate, Chefchaouen, Ouezzane and El Jadida identified 43 local fig tree varieties [18]. Among these, the varieties recommended for fresh or dried autumn fig production include Nabout, Messari, Fassi, Ghouddane, Lassoune, Masfah, Hamri, and Ounq Hmam. This genetic diversity within Moroccan fig germplasm, in the context of the Mediterranean basin, is the result of long-term domestication and adaptation to various environments, such as the mountainous regions of Chefchaouen or the semi-arid plains of Taounate [14,19]. In these regions, economic and sociocultural factors have contributed significantly to the preservation of traditional culture and the enhancement of genetic diversity [15,20]. In fact, fig trees have a significant ecological role to sustain the naturel balance of agroecosystems in semi-arid and arid climates, stabilizing soil structure and promoting functional biodiversity. However, despite their essential ecological role, native fig varieties in the Mediterranean area are currently exposed to serious genetic erosion, caused by multiple biotic and abiotic stresses, including the expansion of monovarietal cropping systems and urban development.
Fig production and development are greatly influenced by geographical origin and associated factors, sach as altitude, pedoclimatic conditions, and agricultural practices including soil fertilization and irrigation [21,22,23]. Prolonged droughts, rising temperatures, and soil salinization are among the main effects of climate change, particularly in arid and semi-arid areas such as the Mediterranean. These changes disrupt plant phenological and physiological processes, including stomatal function, cell water status, and photosynthetic capacity. As a result, environmental stresses significantly influence tree physiology of fig, reducing affecting growth and productivity. However, fig trees have developed diverse adaptive mechanisms and physiological processes to manage water scarcity [24,25]. Following to these authors, the decrease of stomatal conductance was the primary response to water stress, which controlled transpiration and photosynthesis rates, as well as leaf temperature. Indeed, recent studies have shown that genotype [24], leaf and fruit development stages [9,26], growing region, and edaphoclimatic conditions [25] all influence gas exchange capacity. Moreover, fig trees accumulate osmoprotectors (proline, soluble sugars and antioxidants) and improve their antioxidant defenses to minimize oxidative stress produced by reactive oxygen species [27]. Under drought conditions, figs also show reductions in chlorophyll fluorescence (Fv/Fm), chlorophyll index, and leaf number [25]. In this regard, chlorophyll content and chlorophyll fluorescence have been widely used to evaluate the adaptation of the photosynthetic machinery and plant performance under stressed environments [28]. Furthermore, stress-related biochemical markers (proline, soluble sugars and antioxidants) can provide a global comprehension of stress adaptation mechanisms in fig trees [29].
The northern Moroccan regions, particularly Chefchaouen, Taounate, and Taza, present diverse agroclimatic conditions, with considerable variations in temperature, rainfall, and soil characteristics. These environmental differences influence the physiological performance of fig trees, including photosynthesis and transpiration, and their ability to manage water stress. However, each fig variety has a different capacity to adaption, which is essential for selecting the most resilient varieties. Despite previous studies, there is still limited information on how local fig genotypes respond to environmental variability under real field conditions. Understanding the physiological and biochemical responses is crucial for selecting of resilient varieties suitable for cultivation in climate-stressed areas. In this context, the present work focused on evaluating the combined effects of location, variety, and their interactions on the physiological and biochemical parameters in four local fig varieties (Fassi, Ghouddane, Nabout, and Ounq Hmam) grown across three contrasting locations in northern Morocco.
2. Results
2.1. Analyses of Variance
Mean squares of the combined analyses of variance for the studied physiological and biochemical traits of fig leaves are summarized in Table 1. The results showed that variety, location, and their interaction affected significantly all the studies parameters. Variety effect was significant and predominant, accounting for more than 63% of variability for SPAD value, ChlT, Fv/Fm, CTD, proline content, H2O2 and MDA. In contrast, the location effect was mainly exhibited for protein content and TSS, contributing to 44% and 75% of total variance, respectively. Location by variety interaction had a lower effect and explained only 15% of the total variability.
2.2. Effect of Location and Variety
The mean values of SPAD index, ChlT, Fv/Fm and CTD are presented in Figure 1. Fig leaves from Chefchaouen showed higher values for SPAD index (40.113) and ChlT (1.764 mg/g FW), and the lowest ones for Fv/Fm (0.722) and CTD (1.596 °C). Taounate exhibited the best scores for SPAD index and ChlT (38.213 and 1.356 mg/g FW, respectively). The highest value of Fv/Fm (0.77), was observed in Taza. Among varieties, significant differences were observed with Nabout showing the highest levels for most parameters (SPAD index=41.423, ChlT =1.9 mg/g FW, and Fv/Fm=0.809) except for CTD where Ounq Hmam presented higher values. (4.581 °C). Ghouddane was characterized by the lowest value for Fv/Fm and CTD (0.685 and 1.187 °C, respectively), whereas the lowest value of SPAD (36.506) index was observed in Fassi.
For biochemical parameters, significant variation was observed for proline content, protein content, TSS, H2O2 and MDA (Figure 2). In fact, Chefchaouen presented the highest ones for protein content, TSS, H2O2 and MDA (3.705 mg/g FW, 46.18 µmol/g FW, 4.851 mM/g FW and 5.805 mM/g FW, respectively) except for proline content where Taounate recorded higher values (4.992 µmol/g FW). Among varieties, Ghouddane recorded the highest values for proline content, TSS, H2O2 and MDA (15.246 µmol/g FW, 42.015 mg/g FW, 5.837 mM/g FW and 6.443 mM/g FW, respectively), followed by Fassi. However, Nabout leaves showed lowest concentration of proline content, TSS, protein content, H2O2 and MDA (9.465 µmol/g FW, 34.078 mg/g FW, 2.992 mg/g FW, 3.219 mM/g FW and 5.078 mM/g FW, respectively).
2.3. Relationships Between Parameters
Table 2 present the correlation matrix among the studied physiological and biochemical traits of fig leaves. Positive correlations were found between Fv/Fm, SPAD and ChlT, while all these variables were negatively correlated to H2O2, MDA and proline content. In fact, the greatest and most significant relationship (r= 0.834***) was observed between SPAD and ChlT. CTD was positively associated with Fv/Fm (r= 0.652***) and negatively associated with H2O2 (r = -0.633***) and MDA (r = -0.509***). Protein was correlated positively and significantly with TSS (r=0.556***), H2O2 (r = 0.351*) and MDA (r = 0.351*). Additionally, TSS showed a negative association with Fv/Fm (r = -0.499***), but it was positively linked to H2O2 (r = 0.580***) and MDA (r = 0.488***). Moreover, positive correlations were found between proline content and both H2O2 (r = 0.492***) and MDA (r = 0.683***). Finally, H2O2 was positively linked to MDA (r = 0.930***).
2.4. Principal Component Analysis
PCA was conducted on the correlation matrix using mean values to determine relationships between the studied factors and various parameters. Results showed that the first two PC axes explained about 72% of the total variance, with PC1 accounting for 51% and PC2 for 21% (Figure 3, 4). PC1 clearly separated protein content, TSS, H2O2, MDA, and proline content in the positive direction from SPAD, ChlT, Fv/Fm and CTD in the opposite direction. The second axis (PC2) allowed discrimination between Chlt, SPAD, protein content, and TSS towards the upper side and both Fv/Fm, CTD and Proline content downwards. Regarding varieties (Figure 3), a clear distinction among the four varieties was shown along PC1. Ghouddane and Fassi were marked by higher values of proline content, H2O2 and MDA on the right side, while Nabout and Ounq Hmam were related to SPAD, ChlT, Fv/Fm and CTD on the opposite side. A separation among locations was detected along PC2 (Figure 4). In fact, Chefchaouen was positioned towards the positive side, with higher values of ChlT, SPAD, protein content and TSS, while Taounate in the opposite direction interacted with proline content, Fv/Fm and CTD. Points related to Taza location overlapped between Chefchaouen and Taounate.
3. Discussion
For a sustainable increase in fig production under climate change conditions, it is necessary to select new fig plants while considering productivity, drought tolerance, and cultural requirements. Local fig varieties are the fruit of a lengthy adaptation to climate and soil conditions in Morocco [14]. However, there are no previous studies about the physiological and biochemical behavior of local varieties according to the combined effects of location and variety and their interactions. Hence, this work focused on the study of four local fig varieties grown at three different locations in northern Morocco.
Fig plant is characterised by larger and thicker leaves, which enable enhanced chlorophyll production and facilitate efficient gas exchange, thereby conferring a robust adaptation to the arid Mediterranean climate [32]. Indeed, climatic factors such as higher temperature, low rainfall and low light affect negatively leaf chlorophyll content and photosynthetic parameters, including net photosynthetic assimilation, stomatal conductance, and transpiration rate in fig trees [24,33].
In this study, we examined the physiological and biochemical traits of four fig varieties growing in three different locations of northern Morocco. Statistical analysis revealed a significant variability among locations for all studied parameters in agreement with other research works[34]. These differences could be explained by pedoclimatic conditions varying from one environment to another.
However, the variety effect was the main variability source, indicating that physiological and biochemicals parameters are genetically dependent. Previous works have reported significant effects of genotype on various physiological parameters in fig trees[7,24,26].
Our results revealed that Chefchaouen leaves had the highest SPAD index and ChlT values, suggesting optimal environmental conditions for chlorophyll synthesis. This confirmed by the high positive correlation between Chlt and SPAD index. Taounate also showed strong scores for these two parameters reinforcing its suitability for maintaining robust photosynthetic activity. In fact, the SPAD index and ChlT are crucial indicators of photosynthetic capacity and overall plant health [35,36,37]. These results align with research emphasizing the importance of environmental adaptation in photosynthetic performance [38,39]. Among varieties, Nabout displayed the highest SPAD index and ChlT, reflecting its genetic predisposition for superior chlorophyll production. These findings coincide with those of Maatallah et al [7], which reported that Mlouki and Assal cultivars grown under warm climate conditions of Tunisia had the greatest amounts of chlorophyll and net photosynthetic assimilation.
The maximum photochemical efficiency (Fv/Fm) is a reliable indicator of photosynthetic apparatus functionality and light-dependent reactions including water splitting, electron transport, establishment of the pH gradient across the thylakoid membrane and ATP synthesis [40,41]. Our results showed that Fv/Fm ratio varied between 0.69 and 0.81 in all varieties in accordance with data from Mardinata et al [36]. Maximum Fv/Fm ratio was recorded in Nabout (0.81), indicating its ability to maintain efficient photochemistry under variable environmental conditions. This was confirmed by the high positive correlation between Fv/Fm and SPAD index. Regarding locations, Chefchaouen showed the lowest Fv/Fm ratio (0.722), reflecting the stress-induced photodamage on PSII that can be observed under natural conditions such as drought or high temperatures [25,30,32].
Plants produce and accumulate osmolytes under abiotic stresses, like amino acids (proline), soluble sugars, and proteins, for maintaining cell turgor [42]. Furthermore, accumulation of such compounds would produce higher negative water potential in plants, a condition required for absorbing and holding water in plant cells [43]. Our results proved that Chefchaouen recorded the highest protein and TSS levels, suggesting that the plants in this location are more actively involved in stress mitigation through metabolic adjustments. Valluru and Van den Ende [44] showed the important role of soluble sugars in osmotic adjustment and cell protection by inducing direct detoxification processes of reactive oxygen species or by stimulating indirectly the antioxidative defense system. Additionally, accumulation of organic solutes such as soluble carbohydrates and proline to maintain cell turgor was observed in drought-stressed olive and wheat leaves [30,45]. Regarding varieties, Ghouddane recorded the highest proline content, indicating a strong stress response mechanism. in fact, proline accumulation is known to be a key response to osmotic stress, acting as an osmoprotectant to stabilize cellular structures [27,46]. On the other hand, Nabout exhibited the lowest concentrations of proline content, TSS, and protein content, indicating that it may be less equipped to handle abiotic stress. However, its superior SPAD index and Fv/Fm values suggest that it performs well under favorable conditions.
H₂O₂ and MDA are well-known plant stress indicators [47]. In fact, MDA is the product of the peroxidation of polyunsaturated fatty acids, and its release under drought conditions indicates increased reactive oxygen species (ROS) and leads to lipid peroxidation [48,49]. Indeed, H2O2 concentration mostly indicates the degree of environmental stress on the plants since it is the main reactive oxygen species (ROS) produced in different organelles [50,51]. Furthermore, Chefchaouen recorded the highest levels of both H2O2 and MDA, indicating higher oxidative stress in this location. This is confirmed by the strong negative correlation between Fv/Fm and both H₂O₂ and MDA, suggesting that environmental stress affects photosystem functionality [52]. Our results indicate that Ghouddane showed the highest H₂O₂ and MDA levels, further indicating susceptibility to oxidative stress. High levels of reactive oxygen species (ROS) like H₂O₂ are commonly observed in plants under abiotic stress, triggering both protective and damaging response [53]. Nabout with its lower H₂O₂ and MDA levels, demonstrated reduced oxidative damage, suggesting enhanced ROS control and successful stress mitigation.
PCA plot revealed a clear separation among the four fig varieties. Ghouddane and Fassi clustered on the right side of PC1, associated with higher levels of proline content, H₂O₂, and MDA. This clustering suggests that these varieties exhibit stronger stress responses, which may be beneficial for their survival under harsher environments. These findings align with research by Choudhury et al [52], who noted that elevated levels of reactive ROS and proline content are common indicators of plants coping with oxidative stress. In contrast, Nabout and Ounq Hmam clustered on the left side of PC1, associated with higher photosynthetic efficiency indicators, such as SPAD index, ChlT, and Fv/Fm. These varieties appear to be more suited to optimal growing conditions, where photosynthesis can be prioritized over stress responses. Study focusing on different fig genotypes under water deficit conditions found that certain genotypes maintained higher photosynthetic rates and water use efficiency [38].
The high SPAD, ChlT, protein, and TSS values indicate strong photosynthetic and metabolic productivity in Chefchaouan. However, elevated H₂O₂ and MDA levels suggest periodic stress episodes, necessitating targeted management strategies such as irrigation and balanced fertilization [54]. Associated with high proline content, Fv/Fm, and CTD, Taounate reflects a strong stress adaptation profile, suitable for resilient varity like Ghouddane.
4. Materials and Methods
4.1. Plant Samples
Four Moroccan fig varieties (Fassi: FAS, Ghouddane: GHO, Nabout: NBT , and Ounq Hmam: OQH) were chosen from the most cultivated Moroccan figs. Each variety were marked in triplicate at three different locations in northern Morocco: Chefchaouen (Beni ahmed, 34°50'23.7"N 5°04'42.9"W), Taounate (Khlalfa, 34°39'56.4"N 4°37'01.6"W) and Taza (Brarha, 34°28'08.8"N 4°20'42.4"W) (Figure 5). These locations were chosen for their extensive fig cultivation and commercial production.
The study area displays a typical Mediterranean climate which is humid in winter and semi-arid in summer. Taza and Taounate are under Mediterranean to semi-continental influence and receive around 432.9 mm and 477.3 mm of annual precipitations, withaverage temperatures of 19.48 °C and 19.58 °C, respectively. In contrast, Chefchaouen, under coastal influence, receives an annual precipitation of 624.4 mm with 20.2 °C as an average temperature.
The fig leaves were collected in the last week of August during the 2023 growing season. Four leaves from each variety were randomly sampled, stored in an ice box, and transported to the laboratory of Natural Resources and Environment, Polydisciplinary Faculty of Taza, where they were stored at -20°C up to analysis.
4.2. Physiological Traits Determination
4.2.1. Chlorophyll Fluorescence (Fv/Fm)
Chlorophyll fluorescence was recorded at 12:00 - 13:00 using a portable fluorometer (OS-30p, Opti-Science Inc., Hudson, NH, USA) following the procedure reported by [30]. Intact fig leaves were dark-adapted for 20 minutes to determine the minimum fluorescence (F0). Then the maximum fluorescence in light (Fm) was determined after applying a saturating actinic light pulse (3.000μmol m-2 s-1). F0 and Fm were used to determine the maximum quantum efficiency of photosystem II (PSII), given by Fv/Fm = (Fm-F0)/Fm.
4.2.2. SPAD Index
SPAD index was determined using a handheld SPAD meter (SPAD 502 plus, Konica Minolta), which measures the difference between the transmittance of a red (650 nm) and an infrared (940 nm) light through the leaf, generating a three-digit SPAD value [55]. SPAD measurement was done on at least three developed leaves per variety.
4.2.3. Total Chlorophyll Content (ChlT)
For estimating total chlorophyll content, 20 mg of finely chopped leaf sample of fig was added in 4 ml of DMSO (dimethyl sulfoxide) in a test tube and was incubated at 60 °C for 1h. Absorbance was recorded at 663 nm and 645 nm using UV–VIS spectrophotometer (Jenway Model 6100, Dunmow, Essex, UK) and total chlorophyll content were estimated [56].
4.2.4. Canopy Temperature Depression (CTD)
The CTD was calculated as the difference between air temperature and leaf temperature, with positive values when leaves were cooler than the air. Leaf temperature was recorded using a handheld infrared thermometer (320-EN-00, BENETECH) by targeting the leaves at a 45° angle to the horizontal. Readings were taken on bright, sunny, and non-windy days between 11.00 and 12.00 hrs. Air temperature was measured at the same time as the leaf temperature [45].
4.3. Biochemical Traits Determination
4.3.1. Proline Content
Proline content was quantified by a colorimetric method adapted from Bates et al [57]. Leaf fresh tissue (200 mg) was mixed with 4 mL of 3% sulfosalicylic acid and centrifuged at 1000 rpm for 10 min. Then, the ninhydrin buffer (2.5% ninhydrin, 60% acetic acid in 2.5 M phosphoric acid) and 100% acetic acid were added to 2 mL of supernatant (1:1:1, v/v/v) and heated at 100°C for 60 min. After cooling, 3 mL of toluene was added, and the optical density of the upper organic phase was read at 520 nm. Proline content was determined by comparison with L-proline as a standard curve.
4.3.2. Total Soluble Sugars (TSS)
Total soluble sugars (reported as mg. g-1 FW) was estimated according to the technique of Dubois et al [58]. Leaf sections (250 mg) were ground in 5 mL of 80% methanol (v/v) and boiled at 90°C for 30 min. Once cooled, 1 mL of the extract was combined with 1 mL of phenol (5%) and 5 mL of concentrated sulfuric acid. After agitation and cooling of the reagent mixture, the absorbance at 490 nm was read using methanol as a blank. Total soluble sugars concentration was estimated referring to a glucose solution as a standard curve.
4.3.3. Hydrogen Peroxide (H2O2)
Hydrogen peroxide content was measured using the protocol described by Sarker and Oba [59]. 250 mg of leaf sample was homogenized with 5 mL of trichloroacetic acid (0.1%) and centrifuged at 10.000g for 5 min. Then, the supernatant (0.2 mL) was mixed with 1 mL of KI (1 M) and 0.8 mL phosphate buffer (pH 7), and he absorbance of this mixture was read at 390 nm (Spectrophotometer JENWAY 6100, Dunmow, Essex, UK), and the hydrogen peroxide content was measured using a standard curve of H2O2.
4.3.4. Malondialdehyde (MDA)
MDA content was measured to evaluate lipid peroxidation. It was estimated using the method described by Sarker and Oba [59]. Frozen samples (250 mg) were mixed with 5 mL of trichloroacetic acid (0.1%) in an ice bath, and the solution was centrifuged at 10,000 g for 10 min. Then, 1 mL of the obtained supernatant was added to 4 mL of the prepared mixture of trichloroacetic acid ((TCA) 20%) and thiobarbituric acid ((TBA) 0.5%), subsequently was heated at 95 °C for 10 min. After centrifugation (10 000 rpm/5 min), the absorbance was measured at 532 nm (Spectrophotometer JENWAY 6100, Dunmow, Essex, UK) in order to determine the MDA content (mmol/g FW).
4.3.5. Protein Content
Protein content was determined following the method described by Sarker et al [60]. For protein extraction, 200 mg of leaf fresh tissue was homogenized in ice bath with 2 mL of phosphate sodium buffer (100 mM, pH 7.5) and the homogenate was centrifuged at 8000 rpm for 15 min. Then, 0.5 mL of the supernatant was added to 5 mL of the prepared reagent (50 mg of CuSO4.5H2O was added to 10 mL of 2% sodium tartarate; 1 mL of this solution was added to 50 mL of 2% sodium carbonate prepared in 0.1N NaOH), thoroughly mixed, and 0.5 mL of Folin-Ciocalteau reagent was added. After incubating, protein content was determined photometrically (Spectrophotometer JENWAY 6100, Dunmow, Essex, UK) using a standard curve of Bovine Serum Albumine (BSA).
4.4. Statistical Analysis
Combined analyses of variance (ANOVA) were performed to compare mean values for the different factors analyzed at significance level of p < 0,05. Principal component analysis (PCA) was conducted to identify the relationships between Physiological and biochemical parameters. All analysis was performed using Statgraphics Centurion 19 (StatPoint Technologies Inc., Virginia, USA).
5. Conclusions
Great variability was observed among fig varieties and geographic locations for the physiological and biochemical leaf traits, with the variety effect being the main source of variation. The high photosynthetic capacity and reduced stress indicators observed in Nabout suggest its suitability for cultivation under optimal conditions with minimal abiotic challenges. Conversely, Ghouddane variety exhibited high levels of proline and ROS, indicating a higher stress tolerance and suitability for harsh environments. These findings highlight the importance of integrating physiological and biochemical screening for selecting resilient fig genotypes. Long-term trials and stress-specific experiments are essential to better understand the adaptive capacity of each variety under varying environmental pressures.
Author Contributions
Conceptualization, Y.R., A.B. and M.E.; methodology, Y.R. and M.E.; investigation, M.E and R.B.; writing—original draft preparation, M.E. and R.B.; writing—review and editing, M.E., A.B. and Y.R.; visualization, M.E.; supervision, Y.R.; funding acquisition, Y.R. All authors have read and agreed to the published version of the manuscript.
Funding
This work was supported by internal funding from Sidi Mohamed Ben Abdellah University (Morocco).
Conflicts of Interest
The authors declare no conflicts of interest.
References
- Hao, G.-Y.; Goldstein, G.; Sack, L.; Holbrook, N.; Liu, Z.-H.; Wang, A.-Y.; Harrison, R.; Su, Z.-H.; Cao, K.-F. Ecology of Hemiepiphytism in Fig Species Is Based on Evolutionary Correlation of Hydraulics and Carbon Economy. Ecology 2011, 92, 2117–2130. [Google Scholar] [CrossRef]
- Mellal, M.K.; Khelifa, R.; Chelli, A.; Djouadi, N.; Madani, K. Combined Effects of Climate and Pests on Fig (Ficus Carica L.) Yield in a Mediterranean Region: Implications for Sustainable Agricultural Strategies. Sustainability (Switzerland) 2023, 15. [Google Scholar] [CrossRef]
- Huang, J.; Xu, R.; Peng, Y. Research Progress of Interspecific Hybridization in Genus Ficus. Biodiversity Science 2019, 27, 457–467. [Google Scholar] [CrossRef]
- Flaishman, M. Horticultural Practices under Various Climatic Conditions. In; 2022; pp. 117–138. ISBN 978-1-78924-247-8.
- Crisosto, H.; Ferguson, L.; Bremer, V.; Stover, E.; Colelli, G. 7 - Fig (Ficus Carica L.). In Postharvest Biology and Technology of Tropical and Subtropical Fruits; Yahia, E.M., Ed.; Woodhead Publishing Series in Food Science, Technology and Nutrition; Woodhead Publishing, 2011; pp. 134–160e. ISBN 978-1-84569-735-8.
- Stover, E.; Aradhya, M.; Ferguson, L.; Crisosto, C. The Fig: Overview of an Ancient Fruit. HortScience 2007, 42. [Google Scholar] [CrossRef]
- Maatallah, S.; Guizani, M.; Lahbib, K.; Montevecchi, G.; Santunione, G.; Hessini, K.; Dabbou, S. Physiological Traits, Fruit Morphology and Biochemical Performance of Six Old Fig Genotypes Grown in Warm Climates “Gafsa Oasis” in Tunisia. Journal of Agriculture and Food Research 2024, 17, 101253. [Google Scholar] [CrossRef]
- Micheloud, N.; Gabriel, P.; Favaro, J.C.; Gariglio, N. Agronomic Strategies for FigFig CultivationCultivation in a Temperate-Humid Climate Zone. In Fig (Ficus carica): Production, Processing, and Properties; Ramadan, M.F., Ed.; Springer International Publishing: Cham, 2023; pp. 193–214. ISBN 978-3-031-16493-4. [Google Scholar]
- Silva, F.S.O.; Pereira, E.C.; Mendonça, V.; Da Silva, R.M.; Alves, A.A. Phenology and Yield of the ‘Roxo de Valinhos’ Fig Cultivar in Western Potiguar. Revista Caatinga 2017, 30, 802–810. [Google Scholar] [CrossRef]
- Veberic, R.; Colaric, M.; Stampar, F. Phenolic Acids and Flavonoids of Fig Fruit (Ficus Carica L.) in the Northern Mediterranean Region. Food Chemistry 2008, 106, 153–157. [Google Scholar] [CrossRef]
- Statistiques| FAO | Organisation des Nations Unies pour l'alimentation et l'agriculture. Available online: http://www.fao.org/statistics/fr (accessed on 10 May 2025).
- Oukabli A; Mamouni A Fiche Technique Figuier (Ficus Carica L.), Installation et Conduite Technique de La Culture, Institut de La Recherche Agronomique, Maroc. 2008.
- Walali, L.; Skiredj, A.; Alattir, H. Fiches Techniques: L’amandier, l’olivier, Le Figuier, Le Grenadier; Bulletin de Transfert de Technologie en Agriculture, 105, 2003, 2003.
- Achtak, H.; Ater, M.; Oukabli, A.; Santoni, S.; Kjellberg, F.; Khadari, B. Traditional Agroecosystems as Conservatories and Incubators of Cultivated Plant Varietal Diversity: The Case of Fig (Ficus caricaL.) in Morocco. BMC Plant Biology 2010, 10, 28. [Google Scholar] [CrossRef]
- Hmimsa, Y.; Aumeeruddy-Thomas, Y.; Ater, M. Vernacular Taxonomy, Classification and Varietal Diversity of Fig (Ficus Carica L.) Among Jbala Cultivators in Northern Morocco. Human Ecology 2012, 40, 301–313. [Google Scholar] [CrossRef]
- Hssaini, L.; Hanine, H.; Razouk, R.; Ennahli, S.; Mekaoui, A.; Ejjilani, A.; Charafi, J. Assessment of Genetic Diversity in Moroccan Fig (Ficus Carica L.) Collection by Combining Morphological and Physicochemical Descriptors. Genetic Resources and Crop Evolution 2020, 67, 457–474. [Google Scholar] [CrossRef]
- Tikent, A.; Marhri, A.; Mihamou, A.; Sahib, N.; Serghini-Caid, H.; Elamrani, A.; Abid, M.; Addi, M. Phenotypic Polymorphism, Pomological and Chemical Characteristics of Some Local Varieties of Fig Trees (Ficus Carica L.) Grown in Eastern Morocco. In Proceedings of the E3S Web of Conferences; EDP Sciences, January 20 2022; Vol. 337. [Google Scholar]
- Hajjam, A.E.; Ezzahouani, A.; Sehhar, E.A. Conduite Technique et Inventaire Des Variétés Marocaines Locales de Figuier (Ficus Carica L.) Dans Quatre Principaux Sites de Production, Provinces de Chefchaouen, El Jadida, Ouezzane, et Taounate; 2018.
- Khadari, B.; Roger, J.P.; Ater, M.; Achtak, H.; Oukabli, A.; Kjellberg, F. Moroccan Fig Presents Specific Genetic Resources: A High Potential of Local Selection. In Proceedings of the Acta Horticulturae; International Society for Horticultural Science, 2008; Vol. 798, pp. 33–37.
- Hmimsa, Y.; Ramet, A.; Dubuisson, C.; El Fatehi, S.; Hossaert-McKey, M.; Kahi, H.; Munch, J.; Proffit, M.; Salpeteur, M.; Aumeeruddy-Thomas, Y. Pollination of the Mediterranean Fig Tree, Ficus Carica L.: Caprification Practices and Social Networks of Exchange of Caprifigs among Jbala Farmers in Northern Morocco. Human Ecology 2024, 52, 289–302. [Google Scholar] [CrossRef]
- Mafrica, R.; Bruno, M.; Fiozzo, V.; Caridi, R.; Sorgonà, A. Rooting, Growth, and Root Morphology of the Cuttings of Ficus Carica L. (Cv. “Dottato”): Cutting Types and Length and Growth Medium Effects. Plants 2025, 14, 160. [Google Scholar] [CrossRef]
- Şen, F.; Aksoy, U.; Özer, K.B.; Can, H.; Konak, R. Effect of Altitudes on Physical and Chemical Properties of Sun-Dried Fig ( Ficus Carica ‘Sarılop’) Fruit. Acta Horticulturae 2021, 149–156. [Google Scholar] [CrossRef]
- Trad, M.; Gaaliche, B.; Renard, C.M.G.C.; Mars, M. Inter- and Intra-Tree Variability in Quality of Figs. Influence of Altitude, Leaf Area and Fruit Position in the Canopy. Scientia Horticulturae 2013, 162, 49–54. [Google Scholar] [CrossRef]
- Ammar, A.; Ben Aissa, I.; Mars, M.; Gouiaa, M. Comparative Physiological Behavior of Fig (Ficus Carica L.) Cultivars in Response to Water Stress and Recovery. Scientia Horticulturae 2020, 260. [Google Scholar] [CrossRef]
- Ammar Arouaand Ben Aissa, I. and Z.F. and G.M. and M.M. Physiological Behaviour of Fig Tree (Ficus Carica L.) Under Different Climatic Conditions. In Fig (Ficus carica): Production, Processing, and Properties; Ramadan, M.F., Ed.; Springer International Publishing: Cham, 2023; pp. 247–257. ISBN 978-3-031-16493-4. [Google Scholar]
- Vemmos, S.N.; Petri, E.; Stournaras, V. Seasonal Changes in Photosynthetic Activity and Carbohydrate Content in Leaves and Fruit of Three Fig Cultivars (Ficus Carica L.). Scientia Horticulturae 2013, 160, 198–207. [Google Scholar] [CrossRef]
- Abdolinejad, R.; Shekafandeh, A. Tetraploidy Confers Superior in Vitro Water-Stress Tolerance to the Fig Tree (Ficus Carica) by Reinforcing Hormonal, Physiological, and Biochemical Defensive Systems. Frontiers in Plant Science 2022, 12, 796215. [Google Scholar] [CrossRef]
- Swoczyna, T.; Kalaji, H.M.; Bussotti, F.; Mojski, J.; Pollastrini, M. Environmental Stress - What Can We Learn from Chlorophyll a Fluorescence Analysis in Woody Plants? A Review. Frontiers in Plant Science 2022, 13. [Google Scholar] [CrossRef]
- Mohammadi Alagoz, S.; Asgari Lajayer, B.; Ghorbanpour, M. Chapter 10 - Proline and Soluble Carbohydrates Biosynthesis and Their Roles in Plants under Abiotic Stresses. In Plant Stress Mitigators; Ghorbanpour, M., Adnan Shahid, M., Eds.; Academic Press, 2023; pp. 169–185 ISBN 978-0-323-89871-3.
- El Yamani, M.; Sakar, E.H.; Boussakouran, A.; Rharrabti, Y. Leaf Water Status, Physiological Behavior and Biochemical Mechanism Involved in Young Olive Plants under Water Deficit. Scientia Horticulturae 2020, 261. [Google Scholar] [CrossRef]
- Boussakouran, A.; El Yamani, M.; Sakar, E.H.; Rharrabti, Y. Genetic Advance and Grain Yield Stability of Moroccan Durum Wheats Grown under Rainfed and Irrigated Conditions. International Journal of Agronomy 2021, 2021. [Google Scholar] [CrossRef]
- Can, H.; Meyvaci, K.B.; Balcı, B. Determination of Gas Exchange Capacity of Some Breba Fig Cultivars. Acta Horticulturae 2008, 798, 117–122. [Google Scholar] [CrossRef]
- Jia, Q.; Liu, Z.; Guo, C.; Wang, Y.; Yang, J.; Yu, Q.; Wang, J.; Zheng, F.; Lu, X. Relationship between Photosynthetic CO2 Assimilation and Chlorophyll Fluorescence for Winter Wheat under Water Stress. Plants 2023, 12. [Google Scholar] [CrossRef]
- Yuan, S.; Yin, T.; He, H.; Liu, X.; Long, X.; Dong, P.; Zhu, Z. Phenotypic, Metabolic and Genetic Adaptations of the Ficus Species to Abiotic Stress Response: A Comprehensive Review. International Journal of Molecular Sciences 2024, 25. [Google Scholar] [CrossRef]
- Ling, Q.; Huang, W.; Jarvis, P. Use of a SPAD-502 Meter to Measure Leaf Chlorophyll Concentration in Arabidopsis Thaliana. Photosynthesis Research 2011, 107, 209–214. [Google Scholar] [CrossRef]
- Mardinata, Z.; Edy Sabli, T.; Ulpah, S. Biochemical Responses and Leaf Gas Exchange of Fig (Ficus Carica l.) to Water Stress, Short-Term Elevated Co2 Levels and Brassinolide Application. Horticulturae 2021, 7. [Google Scholar] [CrossRef]
- Sharma, L.; Priya, M.; Bindumadhava, H.; Nair, R.M.; Nayyar, H. Influence of High Temperature Stress on Growth, Phenology and Yield Performance of Mungbean [Vigna Radiata (L.) Wilczek] under Managed Growth Conditions. Scientia Horticulturae 2016, 213, 379–391. [Google Scholar] [CrossRef]
- Del Rosario Jacobo-Salcedo, M.; Valdez-Cepeda, R.D.; Sánchez-Cohen, I.; González-Espíndola, L.; Arreola-ávila, J.G.; Trejo-Calzada, R. Physiological Mechanisms in Ficus Carica L. Genotypes in Response to Moisture Stress. Agronomy Research 2024, 22, 685–702. [Google Scholar] [CrossRef]
- Zivcak, M.; Brestic, M.; Kalaji, H.M. ; Govindjee Photosynthetic Responses of Sun- and Shade-Grown Barley Leaves to High Light: Is the Lower PSII Connectivity in Shade Leaves Associated with Protection against Excess of Light? Photosynthesis Research 2014, 119, 339–354. [Google Scholar] [CrossRef]
- Kalaji, H.M.; Carpentier, R.; Allakhverdiev, S.I.; Bosa, K. Fluorescence Parameters as Early Indicators of Light Stress in Barley. Journal of Photochemistry and Photobiology B: Biology 2012, 112, 1–6. [Google Scholar] [CrossRef]
- Mlinarić, S.; Antunović Dunić, J.; Štolfa, I.; Cesar, V.; Lepeduš, H. High Irradiation and Increased Temperature Induce Different Strategies for Competent Photosynthesis in Young and Mature Fig Leaves. South African Journal of Botany 2016, 103, 25–31. [Google Scholar] [CrossRef]
- Verslues, P.E.; Agarwal, M.; Katiyar-Agarwal, S.; Zhu, J.; Zhu, J.K. Methods and Concepts in Quantifying Resistance to Drought, Salt and Freezing, Abiotic Stresses That Affect Plant Water Status. Plant Journal 2006, 45, 523–539. [Google Scholar] [CrossRef]
- Yang, X.; Lu, M.; Wang, Y.; Wang, Y.; Liu, Z.; Chen, S. Response Mechanism of Plants to Drought Stress. Horticulturae 2021, 7. [Google Scholar] [CrossRef]
- Valluru, R.; Van Den Ende, W. Plant Fructans in Stress Environments: Emerging Concepts and Future Prospects. Journal of Experimental Botany 2008, 59, 2905–2916. [Google Scholar] [CrossRef]
- Boussakouran, A.; El Yamani, M.; Sakar, E.H.; Rharrabti, Y. Genetic Progress in Physiological and Biochemical Traits Related to Grain Yield in Moroccan Durum Wheat Varieties from 1984 to 2007. Crop Science 2022, 62, 53–66. [Google Scholar] [CrossRef]
- Hayat, S.; Hayat, Q.; Alyemeni, M.N.; Wani, A.S.; Pichtel, J.; Ahmad, A. Role of Proline under Changing Environments: A Review. Plant Signaling and Behavior 2012, 7. [Google Scholar] [CrossRef]
- Bouhraoua, S.; Ferioun, M.; Nassira, S.; Boussakouran, A.; Akhazzane, M.; Belahcen, D.; Hammani, K.; Louahlia, S. Biomass Partitioning and Physiological Responses of Four Moroccan Barley Varieties Subjected to Salt Stress in a Hydroponic System. Journal of Plant Biotechnology 2023, 50, 115–126. [Google Scholar] [CrossRef]
- Ferioun, M.; Bouhraoua, S.; Belahcen, D.; Zouitane, I.; Srhiouar, N.; Louahlia, S.; El Ghachtouli, N. PGPR Consortia Enhance Growth and Yield in Barley Cultivars Subjected to Severe Drought Stress and Subsequent Recovery. Rhizosphere 2024, 31. [Google Scholar] [CrossRef]
- Møller, I.M.; Jensen, P.E.; Hansson, A. Oxidative Modifications to Cellular Components in Plants. Annual Review of Plant Biology 2007, 58, 459–481. [Google Scholar] [CrossRef] [PubMed]
- Czarnocka, W.; Karpiński, S. Friend or Foe? Reactive Oxygen Species Production, Scavenging and Signaling in Plant Response to Environmental Stresses. Free Radical Biology and Medicine 2018, 122, 4–20. [Google Scholar] [CrossRef]
- Zaid, A.; Wani, S.H. Reactive Oxygen Species Generation, Scavenging and Signaling in Plant Defense Responses. In Bioactive Molecules in Plant Defense: Signaling in Growth and Stress; Jogaiah, S., Abdelrahman, M., Eds.; Springer International Publishing: Cham, 2019; pp. 111–132. ISBN 978-3-030-27165-7. [Google Scholar]
- Choudhury, F.K.; Rivero, R.M.; Blumwald, E.; Mittler, R. Reactive Oxygen Species, Abiotic Stress and Stress Combination. Plant Journal 2017, 90, 856–867. [Google Scholar] [CrossRef]
- Hossain, M.A.; Bhattacharjee, S.; Armin, S.M.; Qian, P.; Xin, W.; Li, H.Y.; Burritt, D.J.; Fujita, M.; Tran, L.S.P. Hydrogen Peroxide Priming Modulates Abiotic Oxidative Stress Tolerance: Insights from ROS Detoxification and Scavenging. Frontiers in Plant Science 2015, 6. [Google Scholar] [CrossRef] [PubMed]
- Zivcak Marekand Olsovska, K. and B.M. Photosynthetic Responses Under Harmful and Changing Environment: Practical Aspects in Crop Research. In Photosynthesis: Structures, Mechanisms, and Applications; Hou Harvey J.M.and Najafpour, M.M. and M.G.F. and A.S.I., Ed.; Springer International Publishing: Cham, 2017; pp. 203–248. ISBN 978-3-319-48873-8. [Google Scholar]
- Uddling, J.; Gelang-Alfredsson, J.; Piikki, K.; Pleijel, H. Evaluating the Relationship between Leaf Chlorophyll Concentration and SPAD-502 Chlorophyll Meter Readings. Photosynthesis Research 2007, 91, 37–46. [Google Scholar] [CrossRef] [PubMed]
- Burnison, B.K. Modified Dimethyl Sulfoxide (DMSO) Extraction for Chlorophyll Analysis of Phytoplankton. Canadian Journal of Fisheries and Aquatic Sciences 1980, 37, 729–733. [Google Scholar] [CrossRef]
- Bates, L.S.; Waldren, R.P.; Teare, I.D. Rapid Determination of Free Proline for Water-Stress Studies. Plant and Soil 1973, 39, 205–207. [Google Scholar] [CrossRef]
- Dubois, M.; Gilles, K.; Hamilton, J.K.; Rebers, P.A.; Smith, F. A Colorimetric Method for the Determination of Sugars. Nature 1951, 168, 167–167. [Google Scholar] [CrossRef] [PubMed]
- Sarker, U.; Oba, S. Drought Stress Effects on Growth, ROS Markers, Compatible Solutes, Phenolics, Flavonoids, and Antioxidant Activity in Amaranthus Tricolor. Appl Biochem Biotechnol 2018, 186, 999–1016. [Google Scholar] [CrossRef]
- Sarker, U.; Islam, M.T.; Rabbani, M.G.; Oba, S. Variability, Heritability and Genetic Association in Vegetable Amaranth (Amaranthus Tricolor L.). Spanish Journal of Agricultural Research 2015, 13, e0702–e0702. [Google Scholar] [CrossRef]
Figure 1.
Means values of SPAD index (a), total chlorophylls ChlT (b), chlorophyll fluorescence Fv/Fm (c) and canopy temperature depression CTD (d) of four fig varieties (FAS: Fassi. GHO: Ghouddane. NBT: Nabout. OQH: Ounq Hmam) grown at three different locations (Chefchaouen. Taounate and Taza).
Figure 1.
Means values of SPAD index (a), total chlorophylls ChlT (b), chlorophyll fluorescence Fv/Fm (c) and canopy temperature depression CTD (d) of four fig varieties (FAS: Fassi. GHO: Ghouddane. NBT: Nabout. OQH: Ounq Hmam) grown at three different locations (Chefchaouen. Taounate and Taza).
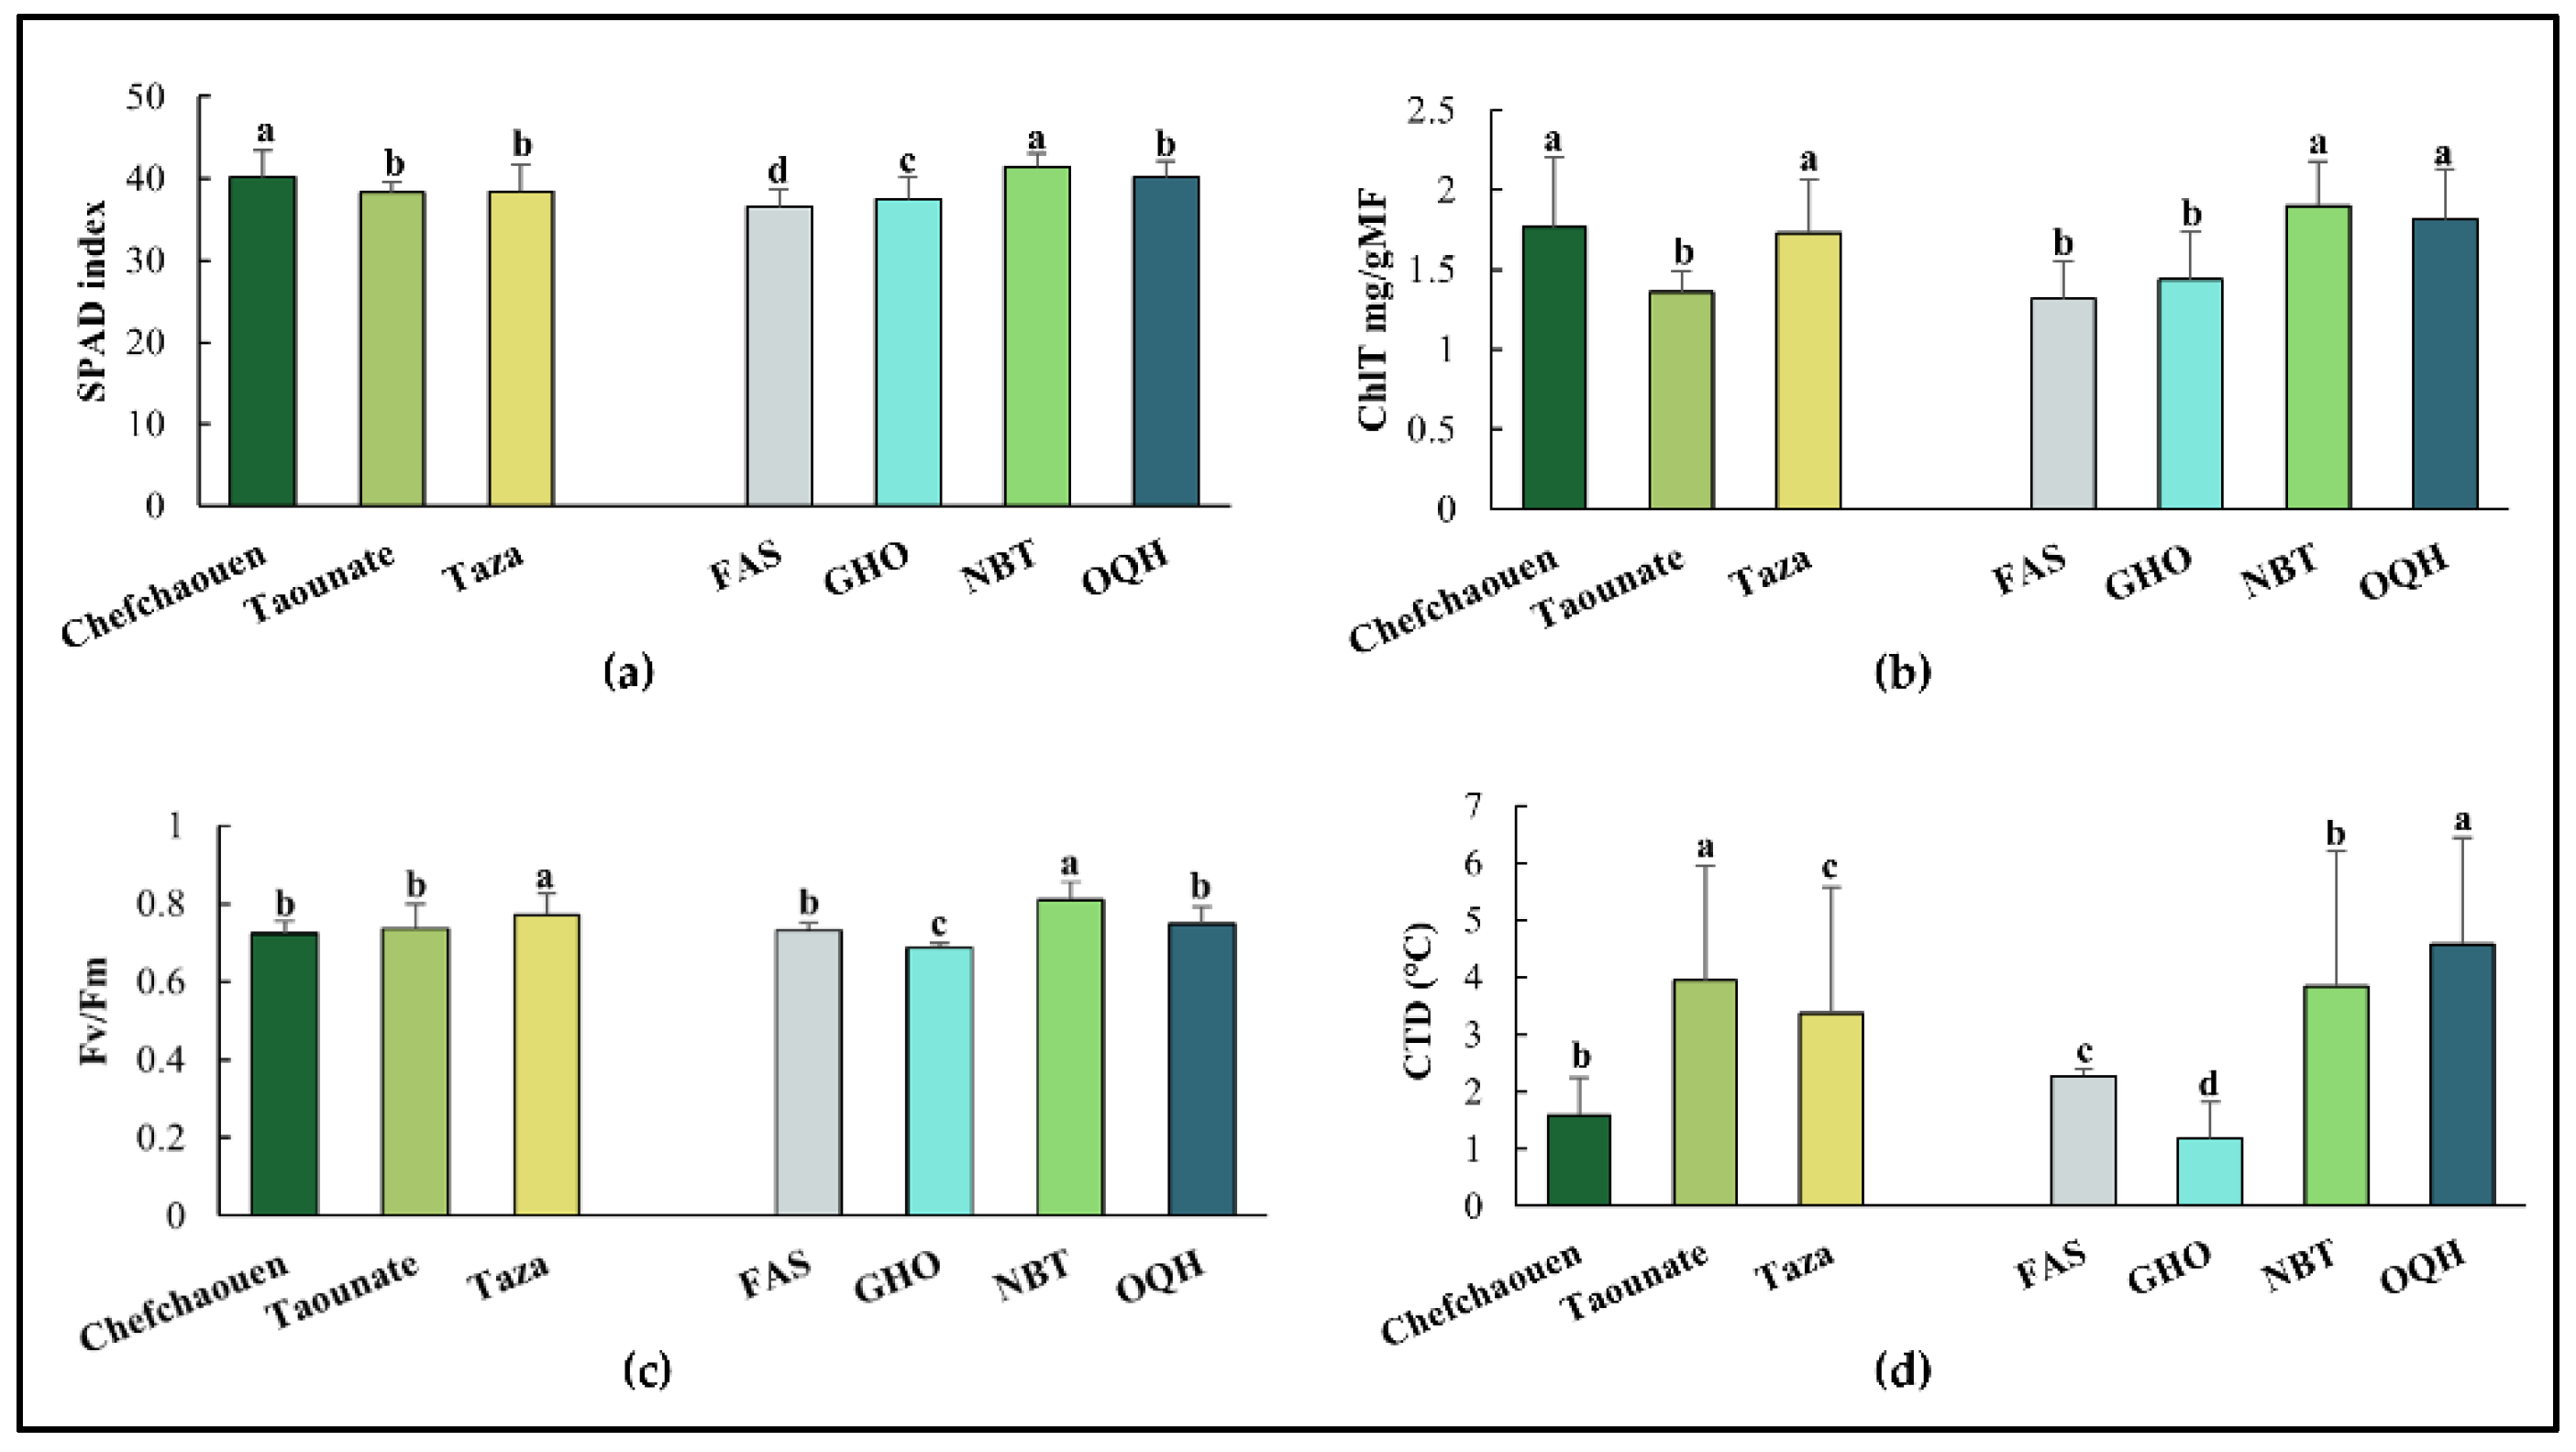
Figure 2.
Means values of protein content (a), total soluble sugars TSS (b), proline (c), malondialdehyde MDA (d) and hydrogen peroxide H2O2 (e) of four fig varieties (FAS: Fassi. GHO: Ghouddane. NBT: Nabout. OQH: Ounq Hmam) grown at three different locations in northern Morocco (Chefchaouan. Taounate and Taza).
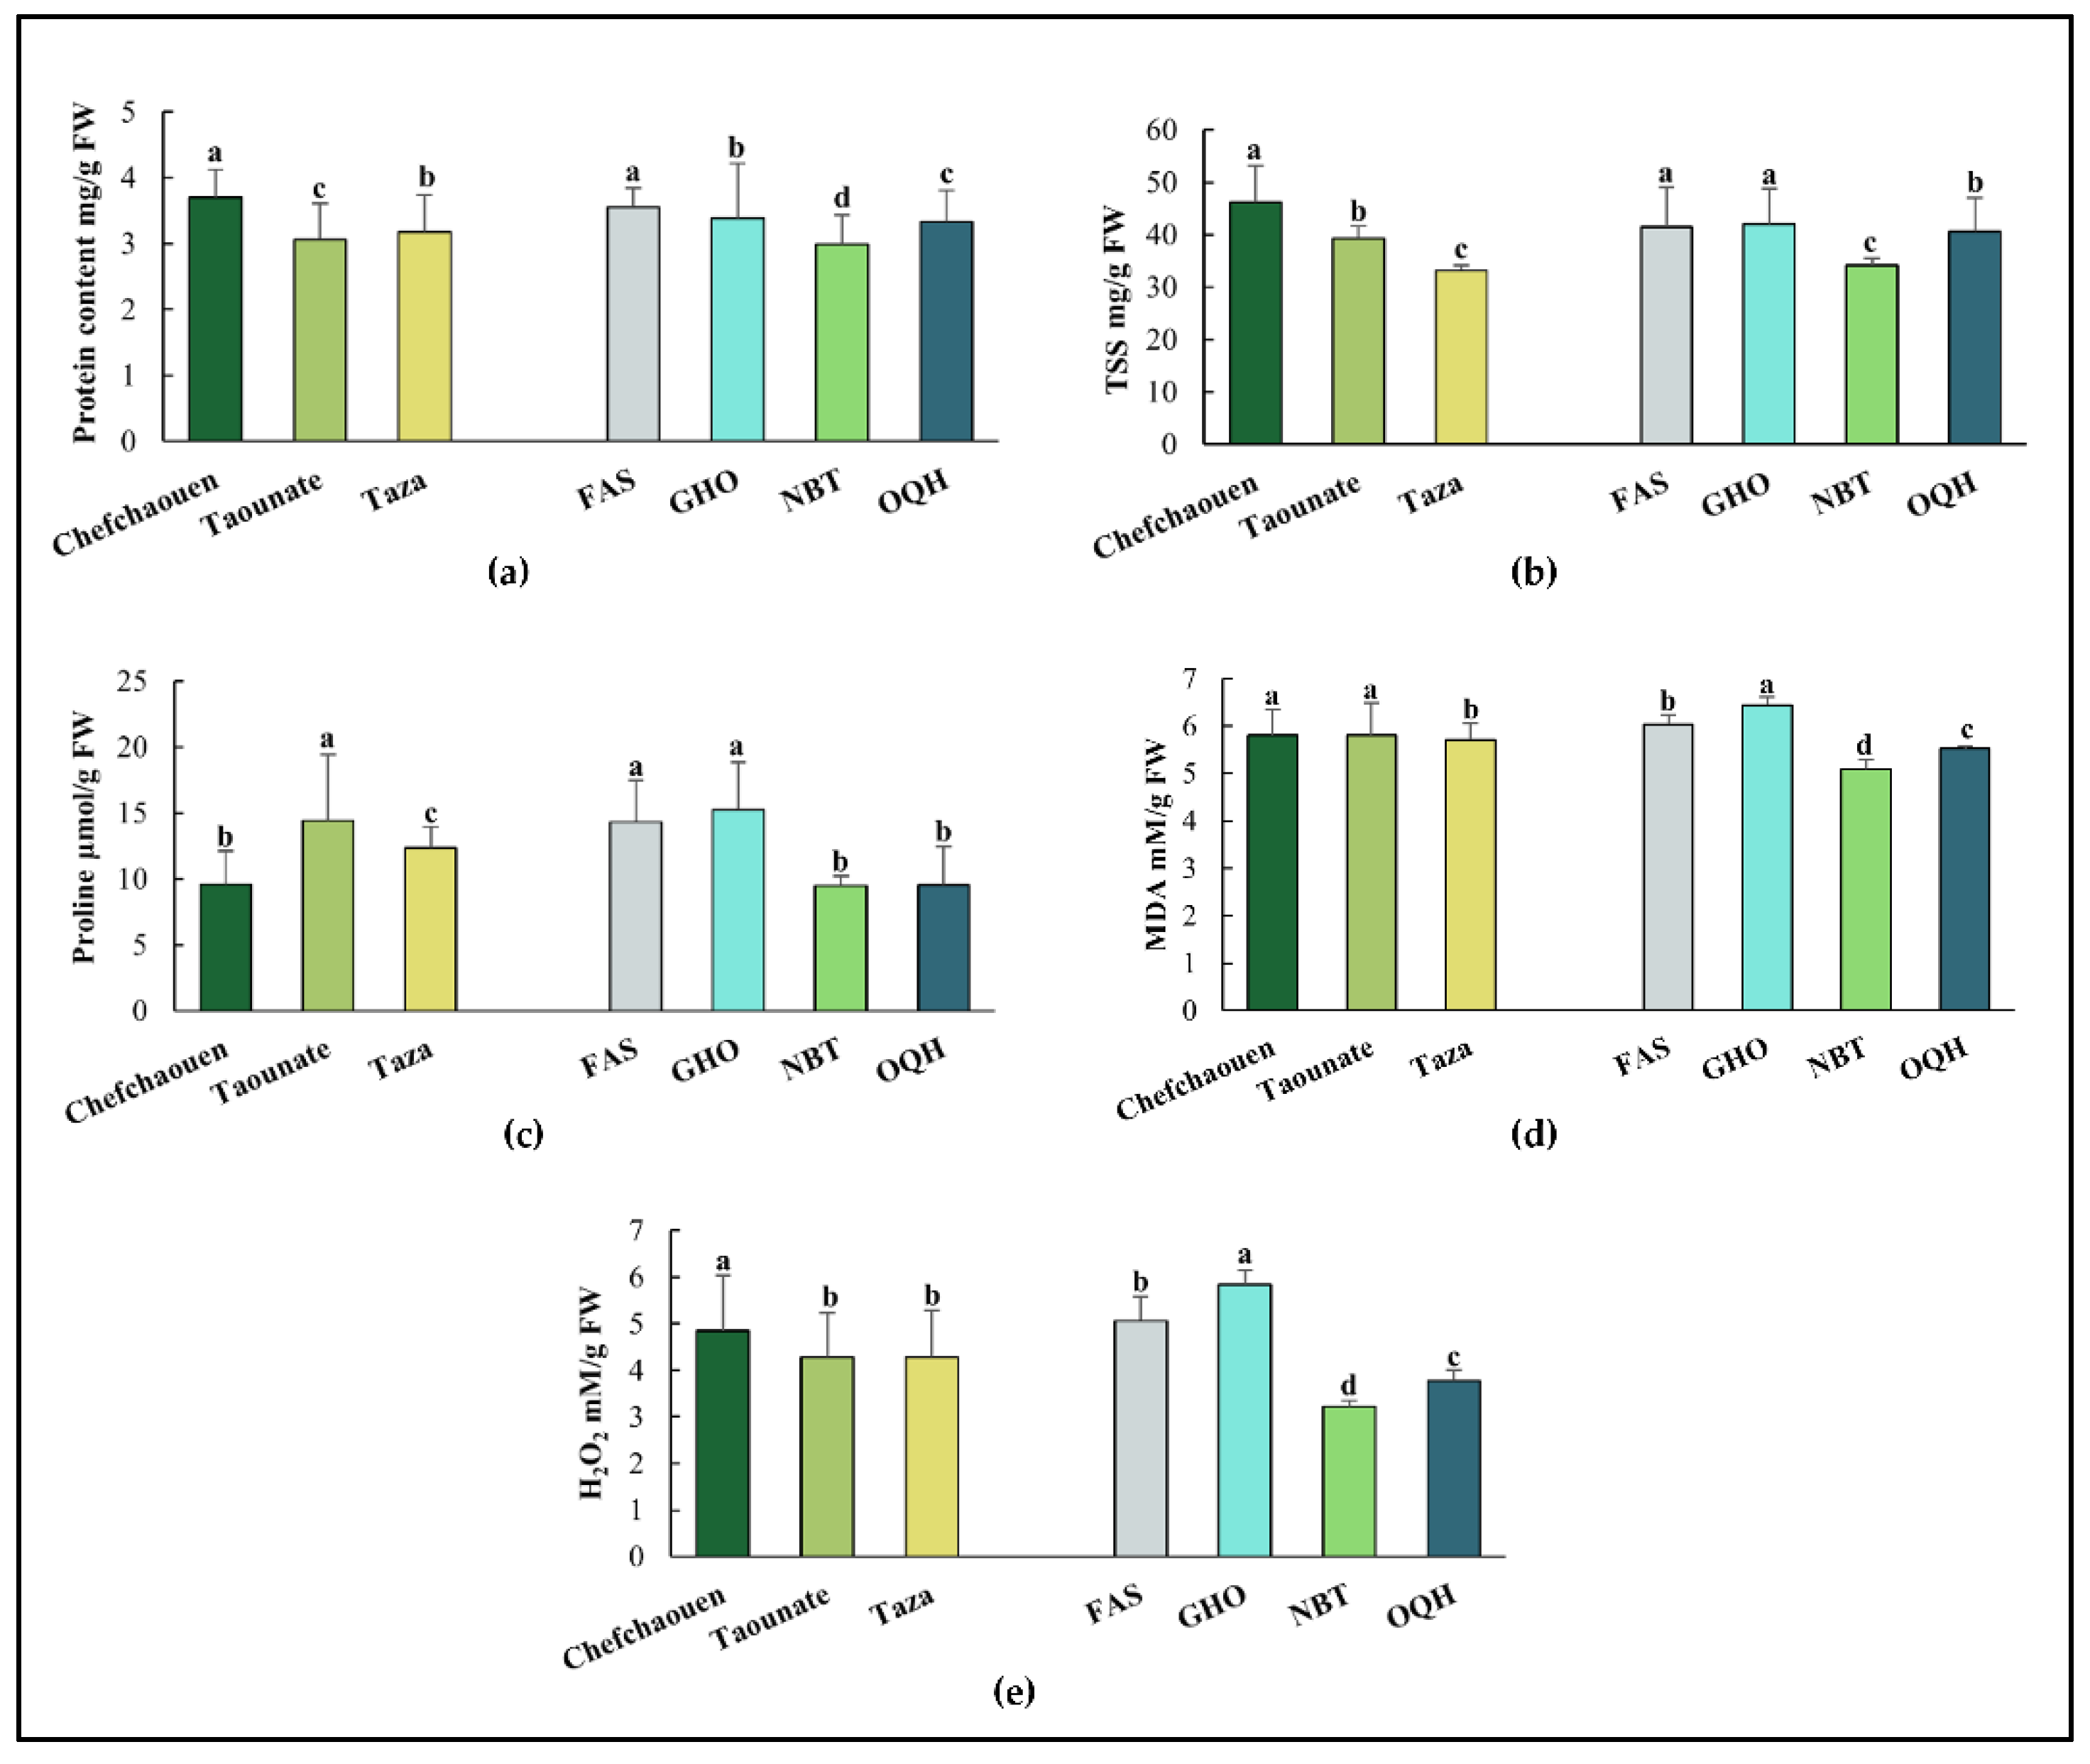
Figure 3.
PCA projections on axes 1 and 2 accounting for 72% of total variance. Eigenvalues of the correlation matrix are symbolized as vectors representing traits that most influence each axis. The 12 points representing traits means for each variety (FAS: Fassi, GHO: Ghouddane, NBT: Nabout, OQH: Ounq hmam) are plotted on the plane determined by axes 1 and 2. Fv/Fm: chlorophyll fluorescence, ChlT: total chlorophyll content, TSS: total soluble sugars, CTD: canopy temperature depression, MDA: malondialdehyde, H2O2: hydrogen peroxide.
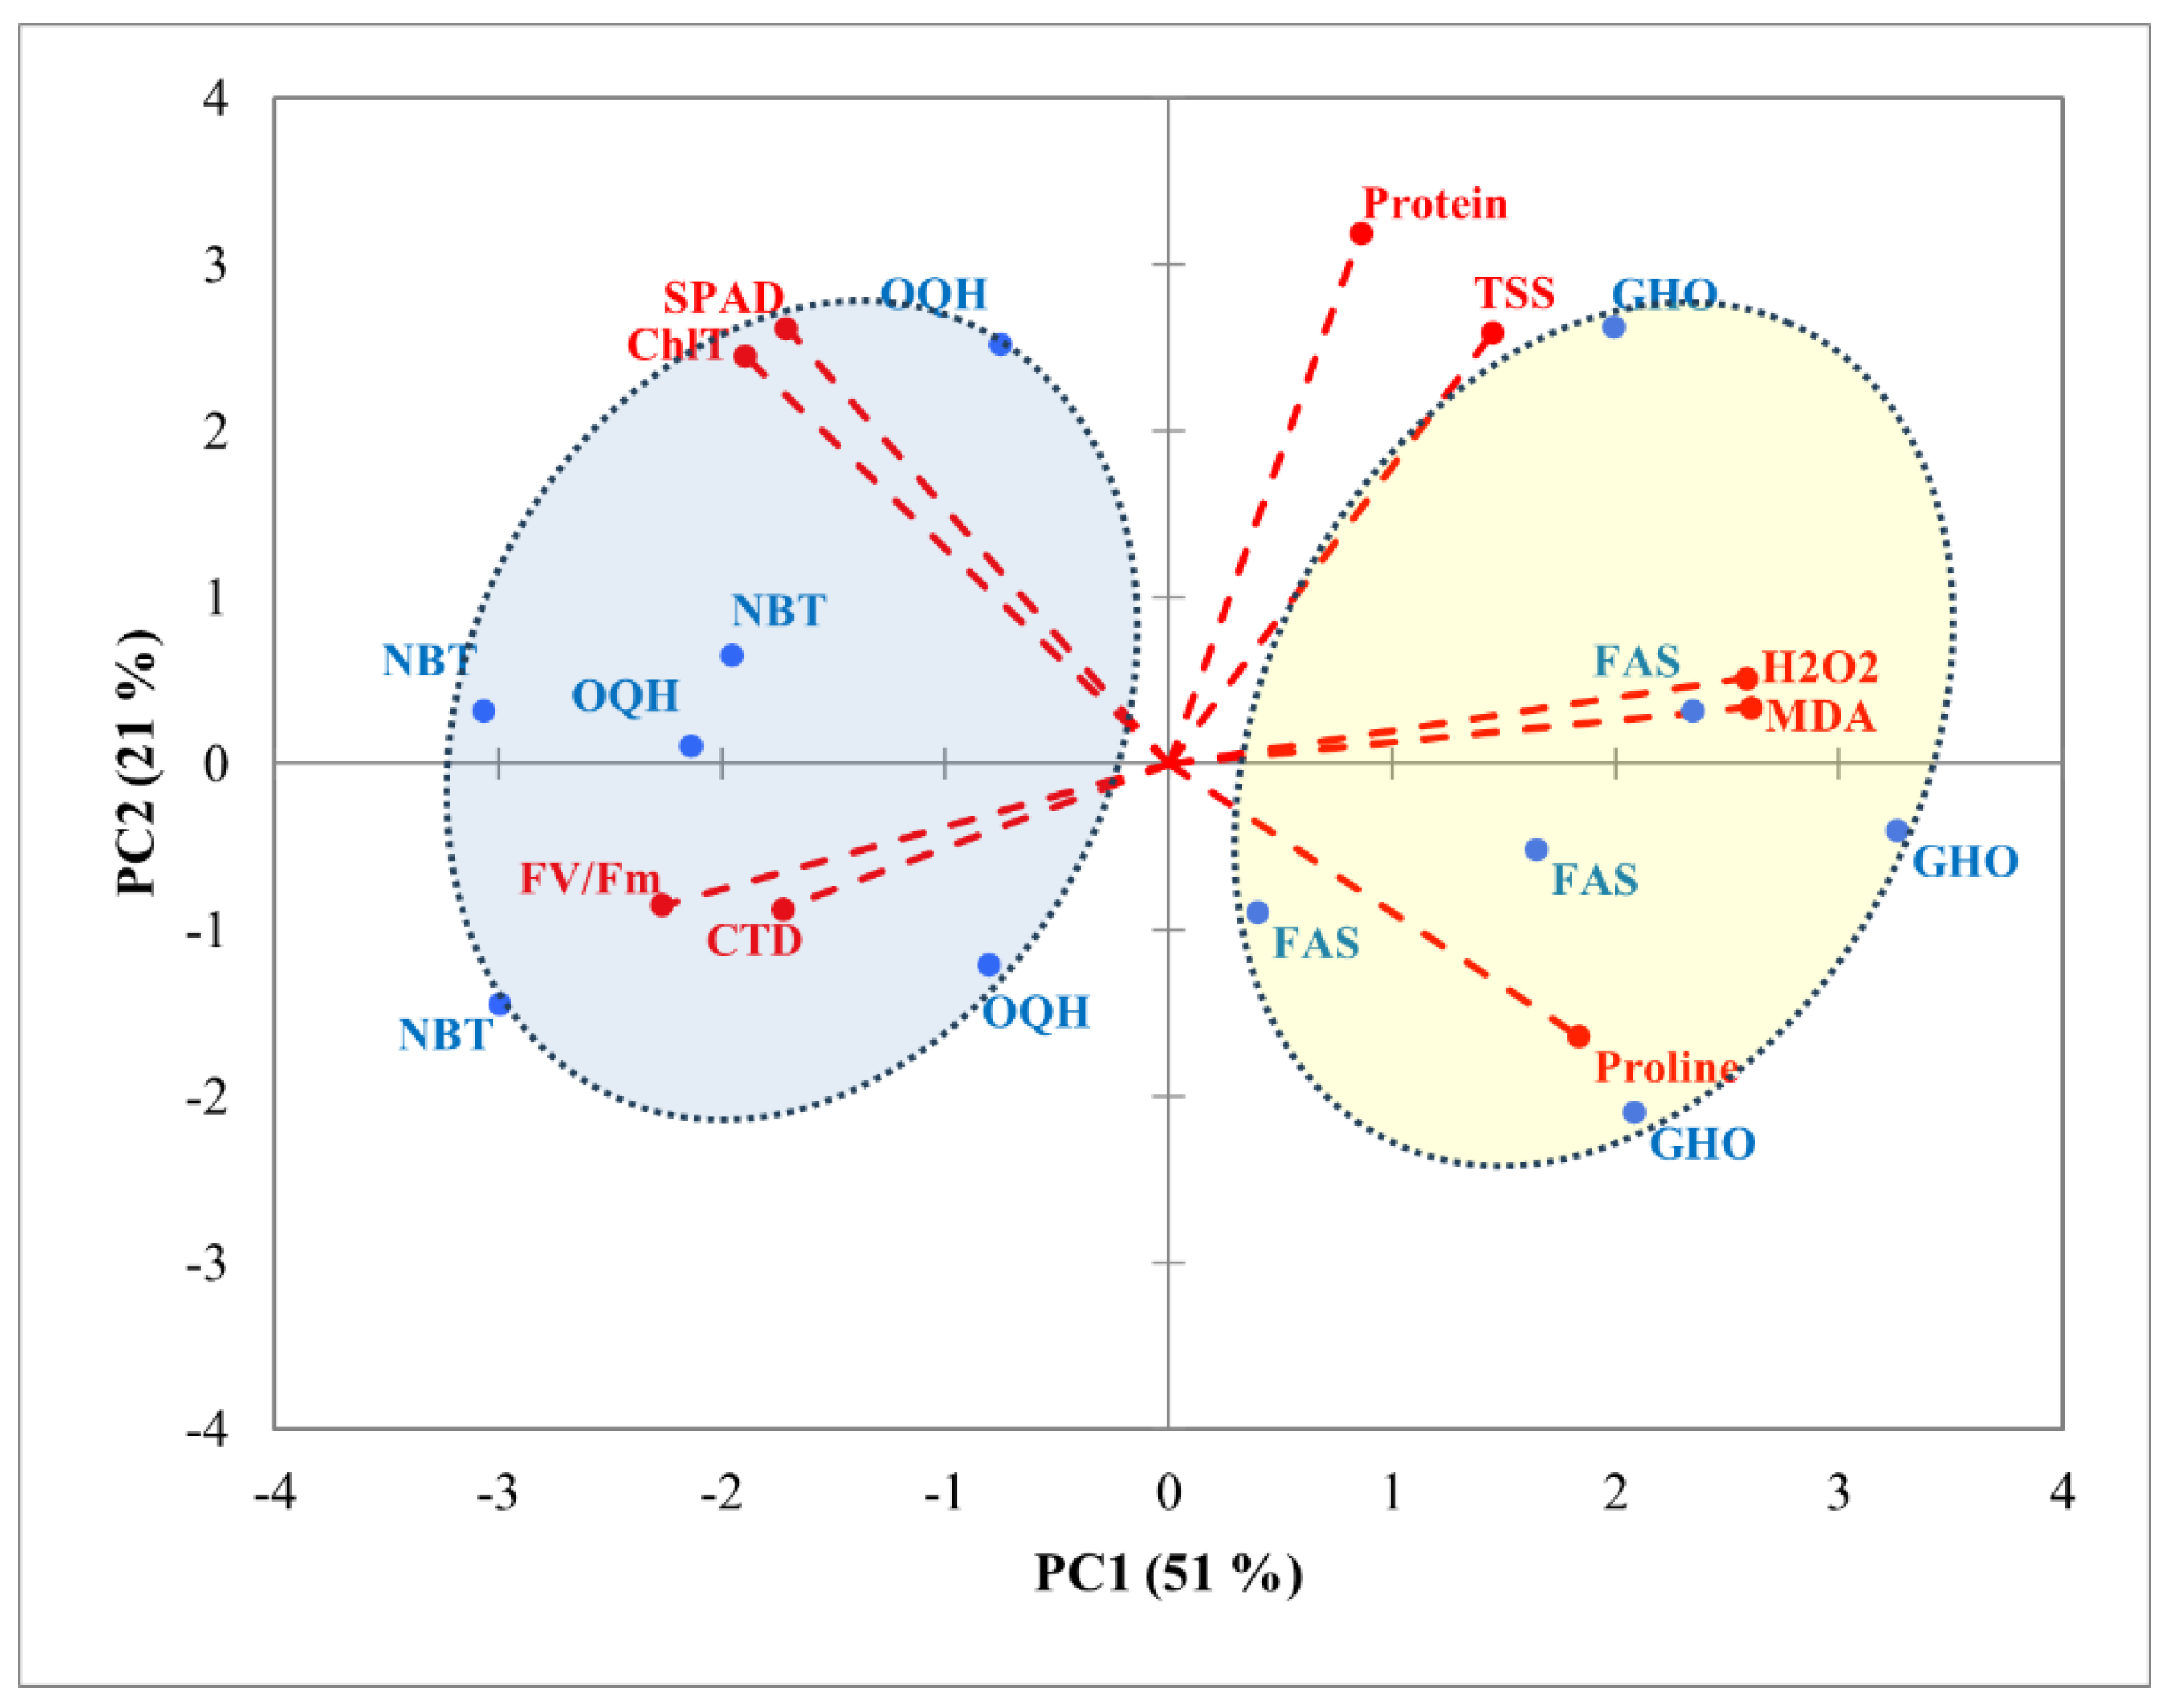
Figure 4.
PCA projections on axes 1 and 2 accounting for 72% of total variance. Eigenvalues of the correlation matrix are symbolized as vectors representing traits that most influence each axis. The 12 points representing traits means for each location (Chefchaouan, Taounate and Taza) are plotted on the plane determined by axes 1 and 2. Fv/Fm: chlorophyll fluorescence, ChlT: total chlorophyll content, TSS: total soluble sugars, CTD: canopy temperature depression, MDA: malondialdehyde, H2O2: hydrogen peroxide.
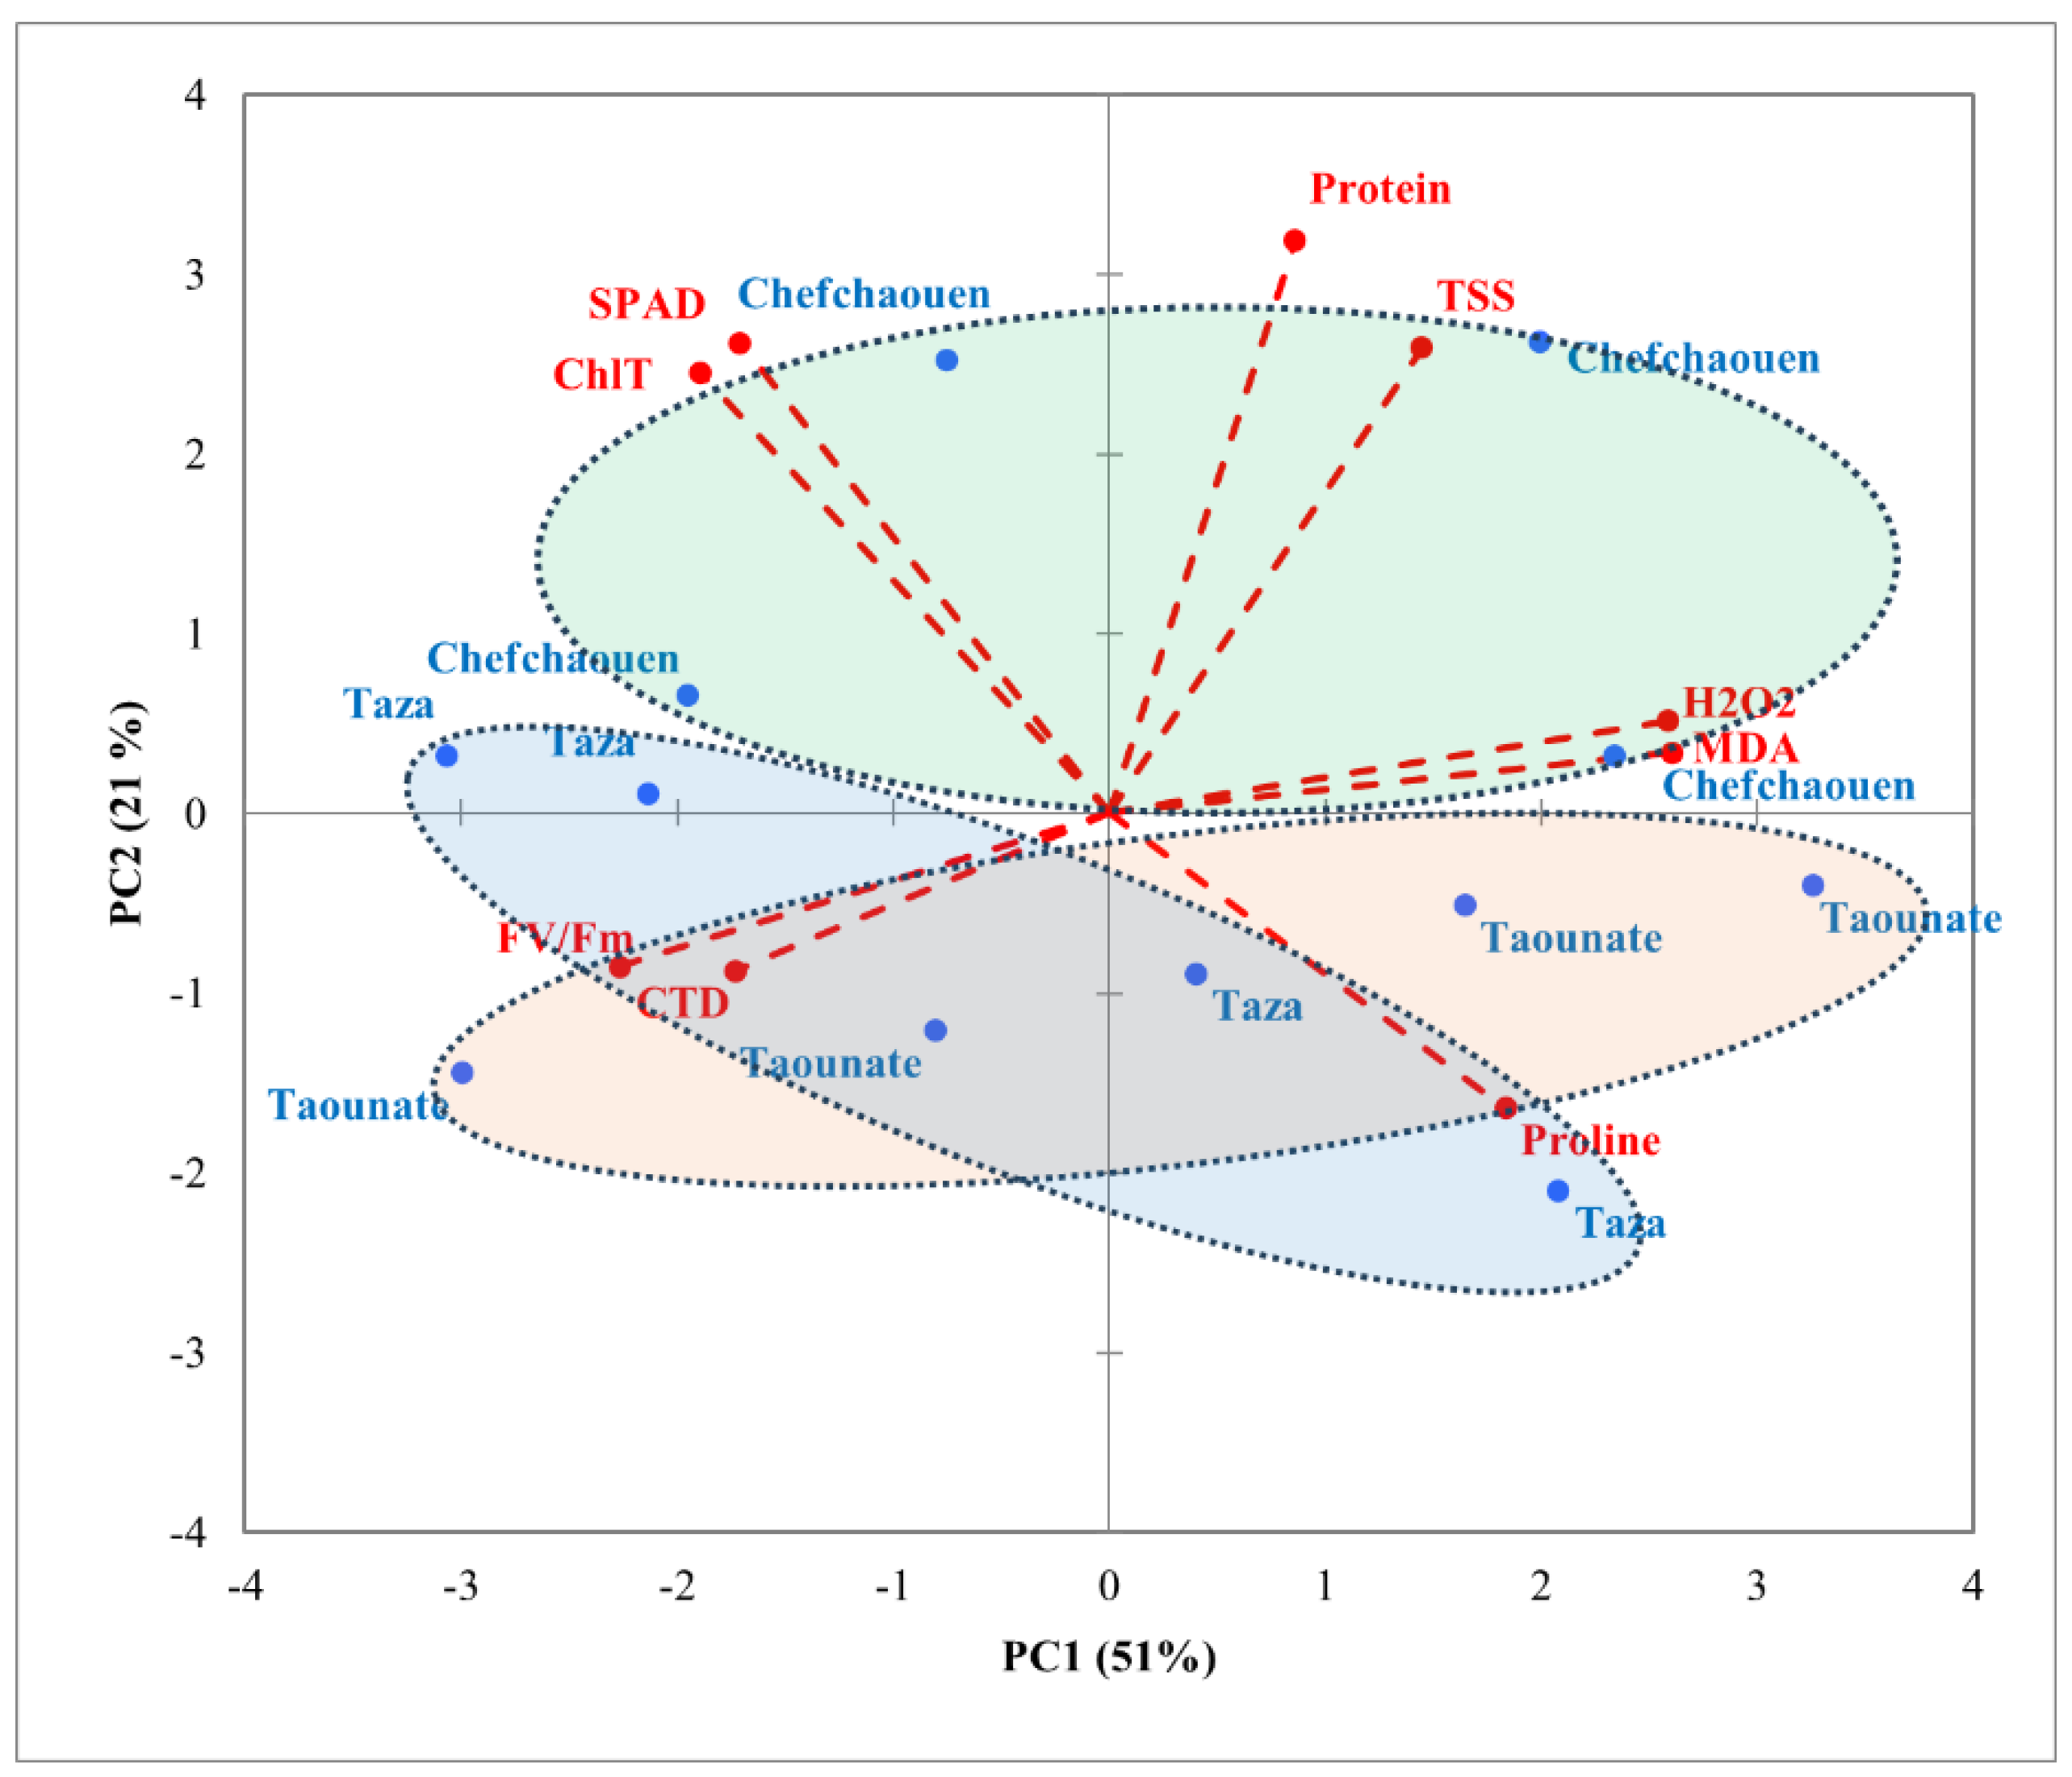
Figure 5.
Geographical localization of the three locations.
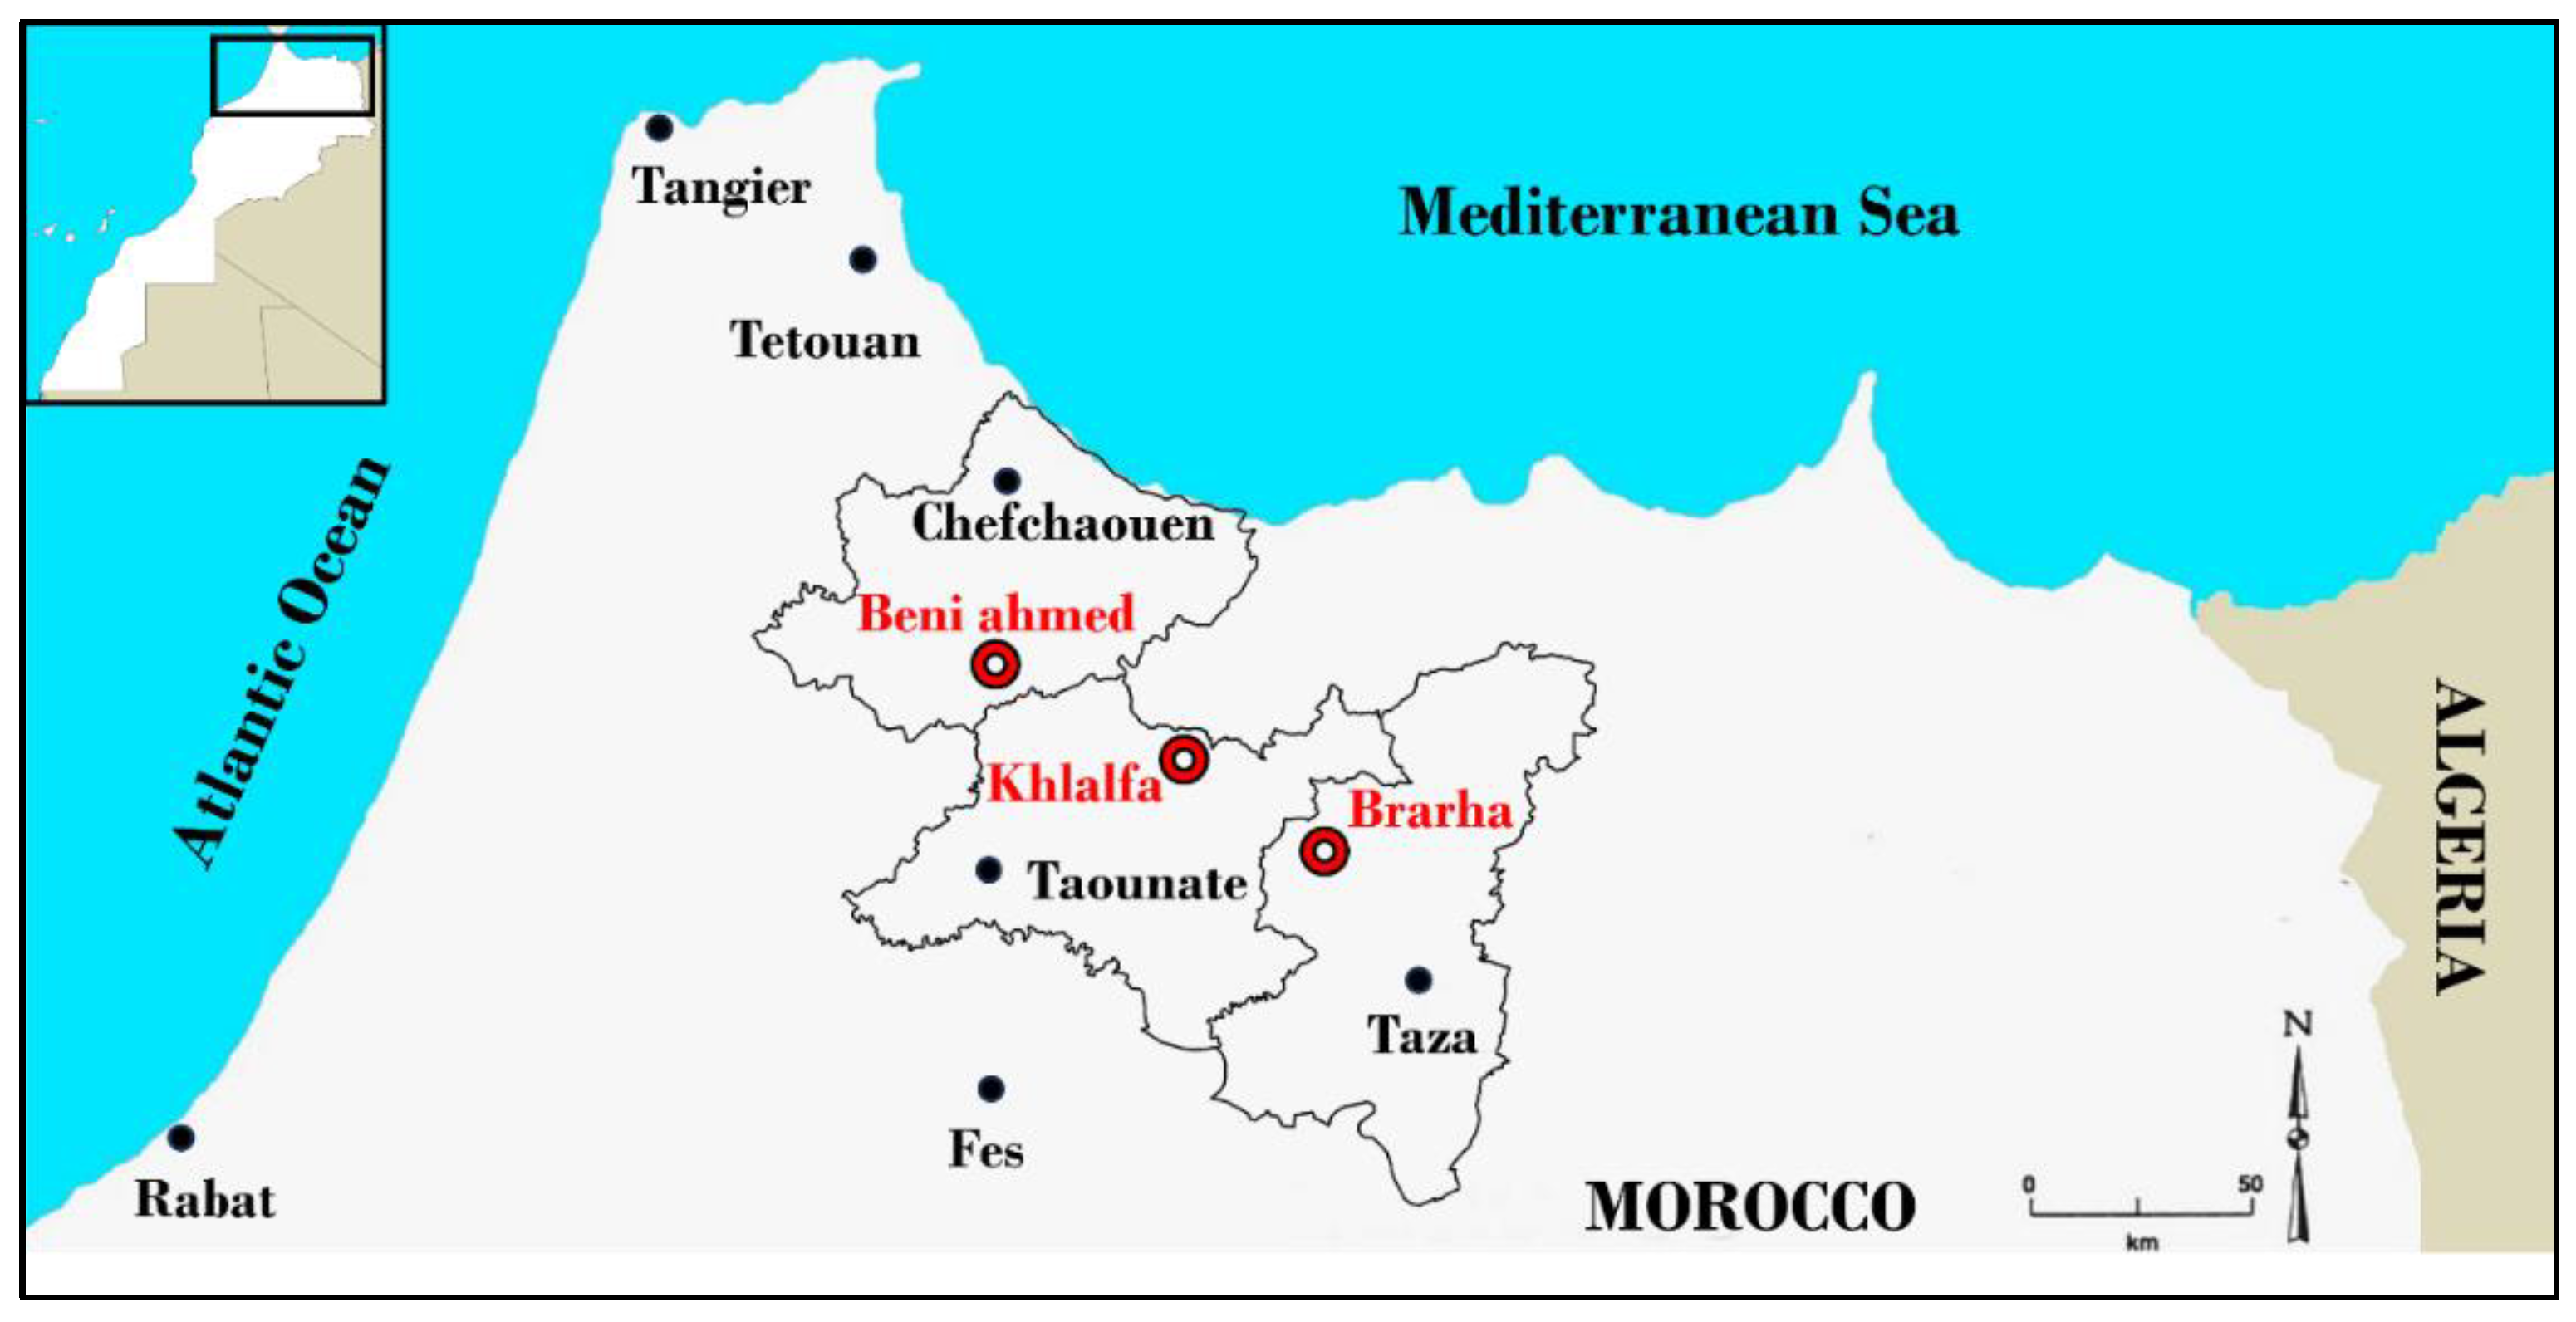

Table 1.
Analyses of variance for SPAD index, total chlorophyll content (ChlT), chlorophyll fluorescence (Fv/Fm), canopy temperature depression (CTD), proline content, protein content, total soluble sugar (TSS), Hydrogen peroxide (H2O2) and malondialdehyde (MDA) in leaves of four fig varieties grown at three locations in northern Morocco.
| Variation | Df | SPAD | ChlT | FV/Fm | CTD | Proline | Protein | TSS | H₂O₂ | MDA |
|---|---|---|---|---|---|---|---|---|---|---|
| Location | 2 | 13.264*** | 0.614*** | 0.00751*** | 18.0123*** | 70.926*** | 1.4238*** | 5.137*** | 1.293*** | 0.0398*** |
| Variety | 3 | 47.284*** | 0.718*** | 0.02358*** | 21.0292*** | 85.12*** | 0.4952*** | 1.2196*** | 12.764*** | 3.2001*** |
| Replicate | 2 | 0.285 | 0.018 | 0.00005 | 0.0003 | 0.929 | 0.0011 | 0.004 | 0.005 | 0.0008 |
| Location*Variety | 6 | 22.850*** | 0.239*** | 0.00366*** | 8.1465*** | 19.706*** | 1.3355*** | 0.469*** | 0.208*** | 0.1545*** |
| Residual | 22 | 0.187 | 0.010 | 0.00022 | 0.0006 | 1.457 | 0.0009 | 0.004 | 0.004 | 0.0007 |
| Total (corrected) | 35 |
* Significant at 0.05 probability level; ** Significant at 0.01 probability level; *** Significant at 0.001 probability level.
Table 2.
Correlations between SPAD index, total chlorophyll content (ChlT), chlorophyll fluorescence (Fv/Fm), canopy temperature depression (CTD), proline content, protein content, total soluble sugar (TSS), Hydrogen peroxide (H2O2) and malondialdehyde (MDA) in leaves of four fig varieties grown at three locations in northern Morocco.
| SPAD | ChlT | Fv/Fm | CTD | Protein | TSS | Proline | H2O2 | MDA | |
|---|---|---|---|---|---|---|---|---|---|
| SPAD | 0.834*** | 0.299 | 0.216 | 0.186 | -0.051 | -0.433** | -0.543*** | -0.502*** | |
| ChlT | 0.356* | 0.153 | 0.188 | -0.229 | -0.552*** | -0.556*** | -0.570*** | ||
| Fv/Fm | 0.652*** | -0.223 | -0.499*** | -0.456** | -0.732*** | -0.761*** | |||
| CTD | -0.160 | -0.263 | -0.295 | -0.633*** | -0.509*** | ||||
| Protein | 0.556*** | 0.080 | 0.351* | 0.426* | |||||
| TSS | -0.113 | 0.580*** | 0.488*** | ||||||
| Proline | 0.492*** | 0.683*** | |||||||
| H2O2 | 0.930*** | ||||||||
| MDA |
* Significant at 0.05 probability level; ** Significant at 0.01 probability level; *** Significant at 0.001 probability level.
Disclaimer/Publisher’s Note: The statements, opinions and data contained in all publications are solely those of the individual author(s) and contributor(s) and not of MDPI and/or the editor(s). MDPI and/or the editor(s) disclaim responsibility for any injury to people or property resulting from any ideas, methods, instructions or products referred to in the content. |
© 2025 by the authors. Licensee MDPI, Basel, Switzerland. This article is an open access article distributed under the terms and conditions of the Creative Commons Attribution (CC BY) license (http://creativecommons.org/licenses/by/4.0/).
Copyright: This open access article is published under a Creative Commons CC BY 4.0 license, which permit the free download, distribution, and reuse, provided that the author and preprint are cited in any reuse.


