
Submitted:
19 May 2025
Posted:
19 May 2025
You are already at the latest version
Abstract
This study investigates farmers’ knowledge, perceptions, and adaptation strategies to climate change in Rwanda’s Eastern Province, integrating social and physical science approaches. Analysing meteorological data (1981-2021) and surveys from 204 farmers across five districts, we assessed climate trends and adaptation behaviors using statistical methods (descriptive statistics, Chi-square, logistic regression, Regional Kendall test, dynamic linear state-space model). Results show that 85% of farmers acknowledge climate change, with 54% observing temperature increases and 37% noting rainfall declines. Climate data confirm significant rises in annual minimum (+2.95°C) and mean temperatures (+1.87°C), with the largest seasonal increase (+3.37°C) in June-August. Rainfall trends indicate a non-significant decrease in March-May and a slight increase in September-December. Farmers report crop failures, yield reductions, and food shortages as major climate impacts. Common adaptations include agroforestry, crop diversification, and fertilizer use, though financial limitations, information gaps, and input scarcity impede adoption. Despite limited formal education (53.9% primary, 22.3% no formal education), indigenous knowledge aids seasonal prediction. Livestock ownership, group membership, and climate data access are key adaptation enablers. These findings emphasize the need for targeted policies and climate communication to enhance rural resilience by strengthening smallholder farmer support systems for effective climate adaptation.
Keywords:
climate change
; climate trends
; farmer perception
; adaptation strategies
; small holder farmers
; Eastern Rwanda
1. Introduction
Increasing greenhouse gases in the earth’s atmosphere owing to human activities such as the burning of fossil fuels and deforestation together with natural activities since the mid-20th century, resulted in a global average temperature increase [1,2,3]. The rise in the earth’s temperature, known as global warming, influences climate and weather patterns from global to local scales. The existing consequences of climate change that have been identified include frequent and intense droughts, downpours, floods, hurricanes, storms, water scarcity, severe wildfires, melting polar ice, sea level rise, and declining biodiversity [4]. Those consequences have hit most of the critical sectors of life, ranging from agriculture, food production, water resources, energy, health and public health systems, transportation, infrastructure, ecosystems, and biodiversity [5].
People worldwide experience climate change impacts in various ways, with varying severity based on geographic location and primary economic activities. Agriculture remains a crucial sector supporting a significant portion of the population in Africa, a continent with many developing nations. Most agricultural activities are rain-dependent, increasing their vulnerability to climate change effects [6,7]. Changes in temperature and rainfall patterns owing to climate change have posed significant challenges for agricultural communities across the African continent, with the severity of these challenges varying from region to region and country to country.
In East Africa, many people in this region, especially those in agriculture sector, are impacted by climate change through protracted droughts, floodings, and water scarcity, which put them at risk of food insecurity [8]. Rwanda, one of the East African nations, has been previously studied, revealing changes in temperature and rainfall during important seasons over the years. These changes include the observed decline in seasonal and annual total rainfall [9,10,11,12] and increasing temperature [13,14,15] in many parts of the country. Rwanda’s Eastern Province, which is the largest under agricultural production, studies including Sebaziga et al. [11] and Rwema et al. [16] noted a decrease in seasonal rainfall while a high increase in temperature was also recorded over this region [17].
Increased temperatures and decreased rainfall often resulted in diminished water availability for rainfed agriculture, increasing the likelihood of droughts and intensifying pressure on agricultural water resources [18,19]. Over the past few decades, Eastern Rwanda has faced recurring deficits in rainfall, resulting in severe and prolonged droughts. Consequently, water scarcity and food insecurity have escalated in this area [20,21], leading to diverse experiences among farmers.
Repeated exposure to climate-related hazards influences individuals’ perceptions [22], prompting the development of various adaptation and mitigation strategies to address the perceived impacts. Factors including knowledge, beliefs, and perceptions play a crucial role in developing and adopting adaptation strategies. It is imperative to understand climate change comprehensively by exploring its physical mechanism and considering individual behaviors in response to the occurring changes.
Previous studies conducted in Eastern Rwanda have predominantly centered on climatic mechanisms, particularly analysing trends and variabilities in annual and seasonal temperature and rainfall patterns [9,11,16]. Studying the climate aspect is very important for several reasons: it promotes a better understanding of patterns and dynamics of climate systems. It also reveals long-term trends in climate variables, which further explain significant implications for vital sectors such as agriculture, water resources, and health. Furthermore, analysing historical data enables the construction of models and projections for future climate conditions, which is crucial for decision-makers to take appropriate actions to adapt to and mitigate the potential impact of climate change. However, very little attention has been put into exploring the variations in behaviors among individuals, particularly farmers, concerning their perceptions, experiences, and knowledge of climate change across the Eastern Province. This information helps identify the knowledge gaps and misconceptions, allowing for tailored educational efforts [23] in vulnerable communities.
Studying how individuals perceive and experience climate change is also instrumental in assessing their behavioral responses and identifying barriers to adaptation and sustainable behaviours [24]. Additionally, engaging with local and indigenous knowledge provides valuable insights into climate change impacts at local and regional levels. This knowledge complements historical data, informs policy decisions, and contributes to more context-specific responses.
This study aims to explore farmers’ knowledge and perceptions of climate change, its impacts, and the adaptation strategies employed in the Eastern Province. Additionally, it seeks to identify the factors that influence farmers’ decisions to adopt specific adaptation measures. To accomplish this, we analysed data gathered from interviews with farmers across five districts in Eastern Rwanda.
The remaining part of this manuscript is structured as follows: the second section gives details of the methods used for data collection and analysis in the study. The third section presents the findings, which are discussed further in the fourth section. Lastly, the fifth section provides conclusions and offers recommendations.
2. Materials and Methods
2.1. Study Area
This study is conducted in the Eastern Province of Rwanda, the largest (9813000000 m²) of the five provinces. Its administrative borders connect this province to three countries: Uganda to the North, Tanzania to the East, and Burundi to the South. It is subdivided into seven districts: Bugesera, Gatsibo, Kayonza, Kirehe, Ngoma, Nyagatare, and Rwamagana (see Figure 1). Geographically, the Eastern Province is located approximately between longitudes 29.9° and 30.9° E and latitudes 1.1° and 2.3° S. The region’s topography features lowland areas with altitudes below 1,500 m, characterized by a high annual mean temperature exceeding 293.15 K and low annual rainfall of less than 1,000 mm. With the largest population (i.e., 3,563,145), the region’s economy mainly relies on agriculture and livestock. The Eastern region experiences four seasons throughout the year, including two rainy seasons and two dry seasons. The primary rainy seasons occur from March to May (MAM) and from September to December (SOND), with April and November serving as the peak months for these seasons, respectively. Conversely, the dry seasons take place from January to February (JF) and from June to August [25]. Most agricultural practices in this area rely on rainfall and align with the two rainy seasons [26,27]. The main crops in Eastern Rwanda include maize, beans, sorghum, rice, cassava, and bananas. As in other parts of the country, the high dependence on rainfall increases vulnerability to the adverse impacts of changes and variability in rainfall and temperature [18,19]. Over the past few decades, drought has emerged as a significant challenge in this region, leading to decreased agricultural and livestock production, exacerbating food insecurity among a substantial portion of the population [20,21]. From the Northern to the Southern regions of the Eastern Province, farmers have extensive insights to share, particularly about climate change, its impacts, and various adaptation strategies. The farmers participating in this study were recruited from five of the seven districts in the Eastern Province: Nyagatare, Gatsibo, Kayonza, Ngoma, and Kirehe (see Figure 1).
2.2. Sample (s)
The total number of 638,806 agricultural households from seven districts of the Eastern Province [28] was considered to be the population size. With Yamane’s formula [29], we estimated the size of the sample to be 204 heads of households at a 93% confidence level, which implies allowing a margin error of 7%.
where Sample size, Total population, and Margin of error.
Multistage sampling was used to select respondent farmers from the Eastern Province. Five of the seven districts in the Eastern Province were chosen purposely to ensure representation from the North, Central, and Southern regions. In the North, we included Nyagatare and Gatsibo districts; in the Central area, we included Kayonza district; and in the South, we included Ngoma and Kirehe districts (See Figure 1.). Sectors from each district were selected systematically, mainly based on agriculture activities, farmers’ availability, and accessibility. From each sector, with the assistance of sector agronomists, we purposely selected cells based on farmers’ availability. In each cell, the Executive Secretary or Socio-Economic Development Officer (SEDO) helped identify exemplar farmers who randomly helped select their fellow farmers. The distribution of respondent farmers from the districts to cells, as shown in Table 1., indicates the number of respondent farmers per district as follows: Nyagatare (33), Gatsibo (35), Kayonza (36), Ngoma (74), and Kirehe (26).
2.3. Data Type and Data Collection Approach
The meteorological data analysed included rainfall through derived seasonal rainfall variables such as seasonal rainfall amount, onset and cessation, and seasonal duration, along with minimum, maximum, and average temperatures at both annual and seasonal levels. The rainfall and temperature datasets were obtained from the Rwanda Meteorology Agency (Meteo Rwanda) [30]. The farmers’ data were based on recorded responses from interviews conducted in November 2023 with farmers from the Eastern Province of Rwanda. A semi-structured questionnaire featuring both open and closed questions was prepared and used for data collection. The information gathered can be categorised into five main sections. The first section targeted the socioeconomic characteristics of the participants; section two examined knowledge of weather and climate change; section three focused on farmers’ perceptions regarding climate change and its impacts. In section four, we explored farmers’ adaptation strategies, while section five addressed barriers to adaptation. Using the Open Data Kit (ODK) [31], the questionnaire was refined and incorporated into smartphones and tablets for use during field interviews with the data collectors. We applied an in-depth interview technique involving intensive individual interviews with 204 farmers from the Eastern Province. Depending on the respondent’s understanding, the interview lasted between 3,600 and 5,400 seconds. Farmers involved in the survey verbally agreed, expressing their readiness to participate in our interviews.
2.4. Data Analysis
2.4.1. Climate Data Analysis
To analyze rainfall events, we applied the non-parametric Regional Kendall test [32]. This test enhances the Mann-Kendall test [33,34] by enabling the simultaneous analysis of trends across multiple locations while accounting for spatial correlation among datasets. It is robust against non-normal distributions and is less influenced by missing data and outliers [35]. This enhanced capacity allows for the identification of region-wide patterns and trends, considering the interrelationships among different monitoring stations or regions. The Regional Kendall test has been widely employed to determine whether there is an increasing or decreasing trend over time in environmental and climatic data [36,37,38]. The magnitude of the trend was quantified using the non-parametric Sen’s Slope estimator, which is reliable and resistant to the influence of outliers [11,16,39]. Seasonal and annual changes in minimum, maximum, and mean temperatures are calculated using a dynamic linear state-space model. This model effectively captures overall changes and temporal patterns by connecting hidden states that evolve over time to observed measurements while accounting for random fluctuations [40,41,42,43]. The construction procedure for a DLM model and estimations of model states and parameters can be found in Rwema et al. [44], which utilizes a similar DLM model to investigate trends in air temperature across nearly homogeneous zones of the Eastern Province of Rwanda.
2.4.2. Farmers’ Field Data Analysis
After collecting field data, we processed and analysed the dataset using Microsoft Excel and IBM SPSS Statistics version 28.0.0 [45] for a comprehensive statistical evaluation. All responses were anonymized to protect participants’ identities. The analysis primarily employed descriptive statistics, including frequencies, means, and percentages. A Chi-square test was conducted to explore whether a significant association exists between gender and adaptation strategies. The binary logistic model was used to examine how socioeconomic factors influence farmers’ choice of adaptation strategies. As farmers utilized multiple adaptation strategies in combination, it was recommended to use a logistic regression approach to identify the determinants of farmers’ choices regarding adaptation strategies [46]. This approach allows for the assessment of adoption choices by categorizing the dependent variables into a binary choice: either adopted or not adopted. The binary logistic model can be expressed as:
where is the dependent variable (hidden) for a farmer who adopts strategy . The represents independent variables (k factors that influence the farmer’s decision). The and are, respectively, the intercept and the coefficient of the model, while is the error term. From Eq. (2), the condition for is set to be
where is the dependent variable (observed), indicating that the farmer will (will not) adopt strategy as . Therefore, the conditional probability that is defined as:
here, denotes the particular value of the independent variable for a specific observation being evaluated for its conditional probability. Where is the binomial distribution [47].
To obtain the marginal effects that explain the significance and the magnitude of the relationship between dependent variables (i.e., adaptation strategies) and independent variables (i.e., factors influencing farmers’ choices), the derivative of Eq. (4) with respect to is required.
Then, the coefficients in Eq. (5) are explained concerning marginal effects on odds ratios [48]. Having as the probability that a farmer adopts the adaptation strategy , the odds ratio is , the ratio of the probability of adopting to the probability of not adopting [49].
Various scholars, including Acquah-de Graft [50], Asekun-Olarinmoye et al. [51], Kabir et al. [52], Mubalama et al. [53], Mushagalusa et al. [54], and Batungwanayo et al. [46], have employed this approach to examine the factors influencing farmers’ decisions regarding adaptation measures. The model was validated using the Omnibus and Hosmer and Lemeshow tests, which assess its robustness by comparing the predictors with a model that includes only an intercept. Accordingly, it follows an asymptotic Chi-square distribution, with degrees of freedom determined by the difference between the number of variables in the predictor model and the intercept-only model [55]. The Omnibus test should yield a significant p-value (< 0.05), while the Hosmer and Lemeshow test should produce an insignificant p-value (> 0.05). To evaluate the model’s accuracy, we utilize the classification method, which compares the predicted scores from the model’s independent variables against their actual responses recorded in the data. Consequently, the model’s accuracy reflects the proportion of correctly estimated positive and negative events relative to the total number of events [49]. Higher percentages indicate effective performance.
3. Results
3.1. Changes in Temperature and Rainfall Events in Eastern Province
The investigation of temperature trends has revealed a significant positive increase in annual mean temperature over Eastern Rwanda (Table 2). The mean annual maximum temperature showed no significant change. The mean seasonal minimum temperature demonstrated a notable positive change across all seasons, suggesting that the observed rise in both seasonal and annual mean temperatures is mainly attributed to increasing minimum temperatures. Rainfall amounts in the Eastern Rwanda region exhibit non-significant decreasing and increasing trends during the March to May and September to December seasons, respectively (Table 3). The onset of the rainy season has changed significantly, starting earlier than in the past. The length of the seasons indicates an increase across the region in both periods, with a significant change noted for the September to December season.
3.2. Socioeconomic Characteristics of Respondent Farmers
Table 4 presents the socioeconomic characteristics of 204 respondent farmers (heads of household) in the Eastern Province of Rwanda. 57% of the respondents were male and 43% were female. The mean age of the respondents was 44 years old, and they had a mean farming experience of 22 years. The mean duration of working on a farm per day was 20160 s. The respondents exhibited a low level of education, with the majority (61%) having attended only primary school, and 17% reporting no formal education. The farm sizes ranged from 200 to 10000 m2 for 71% of respondents, from 11000 to 20000 m2 for 20%, and from 21000 m2 and above for 10%, with an average size of 13000 m2. Of the respondents, 48% exclusively farm on hillsides, 15% solely farm in wetlands, and 38% engage in farming activities in both hillsides and wetlands. The majority (53%) of respondents utilised inherited land for agriculture, while 17% relied on privately rented land, and 30% of respondents utilised both inherited and rented land. The primary farming objective for the majority (68%) of the respondents was to generate income while meeting home consumption needs. Meanwhile, 30% focused solely on home consumption, and 2% aimed solely at generating income. Most respondents primarily cultivated maize (90%) and beans (89%) as their main crops. While doing agriculture, 64% of respondents are also engaged in livestock breeding, while 36% do not engage in livestock activities. 37% of respondents were members of at least one farmer group, while 63% did not belong to any group. 79% of respondents reported exchanging agricultural information with fellow farmers, while 21% did not. The majority (51%) of respondents lacked access to weather information, while 49% primarily accessed it through radio broadcasts. More than half (58%) of the respondents had access to banking services and had bank accounts, while 42% were not linked to any banking institution. On average, the household size was 5 persons.
3.3. Farmers’ Knowledge of Weather and Climate Change
The climate variables linked to farmers’ indigenous knowledge of critical agricultural indicators such as the onset and cessation of rainy seasons, are presented in Table 5.. As many as 35% of respondent farmers reported that they could predict/forecast the seasonal onset based on cloud features. For example, one farmer explained: “As the onset of rainy season approaches, we begin to observe dark clouds circulating in the sky and experience very cold mornings while the nights grow warmer,” (farmer number 178). 19% of respondent farmers claimed to have knowledge linked to the wind direction and patterns prevalent over the region. For instance, one farmer stated: “We recognize that the onset of the rainy season is near when, around the 5th of September, we begin to experience strong winds, which we interpret as a precursor to rainfall, and we use to say that the wind is going to fetch rain, when these winds return around the 5th to 10th of October, they bring rain,” (farmer number 181). 13% of respondents claim to possess knowledge related to temperature patterns. For instance, one respondent mentioned: “One of the signs of the onset of the rainy season is that we begin to experience warmer nights, accompanied by observable changes in cloud formations in the sky,” (farmer number 84). The farmer’s knowledge regarding the rainy seasonal cessation (Table 5) was mainly linked to rainfall patterns, including rainfall distribution, rainfall amount, rainfall frequency, and rainfall duration in the region. Of the respondent farmers, 46% reported that they could predict/forecast the cessation of a rainy season based on rainfall distribution. One respondent explained: “We can tell that the rain is about to stop when we start experiencing reduced rainfall, often localized to some part of our region without extending to the whole region,” (farmer number 116). 18% of respondent farmers claimed to have knowledge linked to the quantity of rainfall. For instance, one respondent noted: “We know that the cessation of the rainy season is near when we start experiencing reduced rainfall, which is not equivalent to the number of clouds we observed before. Sometimes, we even observe cloud formations in the sky, but they do not result in rainfall,” (farmer number 13). 17% of farmers surveyed asserted that they knew about the rainfall duration. For example, one farmer explained: “We can tell that the rain is about to stop when it starts falling for a short duration and becomes localized. It may rain in one area for a brief period, then move to another part of the region in a similar manner,” (farmer number 176). Knowledge related to rainfall frequency was reported by 11% of respondent farmers. For instance, one respondent farmer explained: “When the seasonal rainfall is about to cease, its frequency starts to decrease. For example, it might rain on a Tuesday and then not rain again until Sunday. After Sunday, there might be another week-long gap before it rains again, continuing like this until it stops completely,” (farmer number 43).
Figure 2 illustrates the participants’ perspectives on the causes of climate change. The majority (55%) attributed climate change to deforestation, 16% cited industrial effluents, and another 16% pointed to carbon emissions by developed countries. Additionally, 10% associated climate change with the black smoke of vehicles, while 9% linked it to the destruction of the environment. A smaller percentage (2%) attributed climate change to natural causes or ‘God’s Plan,’ and another 2% mentioned the ocean as a factor. Notably, 32% of respondents indicated uncertainty about the cause of climate change.
3.4. Respondent Farmers’ Perceptions of Climate Change
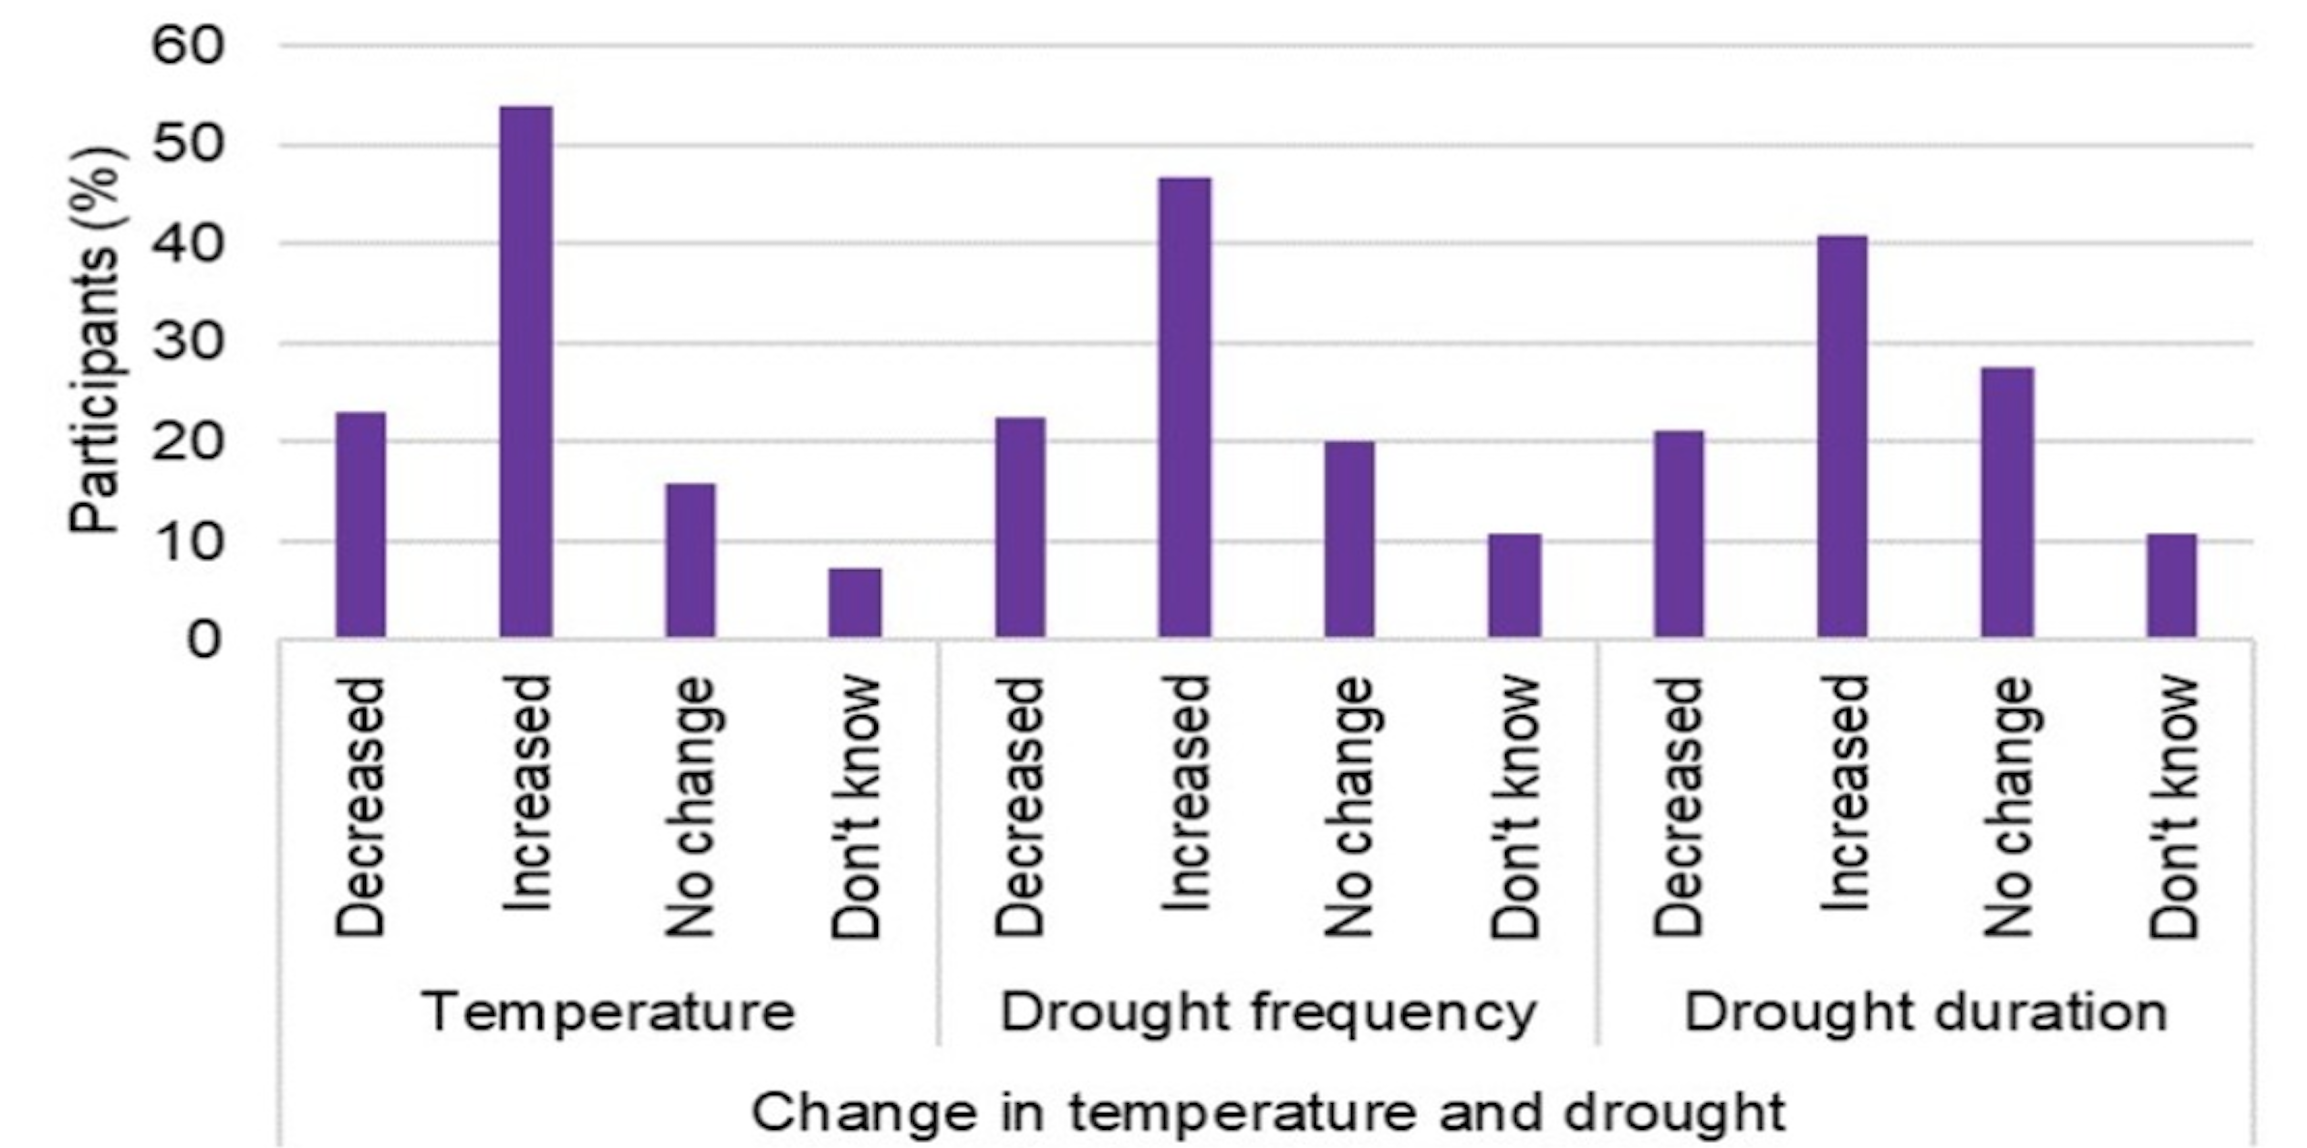
The perceived changes in temperature and drought among farmers are shown in Figure 3. Of the respondent farmers, 54% reported perceiving an increase in temperature, 47% noticed an increase in the frequency of droughts, and 41% observed an increase in the duration of droughts.
Figure 4 presents the farmers’ perceptions of changes in the MAM season rainfall pattern. The majority (53%) of the respondent farmers perceived a delayed onset of the MAM rainy season and an early cessation (58%), leading to a reduction in the length of the rainy season (53%) and a decrease in the amount of seasonal rainfall (49%). Figure 5 shows the perceived changes in the SOND season’s rainfall pattern. Similarly, to the perceived change in the MAM season, as many as 39% of respondents perceived a delayed onset of the SOND rainy season and early cessation (39%), resulting in a reduction in the length of the rainy season (41%) and a decrease in the amount of seasonal rainfall (37%).
3.5. Respondent Farmers’ Perceptions of the Impacts of Climate Change
Figure 6 illustrates the perceived impacts of climate change among the respondent farmers. The majority (56%) of farmers reported crop failures caused by drought and changes in rainfall patterns. In comparison, a smaller portion mentioned soil fertility decline (1%) and the emergence of new pests (7%), resulting in reduced crop yields (20%), food shortage among families (24%), and animals (7%), income loss (6%), poverty (11%), migration (2%) and increased food costs (1%). Additionally, farmers noted that climate variations disrupted the agricultural calendar (2%).
3.6. Climate Change Adaptation Strategies
Various adaptation strategies which were applied by the respondent farmers in response to the perceived impact of climate change are presented in Table 6. As many as 40% of respondents reported agroforestry/ planting trees, changing crop varieties (23%), application of fertilisers (23%), and changing planting dates (26%). The adoption of soil conservation (25%), use of irrigation (21%), focusing on wetlands (10%), mulching (4%), and use of pesticides (7%) were also the measures employed among the farmers.
3.7. Barrier to the Effective Adaptation of Climate Change
Table 7 presents the farmers’ responses when they were asked about barriers hindering their adaptation to climate change. Of the farmer respondents, 28% cited insufficient financial capacity, 18% reported inadequate agricultural skills, and 21% indicated a lack of appropriate material for adaptation. Additionally, 12% mentioned the absence of timely weather information, 20% reported shortages of farm inputs when needed, and 2% noted challenges linked to the location of their farm. Moreover, 7% reported a lack of water sources near their farms, while 3% and 2% cited the high cost of agriculture inputs and materials, respectively.
3.8. Socioeconomic Factors Influencing Farmers’ Choice of Adaptation Strategies
Binary logistic models were used to identify the relationship between socioeconomic factors and the three most essential adaptation strategies that the farmers highlighted to be the most effective: agroforestry/planting trees (PT), changing crop varieties (CCV), and application of fertilizer (AF). The validation diagnostics of the regression logistic models is presented in Table 8. In general, with the Omnibus test of the model coefficients (test of model fit), all the models indicated good fits, confirming their ability to make predictions. It indicated chi-square values ranging between 29.940 and 45.219 and significant p-values (< α = 5%). The results from the Hosmer and Lemeshow test (test of model fit) also confirmed how goodness-of-fit the models were, with the Chi-square values varying between 2.590 and 9.611 and no significant p-values (> α = 5%). Furthermore, Nagelkerke’s R-squared values varying between 0.208 and 0.301 were observed. Overall, the accuracy rate of all the models was reasonable (> 66%). All these confirm how models were able to determine correctly how socioeconomic factors influence the farmers’ choice of particular adaptation strategies to deal with climate change impacts.
The binary logistic regression results are presented in Table 9. The table presents the relationship between socioeconomic factors (predictors) and selected adaptation strategies using odds ratios with a 95% confidence interval (Table 9). While there were notable positive correlations among various variables examined, only those that showed statistical significance were interpreted. Gender indicated significant odds values of less than one for changing crop varieties (0.477 with a 95% confidence interval of 0.205-1.109) and applying fertilizer (0.408 with a 95% confidence interval of 0.167-1.000) adaptation strategies. This suggested that female respondent farmers were less likely to use adaptation strategies such as changing crop varieties and application of fertilizers than the male respondent farmers. Based on the Chi-square test results, we found a significant correlation between gender and the top two effective adaptation strategies: agroforestry (χ²=5.264, p-value=0.022) and changing crop varieties (χ²=4.437, p-value=0.035), while we found no significant association in the application of fertilizer (χ²=3.136, p-value=0.077). Time spent working on the farm per day showed significant odds values of less than one for the application of fertilizer’s adaptation strategy (0.751 with a 95% confidence interval of 0.553-1.020), suggesting that greater time spent on the farm by farmers significantly decreases the odds of using the application of fertilizer. Engaging in farming activities in both hillsides and wetlands indicated a positive relationship with adaptation strategies of changing crop varieties and applying fertilizer. A significant positive relationship was observed in the adaptation strategy of applying fertilizer with odds of 1.926 and a 95% confidence interval of 1.225 to 3.028. Farming to fulfill home consumption needs and generate an income from the market exhibited a positive correlation with adopting agroforestry/planting trees and changing crop varieties as adaptation strategies. Notably, farmers aiming to meet home consumption and generate a market income were significantly more motivated to adopt the agroforestry/planting trees adaptation strategy compared to others, with observed odds of 1.668 and a 95% confidence interval of 1.099 to 2.531. Livestock ownership indicated positive correlations with all three adaptation strategies and was positively significant with agroforestry/planting trees. The odds of a farmer engaging in agroforestry/planting trees when they owned livestock were 1.979 times higher than those farmers who do not have livestock, with a 95% confidence interval of 0.965 to 4.060. Membership in farmer groups/cooperatives showed a positive correlation with all adaptation strategies, significantly influencing the changing of crop varieties and the application of fertilizer as measures for adaptation. Farmers belonging to a group or cooperative were 2.740 times more likely to change crop varieties than those not affiliated with any farmer group, with a 95% confidence interval of 1.206 to 6.226. Similarly, farmers belonging to a group or cooperative were 3.926 times more likely to apply fertilizer than those not affiliated with any farmer group, with a 95% confidence interval of 1.556 to 9.906. Exchanging information among the farmers positively correlated with adopting all three adaptation strategies. It positively influenced the adoption of changing crop varieties with odds of 3.167 and a 95% confidence interval of 0.810 to 12.375. Access to weather and forecast information showed positive correlations with all three adaptation strategies and exhibited a significant positive association with applying fertilizers. Farmers who accessed weather and forecast information were 2.271 times more likely to apply fertilizers compared to those without access to such information, with a 95% confidence interval ranging from 0.978 to 5.276. Access to bank services showed significant odds values of less than one for both changing crop varieties (0.494 with a 95% confidence interval of 0.216-1.127) and fertilizer application (0.286 with a 95% confidence interval of 0.116-0.706) adaptation strategies. These findings suggest a negative influence, indicating that farmers accessing bank services were less likely to adopt these adaptation strategies.
4. Discussion
The respondent farmers’ socioeconomic characteristics show that males and females were almost equally represented in this study, and the farming experience was, on average, above 22 years. This indicates that males and females were exposed to the same negative impacts of changes in climate conditions over Eastern Rwanda in the last 20 years. Most respondent farmers combined agriculture and livestock rearing and exercised them on a small plot of land (average ≤ 13000 m2). This agrees with NISR [28], which reported that 64.2% of Rwandan households are engaged in crop farming and animal breeding. The respondent farmers were mainly involved in the agriculture of stamp food crops, including maize, beans, and cassava. Low education levels among the respondents were observed as the majority reported having attended only primary schools, and others reported having no formal education. This aligns with the NISR [28] report indicating that the majority (53.9%) of the Rwandan population attended only primary school, while no education level stands at 22.3%. This significantly affects adaptation strategies that require a certain level of understanding [56].
Regarding indigenous knowledge, the respondent farmers indicated they have indigenous knowledge and local experience in predicting local weather conditions. The knowledge of rainy seasonal onset was primarily associated with observing dark clouds in the sky, wind direction and intensity, exceptionally high night-time temperatures, and lightning and thunder occurring at night without rainfall. Conversely, the indigenous knowledge of rainy seasonal cessation was mainly linked to observing localized rainfall in the region and decreased rainfall amounts, frequency, and duration. Some farmers mentioned the observation of a transparent cloud in the sky, temperature increase, and wind intensity. This agrees with many scholars [57,58] who have identified that in many East African countries, farmers still use indigenous knowledge to make critical decisions for agricultural practices. However, the accuracy of indigenous knowledge in predicting weather remains uncertain. Therefore, the integration of traditional and scientific knowledge could enhance farmers’ capacity to develop strategies for coping with environmental changes [59,60,61,62].
Farmers indeed perceived the causes or reasons for climate change. Deforestation was the most reported cause, followed by industrial effluents and carbon emissions from developed countries. The black smoke of vehicles, destruction of the environment, natural causes, and the ocean were also mentioned as causes of climate change. This indicates that farmers knew the importance of limiting deforestation and protecting the environment to mitigate climate change. These findings align with similar studies conducted in Bangladesh [52] and Nigeria [51], stating that even at a small-scale level, farmers still have some knowledge about the cause of climate change.
As many as 85% of the respondent farmers agreed that the climate has changed. However, they varied in their ability to articulate the reasons behind the observed changes in the climate system. Many participants reported increased temperature, drought frequency, and drought duration among the perceived changes. On the other hand, for the rainy seasonal level, most farmers perceived a decrease in seasonal rainfall amounts and the number of rainy days. At the same time, late-onset and early cessation for both the MAM and SOND seasons were also perceived. These perceptions are in line with several studies conducted on Rwanda [13,14,15,17], indicating an increase in temperature and decrease in rainfall over many parts of Rwanda in the past recent decades. Particularly in the Eastern Province, a study by Sebaziga et al. [11] noted a decrease in seasonal rainfall in many parts. The perceived decline in seasonal rainfall also aligns with a study by Rwema et al. [16]. This study noted a decrease in seasonal rainfall at many stations in the Eastern Province, where a notable change in MAM rainfall amounts was recorded, mainly in the Southern part. Additionally, studies on temperature have recorded a highly increasing trend over the Eastern Province [17]. A study by Butera et al. [63] with rice farmers in the Eastern Province also agreed with our findings, where the majority of farmers perceived an increase in temperature. It was noted that temperature increase and rainfall decrease contributed to the recurring severe and prolonged drought events in recent decades over Eastern Rwanda [20,21,64]. Acknowledging climate change implies the farmers’ willingness to take several measures to adapt to the perceived change. However, a small number of the farmers believed that there was no change, and this category of farmers needed particular attention to enhance their understanding of climate change, mitigation, and adaptation.
Since we interviewed farmers from the Eastern Province, the area highlighted to be the most prone to climate change impact, such as drought [21], all the participants were able to report one or two negative impacts of climate change they faced in their farming experience. The most observed impacts were crop failures, reduced yield, and food shortage. Farmers also reported the rise of crop diseases (pests), decreased land fertility, and disturbed farming calendars. These impacts were expected for the farmers whose farming heavily relied on seasonal rainfall [65]. The farmers’ perception of these impacts is supported by several studies reporting the negative impact of increasing temperatures and changing rainfall patterns at local and regional scales [46,54,66,67]. As climate change remains the major challenge of the century, small-scale farmers need to adjust their agricultural practices to cope with changing climate conditions by devising strategies that ensure their livelihoods are sustained [54,68].
Acknowledging climate change and its impacts, only 5% of respondent farmers believed they bear responsibility for adaptation, and 19% assigned this responsibility to the government. In comparison, the majority (75%) perceived a shared responsibility between both parties in developing sustainable adaptation measures. This was mentioned because some adaptation technology requires high investment, which cannot be easily affordable for smallholder farmers (e.g., irrigation technology). However, in the Eastern Province, the respondent farmers were applying several adaptation strategies to deal with the perceived impact of climate change. Those strategies include agroforestry/planting trees, changing crop varieties, application of fertilizer (organic and inorganic), changing planting dates, soil conservation, focusing mainly on the farms near water sources, use of irrigation, mulching, and use of pesticides. The respondent farmers reported that agroforestry/planting trees, changing crop varieties (CCV), and applying fertilizer (AF) were the most effective adaptation strategies. Undoubtedly, the last two (CCV and AF) were expected to be mentioned as it has a major influence on increasing growth and production of maize and bean crops [53,69,70] which are mainly grown in the Eastern Province. According to a study by Murthy et al. [71], agroforestry is the most sustainable strategy, offering substantial impacts on soil preservation, biodiversity conservation, and numerous socioeconomic advantages.
Similarly, in other areas where changes in climate conditions were reported to threaten agriculture, smallholder farmers attempted several strategies at the same time to cope with the impact of climate change [46,54,72]. It is recommended to use different adaptation strategies in combination to improve their effectiveness [73].
The main barriers that hindered farmers from adapting to climate change in the study area included limited financial capacity, lack of information (both on the climate and agriculture), and lack of technology and farm inputs. It was also mentioned that the high cost of inputs and technology required for adaptation challenged farmers in the study area. This is in line with the study by Butera et al. [63] at the Eastern Province level and by the World Bank [74] at Rwanda’s country level. These reported barriers are commonly encountered by smallholder farmers in Sub-Saharan Africa, as highlighted in several studies [53,72,75,76,77]. Rwanda’s government shows the political will to support farmers in overcoming these challenges and increasing agricultural resilience to climate change. This is confirmed by the existing several initials such as “NKUNGANIRE” and “Hinga Urishingiwe,” mainly for the farmers who are growing tea, coffee, Irish potato, maize, rice, cassava, soybeans, and beans [56,74,78]. NKUNGANIRE is a national farmers’ subsidy program that aims at helping the poor and the general population get necessary inputs while enhancing the coordination of supply and demand within the supply chain [56]. Hinga Urishingiwe is an insurance-based program aimed at covering damages as a result of extreme weather conditions, such as temperature fluctuations, sunlight exposure, wind intensity, or rainfall patterns, which may lead to crop yield losses throughout the entire duration of the crop growth until physiological maturity [74]. Farmers must embrace these programs to benefit from the available interventions tailored to help them sustainably increase their resilience.
About the factors that influenced farmers’ choice of adaptation strategies, we found that having the goal of meeting family needs and generating a market income positively and significantly influenced agroforestry/planting trees as an adaptation strategy. This agrees with studies indicating different socioeconomic benefits of agroforestry at farm and household levels [71]. Livestock ownership positively influenced farmers’ choices to implement all three adaptation strategies, particularly agroforestry, which showed a significant correlation. Besides providing manure for crop fertilization, livestock is a source of income through milk and meat production. Thus, this enhances farmers’ financial resources and enables them to try various adaptation measures regardless of the associated costs [79]. Farmer group membership and exchanging information were also discovered to positively influence farmers to implement all three adaptation strategies, particularly changing crop variety and applying fertilizers, which showed a significant correlation. This is because group meetings provide farmers with opportunities to exchange information and share their experiences, enabling them to advise each other on the most effective adaptation measures implemented on their farms [80,81,82,83]. Moreover, access to climate and weather information positively influenced the adoption of all three adaptation strategies, significantly applying fertilizers. This aligns with findings from various scholars [46,84], who have highlighted the significant positive impact of access to climate and weather information on farmers’ adaptation decisions. It is crucial to pay attention to the type and quality of information provided to farmers to prevent any misinformation, as the information they receive directly influences their decision-making process.
This study analyses farmers’ indigenous knowledge, perceptions of climate change impacts, adaptation strategies, barriers to adaptation, and socioeconomic factors influencing adaptation in Rwanda’s Eastern Province. Further research should validate indigenous knowledge for seasonal prediction and explore its fusion with scientific methods for improved forecasting accuracy. Studies are needed to quantify losses from perceived impacts and assess adaptation strategy effectiveness. Exploring indigenous knowledge integration into farmers’ decisions and considering all the available adaptation strategies in relation to socioeconomic factors should be prioritized in future studies.
5. Conclusions
The present study examined farmers’ indigenous knowledge, perceptions of changes in the climate system, impacts of perceived changes, adaptation strategies employed by farmers, barriers constraining these adaptation strategies, and the socioeconomic determinants of adaptations to climate change in the Eastern Province of Rwanda. Data collected at the household level from interviews with farmers in five districts of Eastern Rwanda were analysed, along with meteorological data from 1981 to 2021.
It was observed that farmers have indigenous knowledge regarding meteorological indicators, which they use for predicting/forecasting important agricultural events such as rainy seasonal onset and cessation. Most farmers were aware of climate change and perceived an increase in temperature and a decrease in seasonal rainfall, which corresponded to the observed change in meteorological data. Farmers reported that the most significant cause of climate change is deforestation. Respondent farmers indicated that most of the observed impacts were crop failures, reduced yield, and food shortage.
Farmers were adopting various adaptation strategies such as agroforestry/planting trees, changing crop varieties and planting dates, application of fertilizers, soil conservation, and use of irrigation. Among these strategies, the most valuable strategies identified by farmers were agroforestry, changing crop varieties, and application of fertilizers, and their adoption was highly influenced by socioeconomic factors, including livestock ownership, farmer group membership, exchanging information, and access to weather and climate information, among others. Findings also showed that the significant barriers that hindered farmers from adapting to climate change included limited financial capacity, lack of information (both climate and agriculture), and lack of technology and farm inputs when needed.
Recommendations drawn from this study include:
- Climate research highlights significant shifts in temperature and rainfall patterns across the Eastern Province. While many farmers accurately recognize these changes in alignment with scientific findings, a considerable portion remains unaware or misinformed. This lack of awareness can impede the successful adoption of adaptation strategies, as understanding the nature of climate change and its implications is critical for fostering resilience. To address this challenge, it is essential for stakeholders, including government authorities, farmers, and community organizations, to take concerted action to mitigate the impacts of climate change in Eastern Rwanda. Priority should be given to capacity-building programs that educate farmers on the observed climatic shifts, their consequences, and the importance of adopting effective adaptation, mitigation, and prevention strategies. Enhancing farmers’ knowledge and awareness will contribute to building resilience and promoting sustainable agricultural practices in the region.
- We recommend that stakeholders establish a participatory framework that actively involves farmers in decision-making processes. This study reveals that farmers not only recognize climate change but also possess a deep understanding of their local climate conditions, which is vital for strengthening their resilience. Their localized knowledge is an invaluable resource that must be integrated into adaptation planning. Excluding farmers from these discussions could lead to the development of strategies that fail to address their most critical needs, thereby undermining the effectiveness and sustainability of adaptation efforts.
- The study highlights that farmers encounter numerous challenges, particularly those linked to financial constraints. To address this, stakeholders must strengthen their collaboration with farmers to gain a deeper understanding of these difficulties. This approach will enable the development of support programs and solutions that are both cost-effective and aligned with farmers’ financial realities. Efforts to improve the financial capacity of farmers are especially crucial for fostering resilience and sustainable agricultural practices in Eastern Rwanda.
- Since adaptation methods like agroforestry have been widely embraced by farmers, it is vital for the government and other stakeholders to prioritize selecting tree species that are best suited to the soil and climatic conditions of Eastern Rwanda. Adopting this targeted approach can maximize the benefits of agroforestry, strengthening farmers’ resilience by improving health, nutrition, and financial stability, all of which are influenced by the choice of tree species planted.
Beyond the scope of this study, further research endeavors could focus on validating indigenous knowledge for seasonal prediction and investigating its integration with scientific methodologies to bolster forecasting precision. Additionally, there is a need for studies to quantify the losses incurred due to perceived impacts and evaluate the efficacy of implemented adaptation strategies. Exploring the incorporation of indigenous knowledge into farmers’ decision-making processes within the study area would also yield valuable insights. Given that the examination of the relationship between socioeconomic factors and adaptation strategies did not encompass all available options, future studies may seek to expand upon this investigation by exhaustively documenting the full spectrum of adaptation strategies as reported by farmers.
Author Contributions
Conceptualization, M.R., B.S. and M.B.S.; methodology, M.R., B.S., M.B.S., L.R. and M.L.; software, M.R. and M.L.; validation, M.R., B.S., M.B.S., L.R. and M.L.; formal analysis, M.R.., B.S. and M.B.S.; investigation, M.R., and B.S.; resources, L.R.; data curation, M.R., B.S. and M.B.S.; writing—original draft preparation, M.R., B.S., M.B.S., L.R. and M.L; writing—review and editing, M.R., B.S., M.B.S., L.R. and M.L.; visualization, M.R., B.S., M.B.S., L.R. and M.L.; supervision, B.S., M.B.S., L.R. and M.L.; project administration, B.S and L.R.; funding acquisition, L.R and M.B.S. All authors have read and agreed to the published version of the manuscript.
Funding
This work was funded by a grant from the African Institute for Mathematical Sciences, www.nexteinstein.org, with financial support from the Government of Canada provided through Global Affairs Canada, www.international.gc.ca, and the International Development Research Centre, www.idrc.ca. LR and ML were funded by the Research Council of Finland (project numbers 353083, 353095, 321890).
Institutional Review Board Statement
The study was conducted in accordance with the Declaration of Helsinki, and approved by the Institutional Review Board of the University of Rwanda (Reference letter no: UR/CST/SoS/720/2023 and 20th September 2023).
Informed Consent Statement
Informed consent was obtained from all subjects involved in the study.
Data Availability Statement
Climate datasets were provided by the Rwanda Mete orology Agency (Meteo Rwanda). The data can be accessed through the online portal at https://www.meteorwanda.gov.rw. The field survey data that support the findings of this study are available from the corresponding author upon reasonable request.
Acknowledgments
The authors are grateful to the Rwanda Meteorology Agency (Meteo-Rwanda) for providing climate data used in this study.
Conflicts of Interest
The authors declare no conflicts of interest.
References
- Intergovernmental Panel on Climate Change (IPCC), Climate Change 2013 – The Physical Science Basis: Working Group I Contribution to the Fifth Assessment Report of the Intergovernmental Panel on Climate Change. Cambridge: Cambridge University Press, 2014. [CrossRef]
- R. Mind’je et al., “Flood susceptibility modeling and hazard perception in Rwanda,” Int. J. Disaster Risk Reduct., vol. 38, p. 101211, Aug. 2019. [CrossRef]
- Saleem et al., “Preparation of Marketable Functional Food to Control Hypertension using Basil (ocimum basillium) and Peppermint (mentha piperita).,” Int. J. Innov. Sci. Technol., vol. 01, no. 01, Feb. 2019. [CrossRef]
- Intergovernmental Panel On Climate Change (Ipcc), Climate Change 2021 – The Physical Science Basis: Working Group I Contribution to the Sixth Assessment Report of the Intergovernmental Panel on Climate Change, 1st ed. Cambridge University Press, 2023. [CrossRef]
- G. T. Pecl et al., “Biodiversity redistribution under climate change: Impacts on ecosystems and human well-being,” Science, vol. 355, no. 6332, p. eaai9214, Mar. 2017. [CrossRef]
- E. I. Christian, “Climate Change and Global Warming: Implications for Sub-Saharan Africa,” J. Contemp. Res., vol. 7, no. 1, 2010. [CrossRef]
- R. B. Zougmoré, S. T. Partey, M. Ouédraogo, E. Torquebiau, and B. M. Campbell, “Facing climate variability in sub-Saharan Africa: analysis of climate-smart agriculture opportunities to manage climate-related risks,” Cah. Agric., vol. 27, no. 3, p. 34001, May 2018. [CrossRef]
- L. Nahayo, J.B. Nsengiyumva, C. Mupenzi, R. Mind’je, and E. M. Nyesheja, “Climate Change Vulnerability in Rwanda, East Africa,” Int J Geogr Geol, vol. 8, no. 1, pp. 1–9, 2019.
- G. Rwanyiziri and J. Rugema, “Climate Change Effects on Food Security in Rwanda: Case Study of Wetland Rice Production in Bugesera District,” Rwanda J Agric Sc, vol. 1, no. 1, pp. 35–51, 2013. [CrossRef]
- F. Ntirenganya, “Analysis of Rainfall Variability in Rwanda for Small-scale Farmers Coping Strategies to Climate Variability,” East Afr J Sc Technol, vol. 8, no. 1, pp. 75–96, 2018.
- N. J. Sebaziga, F. Ntirenganya, A. Tuyisenge, and V. Iyakaremye, “A Statistical Analysis of the Historical Rainfall Data Over Eastern Province in Rwanda,” East Afr J Sc Technol, vol. 10, no. 1, pp. 33–52, 2020.
- J. Kazora et al., “Spatiotemporal variability of rainfall trends and influencing factors in Rwanda,” J Atmos Sol-Terr Phys, vol. 219, 2021. [CrossRef]
- Safari, “Trend Analysis of the Mean Annual Temperature in Rwanda during the Last Fifty Two Years,” J. Environ. Prot., vol. 3, no. 6, pp. 538–551, Jun. 2012. [CrossRef]
- M. Haggag, J. C. Kalisa, and A. W. Abdeldayem, “Projections of precipitation, air temperature, and potential evapotranspiration in Rwanda under changing climate conditions,” Afr J Env. Sc Technol, vol. 10, no. 1, pp. 18–33, 2016. [CrossRef]
- J. P. Ngarukiyimana et al., “Climate Change in Rwanda: The Observed Changes in Daily Maximum and Minimum Surface Air Temperatures during 1961–2014,” Front. Earth Sci., vol. 9, p. 619512, Mar. 2021. [CrossRef]
- M. Rwema, M. B. Sylla, B. Safari, L. Roininen, and M. Laine, “Trend analysis and change point detection in precipitation time series over the Eastern Province of Rwanda during 1981–2021,” Theor. Appl. Climatol., vol. 156, no. 2, p. 98, Feb. 2025. [CrossRef]
- Safari and J. N. Sebaziga, “Trends and Variability in Temperature and Related Extreme Indices in Rwanda during the Past Four Decades,” Atmosphere, vol. 14, no. 9, p. 1449, Sep. 2023. [CrossRef]
- G. Maúre et al., “The southern African climate under 1.5 °C and 2 °C of global warming as simulated by CORDEX regional climate models,” Environ. Res. Lett., vol. 13, no. 6, p. 065002, Jun. 2018. [CrossRef]
- S. F. Kew et al., “Impact of precipitation and increasing temperatures on drought trends in eastern Africa,” Earth Syst Dyn, vol. 12, pp. 17–35, 2021. [CrossRef]
- M. Lydie, “Droughts and Floodings Implications in Agriculture Sector in Rwanda: Consequences of Global Warming,” in The Nature, Causes, Effects and Mitigation of Climate Change on the Environment, S. A. Harris, Ed., IntechOpen, 2022. [CrossRef]
- J. Uwimbabazi, Y. Jing, V. Iyakaremye, I. Ullah, and B. Ayugi, “Observed Changes in Meteorological Drought Events during 1981–2020 over Rwanda, East Africa,” Sustainability, vol. 14, no. 3, p. 1519, Jan. 2022. 2022. [CrossRef]
- J. M. Wolfe et al., Sensation & perception. Sunderland, MA: Sinauer, 2006. [Online]. Available: https://scholar.google.com/citations?user=QO9ARccAAAAJ&hl=en&oi=sra.
- S. A. Bempah, “The role of social perception in disaster risk reduction_ Beliefs, perception, and attitudes regarding flood disasters in communities along the Volta River, Ghana,” Int J Disaster Risk Reduct, vol. 23, pp. 104–108, 2017. [CrossRef]
- F. Messner and V. Meyer, “FLOOD DAMAGE, VULNERABILITY AND RISK PERCEPTION – CHALLENGES FOR FLOOD DAMAGE RESEARCH,” in Flood Risk Management: Hazards, Vulnerability and Mitigation Measures, vol. 67, J. Schanze, E. Zeman, and J. Marsalek, Eds., Dordrecht: Springer Netherlands, 2006, pp. 149–167. [CrossRef]
- Meteo Rwanda, “Climatology of Rwanda.” Accessed: Jun. 04, 2023. [Online]. Available: https://www.meteorwanda.gov.
- Ntwali, B. A. Ogwang, and V. Ongoma, “The Impacts of Topography on Spatial and Temporal Rainfall Distribution over Rwanda Based on WRF Model,” Atmospheric Clim. Sci., vol. 06, no. 02, pp. 145–157, 2016. [CrossRef]
- S. E. Nicholson, “The ITCZ and the Seasonal Cycle over Equatorial Africa,” Bull. Am. Meteorol. Soc., vol. 99, no. 2, pp. 337–348, Feb. 2018. [CrossRef]
- NISR, “5th Population and Housing Census, Main Indicators Report,” National Institute of Statistics Rwanda, Kigali, Rwanda, 2023. [Online]. Available: http://www.statistics.gov.rw.
- M. B. Slovin, M. E. Sushka, and J. A. Polonchek, “The Value of Bank Durability: Borrowers as Bank Stakeholders,” J. Finance, vol. 48, no. 1, pp. 247–266, Mar. 1993. [CrossRef]
- Meteo Rwanda, “Dataset Documentation.” Accessed: Jul. 31, 2024. [Online]. Available: http://maproom.meteorwanda.gov.rw/maproom/Summary/index.html#tabs-2.
- I. Tikito and N. Souissi, “ODK-X: From A Classic Process To A Smart Data Collection Process,” Int. J. Interact. Mob. Technol. IJIM, vol. 15, no. 13, p. 28, Jul. 2021. [CrossRef]
- R. Helsel and L. M. Frans, “Regional Kendall Test for Trend,” Environ. Sci. Technol., vol. 40, no. 13, 2006. [CrossRef]
- H. B. Mann, “Nonparametric Tests Against Trend,” Econometrica, vol. 13, no. 3, p. 245, Jul. 1945. [CrossRef]
- M. G. Kendall, “Rank correlation methods, 4th edn,” Charles Griffin Co. Ltd., 1975, [Online].
- T. Partal and E. Kahya, “Trend analysis in Turkish precipitation data,” Hydrol. Process., vol. 20, no. 9, pp. 2011–2026, Jun. 2006. [CrossRef]
- E. J. Dietz and T. J. Killeen, “A Nonparametric Multivariate Test for Monotone Trend With Pharmaceutical Applications,” J. Am. Stat. Assoc., vol. 76, no. 373, pp. 169–174, 1981. http://www.tandfonline.com/action/showCitFormats?doi=10.1080/01621459.1981.10 477624.
- T. Chen, G. Xia, L. T. Wilson, W. Chen, and D. Chi, “Trend and Cycle Analysis of Annual and Seasonal Precipitation in Liaoning, China,” Adv. Meteorol., vol. 2016, pp. 1–15, 2016. [CrossRef]
- A. K. Margaritidis, “Site and Regional Trend Analysis of Precipitation in Central Macedonia, Greece,” Comput. Water Energy Environ. Eng., vol. 10, no. 02, pp. 49–70, 2021. [CrossRef]
- Z. X. Xu, K. Takeuchi, and H. Ishidaira, “Monotonic trend and step changes in Japanese precipitation,” J. Hydrol., vol. 279, no. 1–4, pp. 144–150, Aug. 2003. [CrossRef]
- D. Gamerman and H. F. Lopes, Markov chain Monte Carlo: stochastic simulation for Bayesian inference, 2nd ed. in Texts in statistical science series, no. 68. Boca Raton: Taylor & Francis, 2006.
- Petris, “An R Package for Dynamic Linear Models,” J. Stat. Softw., vol. 36, no. 12, 2010. [CrossRef]
- T. J. Durbin and S. J. Koopman, “Time Series Analysis by State Space Methods by Durbin and Koopman | PDF | Normal Distribution | Estimation Theory,” Scribd. Accessed: May 01, 2025. [Online]. Available: https://www.scribd.com/doc/55179464/Time-Series-Analysis-by-State-Space-Methods-by-Durbin-and-Koopman.
- M. Laine, N. Latva-Pukkila, and E. Kyrölä, “Analysing time-varying trends in stratospheric ozone time series using the state space approach,” Atmospheric Chem. Phys., vol. 14, no. 18, pp. 9707–9725, Sep. 2014. [CrossRef]
- M. Rwema, B. Safari, M. Laine, M. B. Sylla, and L. Roininen, “Trends and Variability of Temperatures in the Eastern Province of Rwanda,” Int. J. Climatol., p. e8793, Feb. 2025. [CrossRef]
- IBM, SPSS Statistics for Windows. (2021). [Online]. Available: https://www.ibm.com/docs/en/spss-statistics/28.0.0.
- P. Batungwanayo, “Confronting climate change and livelihood: smallholder farmers’ perceptions and adaptation strategies in northeastern Burundi,” Reg Env. Change, vol. 23, no. 47, 2023. [CrossRef]
- A. Fernihough, “Simple logit and probit marginal effects in R, Working paper series,” UCD Center for economic research, University of Dublin, Ireland. Accessed: Mar. 17, 2024. [Online]. Available: http://www.ucd.ie/t4cms/WP1122.pdf.
- A. Funk, A. R. Sathyan, P. Winker, and L. Breuer, “Changing climate - Changing livelihood: Smallholder’s perceptions and adaption strategies,” J Env. Manage, vol. 259, 2020. [CrossRef]
- J. Lever, M. Krzywinski, and N. Altman, “Logistic regression,” Nat. Methods, vol. 13, no. 7, pp. 541–542, Jul. 2016. [CrossRef]
- H. Acquah-de Graft, “Farmers’ perceptions and adaptation to climate change: a willingness to pay analysis,” J. Sustain. Dev. Afr., vol. 13, no. 5, pp. 150–161, 2011.
- E. O. Asekun-Olarinmoye et al., “Public perception of climate change and its impact on health and environment in rural southwestern N,” Res. Rep. Trop. Med., vol. 5, pp. 1–10, 2014. [CrossRef]
- M. I. Kabir, M. B. Rahman, W. Smith, M. A. F. Lusha, S. Azim, and A. H. Milton, “Knowledge and perception about climate change and human health: findings from a baseline survey among vulnerable communities in Bangladesh,” BMC Public Health, vol. 16, no. 266, 2016. [CrossRef]
- L. K. Mubalama, D. M. Masumbuko, D. R. Mweze, G. T. Banswe, and P. A. Mirindi, “Farmers’ Perceptions towards Climate Change, and Meteorological Data in Kahuzi-Biega National Park Surroundings, Eastern DR. Congo,” Int. J. Innov. Res. Dev., vol. 9, no. 6, Jun. 2020. [CrossRef]
- A. M. Balasha, A. B. Ndele, B. B. Murhula, and V. M. Ngabo, “Perceived Impacts of Climate Change and Farmers’ Choices of Adaptation Practices in the South Kivu’s Marshlands,” J Appl Agric Econ Policy Anal, vol. 4, no. 1, pp. 18–24, 2021. [CrossRef]
- M. Abid, J. Scheffran, U. A. Schneider, and M. Ashfaq, “Farmers’ perceptions of and adaptation strategies to climate change and their determinants: the case of Punjab province, Pakistan,” Earth Syst. Dyn., vol. 6, no. 1, pp. 225–243, May 2015. [CrossRef]
- IRDP, “Determinants of inorganic fertilizers and improved seeds along with extension services support for agricultural productivity in Rwanda. final policy issues and recommendations,” Institute of Research and Dialogue for Peace, 2020. [Online]. Available: https://irdp.rw/wp- content/uploads/IRDP%20Agri%20Final%20Policy%20brief%20Final.pdf.
- L. B. Chang’a, P. Z. Yanda, and J. Ngana, “Indigenous knowledge in seasonal rainfall prediction in Tanzania: A case of the South-western Highland of Tanzania,” J Geogr Reg Plann, vol. 3, no. 4, pp. 66–72, 2010. [CrossRef]
- M. Radeny et al., “Indigenous knowledge for seasonal weather and climate forecasting across East Africa,” Clim. Change, vol. 156, no. 4, pp. 509–526, Oct. 2019. [CrossRef]
- G. Ziervogel and A. Opere, “Integrating meteorological and indigenous knowledge- based seasonal climate forecasts for the agricultural sector: lessons from participatory action research in sub-Saharan Africa.” Accessed: Jul. 20, 2024. [Online]. Available: https://idl-bnc-idrc.dspacedirect.org/items/a4b47199-a1ba-4047-a1e4-32ef2bc48c00.
- J. M. Kalanda, C. Ngongondo, L. Chipeta, and F. Mpembeka, “Integrating indigenous knowledge with conventional science: enhancing localized climate and weather forecasts in Nessa, Mulanje, Malawi,” Phys Chem Earth, vol. 36, no. 14–15, pp. 996–1003, 2011. [CrossRef]
- D. Kolawole, P. Wolski, B. Ngwenya, and G. Mmopelwa, “Ethnometeorology and scientific weather forecasting: small farmers and scientists’ perspectives on climate variability in the Okavango Delta, Botswana,” Clim. Risk Manag, vol. 4, pp. 43–58, 2014. [CrossRef]
- M. R. Nkuba, R. Chanda, G. Mmopelwa, E. Kato, M. N. Mangheni, and D. Lesolle, “Influence of Indigenous Knowledge and Scientific Climate Forecasts on Arable Farmers’ Climate Adaptation Methods in the Rwenzori region, Western Uganda,” Environ. Manage., vol. 65, no. 4, pp. 500–516, Apr. 2020. [CrossRef]
- T. Butera, T. K. Kim, and S. H. Choi, “Determinant Factors of Rice Farmers’ Selection of Adaptation Methods to Climate Change in Eastern Rwanda,” Korean J Org Agric, vol. 30, no. 2, pp. 241–253, 2022. [CrossRef]
- S. Sarkodie, P. Rufangura, Herath MPC Jayaweera, and P. A. Owusu, “Situational Analysis of Flood and Drought in Rwanda,” p. 1773839 Bytes, 2016. [CrossRef]
- C. A. Harvey et al., “Extreme vulnerability of smallholder farmers to agricultural risks and climate change in Madagascar,” Philos Trans Roy Soc B, vol. 369, no. 1639, pp. 2–22, 2014. https://doi.org/10.1098%2Frstb.2013.0089.
- E. C. Brevik, “The Potential Impact of Climate Change on Soil Properties and Processes and Corresponding Influence on Food Security,” Agriculture, vol. 3, pp. 398–417, 2013. [CrossRef]
- M. Y. Bele, D. J. Sonwa, and A. M. Tiani, “Local Communities Vulnerability to Climate Change and Adaptation Strategies in Bukavu in DR Congo,” J. Environ. Dev., vol. 23, no. 3, pp. 331–357, Sep. 2014. [CrossRef]
- L. M. C. S. Menike and K. A. G. P. K. Arachchi, “Adaptation to Climate Change by Smallholder Farmers in Rural Communities: Evidence from Sri Lanka,” Procedia Food Sci., vol. 6, pp. 288–292, 2016. [CrossRef]
- T. Abera, T. Debele, and D. Wegary, “Effects of Varieties and Nitrogen Fertilizer on Yield and Yield Components of Maize on Farmers Field in Mid Altitude Areas of Western Ethiopia,” Int. J. Agron., vol. 2017, pp. 1–13, 2017. [CrossRef]
- A. Kamran et al., “The Impact of Different P Fertilizer Sources on Growth, Yield and Yield Component of Maize Varieties,” Agri Res Tech Open Access J, vol. 13, no. 3, 2018. [CrossRef]
- K. Murthy, S. Dutta, V. Varghese, and P. Kumar, “Impact of Agroforestry Systems on Ecological and Socio-Economic Systems: A Review,” Glob J Sci Front Res, vol. 16, no. 5, pp. 15–28, 2016.
- T. O. Jawo, N. Teutscherová, M. Negash, K. Sahle, and B. Lojka, “Smallholder coffee- based farmers’ perception and their adaptation strategies of climate change and variability in South-Eastern Ethiopia,” Int J Sustain Dev World Ecol, vol. 30, no. 5, pp. 533–547, 2023. [CrossRef]
- P. Rajan, P. Manjet, and K. Solanke, “Organic Mulching- A Water Saving Technique to Increase the Production of Fruits and Vegetables – Current Agriculture Research Journal.” Accessed: May 01, 2025. [Online]. Available: http://www.agriculturejournal.org/volume5number3/organic-mulching-a-water-saving-technique-to-increase-the-production-of-fruits-and-vegetables/.
- World Bank, “Climate-Smart Agriculture in Rwanda. CSA Country Profiles for Africa, Asia, and Latin America and the Caribbean Series,” World Bank, 2015. [Online]. Available: https://climateknowledgeportal.worldbank.org/sites/default/files/2019- 06/CSA%20RWANDA%20NOV%2018%202015.pdf.
- E. Bryan, T. T. Deressa, G. A. Gbetibouo, and C. Ringler, “Adaptation to climate change in Ethiopia and South Africa: options and constraints,” Env. Sci Policy, vol. 12, no. 4, pp. 413–426, 2009. [CrossRef]
- J. S. Juana, Z. Kahaka, and F. N. Okurut, “Farmers’ Perceptions and Adaptations to Climate Change in Sub-Sahara Africa: A Synthesis of Empirical Studies and Implications for Public Policy in African Agriculture,” J Agric Sci, vol. 5, pp. 121–135, 2013. [CrossRef]
- S. Sani, “Farmers’ Perception, Impact and Adaptation Strategies to Climate Change among Smallholder Farmers in Sub-Saharan Africa: A Systematic Review,” J. Resour. Dev. Manag., vol. 26, no. 0, p. 1, 2016.
- MoE, “Strategic Programme for Climate Resilience (SPCR) Rwanda,” Kigali, Rwanda, 2017. [Online]. Available: http://www.fonerwa.org/sites/default/files/2021-06/SPCR.pdf.
- T. P. Cox, “Farming the battlefield: the meanings of war, cattle and soil in South Kivu, Democratic Republic of the Congo,” Disasters, vol. 36, no. 2, pp. 233–248, 2011. [CrossRef]
- D. Abebaw and M. G. Haile, “The impact of cooperatives on agricultural technology adoption: Empirical evidence from Ethiopia,” Food Policy, vol. 38, pp. 82–91, Feb. 2013. [CrossRef]
- E. Verhofstadt and M. Maertens, “Smallholder cooperatives and agricultural performance in Rwanda: do organizational differences matter?,” Agric. Econ., vol. 45, no. S1, pp. 39–52, Nov. 2014. [CrossRef]
- J. Manda et al., “Does cooperative membership increase and accelerate agricultural technology adoption? Empirical evidence from Zambia,” Technol. Forecast. Soc. Change, vol. 158, p. 120160, Sep. 2020. [CrossRef]
- J. Manda et al., “Does cooperative membership increase and accelerate agricultural technology adoption? Empirical evidence from Zambia,” Technol. Forecast. Soc. Change, vol. 158, p. 120160, Sep. 2020. [CrossRef]
- Destaw and M. M. Fenta, “Climate change adaptation strategies and their predictors amongst rural farmers in Ambassel district, Northern Ethiopia, Jamba,” J Disaster Risk Stud, vol. 13, no. (1), 2021. https://doi.org/10.4102%2Fjamba.v13i1.974.
Figure 1.
Eastern Province map with the surveyed participants’ location highlighted with purple dots.
Figure 1.
Eastern Province map with the surveyed participants’ location highlighted with purple dots.
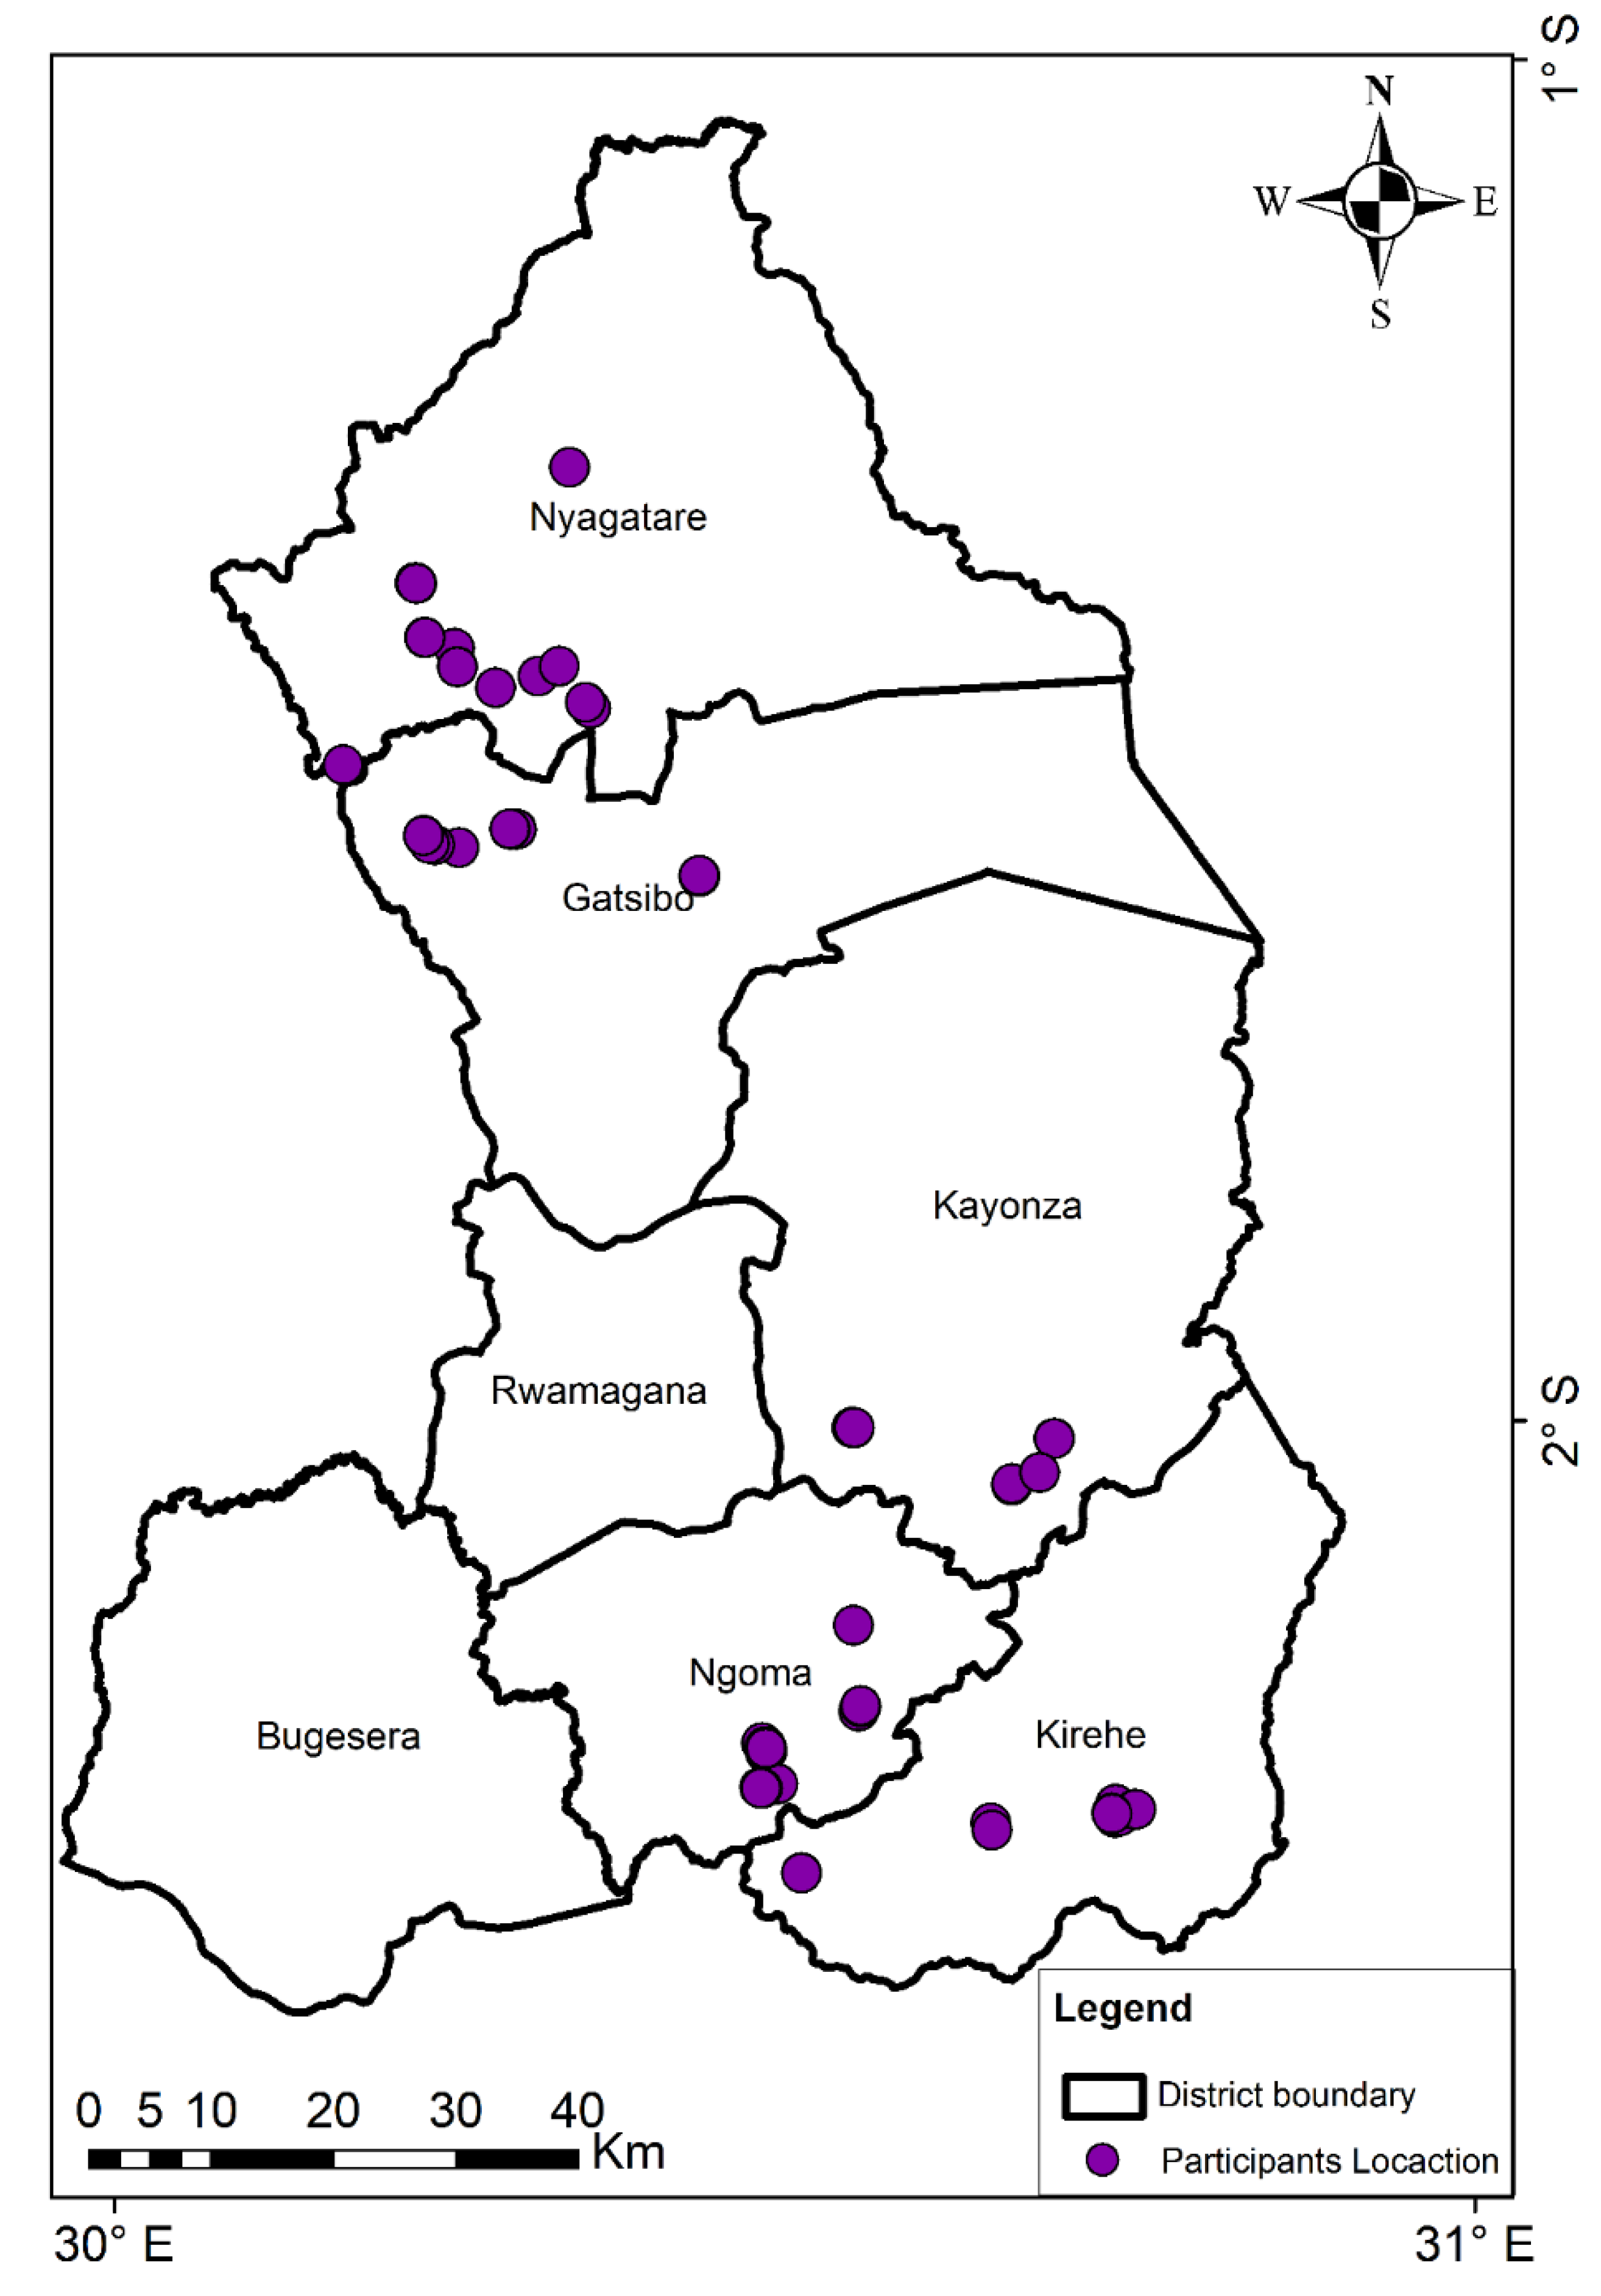
Figure 2.
Farmers’ knowledge about causes or reasons for climate change (n=204).
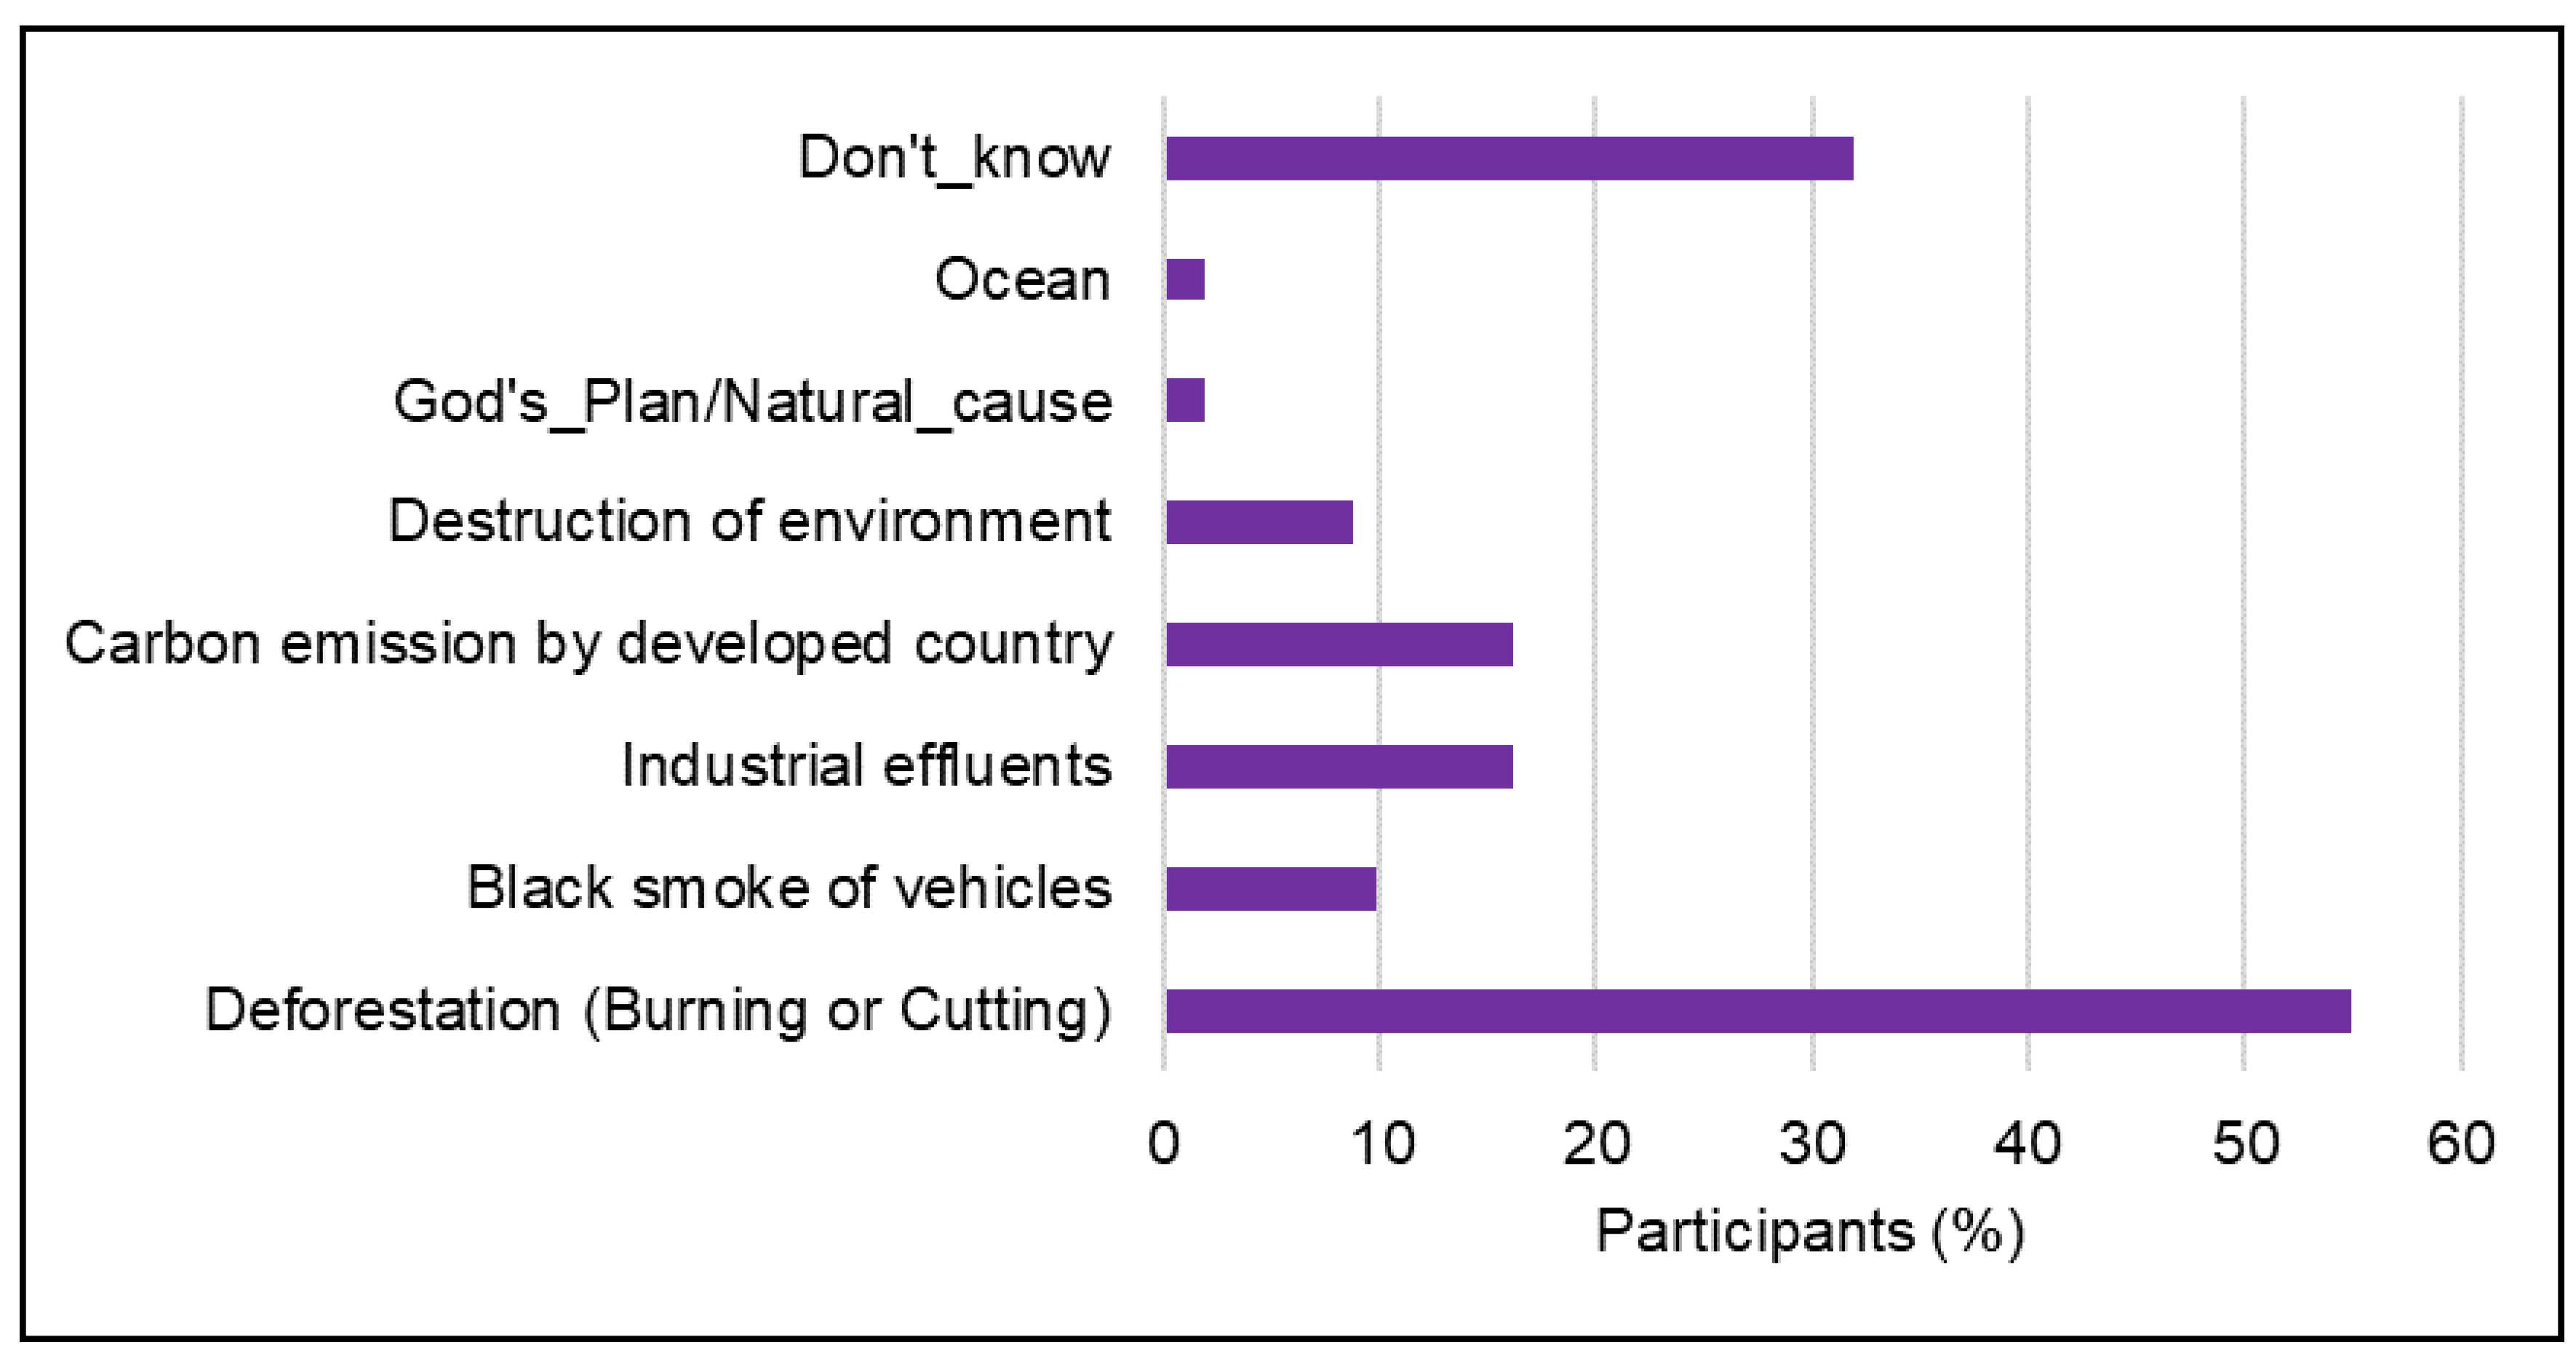
Figure 3.
Respondent farmers’ perception of change in temperature and drought pattern (n=204).
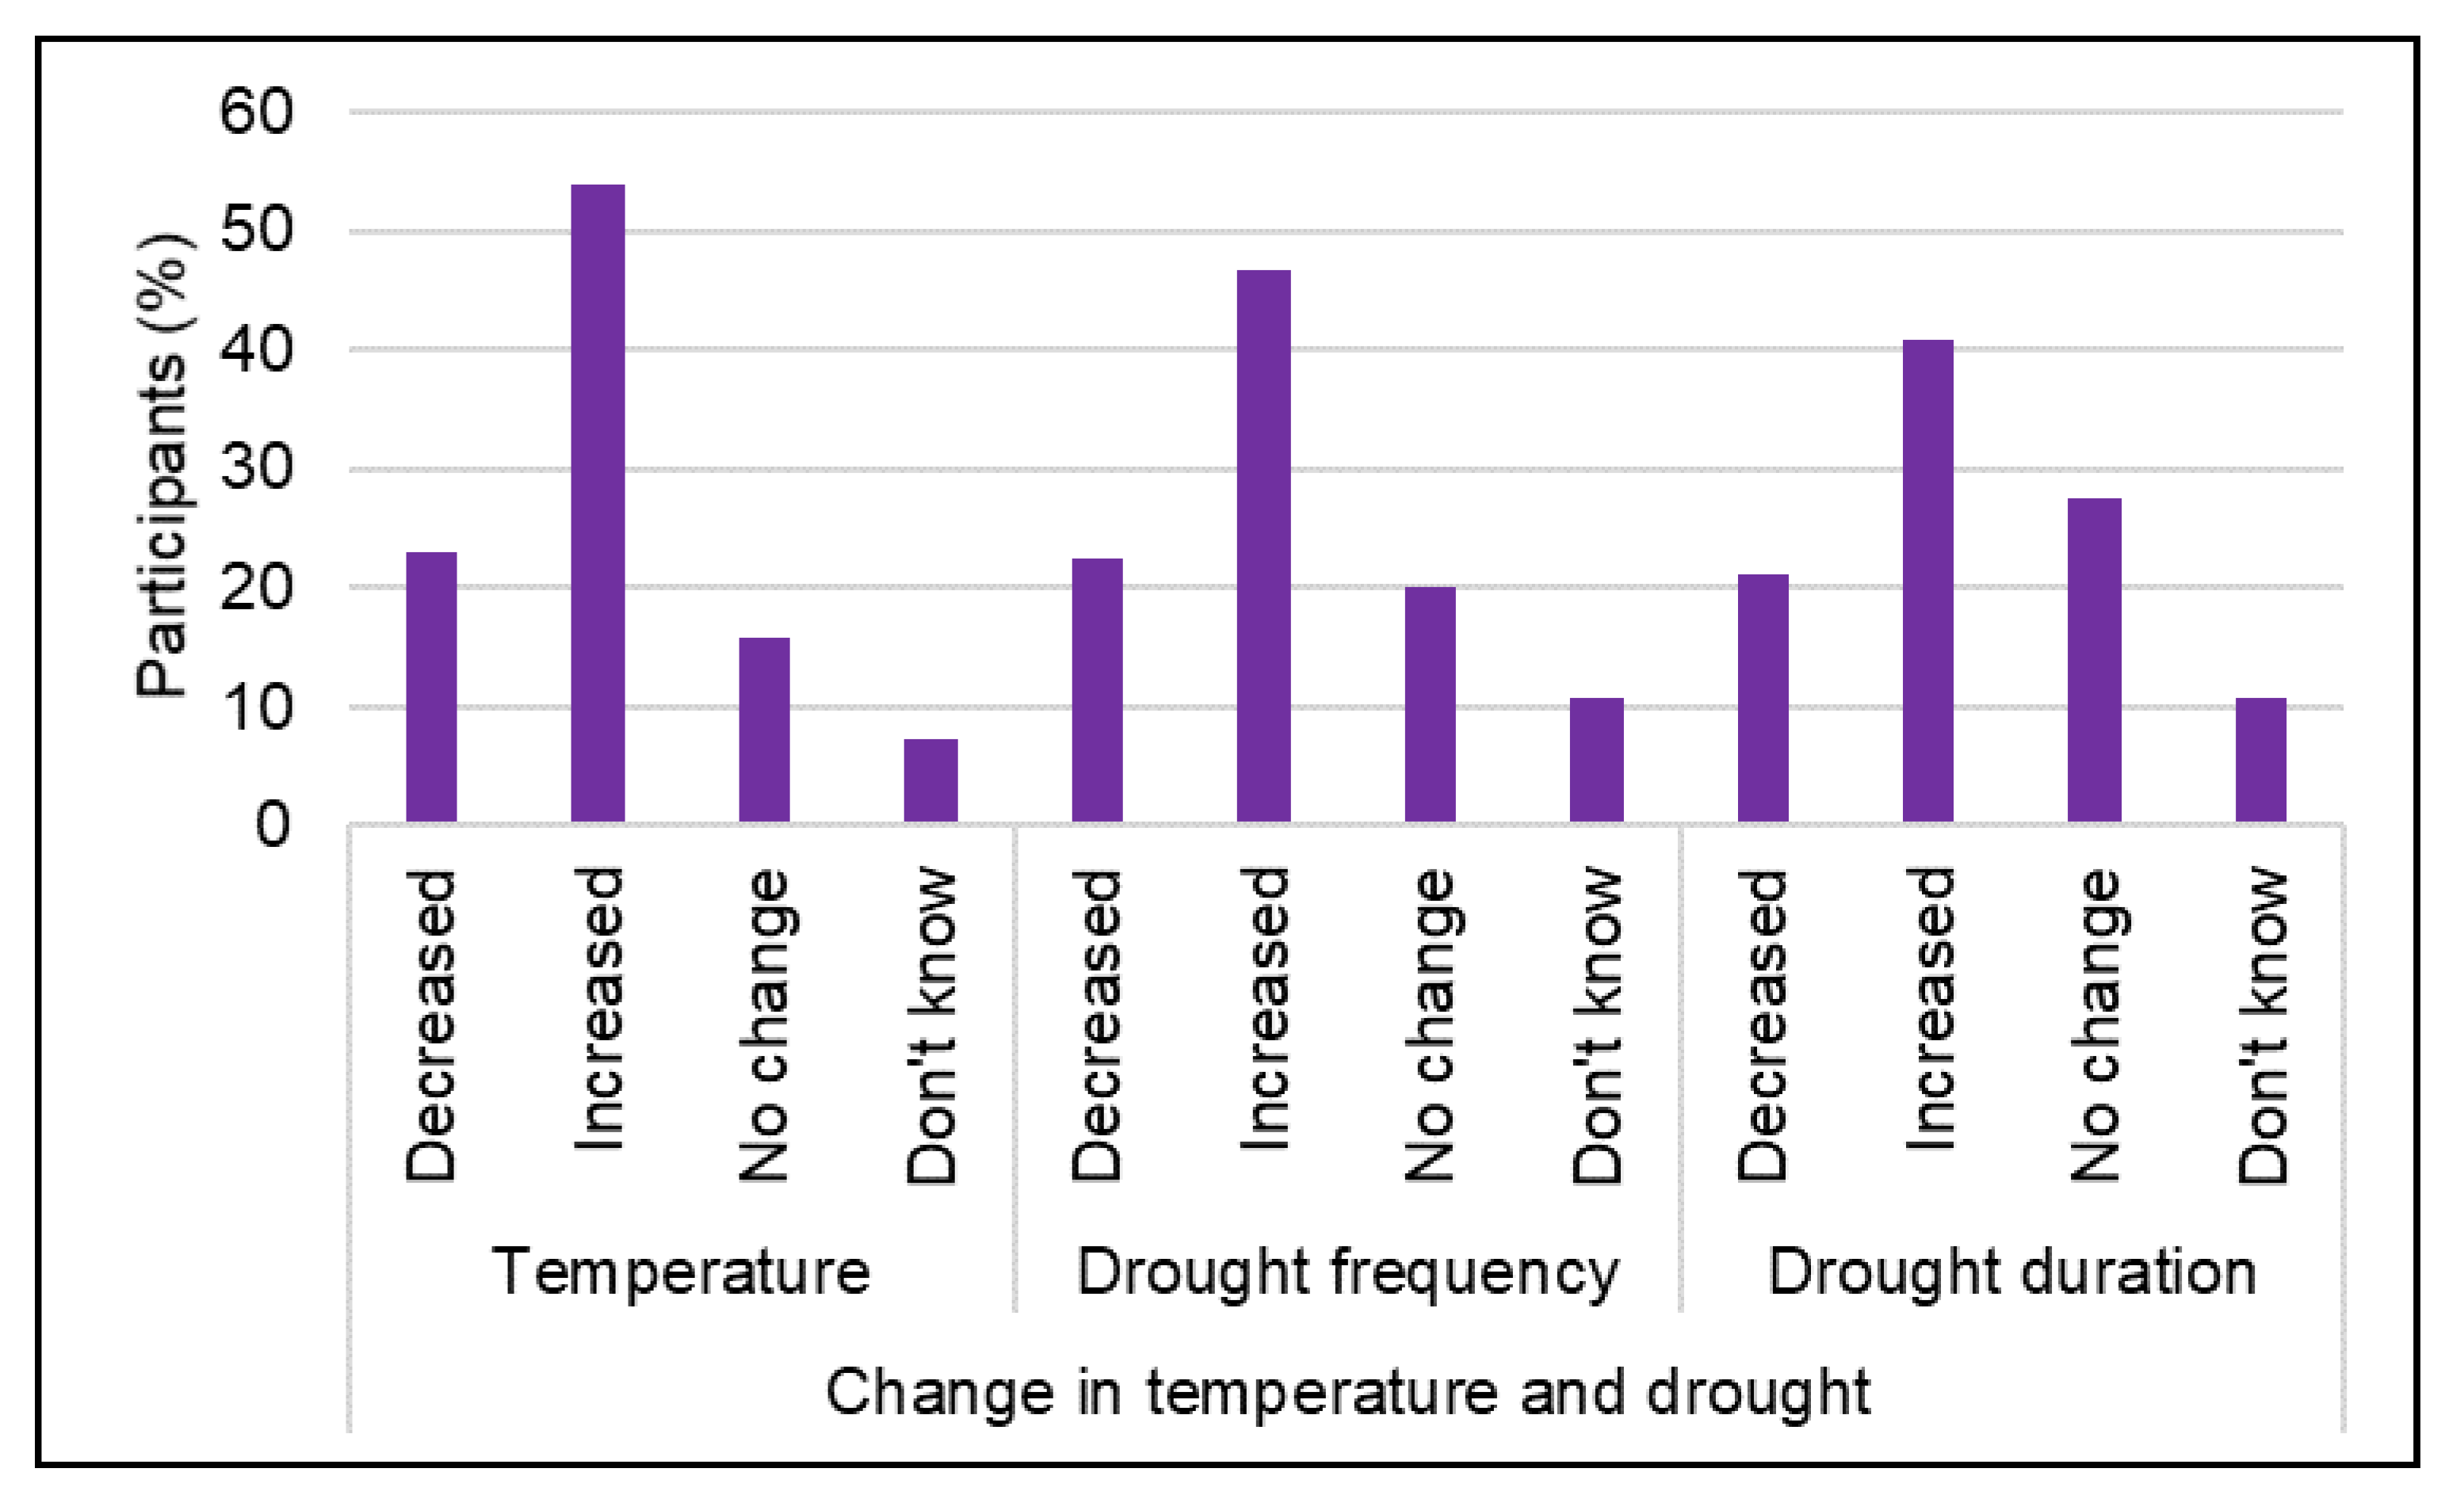
Figure 4.
Respondent farmers’ perceptions of change in the MAM season rainfall pattern.
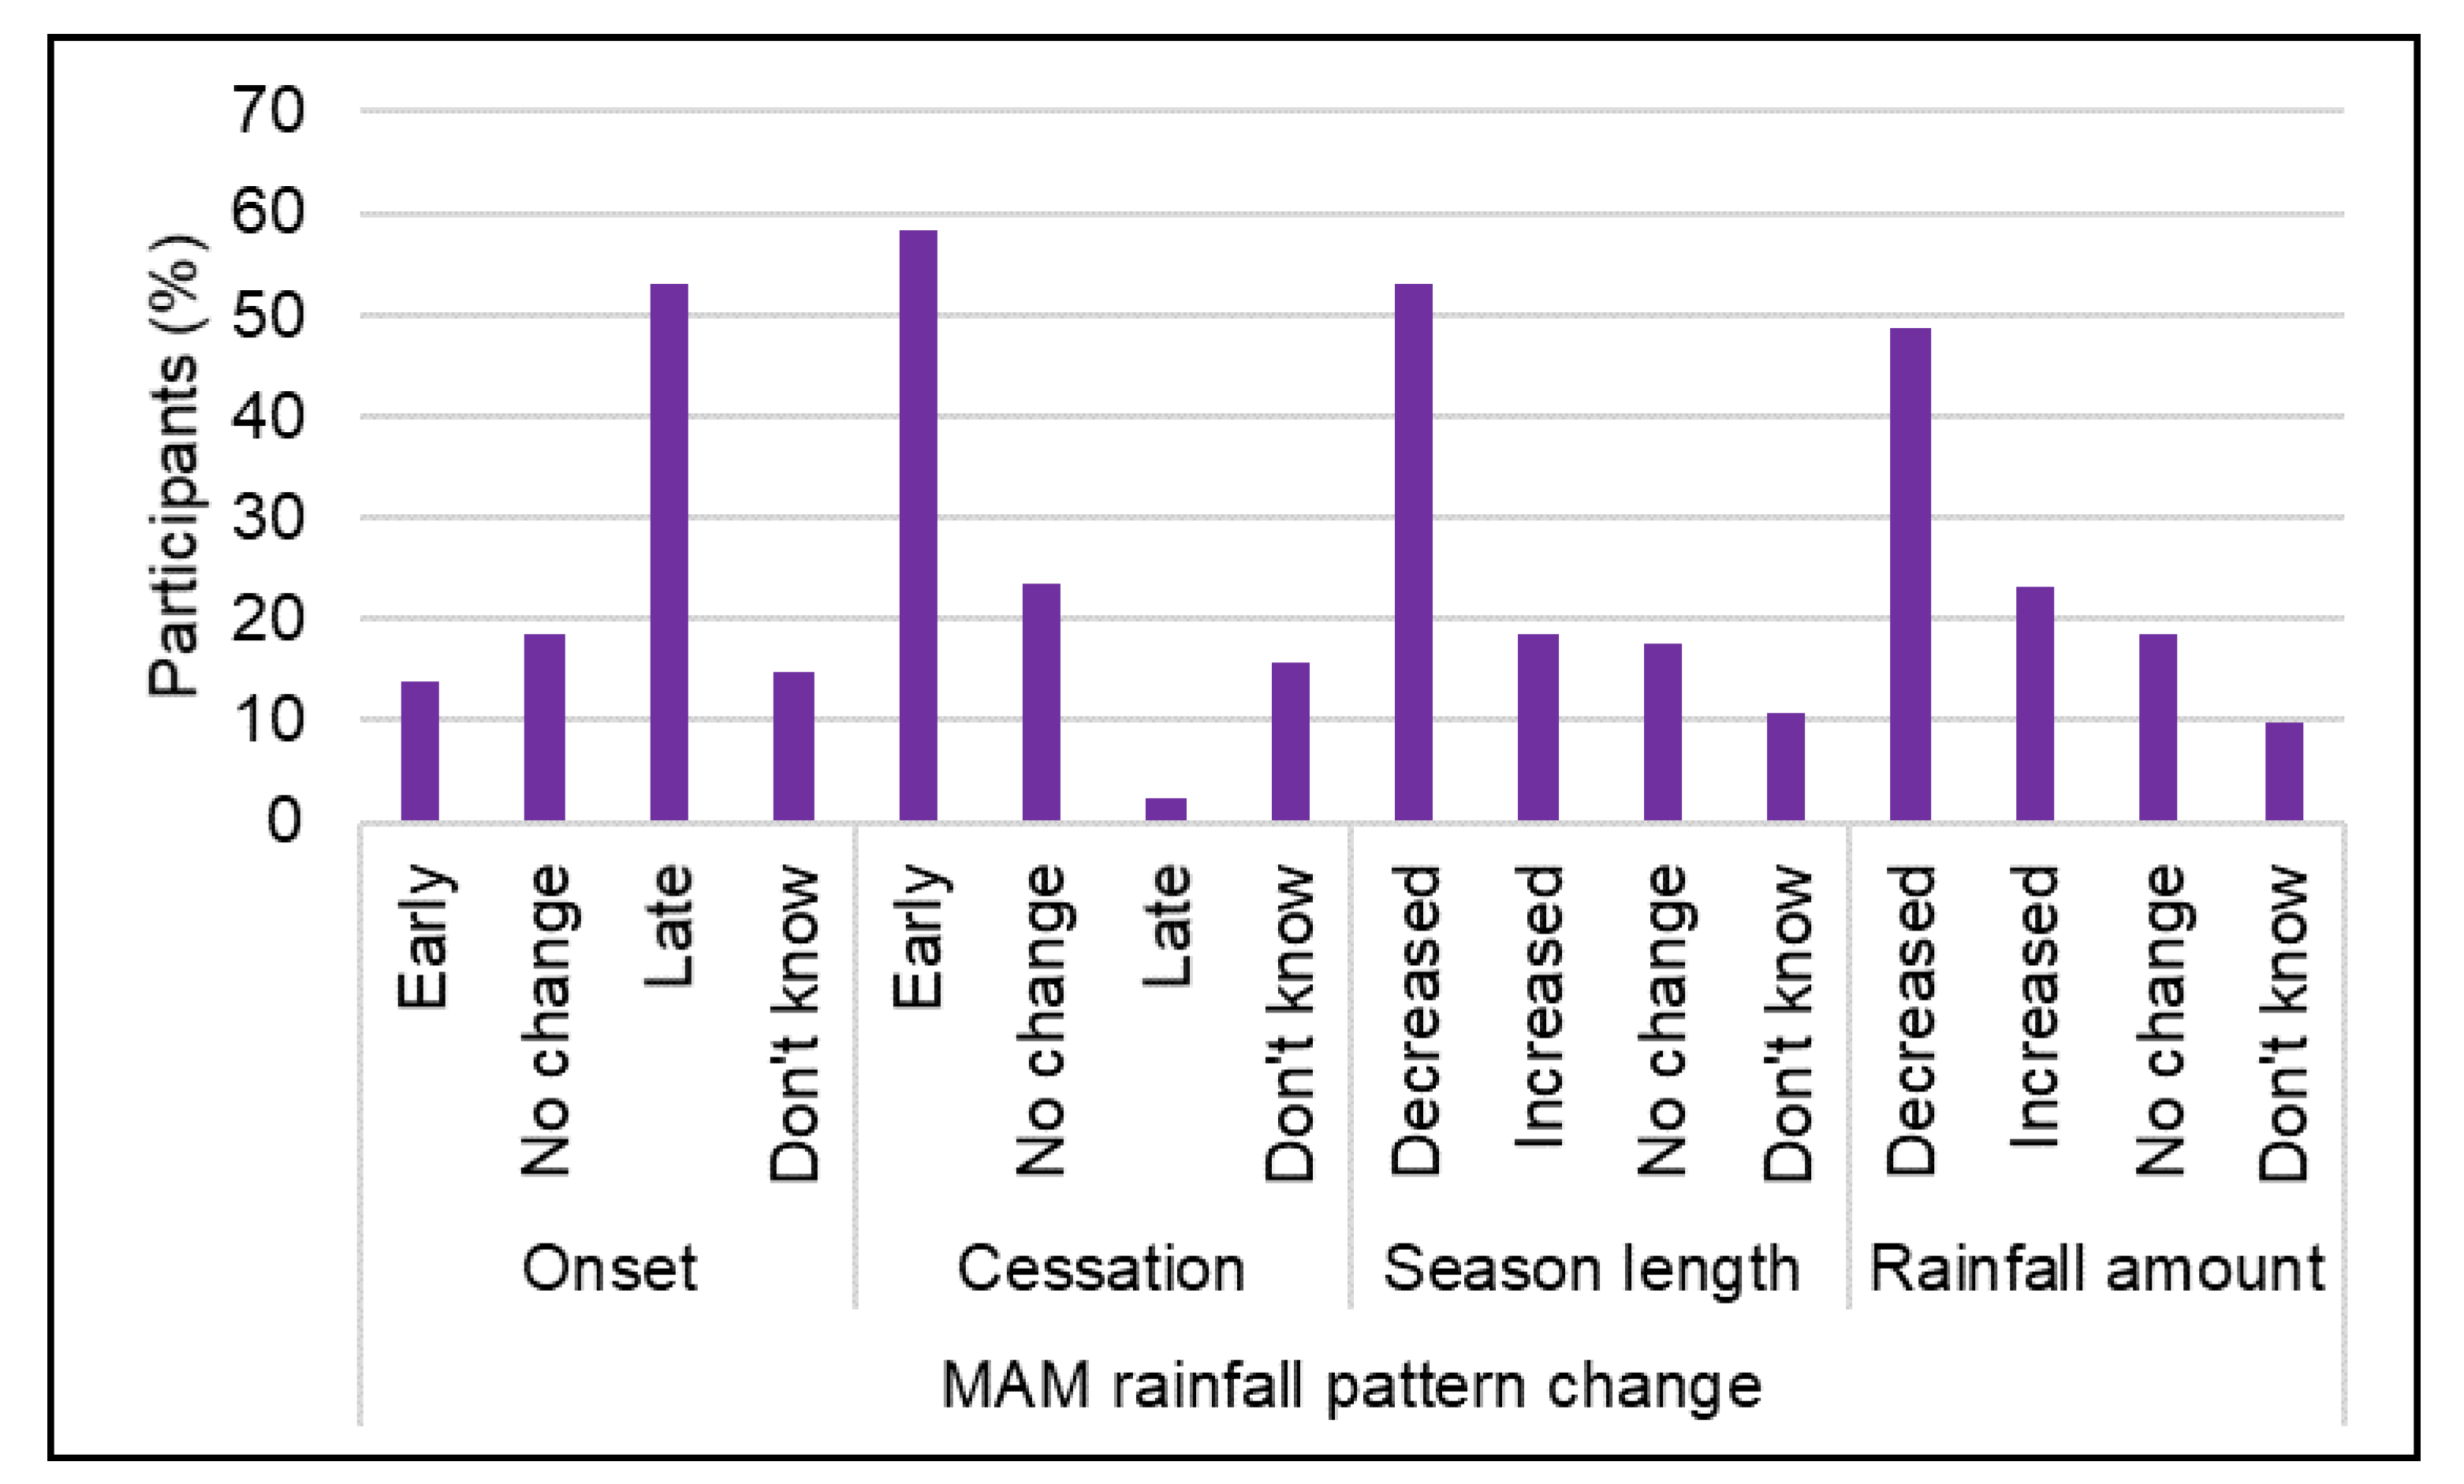
Figure 5.
Respondent farmers’ perceptions of change in the SOND season rainfall pattern.
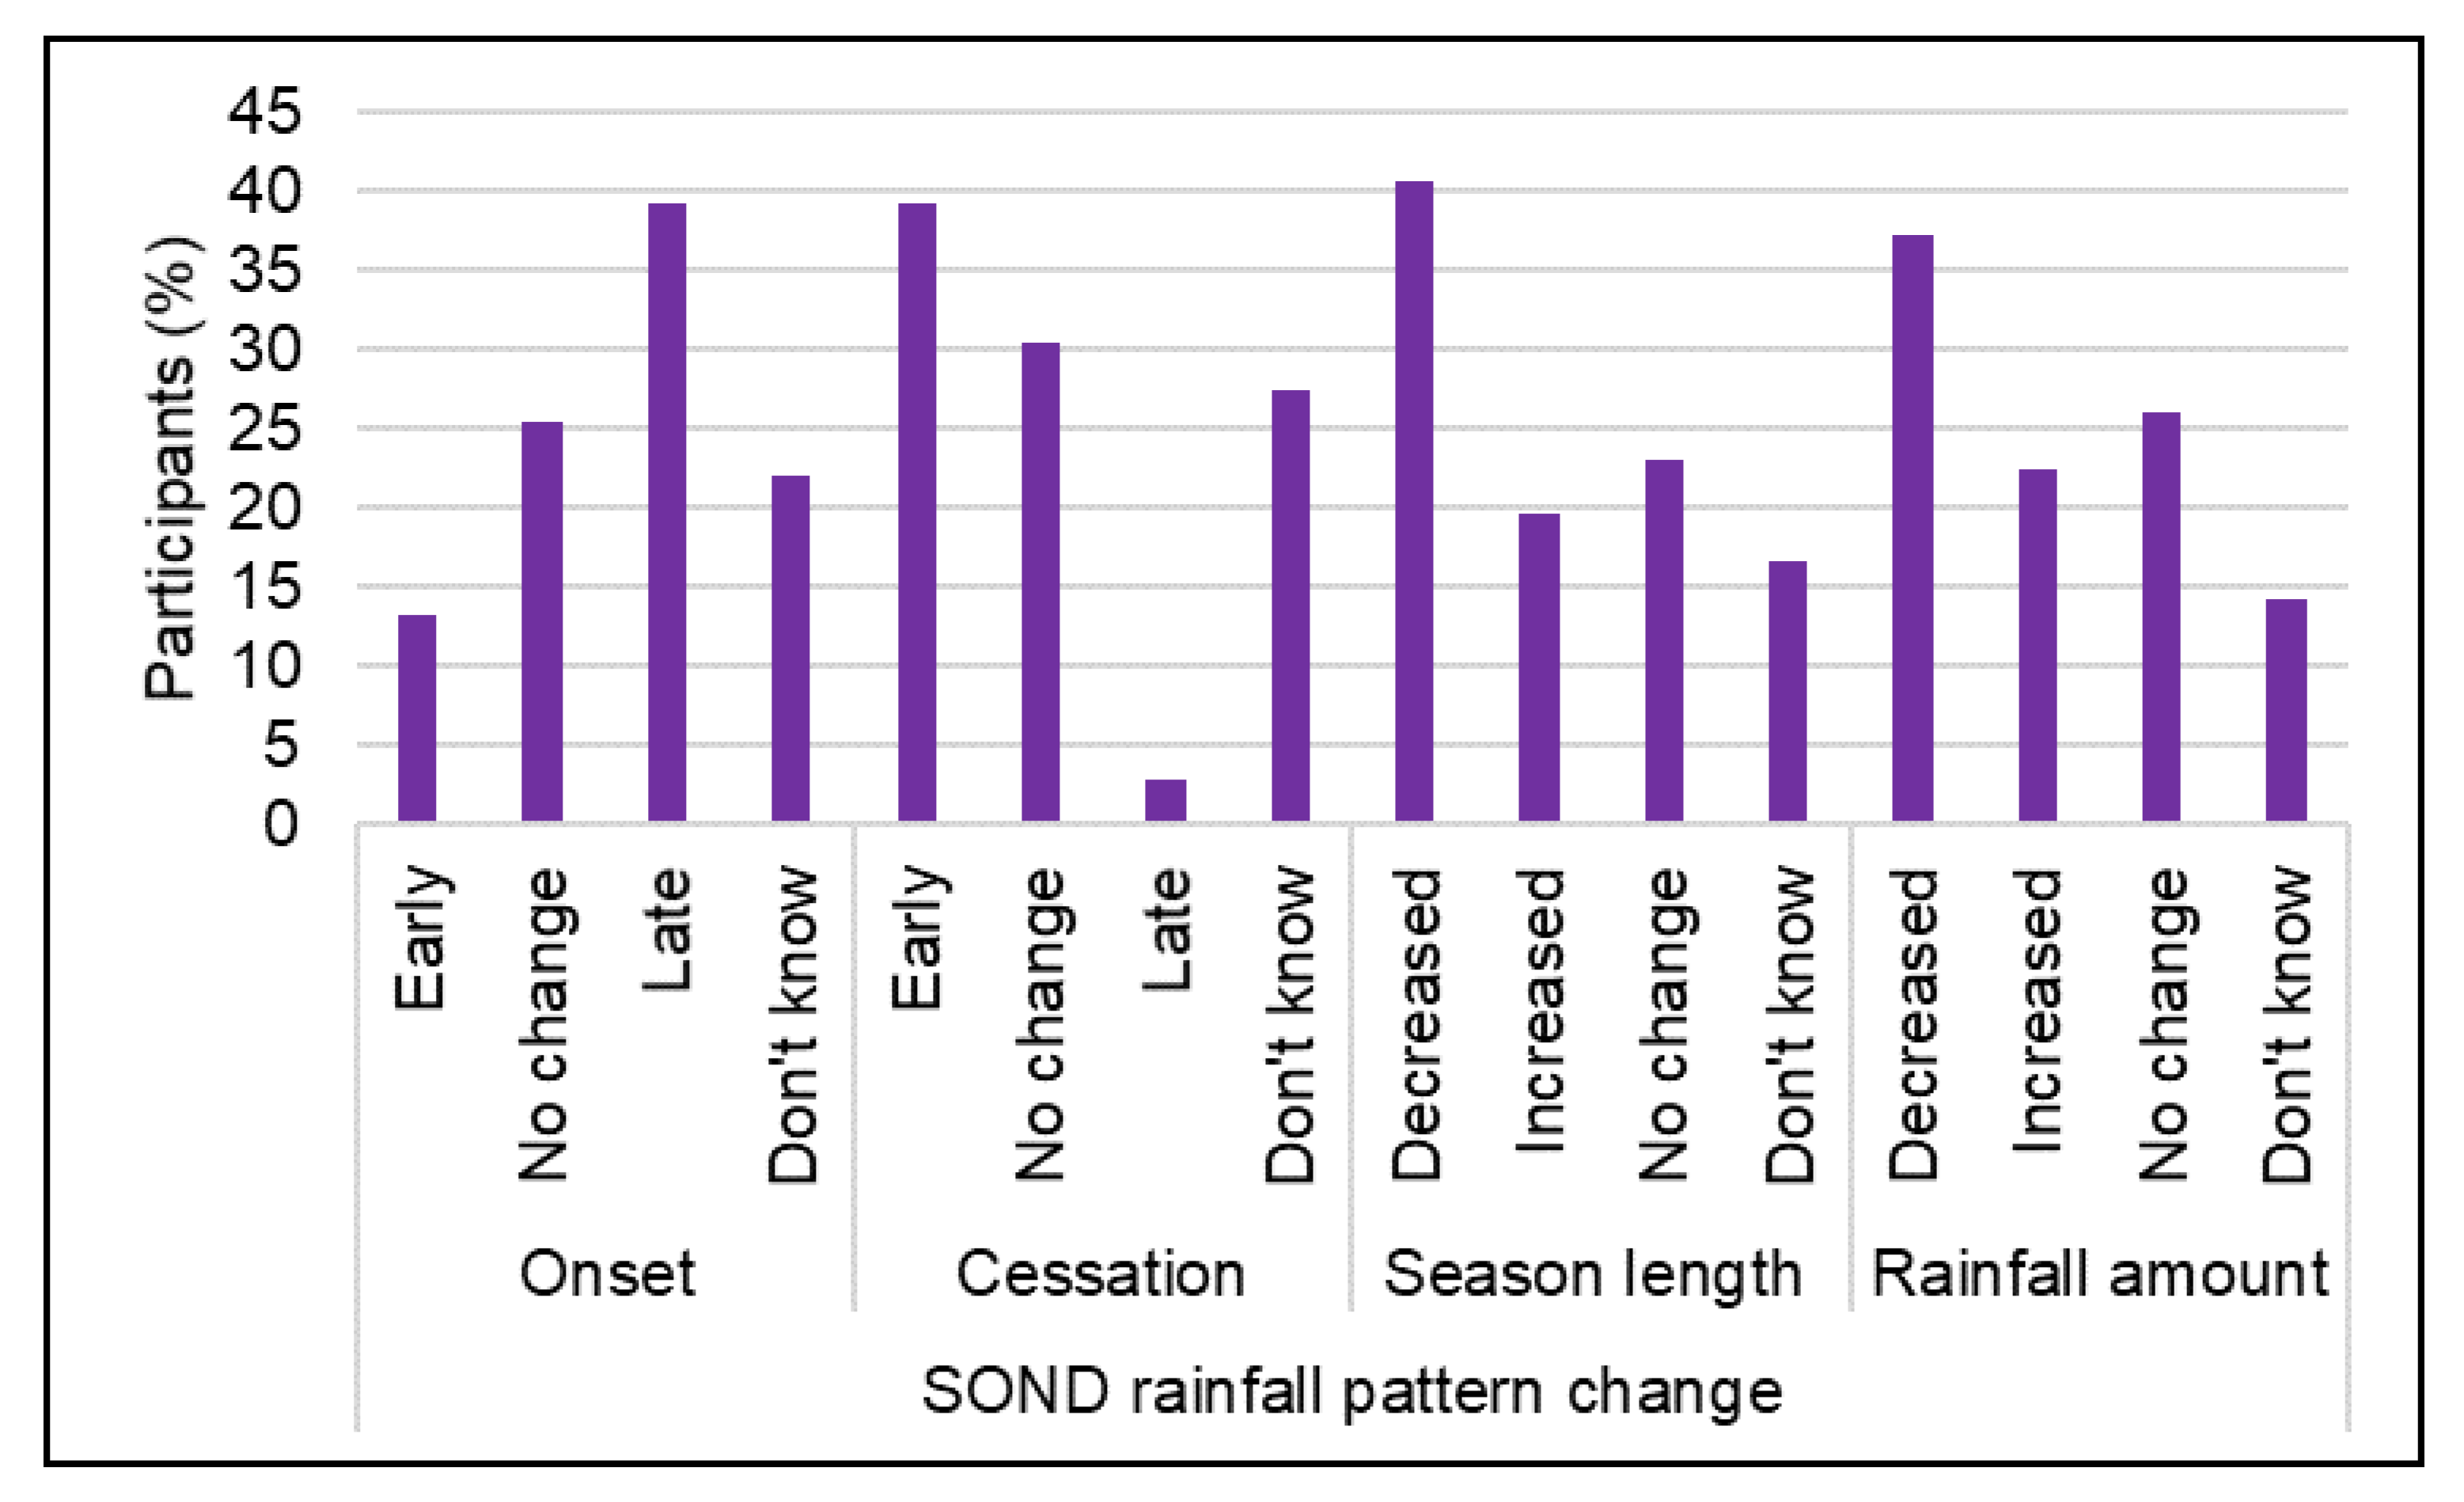
Figure 6.
Percentage (%) of respondent farmers who perceived the impacts of climate change (n=204).
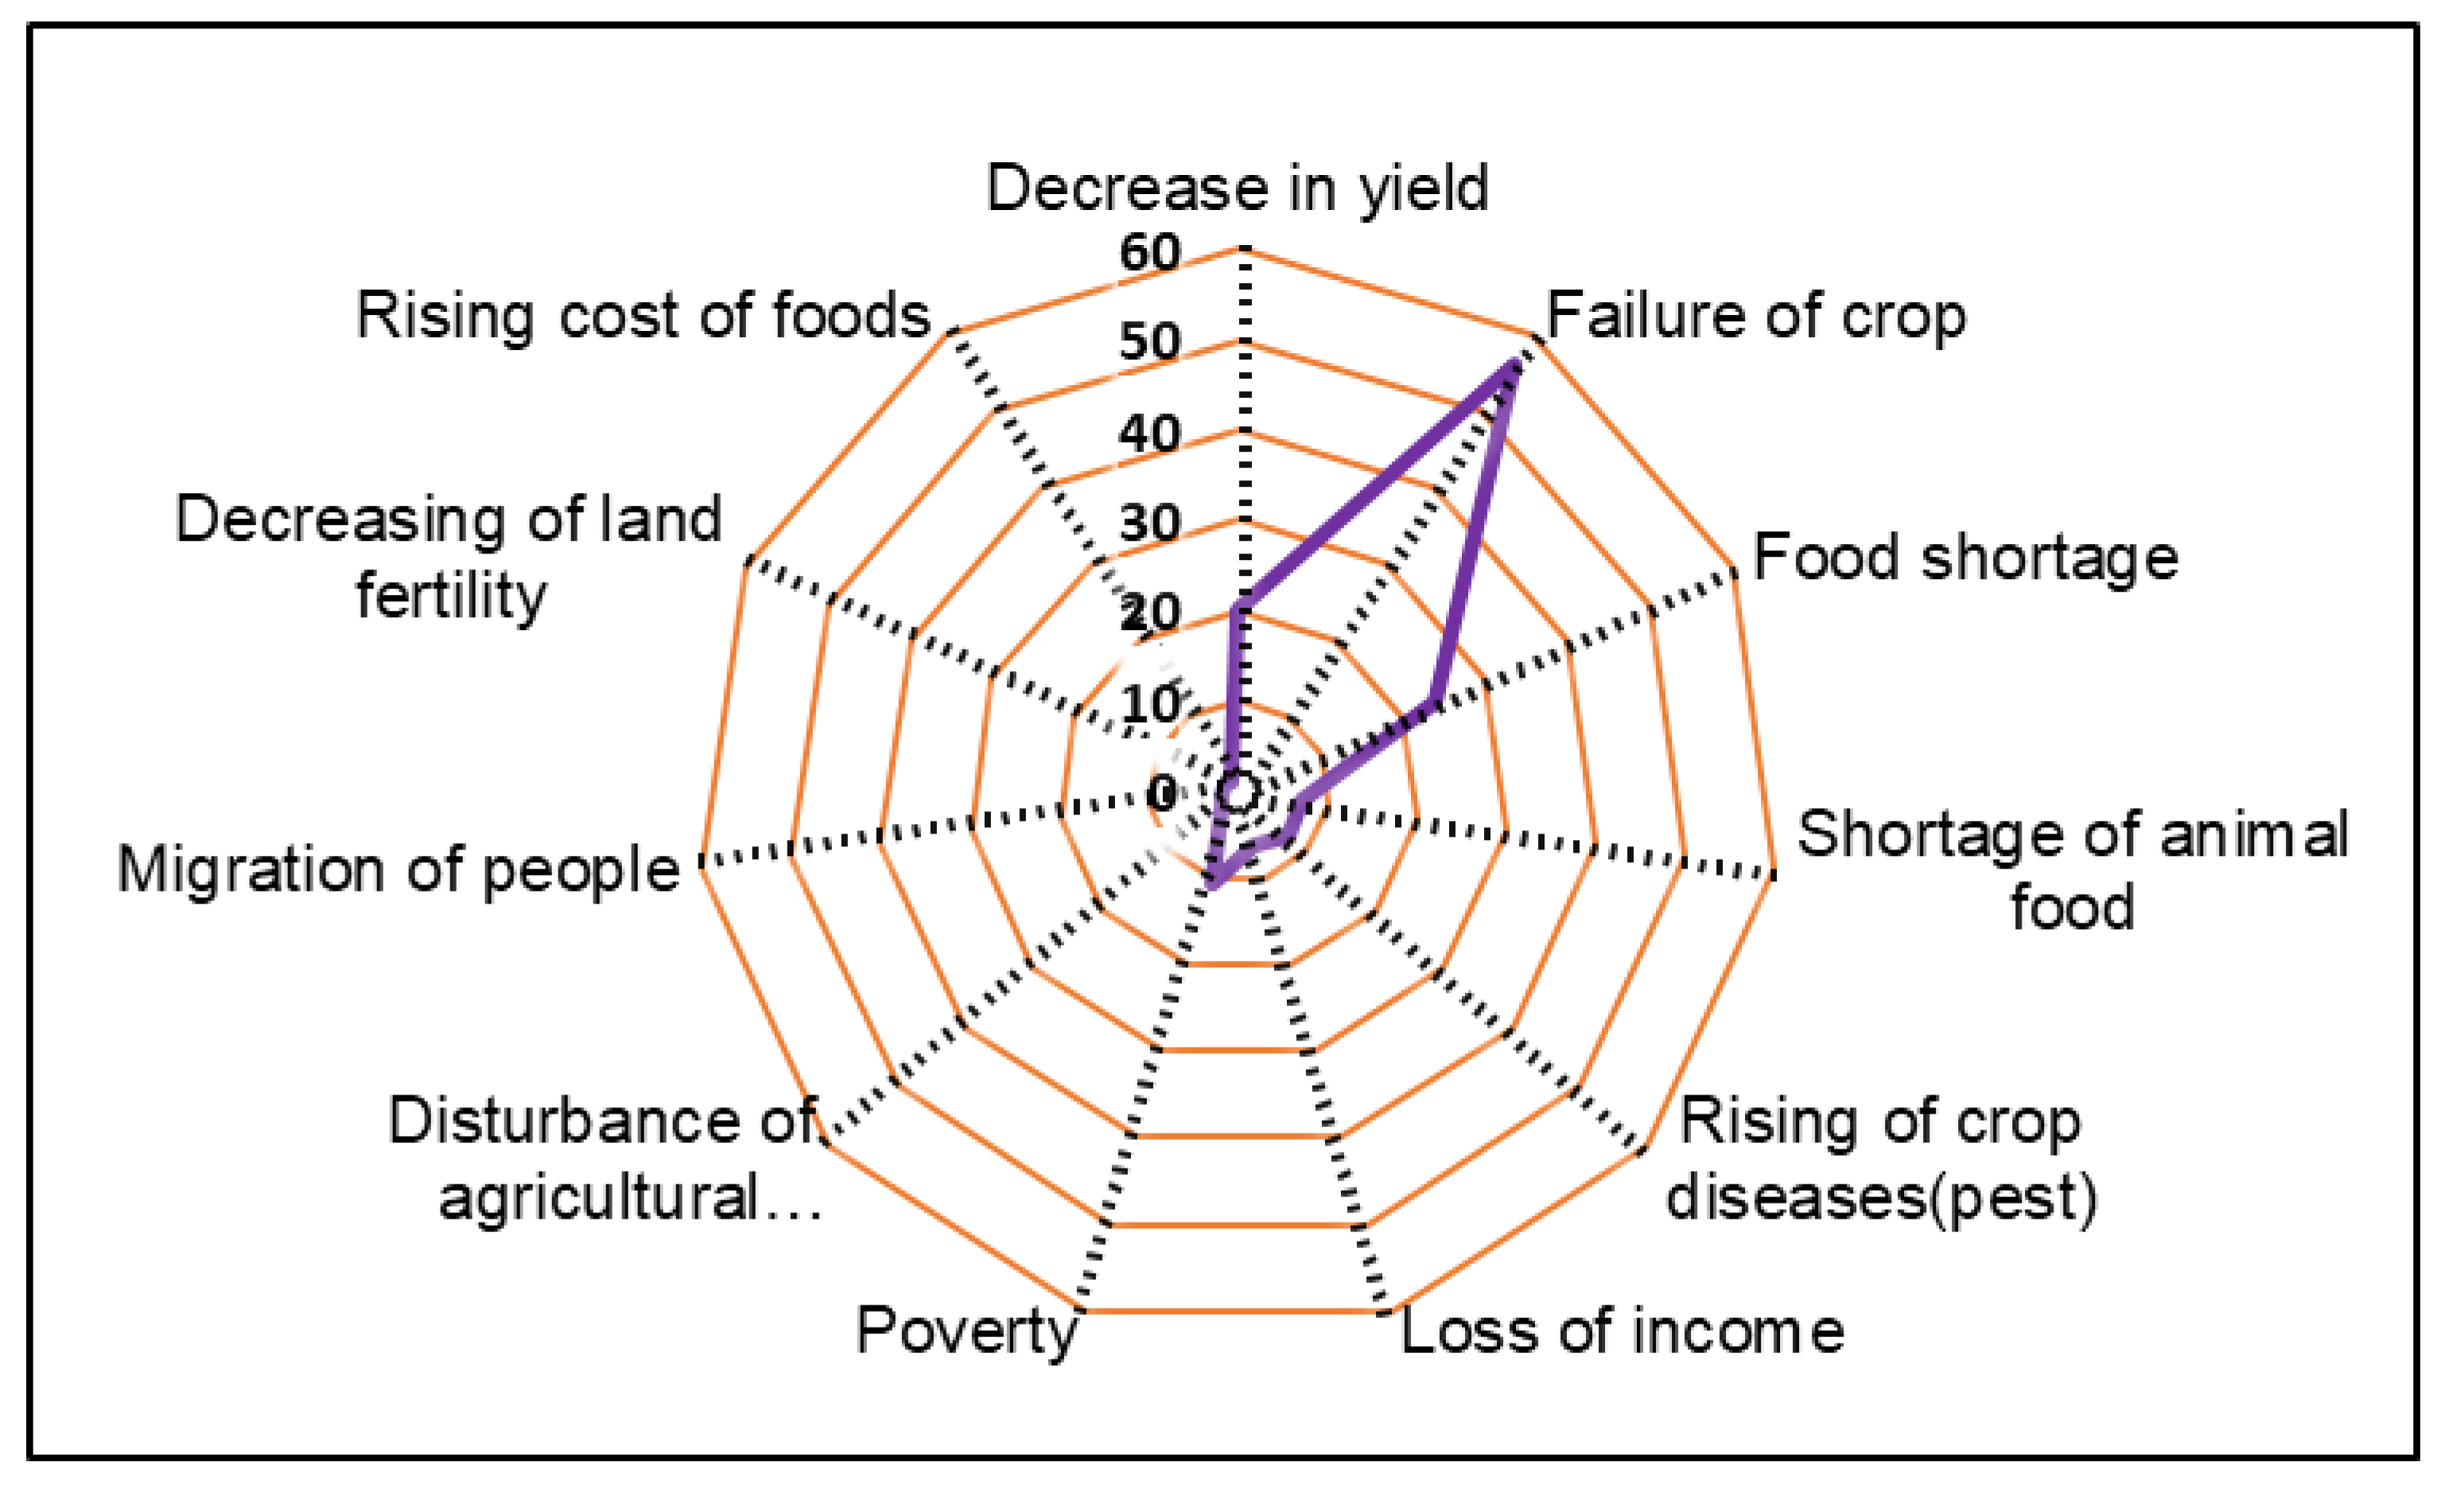

Table 1.
Farmers’ distribution in districts, sectors, and cells.
| Zone | District | Sector | Cell |
|---|---|---|---|
| North | Nyagatare (33) | Nyagatare (1) | Nyagatare (1) |
| Gatunda (9) | Nyamirembe (9) | ||
| Mukama (6) | Gihengeri (1), Rugarama (5) | ||
| Mimuri (4) | Mimuri (2), Rugari (2) | ||
| Katabagemu (13) | Barija (3), Nyakigando (9), Ryaruganzu (1) | ||
| Gatsibo (35) | Ngarama (10) | Nyarubungo (9), Cyigashi (1) | |
| Nyagihanga (14) | Gitinda (14) | ||
| Kabarore (11) | Nyabikiri (10), Nyabikenke (1) | ||
| Central | Kayonza (36) | Ndego (10) | Byimana (7), Kiyovu (3) |
| Kabare (12) | Rubumba (10), Cyarubare (1), Karubimba (1) | ||
| Kabarondo (14) | Cyabajwa (14) | ||
| South | Ngoma (74) | Mutenderi (24) | Karwema (19), Kibare (5) |
| Kazo (29) | Kinyonzo (29) | ||
| Murama (21) | Sakara (19), Rurenge (1), Mvumba (1) | ||
| Kirehe (26) | Nyamugali (10) | Nyamugali (7), Kiyanzi (3) | |
| Kigina (11) | Gatarama (11) | ||
| Musaza (5) | Mubuga (4), Nganda (1) |
Table 2.
Displays changes (in °C) with a 95% confidence interval in brackets [] for the averaged seasonal and annual means of Tx, Tn, and T in the Eastern Province of Rwanda from 1983 to 2021.
Table 2.
Displays changes (in °C) with a 95% confidence interval in brackets [] for the averaged seasonal and annual means of Tx, Tn, and T in the Eastern Province of Rwanda from 1983 to 2021.
| 1983-2021 | |||
|---|---|---|---|
| Season | Tx | Tn | T |
| JF | 0.88 [-1.02-2.74] | 1.71 [0.66-2.83] | 1.47 [0.28-2.62] |
| MAM | 0.16 [-1.60-2.00] | 2.37 [1.07-3.68] | 1.69 [0.22-2.93] |
| JJA | 0.85 [-0.27-1.97] | 3.37 [1.75-4.81] | 2.37 [0.94-3.68] |
| SOND | -0.37 [-2.17-1.42] | 2.72 [1.10-4.46] | 1.17 [-0.18-2.47] |
| Annual | 0.30 [-1.31-1.71] | 2.95 [1.64-4.45] | 1.87 [0.61-3.19] |
Table 3.
Slope value of identified trends for rainfall events at the Eastern regional scale. The * in the results indicates that significant regional trends are observed at a 95% confidence level.
Table 3.
Slope value of identified trends for rainfall events at the Eastern regional scale. The * in the results indicates that significant regional trends are observed at a 95% confidence level.
| 1981-2021 | ||||
|---|---|---|---|---|
| Season | Rainfall amount mm/day/year | Onset days/year |
Cessation days/year |
Season Duration days/year |
| MAM | -0.01 | -0.21 | 0.00 | 0.21 |
| SOND | 0.00 | -0.21* | 0.00 | 0.23* |
Table 4.
Socioeconomic characteristics of respondents (n=204).
| Variables | Category | Frequency | Percentage (%) | Mean |
|---|---|---|---|---|
| Gender | Female | 88 | 43 | |
| Male | 116 | 57 | ||
| Age | 20-34 | 48 | 24 | 43.66 |
| 35-49 | 98 | 48 | ||
| 50-64 | 48 | 24 | ||
| 65-80 | 10 | 5 | ||
| Farming Experience (years) | 1-20 | 96 | 47 | 22.18 |
| 21-40 | 97 | 48 | ||
| 41-60 | 10 | 5 | ||
| Time in farm per day (unit is second) | ≤ 14400 | 21 | 10 | 20880 |
| 18000-28800 | 167 | 82 | ||
| ≥ 32400 | 16 | 8 | ||
| Education | None | 34 | 17 | |
| Primary | 124 | 61 | ||
| Secondary_level_1_(Senior_3) | 22 | 11 | ||
| Secondary_level_2_(Senior_6) | 17 | 8 | ||
| Technical_vocation | 6 | 3 | ||
| University | 1 | 0.5 | ||
| Farm size (unit is square meters) | 0-10000 | 144 | 71 | 13000 |
| 11000-20000 | 40 | 20 | ||
| > 20000 | 20 | 10 | ||
| Farm location | Hillside | 97 | 48 | |
| Wetland | 30 | 15 | ||
| Both | 77 | 38 | ||
| Farm ownership status | Owner | 108 | 53 | |
| Tenant | 34 | 17 | ||
| Both | 62 | 30 | ||
| Farming goals | Home consumption | 62 | 30 | |
| Income | 4 | 2.0 | ||
| Both (Income and home consumption) | 138 | 68 | ||
| Main crops | Maize | 184 | 90 | |
| Beans | 181 | 89 | ||
| Cassava | 63 | 31 | ||
| Livestock ownership | Yes | 131 | 64 | |
| No | 73 | 36 | ||
| Group membership | Yes | 76 | 37 | |
| No | 128 | 63 | ||
| Exchanging info | Yes | 161 | 79 | |
| No | 43 | 21 | ||
| Access to weather info | Yes | 99 | 49 | |
| No | 105 | 51 | ||
| Access to bank service | Yes | 119 | 58 | |
| No | 85 | 42 | ||
| Household size | 1-5 | 136 | 67 | 5 |
| 6-10 | 65 | 32 | ||
| 11-15 | 3 | 1.5 |
Table 5.
Climate indicators associated with farmers’ knowledge about rainy season onset and cessation (n=204).
Table 5.
Climate indicators associated with farmers’ knowledge about rainy season onset and cessation (n=204).
| Onset skills | Cessation skills | ||||
| Frequency | Percentage | Frequency | Percentage | ||
| Cloud | 72 | 35 | Rainfall distribution | 93 | 46 |
| Wind | 38 | 19 | Rainfall amount | 36 | 18 |
| Temperature | 27 | 13 | Rainfall duration | 35 | 17 |
| Lightning | 12 | 6 | Rainfall frequency | 22 | 11 |
| Do not know | 32 | 16 | Cloud | 16 | 8 |
| Temperature | 13 | 6 | |||
| Wind | 4 | 2 | |||
| Do not know | 25 | 12 | |||
Table 6.
Climate change adaptation strategies adopted by respondent farmers (n=204).
| Adaptation Strategies | Frequency | Percentage |
|---|---|---|
| Agroforestry/Planting trees (PT) | 81 | 40 |
| Changing crop varieties (CCV) | 47 | 23 |
| Application of fertilizer (organic and inorganic) (AF) | 47 | 23 |
| Changing planting dates (CPD) | 54 | 26 |
| Soil conservation (SC) | 50 | 25 |
| Focus on wetland (FWL) | 21 | 10 |
| Use irrigation (UI) | 43 | 21 |
| Mulching (M) | 9 | 4 |
| Use of pesticides (UP) | 15 | 7 |
| Planting grass (PG) | 11 | 5 |
Table 7.
Barriers to the effective adaptation of climate change by respondent farmers (n=204).
| Barriers | Frequency | Percentage |
|---|---|---|
| Lack of finance | 58 | 28 |
| Inadequate info | 39 | 19 |
| Lack of material | 43 | 21 |
| Lack of weather info | 24 | 12 |
| Shortage of farm inputs | 40 | 20 |
| Lack of water | 14 | 7 |
| High cost of input | 7 | 3 |
| Land location | 4 | 2 |
| High cost of material | 4 | 2 |
Table 8.
Analysis of the models’ significance and goodness of fit.
| Omnibus Tests of Model Coefficients | ||||
| Models | Chi-square | Degree of freedom(df) | P-value | |
| Agroforestry/Planting trees (PT) | 34.026 | 15 | .003 | |
| Changing crop varieties (CCV) | 29.94 | 15 | .012 | |
|
Application of fertilizer (Organic and inorganic) (AF) |
45.219 | 15 | .000 | |
| Hosmer and Lemeshow Test | ||||
| Chi-square | Degree of freedom(df) | P-value | ||
| Agroforestry/Planting trees (PT) | 5.316 | 8 | .723 | |
| Changing crop varieties (CCV) | 2.59 | 8 | .957 | |
|
Application of fertilizer (organic and inorganic) (AF) |
9.611 | 8 | .293 | |
| Model Summary | ||||
| -2 Log likelihood | Cox & Snell R Square | Nagelkerke R Square | Model correctness (%) | |
| Agroforestry/Planting trees (PT) | 240.068 | 0.154 | 0.208 | 66.7 |
| Changing crop varieties (CCV) | 190.278 | 0.137 | 0.207 | 77.5 |
|
Application of fertilizer (Organic and inorganic) (AF) |
174.999 | 0.199 | 0.301 | 82.4 |
Table 9.
Logistic regression results: odds ratios and 95 % confidence interval showing socioeconomic factors influencing farmers’ choice of selected adaptation strategies. .
Table 9.
Logistic regression results: odds ratios and 95 % confidence interval showing socioeconomic factors influencing farmers’ choice of selected adaptation strategies. .
| Variables | PT | CCV | AF |
|---|---|---|---|
| Gender | 0.700 [0.345-1.418] | 0.477* [0.205-1.109] | 0.408** [0.167-1.000] |
| Age | 0.965 [0.915-1.017] | 0.963 [0.904-1.026] | 1.009 [0.951-1.070] |
| Education level | 1.037 [0.717-1.502] | 0.963 [0.629-1.474] | 1.013 [0.635-1.616] |
| Farmer experience(years) | 1.019 [0.969-1.072] | 1.036 [0.977-1.099] | 1.002 [0.946-1.061] |
| Time spent/day (Hours) | 1.007 [0.810-1.252] | 0.843 [0.647-1.099] | 0.751* [0.553-1.020] |
| Farm size (hectares) | 0.885 [0.690-1.134] | 1.013 [0.780-1.314] | 0.773 [0.498-1.201] |
| Farm location | 0.739 [0.513-1.064] | 1.052 [0.697-1.587] | 1.926** [1.225-3.028] |
| Land-holding status | 1.158 [0.803-1.670] | 1.324 [0.867-2.022] | 1.008 [0.638-1.591] |
| Farming goal | 1.668** [1.099-2.531] | 1.245 [0.745-2.083] | 0.770 [0.460-1.288] |
| Livestock ownership | 1.979* [0.965-4.060] | 1.250 [0.530-2.948] | 1.674 [0.679-4.128] |
| Farmer group membership | 1.587 [0.776-3.245] | 2.740** [1.206-6.226] | 3.926** [1.556-9.906] |
| Exchanging info | 2.024 [0.770-5.320] | 3.167* [0.810-12.375] | 1.118 [0.321-3.895] |
| Access to weather info (Radio) | 1.234 [0.639-2.384] | 1.272 [0.592-2.732] | 2.271* [0.978-5.276] |
| Access to bank services | 0.703 [0.344-1.437] | 0.494* [0.216-1.127] | 0.286** [0.116-0.706] |
| Household size (Individuals) | 1.043 [0.893-1.218] | 1.009 [0.846-1.205] | 0.994 [0.818-1.208] |
| Constant | 0.261 | 0.203 | 0.403 |
* and ** show significant levels at 0.1 and 0.05, respectively.
Disclaimer/Publisher’s Note: The statements, opinions and data contained in all publications are solely those of the individual author(s) and contributor(s) and not of MDPI and/or the editor(s). MDPI and/or the editor(s) disclaim responsibility for any injury to people or property resulting from any ideas, methods, instructions or products referred to in the content. |
© 2025 by the authors. Licensee MDPI, Basel, Switzerland. This article is an open access article distributed under the terms and conditions of the Creative Commons Attribution (CC BY) license (http://creativecommons.org/licenses/by/4.0/).
Copyright: This open access article is published under a Creative Commons CC BY 4.0 license, which permit the free download, distribution, and reuse, provided that the author and preprint are cited in any reuse.


