
Submitted:
01 May 2025
Posted:
05 May 2025
You are already at the latest version
Abstract
Gene expression analysis is crucial in understanding cellular processes, development, health, and disease. With RNA-seq outpacing microarray as the chosen platform for gene expression, is there space for array data in future profiling? The study involved 35 participants from the Adolescent Medicine Trials Network for HIV/AIDS Intervention protocol. RNA was isolated from whole blood samples and analyzed using both microarray and RNA-seq technologies. Data processing included quality control, normalization, and statistical analysis using non-parametric Mann-Whitney U tests. Differential expression analysis and pathway analysis were conducted to compare the outputs of the two platforms. The study found a high correlation in gene expression profiles between microarray and RNA-seq, with a median Pearson correlation coefficient of 0.76. RNA-seq identified 2,395 differentially expressed genes (DEGs), while microarray identified 427 DEGs, with 223 DEGs shared between the two platforms. Pathway analysis revealed 205 perturbed pathways by RNA-seq and 47 by microarray, with 30 pathways shared. Both microarray and RNA-seq technologies provide highly concordant results when analyzed with consistent non-parametric statistical methods. The findings emphasize that both methods are reliable for gene expression analysis and can be used complementarily to enhance the robustness of biological insights.
Keywords:
microarray
; RNA-sequencing
; nonparametric
; HIV
; transcriptomics
; gene expression
1. Introduction
Gene expression analysis plays an important role in evaluating the molecular mechanisms underlying cellular processes, development, health and disease [1,2,3,4]. RNA sequencing (RNA-seq) and microarray technologies are two well established methods for quantifying gene expression profiles. For decades, throughout the late 1990’s and early 2000’s, microarray technology was the cornerstone of transcriptome profiling and the source for the bulk of Gene Expression Omnibus (GEO) repository’s datasets during that time. The landscape of transcriptomics in GEO has shifted with the advent of RNA-seq technology which, as of 2023, comprises 85% of all submissions [5].
While both technologies start with mRNA and PCR amplification to produce cDNA, the two platforms differ greatly in their gene expression quantification technologies. Microarrays detect fluorescently labeled cDNA through hybridization to complementary sequences on a solid surface. The output is measured as a continuous variable, represented by fluorescence intensity. In contrast, RNA-seq leverages next-generation sequencing (NGS) of cDNA molecules, providing a digital readout of transcript abundance and sequence information.
Comparisons between RNA-seq and microarray technologies for gene expression yield both similar and different findings regarding comparability of profiling by each method [6,7,8,9,10]. The gene expression discordance found in these studies may be attributed to inherent differences introduced by sample variability, preparation, and analytical approach. One study using technical replicates and simulated data to assess the differentially expressed gene (DEG) profiles found strong correlations between microarray and RNA-seq with most discrepancies related to the different analytic algorithms for each platform [11]. Zhang, et al. found that despite DEG discrepancies microarray and RNA-seq had similar clinical endpoint predictions [12]. A comparison done starting with the same samples and an appropriate non-parametric statistical approach may reduce gene expression discrepancies and enhance downstream pathway analyses.
In this comparison study using RNA-seq and microarray data, the same statistical approaches were applied to analyze the transcriptome profile of the same peripheral blood cell (PBC) samples. The goal of this study was to minimize DEG discrepancies and assess the relatedness of the functional analyses’ outputs between microarray and RNA-seq.
2. Materials and Methods
2.1. Clinical Profile of the Study Participants
The study participants were enrolled through the Adolescent Medicine Trials Network (ATN) for HIV/AIDS Intervention protocol 071/101, across 22 urban sites across in the United States and Puerto Rico (ClinicalTrials.gov; https://clinicaltrials.gov, Clinical Identifier No NCT00683579). The enrollment procedure and primary outcome results for this 3-year study have been reported [13,14,15,16,17,18,19,20]. A sub-study of 35 participants aged 18–25 years included 22 youth without HIV (YWOH) and 13 youth with HIV (YWH) (Table S1) selected based on the availability of whole blood samples for both microarray and RNA-seq analyses. The study participants across the groups were predominantly male (79%) and African American (70%). YWH were on combination antiretroviral therapy (ART) with suppressed viral loads (< 50 HIV-1 RNA copies/mL plasma) and reported use of marijuana and tobacco, while YWOH reported no substance use.
2.2. RNA Isolation, Hybridization and Sequencing
Total intracellular RNA was isolated from whole blood cell samples collected in PAXgene Blood RNA tubes (Becton, Dickinson and Company, Franklin Lakes, New Jersey, US) using PAXgene Blood RNA Kit (PreAnalytiX, Hombrechtikon, Switzerland) as previously described[19,20]. Globin mRNA was depleted using GLOBINclear Kit (Ambion, Waltham, MA, USA) and RNA quality was assessed by Agilent Bioanalyzer for an integrity score above 7. For microarray analysis, 100 ng aliquots of globin reduced RNA was poly(A) selected, amplified and labeled using GeneChip 3’ IVT Express Kit (Affymetrix, Waltham, MA, USA) and hybridized to Gene Chip Human Genome U133 Plus 2.0 Array with 54,675 probes representing 20,174 genes (Affymetrix, Waltham, MA, USA) in the Interdisciplinary Center for Biotechnology Research (ICBR) at the University of Florida. For RNA-seq, 100 ng aliquots of globin reduced RNA was processed with poly(A) mRNA Magnetic Isolation Module and NEBNext Ultra II RNA Library Prep Kit for Illumina (New England Biolabs, Ipswich, MA, USA). Libraries were uniquely barcodes and sequenced on the Illumina Hiseq 3000 platform (2 X 100 cycle) (Illumina, San Diego, CA, USA) at the ICBR, generating 50 million paired end reads per sample.
2.3. Data Processing
The study analytic workflow is outlined in Figure 1. For microarray data, the raw signal intensities in CEL format generated with Affymetrix GeneChip Operating Software were evaluated for quality by checking mean values, variance, and paired scatter plots. The raw probe signal values were background corrected, quantile normalized, and summarized using Robust Multi-Array Averaging (RMA) with the rma function from affy, R/Bioconductor package [21]. All expression values were converted to a log2 scale for downstream analysis. Microarray data were filtered by removing the lower 25% of the interquartile range (IQR) using the R package genefilter and annotated using the hgu133plus2.dg package in R.
Figure 1.
Study Design. The comparison was performed by collecting aliquots from the same samples for the respective platform. Data processing included filtering low variable probes in the microarray output and rows with no counts in the RNA-seq output. Data was normalized by log transformation for microarray and transcript per million (TPM) for RNA-seq. Principal Component Analysis (PCA) was performed on log-transformed data for microarray and VST for RNA-seq. Analysis of differentially expressed genes (DEGs) was performed, and coefficient of correlation, concordance, dynamic range and unique/shared genes were derived from DEGs output. Pathway analysis was performed on total gene expression data. Differential expression was determined with Mann-Whitney U (Wilcoxon rank sum) test and adjusted with Benjamini-Hochbery (BH) correction.
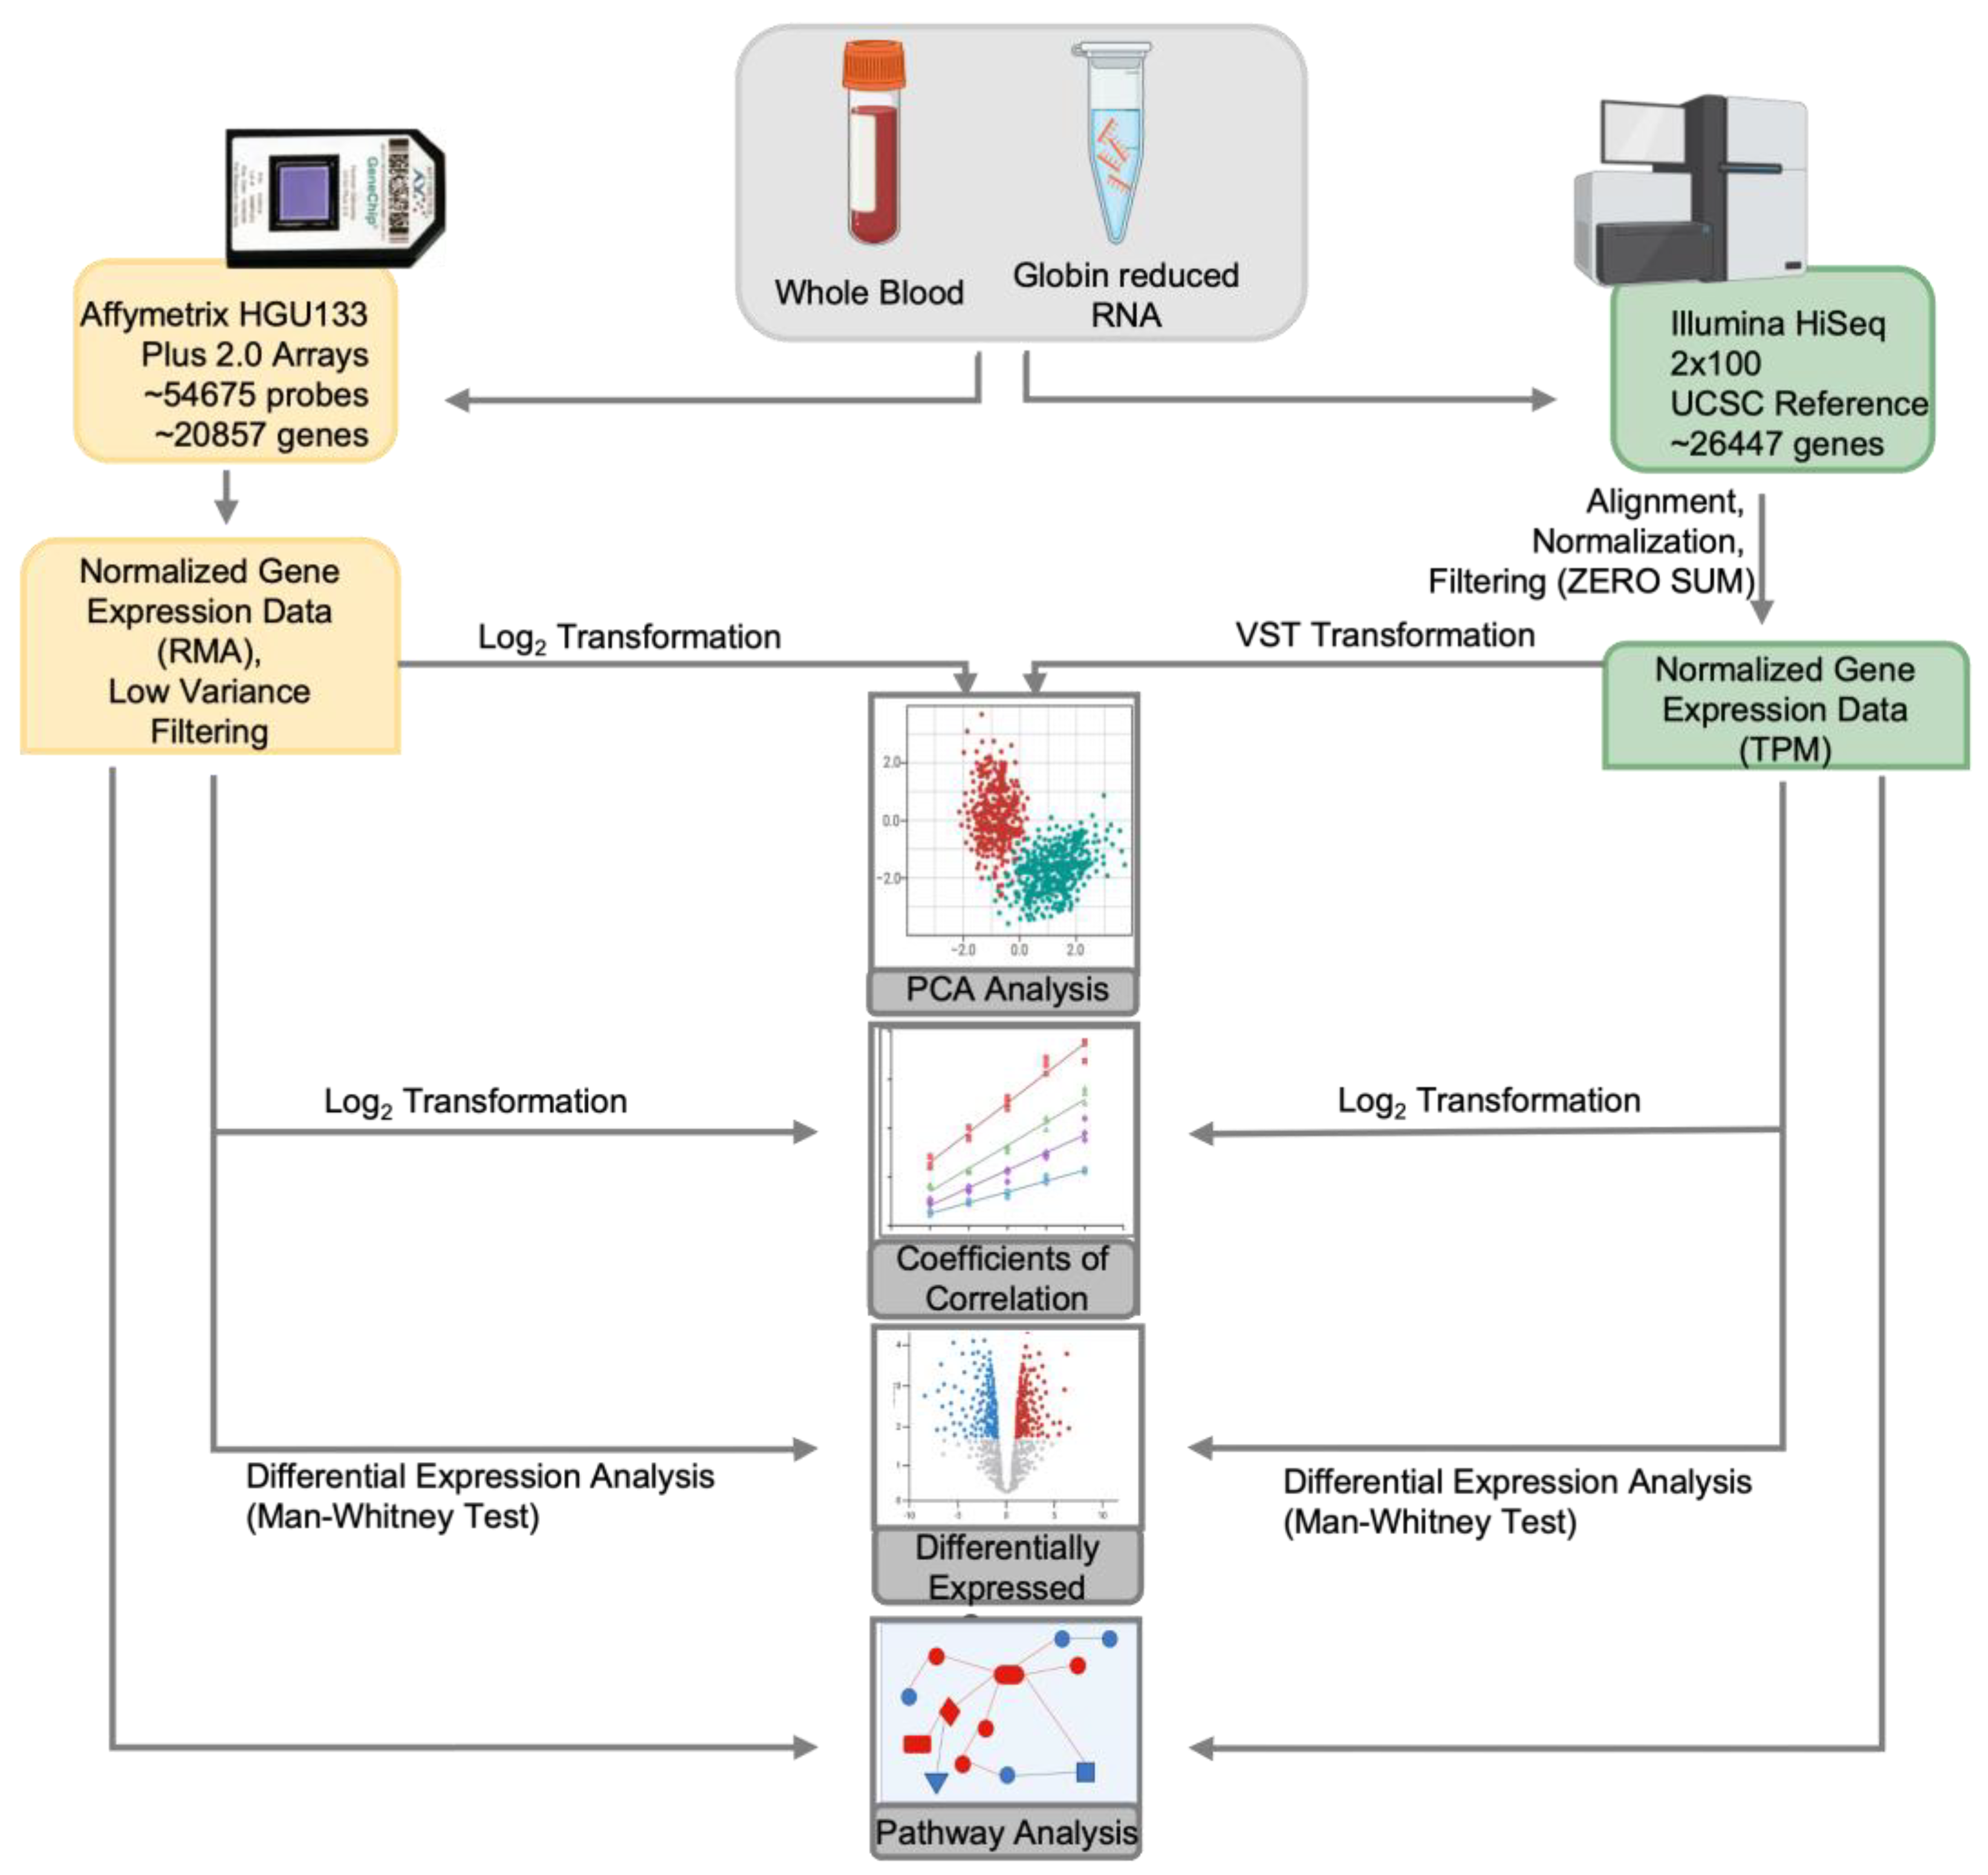
For RNA-seq, raw reads were checked for quality control with FASTQC [22]. Low-quality reads and residual adaptor sequences were trimmed using trimmomatic [23] and aligned to the USCS reference transcriptome, which included 26,475 annotated genes [24]. Read counts for each gene were obtained, and Transcripts Per Million (TPM) values were calculated. The aligned reads were assessed for batch variation and outliers using BatchQC version 2.0.0 [25]. RNA-seq data were filtered by removing all genes with a sum of 0 across all samples.
2.4. Downstream Analysis
To assess normality of the log transformed microarray data the Kolmogorov-Smirnov (KS) and the Anderson-Darling (AD) tests were employed (Table S2). To visually inspect the distributions of the microarray samples the R package ggplot2 was used to create density plots of the data (Figure S1A). The function fitdistr from the MASS package in R was used to evaluate the goodness-of-fit of RNA-seq data against three distributions: normal, Poisson and negative binomial (NB) (Table S2). To visualize the distributions of the RNA-seq samples ggplot2 was used to create overlayed density plots (Figure S1B) [26,27]. Depending on the downstream analysis, expression data was either log2 transformed or variance stabilizing transformation (VST) using the DESeq2/Bionconductor R package (1.4.4.0) [28,29,30]. Log transformed microarray and RNA-seq data were used to compute correlation coefficients using the Pearson method in R. PCA was performed on log transformed microarray data and VST-transformed RNA-seq data using the prcomp function and visualized with the ggfortify and cluster packages in R [31,32]. Ellipses on PCA plot represent a 95% confidence interval.
Differential expression analysis was conducted using non-parametric Mann-Whitney U test with wilcox.test function in R with the paired argument set to FALSE. Multiple comparisons were adjusted using the padjust function with the BH method (padj = 0.05). Dynamic fold change was calculated by dividing the means of each variable for YWOH by the means of the respective variable for YWH, followed by log2 transformation. Next, filtered expression values for microarray and RNA-seq data were uploaded into Qiagen’s Ingenuity Pathway Analysis (IPA) for pathway analysis [33].
3. Results
3.1. High Correlation of Gene Expression and Concordance of DEGs
After normalizing and filtering microarray data included 15,847 genes, about 29% less than RNA-seq’s 22,323 genes. The two platforms shared 13,667 genes, representing ~86% of microarray’s gene expression dataset and ~61% of RNA-seq’s gene expression dataset (Table 1). To further assess the concordance between RNA-seq and microarray data, differential expression analysis was performed, and outputs were compared (Table 1). RNA-seq analysis identified 2,395 DEGs, while microarray analysis identified 427 DEGs. The two platforms shared 223 DEGs, representing 52.2% of total microarray DEGs and 9.3% of total DEGs by RNA-seq, with significant concordance in the overlap (p-value = 2.2e-16).
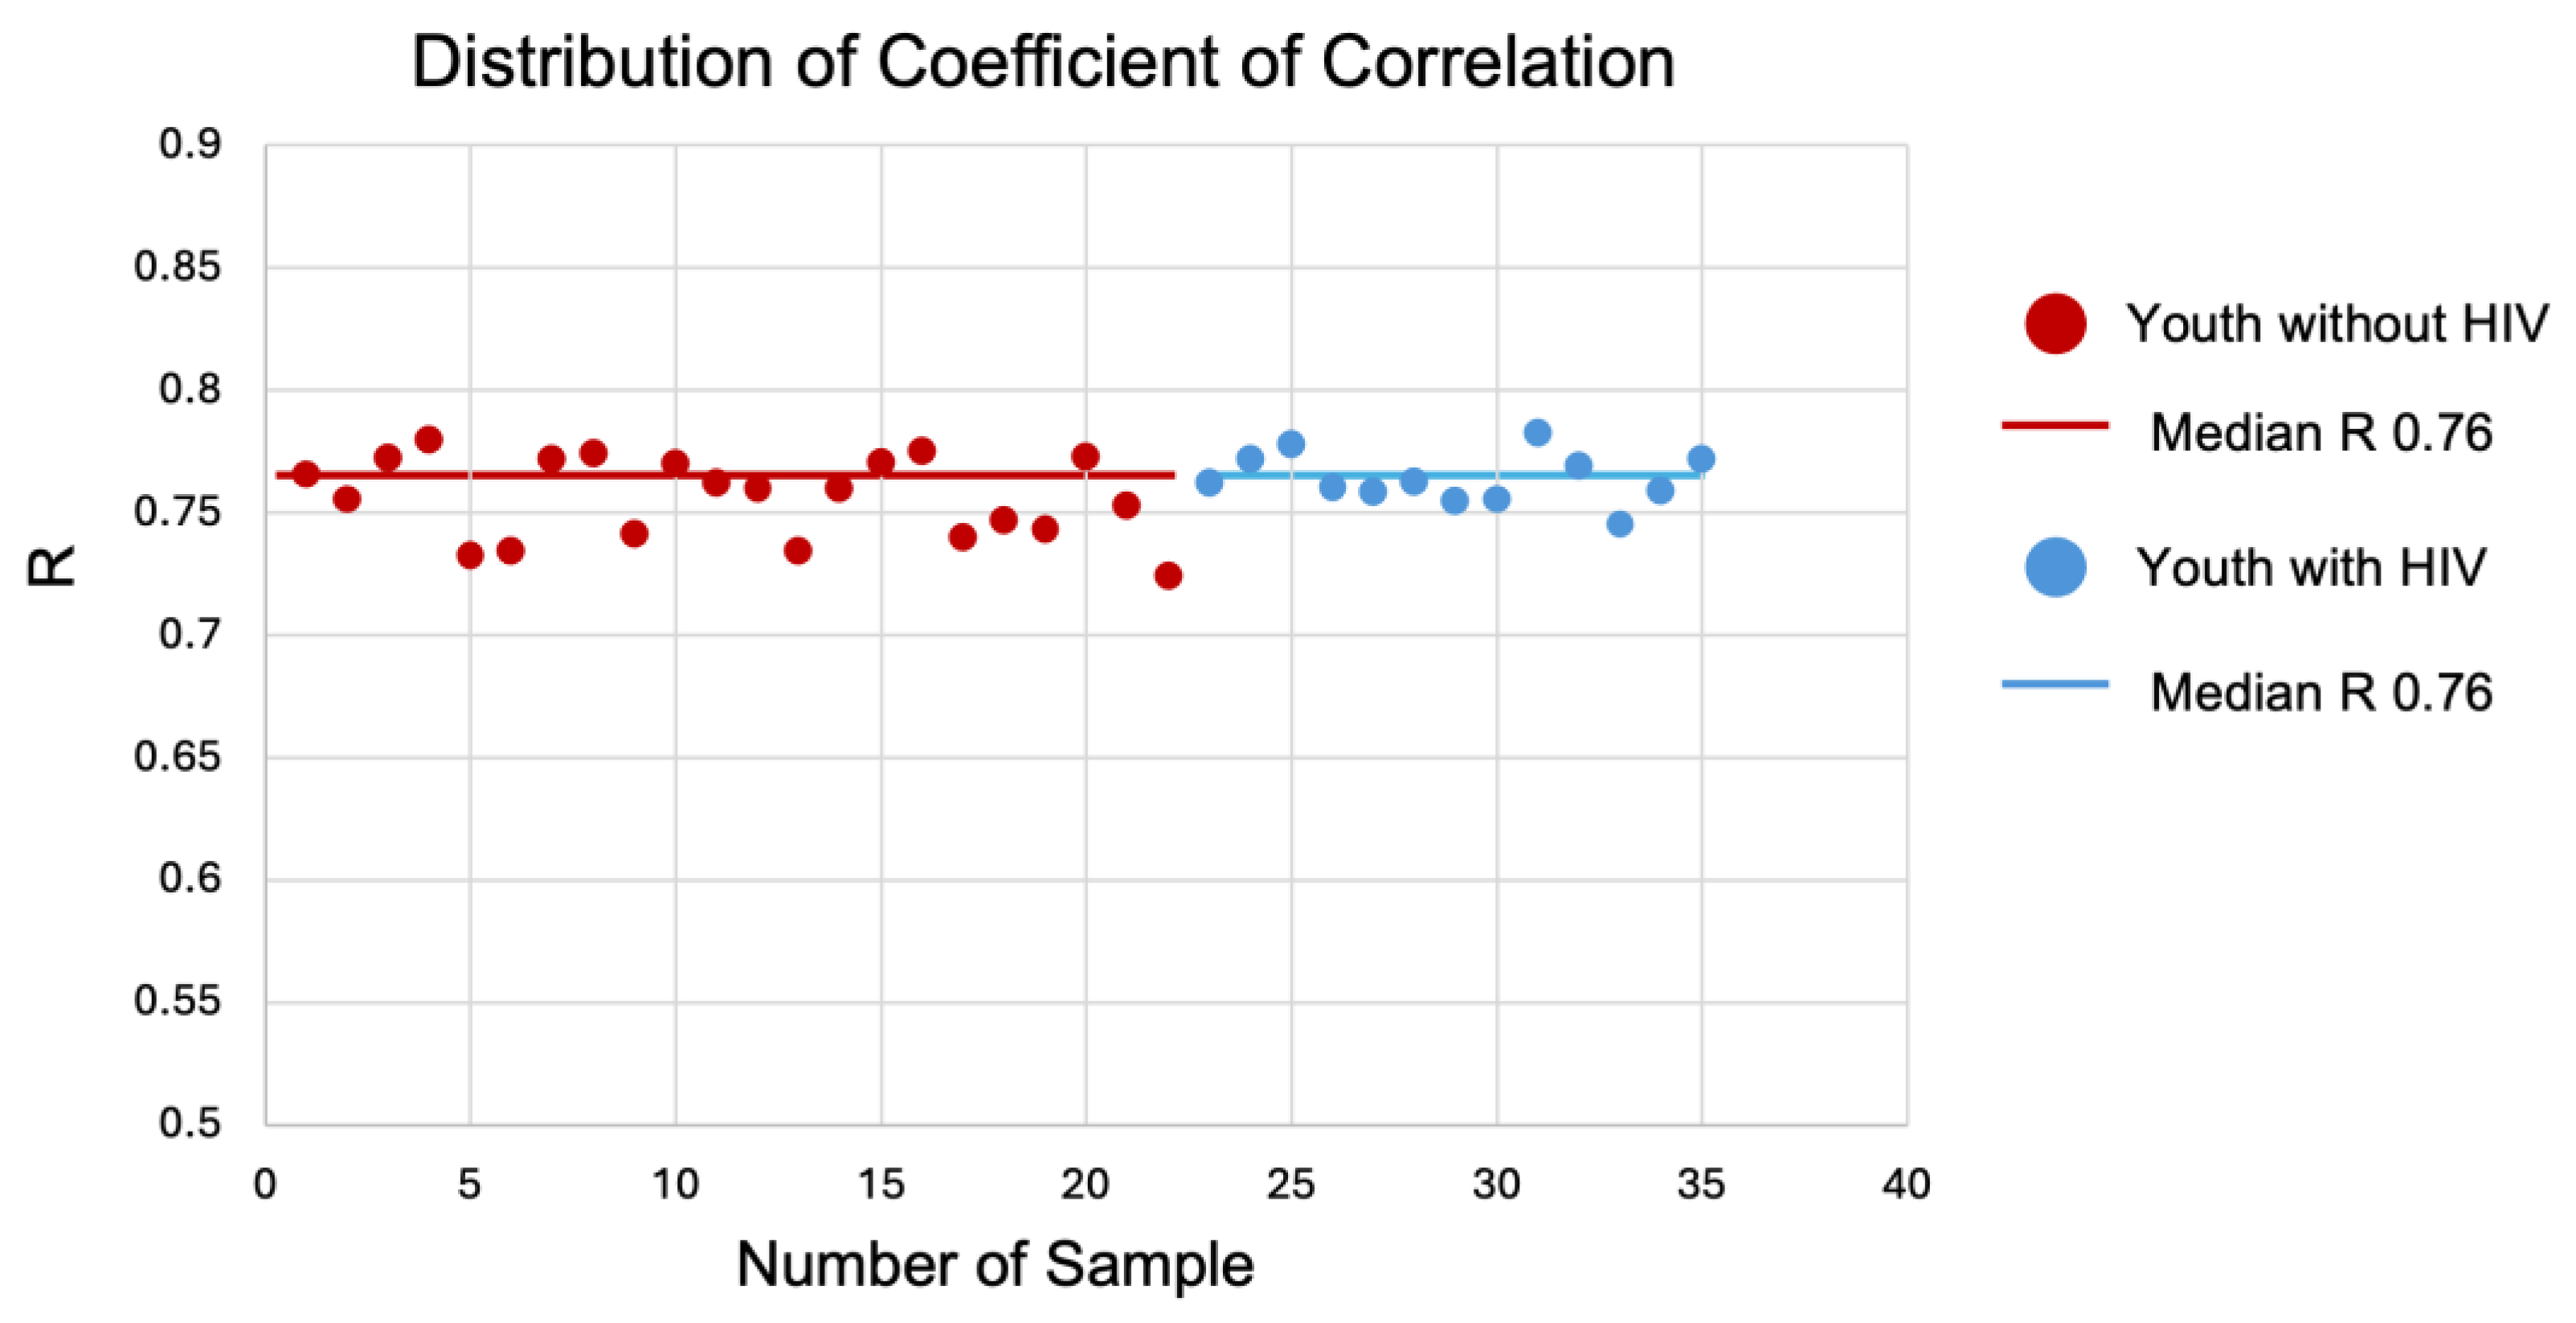
To determine if a linear relationship between the two datasets existed, Pearson correlation coefficient was computed on the gene expression outputs and the distribution of coefficient of correlation (R) was plotted for all samples (Figure 2). The median correlation coefficient (R = 0.76 and p-value < 0.05) signifies the expression datasets sequenced using the two platforms show a strong correlation.

Table 1.
Comparison of expressed genes and DEG numbers between microarray and RNA-seq.
| Microarray1 | RNA-seq2 | ||
|---|---|---|---|
| Expressed Genes | |||
| Unique | 2,180 | 8,656 | |
| Shared | 13,667 | ||
| Total | 15,847 | 22,323 | |
| DEGs (FDR = 0.05) | |||
| Unique | 204 | 2,172 | |
| Shared | 223 | ||
| Total | 427 | 2,395 |
1Microarray data were filtered by removing the genes responsible for the bottom 25% variance. 2RNA-seq data were filtered by removing all genes that had sum zero across all samples.
Figure 2.
Distribution of Coefficient of Correlation (R). Correlation of coefficient for youth with HIV (Blue) and without HIV (Red). The median correlation coefficient (R) is 0.76 for both groups indicating a positive relationship between their variables.
Figure 2.
Distribution of Coefficient of Correlation (R). Correlation of coefficient for youth with HIV (Blue) and without HIV (Red). The median correlation coefficient (R) is 0.76 for both groups indicating a positive relationship between their variables.
3.2. PCA of Microarray and RNA-seq
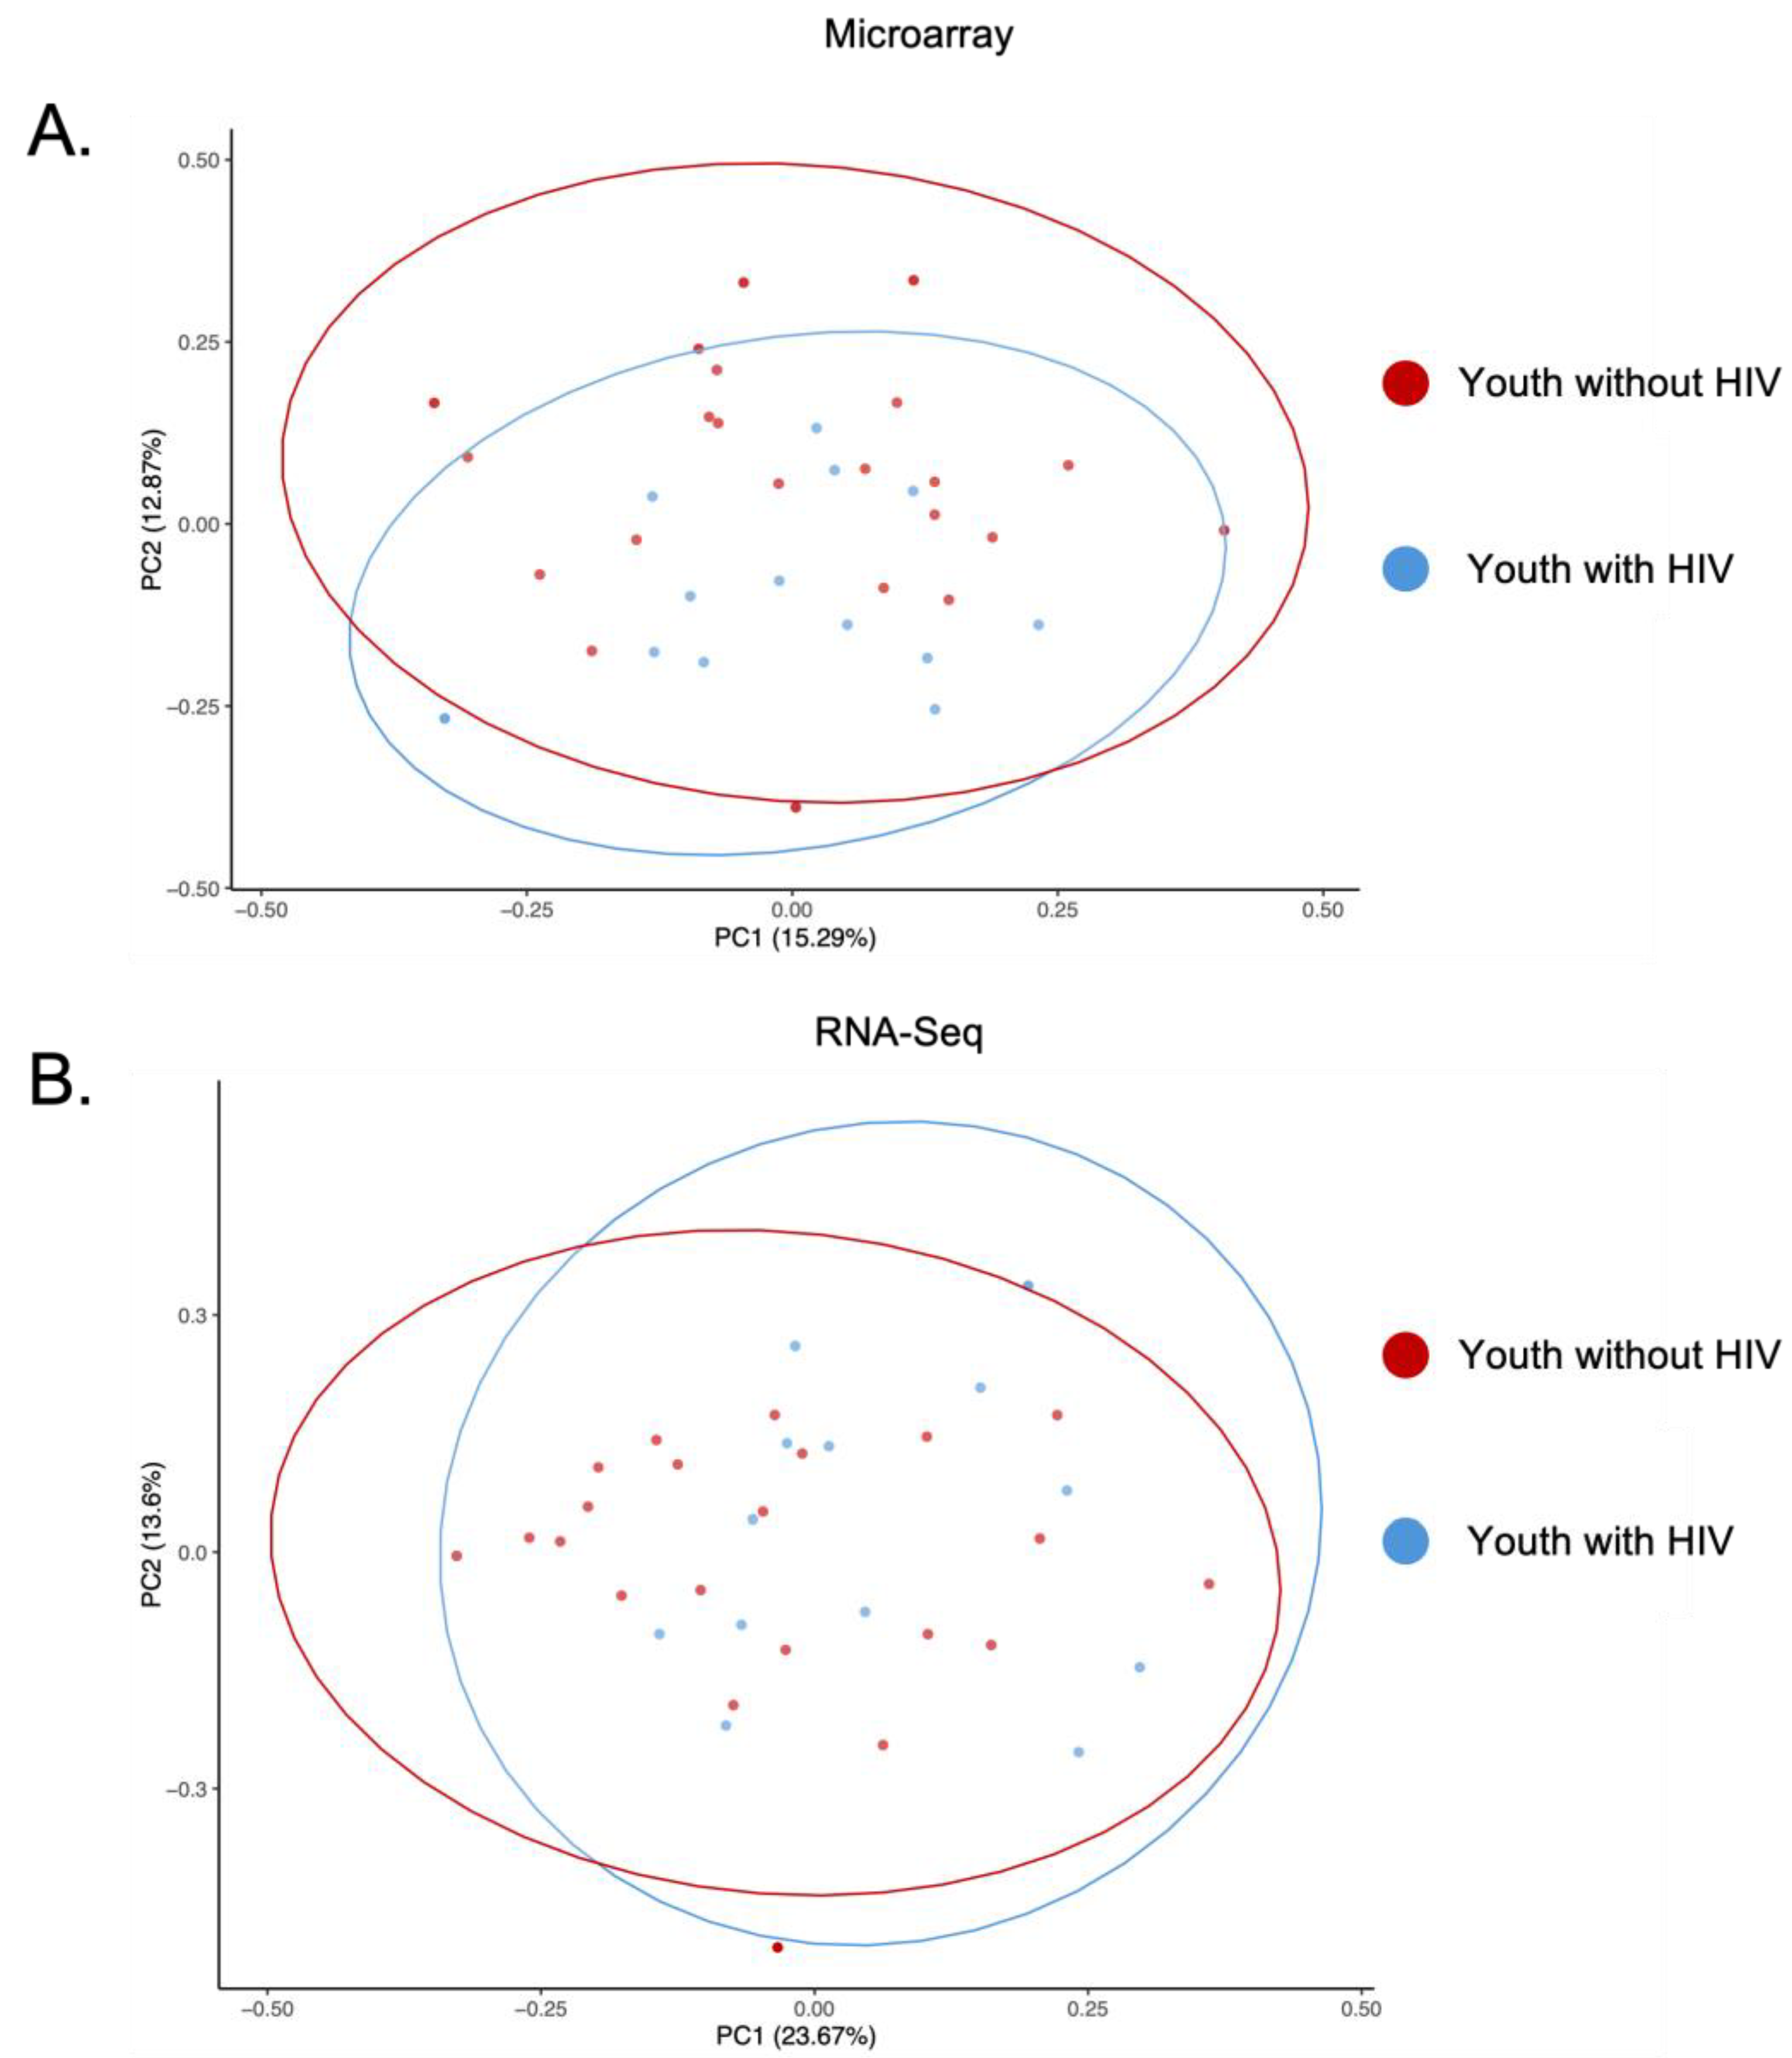
To assess the variance and consistency of the two gene expression platforms, PCAs were generated using log2 and VST transformed normalized expression values of the 223 shared genes (Figure 3A,B). The first two components (PC1 and PC2) accounted for 28.2% variability for PCA of microarray and 37.3% variability for PCA of RNA-seq. The PCA for each platform showed two clusters based on their biological profile. Red cluster includes all but one YWOH (22/23), while the blue cluster includes all YWH (13/13).
Figure 3.
Principal Component Analyses. A. PCA of microarray data from youth with HIV (Blue) and youth without HIV (Red). The first principal component (PC) accounts for 15.3% of the variability, while the second PC explains 12.9% of the variability, together representing 28.2% of the total variability in the data. B. PCA of RNA-seq data from youth with HIV (Blue) and youth without HIV (Red). The first PC accounts for 23.7% of the variability, with the second PC explains 13.6% of the variability, together representing 37.3% of the total variability in the data. Ellipses represent a 95% confidence interval.
3.3. RNA-seq Demonstrates a Greater Dynamic Range of Fold Change
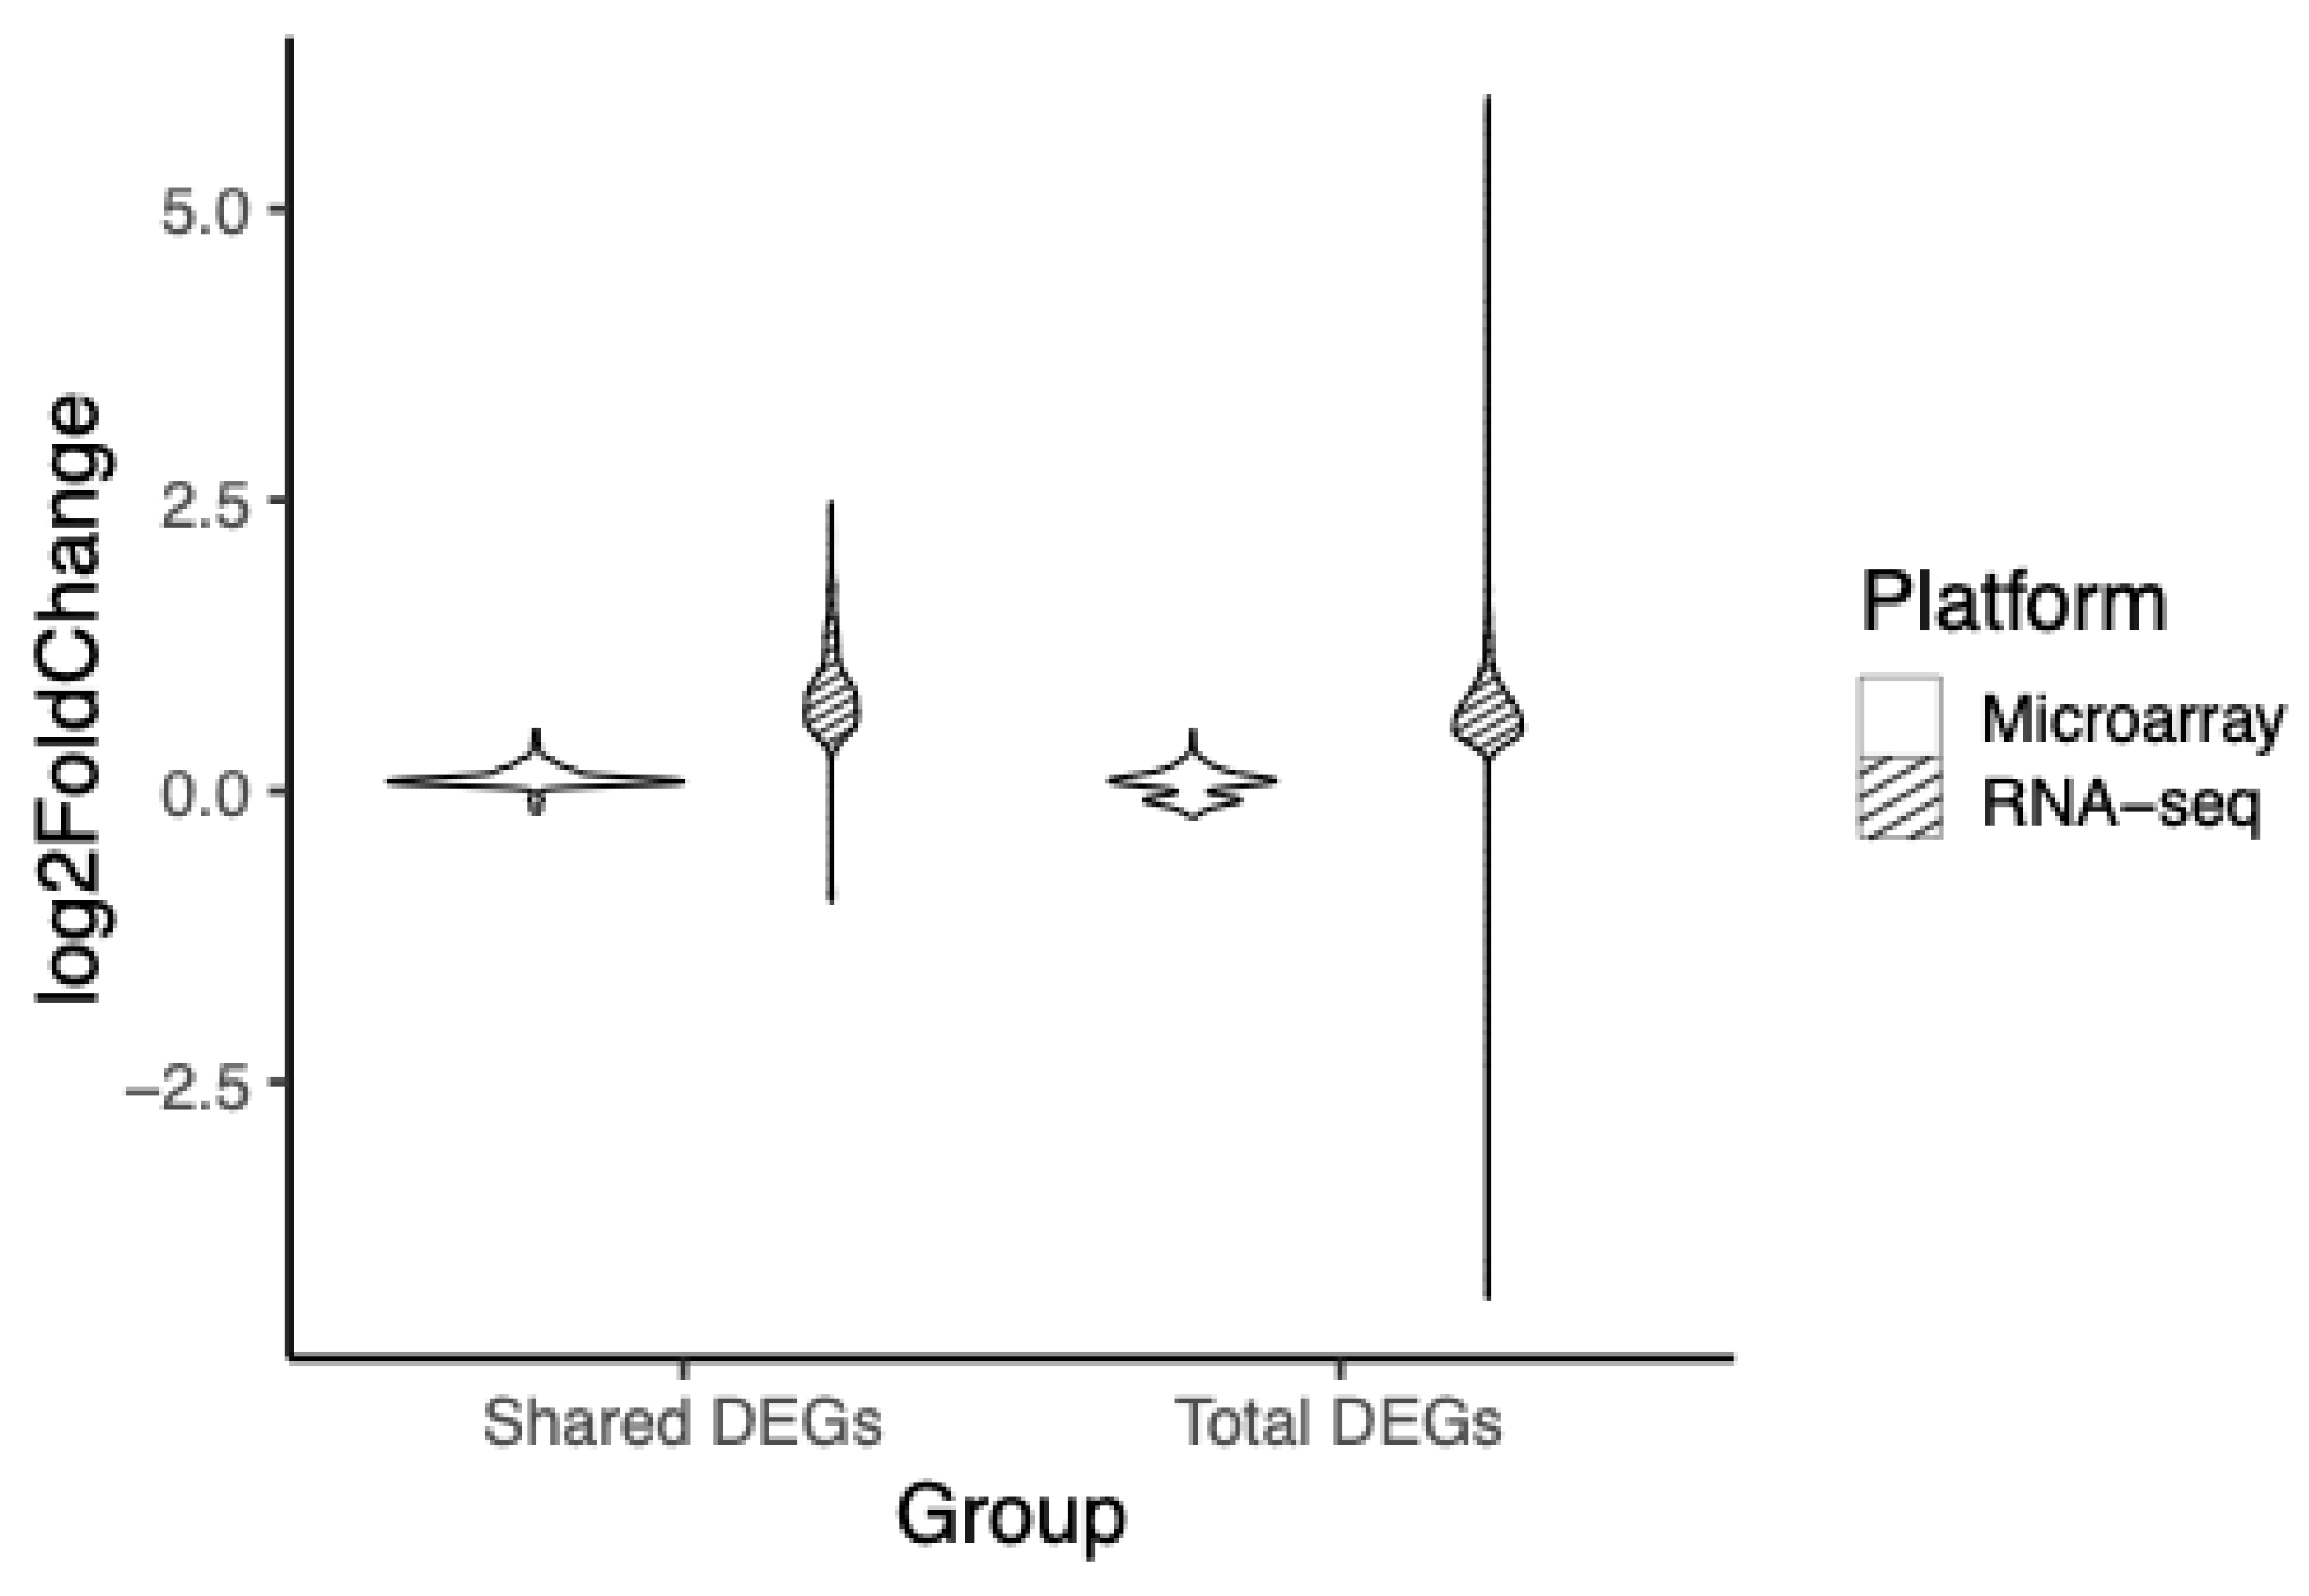
To evaluate the resolution of differential expression, comparisons of fold change dynamics between the two platforms were assessed. DEGs shared between platforms had their log2 fold change assessed and plotted (Figure 4). RNA-seq had a range between -0.9 to 2.5, while the range for DEGs from the microarray platform was between -0.2 and 0.5. The second comparison consisted of the complete set of DEGs unique to the respective platform. RNA-seq’s log2 fold change range was -4.4 to 6.0, while microarray had a more limited range of log2 fold change between -0.2 and 0.5, when compared to RNA-seq.
Figure 4.
Violin plot of the range of fold change of shared and total DEGs. Log2FC values of DEGs common in both microarray and RNA-seq (Shared DEGs) and all DEGs in their respective platform (Total DEGs), microarray (white), RNA-seq (striped). Log2FC is computed by dividing the mean of each variable in youth with HIV by the respective mean of each variable in youth without HIV and calculating the log2 of the output. Microarray had a range of -0.2 to 0.5 Log2FC and RNA-seq had a range of -0.9 to 2.5 Log2FC for shared DEGs. Microarray had a range of -0.2 to 0.5 Log2FC and RNA-seq had a range of -4.4 to 6.0 Log2FC for total DEGs.
3.4. High Concordance of Canonical Pathways
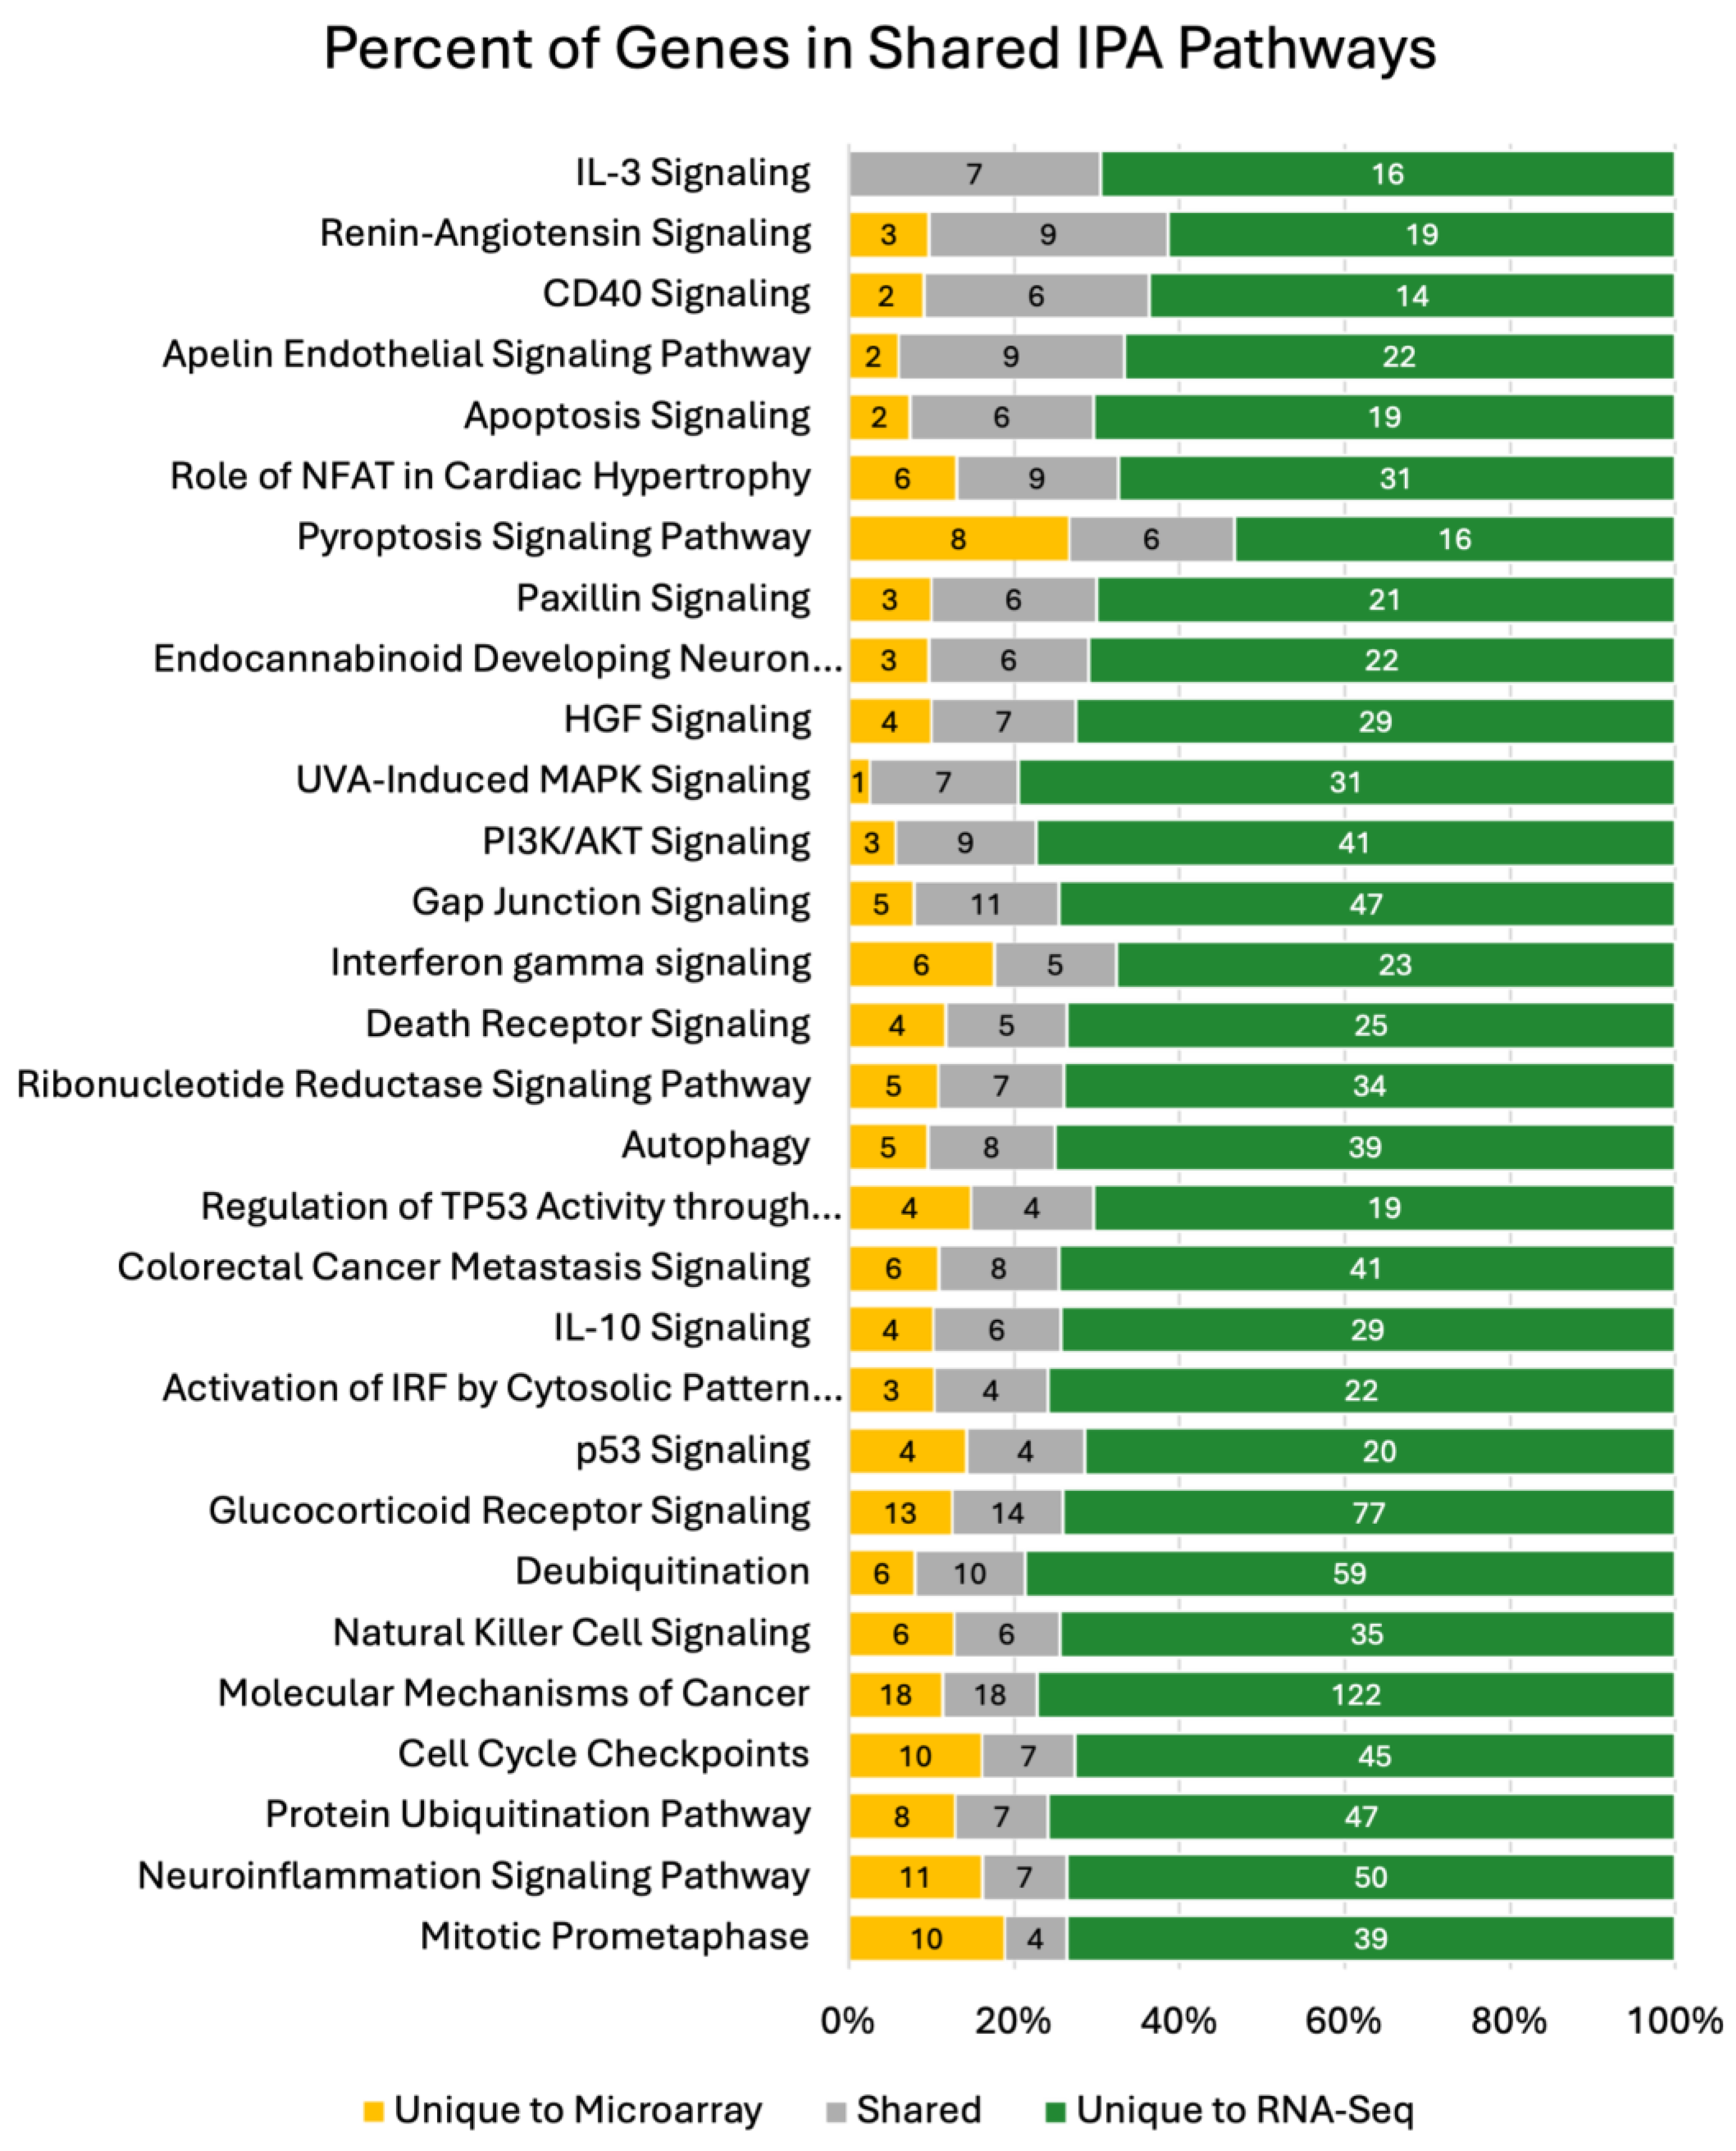
To determine potential biological relevance, canonical pathways were investigated using IPA on filtered expression outputs. RNA-seq analysis identified 205 perturbed pathways, while microarray analysis identified 47 pathways perturbed. Among the perturbed pathways identified by RNA-seq, 30 pathways were also detected by microarray analysis (Figure 5). The 30 shared pathways represent 14.6% of the total RNA-seq pathways and 63.8% of the microarray pathways with significant concordance in the amount of overlap observed (p-value < 0.0001). The median percent of shared DEGs across the significant pathways identified by both platforms was 15%.
Figure 5.
Shared pathways of the IPA Analysis. IPA analysis was used to determine functional outputs of microarray and RNA-seq data. The total number of shared pathways between microarray and RNA-seq are represented (30 pathways). The percentage of genes unique to microarray in each pathway are annotated with yellow. Theres is a large percentage of shared genes in each pathway which are annotated with grey. RNA-seq had the most contributions of unique genes to shared apthways annotated with green. Number of genes contributing to precent values are annotated in each stacked percent bar in the graph.
4. Discussion
In this study, we compared the results obtained from microarray and RNA-seq data, both derived from the same biological samples. The normality and goodness-of-fit analysis revealed that the microarray data had significant deviations from normality, as evidenced by the KS and AD tests. Conversely, the RNA-seq data showed a better fit with the NB distribution than the Poisson and normal distributions, reflecting the frequent issue of overdispersion in RNA-seq data where low expressed genes’ variance exceeds the means. Using the Mann-Whitney U test for analysis ensured consistency in our statistical approach, which provided a more robust framework for comparing the outputs across different data types. The findings indicate that applying similar statistical methods to these data sets provides comparable views of canonical pathways and potential biological significance. Furthermore, the use of consistent sample preparation protocols for both RNA-seq and microarray experiments is crucial to minimize biological variability and enable a more accurate assessment of platform performance. This approach reduces variance in data sets developed from different sources, allowing for meaningful comparisons between well-curated microarray data and RNA-seq data. By using the same non-parametric statistics, we ensure a more consistent comparison between the two technologies, reducing the technical variability associated with different statistical analyses. This facilitates a fair and comprehensive evaluation of the strengths and limitations of each platform and their feasibility.
Few studies have systematically compared RNA-seq and microarray data generated from identical samples by the same statistical approach, highlighting a significant gap in the current research literature. Addressing this gap is essential to provide robust benchmarks and guide best practices in transcriptomic research. Comparative analyses hold promise to advance understanding the factors influencing gene expression measurements and improve the reproducibility and reliability of transcriptomic studies across different experimental settings and biological systems.
The Mann-Whitney U test was applied in this study due to its robustness in handling a range of varying distributions and not assuming a normal distribution [34,35], making it suitable for skewed data often encountered in RNA-seq and microarray analysis. A limitation of the method is the lack of power that parametric tests provide when the data fit their distribution [34]. Despite this limitation, we provide striking results of overlap in the reported canonical pathways.
The key findings from this study are the strong correlation of gene expression profiles determined by the coefficient of correlation, the high concordance across DEGs and canonical pathways, and the relevance and consistency of canonical pathways previously identified between the groups studied. The median correlation coefficient of 0.76 indicates a strong concordance in the gene expression profiles obtained from the two platforms. Furthermore, the comparison of DEGs between the two platforms revealed a high degree of overlap, with Fisher’s exact test confirming significant concordance. Removing the low-variance genes from the microarray dataset increased the power to detect DEGs, supporting the idea that microarray analysis benefits from focused filtering to enhance the sensitivity of differential expression analysis [36,37,38].
Two separate fold-change analyses were performed: one focusing on the shared genes between the two platforms, and another using all DEGS identified for each platform individually. Restricting the analysis to shared genes limits the ability to detect platform specific ranges, especially in RNA-seq, where more low expressed genes were detected. However, performing fold-change analysis using all DEGs may skew results, particularly in cases where one platform detects larger numbers of DEGS. The results of the PCA analyses may have showcased the differences in platform specific variability. The RNA-seq PCA analysis had a larger PC1, possibly highlighting RNA-seq’s broad range in total variability. This may be due to RNA-seq’s much broader dynamic range, which we highlight in the fold change analysis. The difference in PC1’s contribution may also be due to RNA-seq’s greater representation of total biological diversity in gene expression since microarray is optimized for predefined target sequences on the probe set.
Nested from a previous microarray study [19,20] that focused on the inflammatory impact of recreational marijuana and tobacco use, many canonical pathways perturbed in the current sub study, based on their group function or biological role, were enriched. Pathways previously reported and identified in this study include interferon signaling, PI3K signaling, and cell death pathways. The similarity in pathway profiles between the two studies suggests that despite differences in technology, both platforms capture genes from similar pathways and the approach could be applied to other conditions.
RNA-seq is currently the standard for gene expression data curation, leaving to question microarray’s past, present and future viability in the research community. Microarray was the largest contributor to gene expression data for many years filling large depositories with publicly available datasets, some of which are from challenging to produce studies, like those involving neonates, neurological, or tissue with limited availability. Machine learning (ML) algorithms and Artificial Intelligence (AI) tools could be created to integrate RNA-seq and microarray data, learning to recognize platform-specific biases, adjust analysis to increase confidence and improve predictive accuracy of biological outcome. The high concordance of biological relevant functional pathways and DEGs between the two platforms suggests that both technologies could serve as input for predictive models.
5. Conclusions
This study demonstrates that both microarray and RNA-seq technologies provide highly concordant results when analyzing the same biological samples and analyzed with the same nonparametric statistics, Mann-Whitney U test. The decreased biological variance helped to establish the robustness of the statistical analysis when comparing two different gene expression platforms. Both platforms identify similar canonical pathways and DEGs. The two platforms remain complementary tools in gene expression analysis. The results we present emphasize the importance of considering both technologies in future research, particularly in the context of AI and machine learning techniques to improve the integration of transcriptomic data for clinical and translational research. Microarray data remains a valid and relevant tool for gene expression analysis, even in an era of RNA-seq dominance.
Supplementary Materials
The following supporting information can be downloaded at the website of this paper posted on Preprints.org, Figure S1: Density plots; Table S1: Demographic and clinical characteristics of study groups; Table S2: Assessment for goodness of fit for microarray’s normality and fitting of distributions for RNA-seq.
Author Contributions
Conceptualization, I.D.R, S.A.B., L.Y. and M.M.G.; methodology, I.D.R and S.A.B.; software, I.D.R. and S.A.B.; validation, K.C., L.Y., J.S. and U.N.; formal analysis, I.D.R and S.A.B.; investigation, I.D.R. and S.A.B.; resources, M.M.G and J.W.S.; data curation, I.D.R. and K.C.; writing—original draft preparation, I.D.R.; writing—review and editing, S.A.B., K.C., L.Y., U.N., G.M.V., J.S., J.W.S. and M.M.G.; visualization, I.D.R., K.C. and U.N.; supervision, M.M.G. and J.W.S.; project administration, K.C.; funding acquisition, M.M.G. and J.W.S.. All authors have read and agreed to the published version of the manuscript.
Funding
This work was supported by NIH awards R01-DA031017 (MMG), U01-DA044571 (JWS), U01-HD040533 (JWS), U01-HD040474 (JWS), U01-A1068632 (JWS), NIH Pathway Program, NIH Division of Intramural Research, NIAID (MMG), NIH Office of AIDS Research, OD (MMG), and 5P30-AI064518 (JWS, Duke University Center for AIDS Research).
Institutional Review Board Statement
Approval to analyze the biorepository samples from this study was obtained from the Duke University IRB, Consequences of Marijuana Use on Inflammatory Pathways in HIV-Infected Youth, (Pro00100780) approved on 8 March 2019, and the National Institutes of Health IRB (18-NIAID-00677) approved on 10 August 2018.
Informed Consent Statement
All participants provided informed consent for enrollment in Adolescent Medicine Trials Network (ATN) for HIV/AIDS Interventions protocol 071/101 at their individual sites (ClinicalTrials.gov; https://clinicaltrials.gov/, Clinical Identifier No NCT00683579).
Data Availability Statement
We encourage all authors of articles published in MDPI journals to share their research data. In this section, please provide details regarding where data supporting reported results can be found, including links to publicly archived datasets analyzed or generated during the study. Where no new data were created, or where data is unavailable due to privacy or ethical restrictions, a statement is still required. Suggested Data Availability Statements are available in section “MDPI Research Data Policies” at https://www.mdpi.com/ethics.
Acknowledgments
The authors would like to thank the study volunteers for their participation in the study. This work was supported in part by funding from the Adolescent Trials Network for HIV/AIDS Interventions (ATN) from the NIH (U01-HD040533 and U01-HD040474) through the Eunice Kennedy Shriver National Institute of Child Health and Human Development (NICHD), with supplemental funding from the National Institute on Drug Abuse (NIDA) and the National Institute for Mental Health (NIMH). It was also supported by independent grants from the NIDA (R01-DA031017 and U01-DA044571). The study was co-endorsed by the International Maternal Pediatric Adolescent AIDS Clinical Trials Group (IMPAACT), which is supported by the NIAID, the Eunice Kennedy Shriver NICHD, and the NIMH (U01-A1068632). Further support was provided by the Duke University Center for AIDS Research (CFAR) (NIH 5P30-AI064518). The following ATN sites participated in this study: University of South Florida, Tampa (Emmanuel, Lujan-Zilberman, Julian), Children’s Hospital of Los Angeles (Belzer, Flores, Tucker), University of Southern California at Los Angeles (Kovacs, Homans, Lozano), Children’s National Medical Center (D’Angelo, Hagler, Trexler), Children’s Hospital of Philadelphia (Douglas, Tanney, DiBenedetto), John H. Stroger Jr. Hospital of Cook County and the Ruth M. Rothstein CORE Center (Martinez, Bojan, Jackson), University of Puerto Rico (Febo, Ayala-Flores, Fuentes-Gomez), Montefiore Medical Center (Futterman, Enriquez-Bruce, Campos), Mount Sinai Medical Center (Steever, Geiger), University of California-San Francisco (Moscicki, Auerswald, Irish), Tulane University Health Sciences Center (Abdalian, Kozina, Baker), University of Maryland (Peralta, Gorle), University of Miami School of Medicine (Friedman, Maturo, Major-Wilson), Children’s Diagnostic and Treatment Center (Puga, Leonard, Inman), St. Jude’s Children’s Research Hospital (Flynn, Dillard), and Children’s Memorial (Garofalo, Brennan, Flanagan). The following IMPAACT sites participated in the study: Children’s Hospital of Michigan—Wayne State (Moore, Rongkavilit, Hancock), Duke University Medical Center Pediatric CRS (Cunningham, Wilson), Johns Hopkins University (Ellen, Chang, Noletto), New Jersey Medical School CTU/CRS (Dieudonne, Bettica, Monti), St. Jude/Memphis CTU/CRS (Flynn, Dillard, McKinley), University of Colorado School of Medicine/The Children’s Hospital (Reirden, Kahn, Witte) University of Southern California Medical Center (Homans, Lozano), Howard University Hospital (Rana, Deressa). Four of the ATN and IMPAACT sites utilized their General Clinical Research Center (GCRC)/Pediatric Clinical Research Center (PCRC) for the study. The centers were supported by grants from the General Clinical Research Center Program of the National Center for Research Resources (NCRR), NIH, Department of Health and Human Services as follows: Children’s National Medical Center, M01RR020359; Howard University Hospital, MO1-RR010284; University of California at San Francisco, UL1 RR024131; and University of Colorado School of Medicine/Children’s Hospital, UL1 RR025780. The University of Pennsylvania/Children’s Hospital of Philadelphia utilized its Institutional Clinical and Translational Science Award Research Center (CTRC), supported by grant UL1 RR024134 from NCRR. The Tulane University Health Sciences Center utilized its CTRC for the study, which was supported in whole or in part by funds provided through the Louisiana Board of Regents RC/EEP (RC/EEP-06). This research was also supported by Stephany W. Holloway University Endowed Chair for AIDS Research at the University of Florida and Intramural Research Program of the NIAID.
Conflicts of Interest
The authors declare no conflicts of interest.
Abbreviations
The following abbreviations are used in this manuscript:
| RNA | Ribonucleic acid |
| HIV | Human immunodeficiency virus |
| AIDS | Acquired immunodeficiency syndrome |
| DEG | Differentially expressed gene(s) |
| GEO | Gene expression omnibus |
| PCR | Polymerase chain reaction |
| DNA | Deoxyribonucleic acid |
| NGS | Next generation sequencing |
| PBC | Peripheral blood cells |
| ATN | Adolescent Medicine Trial Network |
| YWOH | Youth without HIV |
| YWH | Youth with HIV |
| ART | Antiretroviral therapy |
| RMA | Robust multi-array averaging |
| IQR | Interquartile range |
| PCA | Principal component analysis |
| TPM | Transcripts per million |
| VST | Variance stabilizing transformation |
| NB | Negative binomial |
| IPA | Ingenuity Pathway Analysis |
| KS | Kolmogorov-Smirnov |
| AD | Anderson-Darling |
| ML | Machine learning |
| AI | Artificial intelligence |
References
- Baechler, E.C. , et al., Gene expression profiling in human autoimmunity. Immunological reviews 2006, 210, 120–137. [Google Scholar] [CrossRef]
- Cooper-Knock, J. , et al., Gene expression profiling in human neurodegenerative disease. Nature Reviews Neurology 2012, 8, 518–530. [Google Scholar] [CrossRef] [PubMed]
- Sotiriou, C. and M.J. Piccart, Taking gene-expression profiling to the clinic: when will molecular signatures become relevant to patient care? Nature reviews cancer 2007, 7, 545–553. [Google Scholar] [CrossRef] [PubMed]
- Marín de Evsikova, C. , et al., The transcriptomic toolbox: resources for interpreting large gene expression data within a precision medicine context for metabolic disease atherosclerosis. Journal of Personalized Medicine 2019, 9, 21. [Google Scholar] [CrossRef] [PubMed]
- Clough, E. , et al., NCBI GEO: archive for gene expression and epigenomics data sets: 23-year update. Nucleic Acids Research 2023, 52, D138–D144. [Google Scholar] [CrossRef]
- Rao, M.S. , et al., Comparison of RNA-Seq and microarray gene expression platforms for the toxicogenomic evaluation of liver from short-term rat toxicity studies. Frontiers in genetics 2019, 9, 636. [Google Scholar] [CrossRef]
- van der Kloet, F.M. , et al., Increased comparability between RNA-Seq and microarray data by utilization of gene sets. PLoS computational biology 2020, 16, e1008295. [Google Scholar] [CrossRef]
- Wang, C. , et al., The concordance between RNA-seq and microarray data depends on chemical treatment and transcript abundance. Nature biotechnology 2014, 32, 926–932. [Google Scholar] [CrossRef]
- Zhao, S. , et al., Comparison of RNA-Seq and microarray in transcriptome profiling of activated T cells. PloS one 2014, 9, e78644. [Google Scholar]
- Zwemer, L.M. , et al., RNA-Seq and expression microarray highlight different aspects of the fetal amniotic fluid transcriptome. Prenatal diagnosis 2014, 34, 1006–1014. [Google Scholar] [CrossRef]
- Xu, X. , et al., Parallel comparison of Illumina RNA-Seq and Affymetrix microarray platforms on transcriptomic profiles generated from 5-aza-deoxy-cytidine treated HT-29 colon cancer cells and simulated datasets. BMC bioinformatics 2013, 14, 1–14. [Google Scholar] [CrossRef] [PubMed]
- Zhang, W. , et al., Comparison of RNA-seq and microarray-based models for clinical endpoint prediction. Genome Biology 2015, 16, 133. [Google Scholar] [CrossRef] [PubMed]
- Williams, J.C. , et al., Soluble CD14, CD163, and CD27 biomarkers distinguish ART-suppressed youth living with HIV from healthy controls. J Leukoc Biol 2018, 103, 671–680. [Google Scholar] [CrossRef]
- Nichols, S.L. , et al., Antiretroviral treatment initiation does not differentially alter neurocognitive functioning over time in youth with behaviorally acquired HIV. J Neurovirol 2016, 22, 218–30. [Google Scholar] [CrossRef] [PubMed]
- Kim-Chang, J.J. , et al., Higher soluble CD14 levels are associated with lower visuospatial memory performance in youth with HIV. Aids 2019, 33, 2363–2374. [Google Scholar] [CrossRef]
- Rudy, B.J. , et al. , Immune Reconstitution but Persistent Activation After 48 Weeks of Antiretroviral Therapy in Youth With Pre-Therapy CD4 >350 in ATN 061. J Acquir Immune Defic Syndr 2015, 69, 52–60. [Google Scholar]
- Nichols, S.L. , et al., Neurocognitive functioning in antiretroviral therapy-naïve youth with behaviorally acquired human immunodeficiency virus. J Adolesc Health 2013, 53, 763–71. [Google Scholar] [CrossRef]
- Nichols, S.L. , et al., Concordance between self-reported substance use and toxicology among HIV-infected and uninfected at risk youth. Drug Alcohol Depend 2014, 134, 376–382. [Google Scholar] [CrossRef]
- Yin, L. , et al., Anti-inflammatory effects of recreational marijuana in virally suppressed youth with HIV-1 are reversed by use of tobacco products in combination with marijuana. Retrovirology 2022, 19, 10. [Google Scholar]
- Borkar, S.A. , et al., Youth Who Control HIV on Antiretroviral Therapy Display Unique Plasma Biomarkers and Cellular Transcriptome Profiles Including DNA Repair and RNA Processing. Cells 2025, 14. [Google Scholar]
- Gautier, L. , et al. , affy—analysis of Affymetrix GeneChip data at the probe level. Bioinformatics 2004, 20, 307–315. [Google Scholar] [PubMed]
- FASTQC, FastQC. 2015.
- Bolger, A.M., M. Lohse, and B. Usadel, Trimmomatic: a flexible trimmer for Illumina sequence data. Bioinformatics 2014, 30, 2114–20. [Google Scholar] [CrossRef]
- Kent, W.J. , et al., The human genome browser at UCSC. Genome Res 2002, 12, 996–1006. [Google Scholar] [CrossRef]
- Manimaran, S. , et al., BatchQC: interactive software for evaluating sample and batch effects in genomic data. Bioinformatics 2016, 32, 3836–3838. [Google Scholar] [CrossRef] [PubMed]
- Ripley, B. , et al. , Package ‘mass’. Cran r 2013, 538, 822. [Google Scholar]
- Wickham, H. , ggplot2. Wiley interdisciplinary reviews: computational statistics 2011, 3, 180–185. [Google Scholar] [CrossRef]
- Love, M.I., W. Huber, and S. Anders, Moderated estimation of fold change and dispersion for RNA-seq data with DESeq2. Genome Biol 2014, 15, 550. [Google Scholar] [CrossRef]
- R, I.R.a.G. , R: A Language for Data Analysis and Graphics. Journal of Computational and Graphical Statistics 1996, 3, 299–314. [Google Scholar]
- team, D.c. , R: A language and enviroment for statistical computing. R foundation for statistical computing., 2004.
- Yuan, Y., M. Horikoshi, and W. Li, ggfortify: unified interface to visualize statistical results of popular R packages. 2016.
- Maechler, M. , et al., Package ‘cluster’. Dosegljivo na, 2013. 980.
- Krämer, A. , et al. , Causal analysis approaches in Ingenuity Pathway Analysis. Bioinformatics 2013, 30, 523–530. [Google Scholar]
- Gao, X. and P.X. Song, Nonparametric tests for differential gene expression and interaction effects in multi-factorial microarray experiments. BMC bioinformatics 2005, 6, 1–13. [Google Scholar] [CrossRef]
- Saroj, R.K., K. N. Murthy, and M. Kumar, Nonparametric statistical test approaches in genetics data. International Journal for Computational Biology (IJCB) 2016, 5, 77–87. [Google Scholar]
- Hackstadt, A.J. and A. M. Hess, Filtering for increased power for microarray data analysis. BMC bioinformatics 2009, 10, 1–12. [Google Scholar]
- Lu, J. , et al., Principal component analysis-based filtering improves detection for Affymetrix gene expression arrays. Nucleic acids research 2011, 39, e86–e86. [Google Scholar] [CrossRef] [PubMed]
- Marczyk, M. , et al., Adaptive filtering of microarray gene expression data based on Gaussian mixture decomposition. BMC bioinformatics 2013, 14, 1–12. [Google Scholar] [CrossRef]
Disclaimer/Publisher’s Note: The statements, opinions and data contained in all publications are solely those of the individual author(s) and contributor(s) and not of MDPI and/or the editor(s). MDPI and/or the editor(s) disclaim responsibility for any injury to people or property resulting from any ideas, methods, instructions or products referred to in the content. |
© 2025 by the authors. Licensee MDPI, Basel, Switzerland. This article is an open access article distributed under the terms and conditions of the Creative Commons Attribution (CC BY) license (https://creativecommons.org/licenses/by/4.0/).
Copyright: This open access article is published under a Creative Commons CC BY 4.0 license, which permit the free download, distribution, and reuse, provided that the author and preprint are cited in any reuse.


