
Submitted:
28 April 2025
Posted:
30 April 2025
You are already at the latest version
Abstract
Land-based bioenergy systems are increasingly promoted for their potential to support climate mitigation and energy security. Building up on previous productivity and efficiency analyses [1], this study applies the MiscanFor and SalixFor models to evaluate land use energy intensity (LUEI) for Miscanthus (Miscanthus × giganteus) and willow (Salix spp.) feedstock fuel under baseline (1961-1990) and future climate scenarios (B1 and A1FI, up to 2060). In addition, the study assesses the impact of biomass transport on energy use efficiency (EUE) and quantifies soil organic carbon (SOC) sequestration of Miscanthus. Under current conditions, Miscanthus exhibits a higher global mean LUEI (321 ± 179 GJ/ha) compared to willow (164 ± 115.6 GJ/ha), with energy yield hotspots located in tropical and subtropical regions such as South America, Sub-Saharan Africa, and Southeast Asia due to climate suitability. In contrast, colder regions in Europe and Canada show limited energy potential. By 2060, LUEI is projected to decline by 9–15% for Miscanthus and 8–13% for willow, with moderate warming (B1) improving energy return in temperate zones and extreme warming (A1FI) reducing energy in the tropics. Overall, Miscanthus delivers higher energy returns, while willow offers broader temperature adaptability provided sufficient water is available.
At baseline, global EUE for Miscanthus declines from 15.73 ± 7.1 to 12.37 ± 5.2 as transport distance increases from 50 km to 500 km, a 21% reduction, with similar trends observed under future climate scenarios. Mean global annual SOC sequestration is estimated at 1.20 ± 1.46 t C/ha, with tropical hotspots reaching up to 4.57 t C/ha. In contrast, some cooler temperate and boreal regions show net SOC losses down to –7.93 t C/ha. Projected gains decline to 0.62 ± 1.11 t C/ha (B1) and 0.49 ± 1.13 t C/ha (A1FI), reflecting strong climate sensitivity and regional variability. These findings underscore the critical need for region-specific biomass supply chains that strategically balance logistical and economic trade-offs with environmental sustainability, ensuring resilient, climate-smart bioenergy systems that maximize carbon gains and net energy returns.
Keywords:
Bioenergy crops
; Miscanthus
; willow
; Energy use efficiency
; Land use energy intensity
; Soil organic carbon
; Climate change mitigation
1. Introduction
Miscanthus (Miscanthus × giganteus) and willow (Salix spp.) are among the leading candidates for sustainable bioenergy production. This is due to their high biomass yields and adaptability to diverse environmental conditions. Building on the productivity and efficiency analysis previously presented in Part 1 [1], Part 2 of this study extends the evaluation to land use energy intensity (LUEI), the impacts of biomass transport on energy use efficiency (EUE), and soil carbon sequestration. For the purposes of this study, we consider the values relating to the biomass feedstock used as a fuel at the farm gate or after transportation at the fuel use location gate, we do not consider thermal conversion efficiencies of the end use. While both crops are assessed for LUEI, analyses of biomass transport and carbon sequestration are conducted exclusively for Miscanthus, as comparable data for willow were unavailable.
Miscanthus is widely recognized for its high biomass yield and substantial carbon sequestration potential, making it a promising option for sustainable bioenergy production and long-term carbon storage in agricultural systems [2,3]. Its perennial growth cycle and extensive root system are valuable in promoting the accumulation of soil organic carbon (SOC), contributing to improved soil health and climate mitigation [4,5]. However, evaluating the true sustainability of Miscanthus-based bioenergy systems requires more than just agronomic assessments. Energy use and emissions associated with biomass transport can significantly influence overall EUE and carbon balance, potentially offsetting some of bioenergy benefits [6]. To address this, the current study incorporates biomass transport considerations into the sustainability assessment of Miscanthus, offering a more comprehensive evaluation that accounts for logistical constraints alongside agronomic potential. Through analysis of transportation-related energy consumption and greenhouse gas (GHG) emissions, the study aims to identify strategies that reduce fossil fuel dependence, improve EUE, and minimize climate impacts [1,7]. This integrated approach provides critical insights for optimizing biomass supply chains, informing decisions about processing site locations, and guiding policy development to support low-carbon bioenergy systems. Although willow is not included in the carbon sequestration and transport analysis presented in this study, it remains an important species in bioenergy research. Its deep-rooted system contributes to soil stability and nutrient cycling, offering valuable ecosystem services beyond the scope of this study [8]. However, other woody biomass species may be more suitable for use in tropical and subtropical climate zone but are not considered here.
To conduct this analysis, we applied the MiscanFor and SalixFor models, which simulate biomass yields and energy requirements by integrating climatic conditions, soil properties, and management practices [6]. These process-based models are instrumental in evaluating the energy performance of bioenergy crops, particularly under projected climate change scenarios which may significantly influence both productivity and resource demands. Estimation of SOC turnover involves quantifying the incorporation of organic carbon from above- and below-ground biomass into the soil matrix. This is a key process in determining the crop’s long-term contribution to SOC accumulation, an essential factor for improving soil health, fertility, and carbon sequestration potential. Reliable assessment of these carbon inputs is vital for understanding the broader role of Miscanthus systems in GHG mitigation and sustainable land use strategies [9].
By integrating energy yield analysis, transport impacts, and SOC dynamics, this study provides a comprehensive evaluation of Miscanthus and willow as sustainable bioenergy crops. It contributes to the ongoing discussion on their viability within the context of climate change mitigation and the global energy transition. Ultimately, the findings from this study underline the necessity of holistic approaches to bioenergy system design, approaches that account for productivity, environmental performance, and logistical considerations to maximize climate benefits [4,5,6,10].
2. Materials and Methods
2.1. Soil Data
The soil characteristics used in this study were derived from the dataset documented by [1,6]. These data, sourced from the International Geosphere-Biosphere Program - Data and Information System (IGBP-DIS), encompass critical parameters such as wilting point, field capacity, bulk density, soil organic carbon (to a depth of 1 m), thermal capacity, and total nitrogen. The dataset, available at a 5′ x 5′ global grid resolution, was accessed through the Oak Ridge National Laboratory Distributed Active Archive Center (ORNL DAAC). These inputs formed the basis for driving the MiscanFor and SalixFor models to simulate biomass productivity.
2.2. Crop Data
Land cover data for this analysis were sourced from the CORINE Land Cover 2000 (CLC 2000) dataset [11] as previously detailed in [1,6]. The dataset uses 44 distinct land use classes, though only four were considered appropriate for cultivating Miscanthus. This exclusion reflects the incompatibility of Miscanthus due to its height (3-5 m) with intercropping systems in orchards or planting on woodlands, peatlands or other protected areas. The methodology for selecting suitable categories for Miscanthus cultivation is discussed further in [1,6].
2.3. Climate Data
The climate data used in this study included monthly values for temperature, precipitation, vapor pressure, cloud cover, and temperature range. These data were obtained from global gridded datasets produced by the Climate Research Unit (CRU) at the University of East Anglia, as described by [1,6,12]. Future climate projections (2010-2100) were generated using the HadCM3 global climate model, driven by the IPCC’s Special Report on Emissions Scenarios (SRES). Scenarios A1FI and B1 were selected to evaluate the potential impacts of a fossil-fuel-intensive future versus a sustainability-focused pathway. The baseline period (1961-1990) served as a reference for comparing these projections.
2.4. MiscanFor and SalixFor Models
The MiscanFor and SalixFor models are dynamic, process-based simulation tools designed to estimate the growth and biomass yield of Miscanthus and short-rotation coppice willow (referred to as willow in this study). These models, as outlined by [1,6,7,8,13], incorporate environmental, agronomic, and management data to predict crop performance under different scenarios. MiscanFor has been successfully applied from local to global scales and has been promoted for its versatility in predicting crop responses to changes in soil conditions, climate variability, and management practices [1]. SalixFor, developed based on MiscanFor principles, is tailored for modelling willow crops and explores similar biophysical and management interactions. Both models enable evaluations of long-term crop productivity, carbon dynamics, and water-use efficiency, thus supporting the development of strategies for sustainable bioenergy production.
2.5. Annual Land Use Energy Intensity (LUEI)
Annual land use energy intensity (LUEI) represents the net energy yield of the biomass fuel produced by a bioenergy crop system per unit land area, expressed in GJ/ha. It is calculated as the difference between the gross energy content of the harvested biomass and the total energy inputs required for cultivation, harvest, processing, and transport. Positive LUEI values indicate a net energy gain, reflecting favourable conditions for energy crop production, while negative values imply that the system consumes more energy than it generates, signalling unsuitability for bioenergy deployment in those locations. This metric enables spatially explicit assessments of land suitability and energy performance under current and future scenarios [9,14].
2.6. Impacts of Biomass Transport on Energy Use Efficiency (EUE)
The transportation of biomass plays a critical role in determining the overall energy and use efficiency of bioenergy systems. It was possible for transportation impacts of Miscanthus biomass to be assessed, as reliable data and estimation values are available from previous research by [5], however, equivalent comprehensive data for willow are currently unavailable but a similar methodology could be applied knowing the bulk density of chipped and pelleted willow. Biomass transportation from the Miscanthus cultivation sites to processing facilities or end-use markets introduces environmental, economic, and logistical challenges. To quantify the impacts of transportation on energy use efficiency, two primary transport scenarios were considered:
1. Local utilization: Biomass is transported within a 50 km radius of the cultivation site, representing a decentralized bioenergy model with minimal transportation emissions.
2. Long distance utilization: Biomass is transported over 500 km, simulating scenarios where centralized bioenergy facilities or export markets require long-haul transportation.
In both scenarios, Miscanthus was assumed to be propagated through rhizomes and converted to biomass pellets following harvesting, a common practice to enhance storage efficiency and combustion performance. As illustrated in Table 1, the on-farm energy and carbon costs of production used in the MiscanFor model to represent transport distances, include carbon sequestration per hectare, carbon emissions per tonne of biomass transported, crop moisture content, and annual energy yield, were derived from the values reported by [5].
2.7. Estimated SOC Turnover for Miscanthus
In this study, global estimation of SOC accumulation under Miscanthus cultivation is supported by well-established data on belowground biomass contributions and carbon inputs. Specifically, the average annual belowground live biomass carbon (C) for Miscanthus is approximately 2.7 times the harvest yield [15,16], providing a robust basis for calculating long-term SOC changes. Additionally, soil carbon inputs from litter (including leaf fall and stubble), dead rhizomes, and root turnover contribute an estimated 0.73 times the harvest yield (Shepherd et al., unpublished). These well-constrained relationships allow for a more precise estimation of SOC dynamics under Miscanthus cultivation.
The initial SOC stock dataset (prior to Miscanthus establishment) was spatially aligned with Miscanthus dry matter (DM) yield outputs from the MiscanFor model under each climate scenario. This was achieved using the latitude and longitude of each grid cell. Grids were matched to their exact coordinates or, if unavailable, to the nearest neighbouring cell within a 1-meter threshold. In cases where initial SOC values were missing, a default value of zero was assigned, as summarised in Table 2.
The annual change and rate of SOC accumulation were calculated using the cumulative SOC values at 30 years (baseline) and 70 years (future scenarios), based on formulas 1-4 below derived from the Cohort Model [17,18,19] and parameterized for Miscanthus in [20] and implemented in MiscanFor [21].
SOC30 =(SOC_initial * (1-0.310745))/10 + DM yield/y * 3.588562
SOC70 =(SOC_initial * (1-0.470492))/10 + DM yield/y * 5.568245
SOC annual change (t/ha) = (SOC30 (or 70) – SOC_initial)/30 (or 70)
SOC annual rate (t/ha) = SOC30 (or 70)/30 (or 70)
Where SOC30 and SOC70 are the cumulative amounts of SOC (t/ha) after 30 and 70 years. SOC_initial is the initial SOC stock (t/ha) before planting Miscanthus. The values (1-0.3107451) and (1-0.470492), represent the fractional losses of the initial SOC over 30 and 70 years, respectively, due to decomposition and other natural processes. DM yield/year is the annual dry matter of biomass yield from Miscanthus cultivation. The values 3.588562 and 5.568245 are conversion factors which represent the cumulative impact of annual biomass inputs on SOC accumulation over 30 and 70 years, [17,18,19].
3. Results
3.1. Land Use Energy Intensity (LUEI) for Miscanthus and Willow
3.1.1. Land Use Energy Intensity (LUEI) for Miscanthus and Willow Under Current Climate Conditions
Figure 1a and Table 3 present the baseline annual LUEI for Miscanthus, expressed in GJ/ha. Values range from -8.68 to 753 GJ/ha, with a global mean of 321±179 GJ/ha. The highest LUEI values are predominantly concentrated in tropical and subtropical regions. Notably, South America, particularly Brazil and surrounding areas, emerges as a major hotspot for net energy gains. Similarly, central and eastern Sub-Saharan Africa, along with large parts of South and Southeast Asia (including India, Thailand, and Indonesia), demonstrate strong bioenergy potential. In Australia, elevated LUEI values are observed along the northern and eastern coastal zones, reflecting warm climates and favourable growing conditions. Moderate LUEI values are found in the southern United States and Eastern Europe, indicating reasonable productivity potential. In contrast, regions such as Scandinavia, the Baltics, northern Russia, and parts of Canada, and northern parts of Asia (including Russia) exhibit low to very low, and in some cases negative, LUEI values. These patterns reflect biophysical constraints, notably colder temperatures and shorter growing seasons, which limit biomass productivity and reduce net energy yields.
Figure 1b and Table 3 illustrate the baseline LUEI distribution for willow, revealing both parallels and distinctions compared to Miscanthus. Willow's LUEI ranges from -7.98 to 488 GJ/ha, with a mean of 164±115.6 GJ/ha. Similarly to Miscanthus, high LUEI values are evident across South America, Sub-Saharan Africa, and Southeast Asia, particularly in India, Malaysia, Indonesia, and parts of the Philippines. Coastal zones in northern and eastern Australia also show strong potential. Unlike Miscanthus, willow exhibits a broader distribution of medium LUEI values, particularly across the central and eastern United States and much of Central Europe. This suggests that willow may show better versatility to a wider range of suboptimal or variable environmental conditions, potentially making it more resilient under future climate uncertainties. Despite these regional strengths, both crops show persistently low LUEI values in high-latitude regions such as Scandinavia, the Baltics, northern Russia, parts of Canada and northern Asia. These results highlight the limitations imposed by cold climates and short growing seasons on biomass-based energy systems.
Figure 2 compares regional variations in LUEI for both Miscanthus and willow. Miscanthus consistently outperforms willow across all regions, indicating higher energy returns per unit area. The highest values for both crops are observed in South America and Asia, followed by Africa, highlighting the strong potential of tropical and subtropical environments. Europe records the lowest LUEI values, while North America and Oceania demonstrate moderate potential. While Miscanthus offers greater energy yield per hectare, willow shows a broader distribution of moderate LUEI values, highlighting its potential adaptability across diverse environmental contexts. However, this apparent adaptability should be interpreted with caution, as the version of the SalixFor model used in this analysis may not fully account for willow’s known sensitivity to drought stress, which can significantly reduce yields or increase susceptibility to pests and mortality. These findings suggest that both crops could still play complementary roles in sustainable bioenergy strategies, provided local environmental constraints, especially water availability, are carefully considered.
3.1.2. Land Use Efficiency Intensity for Miscanthus Under B1 and A1FI Climate Scenarios
Figure 3a and Table 3 present the projected LUEI for Miscanthus under the B1 climate scenario up to 2060, revealing notable shifts compared to the baseline. LUEI values range from -8.29 to 784.8 GJ/ha, with a global mean of 293±190 GJ/ha. High to very high LUEI values remain concentrated in tropical and subtropical regions, including much of South America (particularly Brazil), Sub-Saharan Africa, Southeast Asia, and the northern and eastern coasts of Australia. These regions maintain strong productivity potential, with only minor reductions due to climate stress, reinforcing Miscanthus's continuing suitability to warmer climates. The B1 scenario also shows an expansion of medium to high LUEI values in temperate zones. Notably, parts of the southern United States, central Europe, and eastern Europe show improved energy yield potential, suggesting that moderate warming could improve Miscanthus productivity in regions previously considered marginal. Overall, LUEI declines by 9% globally under the B1 scenario, as shown in Table 3.
Figure 3b and Table 3 show LUEI distribution under the A1FI scenario, also up to 2060. Values range from -8.44 to 703 GJ/ha, with a global mean of 273±184.7 GJ/ha. Compared to the baseline, the A1FI scenario leads to a broader spread of high to very high LUEI values, particularly across temperate regions. Significant increases are observed in North America, especially across the Midwest and southern United states where many areas shift to medium and high LUEI categories. Similarly, central and eastern Europe transition to higher productivity classes, benefiting from the stronger warming and extended growing seasons projected under A1FI. However, greater climate stress in some tropical and subtropical areas causes declines in net energy yield, compared to both the baseline and B1 scenario. This suggests potential limitations for Miscanthus in parts of the global South under more extreme warming. Overall, LUEI under A1FI declines by 15%, indicating a greater global reduction in energy efficiency than under B1.
3.1.3. Land Use Efficiency Intensity for Willow Under B1and A1FI Climate Scenarios
Figure 4a and Table 3 present the projected LUEI for willow under the B1 climate scenario up to 2060, showing notable shifts from the baseline. Values range from -8.82 to 505.3 GJ/ha, with a global mean of 151±115 GJ/ha. High to very high LUEI values remain concentrated in tropical and subtropical regions, including South America (especially Brazil), Sub-Saharan Africa, Southeast Asia, and the northern and eastern coasts of Australia. These areas continue to offer favourable energy returns for willow, with only minor reductions in net energy gain due to climate stress, confirming willow’s suitability under moderate warming conditions. The B1 scenario also leads to a modest expansion of medium to high LUEI values in temperate regions. Areas such as the southeastern United States, southern and eastern Europe, and parts of Central Asia show upward shifts in LUEI classes, indicating improved suitability for willow cultivation in regions that were previously marginal. These shifts highlight willow’s potential to adapt to broader geographic ranges under the moderate warming projected by the B1 scenario. However, LUEI still declines by 8% globally under B1, as shown in Table 3.
Figure 4b and Table 3 show the LUEI for willow under the A1FI scenario, up to 2060. Values range from -5.56 to 455.3 GJ/ha, with a global mean of 142.5±111.8 GJ/ha. Compared to the baseline, A1FI leads to a wider distribution of high to very high LUEI values, especially across the tropics and subtropics. This includes a stronger presence in South America, Sub-Saharan Africa, and Southeast Asia, strengthening willow’s strong bioenergy potential in warm regions. Additionally, there is a more pronounced expansion into temperate regions, such as the Midwest and southern United states, as well as across central and eastern Europe. These improvements suggest that stronger warming and longer growing seasons under A1FI may improve willow’s net energy gains in some cooler areas. However, in certain tropical and subtropical locations facing higher climate stress or extreme warming, net energy yields decline compared to the baseline and B1 scenarios. This suggests that while willow benefits from warming in many regions, excessive climate stress may limit its efficiency in others. As shown in Table 3, global LUEI for willow declines by 13% under the A1FI scenario, reflecting a greater reduction than under B1.
3.2. Impacts of Biomass Transport on Energy Use Efficiency
3.2.1. Impacts of Biomass Transport Under Current Climate Conditions
Figure 5a and Figure 5b illustrate the global baseline EUE of Miscanthus cultivation under two transportation scenarios: local transport (50 km) and long-distance transport (500 km). As presented in Table 4, EUE values for the 50 km scenario range from 0.05 to approximately 24.75, with a mean of 15.73±7.1, whereas for the 500 km scenario, values range from 0.05 to approximately 18.20, with a mean of 12.37±5.2. These results highlight both the spatial variability in EUE across climatic zones and the influence of transport distance on biomass utilization efficiency. In both figures, the highest EUE values are predominantly located in tropical and subtropical regions, including Central and South America (especially the Amazon Basin), Central and Sub-Saharan Africa, Southeast Asia, and northern coastal Australia. The key difference between the two scenarios is the impact of increased transport distance on EUE. In the 50 km transport scenario, very high EUE values are more widely distributed across tropical and subtropical zones, indicating that biomass production is highly efficient when transportation distances are minimized. In contrast, under the 500 km scenario, there is a notable average decline of 21% in EUE globally (Table 4). Many regions which exhibited very high EUE in the 50 km scenario shift to high or medium EUE, illustrating the energy penalty associated with longer transportation. This trend emphasizes a critical trade-off common to many energy systems: while Miscanthus production remains energy-efficient in favourable climatic zones, the low energy density of biomass makes long-distance transport particularly detrimental to net energy efficiency.
Figure 6 shows regional differences in EUE between the two distance scenarios under baseline conditions. The impact of transport distance is particularly pronounced in Africa, Asia, and South America, likely due to regional infrastructure, environmental conditions, and supply chain coordination.
3.2.2. Impacts of Biomass Transport Under B1and A1FI Climate Scenarios
Figure 7a and Figure 7b show the global EUE of Miscanthus cultivation under the B1 climate scenario for two transport distances: local use at 50 km and long-distance transport at 500 km, respectively. According to Table 4, EUE values for the 50 km scenario range from 0.08 to approximately 24.99 (mean = 15.15±7.13), while those for the 500 km scenario range from 0.08 to approximately 18.33 (mean = 11.97±5.17). Although the spatial distribution of EUE remains largely like the baseline scenario, there are slight increases in EUE found in colder northern regions and slight decreases in warmer regions. Overall, mean EUE values are slightly lower, reflecting the projected climate effects under the B1 scenario. These figures highlight regional variability in EUE and the influence of transport distances on biomass utilization efficiency. In both transport scenarios, the highest EUE values remain concentrated in tropical and subtropical regions, such as Central and South America (notably the Amazon Basin), Central Africa, Southeast Asia, and northern coastal Australia. Similarly to the baseline scenario, increasing the transport distance from 50 km to 500 km results in a 21% decline in EUE under B1 conditions (Table 4). For the 50 km scenario, very high EUE values are more widespread across tropical zones, demonstrating efficient biomass utilization when transport distances are minimal. Conversely, under the 500 km scenario, EUE declines across all regions, with many areas shifting from very high to high or moderate efficiency levels.
Figure 8a and Figure 8b present the global EUE of Miscanthus under the A1FI climate scenario for the same two transport distances. EUE values for 50 km range from 0.06 to approximately 24.25 (mean = 14.56±7.10), and for 500 km from 0.06 to approximately 17.92 (mean = 11.58±5.14). Compared to the baseline and B1 scenarios, the spatial extent of high EUE areas is slightly larger, but overall mean EUE is lower. This reduction is largely due to increased temperatures under A1FI, which restrict crop productivity, especially in already warm regions. As with the other scenarios, tropical and subtropical regions, Central and South America, Central Africa, Southeast Asia, and northern coastal Australia, show the highest EUE values under both transport scenarios. However, EUE decreases more significantly in temperate zones farther from the Equator, such as Canada, the northern United States, and central and northern Europe specifically Scandinavia, the Baltics and northern Russia, where climatic constraints reduce Miscanthus productivity. Transport distance continues to play a major role, with a 20% decline in EUE observed when increasing from 50 km to 500 km under A1FI conditions (Table 4). In Figure 8a, very high EUE areas are again more prominent in tropical zones under the 50 km scenario. In contrast, Figure 8b shows widespread reductions in EUE under the 500 km scenario, with many regions dropping from very high to high or moderate efficiency levels. Overall, these results reinforce the consistent trade-off observed across all climate scenarios: while biomass production remains suitable in favourable climatic regions, long-distance transport reduces energy efficiency.
3.3. Estimated Soil Organic Carbon Sequestered by Miscanthus
Figure 9 and Table 5 highlight the global spatial and statistical patterns of annual changes in soil organic carbon (∆SOC) and annual SOC addition rates under Miscanthus cultivation across the baseline and two climate scenarios (B1 and A1FI) by 2060. Under the baseline scenario (1961-1990), annual ∆SOC values are predominantly positive across most regions, particularly in tropical Africa, Southeast Asia, and Latin America (Figure 9a). The global mean annual change is 1.20±1.46 t/ha, with some locations reaching up to 4.57 t/ha, indicating strong carbon accumulation potential. The annual SOC addition rate is also highest during this period, with a mean of 5.02±2.0 t/ha, and values reaching a maximum of 21.44 t/ha, reflecting highly favourable conditions for SOC build-up.
Under the B1 scenario, there is a notable decline in both spatial extent and intensity of SOC gains (Figure 9b). Many regions shift from high ∆SOC to low ∆SOC, especially in northern and temperate zones. The mean annual ∆SOC drops to 0.62±1.11 t/ha, and the mean annual rate decreases to 2.39±1.05 t/ha, suggesting that even under a relatively moderate climate pathway, SOC sequestration potential is reduced. The A1FI scenario shows a further decrease in SOC change intensity (Figure 9c), with more widespread areas showing negative ∆SOC. The mean annual ∆SOC under A1FI is just 0.49±1.13 t/ha, while the annual SOC addition rate is reduced to 2.34±1.05 t/ha (Table 5). Some regions, specifically areas of Sub-Saharan Africa and Southeast Asia, still maintain relatively high SOC gain potential. However, overall spatial coverage of very high gains is more limited. These results indicate that climate change scenarios are likely to dampen the SOC accumulation benefits of Miscanthus, with both the extent and magnitude of annual gains significantly reduced under future conditions.
Figure 10 compares the average regional SOC rates (t/ha) added by Miscanthus under the baseline and future climate scenarios (B1 and A1FI). Across all regions, the baseline scenario consistently shows higher rate values, highlighting the adverse effects of projected climate change on carbon addition to soils by Miscanthus. The greatest SOC additions are observed in South America, Asia, and Africa, which illustrates the optimal growing conditions for the crop, with no significant impact of climate change. In contrast, colder and more boreal regions in Europe, such as Scandinavia and the Baltics, exhibit negative rate values across all scenarios, suggesting that climatic, and possibly soil or land-use constraints, may limit Miscanthus-driven SOC gains in these areas. These regional disparities emphasize the critical role of local environmental conditions in determining the carbon addition potential of Miscanthus under changing climate scenarios.
4. Discussion
4.1. Land Use Energy Intensity for Miscanthus and Willow Under Current Climate Conditions
The spatial variability in LUEI observed for Miscanthus under current climate conditions reflects a high degree of sensitivity with respect to climatic and biophysical activities. The global annual mean LUEI for Miscanthus (321±179.1 GJ/ha) shows the crop's strong energy yield potential, especially in tropical and subtropical regions such as Brazil, Southeast Asia, Sub-Saharan Africa, and coastal northern Australia. These high-LUEI zones benefit from elevated solar radiation, long growing seasons, and adequate rainfall, helping to promote robust biomass production and, as a result, greater annual net energy returns [22,23]. This is consistent with Figure 1a and Table 3, which show LUEI values more than 700 GJ/ha in tropical hotspots and reflects the success of sugarcane production in Brazil for bioenergy both for ethanol production and bagasse burning. Sugarcane grass being closely related to Miscanthus. However, in cooler temperate and boreal regions, such as Scandinavia, the Baltics, northern Russia, parts of Canada and Russia, Miscanthus shows significantly lower LUEI values, with some areas exhibiting negative effects. These outcomes reflect fundamental biophysical constraints, shorter growing seasons, limited heat units, and low winter survival, reducing annual biomass accumulation and energy efficiency [1,24].
Willow has been taken as a proxy for coppiced woody biomass in this study and may not be the highest yielding or suitable tree species for all climatic zones, especially subtropical and tropical zones. Being a C3 photosynthesise and having a lower yield than a C4 grass like Miscanthus, willow exhibits a lower mean annual LUEI (164±115.56 GJ/ha) but demonstrates a broader geographical range of moderate net energy gains due to its temperate origin. Its performance is relatively stable across temperate zones, including the central and eastern United States and much of Central Europe. This suggests greater resilience to variable and cooler climatic conditions [25,26]. As shown in Figure 1b, willow's energy performance does not reach the highs of Miscanthus but maintains moderate yields across wider latitudes. This broader adaptation improves its suitability under uncertain future climate conditions.
When comparing both Miscanthus and willow at regional level (Figure 2), both crops show high variability. Miscanthus consistently delivers higher energy returns per hectare than willow across the globe. Nevertheless, willow’s broader distribution of moderate LUEI values points to its potential as a complementary crop, particularly in areas where Miscanthus performance is marginal. However, the LUEI calculations by MiscanFor do not include the energy cost of removing the crop at the end of its lifetime, unless specifically modelled in the system’s assumptions. These findings underline the importance of matching crop types to regional environmental suitability, both by peak yield and stability under varying conditions.
The concentration of high LUEI values in tropical and subtropical regions reinforces the strategic value of these zones for maximizing bioenergy outputs. However, prioritizing these regions for bioenergy expansion must be balanced against long term impacts on land availability, food security, and ecosystem conservation [27,28]. Incorporating environmental, economic, and social dimensions into land-use planning is essential to ensure that bioenergy deployment aligns with wider sustainable development goals [29]. Our results confirm that while Miscanthus offers superior annual net energy yields under optimal conditions, willow’s broader climatic suitability means that it has the potential for being suitable for greater diverse geographical deployment. This supports a dual-crop strategy tailored to local biophysical and socio-economic contexts.
4.2. Land Use Energy Intensity for Miscanthus Under Future Climate Conditions
The LUEI projections for Miscanthus under the B1 scenario indicate a sustained capacity for high net energy yield in tropical and subtropical zones, such as Brazil, Sub-Saharan Africa, Southeast Asia, and coastal Australia. These regions benefit from continued access to high solar irradiance, stable precipitation, and suitable growing temperatures. Despite moderate climate change, the biophysical conditions in these zones remain supportive of biomass productivity, demonstrating the crop's resilience to minimised climate stress [30,31]. The limited LUEI decline in these areas suggests a degree of climate buffering, consistent with previous research connected to Miscanthus’s adaptability across a range of warm environments [32]. Additionally, the B1 scenario facilitates improvements in LUEI across certain temperate regions. Specifically, medium-to-high LUEI values are noted in the southern United States and parts of central and eastern Europe by 2060, signalling that moderate warming may expand Miscanthus’s agronomic frontier. Warmer temperatures, coupled with extended frost-free periods, appear to improve biomass accumulation in these zones [6,9]. This finding supports earlier simulation research suggesting that Miscanthus could become viable in previously marginal regions due to projected climatic shifts, especially due to its genetic variation and wide geographical origin [9,33,34]. Nevertheless, the global average LUEI still shows a 9% decline under B1, indicating that climate change, even under a lower-emissions scenario, introduces subtle negative feedback on energy gains. This is possibly because of altered rainfall regimes or increased pest/disease risks [29].
Under the more extreme A1FI scenario, changes in LUEI become more marked. While the global mean LUEI drops by 15%, this overall decline masks important regional contrasts. There is a broader expansion of medium-to-high LUEI values in temperate regions, including the Midwest United states and much of central and eastern Europe. In these areas, elevated temperatures and longer growing seasons appear to realise the potential of Miscanthus’s energy yield, effectively transforming previously low-yielding lands into productive bioenergy sites [35]. This result also confirms the crop's potential role in climate adaptation and mitigation strategies for temperate zones. Conversely, the A1FI scenario results in noticeable declines in LUEI across certain tropical and subtropical zones, notably in regions previously characterized by peak Miscanthus performance. The more intense climate stress manifested as excessive heat, drought, or nutrient cycling disruption appears to surpass the crop’s ecological tolerance thresholds in some locations, resulting in yield penalties [23]. These findings are consistent with broader concerns in the bioenergy literature that aggressive warming scenarios may exacerbate trade-offs between food and energy production in vulnerable regions [29,36]. While both climate scenarios present new opportunities for Miscanthus expansion into temperate latitudes, especially under A1FI, they also highlight geographic trade-offs and a shift in global bioenergy potential. The spatial redistribution of suitability reiterates the requirement for adaptive bioenergy planning and a multi-risk assessment framework which integrates land-use efficiency, climate resilience, and ecosystem impacts [29,36]. It also indicated the need for continued work on breeding new varieties of Miscanthus to take advantage of its genetic and phenotypical variation to survive future climates [37]. Future policy and management strategies should focus not only on where Miscanthus can grow, but also on how to sustainably optimize energy returns in amongst climatic uncertainty and demand to improve food security and biodiversity [38].
4.3. Land Use Energy Intensity for Willow Under Future Climate Conditions
Under the B1 climate scenario projected to 2060, willow maintains high to very high LUEI in tropical and subtropical regions, including Brazil, Sub-Saharan Africa, Southeast Asia, and coastal Australia. These findings align with previous studies demonstrating willow’s broad ecological adaptability, specifically in regions with moderate temperatures and adequate water availability [39]. While some minor reductions in LUEI are observed, likely due to modest increases in climate stress, willow’s overall energy yield remains stable, supporting its continued role in low-emissions bioenergy systems under moderate climate change. Importantly, the B1 scenario stimulates a spatial redistribution of medium to high LUEI values into new temperate zones. The southeastern United States, Southern and Eastern Europe, and parts of Central Asia exhibit enhanced suitability for willow cultivation. These improvements likely stem from increased growing season lengths and milder winters under B1 conditions, improving biomass productivity in previously marginal zones [40]. However, the overall LUEI for willow under B1 shows an 8% decline, indicating that while geographic expansion of suitable areas occurs, productivity losses in currently optimal regions may partially offset these energy gains.
Under the more extreme A1FI scenario, LUEI patterns for willow show more dramatic transformations. The stronger warming and increases in atmospheric CO₂ associated with this scenario lead to substantial expansion of high LUEI zones in both the tropics and temperate regions. Notably, parts of the Midwest United states and Southern Europe transition into higher LUEI categories, reflecting patterns reported in recent bioenergy modelling studies where extreme climate change creates favourable thermal regimes for fast-growing woody crops like willow [1,41].
However, as climate stress intensifies in parts of the tropics and subtropics, particularly in regions with higher evapotranspiration and soil moisture deficits [42], there is a decline in willow's net energy gain compared to baseline or B1 levels. This shows a threshold effect where increasing climate stress begins to outlast the physiological resilience of the crop. Moreover, the overall 13% reduction in LUEI under A1FI highlights the trade-offs associated with high-emissions scenarios where broader spatial potential comes at the cost of productivity stability in core production zones. Taken together, these findings suggest that while willow could expand into new areas under both scenarios, maintaining high energy yields will depend on region-specific climate impacts, particularly moisture availability and temperature extremes. Strategic land-use planning will be critical to maximize bioenergy returns while minimizing risks under future climate trajectories. Overall although this study has used willow as a proxy for short rotation coppice wood biomass, due to widespread trials, it should be noted that other woody biomass such as poplar and eucalyptus may be more suitable for areas outside the temperate climate predictions.
4.4. Impacts of Biomass Transport on Energy Use Efficiency of Miscanthus
This study provides a detailed assessment of how biomass transport distance affects the EUE of Miscanthus-based bioenergy systems under both current and projected future climate scenarios. While this analysis focuses solely on Miscanthus owing to the availability of robust modelling data from previous studies such as [5], a key gap remains in comparable datasets for other perennial crops such as willow. Bridging this gap will be essential to enable comprehensive multi-crop comparisons and to guide informed decisions in biomass supply chain development.
The spatial analysis reveals a consistent pattern across all climate scenarios (baseline, B1, A1FI): EUE is highest in tropical and subtropical zones, including Central and South America, Sub-Saharan Africa, Southeast Asia, and northern Australia, where climatic conditions promote high biomass yields and minimal energy input requirements [1]. These findings confirm earlier research highlighting the sensitivity of Miscanthus productivity to temperature, rainfall, and growing season length [1,23]. However, the study also reveals a pronounced reduction in EUE when increasing the transportation distance from 50 km to 500 km. Across all scenarios, long-distance transport leads to an average EUE decline of approximately 20–21%, with the most dramatic reductions are observed in regions with otherwise high biomass potential. For instance, under baseline conditions, the mean EUE dropped from 15.73±7.10 to 12.37± 5.15 with a 500 km transport scenario, a 21% reduction. Similar trends were observed under the B1 (from 15.15±7.13 to 11.97±5.17; ~21%) and A1FI (from 14.56±7.10 to 11.58±5.14; ~20%) scenarios. These consistent reductions reflect the high energy cost associated with transporting bulky, low-energy-density biomass pellets over long distances, supporting findings from [43,44], who reported that extended biomass transport substantially reduces EUE.
Importantly, while warmer future climates, particularly under the A1FI scenario, show slight EUE improvements in colder, high-latitude regions due to relaxed thermal constraints on crop growth, these gains are generally insufficient to offset the energy penalties of long-distance transport. Under A1FI, although EUE spatial coverage expanded slightly in temperate zones, the average efficiency remained lower than baseline, primarily due to increased heat stress in already warm regions that reduced biomass productivity. This nuanced response underlines the importance of considering regional climate-crop interactions when planning future biomass systems [1,33]. The energy trade-off between biomass production and transport is further highlighted in regional comparisons (Figure 6), where infrastructure limitations and environmental conditions exacerbate transport inefficiencies, particularly in parts of Africa, Asia, and South America. These patterns call for regionally tailored logistics solutions that can mitigate energy losses from transport. This has been achieved in Brazil where bioethanol plants and bagasse fuelled power stations are co-located in areas where sugarcane is grown and harvested, resulting in minimal transport energy and emission costs [45].
To enhance EUE and overall system sustainability, bioenergy strategies must focus on localized biomass supply chains, where production, processing, and end-use occur in close geographical proximity. Adopting this approach not only reduces fossil fuel consumption but also supports more resilient, decentralized energy systems, as recommended by [46]. Additional strategies include developing decentralized preprocessing facilities to convert raw biomass into energy-dense forms such as pellets, briquettes, or bio-oils, which are more cost- and energy-efficient to transport over long distances although the palletisation process is energy intensive and is a trade-off with transportation costs [5,44]. However, such decentralization may introduce trade-offs, particularly through reduced economies of scale. A more distributed system often requires additional agricultural, harvesting, and processing machinery, or increased movement of centralized contractors, which could partially offset the savings gained from reduced end-product transport. Therefore, a balanced approach is essential, weighing the logistical and economic trade-offs against the environmental and resilience benefits of decentralization.
Our study highlights that while Miscanthus is a highly promising energy crop in tropical and subtropical regions, the benefits of its cultivation can be substantially diminished by long transport distances. This finding is consistent across present and future climate scenarios, underlining a critical sustainability constraint. Future bioenergy policy should, therefore, prioritize geographically optimized systems, accounting for transport infrastructure, regional climate projections, and the energy-intensity of logistics such that transport by water or rail is less energy and emissions intensive than road transport. Promoting supply chains which minimize transportation costs will be vital for maximizing EUE and realizing the full environmental and economic potential of Miscanthus-based bioenergy systems. However, these strategies must also consider the unintended consequences of land-use change, particularly the risk of significant SOC loss when cultivating Miscanthus on for example deep tropical peatlands. Like the impacts seen in palm oil production, disturbing peat soils for energy crop establishment can result in substantial carbon emissions, undermining climate mitigation goals. Careful site selection that avoids high-carbon stock soils, such as undisturbed peatlands, is therefore essential to ensure genuine sustainability gains.
4.5. Estimated Soil Organic Carbon Sequestered by Miscanthus
The results of this study demonstrate that Miscanthus cultivation has significant potential to improve SOC sequestration across diverse global regions, particularly under current climatic conditions. The highest SOC accumulation is observed under the baseline climate (1961–1990), with an overall global mean annual ∆SOC of 1.20±1.46 t/ha and some hotspots reaching up to 4.57 t/ha. This is consistent with previous findings that perennial bioenergy crops can significantly contribute to carbon storage in soils [20,47]. However we also find that areas with initially high carbon- histosols or low yields will result in soil carbon loss. These findings are particularly encouraging for tropical and sun tropical regions of Africa, Southeast Asia, and Latin America, where favourable temperature and moisture conditions likely improve plant growth and litter input, thus promoting SOC accumulation [48]. However, it is important to note that these same environments, while conducive to plant growth, are also highly susceptible to SOC losses due to disturbance from ploughing, drainage, or other land preparation activities. In such settings, decomposition rates of pre-existing SOC are significantly accelerated, meaning that the carbon inputs from Miscanthus may not be sufficient to fully offset the emissions caused during crop establishment, especially on carbon-rich soils like peat. The distinction between the absolute addition of plant inputs and the relative change in SOC is crucial, as high plant productivity and SOC addition rates may still coincide with a net loss of SOC due to these pre-existing soil conditions and management practices.
Projections under future climate scenarios (B1 and A1FI) show a marked decline in both the spatial extent and intensity of SOC gains, with the mean ∆SOC declining to 0.62±1.11 t/ha and 0.49±1.13 t/ha, respectively. Specifically, under the high-emission A1FI scenario, SOC gains are substantially diminished, suggesting that elevated temperatures and potential drought stress could offset the carbon sequestration benefits of Miscanthus across several regions. Similar conclusions were drawn by [49], who reported reduced mitigation benefits from bioenergy crops under future warming scenarios.
The spatial variability highlighted in Figure 10 underlines the importance of regional biophysical conditions in mediating SOC responses. For instance, positive SOC changes in tropical and subtropical regions are consistent with high net primary productivity and faster biomass turnover, which drive greater carbon inputs to the soil [50]. Conversely, Europe’s consistent negative ∆SOC across all scenarios may reflect limitations imposed by cooler climates, lower biomass yields, \higher initial SOC values and the large areas of historsols which restrict SOC enhancement [51]. This reinforces the perception that site-specific assessments are crucial for determining the net carbon benefits of Miscanthus deployment [30]. Importantly, this analysis contributes to a growing body of literature emphasizing the role of bioenergy crops like Miscanthus both as renewable energy sources and as land-based climate mitigation options through carbon sequestration [52]. Nonetheless, the declining trend under future scenarios highlights the need for integrating adaptive management strategies, (e.g., improved cultivar selection or soil amendments), to maintain SOC gains under climate change. Overall, while the baseline scenario illustrates the high potential of Miscanthus to improve SOC stocks globally, the diminished gains under projected climate change highlights the urgency of coupling bioenergy deployment with robust climate adaptation strategies to sustain soil carbon benefits long term.
5. Conclusions
This study provides a global, spatially explicit assessment of the LUEI of two perennial bioenergy crops, Miscanthus and willow, under both current and future climate scenarios. Under baseline conditions, both crops exhibit high energy yield potential, particularly in tropical and subtropical regions due to favourable climatic and biophysical factors. Miscanthus consistently outperforms willow in terms of spatial energy productivity, especially across these high-potential zones. Under the moderate B1 scenario, energy yields remain robust in tropical areas and improve in temperate regions such as Central Europe and North America. In contrast, the more extreme A1FI scenario results in marked declines in energy returns across Southeast Asia and parts of sub-Saharan Africa, reflecting the crop's sensitivity to elevated temperatures and shifting precipitation regimes. These findings highlight the need for flexible, climate-resilient deployment strategies
Transport logistics play a significant role in determining net energy returns. Across all climate scenarios, extending the transport distance from 50 km to 500 km leads to a consistent 20–21% decline in EUE, highlighting the importance of localized biomass processing and distribution. However, a balanced strategy is required, one that carefully weighs the logistical and economic trade-offs of decentralization against its environmental benefits and the potential to enhance overall system resilience. Miscanthus also offers notable climate mitigation potential through its capacity for both renewable energy production and SOC sequestration. Under current climatic conditions, the global mean annual SOC gain is estimated at 1.20 ± 1.46 t C/ha, with tropical regions such as Southeast Asia, Africa, and Latin America exhibiting sequestration hotspots reaching up to 4.57 t C/ha. However, projected climate change poses challenges: mean ∆SOC falls to 0.62 ± 1.11 t C/ha under B1 and 0.49 ± 1.13 t C/ha under A1FI, possibly due to increased temperature stress and altered soil moisture regimes. Cooler regions such as Scandinavia, the Baltics, northern Russia, and parts of Canada consistently show net SOC losses, driven by lower productivity, higher initial SOC levels, and the presence of carbon-rich histosols. These spatial patterns reinforce the need for regionally tailored management and risk assessment strategies to preserve the carbon and energy benefits of Miscanthus. Adaptive approaches, such as breeding for climate-resilient cultivars, improving water-use efficiency, and adopting soil amendments, are essential to enhance system resilience under future conditions.
Overall, this spatially explicit modelling framework enables more informed, sustainable deployment of bioenergy systems by identifying both priority regions for cultivation and areas that should be avoided due to environmental risks or marginal energy returns. Miscanthus emerges as a cornerstone for land-based climate mitigation, provided its expansion is supported by robust environmental modelling, strategic policy, and site-specific risk screening.
Author Contributions
Conceptualization, M.A., A.H. and P.S.; methodology, M.A., A.H., G.C., J.M and A.S.; software, M.A., A.H.; formal analysis, M.A., J.M and G.C.; investigation, M.A., A.H., G.C., J.M and P.S.; writing-original draft preparation, M.A.; writing-review and editing, M.A., A.H., G.C., J.M, A.S and P.S.; visualization, M.A., J.M and G.C. All authors have read and agreed to the published version of the manuscript.
Acknowledgments
This work was supported by the EU Horizon-UPTAKE Project (project nr: 101081521) and UKRI projects: PCB4GGR (BB/V011553/1) & NZ+ (BB/V011588/1).
References
- Abdalla, M.; Hastings, A.; Campbell, G.; Chen, H.; Smith, P. Assessing the Sustainability of Miscanthus and willow as Global Bioenergy Crops: Current and Future Climate Conditions (Part 1). Agronomy 2024, 14, 3020. [Google Scholar] [CrossRef]
- McCalmont, J.P.; Hastings, A.; McNamara, N.P.; Richter, G.M.; Robson, P.; Donnison, I.S.; Clifton-Brown, J. Environmental Costs and Benefits of Growing Miscanthus for Bioenergy in the UK. GCB Bioenergy 2017, 9, 489–507. [Google Scholar] [CrossRef] [PubMed]
- Hodgson, E.; McCalmont, J.; Rowe, R.; Whitaker, J.; Holder, A.; Clifton-Brown, J.; Thornton, J.; Hastings, A.; Robson, P.; Webster, R. Upscaling Miscanthus Production in the United Kingdom: The Benefits, Challenges, and Trade-Offs. GCB Bioenergy 2024, 16, e13177. [Google Scholar] [CrossRef]
- Clifton-Brown, J.; Breuer, J.; Jones, M.B. Carbon Mitigation by the Energy Crop, Miscanthus. Global Change Biology 2007, 13, 2296–2307. [Google Scholar] [CrossRef]
- Hastings, A.; Mos, M.; Yesufu, J.A.; McCalmont, J.; Schwarz, K.U.; Shafei, R.; Ashman, C. Economic Viability of Miscanthus Production with Less Productive Land in England. Global Change Biology Bioenergy 2017, 9, 947–957. [Google Scholar]
- Hastings, A.; Clifton-Brown, J.; Wattenbach, M.; Mitchell, C.P.; Stampfl, P.; Smith, P. Future Energy Potential of Miscanthus in Europe. GCB Bioenergy 2009, 1, 180–196. [Google Scholar] [CrossRef]
- Pogson, M.; Richards, M.; Dondini, M.; Jones, E.; Hastings, A.; Smith, P. ELUM: User-Friendly Spatial Modelling Tool Predicts Net Soil Greenhouse Gas Balance of Bioenergy Land-Use Change in the UK up to 2050. Environ. Model. Softw. 2016, 84, 458–466. [Google Scholar] [CrossRef]
- Aylott, M.J.; Casella, E.; Tubby, I.; Street, N.R.; Smith, P.; Taylor, G. Yield and Spatial Supply of Bioenergy Poplar and Willow Short-Rotation Coppice in the UK. New Phytologist 2008, 178, 358–370. [Google Scholar] [CrossRef]
- Hastings, A.; Clifton-Brown, J.; Wattenbach, M.; Mitchell, C.P.; Smith, P. The development of MISCANFOR, a new Miscanthus crop growth model: towards more robust yield predictions under different climatic and soil conditions. GCB Bioenergy 2009, 1, 154–170. [Google Scholar] [CrossRef]
- Hastings, A.; Tallis, M.J.; Casella, E.; Matthews, R.W.; Henshall, P.A.; Milner, S.; Smith, P.; Taylor, G. The technical potential of Great Britain to produce ligno-cellulosic biomass for bioenergy in current and future climates. GCB Bioenergy 2014, 6, 108–122. [Google Scholar] [CrossRef]
- European Environment Agency (EEA). CORINE Land Cover 2000 (CLC2000): Technical Guidelines; EEA: Copenhagen, Denmark, 2002; Available online: https://www.eea.europa.eu (accessed on 1 May 2024).
- Mitchell, T.D.; Carter, T.R.; Jones, P.D.; Hulme, M. A Comprehensive Set of High-Resolution Grids of Monthly Climate for Europe and the Globe: The Observed Record (1901–2002) and 16 Scenarios (2001–2100); Working Paper 55; Tyndall Centre for Climate Change Research: Norwich, UK, 2004. [Google Scholar]
- Hastings, A.; Clifton-Brown, J.; Lewandowski, I. The Potential of Miscanthus as a Sustainable Energy Crop. Biofuels Bioprod. Biorefin. 8, 123–134.
- Daioglou, V.; Doelman, J.C.; Wicke, B.; Faaij, A.P.C.; van Vuuren, D.P. Integrated Assessment of Biomass Supply and Demand in Climate Change Mitigation Scenarios. Global Environmental Change 2019, 54, 88–101. [Google Scholar] [CrossRef]
- Dohleman, F.G.; Heaton, E.A.; Arundale, R.A.; Long, S.P. Seasonal Dynamics of Above- and Below-Ground Biomass and Nitrogen Partitioning in Miscanthus × giganteus and Panicum virgatum across Three Growing Seasons. GCB Bioenergy 2012, 4, 534–544. [Google Scholar] [CrossRef]
- Martani, E.; Ferrarini, A.; Serra, P.; Pilla, M.; Marcone, A.; Amaducci, S. Belowground Biomass C Outweighs Soil Organic C of Perennial Energy Crops: Insights from a Long-Term Multispecies Trial. GCB Bioenergy 2021, 13, 88–103. [Google Scholar] [CrossRef]
- Bosatta, E.; Ågren, G.I. Theoretical Analysis of Decomposition of Heterogeneous Substrates. Soil Biol. Biochem. 1985, 17, 601–610. [Google Scholar] [CrossRef]
- Bosatta, E.; Ågren, G.I. Dynamics and Carbon and Nitrogen in the Organic Matter of the Soil: A Generic Theory. Am. Nat. 1991, 138, 227–245. [Google Scholar] [CrossRef]
- Bosatta, E.; Ågren, G.I. Theoretical Ecosystem Ecology: Understanding Element Cycles; Cambridge University Press: Cambridge, UK, 1996. [Google Scholar]
- Dondini, M.; Van Groenigen, K.J.; Del Galdo, I.; Jones, M.B. Carbon Sequestration under Miscanthus: A Study of Potential, Mechanisms and Environmental Interactions. GCB Bioenergy 2009, 1, 123–133. [Google Scholar] [CrossRef]
- Hastings, A.; Clifton-Brown, J.; Wattenbach, M.; Mitchell, C.P.; Smith, P. The Development of MISCANFOR, a New Miscanthus Crop Growth Model: Towards More Robust Yield Predictions under Different Climatic and Soil Conditions. GCB Bioenergy 1, 154–170. [CrossRef]
- Heaton, E.A.; Dohleman, F.G.; Long, S.P. Meeting US Biofuel Goals with Less Land: The Potential of Miscanthus. Glob. Chang. Biol. 2008, 14, 2000–2014. [Google Scholar] [CrossRef]
- Clifton-Brown, J.; Hastings, A.; Mos, M.; McCalmont, J.P.; Ashman, C.; Awty-Carroll, D.; Cerazy, J.; Chiang, Y.-C.; Cosentino, S.; Cracroft-Eley, W.; et al. Progress in Upscaling Miscanthus Biomass Production for the European Bio-Economy with Seed-Based Hybrids. GCB Bioenergy 2017, 9, 6–17. [Google Scholar] [CrossRef]
- Clifton-Brown, J.C.; Stampfl, P.F.; Jones, M.B. Miscanthus Biomass Production for Energy in Europe and Its Potential Contribution to Decreasing Fossil Fuel Carbon Emissions. Global Change Biology 2004, 10, 509–518. [Google Scholar] [CrossRef]
- Karp, A.; Shield, I. Bioenergy from Plants and the Sustainable Yield Challenge. New Phytologist 2008, 179, 15–32. [Google Scholar] [CrossRef]
- Donnison, I.S.; Shield, I.F.; Parrish, D.J.; Clifton-Brown, J.; Karp, A. Prospects for Miscanthus, Willow and Other Perennial Biomass Crops in the UK. In Perennial Energy Crops; 2009; pp. 245–268.
- Tilman, D.; Socolow, R.; Foley, J.A.; Hill, J.; Larson, E.; Lynd, L. .; Williams, R. Beneficial Biofuels—The Food, Energy, and Environment Trilemma. Science 2009, 325, 270–271. [Google Scholar] [CrossRef] [PubMed]
- Santangeli, A.; Di Minin, E.; Toivonen, T.; Pogson, M.; Hastings, A.; Smith, P. GCB Bioenergy 2016, 8, 1191–1200. [CrossRef]
- Creutzig, F.; Ravindranath, N.H.; Berndes, G.; Bolwig, S.; Bright, R.; Cherubini, F. . & Masera, O. Bioenergy and Climate Change Mitigation: An Assessment. GCB Bioenergy 2015, 7, 916–944. [Google Scholar]
- Clifton-Brown, J.; Robson, P.; Sanderson, R.; Hastings, A.; Valentine, J.; Donnison, I. Thermal Requirements for Seed Germination in Miscanthus Compared with Switchgrass (Panicum virgatum), Reed Canary Grass (Phalaris arundinaceae), Maize (Zea mays), and Perennial Ryegrass (Lolium perenne). GCB Bioenergy 2011, 3, 375–386. [Google Scholar] [CrossRef]
- Zhuang, Q.; Qin, Z.; Chen, M. Biofuel, Land and Water: Maize, Switchgrass or Miscanthus? Environ. Res. Lett. 2013, 8, 015020. [Google Scholar] [CrossRef]
- Lewandowski, I.; Scurlock, J.M. O.; Lindvall, E.; Christou, M. The Development and Current Status of Perennial Rhizomatous Grasses as Energy Crops in the US and Europe. Biomass Bioenergy 2003, 25, 335–361. [Google Scholar] [CrossRef]
- Heaton, E.A.; Voigt, T.B.; Long, S.P. A Quantitative Review Comparing the Yields of Two Candidate C4 Perennial Biomass Crops in Relation to Nitrogen, Temperature, and Water. Biomass Bioenergy 2004, 27, 21–30. [Google Scholar] [CrossRef]
- Shepherd, A.; Littleton, E.; Clifton-Brown, J.; Martin, M.; Hastings, A. Projections of Global and UK Bioenergy Potential from Miscanthus × Giganteus—Feedstock Yield, Carbon Cycling, and Electricity Generation in the 21st Century. GCB Bioenergy 2020, 12, 287–305. [Google Scholar] [CrossRef]
- Somerville, C.; Youngs, H.; Taylor, C.; Davis, S.C.; Long, S.P. Feedstocks for Lignocellulosic Biofuels. Science 2010, 329, 790–792. [Google Scholar] [CrossRef] [PubMed]
- Bonsch, M.; Humpenöder, F.; Popp, A.; Bodirsky, B.L.; Dietrich, J.P.; Rolinski, S.; Biewald, A.; Lotze-Campen, H.; Weindl, I.; Gerten, D.; Stevanovic, M. Trade-offs Between Land and Water Requirements for Large-Scale Bioenergy Production. GCB Bioenergy 2016, 8, 11–24. [Google Scholar] [CrossRef]
- Clifton-Brown, J.; Harfouche, A.; Casler, M.D.; Jones, H.D.; Macalpine, W.J.; Murphy-Bokern, D.; Smart, L.B.; Adler, A.; Ashman, C.; Awty-Carroll, D.; et al. Breeding Progress and Preparedness for Mass-Scale Deployment of Perennial Lignocellulosic Biomass Crops Switchgrass, Miscanthus, Willow, and Poplar. GCB Bioenergy 2019, 11, 118–151. [Google Scholar] [CrossRef]
- Clifton-Brown, J.; Hastings, A.; von Cossel, M.; Murphy-Bokern, D.; McCalmont, J.; Whitaker, J.; Alexopoulou, E.; Amaducci, S.; Andronic, L.; Ashman, C.; et al. Perennial Biomass Cropping and Use: Shaping the Policy Ecosystem in European Countries. GCB Bioenergy 2023, 15, 538–558. [Google Scholar] [CrossRef] [PubMed]
- Volk, T.A.; Verwijst, T.; Tharakan, P.J.; Abrahamson, L.P.; White, E.H. Growing Fuel: A Sustainability Assessment of Willow Biomass Crops. Front. Ecol. Environ. 2004, 2, 411–418. [Google Scholar] [CrossRef]
- Volk, T.A.; Abrahamson, L.P.; Nowak, C.A.; Smart, L.B.; Tharakan, P.J.; White, E.H. The Development of Short-Rotation Willow in the Northeastern United States for Bioenergy and Bioproducts, Agroforestry, and Phytoremediation. Biomass Bioenergy 2006, 30, 715–727. [Google Scholar] [CrossRef]
- Volk, T.A.; Heavey, J.P.; Eisenbies, M.H. Advances in Shrub-Willow Crops for Bioenergy, Renewable Products, and Environmental Benefits. Food Energy Sec. 2016, 5, 97–106. [Google Scholar] [CrossRef]
- Yuan, W.; Zheng, Y.; Piao, S.; Ciais, P.; Lombardozzi, D.; Wang, Y.; Ryu, Y.; Chen, G.; Dong, W.; Hu, Z. Increased Atmospheric Vapor Pressure Deficit Reduces Global Vegetation Growth. Sci. Adv. 2019, 5, eaax1396. [Google Scholar] [CrossRef]
- Ko, S.; Lautala, P.; Handler, R.M. Securing the Feedstock Procurement for Bioenergy Products: A Literature Review on the Biomass Transportation and Logistics. J. Clean. Prod. 2018, 200, 205–218. [Google Scholar] [CrossRef]
- Searle, S.; Malins, C. Waste and Residue Availability for Advanced Biofuel Production in the European Union. Biomass Bioenergy 2016, 89, 2–10. [Google Scholar] [CrossRef]
- Galdos, M.V.; Cantarella, H.; Hastings, A.; Hillier, J.; Smith, P. Environmental Sustainability Aspects of Second-Generation Ethanol Production from Sugarcane. In Advances of Basic Science for Second Generation Bioethanol from Sugarcane; Buckeridge, M.S., De Souza, A.P., Eds.; Springer International Publishing AG, 2017; pp. 173–192. [CrossRef]
- Slade, R.; Bauen, A.; Gross, R. Global Bioenergy Resources. Nature Climate Change 2014, 4, 99–105. [Google Scholar] [CrossRef]
- Anderson-Teixeira, K.J.; Davis, S.C.; Masters, M.D.; DeLucia, E.H. Changes in Soil Organic Carbon Under Biofuel Crops. GCB Bioenergy 2009, 1, 75–96. [Google Scholar] [CrossRef]
- Rowe, R.L.; Street, N.R.; Taylor, G. Identifying Potential Environmental Impacts of Large-Scale Deployment of Dedicated Bioenergy Crops in the UK. Renewable Sustainable Energy Rev. 2009, 13, 271–290. [Google Scholar] [CrossRef]
- Whitaker, J.; Field, J.L.; Bernacchi, C.J.; Cerri, C.E. P.; Ceulemans, R.; Davies, C.A.; De Lucia, E.H.; Donnison, I.S.; McCalmont, J.P.; Paustian, K.; Rowe, R.L.; Smith, P.; Thornley, P.; McNamara, N.P. Consensus, Uncertainties and Challenges for Perennial Bioenergy Crops and Land Use. GCB Bioenergy 2018, 10, 150–164. [Google Scholar] [CrossRef]
- Don, A.; Osborne, B.; Hastings, A.; Skiba, U.; Carter, M.S.; Drewer, J.; Freibauer, A. Land-Use Change to Bioenergy Production in Europe: Implications for the Greenhouse Gas Balance and Soil Carbon. GCB Bioenergy 2012, 4, 372–391. [Google Scholar] [CrossRef]
- Richter, D.D.; Hofmockel, M.; Callaham Jr, M.A.; Powlson, D.S.; Smith, P. Long-Term Soil Experiments: Keys to Managing Earth’s Rapidly Changing Ecosystems. Soil Sci. Soc. Am. J. 2015, 79, 1459–1466. [Google Scholar] [CrossRef]
- Paustian, K.; Lehmann, J.; Ogle, S.; Reay, D.; Robertson, G.P.; Smith, P. Climate-Smart Soils. Nature 2016, 532, 49–57. [Google Scholar] [CrossRef]
Figure 1.
Simulated global land use energy intensity (GJ/ha) for Miscanthus (a) and Willow (b) under current climate conditions (1961-1990). For both crops: very low ≤ 0.00; low = 0.00– 100; medium = 100-200; high = 200-300; very high ≥ 300.
Figure 1.
Simulated global land use energy intensity (GJ/ha) for Miscanthus (a) and Willow (b) under current climate conditions (1961-1990). For both crops: very low ≤ 0.00; low = 0.00– 100; medium = 100-200; high = 200-300; very high ≥ 300.
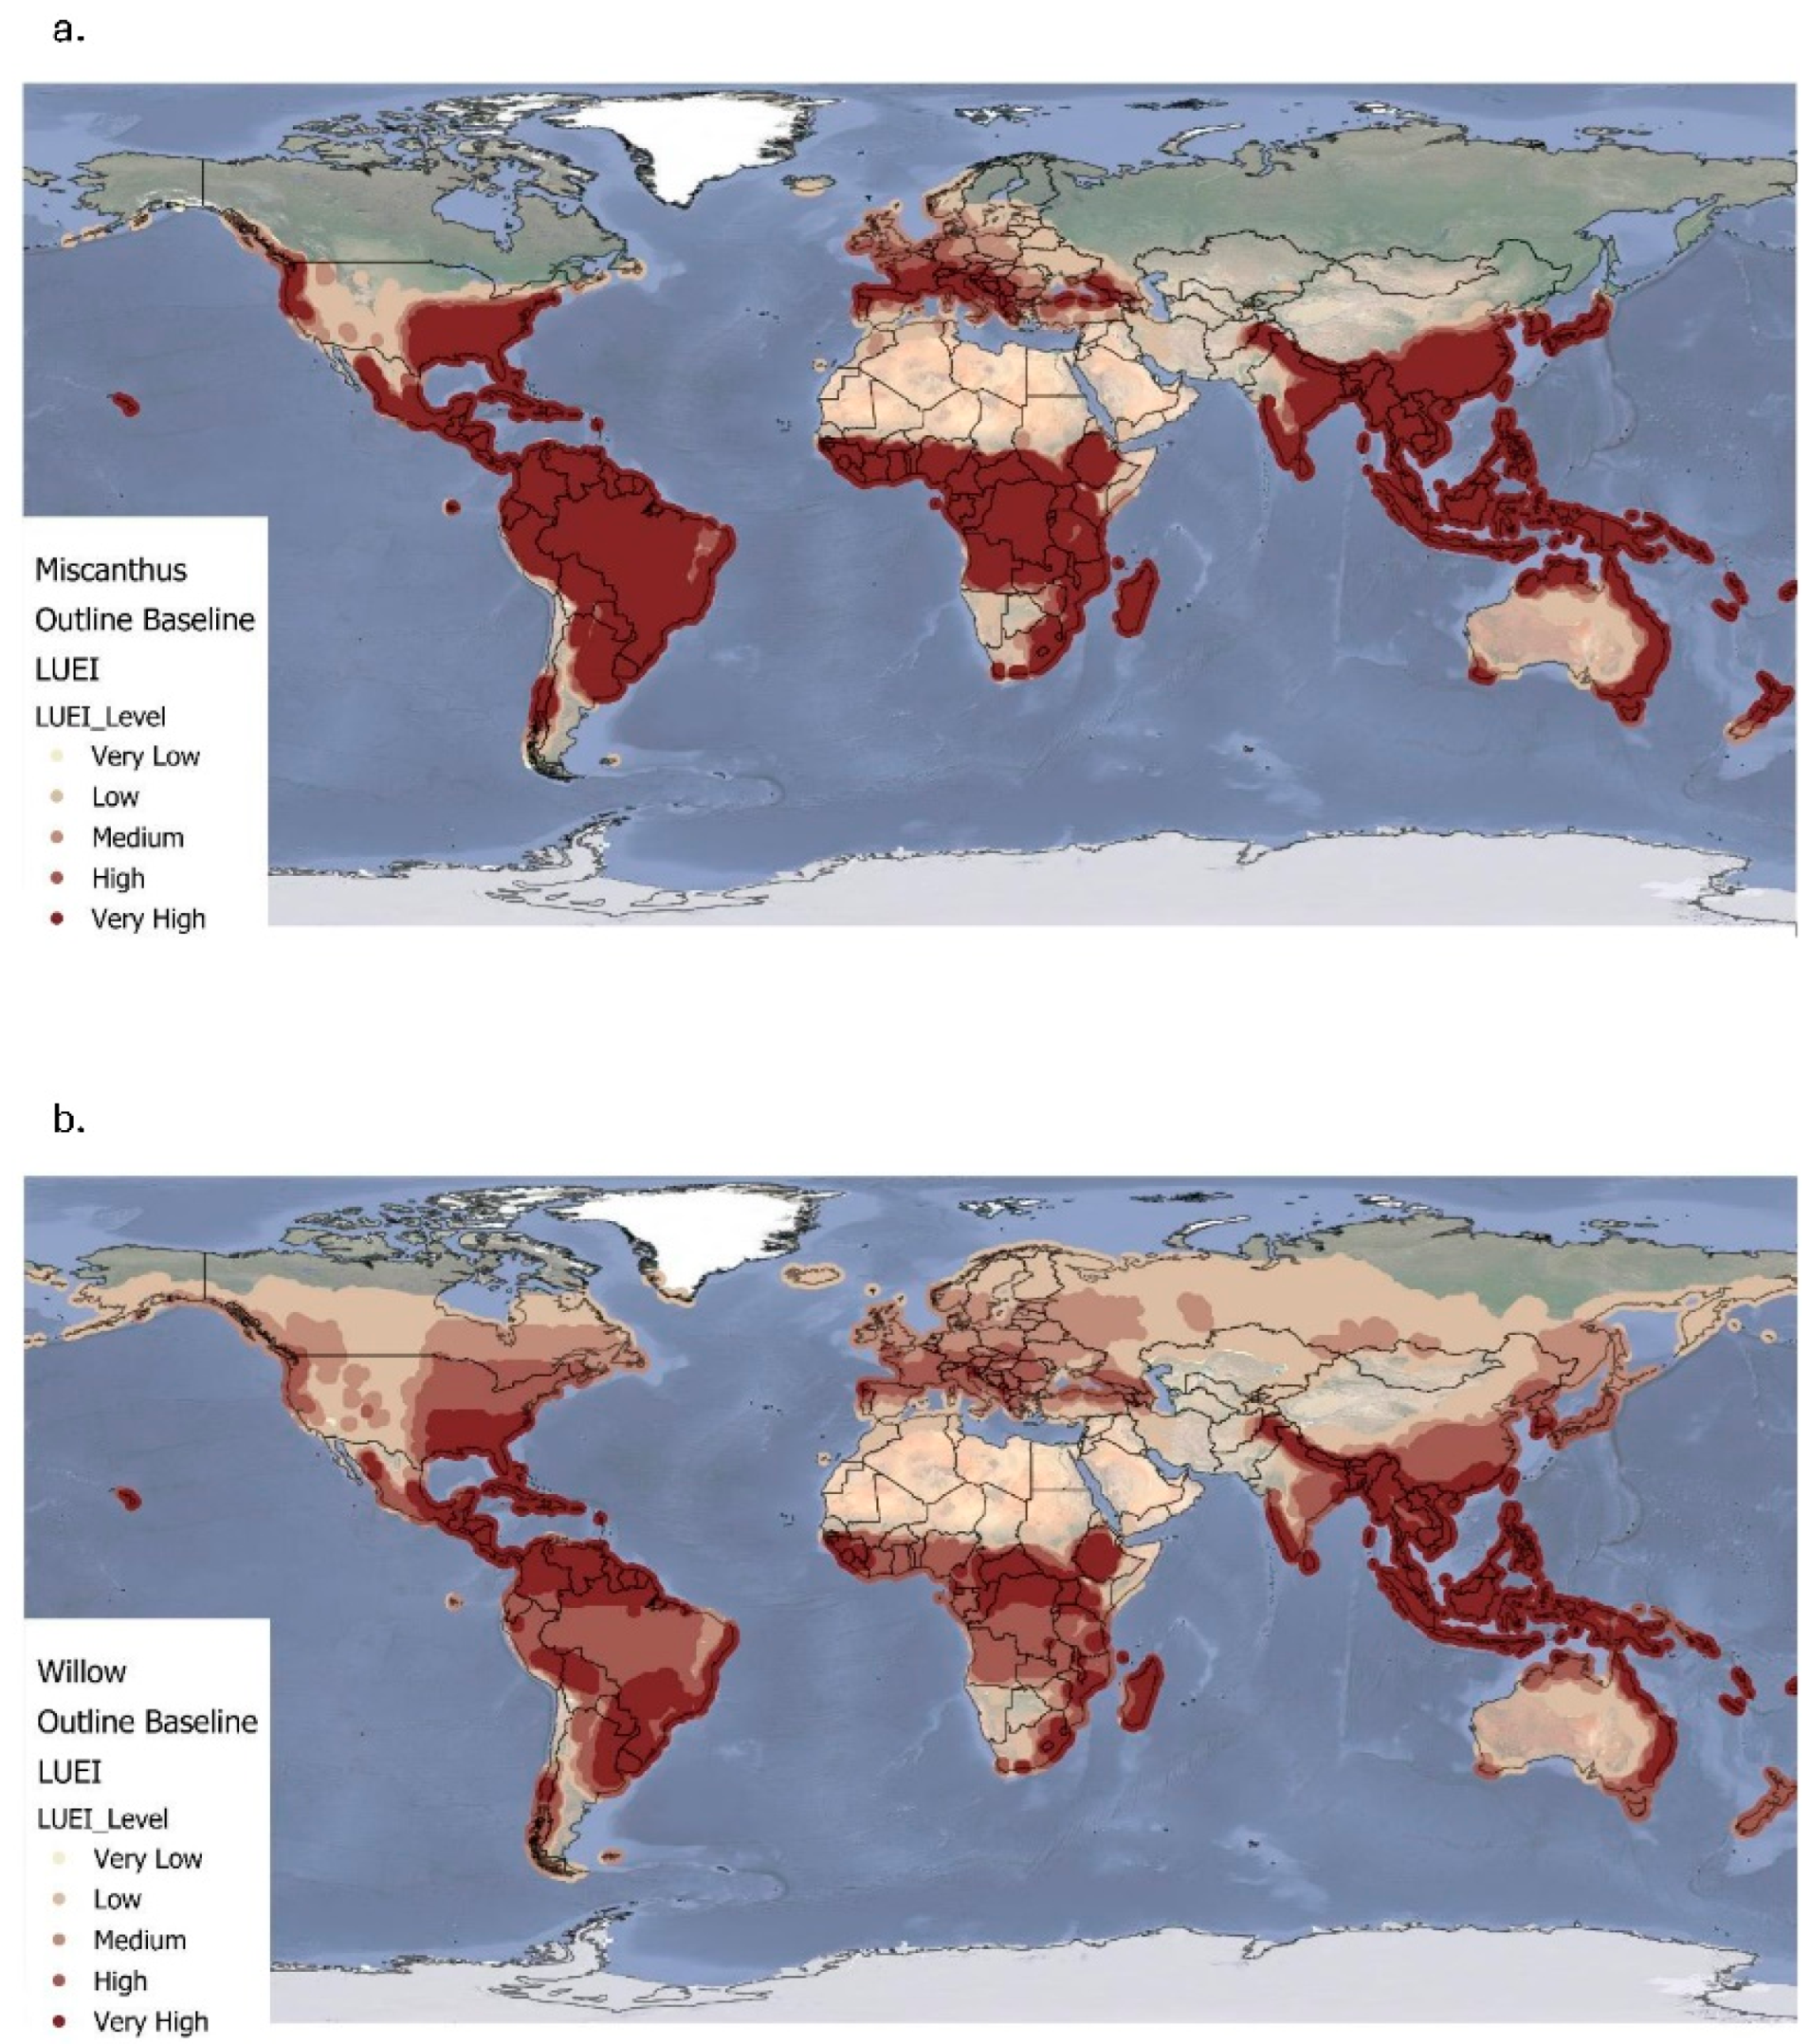
Figure 2.
Regional land use energy intensity of Miscanthus (blue) and Willow (green) under baseline conditions (1961–1990). Error bars represent standard deviation (SD).
Figure 2.
Regional land use energy intensity of Miscanthus (blue) and Willow (green) under baseline conditions (1961–1990). Error bars represent standard deviation (SD).
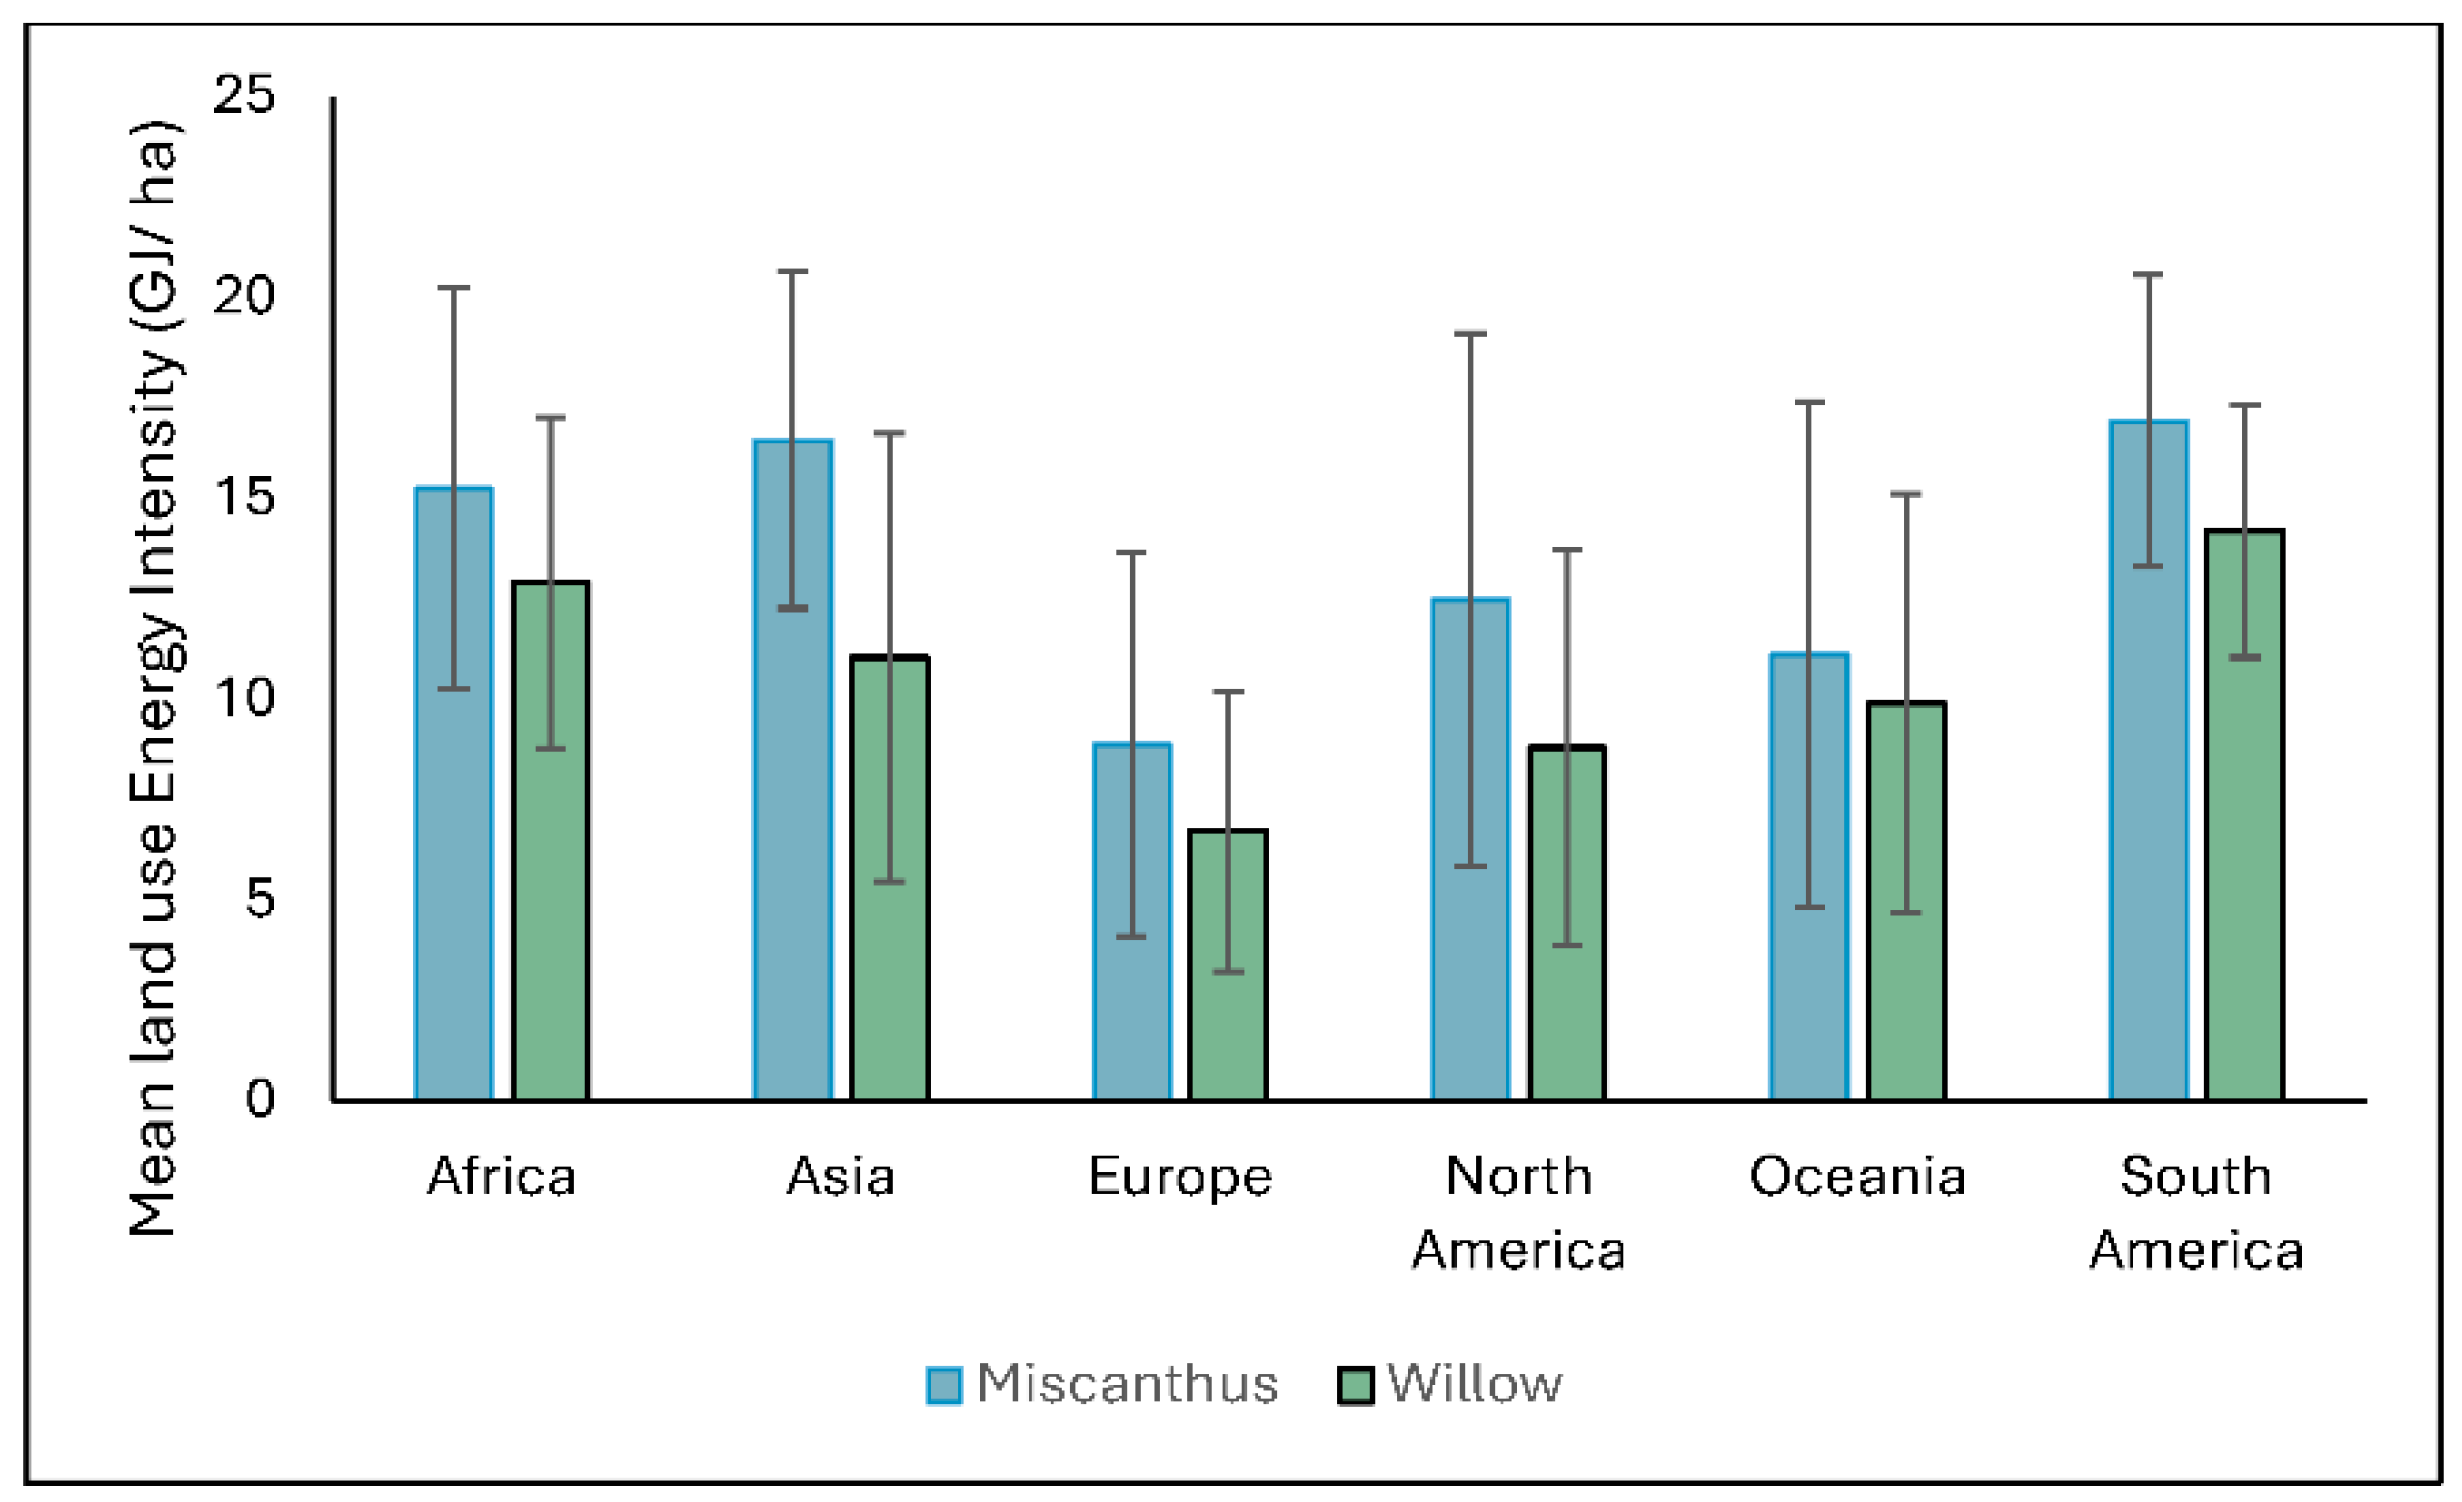
Figure 3.
Simulated global land use energy intensity (GJ/ha) for Miscanthus at the B1 (a) and A1FI (b) climate projections (up to 2060). Very low ≤ 0.00; low = 0.00–100; medium = 100- 200; high = 200-300; very high ≥ 300.
Figure 3.
Simulated global land use energy intensity (GJ/ha) for Miscanthus at the B1 (a) and A1FI (b) climate projections (up to 2060). Very low ≤ 0.00; low = 0.00–100; medium = 100- 200; high = 200-300; very high ≥ 300.
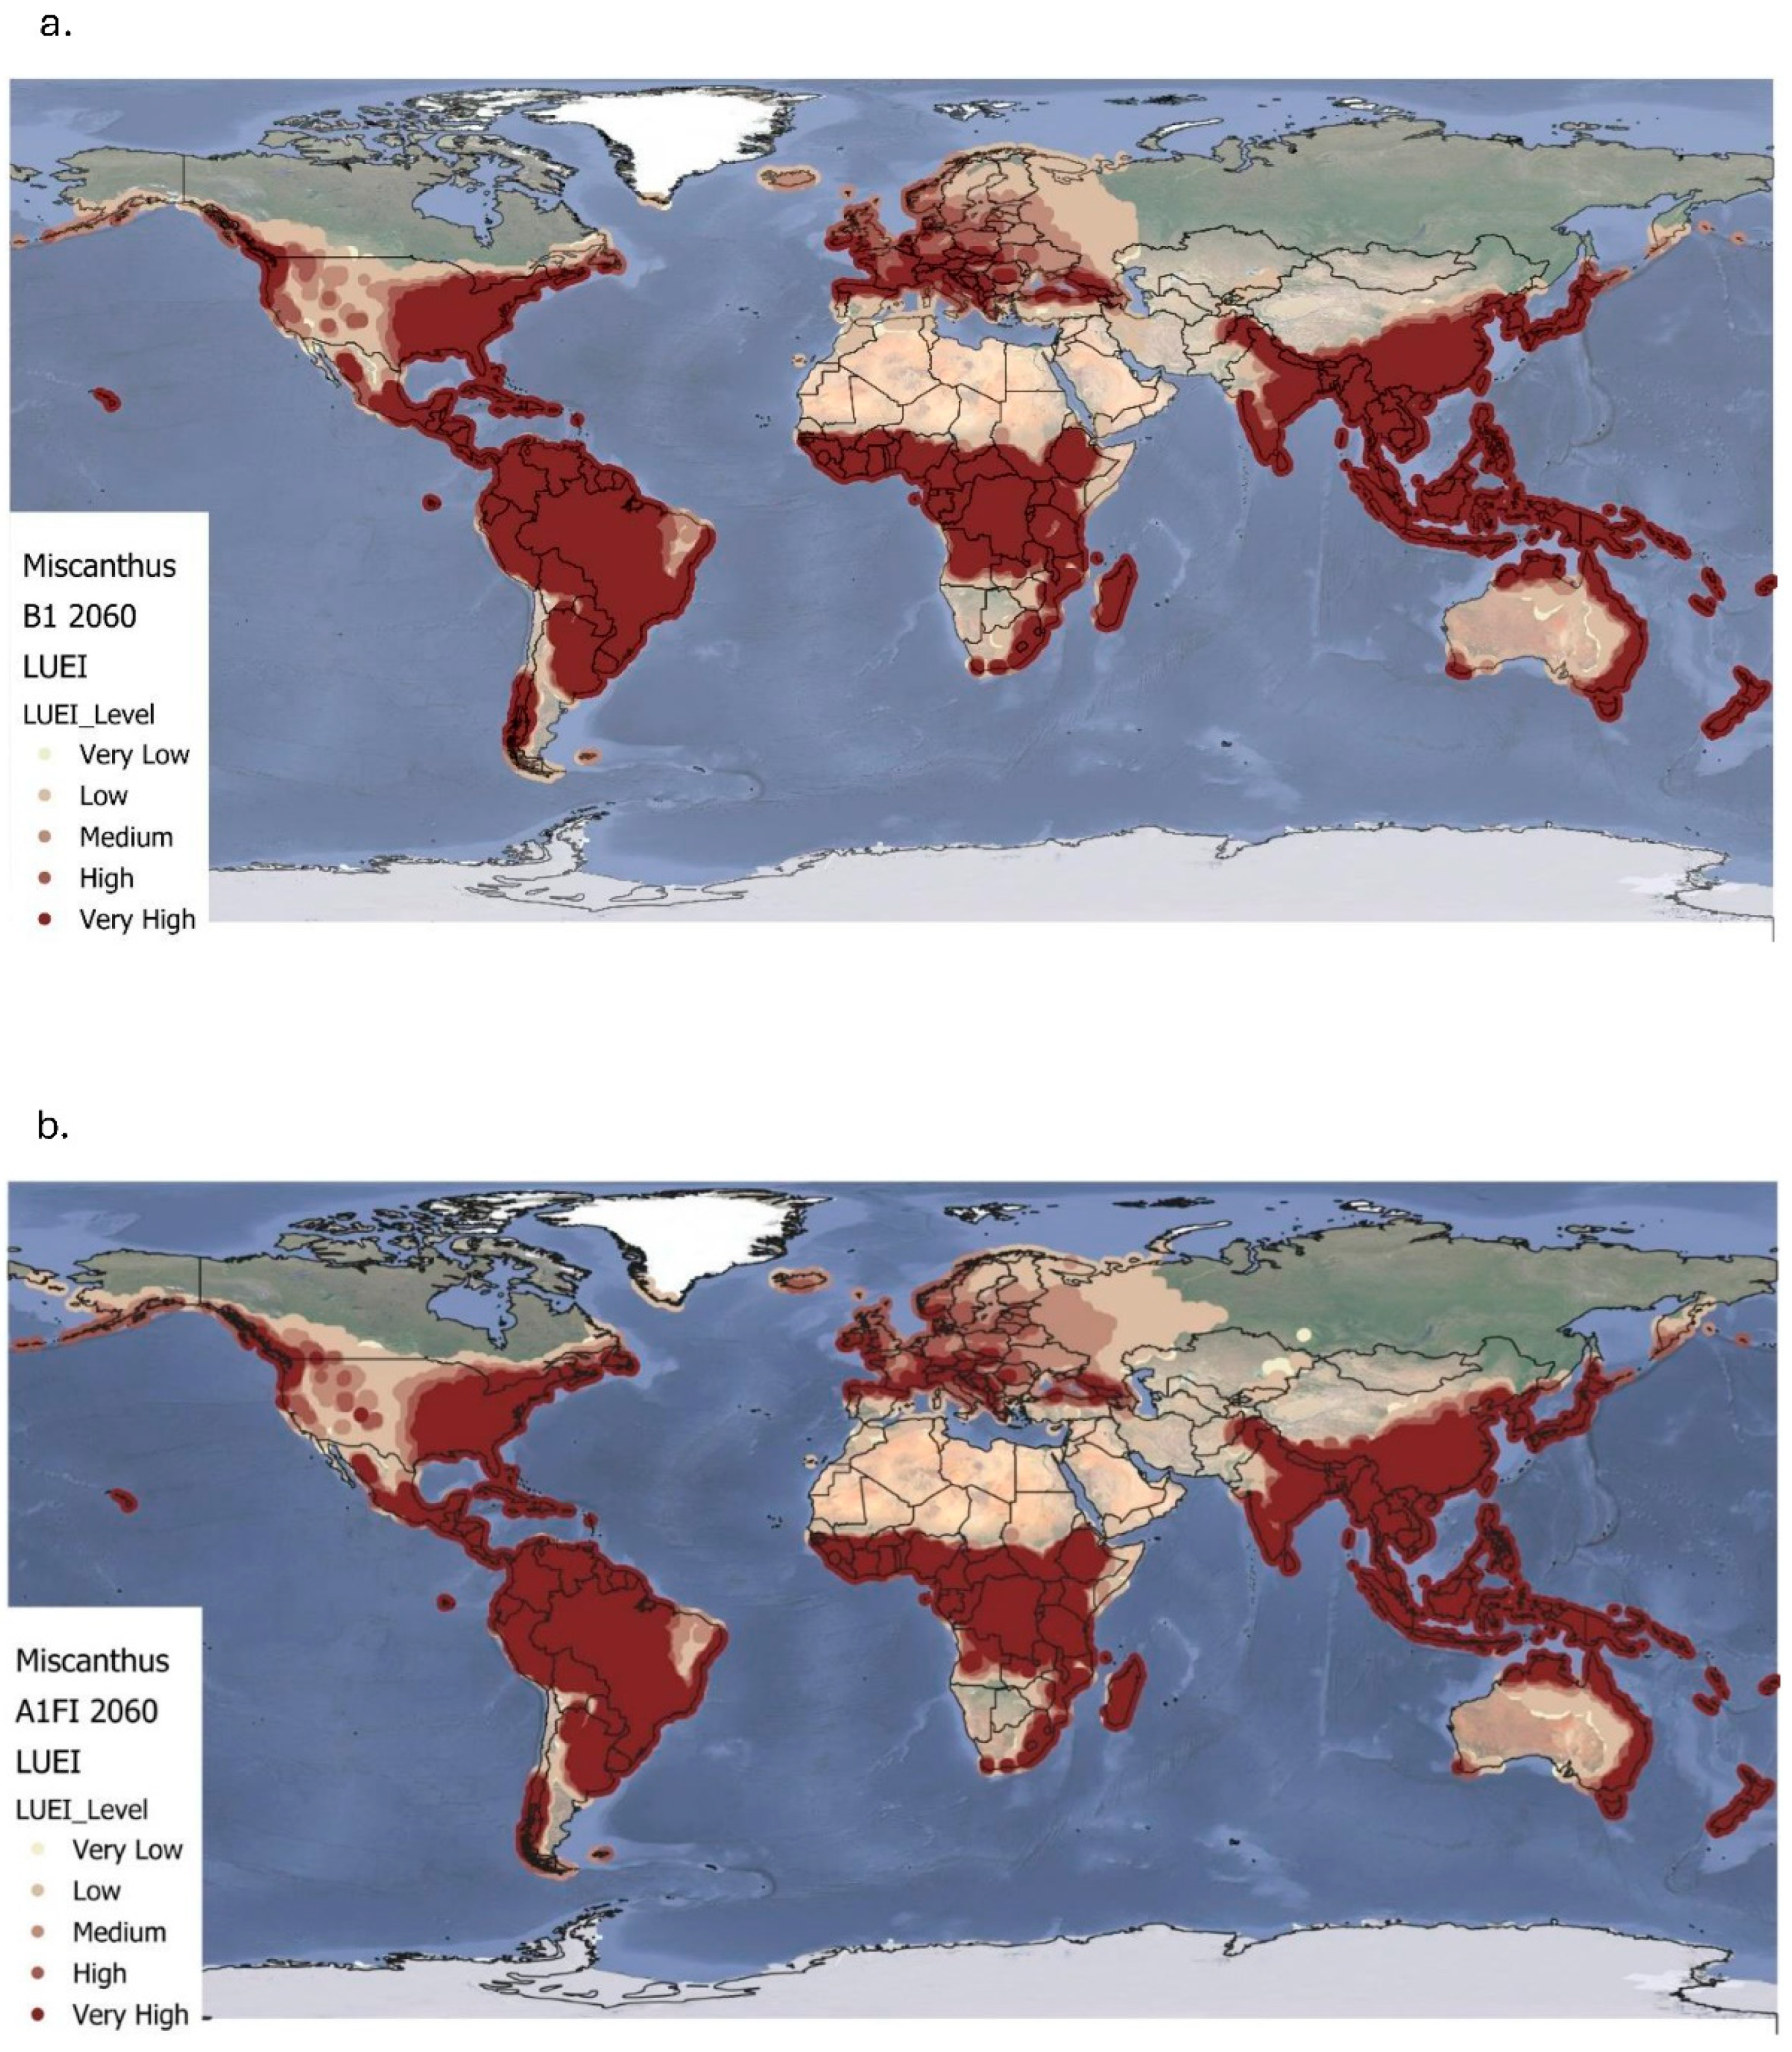
Figure 4.
Simulated global land use energy intensity (GJ/ha) for Willow at the B1 (a) and A1FI (b) climate projections (up to 2060). Very low ≤ 0.00; low = 0.00–100; medium = 100-200; high = 200-300; very high ≥ 300.
Figure 4.
Simulated global land use energy intensity (GJ/ha) for Willow at the B1 (a) and A1FI (b) climate projections (up to 2060). Very low ≤ 0.00; low = 0.00–100; medium = 100-200; high = 200-300; very high ≥ 300.
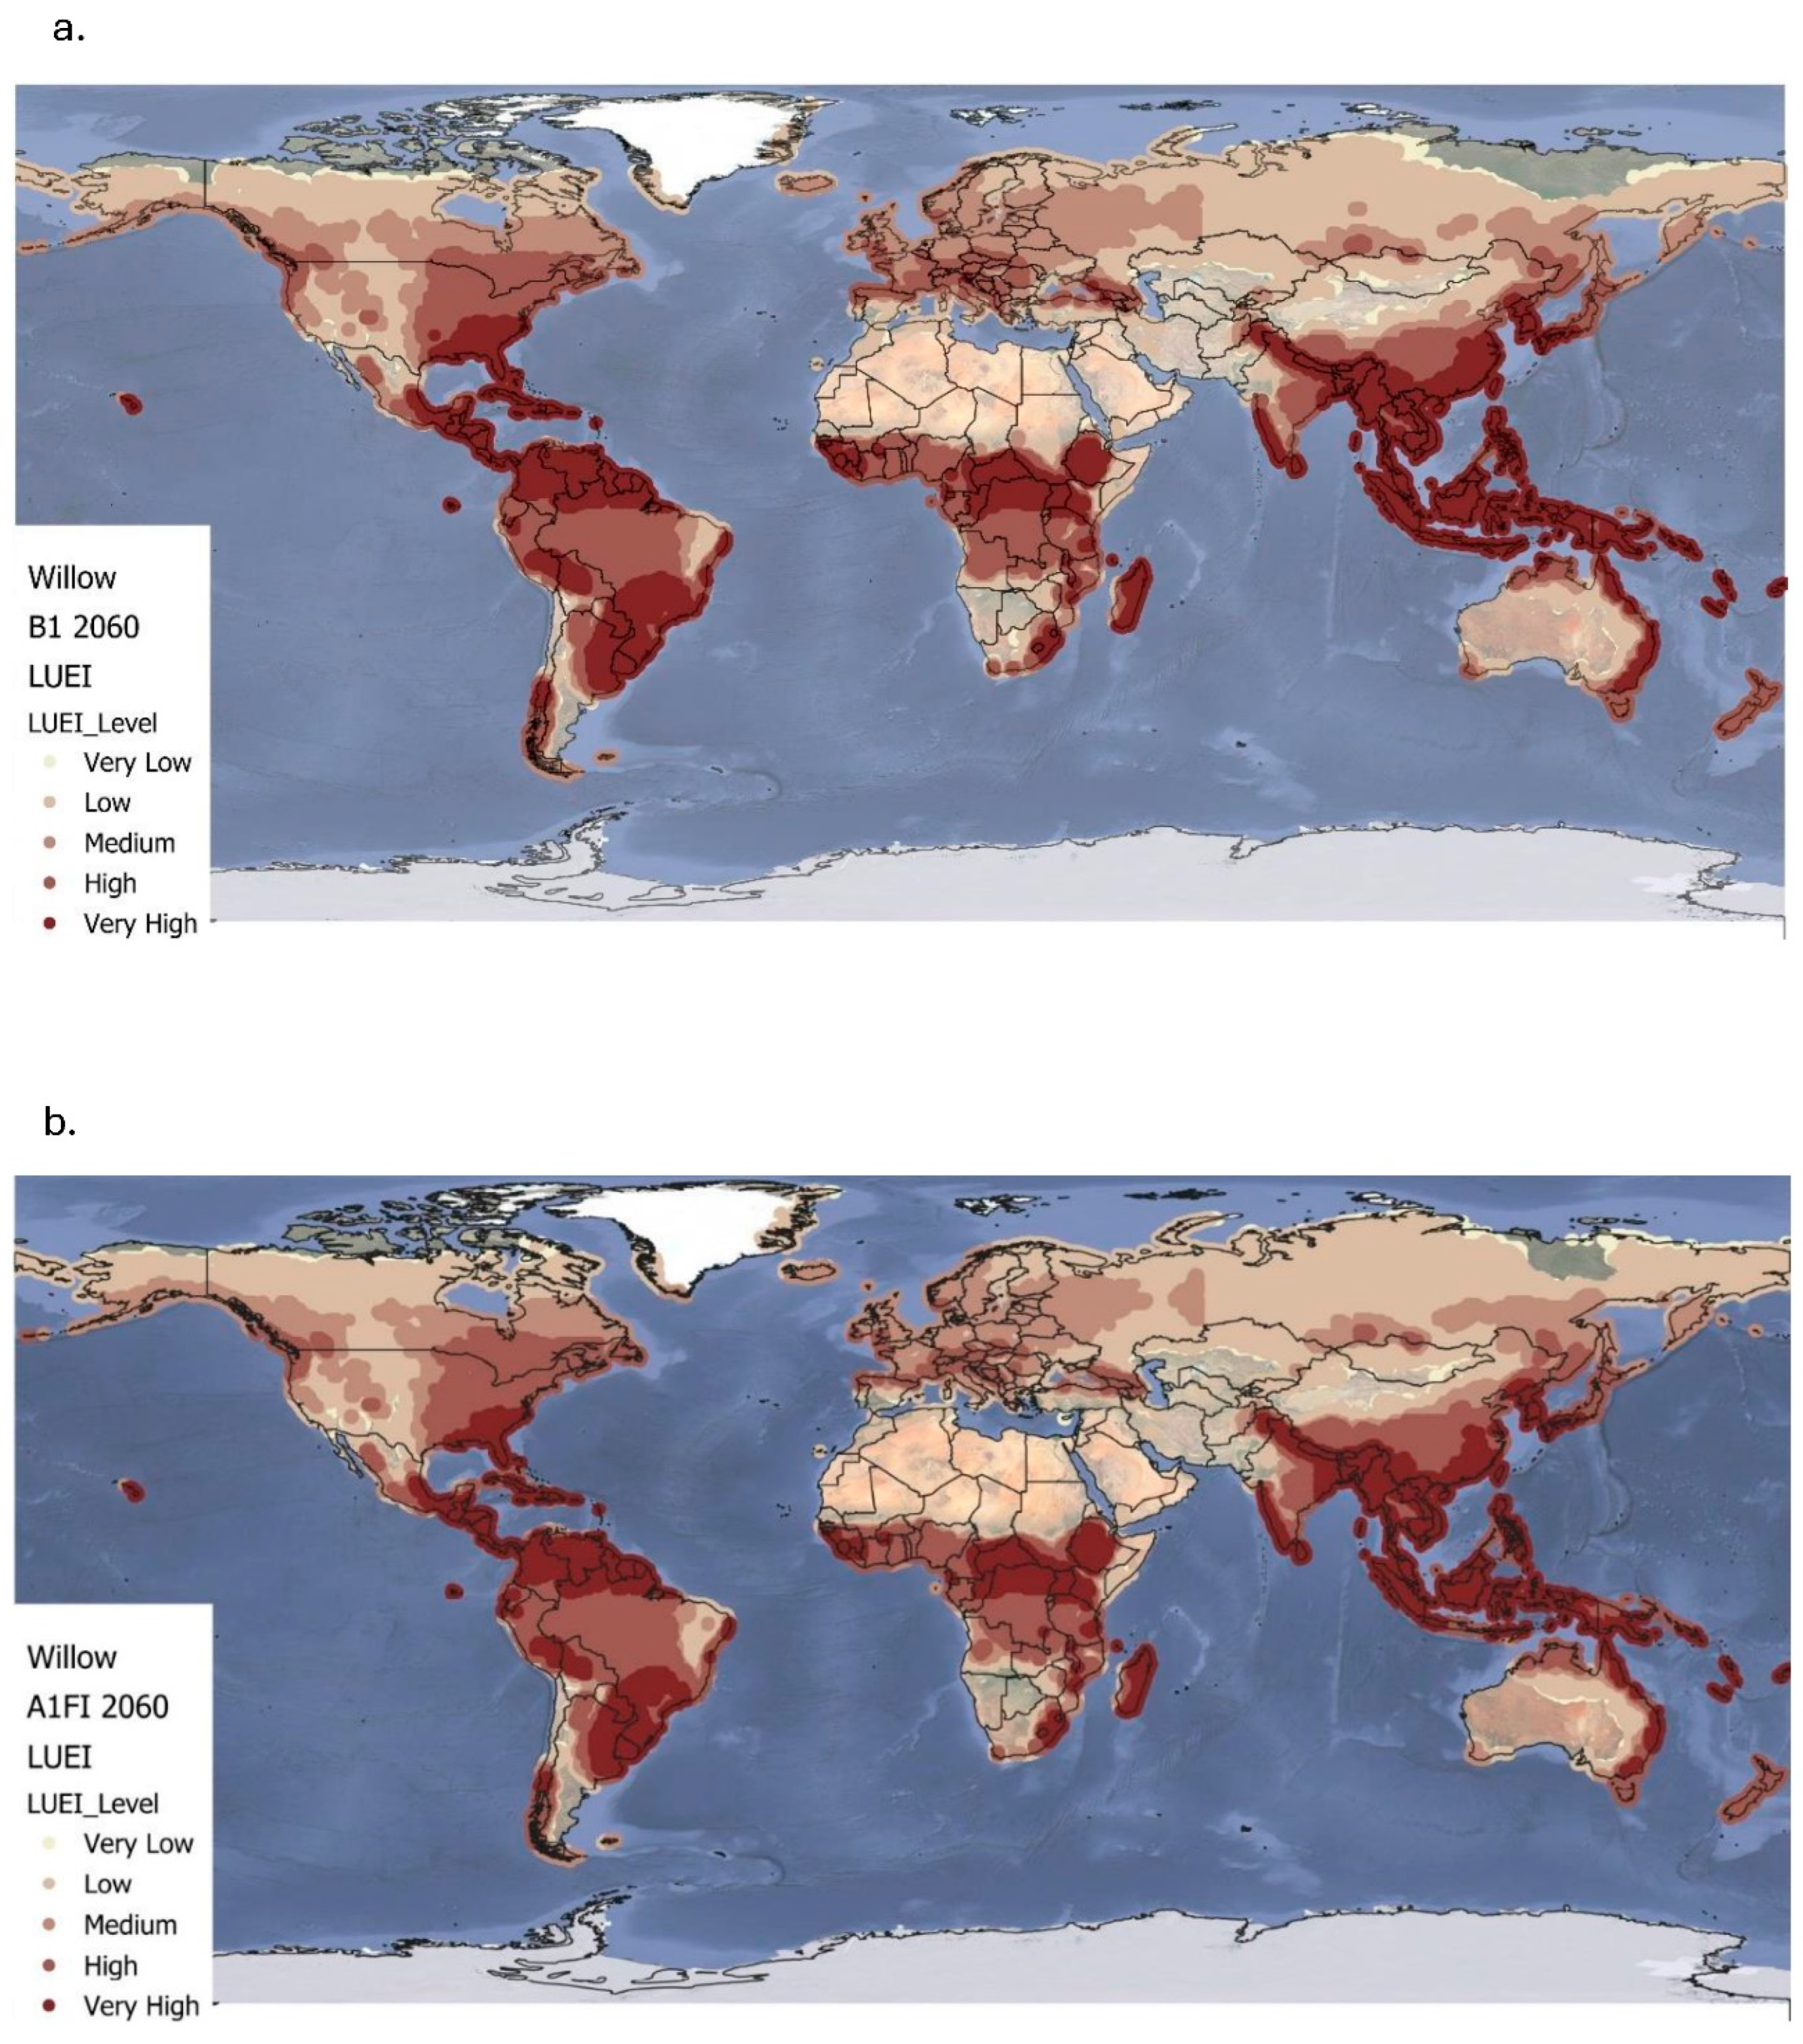
Figure 5.
Energy use efficiency (EUE) of Miscanthus for two transportation levels (50 km and 500 km) at baseline (1961-1990). Very low= < 5; low= 5.00 – 9.99; medium=10.00 – 14.99; high= 15.00 – 20.00.
Figure 5.
Energy use efficiency (EUE) of Miscanthus for two transportation levels (50 km and 500 km) at baseline (1961-1990). Very low= < 5; low= 5.00 – 9.99; medium=10.00 – 14.99; high= 15.00 – 20.00.
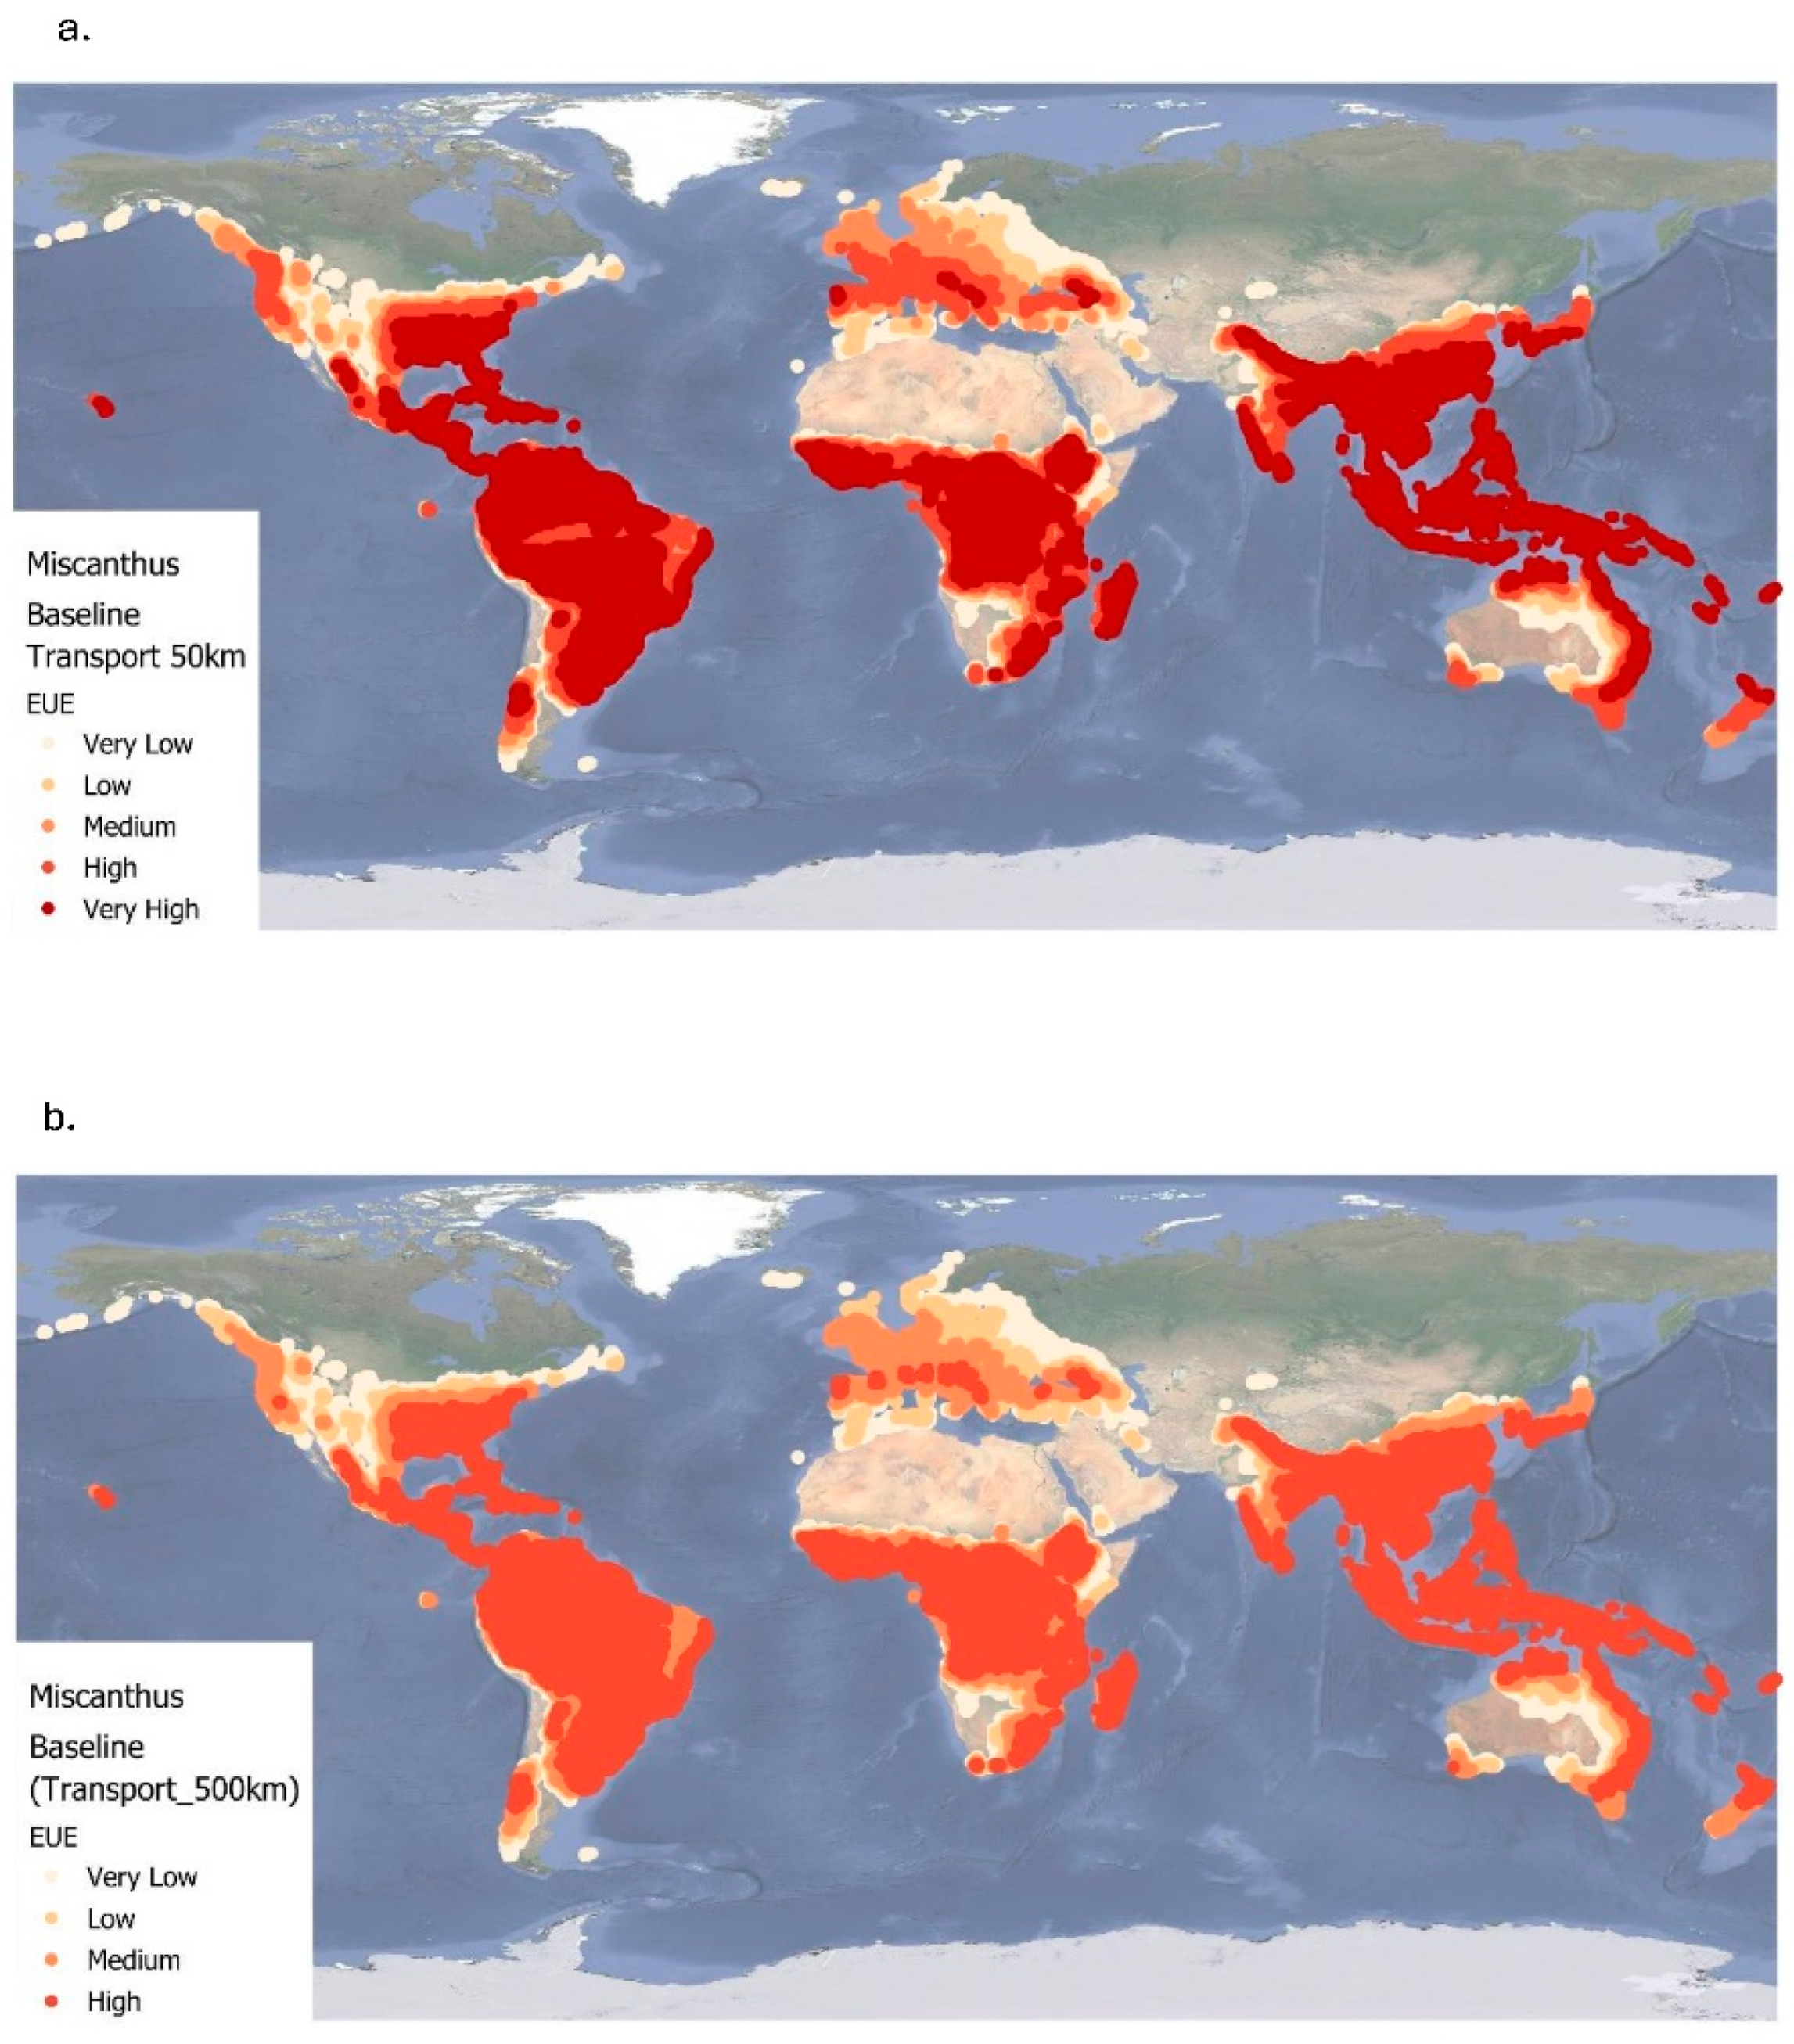
Figure 6.
Regional energy use efficiency at transport distances of 50 km (blue) and 500 km (green) under baseline conditions (1961–1990). Error bars represent standard deviation (SD).
Figure 6.
Regional energy use efficiency at transport distances of 50 km (blue) and 500 km (green) under baseline conditions (1961–1990). Error bars represent standard deviation (SD).
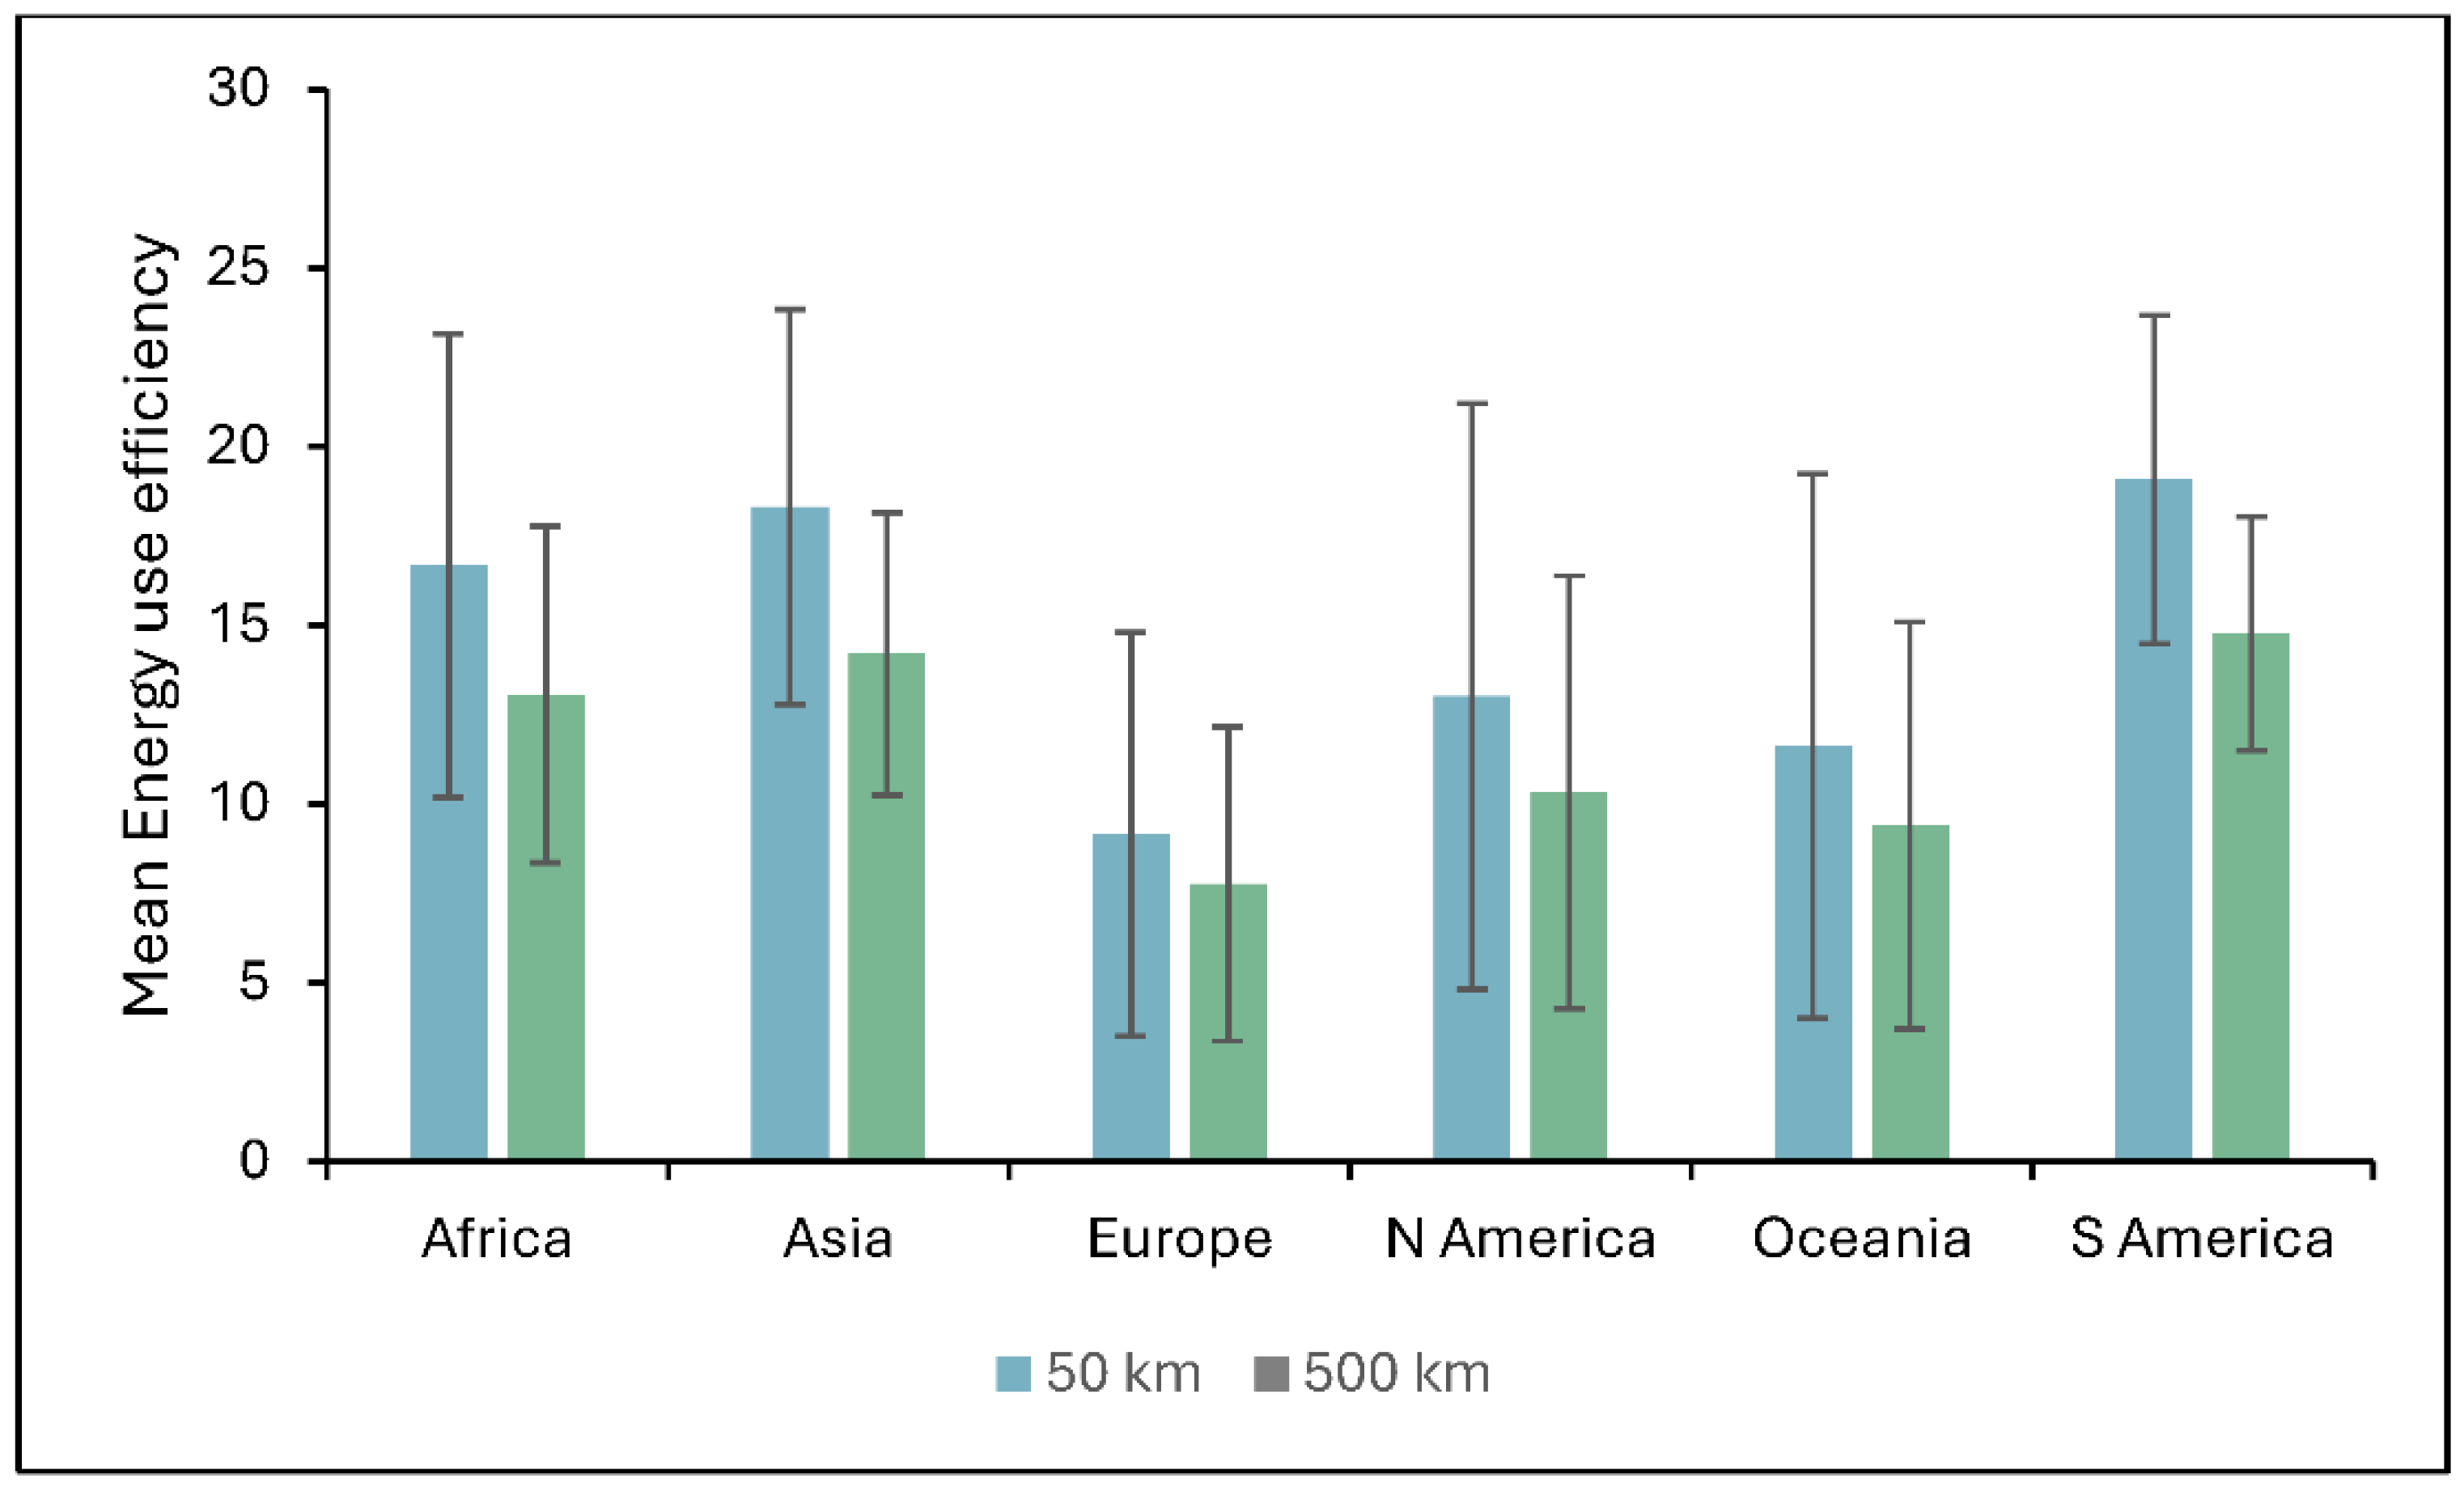
Figure 7.
Energy use efficiency (EUE) of Miscanthus for two transportation levels (50 km and 500 km) at B1up to 2060. Very low= < 5; low= 5.00 – 9.99; medium=10.00 – 14.99; high= 15.00 – 20.00.
Figure 7.
Energy use efficiency (EUE) of Miscanthus for two transportation levels (50 km and 500 km) at B1up to 2060. Very low= < 5; low= 5.00 – 9.99; medium=10.00 – 14.99; high= 15.00 – 20.00.
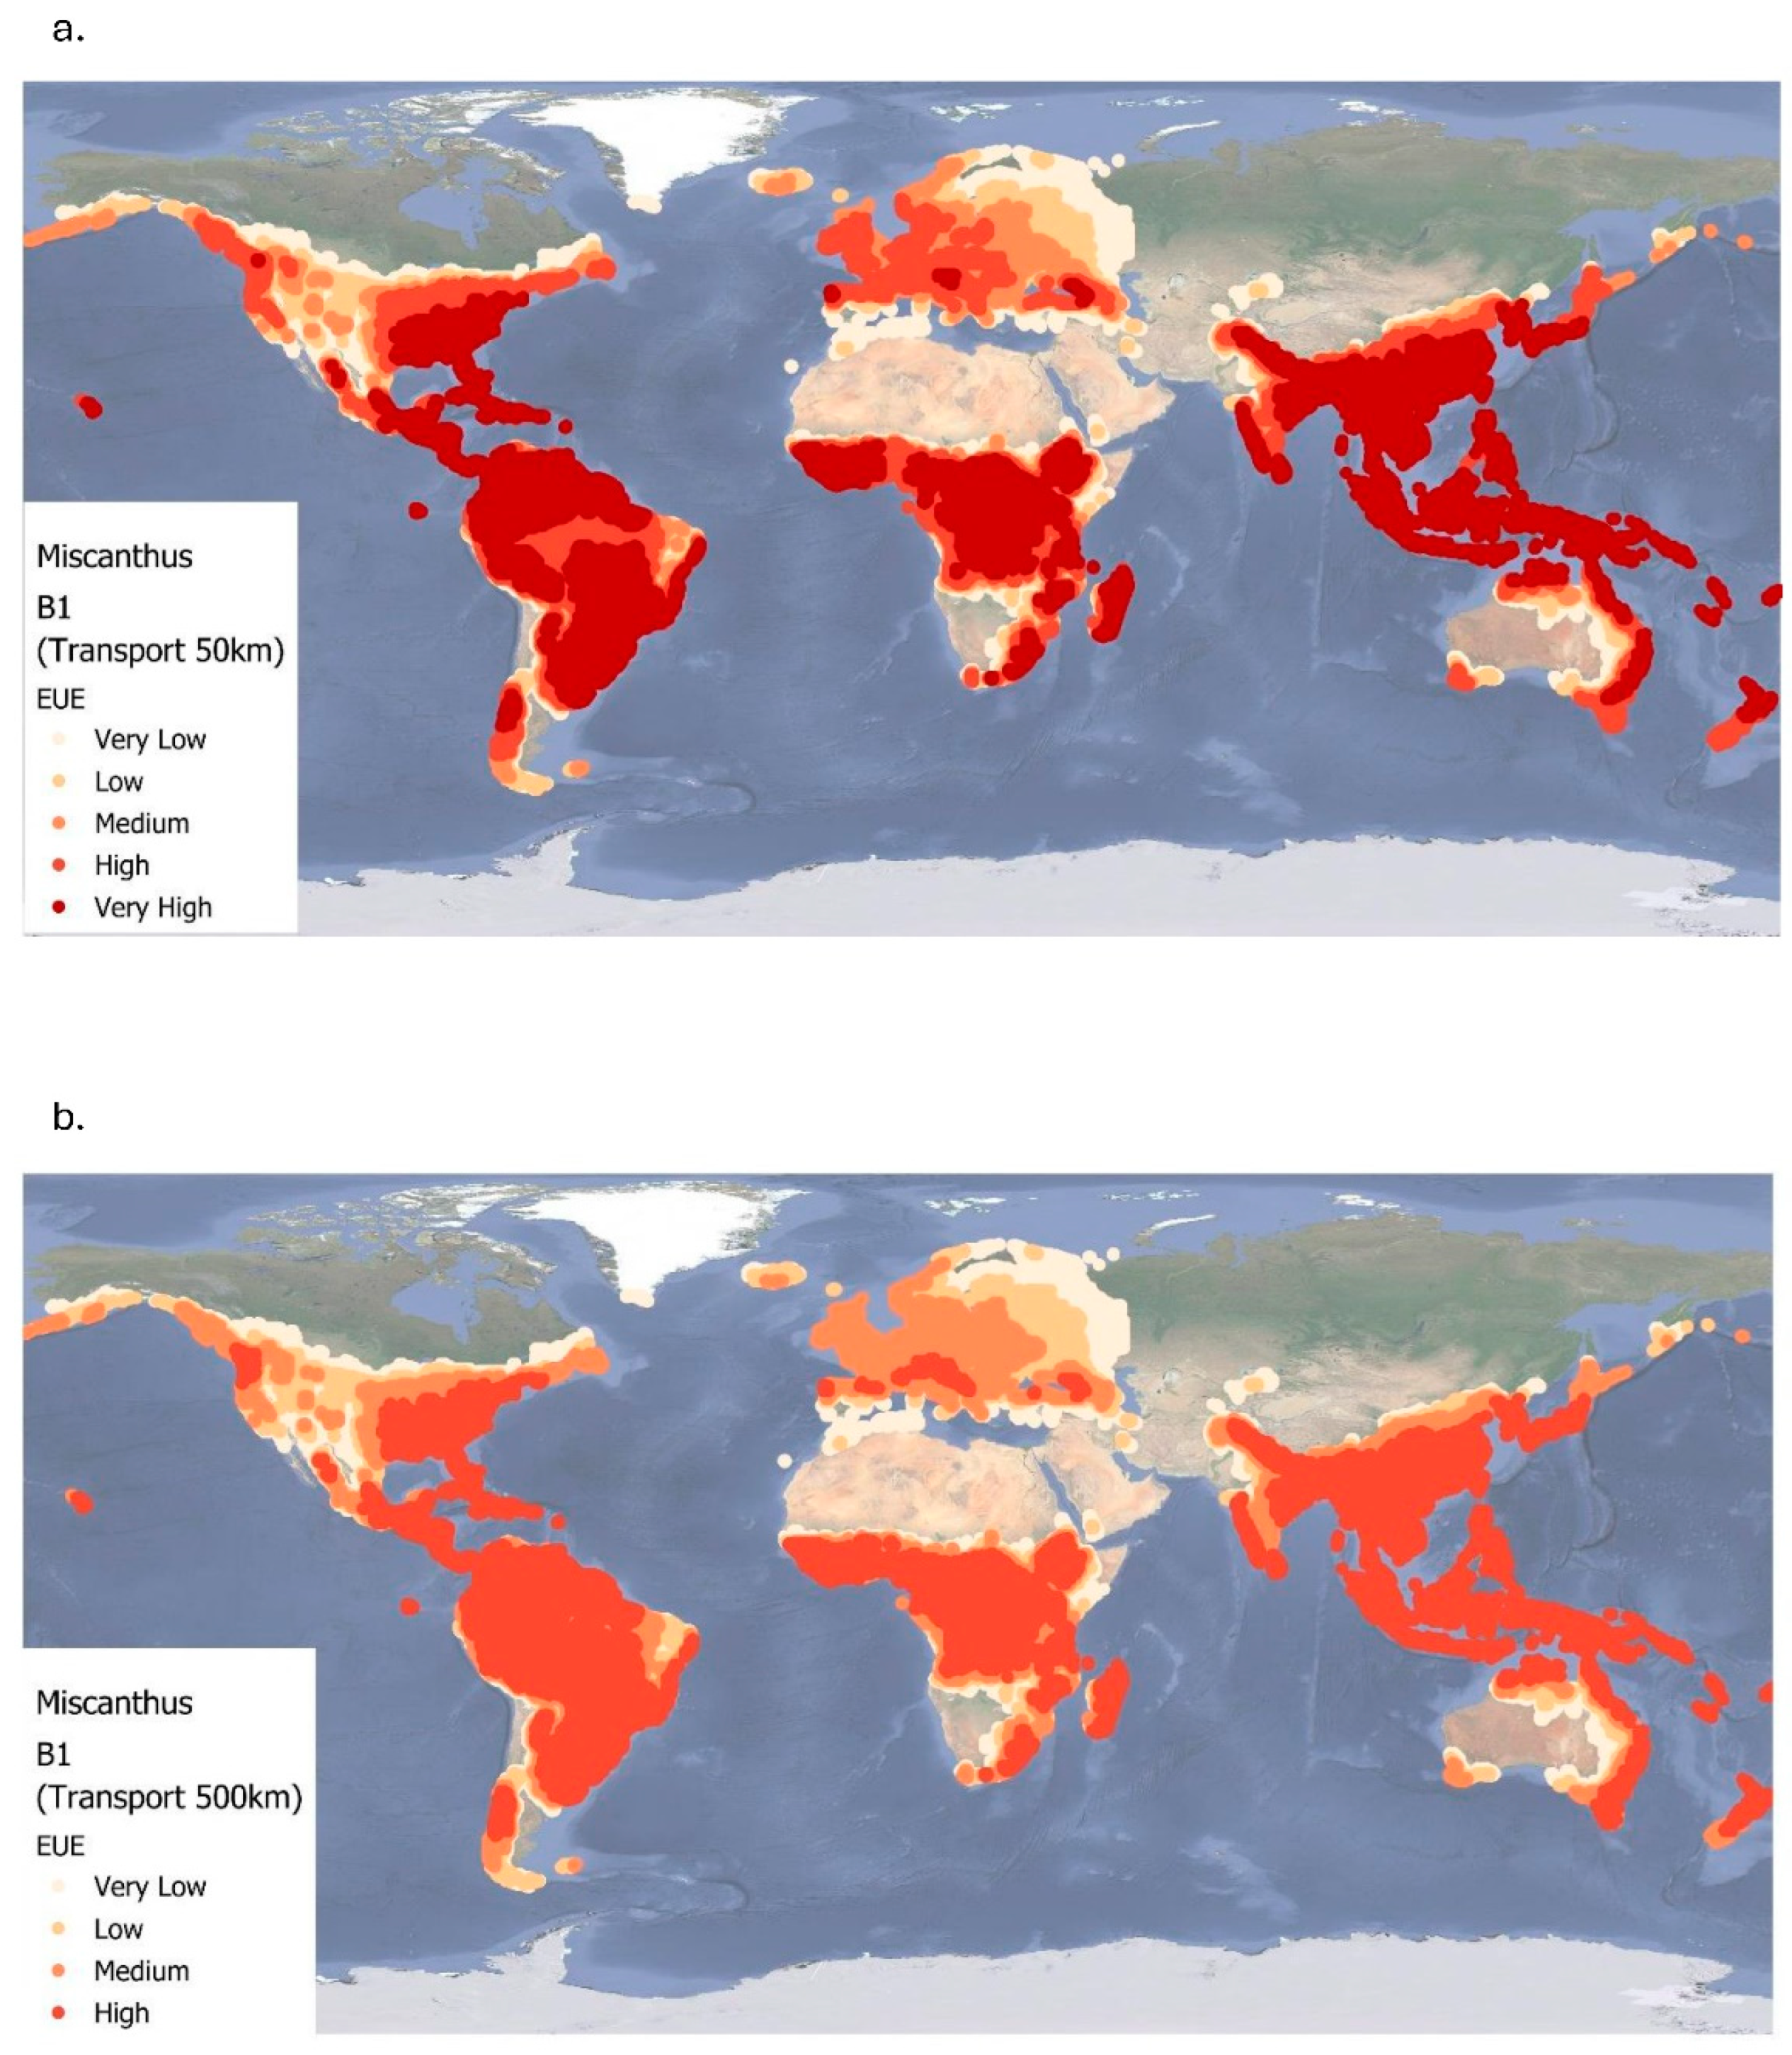
Figure 8.
Energy use efficiency (EUE) of Miscanthus for two transportation levels (50 km and 500 km) at A1FI up to 2060. Very low= < 5; low= 5.00 – 9.99; medium=10.00 – 14.99; high= 15.00 – 20.00.
Figure 8.
Energy use efficiency (EUE) of Miscanthus for two transportation levels (50 km and 500 km) at A1FI up to 2060. Very low= < 5; low= 5.00 – 9.99; medium=10.00 – 14.99; high= 15.00 – 20.00.
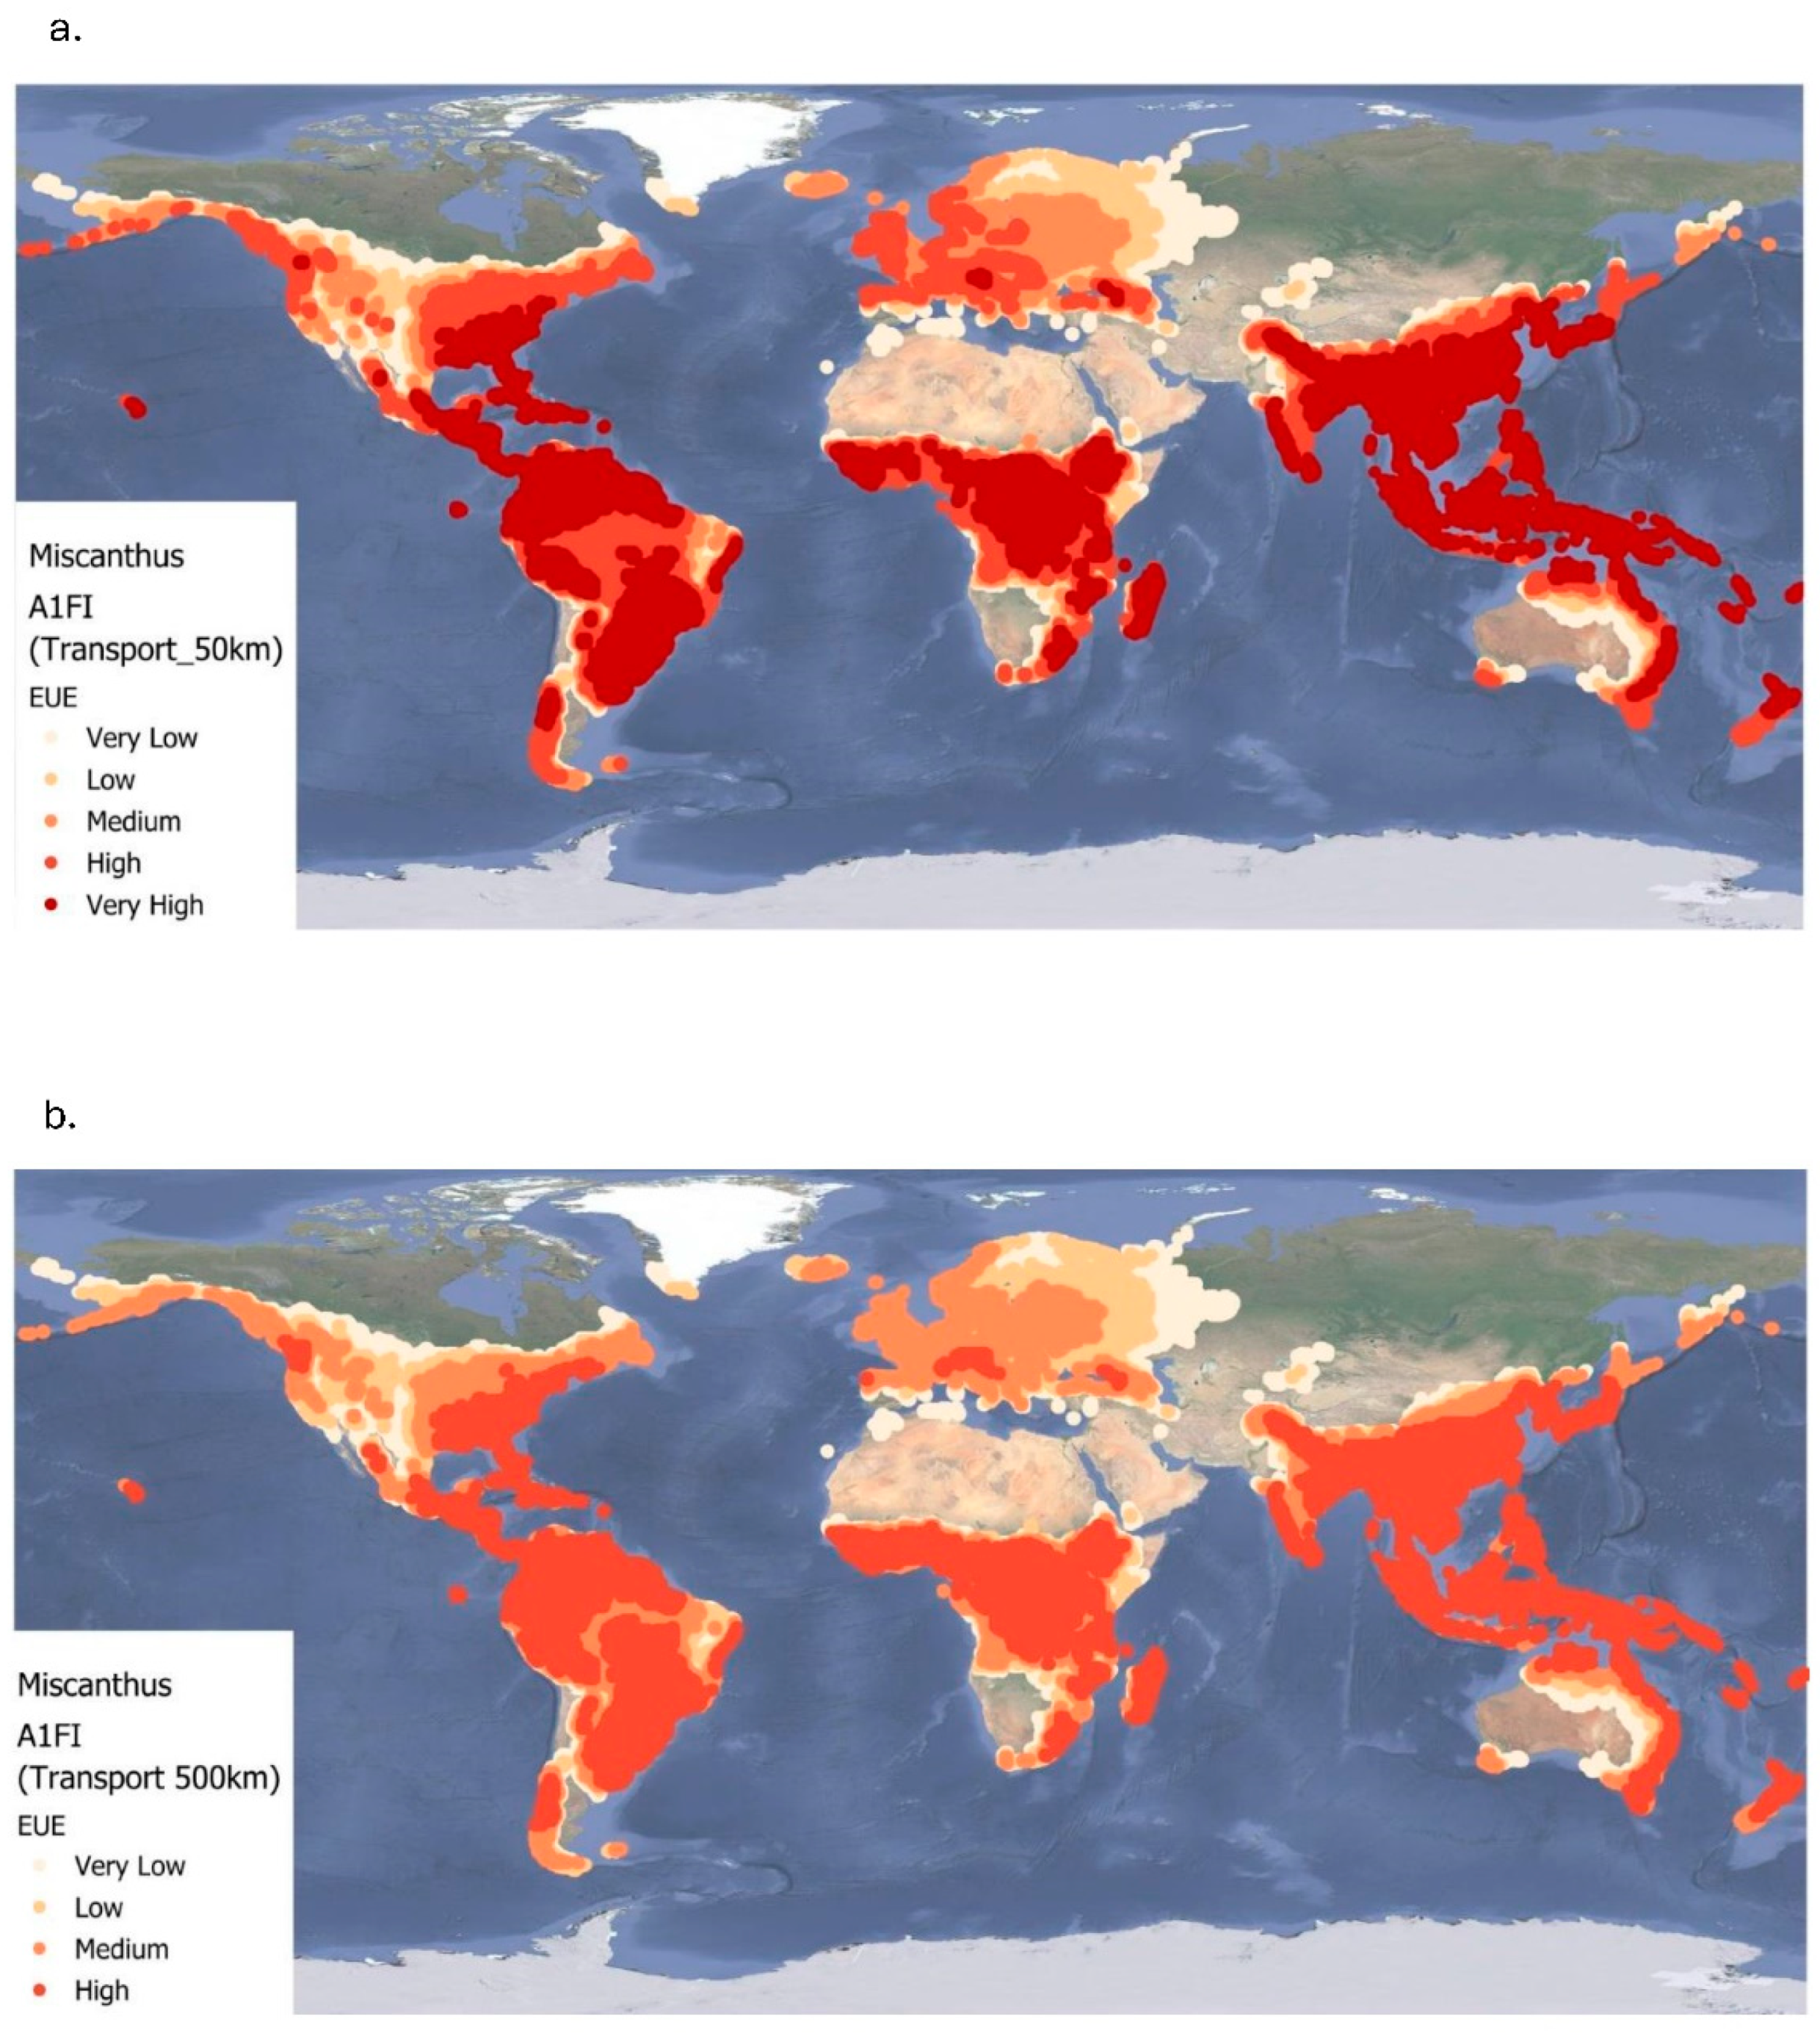
Figure 9.
Changes of soil organic carbon due to cultivation of Miscanthus under baseline (a; 1961-1990) and future climate projections: B1 (b) and A1FI (c). The SOC range varies from 2.89 to -5.47 t/ha.
Figure 9.
Changes of soil organic carbon due to cultivation of Miscanthus under baseline (a; 1961-1990) and future climate projections: B1 (b) and A1FI (c). The SOC range varies from 2.89 to -5.47 t/ha.
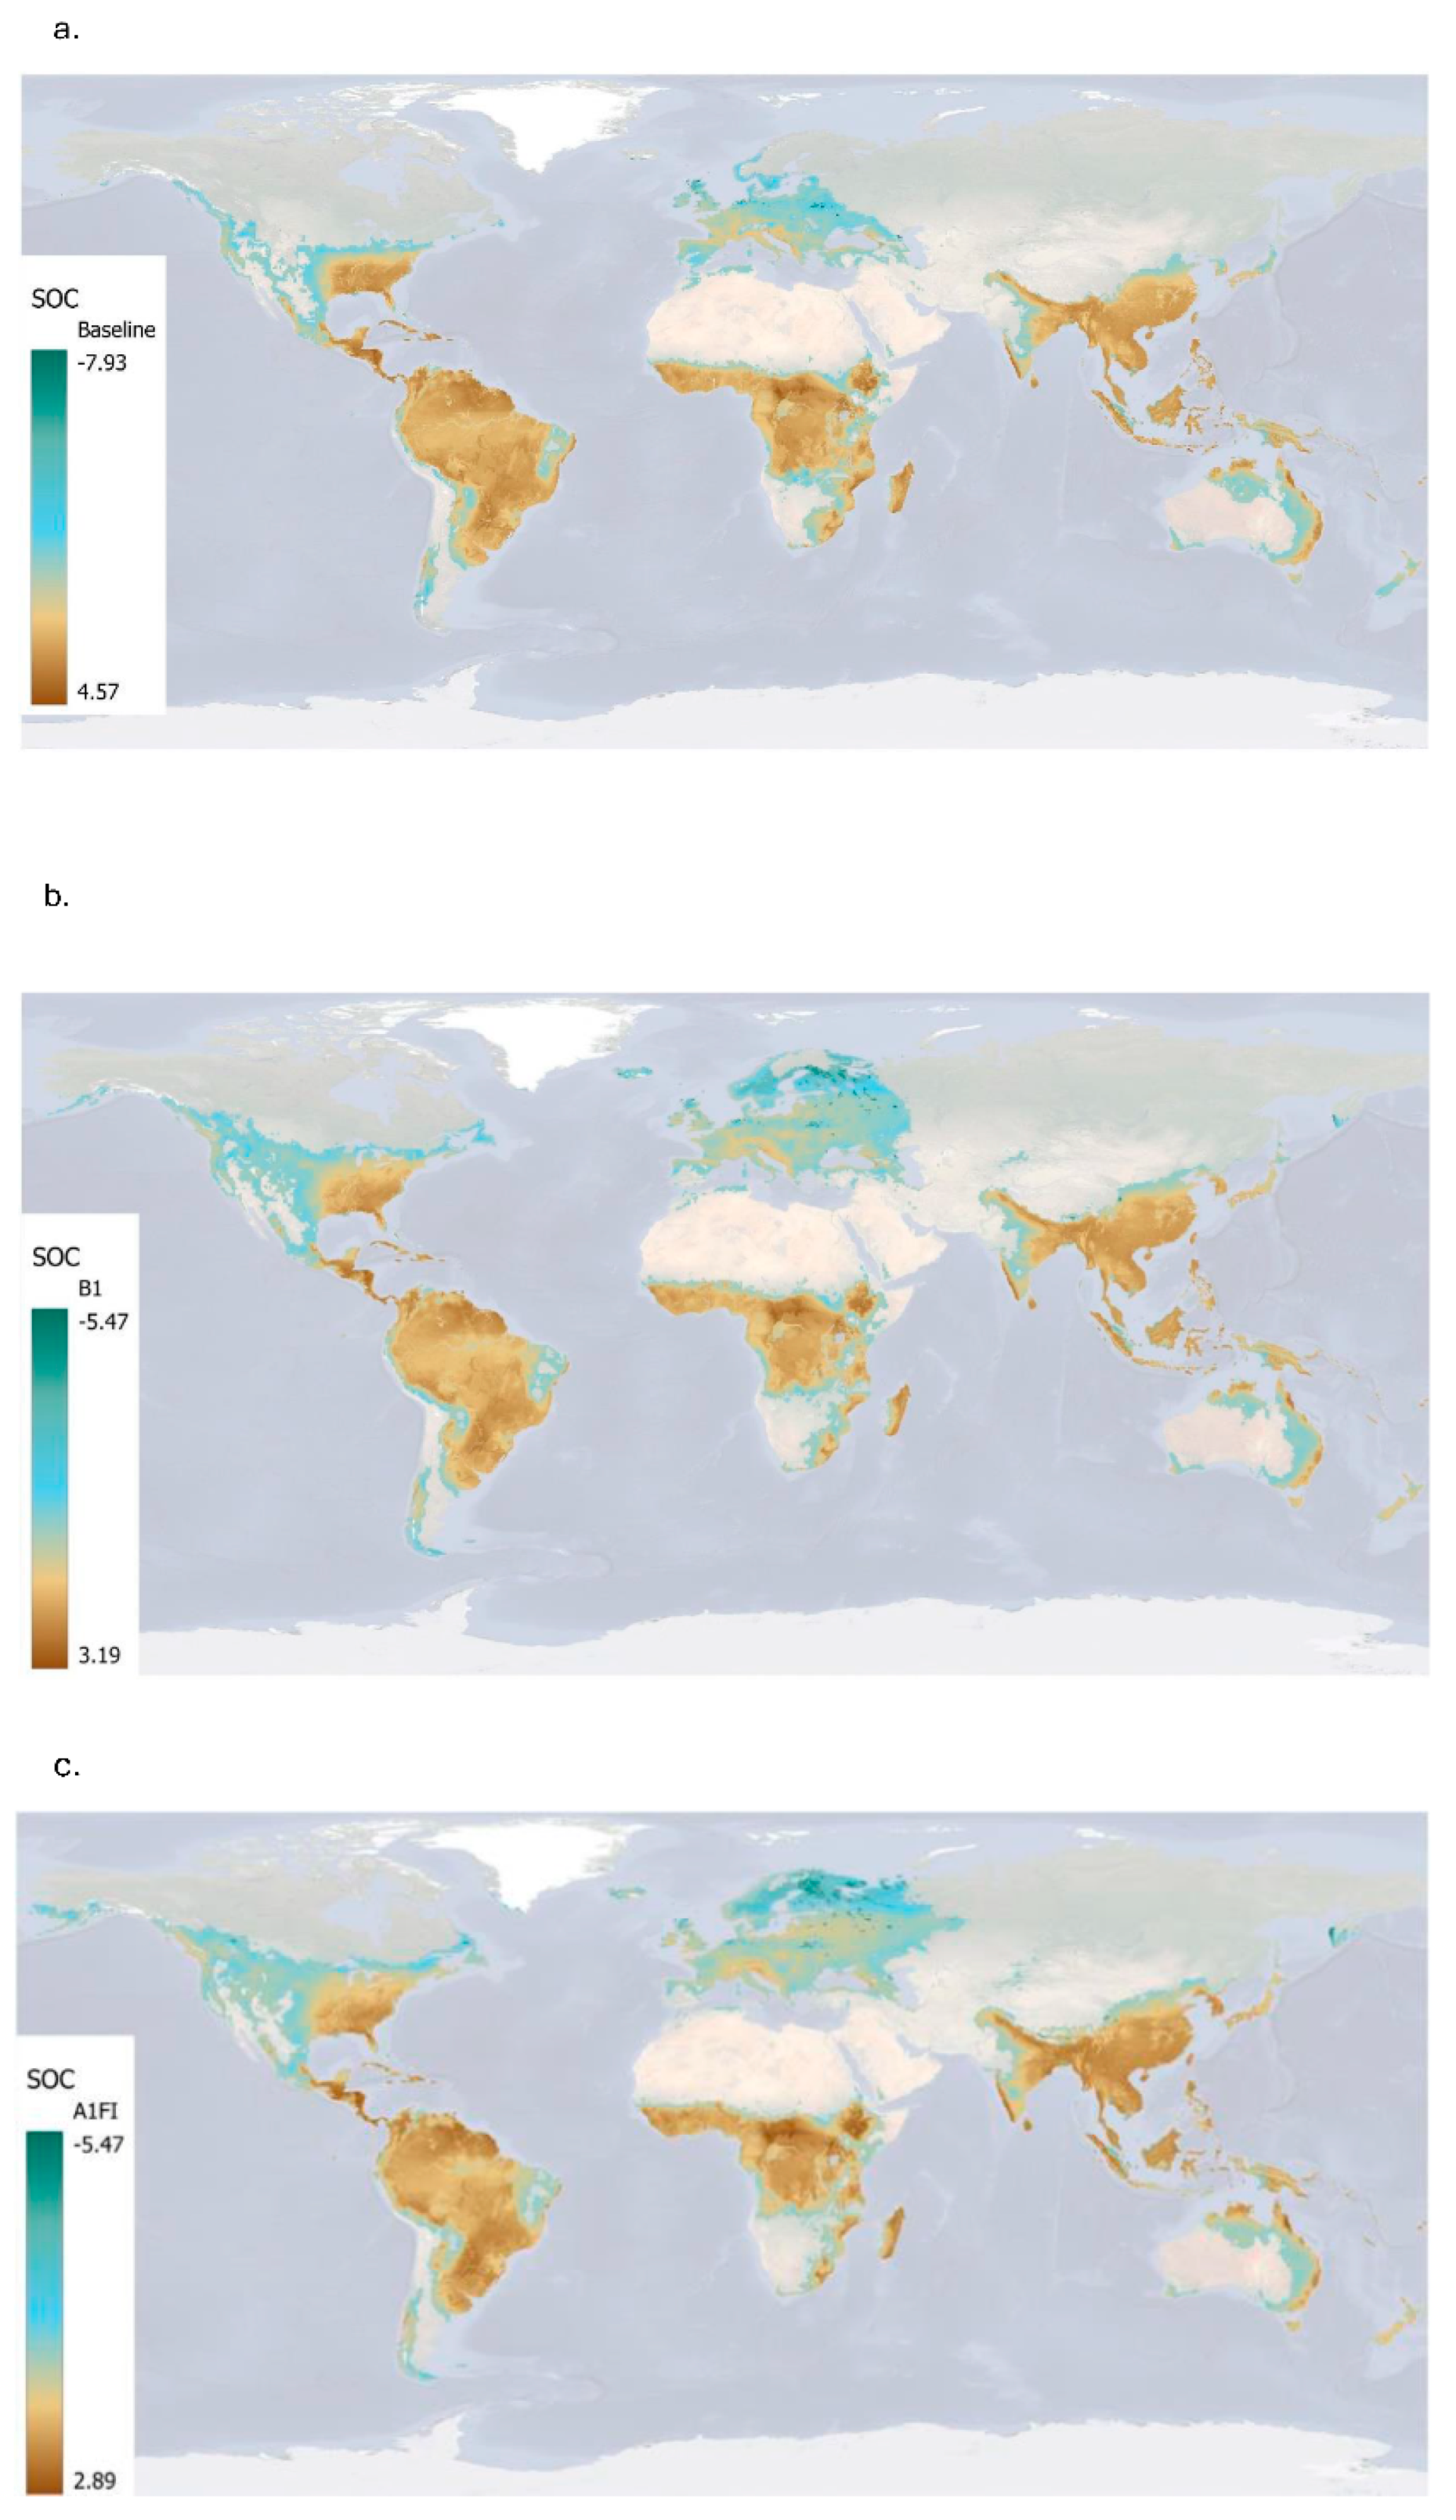
Figure 10.
Regional soil organic carbon (SOC) sequestration due to Miscanthus cultivation under the baseline climate (1961–1990) and two future climate scenarios (B1 and A1FI) projected to 2060. Error bars indicate standard deviation (SD).
Figure 10.
Regional soil organic carbon (SOC) sequestration due to Miscanthus cultivation under the baseline climate (1961–1990) and two future climate scenarios (B1 and A1FI) projected to 2060. Error bars indicate standard deviation (SD).
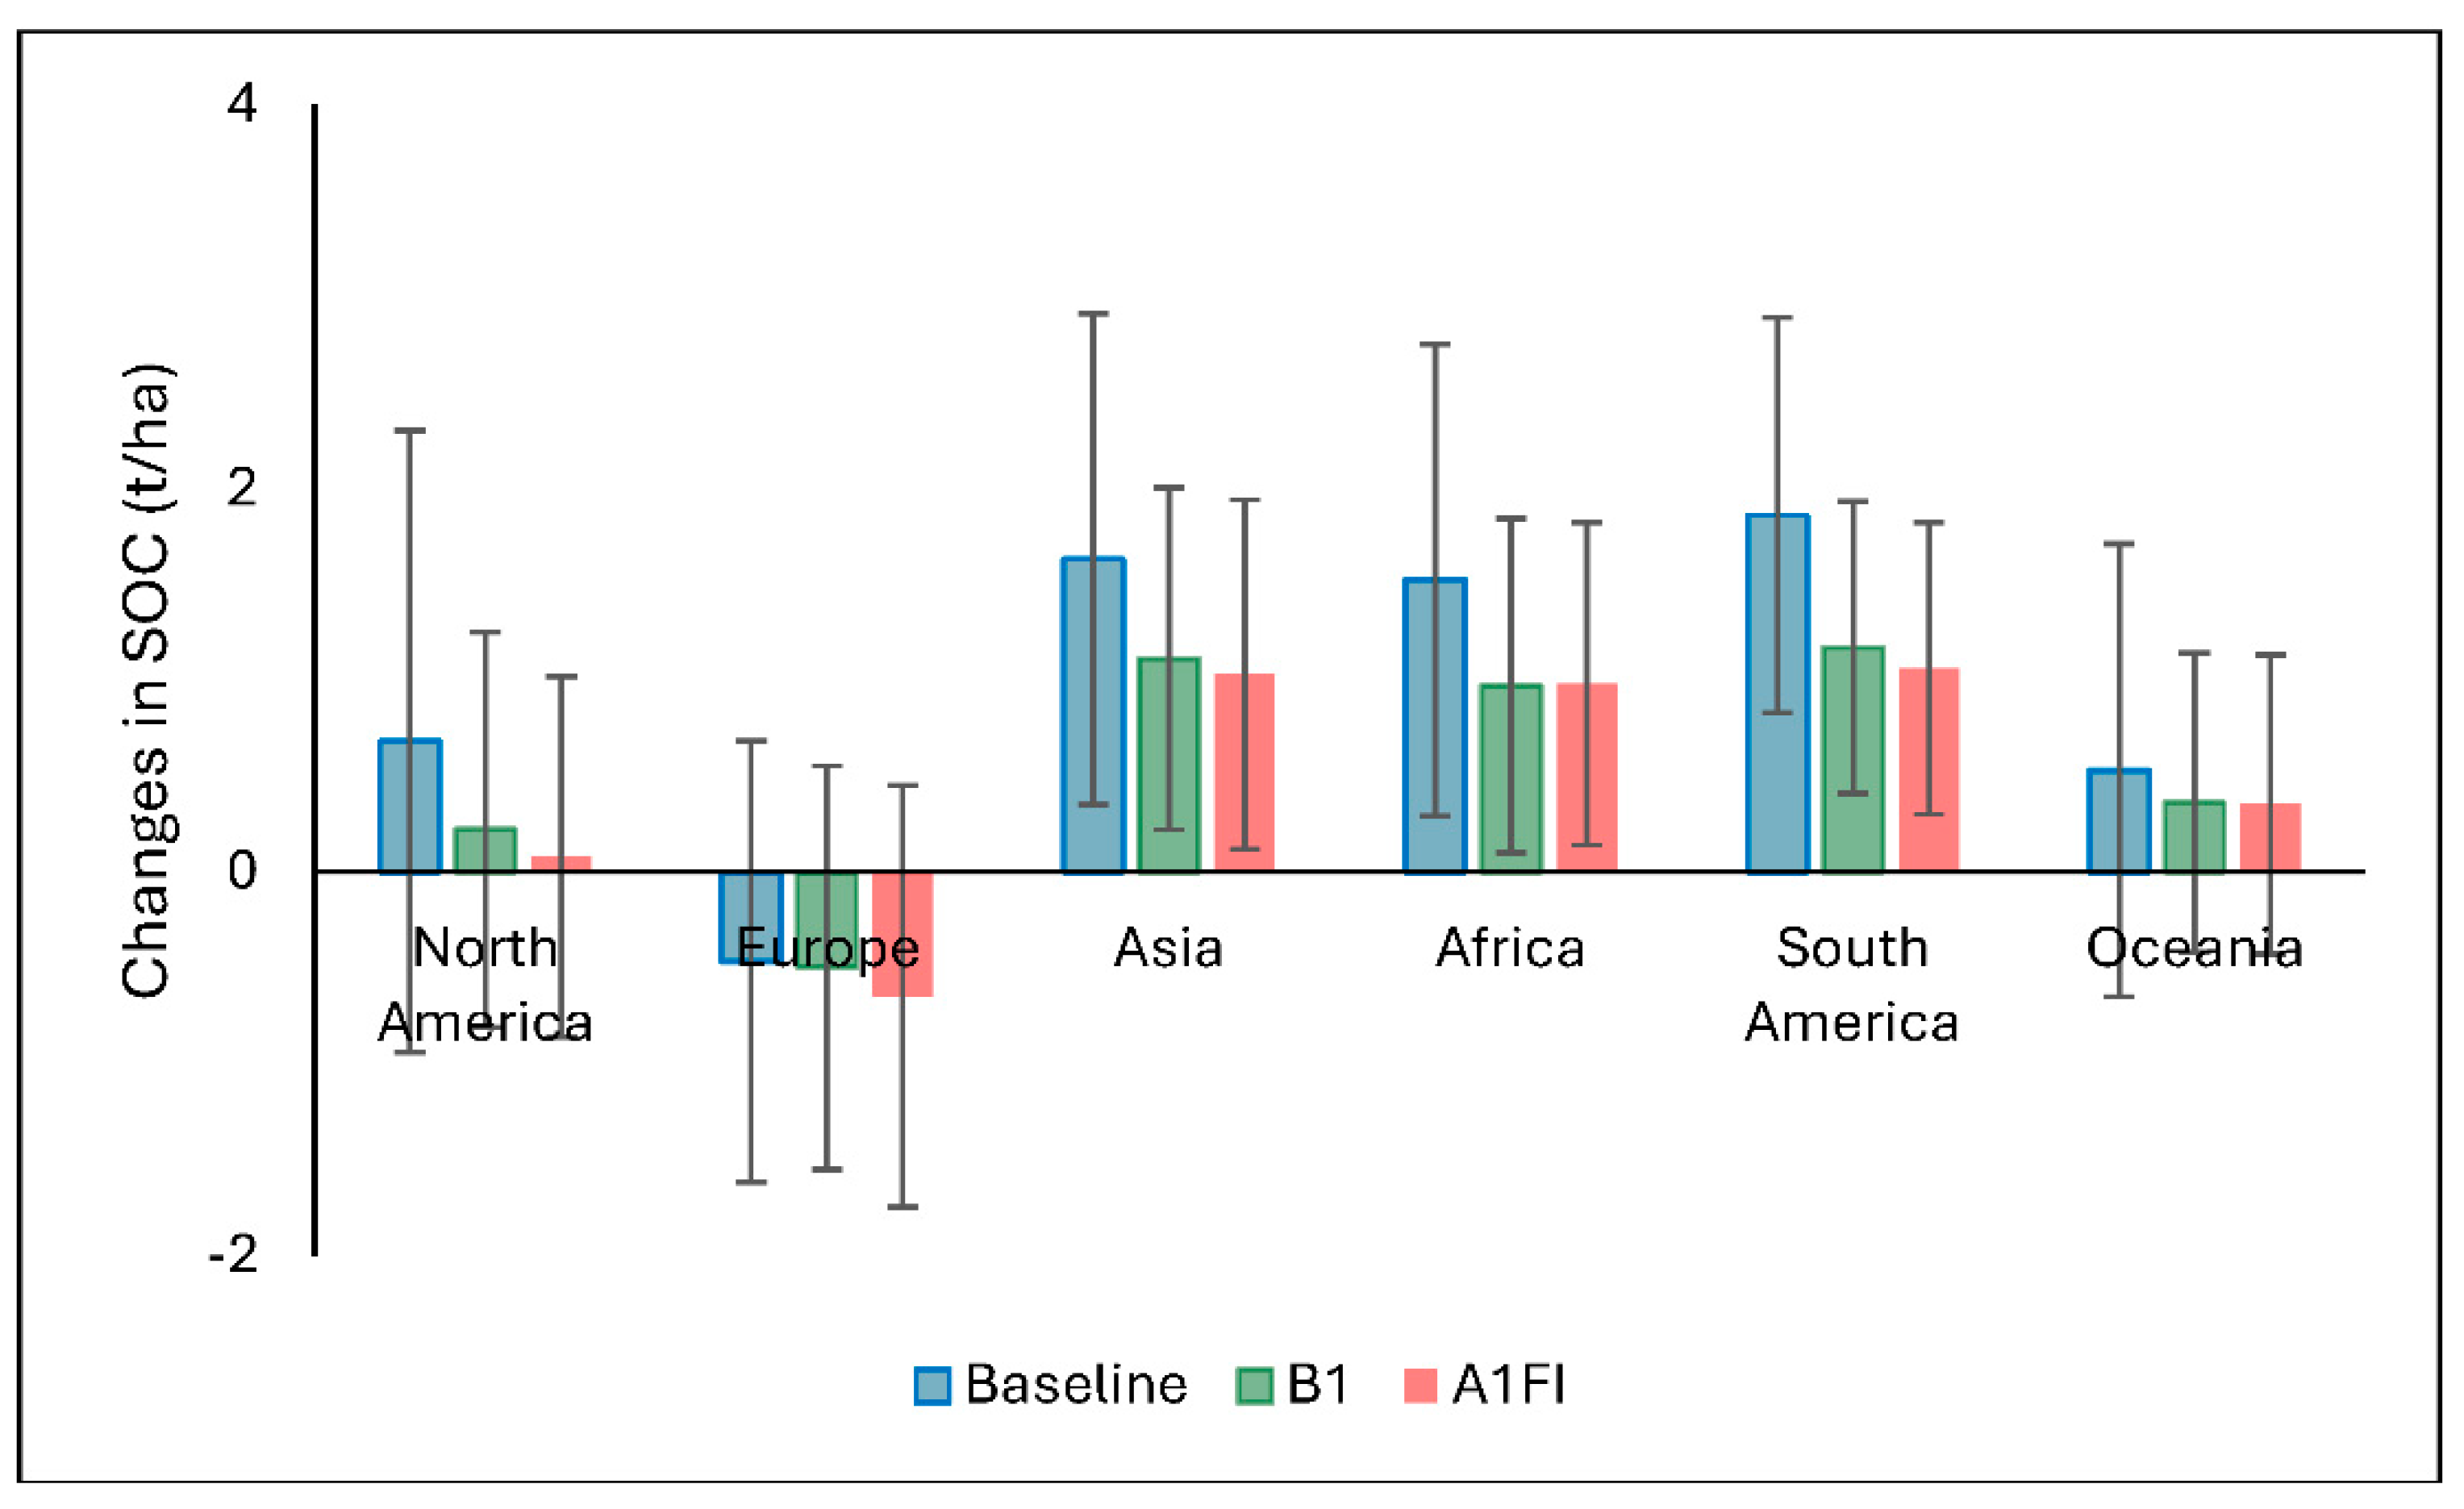

Table 1.
Summary of on farm energy and carbon costs of production used in MiscanFor model.
| Climate/transport Scenario |
Annual energy/ yield (GJ/t) | Greenhouse gas emissions | Crop harvest moisture (%) | |
| (kg C/ha/y) | (kg C/Mg) | |||
| Baseline (50 km) | 0.51475 | 23 | 25.27 | 14 |
| Baseline (500 km) | 0.77100 | 23 | 29.34 | 14 |
| B1 (50 km) | 0.51475 | 23 | 25.27 | 14 |
| B1 (500 km) | 0.77100 | 23 | 29.34 | 14 |
| A1FI (50 km) | 0.51475 | 23 | 25.27 | 14 |
| A1FI (500 km) | 0.77100 | 23 | 29.34 | 14 |
Table 2.
Summary of the number of global grids used in the analysis for each scenario.
| Scenario | Number of grid cells | Number of NA (zeros) |
| Baseline | 725185 | 181 |
| B1 | 836890 | 427 |
| A1FI | 903373 | 778 |
Table 3.
Global mean LUEI (GJ/ha) of Miscanthus and willow at baseline (1961-1990) and two climate projections (A1FI and B1) up to 2060. SD is standard deviation.
Table 3.
Global mean LUEI (GJ/ha) of Miscanthus and willow at baseline (1961-1990) and two climate projections (A1FI and B1) up to 2060. SD is standard deviation.
| Scenario | Minimum | Maximum | Mean | Median | SD | Changes due to climate change (%) | |
|
Miscanthus |
Baseline | -8.68 | 753.10 | 321.02 | 392.01 | 179.07 | - |
| B1 | -8.29 | 784.75 | 293.20 | 345.21 | 190.05 | -9 | |
| A1FI | -8.44 | 702.98 | 273.22 | 302.05 | 184.66 | -15 | |
| Willow | Baseline | -7.98 | 487.79 | 163.98 | 157.73 | 115.56 | - |
| B1 | -8.82 | 505.26 | 150.98 | 136.67 | 115.32 | -8 | |
| A1FI | -5.56 | 455.28 | 142.52 | 125.11 | 111.76 | -13 |
Table 4.
Global mean energy use efficiency (EUE) of Miscanthus for two transportation levels (50 km and 500 km) at baseline (1961-1990) and two climate projections (A1FI and B1) up to 2060. SD is standard deviation.
Table 4.
Global mean energy use efficiency (EUE) of Miscanthus for two transportation levels (50 km and 500 km) at baseline (1961-1990) and two climate projections (A1FI and B1) up to 2060. SD is standard deviation.
| Scenario/ transport distance | Minimum | Maximum | Mean | Median | SD | Changes (%) |
| Baseline (50 km) | 0.05 | 24.75 | 15.73 | 19.65 | 7.08 | 21 |
| Baseline (500 km) | 0.05 | 18.20 | 12.37 | 15.29 | 5.15 | |
| B1 (50 km) | 0.08 | 24.99 | 15.15 | 18.70 | 7.13 | 21 |
| B1 (500 km) | 0.08 | 18.33 | 11.97 | 14.70 | 5.17 | |
| A1FI (50 km) | 0.06 | 24.25 | 14.56 | 17.58 | 7.06 | 20 |
| A1FI (500 km) | 0.06 | 17.92 | 11.58 | 14.00 | 5.14 |
Table 5.
Global cumulative soil organic carbon (SOC30 or SOC70), annual change (∆SOC) and annual added rate for Miscanthus at baseline (1961-1990) and two climate projections (A1FI and B1) up to 2060. SD is standard deviation.
Table 5.
Global cumulative soil organic carbon (SOC30 or SOC70), annual change (∆SOC) and annual added rate for Miscanthus at baseline (1961-1990) and two climate projections (A1FI and B1) up to 2060. SD is standard deviation.
| Scenario | Parameters | Minimum | 1st quartile | Median | Mean | 3rd quartile | Maximum | SD |
| Baseline | SOC30 (t/ha) | 14.9 | 114.40 | 152.50 | 150.5 | 177.2 | 643.2 | 59.9 |
| ∆SOC (t/ha) | -7.93 | -0.05 | 1.67 | 1.20 | 2.37 | 4.57 | 1.46 | |
| Annual rate (t/ha) | 0.50 | 3.81 | 5.08 | 5.02 | 5.91 | 21.44 | 2.00 | |
| B1 | SOC70 (t/ha) | 9.25 | 104.79 | 180.54 | 167.31 | 216.35 | 605.04 | 73.71 |
| ∆SOC (t/ha) | -5.47 | -0.24 | 0.82 | 0.62 | 1.53 | 3.19 | 1.11 | |
| Annual rate (t/ha) | 0.13 | 1.50 | 2.58 | 2.39 | 3.09 | 8.64 | 1.05 | |
| A1FI | SOC70 (t/ha) | 13.37 | 101.39 | 172.58 | 163.45 | 212.09 | 598 | 73.27 |
| ∆SOC (t/ha) | -5.47 | -0.31 | 0.60 | 0.49 | 1.43 | 2.89 | 1.13 | |
| Annual rate (t/ha) | 0.19 | 1.45 | 2.47 | 2.34 | 3.03 | 8.54 | 1.05 |
Disclaimer/Publisher’s Note: The statements, opinions and data contained in all publications are solely those of the individual author(s) and contributor(s) and not of MDPI and/or the editor(s). MDPI and/or the editor(s) disclaim responsibility for any injury to people or property resulting from any ideas, methods, instructions or products referred to in the content. |
© 2025 by the authors. Licensee MDPI, Basel, Switzerland. This article is an open access article distributed under the terms and conditions of the Creative Commons Attribution (CC BY) license (http://creativecommons.org/licenses/by/4.0/).
Copyright: This open access article is published under a Creative Commons CC BY 4.0 license, which permit the free download, distribution, and reuse, provided that the author and preprint are cited in any reuse.


