
Submitted:
26 April 2025
Posted:
28 April 2025
You are already at the latest version
Abstract
The common dolphin, Delphinus delphis, is the most abundant cetacean species along the Western Iberian Peninsula, facing many anthropogenic threats, with bycatch being the most impacting. Its favoured prey, sardine (Sardina pilchardus), has shown abundance fluctuations over the past decade, potentially influencing dolphin distribution. This study provides the first insights into common dolphin distribution along the Portuguese main-land coast, using sighting data from vessel research surveys (2005-2020) to identify hotspot areas, accounting for monthly and seasonal distributions overlapping with sar-dine abundance. Common dolphin hotspots were located along the central-western and southern Portuguese mainland coasts, coinciding with important fishing ports, oceano-geographic features and sardine juvenile habitats. Furthermore, during 2013-2016, com-mon dolphins were observed significantly farther from the coast, coinciding with a period of particularly low sardine biomass in coastal areas. However, GAM analysis indicated that the relationship between sardine biomass and the distance of common dolphins was not significant. This study highlights the major common dolphin hotspots and the most comprehensive temporal and distribution maps of the species available for the Western Iberia in response to the abundance and management plans of their favoured prey (sar-dines). These results can be used by managers to inform conservation measures and for the sustainable management of the Portuguese sardine purse seine fishery fleet, which in-teracts the most with the species.
Keywords:
Dolphins
; Species distribution modelling
; Sardine population dynamics
; Purse seine fishery
; Opportunistic sighting data
; Predator-prey relationship
; Marine ecosystem conservation
1. Introduction
Marine conservation efforts are often based upon the knowledge of where species are distributed in space and time [1]. This knowledge can provide key information about priority seasons and areas for protection, therefore informing cetacean conservation and management plans [2,3,4,5]. In marine and coastal management, the use of Species Distribution Models (SDM) can be used to inform Marine Spatial Planning (MSP) initiatives [6], by providing insight into potential areas of conflict between different users of the maritime space. For instance, cetacean SDM can be used to assess where a species’ habitat overlaps with anthropogenic activities, such as fisheries [7], marine traffic ways [8], physical and acoustic disturbance [9,10], seismic activities [11], touristic operators [12], and offshore development [13,14,15]. Understanding how anthropogenic activities overlap and interact with marine mammals’ distribution is fundamental for decision making regarding the allocation of no-take zones in important migratory routes or breeding and foraging sites [16].
Cetaceans are considered important umbrella species due to their ecological significance and the broad protection their conservation affords to other marine species and habitats. As apex predators, they play a crucial role in maintaining ecosystem structure, regulating dynamics, and supporting essential ecological functions [17]. Moreover, they are particularly vulnerable to human activity because of their slow maturity, low reproductive potential, and occurrence in areas with strong human activity [18]. Cetacean conservation is a top priority for marine management plans because their protection can have positive effects on the overall ecosystem health [19]. Furthermore, cetaceans are considered charismatic species and have a strong intrinsic value for their complexity and diversity [20]. Therefore, to safeguard these flagship species and to address the requirements of the Marine Strategy Framework Directive (MSFD) and European Union (EU) Habitats’ Directive, accurate abundance and distribution estimates are needed [21].
The common dolphin, Delphinus delphis, is one of the most abundant cetacean species, with worldwide distribution [22,23] and is the most abundant cetacean species off the western Iberian coast, with an estimated average population of 80471 individuals [24]. Moreover, studies have shown that the common dolphin is the most frequently stranded species along the Portuguese mainland coast and the species with the highest number of recorded mortalities associated with fisheries [25,26,27,28,29,30]
Studies have shown that common dolphins favour diets rich in small pelagic fish of high-energy content [27,31,32], changing their diet or energy richness according to seasonal and yearly fluctuations of prey distribution and abundance [27,31,32,33,34,35,36]. Optimal foraging theory predicts that diet selection will be driven by prey availability, catchability, energetic value and by the specific cost of foraging [37], which is true for predators leading an energetically expensive lifestyle such as the common dolphin [32].
The western Iberian waters are known for their high productivity with their well-known seasonal upwelling regime [38,39]. This regime sustains the presence of small pelagic fish species whose success depend on favourable environmental conditions [40,41]. However, reported environmental changes, coupled with excessive fishing, caused the decline of the abundance of the European sardine, Sardine pilchardus [42,43,44,45]. The sardine stock in western Iberia belongs to the southern stock, managed by Portugal and Spain and mostly explored by the purse seine fishery in both countries, responsible for the bulk of sardine landings [27,46]. Sardine abundance is dependent on the magnitude of recruitment, which was poor since 2004 up to recent times [41], leading to a historical decline of biomass and consequently a strong management plan for the southern Iberian sardine stock from 2011 onwards by both countries’ administrations, with severe cuts in landing quotas. Therefore, a multi-annual management plan was introduced in 2012 known as the “Sardine Fishery Management Plan (2012-2015)” (henceforth “Sardine Ban”). The Sardine Ban put forward limitations on the annual catch, sardine catch prohibition periods, limits on the catches of juveniles, and regulated technical measures to reduce bycatch in Portuguese Purse Seine Fishery (PPSF) [46,47]. The Sardine Ban resulted in a noticeable recovery in sardine stocks, with a 30% increase in biomass from 2015 to 2016 alone [48]. However, despite some increase in sardine biomass, in 2017 stock numbers were still below the Biological Limits (Blim) as defined by the International Council for the Exploration of the Sea (ICES) and a long way from economic and ecological stability [48].
Studies have shown a strong interaction between the common dolphin and the activities of the PPSF along the Portuguese mainland coast, where the species is found to be the most frequently sighted cetacean species within the operational zone of the fishery [26,29,49,50,51]. This strong common dolphin-PPSF association is perhaps unsurprising due to their mutual preferred target - the sardine [27,31,50]. This resource overlap has raised concern, most notably the risk of bycatch, which has been reported in the area [25,26,27,29].
The aim of this study is to provide insights into spatial and temporal distribution of common dolphins along the Portuguese mainland coast, leveraging information from annual non-dedicated vessel surveys (2005-2020). By examining changes in encounter rates and coastal proximity of dolphins across different periods, this research investigates the potential influence of the sardine ban and fluctuations in sardine biomass on dolphin distribution. This approach will contribute to a better understanding of predator-prey dynamics in marine ecosystems and offer critical information to support evidence-based management and conservation strategies, particularly in the context of fisheries management, dolphin conservation and MSP.
2. Materials and Methods
2.1. Study Area
Mainland Portugal is located in the western part of Southern Europe and lies within the ICES division 9a, included in the Bay of Biscay and Iberian Coast ecoregion [52]. This study covered the Portuguese mainland coast (Figure 1), extending 860 km from Caminha (41° 50’ N, 8° 50’ W) to Vila Real St. António (37° 12’ N, 7° 25’ W). Changes in important topographic, bathymetric and oceanographic features occur along the Portuguese coast leading to different levels of biological productivity. The North-Central western coast from Caminha (41◦50′ N, 8◦50′ W) to Peniche (Cape Carvoeiro) is characterized topographically by long extensions of sandy beaches, a wide and flat continental shelf (40–70 km in width) and strong and fairly homogeneous upwelling with northern wind regimes resulting in colder waters with high productivity. This region also contains one of the largest submarine canyons in Europe, the Nazaré Canyon, which is located at approximately 39◦ 40’ N, 009◦ - 011◦ W. The Central-Southwestern coast, located between Peniche (Cape Carvoeiro) and the western tip of Cabo S. Vicente has a narrower (10–20 km wide) continental shelf. is also characterized by strong upwelling. The southern region, also known as Algarve, extends from the southern tip of Cabo S. Vicente to Vila Real St. Antonio ´ (37◦12′ N, 7◦25′ W). This region has very narrow continental shelf (5–20 km wide), warmer waters influenced by the Atlantic and Mediterranean currents [53] and prevailing southerly winds, and is influenced by several rivers (e.g., Arade, Guadiana) and highly productive coastal lagoons (e.g. Ria Formosa and Ria de Alvor). Furthermore, the whole mainland coast represents a transition between the warmer lower latitudinal waters of the Mediterranean Sea and the cooler higher latitude waters of the north-eastern Atlantic [54].
2.2. Data Collection
European sardine biomass and common dolphin sighting data were obtained as part of the research surveys led by the Portuguese Institute for the Sea and the Atmosphere (IPMA). These data were collected from systematic vessel surveys from 2005-2011 and 2013-2020, from September to June. There was no survey in 2012 due to lack of funding [55]. The primary aim of these annual surveys is to determine the biomass and spatial distribution of coastal small pelagic fish, namely European sardine to make stock assessments and analyse environmental factors that may influence their survival, making a contribution to the sustainability of the purse seine fishery [56]. Nonetheless, the surveys were also used to obtain opportunistic data on seabirds, cetaceans and marine turtles. Cetacean data were collected by one or two trained observers from the Portuguese Society for the Study of Birds (SPEA, BirdLife’s partner in Portugal) using the European Seabird at Sea Methodology (ESAS) [57,58]. All cetaceans within a 300 meters width strip transect, on one side of the boat, were identified, counted and their behaviour recorded. The counts were assigned to segments of transect lasting five minutes of effort (giving an average line length of 1.3 km). These are the sampling unit considered for further analysis here. A more detailed description of the sampling methodology can be found in [57] and [58]. Environmental data such as Beaufort Sea state and visibility were also recorded.
2.3. Data Analysis
2.3.1. Temporal Stratification
Encounter rate, number of animals per unit length, per 5-minute segment, was obtained from the data. For relevant comparisons, pooled encounter rate was also calculated for different periods, including:
- (i)
- Every year,
- (ii)
- Every four years,
- (iii)
- Before and after the sardine ban.
To allow for spatial comparisons before and after the Sardine Ban, two periods were established accordingly: 2005 – 2011 (before the ban) and 2013 – 2020 (after the ban). Additionally, and to refine the temporal analysis four-year periods were also analysed (2005 – 2008; 2009 – 2012; 2013 – 2016; 2017 – 2020).
Bar charts were created using R (R Core Team, 2024 from within RStudio [59]) to visualise differences in the encounter rate across the different years.
2.3.2. Sightings and Grid Maps
To visualise common dolphin occurrence, a sighting map was created on QGIS (Version 3.10.0) [60]. As a supplementary means to visualise the data, a heat map of common dolphin occurrence was created using the Kernel Density Estimation tool on QGIS. Kernel Density estimation is a non-parametric method that can be used to estimate the probability density function, f(x), of a random variable, X. The Kernel function used was based on the quartic kernel function. However, it is important to note some of the potential limitations of this methods. Specifically, the smoothing effect in the Kernel Density Estimation can lead to artificial hotspots in areas where there are no sightings. As such, this method was not used as the primary method, but rather as a supplementary means to visualise common dolphin occurrence. Grid maps were created to compare the common dolphin encounter rate between different years and seasons so that the different periods could be visualised on the same density scale. The common dolphin encounter rate was quantified in a 10 km² orthogonal grid using QGIS and the average encounter rate was calculated for each cell.
2.1.3. Distance to Coast
Changes in the distance to the coast for the common dolphin detections were investigated to understand the common dolphin movements in relation to prey availability. The hypothesis is that the common dolphin will occur significantly further from the coast during periods of low sardine biomass to compensate for low prey availability in inshore waters [52]. The null hypothesis is that there will be no significant difference in the distance of the common dolphin from the coast across the years. Distance to coast values for each common dolphin sighting were obtained by calculating the shortest distance (in metres) to a shapefile of the European coast (https://www.eea.europa.eu/data-and-maps/data/eea-coastline-for-analysis-1/gis-data/europe-coastline-shapefile) (accessed 07/03/2021). The mean, standard deviation, and Coefficient of Variation (CV) of the distance to coast was obtained for each time period described in Section 3.3.1. A boxplot was created to visualise differences in the distance to coast between each period. The mean distance of the common dolphin from the coast was plotted against the total sardine biomass data from the years 2005 to 2020, to visualise trends between the two variables. The Shapiro–Wilk test was used to test for normality of residuals of a model of distance to coast per period. The residuals of the data deviated significantly from a Gaussian distribution leading to a non-parametric test for differences in the distance to coast of the dolphin sightings for the different time periods. A Wilcoxon test was used to test whether there was a significant difference in the distance to coast before and after the sardine ban. A Kruskal-Wallis test was used to test for a statistical difference in the distance to coast for the different years and seasons. Dunn Test Pairwise comparisons were used to understand which time periods were statistically different. In addition, to assess the relationship between sardine biomass and the common dolphins’ distance from the coast, a Generalised Additive Model (GAM) model was fitted to the data.
The following equation was provided:
log(E[distance])=β0+s(sardine biomass)
Where:
E[distance] represents the expected value of distance of common dolphin from the coast.
β0 is the intercept value.
s(biomass2) is a smooth function (spline) of sardine biomass.
We considered a Gamma distribution for the response with a log link function.
R (Version 4.1.2) was used for all analyses [59]. We considered a significance level of 0.05 for all the statistical significance tests.
3. Results
3.1. Sighting and Grid Maps
A sighting map of common dolphin from 2005 – 2020 is presented in Figure 1. The common dolphin had the highest number of sightings off the central-western coast of Nazaré (39°38’N, 9°07’W) and Figueira da Foz (40°10’N, 9°01’W), and off the southern Portuguese coast near Sagres (36°44’N9, 8°58’W). There were also milder hotspots off the western coast near Matosinhos (41°08’N, 9°00’W), Póvoa de Varzim (41°26’N, 8°55’W) and Lisboa (38°41’N, 9°43’W).
3.2. Encounter Rate
The mean encounter rates for the common dolphin between 2005 to 2020 are shown in Figure 2. The figure shows a generally increasing trend in the common dolphin encounter rate, with a few atypical years. The encounter rate ranged between the lowest in 2014 and largest in 2018, with the second and third largest encounter rates in 2013 and 2008, respectively.
Common dolphin encounter rates were plotted onto grid maps and compared before (2005 – 2011) and after (2013 – 2020) the sardine ban (Figure 3). Prior to the ban, the main hotspots occur off the central coast between Nazaré and Figueira da Foz (from 39°41’N, 8°57’W to 40°27’N, 8°57’W), the southern coast near Sagres (36°45’N, 8°50’W) and the northern coast near Póvoa de Varzim (from 41°05’N, 8°54’W). Following the ban, these previously identified hotspots remained critical, but there was also a noticiable increase in common dolphin occurrence off the coast of Lisboa (38°39’N, 9°35’W) and the western Algarve coast (from 36°46’N, 8°59’W).
The encounter rate for the common dolphin was compared between the time periods 2005 – 2008, 2009 – 2011, 2013 – 2016, and 2017 – 2020 (Figure 4). The highest occurrence was observed in the periods 2005 – 2008 and 2017 – 2020. From 2005 – 2008, there was a high density along the central and northern coast, particularly around the regions of Figueira da Foz and Aveiro. From 2009 – 2016, there was a decline in the density of the common dolphin along the whole mainland coast of Portugal, with most sightings occurring further from the coast. From 2017 – 2020, there was a noticeable increase in the density of the common dolphin, where hotspots were reappearing off the central coast near Nazaré and off the southern coast near Sagres.
3.3. Distance from the Coast
The Kruskal Wallis test indicated statistically significant differences in the distance from the coast across years (p-value 7.41e-09). The mean distance to coast was highest for 2017 (μ = 32.19 ± 15.43 km), followed by 2014 (μ = 25.93 ± 10.57 km) and 2011 (μ = 56.61 ± 12.03 km).
The Kruskal Wallis and pairwise comparison showed that there was a significant increase in the mean distance to coast between the four-year periods (p-value < 0.0003). The pairwise comparison showed there was a significant difference between: 2005-2008 (μ = 20.67 ± 10.86 km) and 2013-2016 (μ = 22.16 ± 12.30 km); 2009-2012 (μ = 16.69 ± 10.86 km) and 2013-2016; and 2013-2016 and 2017-2020 (μ = 19.54 ± 12.30 km). The highest mean distance from the coast observed was for the period of 2013-2016. However, there was no significant difference in the mean distance to coast for common dolphins for (a) before and after the sardine ban (p-value = 0.50) and (b) between summer and winter (p-value = 0.19).
Figure 5 plots the mean distance of the common dolphin against sardine biomass estimated by the Working Group on southern Horse Mackerel, Anchovy and Sardine (WGHANSA) for the survey period [61]. The figure suggests an inverse relationship between the total sardine biomass and the common dolphin mean distance from the coast. The years where the common dolphin was located furthest from coast (2011, 2014 and 2017) represent the years where sardine biomass was at its lowest.
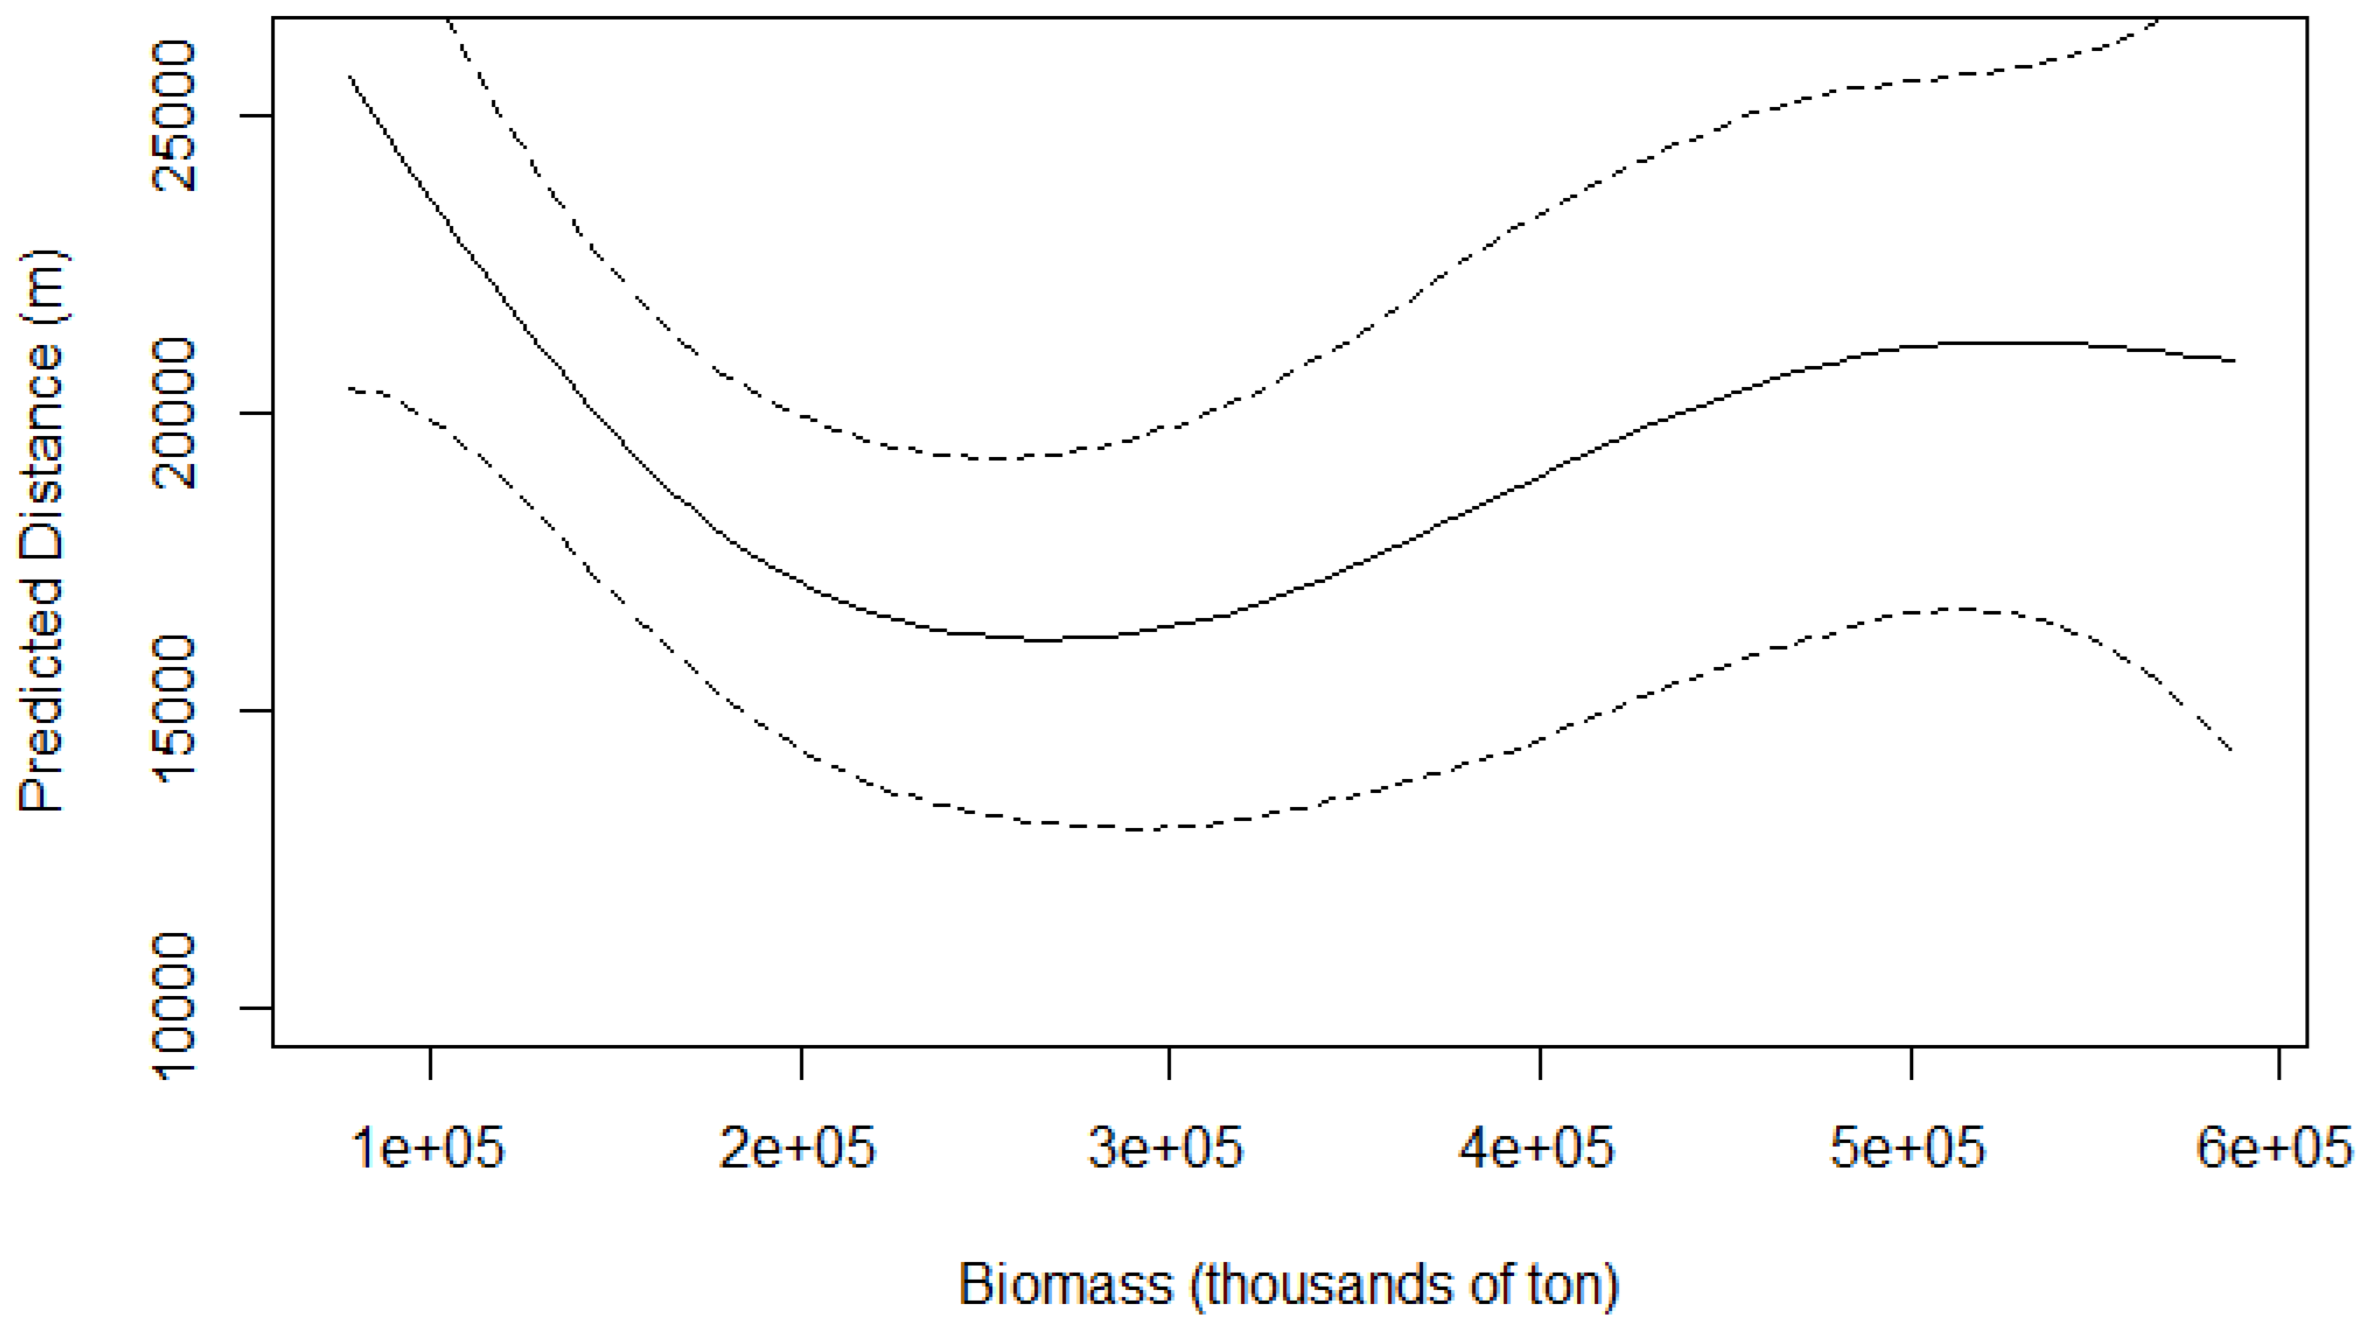
The GAM modelled the effect of sardine biomass on the distance of the common dolphin from the coast as a smooth term (Figure 5; Figure 6). At low sardine biomass levels, dolphins were predicted to occur farthest from shore. As biomass increased to around 250,000 tons, dolphins moved progressively closer to the coast. Beyond this point, increasing sardine biomass was associated with a gradual increase in distance from shore, although the effect was less pronounced than at lower biomass levels, eventually reaching a plateau.The estimated degrees of freedom for the smooth term of sardine biomass is 2.87 which inicates a potential non-linear effect. The relationship between sardine biomass and distance from the coast is not statistically significant (P= 0.084; R2 = 0.382). The adjusted R2 value is with 50.1% of the deviance in the data explained.
4. Discussion
4.1. Overview of the Study
This study investigates for the first time the habitat use of the common dolphin along the Western Iberian coast and provides insight into critical hotspot sites to be considered in future conservation and management actions. The research uses a unique long-term data systematic collection from vessel cruise surveys between 2005 – 2020 to understand how common dolphin distribution varies spatially and temporally. These surveys and the analysis of the accompanying spatial data provide an understanding of the distribution patterns of common dolphins along the Portuguese mainland coast. Therefore, the study contributes to improved knowledge about the habitat use of the species along the Western Iberian coast, which will be useful for identifying priority conservation areas in the future, as has been successfully done elsewhere (see [61]). Up until now, there has been limited dedicated research on the distribution of the common dolphin along the Western Iberian coast. The lack of knowledge about the common dolphins’ core habitat in the area is particularly concerning because of the high intensity level of anthropogenic activities affecting the area, such as fisheries and maritime tourism [26,28,49,50,62].
From 2005 – 2020, the highest number of sightings occurred off the central-western and southern mainland coast, particularly from Figueira da Foz to Nazaré, and off the windward area of the Southern coast, namely Sagres. These common dolphin hotspots are likely related to the presence of geographical and oceanographic features that favour high productivity [63]. For instance, there are high densities of common dolphins located near the major Portuguese submarine canyons (i.e., Nazaré, Lisboa/Setubal and Cape São Vicente) and nearby some of the major cells of upwelling in the Portuguese coast [38]. Submarine canyons also act as important channels for the upwelling of nutrients to surface water, therefore promoting high biological productivity and abundance of fish and crustacea [64,65]. Studies have shown that common dolphin abundance is high off Nazaré and Sesimbra, where the topographic features promote upwelling and high productivity [66]. This aligns with the high abundance of common dolphins in these locations in the current study. Previous studies have shown that the common dolphin tends to aggregate near large river mouths, due to the high nutrient runoff [67,68]. These river mouths act as critical fish recruitment sites and spawning grounds, because of their high productivity [69]. Thus, the high sightings of common dolphins at these sites suggests that they might be specifically aggregating on important fish recruitment grounds due to increased prey availability. In this context, the region between the Nazaré Canyon and the Minho River on the western Portuguese shelf is known as a major sardine (Sardina pilchardus) spawning ground [70], reinforcing the role of this region as key foraging area for common dolphins. Furthermore, here, there is a high density of dolphins located near the mouth of the Rio Mondego (Figueira da Foz) and a moderate density near other major estuaries and rivers such as the Rio Douro (Porto), Ria de Aveiro (Aveiro), the Rio/Estuary of Tejo (Lisbon), and the Rio/Estuary of Sado (Setúbal).
4.2. Common Dolphin Encounter Rate and Distribution Associated with the Sardine Ban
As previously mentioned, the common dolphin tends to aggregate in areas with high prey abundance. Thus, it is expected that changes in prey availability will likely affect the distribution and density of the dolphins [66]. Since 2006, there was a significant reduction in sardine biomass because of the changes in sardine recruitment caused by intensive fishing practices and environmental factors [46,47]. As a result, the Sardine Ban was implemented in 2012, introducing a set of regulatory and technical fishing measures to prevent the further decline of sardine stocks [71]. One of the objectives of this study was to understand the relationship between changes in sardine stock levels, especially as a consequence of the Sardine Ban, and the common dolphin occurrence. Indeed, the study showed that the common dolphin encounter rate and distribution followed a similar trend to sardine biomass levels [52]. Based on the grid maps, there was a low density of common dolphins from the years 2009 to 2016 closer the Portuguese mainland coast. The low density coincides with the period when sardine biomass was at its lowest levels around coastal areas [71]. For instance, in 2009, the sardine landings greatly exceeded ICES scientific advice, with 24% more sardines landed than the advised value [47]. As a consequence of fishing, environment and trophic interactions, 2011 witnessed a peak mortality for the sardine stocks and their lowest levels of recruitment [72]. In the current study, there was also a particularly low encounter rate for the common dolphin in 2011. This result may suggest that prior to the Sardine Ban prey availability was lower for the common dolphin population in the area as suggested by similar studies for other cetacean species in the Mediterranean area and the Pacific region [69,73]. After the Sardine Ban of 2012, there was a gradual recovery in sardine stock levels along the Portuguese mainland coast [74] up to 2020.
The inconsistency between common dolphin encounter rates and sardine biomass in 2008, 2013, and 2018, years with unusually high encounter rates, may be justified by the complexity of other factors (e.g., behaviour, environmental) influencing dolphin distribution along the Portuguese coast. While some interannual variability in the months sampled was observed, the sampling scheme during these years did not differ significantly from other years, supporting the robustness of the observed patterns and reducing the likelihood of sampling bias as an explanation for the peaks. Notably, the sardine fishing ban implemented after 2012 may have contributed to an increase in sardine biomass, which could partially explain the higher encounter rates observed in 2013 and 2018. However, the absence of a significant correlation as presented in the GAMs suggests that other factors may be also at play. Common dolphins, known for their dietary flexibility [27], may have exploited localized prey aggregations, including sardines and alternative prey species, during these years. Behavioural factors, such as increased social aggregation or reproductive activities, could have further influenced their distribution and detectability. Environmental drivers, including upwelling intensity, sea surface temperature anomalies, or primary productivity, may also have created favourable conditions for prey availability or dolphin habitat use [63]. Additionally, anthropogenic factors, such as changes in fishing activity or habitat use, may have played a role [29]. These findings underscore the need for further research integrating prey distribution data, oceanographic conditions, and dolphin behaviour to better understand the drivers of these interannual variations. There is an increase in the common dolphin encounter rate and density from 2016 onwards, aligning with the gradual increase in sardine stock biomass. This may suggest that the dolphins could be benefiting from the sardine stock recovery and responded positively to the implementation of the Sardine Ban. Previous studies have described common dolphins as opportunistic feeders and claim that they switch their prey preference at lower sardine abundance [33]. However, despite the lack of sardine recruitment from 2004 onwards, which was reflected in a sardine biomass downfall from 2010 onwards, stomach content analysis showed the sardine was still the preferred prey for common dolphins between 2010 and 2013 [27].
Our findings suggest that common dolphin densities were lower during periods of reduced sardine abundance. One possible explanation investigated in this study is that common dolphins exhibit spatial responses to fluctuations in sardine stock levels. Indeed, during 2013-2016, a period marked by historically low sardine biomass, dolphins were recorded farther from the coast. This shift could suggest that in response to reduced availability of their preferred prey in coastal waters, dolphins may have expanded their foraging range offshore [75]. Although sardines remained the prevalent component in the diet based on stomach content analyses, other small pelagic fish species, such as Atlantic chub mackerel (Scomber colias) and horse mackerel (Trachurus trachurus), constituted a greater proportion of the common dolphins’ diet than in previous years [27,31]. This dietary adjustment likely reflects opportunistic foraging in areas where sardines were scarce or less accessible to purse seine fleets. The offshore movement of dolphins during this period may therefore relate both to prey availability and to changes in fishing effort, as the sardine fishery was subject to significant restrictions between 2013 and 2016 [76]. Supporting this interpretation, previous studies have shown that there is a positive relationship between sardine catches and the number of cetaceans observed [26,49,50], while in areas where there are low sardine catches, there were lower cetacean interactions with the purse seine fishery [26]. In 2017, as sardine stocks began to recover and fishing restrictions were relaxed, common dolphins were observed closer to the coast. Dias et al. (2022) [29] showed that there is a higher probability of occurrence of dolphin-fishery interactions in areas with higher fishing effort. Thus, it can be assumed that the dolphins are probably moving closer to the coast to benefit from the higher availability of sardines inshore, and the prey aggregation favoured by the purse seine fishery being unable to avoid the usually negative interactions [26,29]. When modelled, sardine biomass did not have a significant effect on common dolphin distance from the coast. This suggests that the spatial distribution of dolphins is likely influenced by additional environmental or ecological factors not accounted for in this study, such as sea surface temperature, oceanographic currents, or seasonal shifts in the availability and distribution of other prey species.
4.3. Limitations and Future Directions
Abundance estimates are essential for assessing the conservation status of a population and impact of anthropogenic threats (EU Habitat Directive 92/43/EEC; [77,78]). Nonetheless, this study considered a simpler analysis framework. There was no attempt to estimate dolphin density, simply considering encounter rates, by definition, indexes of relative abundance, not corrected for detectability. There are no strong reasons to believe that there would be relevant correlation between detectability and distribution to obscure real effects or create spurious ones, but that remains an untested assumption that would be good to be able to test. Estimating detectability might be possible within a distance sampling context but doing so was beyond the objectives of the current work, where we were mostly interested in discussing coarse scale spatial and temporal patterns in the data with respect to the sardine fishery. Additionally, besides including detectability, a distance sampling approach could be extended to models of spatial density over space, relating the dolphin density to other biotic and abiotic covariates. It is likely that there are environmental variables beyond prey availability that are influencing the movements and distribution of the common dolphin. For instance, environmental variables such as water depth [79], surface temperature [80] and seabed gradient [81]. Future studies should incorporate environmental variables in the analysis to better understand how they influence the dolphin’s distribution. This methodology could be particularly useful for predicting the distribution of the common dolphin given their widespread distribution [82]. These models, such as Density Surface Modelling, can be used to locate potential hotspots in situations where sampling coverage is limited, therefore providing valuable information for decision makers and managers [83]. Such modelling techniques would contribute to a better understanding of temporal and spatial changes in cetacean abundance, therefore allowing managers to make more informed conservation decisions.
5. Conclusions
The study investigates the distribution of the common dolphin, the most frequently observed cetacean species, along the Portuguese mainland coast. Our work is the first to use long-term and standardised survey data to assess common dolphin distribution over a 16 year period. Findings revealed that common dolphins showed responsive movements, most likely in response to fluctuations in sardine stock levels, their primary prey. During the years with the lowest sardine levels, dolphin densities notably lower closer to the coast, where sardines used to be abundant. After the implementation of the Sardine Ban of 2012 there was a gradual increase in the sardine stock levels, which resulted in the dolphins moving closer to shore. These findings suggest that common dolphin habitat use is closely tied to prey availability, with fluctuations in prey stocks potentially influencing their spatial distribution. The identification of common dolphin hotspots along the Portuguese coast provides valuable information in MSPs, Marine Protected Area (MPA) designation, and effective management strategies. The results offer critical insights for managers and decision makers to pinpoint high risk areas for common dolphin during the MSP process. Conservation management measures should be continuously implemented and enforced to mitigate the negative anthropogenic impacts on common dolphin populations, which is essential for ensuring a healthy marine ecosystem.
Author Contributions
Conceptualization, S.B., T.A.M., J.G. and A.M.; methodology, S.B., T.A.M., P.M., J.G. and A.M.; formal analysis, S.B. and T.A.M..; investigation, N.O.; data curation, S.B., N.O. and P.M.; writing—original draft preparation, S.B.; writing and reviewing— S.B., T.A.M., J.G. and A.M.; visualization, S.B..; supervision, J.G. and A.M..; project administration, N.O., J.G. and A.M.; funding acquisition, N.O.. All authors have read and agreed to the published version of the manuscript.
Funding
This study was supported by the ERASMUS+ programme from the European Commission through a scholarship granted to the lead author as a student of the Erasmus Mundus Joint Master Degree in Water and Coastal Management (WACOMA) 2020/2022 (WACOMA; ProjectNo.586596-EPP-1-2017-1-IT-EPPKA1-JMD MOB). This study received Portuguese national funds from FCT - Foundation for Science and Technology through projects UIDB/04326/2020 (DOI:10.54499/UIDB/04326/2020), UIDP/04326/2020 (DOI:10.54499/UIDP/04326/2020) and LA/P/0101/2020 (DOI:10.54499/LA/P/0101/2020) to CCMAR. TAM thanks partial support by CEAUL (funded by FCT - Fundação para a Ciência e a Tecnologia, Portugal DOI: 10.54499/UIDB/00006/2020). Most of the data collection was performed in the aim of several projects co-funded through the LIFE Programme (a funding instrument for the environment and climate action from the European Commission), the Interreg Atlantic Area (by European Commission), the European Maritime and Fisheries Fund (EMFF) in Portugal (Mar2020), the Fundo Biodiversidade and the Fundo Ambiental (both from the Portuguese government), namely LIFE IBAS Marinhas (LIFE 04NAT/PT/000213), FAME (2009-1/089), LIFE MarPro (LIFE09 NAT/PT/000038), LIFE Berlengas (LIFE13 NAT/PT/000458), MedAves Pesca (MAR-01.04.02-FEAMP- 0023) and LIFE Ilhas Barreira (LIFE18/NAT/PT/000927).
Institutional Review Board Statement
Not applicable.
Informed Consent Statement
Not applicable.
Data Availability Statement
The datasets generated and/or analysed during the current study are available from the corresponding author upon request.
Acknowledgments
The authors extend upmost thanks to IPMA and the large number of onboard observers operating under the guidance of the Sociedade Portuguesa para o Estudo das Aves (SPEA). The lead author extends thanks to CCMAR and the University of Algarve who hosted her during her Master’s programme. The authors thank all those who in some form or another provided support for this study.
Conflicts of Interest
The authors declare no conflicts of interest.
Abbreviations
The following abbreviations are used in this manuscript:
| BLim | Biological Limits |
| CV | Coefficient of Variation |
| DGRM | Direção-Geral de Recursos Naturais, Segurança e Serviços Marítimos |
| EU | European Union |
| ESAS | European Seabird at Sea Methodology |
| GAM | Generalised Additive Model |
| ICES | International Council for the Exploration of the Sea |
| IPMA | Portuguese Institute for the Sea and the Atmosphere |
| MPA | Marine Protected Area |
| MSFD | Marine Strategy Framework Directive |
| MSP | Marine Spatial Planning |
| PPSF | Portuguese Purse Seine Fishery |
| SDM | Species Distribution Model |
| SPEA | Portuguese Society for the Study of Birds |
| WGHANSA | Working Group of Southern Horse Mackerel, Anchovy and Sardine |
References
- Agardy, T. 2000. Information needs for Marine Protected Areas: Scientific and Societal. Bulletin of Marine Science, 66(3), 875-888. https://www.ingentaconnect.com/content/umrsmas/bullmar/2000/00000066/00000003/art00025.
- Hunt, T.N., Allen, S.J., Bejdar, L., Parra, G.J. 2020. Identifying priority habitat conservation and management of Australian humpback dolphins within a marine protected area. Scientific Report. 10, 1-14. [CrossRef]
- Passadore, C., Moller, L.M., Diaz-Aguirre, F., Parra, G.J. (2018). Modelling Dolphin Distribution to Inform Future Spatial Conservation Decisions in a Marine Protected Area. Scientific Reports, 8. 1-14. [CrossRef]
- Parson, E.C.M., Baulch, S., Bechshoft, T., Bellazzi, G., Bouchet, P., Cosentino, A.M., Godard-Codding, C.A.J., Gulland, F., Hoffmann-Kuhnt, M., Hoyt, E., Livermore, S., MacLeod, C.D., Matrai, E., Munger, L., Ochiai, M., Peyman, A., Recalde-Salas, Regnery,R., Rojas-Brachos, L., Salgado-Kent, C.P., Slooten, E., Wang, J.Y., Wilson, S.C., Wright, A.J., Young, S., Zwamborn, E., Sutherland, W.J. 2015. Key research questions of global importance for cetacean conservation. Endangered Species Research 27, 113-118. [CrossRef]
- Pompa, S., Ehrich, P.R., Ceballos, G. 2011. Global distribution and conservation of marine mammals. Biological Sciences, 108(33), 13600-13605. [CrossRef]
- Marshal, C.E., Glegg, G.A., Howell, K.L. 2014. Species Distribution modelling to support marine conservtaion spatial planning: the next steps. Marine Policy, 330-332. [CrossRef]
- Jog, K., Sutaria, D., Diedrich, A., Grech, A., Marsh, H. 2022. Marine mammal interactions with fisheries: review of research and management trends across commercial and small-scale fisheries. Frontiers in Marine Science, 9, 16. [CrossRef]
- Pennino, M.G., Arcangeli, A., Fonseca, V.P., Campana, I., Pierce, G.J., Rotta, A., Bellido, J.M. 2017. A spatially explicit risk assessment approach: cetaceans and marine traffic in the Pelagos Sanctuary (Mediterranean Sea). PLoS One, 12(6), 1-16. [CrossRef]
- Erbe, C., Marley, S.A., Schoeman, R.P., Smith, J.N., Triggs, L.E., Embling, C.B. 2019. The Effects of Ship Noise on Marine Mammals- A Review. Impacts of Shipping on Marine Fauna, 6(606), 1-21. [CrossRef]
- Desjonqueres, C., Villen-Perez, S., deMarco, P., Maruez, R., Beltran, J.F., Llusia, D. 2022. Acoustic species distribution models (aSDMs): A framework to forecast shifts in calling behaviour under climate change. Methods in Ecology and Evolution, 13(10), 2275-2288. [CrossRef]
- Kavanagh, A.S., Nykänen, M., Hunt, W., Richardson, N., Jesson, M.J. 2019. Seismic surveys reduce cetacean sightings across a large marine ecosystem. Scientific Reports, 9, 10. [CrossRef]
- Parsons, E.C.M. 2012. The negative Impacts of Whale-watching. Journal of Marine Biology, 1, 1-10. [CrossRef]
- Bailey, H., Senior, B., Simmons, D., Rusin, J., Picken, G., Thompson, P.M. 2010. Assessing underwater noise levels during pile-driving at an offshore windfarm and its potential effects on marine mammals. Marine Pollution Bulletin, 60(6), 888-897. [CrossRef]
- Nichols, C., Bejder, L., Green, L., Johnson, C., Keeling, L., Noren, D., Van der Hoop, J., Simmonds, M. 2020. Anthropogenic threats to wild Cetacean Welfare and a Tool to Inform Policy in This Area. Frontiers in Veterinary Science, 57(7), 1-12. [CrossRef]
- Sahri, A., Herwata Putra, M.I., Kusuma Mustika, P.L., Kreb, D., Murk, A.J. 2021. Cetacean habitat modelling to inform conservation management, marine spatial planning, and as a basis for anthropogenic threat mitigation in Indonesia. Ocean and Coastal Management, 205, 1-20. [CrossRef]
- Wade, P.R., Long, K.J., Francis, T.B., Punt, A.E., Hammond, P.S., Heinemann, D., Moore, J.E., Reeves, R.R., Sepúlveda, M., Sullaway, G., Sigurðsson, G.M., Siple, M.C., Vikingsson, G.A., Williams, R., Zerbini, A.N. 2021. Best practices for assessing and managing bycatch of marine mammals. Frontiers in Marine Science, 8, 1-19. [CrossRef]
- Kiszka, J.J., Woodstock, M.W., Heitaus, M.R. 2022. Functional Roles and Ecological Importance of Small Cetaceans in Aquatic Ecosystems, Frontiers in Marine Science, 9, 7. [CrossRef]
- Lettrich, M.D., Asaro, M.J., Borggaard, D.L., Dick, D.M, Griffis, R.B., Litz, J.A., Orphanides, C.D., Palka, D.L., Pendleton, D.E., Soldevilla, M.S. 2019. A Method for Assessing the Vulnerability of Marine Mammals to a Changing Climate, NOAA Technical Memo. NMFS-F/SPO-196, 73. [CrossRef]
- Zacharias, M., Roff, J. 2001. Use of focal species in marine conservation and management: A review and critique. Aquatic Conservation Marine and Freshwater Ecosystems, 11(1), 59-76. [CrossRef]
- Pace D.S., Tizzi, R., Mussi, B. 2015, Cetaceans Value and Conservation in the Mediterranean Sea. Journal of Biodiversity Endangered Species, 1-24. [CrossRef]
- Hammond, P.S., Lacey, C., Gilles, A., Viquerat, S., Börjesson, P., Herr, H., Macleod, K., Ridoux, V., Santos, M.B., Scheidat, M., Teilmann, J., Vingada, J., Øien, N. 2017. Estimates of cetacean abundance in European Atlantic waters in summer 2016 from the SCANS-III aerial and shipboard surveys. St Andrews: Sea Mammal Research Unit. [CrossRef]
- Evans, W.E. 1994. Common dolphin, Delphinus delphis, Linnaeus, 1758. Ridgway SH, Harrison R (eds). Handbook of marine mammals. University Press, London, 191–224.
- Murphy, S., Pinn, E., and Jepson, P. 2013. The short-beaked common dolphin (Delphinus delphis) in the North-eastern Atlantic: distribution, ecology, management and conservation status. Hughes RN, Hughes DJ, Smith IP, eds. CRC Press. Oceanography and Marine Biology, 51, 193-280. [CrossRef]
- Gilles, A., Authier, M., Ramirez-Martinez, N.C, Araújo, H., Blanchard, A., Carlström, J., Eira, C., Dorémus, G., Fernández, Maldonado, C., Geelhoed, S.C.V., Kyhn. L., Laran, S., Nachtsheim, D., Panigada, S., Pigeault, R., Sequeira, M., Sveegaard, S., Taylor, N.L., Owen, K., Saavedra, C., Vázquez-Bonales, J.A., Unger, B., Hammond, P.S. 2023. Estimates of cetacean abundance in European Atlantic waters in summer 2023 from the SCAN-IV aerial and shipboard survey, 64. [CrossRef]
- Silva, M.A., Sequeira, M. 2003. Patterns in the mortality of common dolphins (Delphinus delphis) on the Portuguese coast, using stranding records, 1975-1998, Aquatic Mammals, 29(1), 88-98. [CrossRef]
- Marçalo, A., Katara, I., Feijo, D., Araújo, H., Oliveira, I., Santos, J., Ferreira, M., Monteiro, S., Pierce, G.J., Silva, A., Vingada, J. 2015. Quantification of interactions between the Portuguese sardine purse-seine fishery and cetaceans. ICES Journal of Marine Science, 72(8), 2438-2449. [CrossRef]
- Marçalo, A. Nicolau, L., Giménez, J., Ferreira, M., Santos, J., Araújo, H., Silva, A., Vingada, J., Pierce, G.J. 2018. Feeding ecology of the common dolphin (Delphinus delphis) in Western Iberian waters: has the decline in sardine (Sardina pilchardus) affected dolphin diet. Marine Biology, 165(44), 1-16. [CrossRef]
- Vingada, J., Eira, C. (2018). Conservação de Cetáceos e Aves Marinhas em Portugal Continental. Aveiro: Life+ MarPro. www.marprolife.org.
- Dias, I.C., Marçalo, A., Feijó, D., Domingos, I., Silva, A.A. 2022. Interactions between the common dolphin, Delphinus delphis, and the Portuguese purse seine fishery over a period of 15 years (2003–2018). Aquatic Conservation: Marine and Freshwater Ecosystems, 32(8), 1351–1364. [CrossRef]
- ICES. 2024. Working Group on Bycatch of Protected Species (WGBYC). ICES Scientific Reports, 5(111), 334. [CrossRef]
- Silva, M.A. 1999. Diet of common dolphins, Delphinus delphis, off the Portuguese continental coast. Journal of Marine Biology, 79, 531-540. [CrossRef]
- Spitz, J., Mourocq, E., Ridoux, V. 2010. Prey selection by the common dolphin: Fulfilling high energy requirements with high quality food. Journal of Experimental Marine Biology, 390, 73-77. [CrossRef]
- Young, D.D., Cockcroft, V.G. 1994. Diet of common dolphins (Delphinus delphis) of the south-east coast of southern Africa: opportunism or specialization?. Journal of Zoology, 234, 41–53. [CrossRef]
- Santos M.B., Pierce, G.J., Reid, R.J., Ross, H.M., Patterson, I.A.P., Reid, D.G., Peach, K. 2004. Variability in the diet of harbour porpoises (Phocoena phocoena) in Scottish waters 1992–2003. Marine Mammal Science, 20(1), 27. [CrossRef]
- Santos, M.B., German, I., Correia, D., Read, F.L., Cedeira, J.M., Caldas, M., Lopez, A., Velasco, F., Pierce, G.J. 2013. Long-term variation in common dolphin diet in relation to prey abundance. Marine Ecology Progress Series, 481, 24-268. [CrossRef]
- Santos, M.B., Saavedra, C., Pierce, G.J. 2014. Quantifying the predation on sardine and hake by cetaceans in the Atlantic waters of the Iberian Peninsula. Deep Sea Research Part II: Topical Studies in Oceanography, 106, 232-244. [CrossRef]
- Charnov, E.L. 1976. Optimal foraging, the marginal value theorem. Theoretical Population Biology, 9(2), 129-136. [CrossRef]
- Fiuza, A.F.G. 1983. Upwelling patterns of Portugal. Suess E, Thiede J (eds). Coastal upwelling. Its sediment records (Part A). Plenum, New York, 85–98. [CrossRef]
- Peliz, A., Rosa, T.L, Santos, M.P., Pissarra, J.L. 2002. Fronts, jets and counter flows in the Western Iberian upwelling system. Journal of Marine Systems, 35, 61–77. [CrossRef]
- Borges, M. F., Santos, A. M., Crato, N., Mendes, H., and Mota, B. 2003. Sardine regime shifts off Portugal: a time series analysis of catches and wind conditions. Scientia Marina, 67, 235-244. [CrossRef]
- Santos, M.B., González-Quirós, R., Riveiro, I., Cabanas, J.M., Porteiro, C., Pierce, G.J. 2012. Cycles, trends, and residual variation in the Iberian sardine (Sardina pilchardus) recruitment series and their relationship with the environment. ICES Journal of Marine Science, 69, 739–750. [CrossRef]
- Lemos, R.T. 2004. The upwelling regime of the Portuguese coast, 1941–2000. Climate Research, 24, 511–524. [CrossRef]
- Leitão, F., Maharaj, R.R., Vieira, V.M.N.C.S., Teodósio, A., Cheung, W.W.L. 2018. The effect of regional sea surface temperature rise on fisheries along the Portuguese Iberian Atlantic coast. Aquatic Conservation: Marine Freshwater Ecosystem, 28(1), 1351-1359. [CrossRef]
- Silva, A., Moreno, A., Riveiro, I., Santos, B., Pita, C., Garcia Rodrigues, J., Villasante, S., Pawlowski, L., Duhamel, E. (2015). Research for Pech Committee - Sardine fisheries: Resource Assessment and Social and Economic situation. Directorate-General for Internal Policies Policy Department BL Structural and Cohesion Policies.
- Teixeira, C.M., Gamito, R., Leitão, F., Murta, A.G., Cabral, H.N., Erzini, K., Costa, M.J. 2016. Environmental influence on commercial fishery landings of small pelagic fish in Portugal. Regional Environmental Change, 16(3), 709–716. [CrossRef]
- Silva, A., Garrido, S., Ibaibarriaga, L., Pawlowski, L., Riveiro, I., Marques, V., Ramos, F., Duhamel, E., Iglesias, M., Bryère, P., Mangin, A., Citores, L., Carrera, P., Uriate, A. 2018. Adult-mediated connectivity and spatial population structure of sardine in the Bay of Biscay and Iberian coast. Deep Sea Research Part II, 159, 62-74. [CrossRef]
- Monteiro, P.V. 2017. The purse seine fishing of sardine in Portuguese waters: A difficult compromise between fish stock sustainability and fishing effort. Reviews in Fisheries Science & Aquaculture, 1-7. [CrossRef]
- ICES, 2020. Working Group on Southern Horse Mackeral, Anchovy and Sardine (WGHANSA). ICES Scientific Reports. 2(41), 655. [CrossRef]
- Wise, L., Silva, A., Ferreira, M., Silva, M., Sequeira, W. 2007. Interactions between small cetaceans and the purse seine fishery in western Portuguese waters. Scientia Marina, 71(2), 405-412. [CrossRef]
- Wise, L., Galego, C., Katara, I., Marçalo, A., Meirinho, A., Monteiro, S.S., Oliveira, N., Santos, J., Rodrigues, P., Araújo, H., Vingada, J., Silva, A. 2018. Portuguese purse seine fishery spatial and resource overlap with top predators. Marine Ecology Progress Series, 617-618:183-198. [CrossRef]
- Marçalo, A., Carvalho, F., Frade, M., Bentes, L., Monteiro, P. Pontes, J., Alexandre, S., Oliveira, F., Kingston, A., Erzini, K., Gonçalves, J.M.S. 2025. Reducing cetaceans interactions with bottom set-nets and purse seining using acoustic deterrent devcies in southern Iberia. Auatic Convervation: Marine and Freshwater Ecosystems, 35(2), 15. [CrossRef]
- ICES. 2021. The Workshop for the evaluation of the Iberian sardine HCR (WKSARHCR). ICES Scientific Reports. 3(49), 115. [CrossRef]
- Serra, N., Ambar, I. 2002. Eddy Generation in the Mediterranean Undercurrent, Deep Sea Research Part II, Topical Studies in Oceanography, 49(19), 4225-4243. [CrossRef]
- Álvarez-Salgado, X.A., Figueiras, F.G., Pérez, F.F., Groom, S., Nogueira, E., Borges, A.V., Chou, L., Castro, C.G., Moncoiffé, G., Ríos, A.F., Miller, A.E.J., Frankignoulle, M., Savidge, G., Wollast, R. 2003. The Portugal coastal counter current off NW Spain: new insight on its biogeochemical variability. Progress in Oceanography, 56, 281-321. [CrossRef]
- ICES. 2012. Report of the Working Group on Southern Horse Mackerel, Anchovy and Sardine (WGHANSA), Azores (Horta), Portugal. ICES CM. 16, 544. https://ices-library.figshare.com/articles/report/Report_of_the_Working_Group_on_Southern_Horse_Mackerel_Anchovy_and_Sardine_WGHANSA_/19281419?file=34239803.
- IPMA 2023. Plano de Campanha: Campanha de Rastreio Acústico “PELAGO23” Série PNAB/DCF – PELAGO (Primavera), 40.
- Tasker, M.L., Jones, P.H., Dixon, T., Blake, B.F. 1984. Counting seabirds at sea from ships: A review of methods employed and a suggestion for a standardized approach. The Auk, 101(3), 567-577. [CrossRef]
- Camphuysen, K.C.J., Fox, T.A.D., Leopold, M.M.F., Peterson, I.K. 2004. Towards standardised seabirds at sea census techniques in connection with environmental impact assessments for offshore wind farms in the U.K. COWRIE, Crown Estate, London. [CrossRef]
- R Core Team (2024). R: A language and environment for statistical computing. R Foundation for Statistical Computing, Vienna, Austria. URL https://www.R-project.org/.
- QGIS (2019). QGIS Geographic Information System. Open Source Geospatial Foundation Project. http://qgis.org.
- Hammond, P.S., Macleod, K., Gillespie, D., Swift, R., Winship, A., Canadas, A. 2009. Cetacean Offshore Distribution and Abundance in the European Atlantic (CODA). University of St. Andrews, 43. Microsoft Word - CODA Final Report 11-2-09.doc.
- Silva, A.A., Castro, J., Cid, A., Jesus, S.M., Matos, F.L. 2024. Influence of Dolphin-Watching Tourism Vessels on the Whistle Emission Pattern of Common Dolphins and Bottlenose Dolphins. Oceans, 5(4), pp. 770-784.
- Rodríguez-Climent, S., Angélico, M.M., Marques, V., Oliveira, P., Wise, L., Silva, A. 2017. Essential habitat for sardine juveniles in Iberian water. Scientia Marina, 81(3), 351-360. [CrossRef]
- Ryan, J., Chavez, F. and Bellingham, J. 2005. Physical-biological coupling in Monterey Bay, California: topographic influences on phytoplankton ecology. Marine Ecology Progress Series, 287, 23-32. [CrossRef]
- Salgado Kent, C., Bouchet, P., Wellard, R., Parnum, I., Fouda, L. and Erbe, C. 2021. Seasonal productivity drives aggregations of killer whales and other cetaceans over submarine canyons of the Bremer Sub-Basin, south-western Australia. Australian Mammalogy, 43(2), 168. [CrossRef]
- Vieira, N., Carvalho, I., Brito, C. 2009. Occurrence and relative abundance of common dolphins in three sites of the Portuguese shore. International Whaling Commission IWC. IWC - SC/61/SM16 , 7.
- Certain, G., Ridoux, V., van Canneyt, O., Bretagnolle, V. 2008. Delphinid spatial distribution and abundance estimates over the shelf of the Bay of Biscay. ICES Journal of Marine Science, 65, 656–666. [CrossRef]
- De la Cruz, A., Ramos, F., Navarro, G., Cózar, A., Bécares, J., Arroyo, G.M. 2020. Drivers for spatial modelling of a critically endangered seabird on a dynamic ocean area: Balearic shearwaters are non-vegetarian. Aquatic Conservation: Marine and Freshwater Ecosystems, 31, 1700-1714. [CrossRef]
- Lin, C., Lin, H., Suen, J. and Chou, L. 2021. Association between estuary characteristics and activities of the critically endangered Indo-Pacific humpback dolphin (Sousa chinensis). Frontiers in Marine Science, 8, 8. [CrossRef]
- García-García, L.M., Ruiz-Villarreal, M., Bernal, M. 2016. A biophysical model for simulating early life stages of sardine in the Iberian Atlantic stock, Fisheries Research, 173(3), 250-272. [CrossRef]
- Directorate-General for Natural Resources (DGRM). 2012. Sardine Fishery Management Plan – (2012-2015).
- Szalaj, D., Torres, M.A., Veiga-Malta, T., Angélico, M.M., Sobrinho-Gonçalves, L., Chaves, C., Alcoforado, B., Garrido, S., Ré, P., Cabral, H., Silva, A. 2021. Food-web dynamics in the Portuguese continental shelf ecosystem between 1986 and 2017: Unravelling drivers of sardine decline. Estuarine, Coastal and Shelf Science, 251, 107259. [CrossRef]
- Bearzi, G., Politi, E., Agazzi, S., Azzellino, A. 2006. Prey depletion caused by overfishing and the decline of marine megafauna in eastern Ionian Sea coastal waters (central Mediterranean). Biological Conservation, 127, 373–382. [CrossRef]
- DRGM. 2018. Multiannual Management and Recovery Plan for the Iberian Sardine (2018-2023).
- ICES. 2017. Report of the working group on southern horse mackerel, anchovy and sardine (WGHANSA), Bilbao, Spain, 17. ICES CM: 2017/ACOM, 47. https://core.ac.uk/outputs/95151175/.
- Feijó, D., Marçalo, A., Wise, L., Bentos, T., Barra, J., Correia, M., Pinto, D., Lechuga, R., Felíco, M., Dinis, .D., Inácio, M., Pereira, D., Abreu, P., Lagarto, N., Maia, C., Gomes, P., Luísa Ferreira, A., Silva, D., Fernandes, A., Pero, M., Barbosa, C., Lino, P., Sofia, J.L., Simões, T., Silva, A., 2018. The Portuguese purse seine fishery (2006-2016): what has changed in 10 years? Fisheries in Mediterranean Environments, 4. [CrossRef]
- Hammond, P., Macleod, K., Berggren, P., Borchers, D., Burt, L., Cañadas, A., Desportes, G., Donovan, G., Gilles, A., Gillespie, D., Gordon, J., Hiby, L., Kuklik, I., Leaper, R., Lehnert, K., Leopold, M., Lovell, P., Øien, N., Paxton, C., Ridoux, V., Rogan, E., Samarra, F., Scheidat, M., Sequeira, M., Siebert, U., Skov, H., Swift, R., Tasker, M., Teilmann, J., Van Canneyt, O. and Vázquez, J. 2013. Cetacean abundance and distribution in European Atlantic shelf waters to inform conservation and management. Biological Conservation, 164, 107-122. [CrossRef]
- Hammond, P.S., Francis, T.B., Heinemann, D., Long, K.J., Moore, J.E., Punt, A.E., Reeves, R.R., Sepúlveda, M., Sigurðsson, G.M., Siple, M.C., Víkingsson, G., Wade, P.R., Williams, R., Zerbini, A.N. 2021. Estimating the abundance of marine mammal populations. Frontiers of Marine Science, 27(8), 1-27. [CrossRef]
- Ross G.J.B., Cockcroft V.G., Butterworth D.S. 1987. Offshore distribution of bottlenose dolphins in Natal coastal waters and Algoa Bay, Eastern Cape, South African. Journal of Zoology, 22, 50-56. [CrossRef]
- Hastie, G.D.,J., Swift, R.S., Slesser, G., Thompson, P.M., Turrell, W.R. 2005. Environmental models for predicting oceanic dolphin habitat in the Northeast Atlantic, ICES Journal of Marine Science, 62(4), 760–770. [CrossRef]
- Davis, R. W., Fargion, G. S., May, N., Leming, T. D., Baumgartner, M., Evans, W. E., Mullin, K. 1998. Physical habitat of cetaceans along the continental slope in the northcentral and western Gulf of Mexico. Marine Mammal Science, 14(3), 490-507. [CrossRef]
- Becker, E. A., Foley, D. G., Forney, K. A., Barlow, J., Redfern, J. V., Gentemann, C. L. 2012. Forecasting cetacean abundance patterns to enhance management decisions. Endangered Species Research, 16, 97–112. [CrossRef]
- Becker, A., Carretta, J.V., Forney, K.A., Barlow, J., Brodie, S., Hoopes, R., Jacox, M.G., Maxwell, S.M., Redfern, J.V., Sisson, N.B., Welch, H., Hazen, E.L. 2020. Performance evaluation of cetacean species distribution models developed using Generalized Additive Models and boosted regression trees. Ecology and Evolution, 10(12), 5759-5784. [CrossRef]
Figure 1.
Common dolphin sightings from 2005-2020: (a) Number of sightings during transects (grey dots denote the transect); (b) Heat map of sightings.
Figure 1.
Common dolphin sightings from 2005-2020: (a) Number of sightings during transects (grey dots denote the transect); (b) Heat map of sightings.
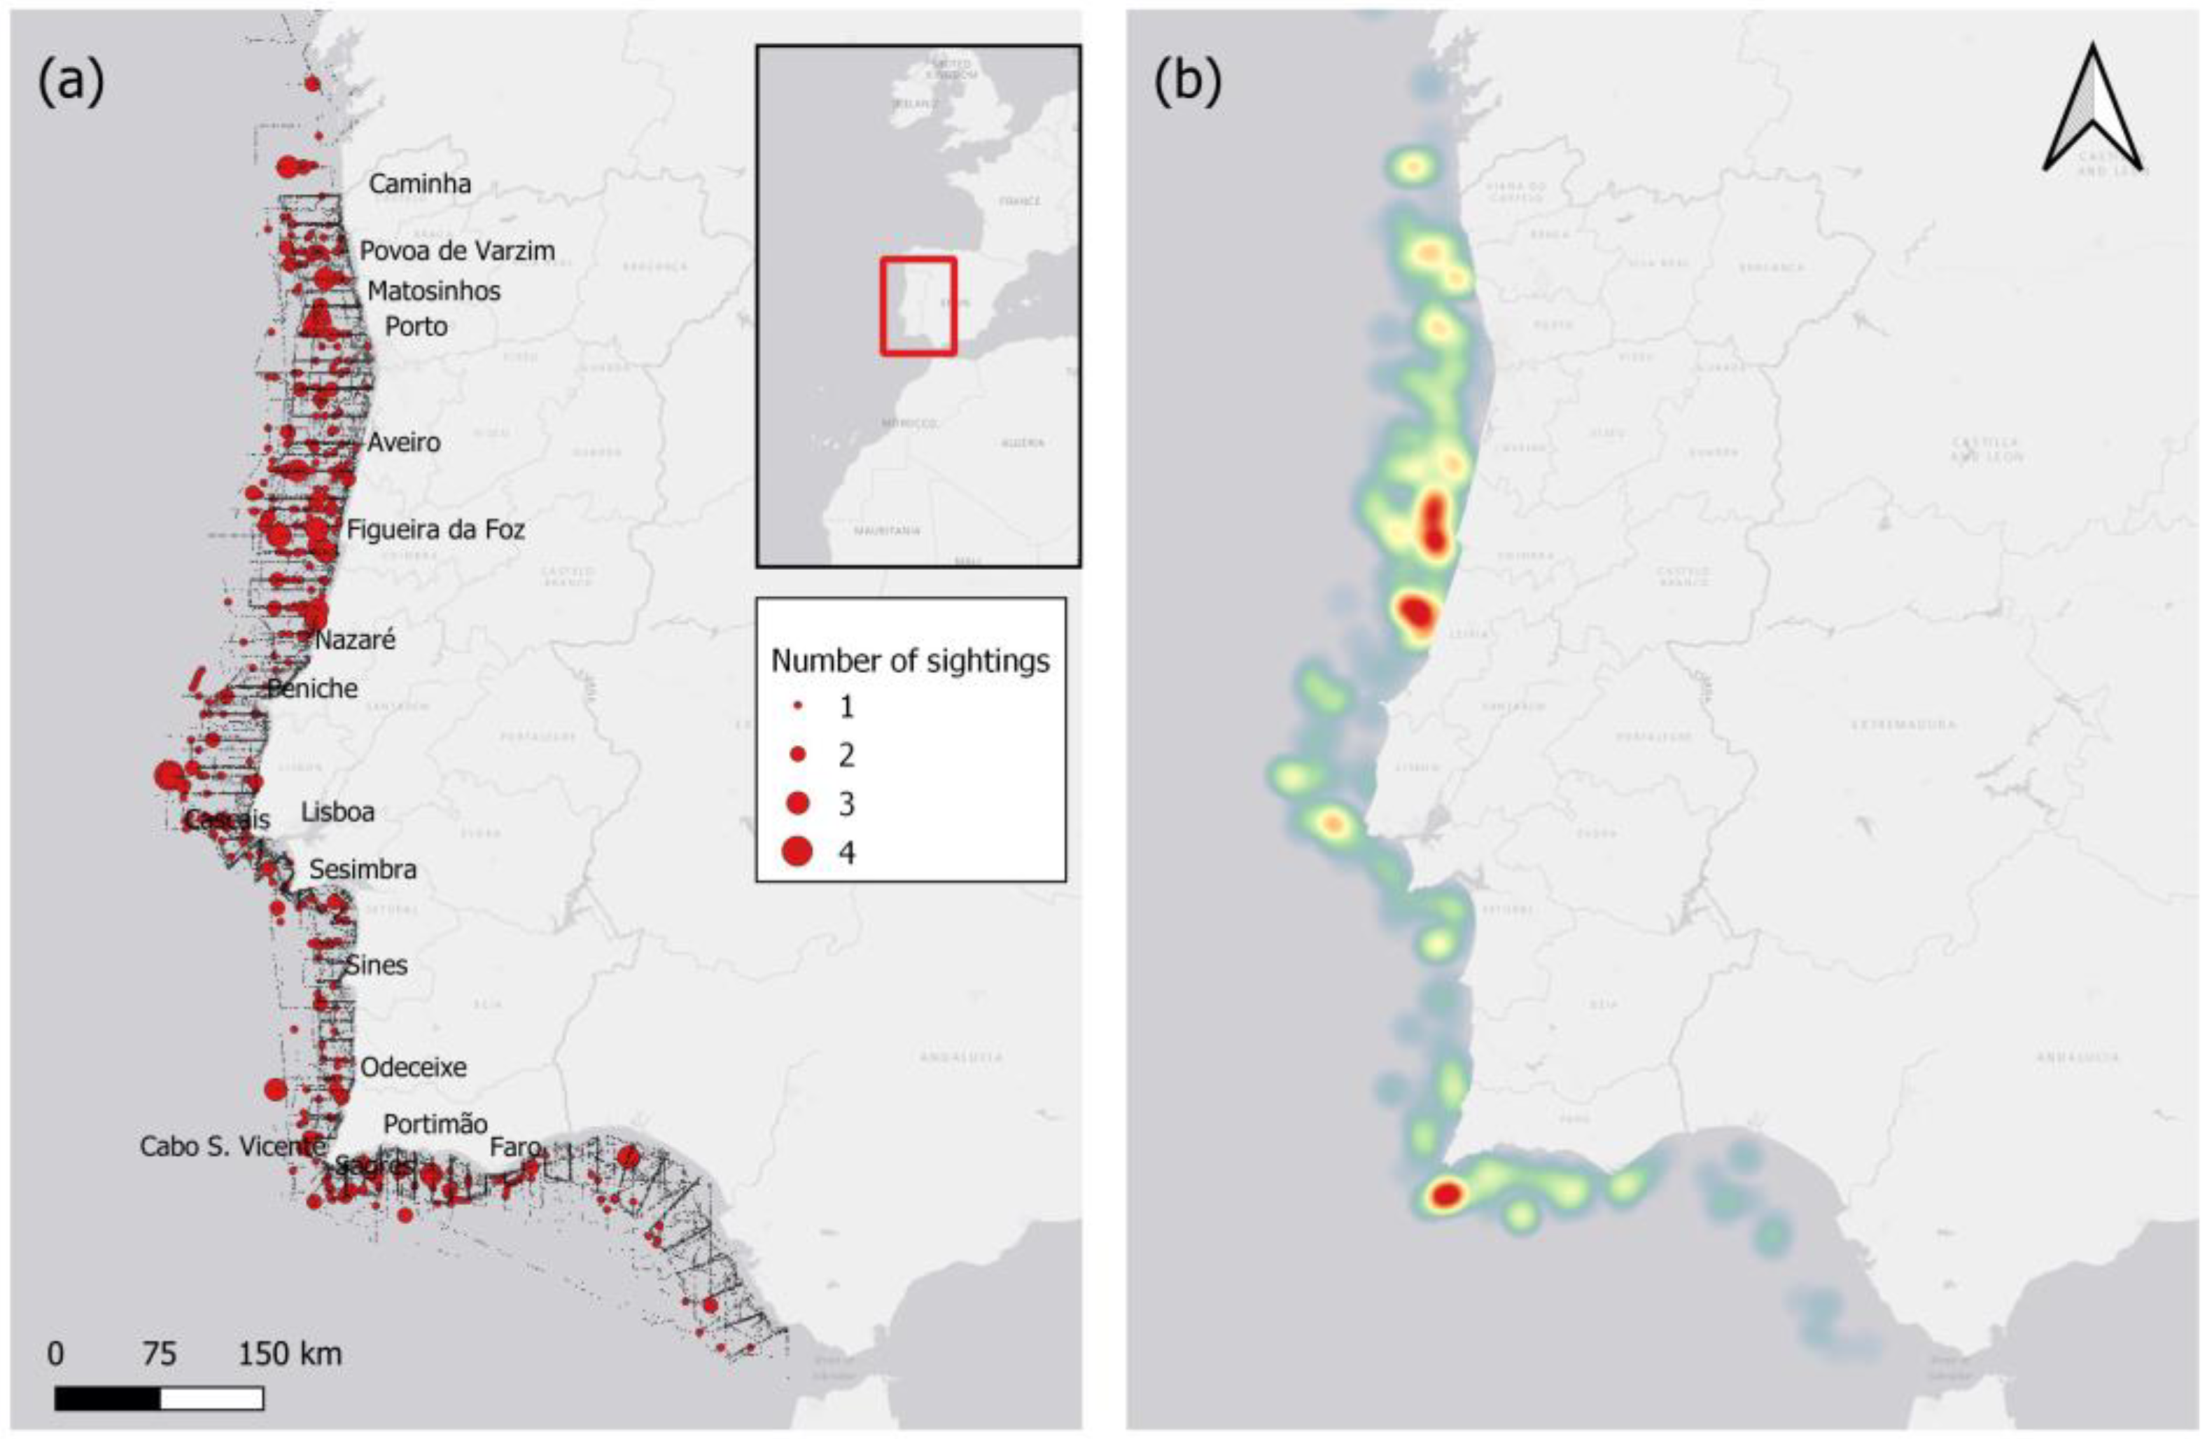
Figure 2.
Mean Encounter rate of the common dolphin per year (with standard error) across segments.
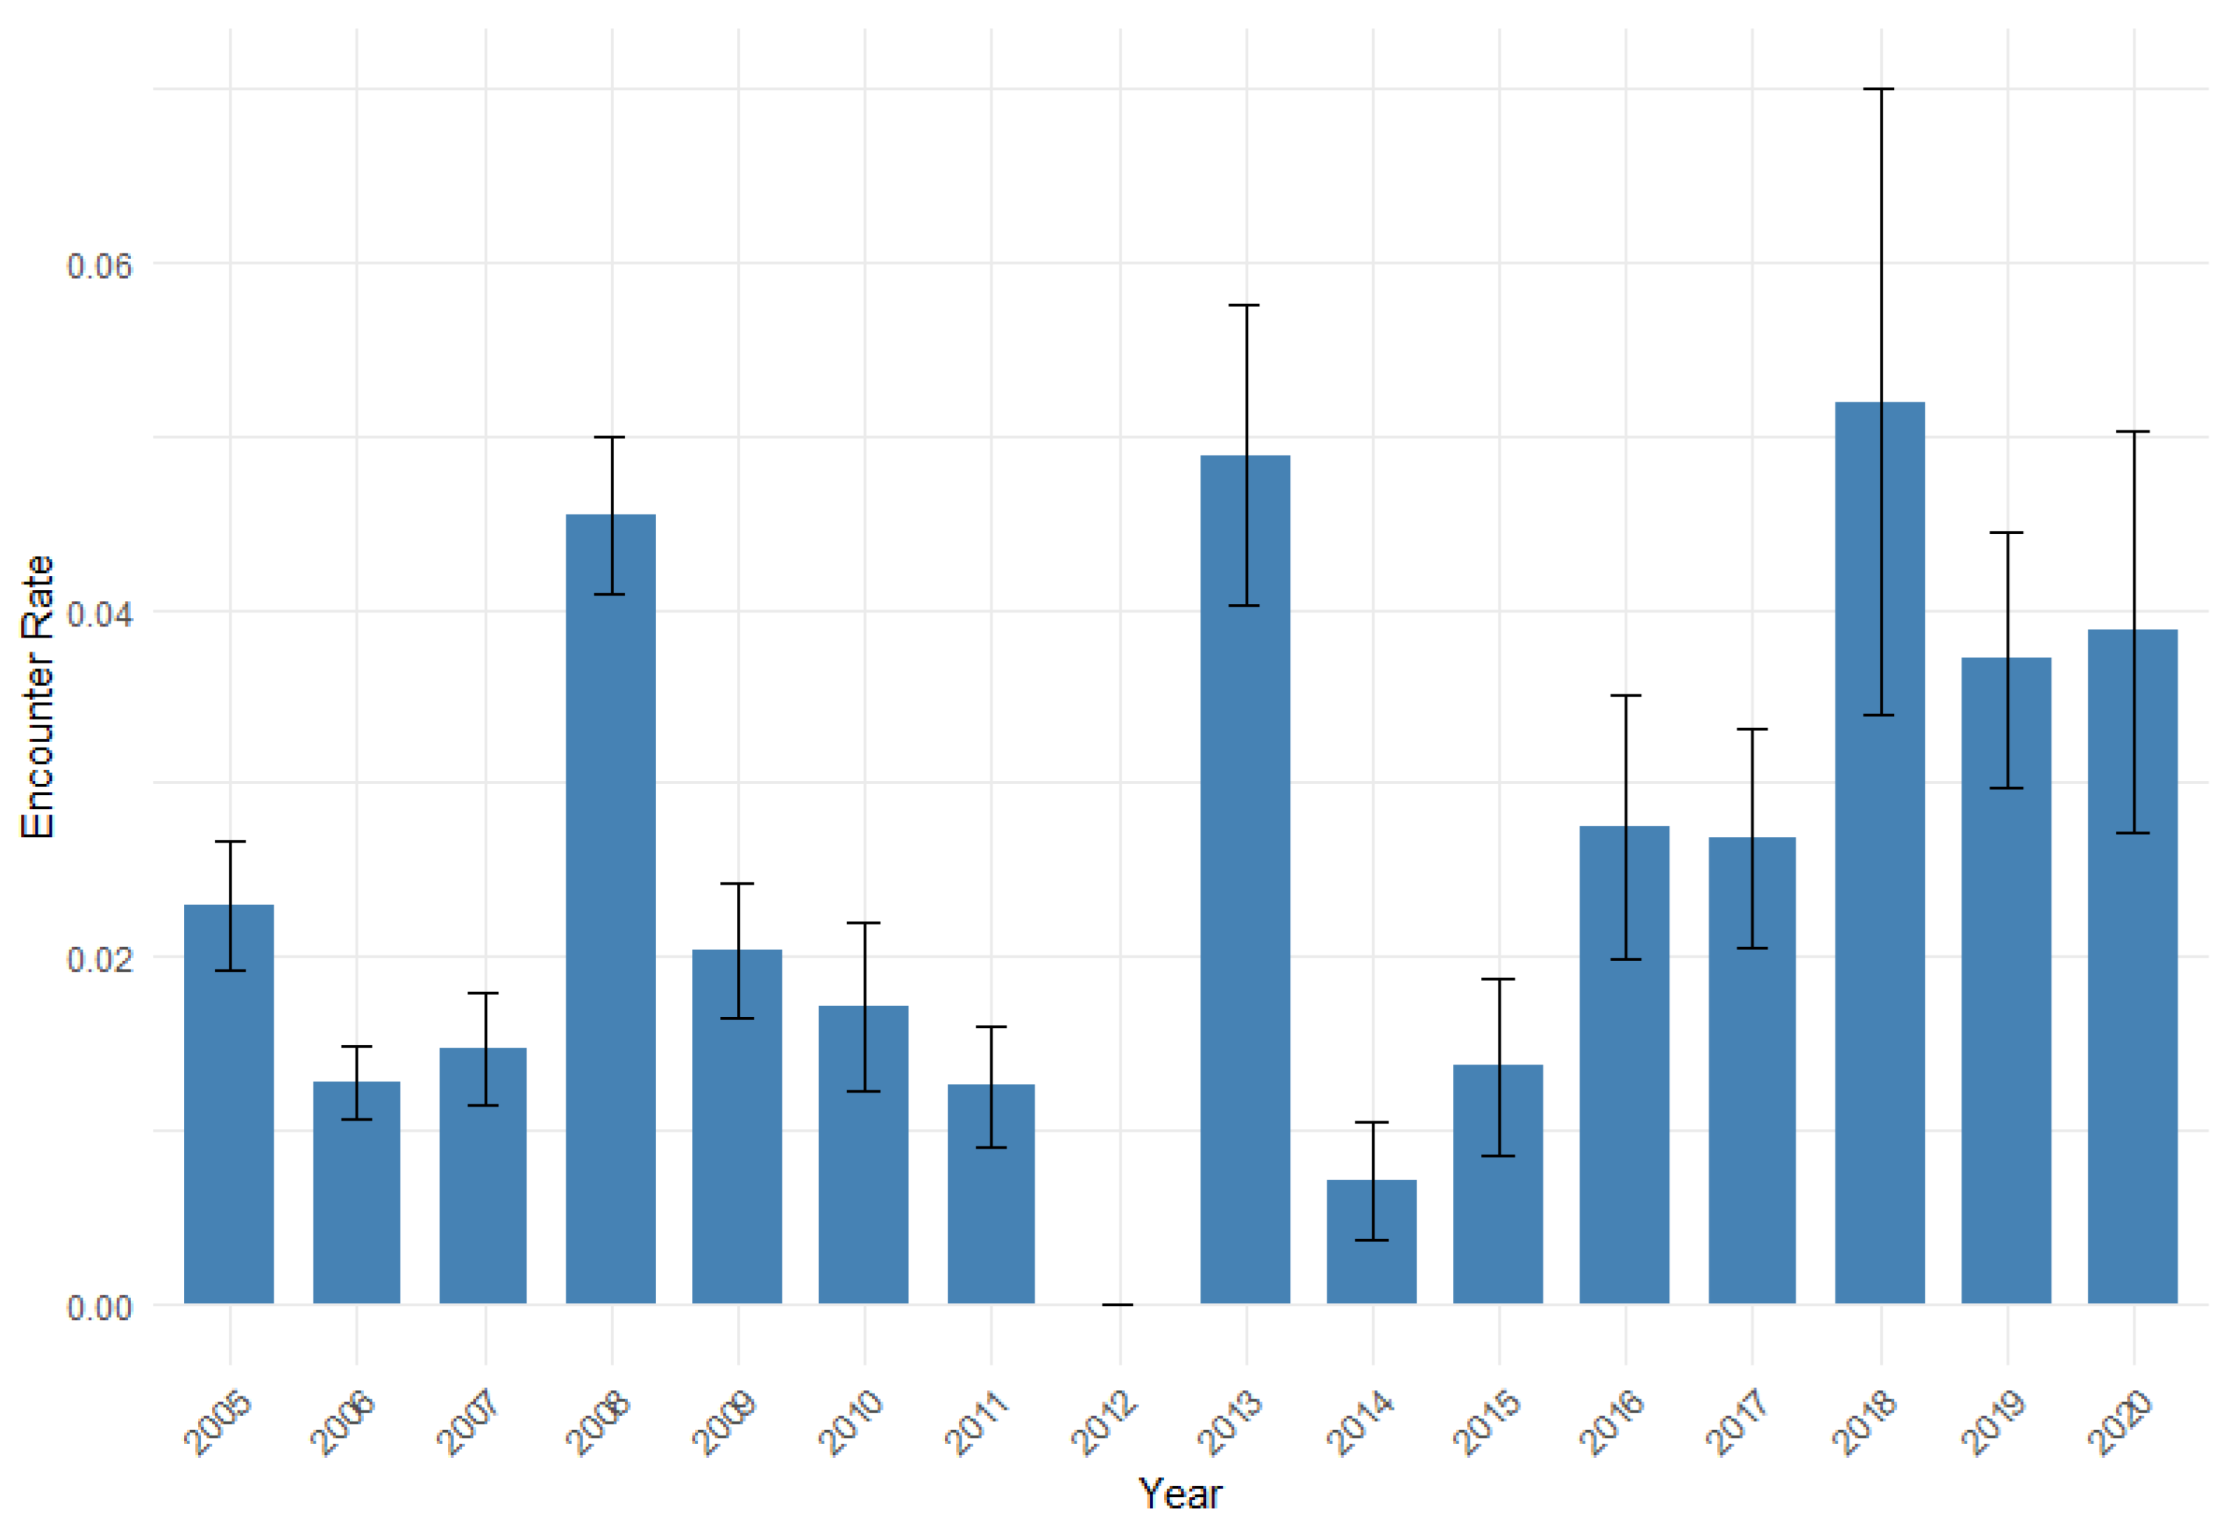
Figure 3.
The encounter rate (animals/km travelled) for the common dolphin (a) before and (b) after the Sardine Ban of 2012. Grid map with a cell resolution of 10km².
Figure 3.
The encounter rate (animals/km travelled) for the common dolphin (a) before and (b) after the Sardine Ban of 2012. Grid map with a cell resolution of 10km².
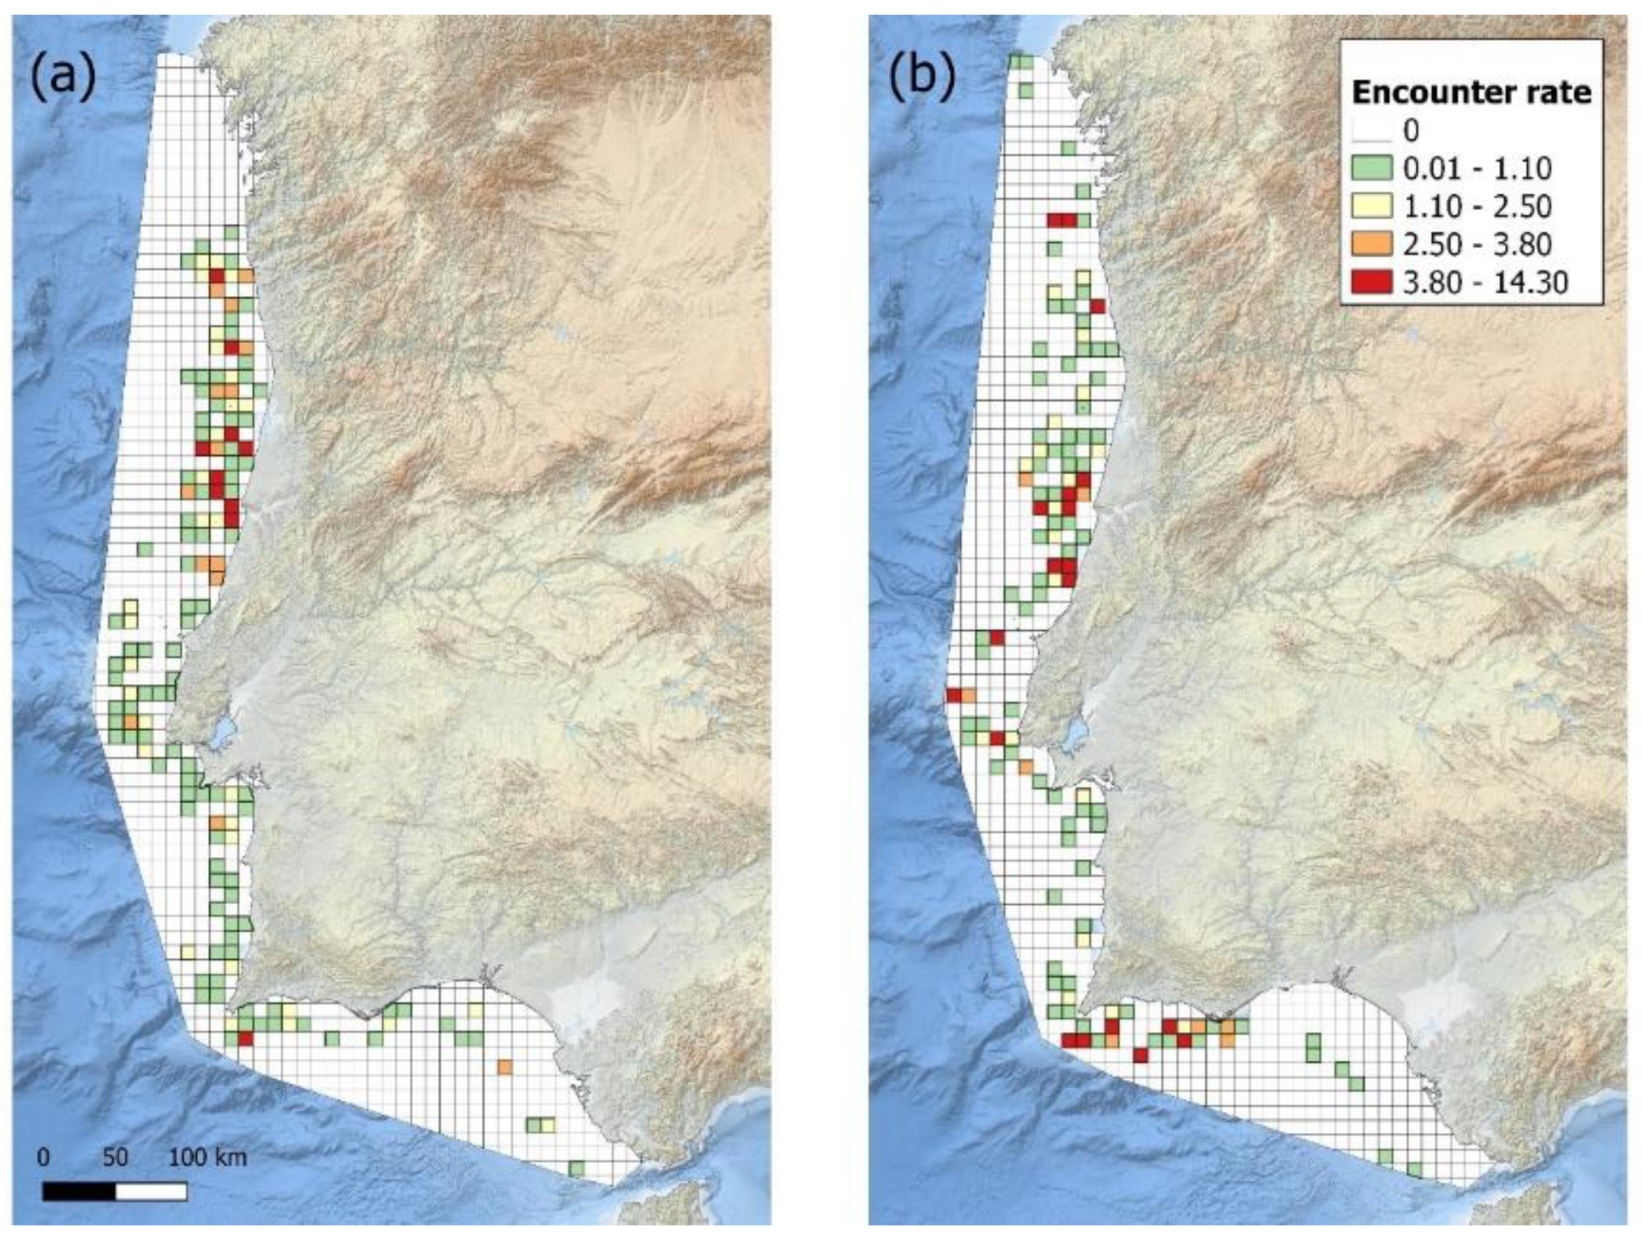
Figure 4.
The encounter rate (animals/km travelled) for the common dolphin for every four years; (a) 2005 – 2008, (b) 2009 – 2011, (c) 2013 – 2016, and (d) 2017 – 2020. Grid map with a cell resolution of 10km².
Figure 4.
The encounter rate (animals/km travelled) for the common dolphin for every four years; (a) 2005 – 2008, (b) 2009 – 2011, (c) 2013 – 2016, and (d) 2017 – 2020. Grid map with a cell resolution of 10km².
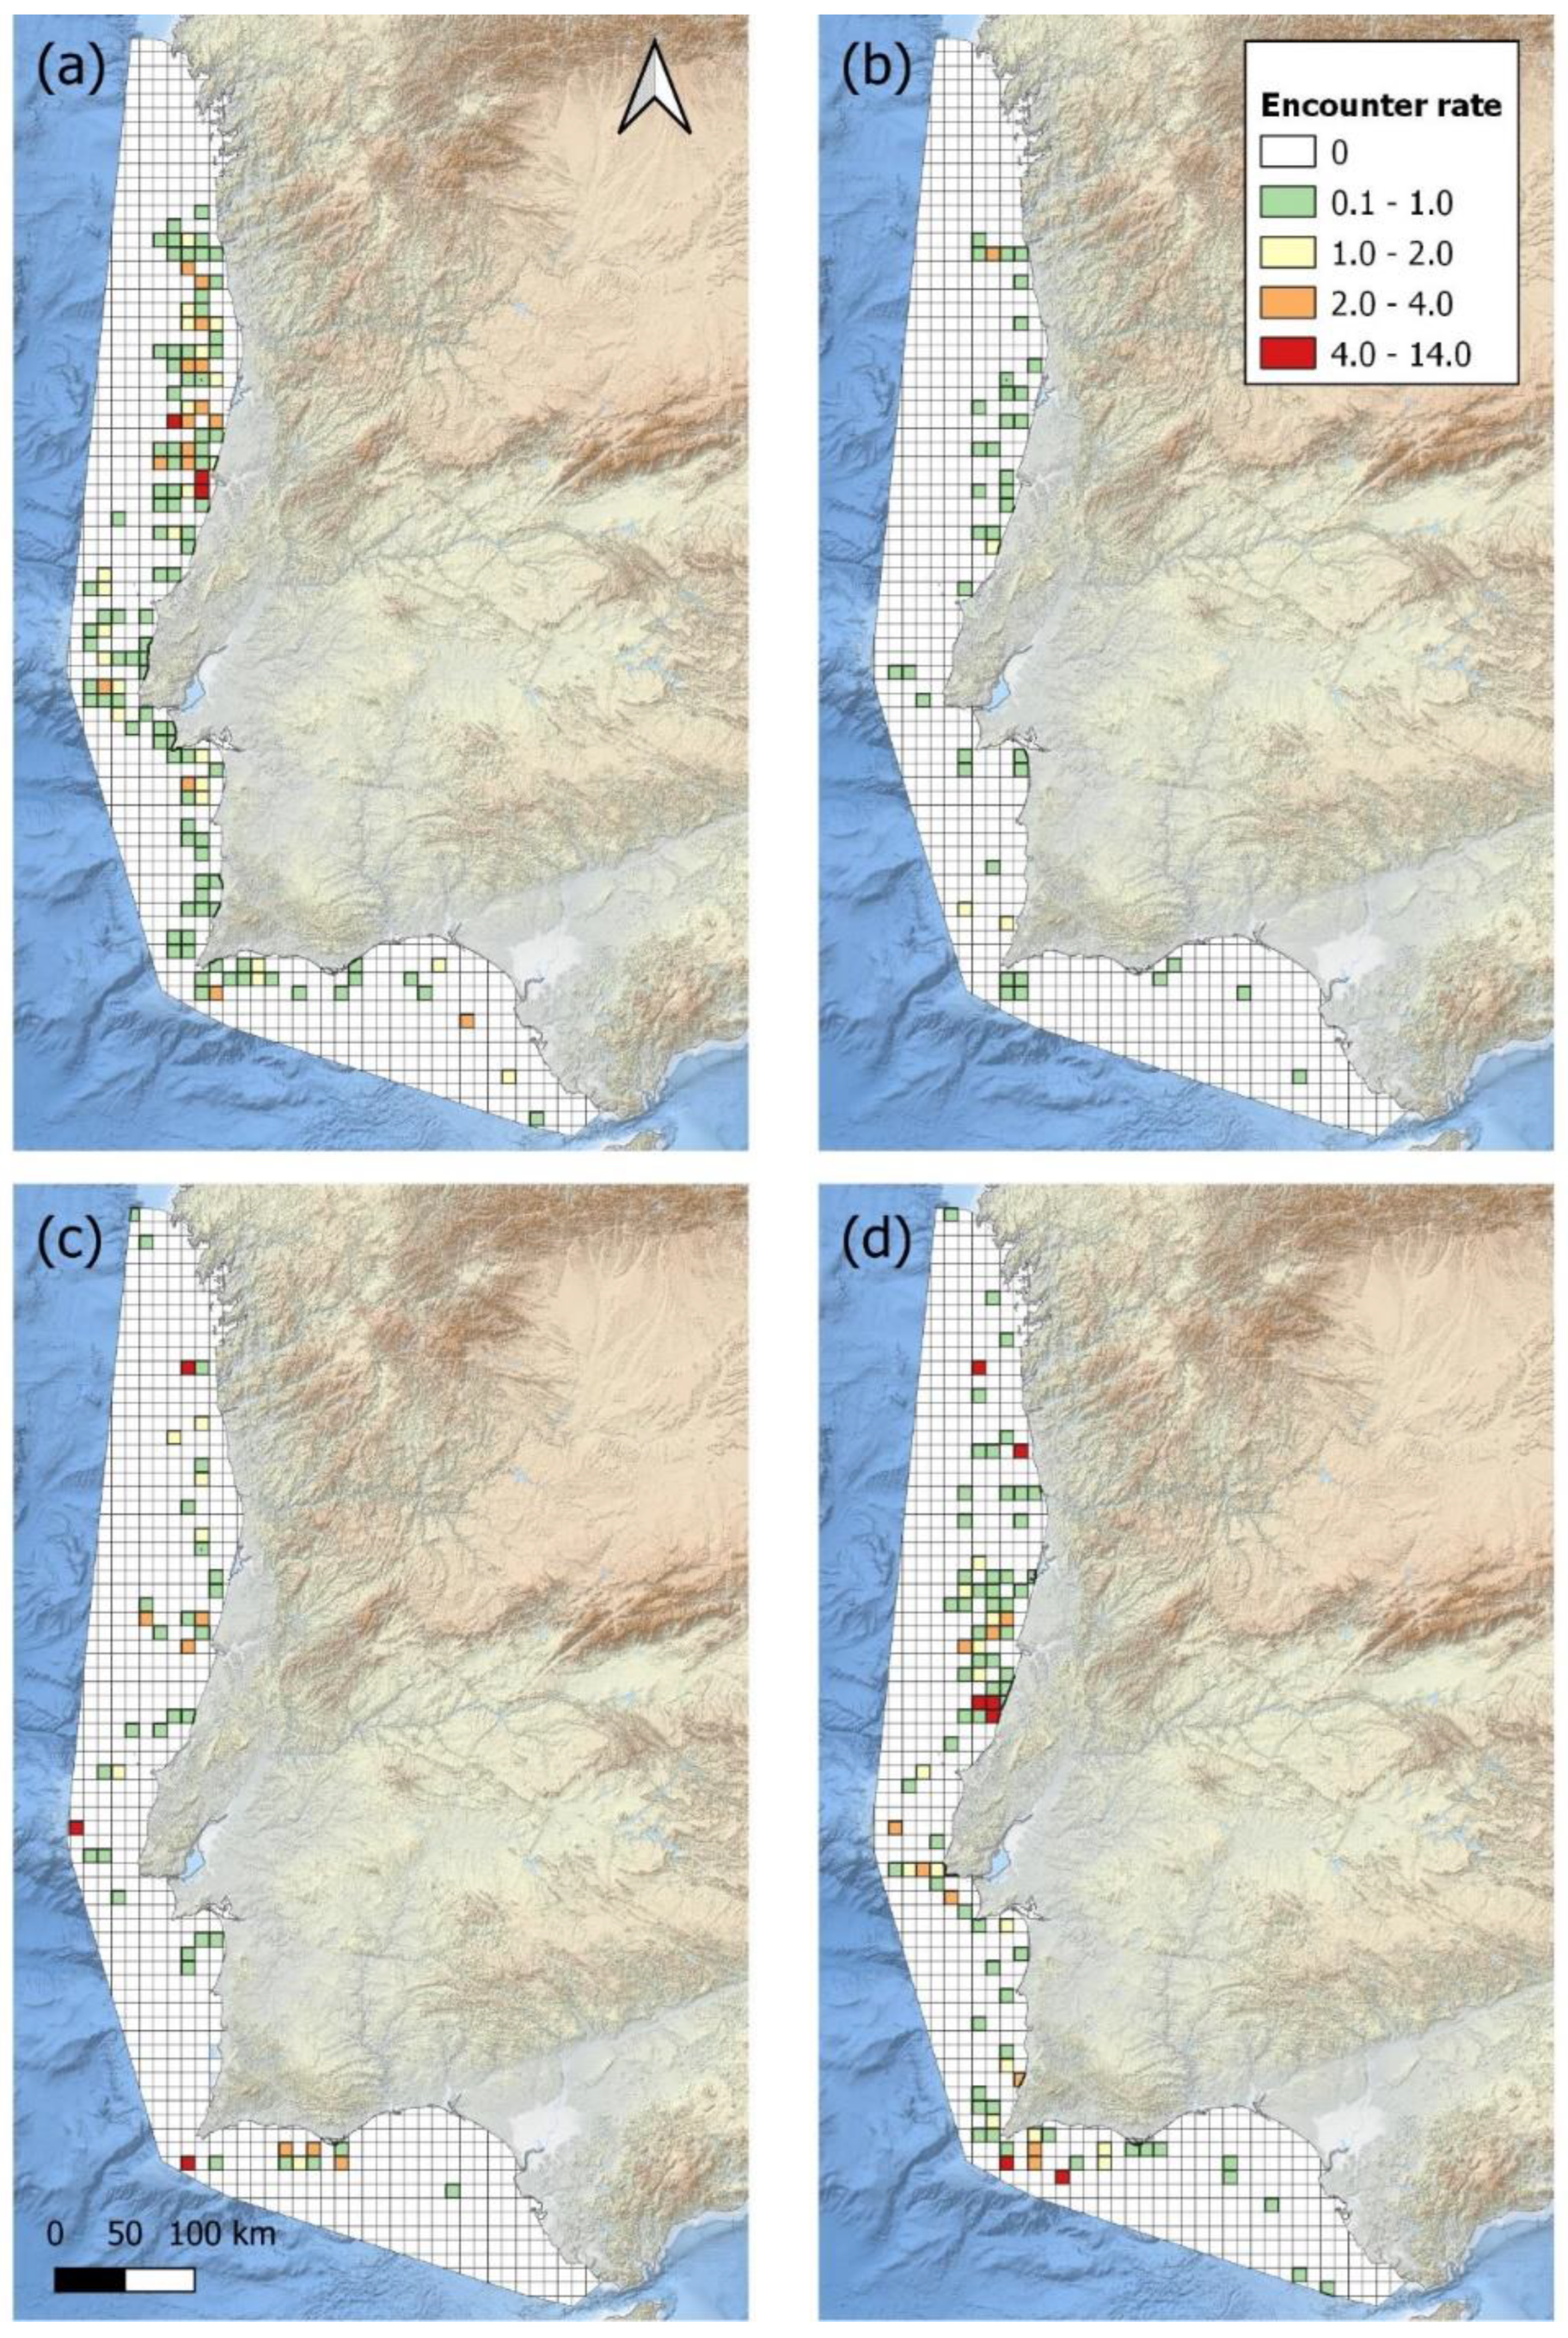
Figure 5.
Total sardine biomass (tons, red thick line) plotted with the mean distance from the coast of the common dolphin for each year (blue box plot). Black line represents the predicted dolphin distance from coast based on sardine biomass, using a smooth GAM curve with 95% confidence band (grey shaded area); sardine biomass data taken from WGHANSA [52].
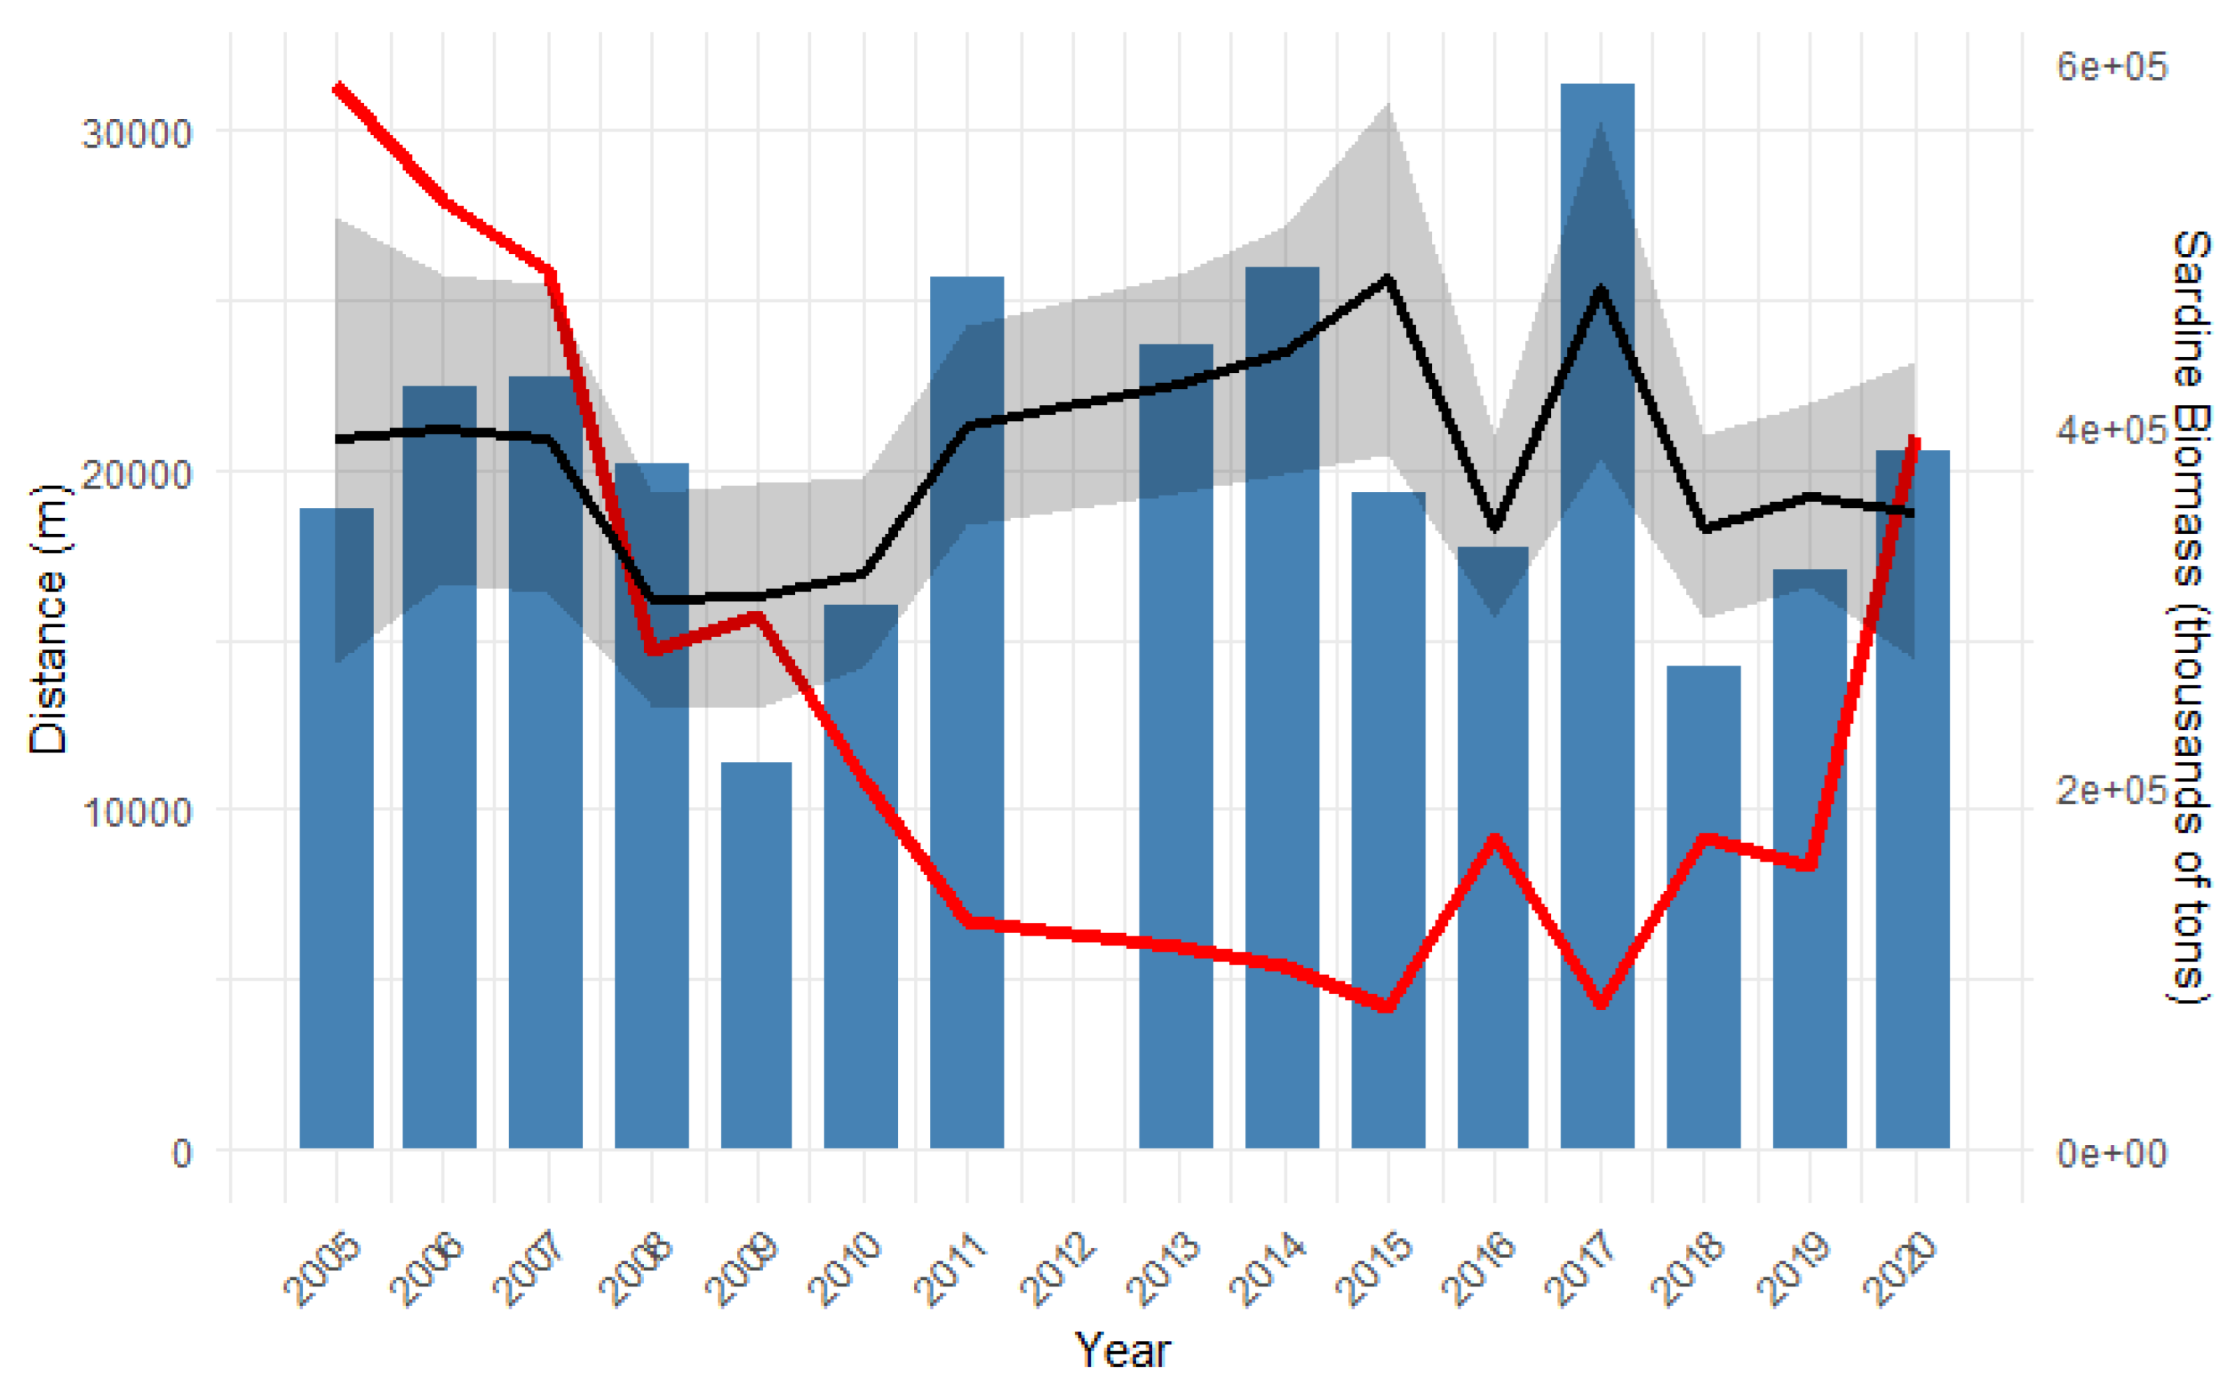
Figure 6.
Predicted distance (m) of the common dolphin from the coast based on a GAM, with sardine biomass (thousands of tons) as the predictor (dashed line represents corresponding 95% confidence bands).
Figure 6.
Predicted distance (m) of the common dolphin from the coast based on a GAM, with sardine biomass (thousands of tons) as the predictor (dashed line represents corresponding 95% confidence bands).
Disclaimer/Publisher’s Note: The statements, opinions and data contained in all publications are solely those of the individual author(s) and contributor(s) and not of MDPI and/or the editor(s). MDPI and/or the editor(s) disclaim responsibility for any injury to people or property resulting from any ideas, methods, instructions or products referred to in the content. |
© 2025 by the authors. Licensee MDPI, Basel, Switzerland. This article is an open access article distributed under the terms and conditions of the Creative Commons Attribution (CC BY) license (http://creativecommons.org/licenses/by/4.0/).
Copyright: This open access article is published under a Creative Commons CC BY 4.0 license, which permit the free download, distribution, and reuse, provided that the author and preprint are cited in any reuse.


