
Submitted:
03 April 2025
Posted:
04 April 2025
You are already at the latest version
Abstract
The growing environmental concerns associated with petroleum-based plastics require the development of sustainable, biodegradable alternatives. Polyhydroxyalkanoates (PHAs), a family of biodegradable bioplastics, offer promising potential as eco-friendly substitutes due to their renewable origin and favorable degradation properties. This research investigates the use of synthetic condensate mimicking the liquid fraction from drying and shredding of household food waste as a viable substrate for PHA production using mixed microbial cultures. Two draw-fill reactors (DFRs) operated under different organic loading rates (2.0 ± 0.5 and 3.8 ± 0.6 g COD/L), maintaining a consistent carbon-to-nitrogen ratio to selectively enrich microorganisms capable of accumulating PHAs through alternating nutrient availability and deficiency. Both reactors achieved efficient organic pollutant removal (>95% soluble COD removal), stable biomass growth, and optimal pH levels. Notably, the reactor with the higher organic load (DFR-2) demonstrated a modest increase in PHA accumulation (19.05 ± 7.18%) compared to the lower-loaded reactor (DFR-1; 15.19 ± 6.00%), alongside significantly enhanced biomass productivity. Polymer characterization revealed the formation of poly(3-hydroxybutyrate-co-3-hydroxyvalerate) (PHBV), influenced by the substrate composition. Microbial community analysis showed an adaptive shift towards Proteobacteria dominance, signifying successful enrichment of effective PHA producers.

Keywords:
polyhydroxyalkanoates
; condensate
; food waste
; draw-fill reactors
1. Introduction
The worldwide production of petroleum-based plastics has grown exponentially in just a few decades - from 1.5 million tons in 1950 to 359 million tons in 2018– and with it, the amount of plastic waste [1]. It is widely known that the exploitation of petroleum for the current demand of plastic materials poses serious environmental concerns, such as global warming, human health risks, and ecosystem toxicity [2]. Moreover, the inadequate management of plastic waste in landfills results in long-term environmental pollution, requiring urgent research and effective solutions to mitigate its adverse effects on soil organisms, ecosystem safety, and climate change mitigation efforts [3]. Therefore, biobased polymers sourced from sustainable and renewable natural origins are increasingly gaining attention as a promising environmentally friendly alternative to conventional plastics [4].
Polyhydroxyalkanoates (PHAs) represent a class of bio-polyesters synthesized by various microorganisms, primarily bacteria, as intracellular carbon and energy storage materials. They are accumulated intracellularly in the form of granules, when stress conditions of limited bacterial growth and excess amount of a carbon source exist [5]. The composition and structure of the polymer chains heavily rely on the biocatalyst species and the type and length of the carbon source provided for PHAs synthesis. Depending on the length of the carbon chains in their monomeric units, PHAs are categorized into short-chain-length (scl-PHAs) and medium-chain-length (mcl-PHAs), which consist of 3 to 5 and 6 to 14 carbon atoms, respectively. The scl-PHAs typically exhibit properties similar to polypropylene (PP) and are mostly used for the production of disposable items and food packaging materials, while mcl-PHAs resemble polyethylene (PET) and polystyrene (PS) in terms of material characteristics, and are used in various sectors such as the medical (e.g. implants), pharmaceutical (e.g. biodegradable matrices for drug delivery) and agricultural (e.g. agricultural nets) [[6], [7], [8]].
Despite the numerous advantages of utilizing biopolymers, their widespread implementation faces challenges, mainly due to their high production costs. They can be 16 times greater than those of traditional petrochemical plastics [[9]. As a result, in recent years, the use of mixed microbial communities capable of PHA production from various waste streams, such as food and agricultural waste, is seen as a sustainable approach for bioplastics production.
In Europe, almost 87.6 million tons of food waste are produced, yet traditional management solutions often overlook its potential as a valuable resource. Many studies have highlighted the opportunity to utilize food waste for the production of high added-value molecules such as PHAs. Approximately 1.3 billion tons per year of food losses occur globally, representing one-third of total food production [[10]]. This corresponds to a daily loss of 614 kilocalories per capita, equivalent to a quarter of the average daily nutrition intake. The environmental impact of these losses is substantial, with an estimated 3.3 billion tons of CO2 equivalent greenhouse gases released annually and a direct economic loss of $750 billion (excluding fish and seafood) [11].
During previous research, an innovative household fermentable waste (HFW) valorization approach was developed and implemented. This approach included the drying/shredding process of the HFW, which results in two valuable materials a homogenized solid biomass product named Food Residue Biomass (FORBI) and a liquid fraction (condensate), which is collected by a condenser [[12]]. FORBI is rich in carbon and nitrogen, making it an ideal substrate for various anaerobic biological processes such as biofuel and electricity production [13], [14]. Condensate, in general, also has a high organic load, mostly volatile fatty acids (VFAs), but has low nitrogen content. Nonetheless, depending on the drying conditions, the storage time before drying, and the feedstock, the exact characteristics may vary [15], [16]. As mentioned above, microorganisms generally possess the ability to transform carbon into biopolymers, particularly when subjected to nutrient stress. Therefore, condensate could serve as an ideal substrate for PHA production.
In this context, the current study focuses on investigating the valorization of condensate and landfill leachate as potential substrates for PHA production. A PHA accumulating mixed microbial culture (MMC) was developed by subjecting aerobic sludge to subsequent nitrogen and carbon limitation. To obtain a more homogeneous readily available feedstock, synthetic condensate was used as the sole carbon source and urea as the organic nitrogen one. The scope of those experiments was to examine the effect of different organic loadings on the yields and molecular composition of PHAs. Additionally, the analysis of the microbial community of the PHA-accumulating system.
2. Materials and Methods
2.1. Setup and Operation of Bioreactors
Two draw and fill reactors (DFR) of working volume 1L each, made of glass, were used. They operated under non-aseptic conditions at room temperature (27◦C). Agitation was performed using a magnetic stirrer with a stirring rate of 250 rpm, and the carbon to nitrogen ratio was C: N (100 mg COD/ mg N). The strategy that was followed for the selection and enrichment of activated sludge in PHA-accumulating bacteria was the alternating cycling between limitation of carbon and nitrogen substrates. In both DFRs, we based on nutrient limitation by sequential supply of C and N, allowing the domination of species that can accumulate carbon reserves and overcome nutrient stress.
Specifically, both DFRs’ operations consisted of the sequential phases that are shown in Figure 1. The duration of growth and accumulation phases alternated between two cycles of 47h and one of 71h in order to further suppress the microbial growth of non-PHA producers. The settling phase lasted 55 minutes, and the withdrawal of the supernatant with the new media supply was 5 minutes. Aeration was conducted with moisturized air at a rate of 2.8 L/min. Following this procedure, PHAs-accumulating bacteria could adapt under stress conditions, and bacteria with high PHAs-accumulation capacity were able to survive longer than their heterotrophic competitors after several cycles.
2.2. Microbial Culture
For the first reactor (DFR-1), an enriched aerobic mixed culture, derived from the recirculation of the secondary clarifier of the Wastewater Treatment Plant of Lykovrisi, Attiki, Greece, was used as inoculum during start-up. The start-up was performed using 12.5% v/v aerobic sludge and 78.5% v/v synthetic media.
2.3. Feedstock
The synthetic media used in each cycle consisted of either the carbon or nitrogen source, the basal synthetic medium and a trace element solution. Synthetic condensate was used as carbon source, containing: acetic acid (27% g COD/L), butyric acid (27% g COD/L), propionic acid (6% g COD/L), ethanol (20% g COD/L), glucose (15% g COD/L) and lactic acid (5% g COD/L), with similar composition as the real one (generated from drying and shredding food waste at 98oC for 9 h and contains: 5% odd VFAs, 45% even VFAs, 25% EtOH, 24% sugars and 1% lactate). Urea was used as nitrogen source. The acclimated culture from DFR-1 was used as inoculum for the second reactor (DFR-2) (30% v/v).
DFR-1 was operated with a concentration of theoretical soluble chemical oxygen demand (s-COD) of 2 g/L and 20 mg/L of nitrogen (N), whereas DFR-2 had s-COD and N concentrations of 4 g/L and 40 mg/L, respectively. The composition of the basal medium used was as follows: 2 g/L MgSO4·7H2O, 0.05 g/L CaCl2·2H2O, 12.5 g/L K2HPO4 and 7.5 g/L KH2PO4 and 1.0 mL/L of a trace elements solution. The trace elements solution had the following composition: 0.01 g/L CuCl2·2H2O, 2 g/L FeCl3·6H2O, 0.03 g/L NaMoO4·2H2O, 0.02 g/L NiCl2·2H2O, 1 g/L ZnSO4·7H2O, 0.2 g/L CoCl2·6H2O, 0.3 g/L KI, 0.3 g/L H3BO3, 0.03 g/L MnCl2·4H2O and 2.5 g/L EDTA
2.4. Analytical Methods
The analysis of soluble Chemical Oxygen Demand (sCOD), total suspended solids (TSS) and volatile suspended solids (VSS) were carried out according to Standard Methods for the Examination of Water and Wastewater [17] The pH was measured using a digital pH-meter (WTW INOLAB PH720). For the quantification of volatile fatty acids (VFAs), 1 ml of sample was acidified with 30 μL of 20% H2SO4 and analyzed via a gas chromatograph (SHIMADZU GC-2010 plus) equipped with a flame ionization detector and a capillary column (Agilent technologies, 30 m x0.53 mm ID x1 μm film, HP-FFAP) using an autosampler (SHIMADZU AOC-20 s). Ethanol, glucose and lactic acid were measured via High Performance Liquid Chromatography (HPLC) with an Agilent Technologies (Santa Clara, USA)1260 Infinity II HPLC, using the column Agilent Hi-plex H of 300 mm × 7.7 mm, as described in Kiskira et al. 2023 [18]. Total Nitrogen (TN) was measured with a Shimadzu TN-L analyzer (Shimadzu, Kyoto, Japan; TOC-VCHS and SSM-5000 module). N-NH4+ analysis was carried out using the HI-93733-01 Reagents kit of Hanna Instruments.
The PHAs detection method was based on the simultaneous extraction and transesterification of PHAs. The frozen and lyophilized biomass pellets in glass tubes were used for determining the concentration and monomeric composition of the PHAs accumulated in microbial biomass by gas chromatography with flame ionization detection (GC-FID) after acidic methanolysis as described in Oehmen et al (2005) [19]. Pure poly (3-R-hydroxybutyrate-co-3-R-hydroxyvalerate) (PHBV) copolymer with a 3-R-hydroxyvalerate (3HV) content of 8 mol% from Sigma-Aldrich was used for calibration; thus, the contents of 3-R-hydroxybutyrate (3HB) and 3HV were determined; PHAs was defined as the sum of 3HB and 3HV.
2.5. Profiling of the structure of microbial populations
The taxonomic microbial distribution of the inoculum and the changes of the microbial structure of the microbial cultures during the transition from DFR1 to DFR2 operational mode, were assessed through Next Generation Sequencing, using samples that were collected upon the startup (day 0) and after 108 days for DFR1, and 162 days of the DFR2. Total genomic DNA extraction was performed from aliquots of 2 ml well-mixed cultures, using a DNeasy PowerSoil Kit (QIAGEN), whereas PCR amplification procedure, purification, sequencing and bioinformatics analysis were performed as described in Kora et al. 2022 [7].
2.6. Statistical Analysis
Data were tested for normality using the Kolmogorov Smirnoff test. Statistically significant differences of measured and estimated parameters were analyzed using t-test or the non-parametric equivalent and considering the value p ≤ 0.05 as statistically significant.
3. Results and Discussion
3.1. Comparison of operational efficiency of the reactors
In the present study, synthetic condensate was evaluated as substrate for the production of PHAs and the effect of organic load (OL) on PHA content and PHA-accumulating microorganisms’ selection was investigated. Two reactors, DFR-1 and DFR-2, operating at different OLRs (2.0±0.5 and 3.8 ± 0.6 g COD/L), were employed. As mentioned above (2.1), the carbon-to-nitrogen ratio (C: N) was maintained at 100 mg COD/mg TN, while operational conditions remained the same for both reactors. Various aspects including sludge properties, substrate utilization, and PHAs synthesis using the enriched culture were monitored.
As shown at Figure 2, the pH values for DFR-1 and DFR-2, during the N phases ranged between 7.2 -7.8 and 7.4 -8.0, respectively. The deviation increased during the C phases from 7.1 to 8.0 for DFR-1 and 7.2 to 8.4 for DFR-2, during COD consumption, but remaining into values that are considered optimal for PHAs production. The microbial biomass increased during the C phases for both reactors, reaching a maximum optical density (OD) value of ~2 for DFR-1and ~2.3 for DFR-2. During the N-phases, it decreased to minimum OD values of ~0.9 and ~1,03, respectively.
The TSS and VSS values of the microbial cultures are presented in Figure 2. Overall, there is an increase in microbial biomass for both reactors. By the end of the experimental cycle for DFR-1, the TSS and VSS concentrations reached 3.8 ± 0.6 g/L and 3.2 ± 0.6 g/L, respectively, (Figure 3a) while for DFR-2 the values were 6.1 ± 0.5 g/L and 5.2 ± 0.5 g/L (Figure 3b). At the end of the growth phase, a small increase is observed, due to the development of PHA accumulators, consuming the intracellular carbon and provided nitrogen (urea). In addition, a small solids reduction is observed between the end of each phase and the start of the next, which is due to the removal of 2/3 of the reactor volume to provide the new feed.
The consumption of s-COD and TN during the operational periods of the DFR-1 are illustrated in Figure 4. Regarding the s-COD, the two reactors showed a removal efficiency higher than 95% with a similar trend. Specifically, DFR-1 initially displayed a s-COD uptake of approximately 65% until day 110, increasing to nearly 100% within 24 hours per carbon cycle thereafter (Figure 4a). On the other hand, DFR-2 demonstrated an average s-COD consumption of 85% over the first two months, achieving complete consumption within 24 hours from that point onward (Figure 5a). The absence of carbon during the following growth phase was considered favorable for the performance of the reactors, as it assisted the enrichment of the microbial culture with PHAs accumulators.
At the onset of each growth phase, TN measurements stand at 18±5 mg/L for DFR-1 and 34±10 mg/L for DFR-2. Urea introduced during this phase is completely utilized by its end, ensuring nitrogen limitation for subsequent accumulation. Specifically, in DFR-1, urea consumption is observed within the initial 24 hours post day 130, as depicted in Figure 4b. Conversely, in DFR-2, incomplete urea consumption is noted during the 48-hour nitrogen phase in the first 30 days, as shown in Figure 5b. This difference may stem from two factors. Firstly, the microbial biomass may not have fully adapted to the new OL, and secondly, initial microbial cells may lack significant intracellular carbon stores, thus limiting nitrogen uptake. Additionally, until day 35, residual nitrogen remains post-feed switch to carbon, even though it is fully consumed within 24 hours of the carbon cycle, potentially impacting bioplastic accumulation.
Beyond the 35-day mark, nitrogen is entirely depleted, with consumption within 24 hours occurring after day 75, indicative of intracellular carbon presence. Therefore, nitrogen levels at the onset of the carbon phase consistently read as zero, suggesting favorable accumulation conditions.
3.2. Comparison of PHAs yields and composition
In Figure 6, the percentages of PHAs for DFR-1 and DFR-2 are shown. Throughout the entire operational period, the average accumulation for DFR-1 is measured at 15.19 ± 6.00%. However, a notable drop to approximately 9% in intracellular carbon occurs during the 7th and 8th months, likely due to consumption during the accumulation phase, because of the carbon uptake within the first 24 hours. As intracellular carbon is consumed during the accumulation phase, the measured PHA percentage at the carbon cycle’s end is not maximal, and the exact percentage consumed is not determined, potentially leading to accumulation rate variations between cycles. Regarding DFR-2, the average accumulation percentage is 19.05 ± 7.18 %. The hypothesis of a small intracellular carbon stock at the operation’s start is supported, with accumulation at 9% observed in the first month. However, intracellular carbon content steadily increases thereafter. Data from TSS and VSS measurements, s-COD, and TN consumption suggest system stability from the 5th month onward. Periodic declines in the 4th and 7th months likely result from intracellular carbon consumption during the accumulation phase, coinciding with organic load consumption within the first 24 hours.
The consistent detection of 3HB and 3HV monomers across all experiments indicates the production of either a copolymer, P(3HBco3HV), or a blend with the homopolymers P3HB and P3HV. Specifically, in DFR-1, the produced PHAs exhibit an average HB monomer content of 81.41 ± 6.21 %, while in DFR-2, this content is 73.79 ± 3.80 %. These findings align with existing literature, which suggests that certain carbon sources such as acetic acid, butyric acid, glucose, and lactic acid are metabolized exclusively into P3HB [20], [21]. However, when these carbon sources are used alongside valeric acid or propionic acid, as in this study, 3HV is coproduced. Notably, a higher proportion of HV monomer is observed in DFR-2 compared to DFR-1, 26.21 ± 3.80 % and 18.59 ± 6.21 %, respectively, likely due to the doubled availability of propionic acid in the former reactor.
In order to compare the two reactors, data were tested for normality using the Kolmogorov-Smirnoff test, the t-test was used to measure and estimate statistically significant differences for normal distributions and its non-parametric equivalent for the non-normal ones. Specifically, comparing the two systems, DFR-2 demonstrates a slightly higher accumulation rate, albeit insignificant (p > 0.05). The most notable difference lies in the average concentrations of TSS and VSS (p < 0.05), with DFR-2 exhibiting approximately 40% higher concentration.
3.3. Development of the mixed microbial culture and evaluation of its structure
The operation of the reactors was monitored for a total period of 8 months regarding DFR1 and 7 months regarding DFR2. The initial seed seemed to adapt to the limiting conditions in the first reactor, demonstrating a stable behavior in terms of the consumption pattern of the available carbon and nitrogen sources, especially after 4 months of operation. However, since the inoculum of DFR2 was the already adapted microbial consortium of DFR1, it seems that it adapted quicker to these conditions. Indeed, the complete limitation of both C and N in the alternating phases was observed, which was maintained throughout the system’s operation.
The composition of the MMC was analyzed via NGS showed that the distribution of taxa was highly limited compared to the seed culture in both reactors. In Figure 8a the relative distribution of the bacterial populations at phylum level is illustrated. As shown, the seed culture (start-up) exhibits a diverse microbial community structure, with Proteobacteria (38.78%) and Firmicutes (32.34%) as the dominant phyla. These groups are typically abundant in activated sludge due to their metabolic versatility and capacity to adapt to fluctuating environmental conditions. Actinobacteriota (15.14%) also play a significant role, likely contributing to substrate degradation [21]. Chloroflexi and Cyanobacteria represented 5.48% and 4.25%, respectively, while Bacteroidota and Planctomycetes each contributed 1.10-1.72%. The initial microbial community composition at phylum level was characteristic of aerobic sludge [22], [23]. However, this distribution changed after nutrient limitation. Firmicutes, with a relative abundance at 32.34% in the aerobic sludge, decreased sharply to 0.66% in DFR1, while the population of Proteobacteria increased significantly from 38.78% to 65.13%. Notably, the study by Inoue et al. which investigated aerobic dynamic feeding (ADF) and aerobic dynamic discharge (ADD) processes, also observed a predominance of Proteobacteria [22]. Bacteroidota, which was a minor phylum in the initial seed, increased to 6.67%; this may also be attributed to the adaptation of the respective bacteria to nutrient limitation since it included many species that have an icreased PHAs accumulation capacity. Actinobacteriota remain prominent (21.77%), indicating their adaptability and continued role in resource recovery. Conversely, the proportion of Firmicutes plummets to 0.66%, suggesting their reduced competitiveness under nutrient-limited environments. Thus, the final microbial community composition of the MMC in DFR1 was heavily influenced by the ecological selective pressure applied, leading to an enriched culture for PHAs production.
As mentioned above, the inoculum used in DFR2 originated from DFR1 and therefore was already acclimated under stress conditions. However, the increase of the organic load impacted the composition of the MMC. Proteobacteria remain dominant (48.24%) but at a lower relative abundance compared to reactor 1 under nutrient stress. The re-emergence of Chloroflexi (21.31%) and an increase in Planctomycetota (8.43%) indicate a shift toward more specialized microbial functions, potentially linked to nutrient cycling and PHA synthesis under the enriched conditions (higher carbon and nitrogen efficiency). More specifically, Chloroflexi relative abundance increased from 3.88 to 21.31%. Although there is no direct evidence in the literature for a dedicated metabolic pathway for PHA biosynthesis in Chloroflexi, members of this phylum are indirectly involved in PHA production. It efficiently converts inorganic carbon to key intermediates like pyruvate. Pyruvate can then feed into metabolic pathways leading to PHA synthesis under specific conditions, especially when carbon sources shift or nutrient limitations occur [24]. The population of cyanobacteria increased noticeably from 0.02% to 5.40%, highlighting their potential as PHAs producers in nitrogen-limited environments. As highly adaptable photoautotrophic organisms, Cyanobacteria have been reported as a promising species for converting CO₂ into PHAs, which serve as both energy and carbon storage compounds. Moreover, the incorporation of propionic acid as a precursor enables the biosynthesis of PHV, which can occur alongside PHB production, leading to the formation of the PHBV copolymer [25], [26], [27]]. Firmicutes (3.12%) partially recover, reflecting their adaptation to the increased nutrient availability.
Figure 8b shows the relative distribution of the bacterial populations at species level, while in Table 3 the ten species with the highest abundance are provided. It is apparent that the progression from the start-up phase to DFR2 demonstrates an evolution toward a microbial community optimized for PHA production. Specifically, upon the start-up of DF1 the microbial community is shown to be quite diverse, with the dominance of Firmicutes (e.g., Weissella and Lactobacillus) and some Proteobacteria with denitrifying capacity (Dechloromonas). Such dominance of fermentative and denitrifying bacteria is expected in activated sludge environments that are geared towards initializing nutrient and organic matter breakdown [28]. Among Proteobacteria, Azospirillum emerged as the dominant genus, accounting for 58.40% of the community in DFR1, accompanied by minor contributions from other species. The dominant species is a nitrogen-fixing bacterium that thrives under microaerophilic conditions. Although it is not a traditional PHA producer, studies suggest it can accumulate high quantities of PHB under stress conditions, such as nitrogen or oxygen limitation from various carbon sources [29], [30]. This highlights its metabolic versatility and its role as a primary PHA producer in DFR1 [30], [31]. Other taxa like Dokdonella (2.06%), Microbulbifer (3.33%), and Rhizobium (2.50%) also belong to Proteobacteria, which are widely studied for PHA production in mixed microbial cultures. These genera are reported of synthesizing PHAs at high accumulation levels when subjected to carbon excess and nutrient limitation ([32],[33]). The low abundance of Defluviicoccus (1.08%) and Micropruina (2.18%) indicates that glycogen-accumulating organisms (GAOs) are present but not dominant [34]. In conclusion, the dominance of Azospirillum highlights a nitrogen-limited system, potentially favoring PHA production whereas the overall community composition suggests that DFR1 is poised for enhanced PHA synthesis if fed with carbon-rich substrates under nutrient stress.
Regarding the microbial composition in DFR2, it reflects a stable and diverse ecosystem with a notable presence of both traditional and non-traditional PHA producers favoring enhanced polymer synthesis. Surprisingly enough the dominant species is A-4b (20.79%), an unclassified bacterium with limited functional information. However, its significant presence suggests adaptation to reactor conditions and potential involvement in nutrient cycling or polymer storage [35]. Azospirillum (15.43%) remains a major contributor, emphasizing its resilience and adaptability to DFR2 conditions whereas the relative abundance of Defluviicoccus drastically increased (10.45%). Indeed, Defluviicoccus is a well-documented PHA producer, especially in systems with alternating feast-and-famine conditions and is a key player in PHA synthesis in mixed microbial cultures. It is, classified as a GAO, which can accumulate both glycogen and PHA under aerobic conditions when a carbon substrate is available [36], [37]. Fimbriiglobus (7.59%) and Rhizobium (5.18%) are less studied for PHA production but could play supportive roles in the ecosystem. Rhizobium strains have been identified as PHA producers, with the ability to synthesize poly(3HB-co-3HV) when provided with glucose as the main carbon source, along with propionate or valerate as supplementary carbon sources [38], [39]. Minor taxa like Leadbetterella (1.78%) and Dermatophilus (1.82%) indicate niche functional roles but are not directly associated with PHA production.
5. Conclusions
This study demonstrates the feasibility of utilizing waste-derived carbon and nitrogen sources for the sustainable production of PHAs within a circular economy framework. The successful enrichment of PHA-accumulating microorganisms and the formation of poly(3-hydroxybutyrate-co-3-hydroxyvalerate) (PHBV) in both DFRs confirm that synthetic condensate mimicking food waste liquid fractions can serve as an effective feedstock for biopolymer synthesis. Microbial community profiling revealed a clear dominance of Proteobacteria, suggesting that targeted enrichment strategies can enhance PHA yields. The high organic pollutant removal efficiencies and stable reactor performance further support the potential of such waste-based substrates in bioplastic production. Notably, the higher organic loading rate resulted in improved PHA accumulation, indicating that process optimization can enhance yields. While these findings provide strong evidence for the viability of waste-derived carbon sources, further validation using actual food waste condensates and leachate will be valuable to confirm scalability and real-world applicability.
Author Contributions
Conceptualization, G.L., K.P and K.F.; methodology, K.F., K.P., I.N. and E.K.; validation, K.F.; formal analysis, K.F., I.N.; investigation, K.F., Μ.Κ. and E.B..; data curation, K.F. and I.N., K.P.; writing—original draft preparation, K.F., I.N., and K.P.; writing—review and editing, K.F., I.N., K.P. and G.L.; visualization, K.F., I.N and K.P.; supervision, G.L., I.N. and K.P.; project administration, G.L. and K.P..; funding acquisition, K.F.. All authors have read and agreed to the published version of the manuscript.
Funding
The research work was supported by the Hellenic Foundation for Research and Innovation (HFRI) under the 3rd Call for HFRI PhD Fellowships (Fellowship Number: 5351) awarded to Mrs. Konstantina Filippou.
Data Availability Statement
Data are available upon request.
Acknowledgments
The authors extend their thanks to Assistant Professor at National Technical University of Athens, Mr. Nikolaos Chronis, for kindly providing the Christ Alpha 1-4 device for the analysis of PHAs Detection.
Conflicts of Interest
The authors declare no conflicts of interest.
Abbreviations
The following abbreviations are used in this manuscript:
| PHA | Polyhydroxyalkanoates |
| scl-PHAs | short-chain-length Polyhydroxyalkanoates |
| mcl-PHAs | Medium-chain-length Polyhydroxyalkanoates |
| HFW | Household Fermentable Waste |
| FORBI | Food Residue Biomass |
| VFAs | Volatile Fatty Acids |
| MMC | Mixed Microbial Culture |
| DFR | Draw-Fill Reactor |
| sCOD | Soluble Chemical Oxygen Demand |
| TSS | Total Suspended Solids |
| VSS | Volatile Suspended Solids |
| HPLC | High Performance Liquid Chromatography |
| TN | Total Nitrogen |
| GC-FID | Gas Chromatography with flame ionization detection |
| PHBV | poly (3-R-hydroxybutyrate-co-3-R-hydroxyvalerate) |
| 3HV | 3-R-hydroxyvalerate |
| 3HB | 3-R-hydroxybutyrate |
| OL | Organic Load |
| OD | Optical Density |
| ADF | Aerobic Dynamic Feeding |
| ADD | Aerobic Dynamic Discharge |
| GAO | Glycogen-accumulating Organisms |
References
- Geyer, R. A Brief History of Plastics; 2020; pp. 31–47. [CrossRef]
- A Review on Microplastics – An Indelible Ubiquitous Pollutant. Biointerface Res. Appl. Chem. 2023, 13. [CrossRef]
- Chae, Y.; An, Y.-J. Current research trends on plastic pollution and ecological impacts on the soil ecosystem: A review. Environ. Pollut. 2018, 240, 387–395. [Google Scholar] [CrossRef]
- Roy, S.; Rhim, J.-W. Advances and Challenges in Biopolymer-Based Films. Polymers 2022, 14, 3920. [Google Scholar] [CrossRef]
- Serafim, L.S.; Lemos, P.C.; Albuquerque, M.G.E.; Reis, M.A.M. Strategies for PHA production by mixed cultures and renewable waste materials. Appl. Microbiol. Biotechnol. 2008, 81, 615–628. [Google Scholar] [CrossRef]
- Kourmentza, C.; Plácido, J.; Venetsaneas, N.; Burniol-Figols, A.; Varrone, C.; Gavala, H.N.; Reis, M.A.M. Recent Advances and Challenges towards Sustainable Polyhydroxyalkanoate (PHA) Production. Bioengineering 2017, 4, 55. [Google Scholar] [CrossRef] [PubMed]
- Kora, E.; Tsaousis, P.C.; Andrikopoulos, K.S.; Chasapis, C.T.; Voyiatzis, G.A.; Ntaikou, I.; Lyberatos, G. Production efficiency and properties of poly(3hydroxybutyrate-co-3hydroxyvalerate) generated via a robust bacterial consortium dominated by Zoogloea sp. using acidified discarded fruit juices as carbon source. Int. J. Biol. Macromol. 2022, 226, 1500–1514. [Google Scholar] [CrossRef]
- Pandey, A.; Adama, N.; Adjallé, K.; Blais, J.-F. Sustainable applications of polyhydroxyalkanoates in various fields: A critical review. Int. J. Biol. Macromol. 2022, 221, 1184–1201. [Google Scholar] [CrossRef]
- Chen, G.-Q.; Chen, X.-Y.; Wu, F.-Q.; Chen, J.-C. Polyhydroxyalkanoates (PHA) toward cost competitiveness and functionality. Adv. Ind. Eng. Polym. Res. 2020, 3, 1–7. [Google Scholar] [CrossRef]
- A. English and Food and Agriculture Organization of the United Nations, The state of food and agriculture. 2019, Moving forward on food loss and waste reduction.
- Ioannidou, S.M.; Pateraki, C.; Ladakis, D.; Papapostolou, H.; Tsakona, M.; Vlysidis, A.; Kookos, I.K.; Koutinas, A. Sustainable production of bio-based chemicals and polymers via integrated biomass refining and bioprocessing in a circular bioeconomy context. Bioresour. Technol. 2020, 307, 123093. [Google Scholar] [CrossRef]
- Lytras, G.; Koutroumanou, E.; Lyberatos, G. Anaerobic co-digestion of condensate produced from drying of Household Food Waste and Waste Activated Sludge. J. Environ. Chem. Eng. 2020, 8. [Google Scholar] [CrossRef]
- Tremouli, A.; Karydogiannis, I.; Pandis, P.K.; Papadopoulou, K.; Argirusis, C.; Stathopoulos, V.N.; Lyberatos, G. Bioelectricity production from fermentable household waste extract using a single chamber microbial fuel cell. Energy Procedia 2019, 161, 2–9. [Google Scholar] [CrossRef]
- Michalopoulos, I.; Lytras, G.M.; Mathioudakis, D.; Lytras, C.; Goumenos, A.; Zacharopoulos, I.; Papadopoulou, K.; Lyberatos, G. Hydrogen and Methane Production from Food Residue Biomass Product (FORBI). Waste Biomass- Valorization 2020, 11, 1647–1655. [Google Scholar] [CrossRef]
- Kanellos, G.; Tremouli, A.; Kondylis, A.; Stamelou, A.; Lyberatos, G. Anaerobic Co-digestion of the Liquid Fraction of Food Waste with Waste Activated Sludge. Waste Biomass- Valorization 2024, 15, 3339–3350. [Google Scholar] [CrossRef]
- Kamperidis, T.; Pandis, P.K.; Argirusis, C.; Lyberatos, G.; Tremouli, A. Effect of Food Waste Condensate Concentration on the Performance of Microbial Fuel Cells with Different Cathode Assemblies. Sustainability 2022, 14, 2625. [Google Scholar] [CrossRef]
- Baird, B. Rodger, Eaton D. Andrew, and Rice W. Eugene, Eds., Standard Methods for the Examination of Water and Waste Water, 23rd ed. American Public Health Association, American Water Works Association, Water Environment Federation, 2017. [CrossRef]
- Kiskira, K.; Lymperopoulou, T.; Lourentzatos, I.; Tsakanika, L.-A.; Pavlopoulos, C.; Papadopoulou, K.; Ochsenkühn, K.-M.; Tsopelas, F.; Chatzitheodoridis, E.; Lyberatos, G.; et al. Bioleaching of Scandium from Bauxite Residue using Fungus Aspergillus Niger. Waste Biomass- Valorization 2023, 14, 3377–3390. [Google Scholar] [CrossRef]
- Oehmen, A.; Keller-Lehmann, B.; Zeng, R.J.; Yuan, Z.; Keller, J. Optimisation of poly-β-hydroxyalkanoate analysis using gas chromatography for enhanced biological phosphorus removal systems. J. Chromatogr. A 2005, 1070, 131–136. [Google Scholar] [CrossRef]
- Dionisi, D.; Majone, M.; Vallini, G.; Di Gregorio, S.; Beccari, M. Effect of the applied organic load rate on biodegradable polymer production by mixed microbial cultures in a sequencing batch reactor. Biotechnol. Bioeng. 2006, 93, 76–88. [Google Scholar] [CrossRef]
- El-Khateeb, M.; Hassan, G.K.; El-Liethy, M.A.; El-Khatib, K.M.; Abdel-Shafy, H.I.; Hu, A.; Gad, M. Sustainable municipal wastewater treatment using an innovative integrated compact unit: microbial communities, parasite removal, and techno-economic analysis. Ann. Microbiol. 2023, 73, 1–16. [Google Scholar] [CrossRef]
- Inoue, D.; Fukuyama, A.; Ren, Y.; Ike, M. Rapid enrichment of polyhydroxyalkanoate-accumulating bacteria by the aerobic dynamic discharge process: Enrichment effectiveness, polyhydroxyalkanoate accumulation ability, and bacterial community characteristics in comparison with the aerobic dynamic feeding process. Bioresour. Technol. Rep. 2019, 7. [Google Scholar] [CrossRef]
- Meerbergen, K.; Van Geel, M.; Waud, M.; Willems, K.A.; Dewil, R.; Van Impe, J.; Appels, L.; Lievens, B. Assessing the composition of microbial communities in textile wastewater treatment plants in comparison with municipal wastewater treatment plants. Microbiologyopen 2017, 6, e00413. [Google Scholar] [CrossRef]
- Freches, A.; Fradinho, J.C. The biotechnological potential of the Chloroflexota phylum. Appl. Environ. Microbiol. 2024, 90, e0175623. [Google Scholar] [CrossRef] [PubMed]
- Troschl, C.; Meixner, K.; Drosg, B. Cyanobacterial PHA Production—Review of Recent Advances and a Summary of Three Years’ Working Experience Running a Pilot Plant. Bioengineering 2017, 4, 26. [Google Scholar] [CrossRef]
- Angra, V.; Sehgal, R.; Gupta, R. Trends in PHA Production by Microbially Diverse and Functionally Distinct Communities. Microb. Ecol. 2023, 85, 572–585. [Google Scholar] [CrossRef] [PubMed]
- Gradíssimo, D.G.; Xavier, L.P.; Santos, A.V. Cyanobacterial Polyhydroxyalkanoates: A Sustainable Alternative in Circular Economy. Molecules 2020, 25, 4331. [Google Scholar] [CrossRef]
- Sheik, A.R.; Muller, E.E.L.; Wilmes, P. A hundred years of activated sludge: time for a rethink. Front. Microbiol. 2014, 5, 47. [Google Scholar] [CrossRef]
- Martínez, M.d.L.Á.M.; Urzúa, L.S.; Carrillo, Y.A.; Ramírez, M.B.; Morales, L.J.M. Polyhydroxybutyrate Metabolism in Azospirillum brasilense and Its Applications, a Review. Polymers 2023, 15, 3027. [Google Scholar] [CrossRef]
- Itzigsohn, R.; Yarden, O.; Okon, Y. Polyhydroxyalkanoate analysis inAzospirillum brasilense. Can. J. Microbiol. 1995, 41, 73–76. [Google Scholar] [CrossRef]
- Martínez-Martínez, M.d.L.A.; González-Pedrajo, B.; Dreyfus, G.; Soto-Urzúa, L.; Martínez-Morales, L.J. Phasin PhaP1 is involved in polyhydroxybutyrate granules morphology and in controlling early biopolymer accumulation in Azospirillum brasilense Sp7. AMB Express 2019, 9, 1–15. [Google Scholar] [CrossRef]
- Correa-Galeote, D.; Argiz, L.; del Rio, A.V.; Mosquera-Corral, A.; Juarez-Jimenez, B.; Gonzalez-Lopez, J.; Rodelas, B. Dynamics of PHA-Accumulating Bacterial Communities Fed with Lipid-Rich Liquid Effluents from Fish-Canning Industries. Polymers 2022, 14, 1396. [Google Scholar] [CrossRef]
- Gautam, S.; Gautam, A.; Pawaday, J.; Kanzariya, R.K.; Yao, Z. Current Status and Challenges in the Commercial Production of Polyhydroxyalkanoate-Based Bioplastic: A Review. Processes 2024, 12, 1720. [Google Scholar] [CrossRef]
- Stokholm-Bjerregaard, M.; McIlroy, S.J.; Nierychlo, M.; Karst, S.M.; Albertsen, M.; Nielsen, P.H. A Critical Assessment of the Microorganisms Proposed to be Important to Enhanced Biological Phosphorus Removal in Full-Scale Wastewater Treatment Systems. Front. Microbiol. 2017, 8, 718. [Google Scholar] [CrossRef] [PubMed]
- Muigano, M.N.; Anami, S.E.; Onguso, J.M.; Omare, G.M. The Isolation, Screening, and Characterization of Polyhydroxyalkanoate-Producing Bacteria from Hypersaline Lakes in Kenya. Bacteria 2023, 2, 81–97. [Google Scholar] [CrossRef]
- Bengtsson, S.; Werker, A.; Welander, T. Production of polyhydroxyalkanoates by glycogen accumulating organisms treating a paper mill wastewater. Water Sci. Technol. 2008, 58, 323–330. [Google Scholar] [CrossRef]
- Queirós, D.; Rossetti, S.; Serafim, L.S. PHA production by mixed cultures: A way to valorize wastes from pulp industry. Bioresour. Technol. 2014, 157, 197–205. [Google Scholar] [CrossRef] [PubMed]
- M. Kivanc, M. M. Kivanc, M. Kıvanc, and N. Dombaycı, ‘PRODUCTION OF POLY-beta-HYDROXYBUTYRIC ACID BY RHIZOBIUM SP. PRODUCTION OF POLY-β-HYDROXYBUTYRIC ACID BY RHIZOBIUM SP’. [Online]. Available: https://www.researchgate.net/publication/309315105. 3093. [Google Scholar]
- Tombolini, R.; Nuti, M. Poly(β-hydroxyalkanoate) biosynthesis and accumulation by differentRhizobiumspecies. FEMS Microbiol. Lett. 1989, 60, 299–304. [Google Scholar] [CrossRef]
Figure 1.
The Operational Mode of the DFRs which consisted of the sequential cycles of C supply (PHAs) Accumulation phase) and N supply (microbial growth phase).
Figure 1.
The Operational Mode of the DFRs which consisted of the sequential cycles of C supply (PHAs) Accumulation phase) and N supply (microbial growth phase).
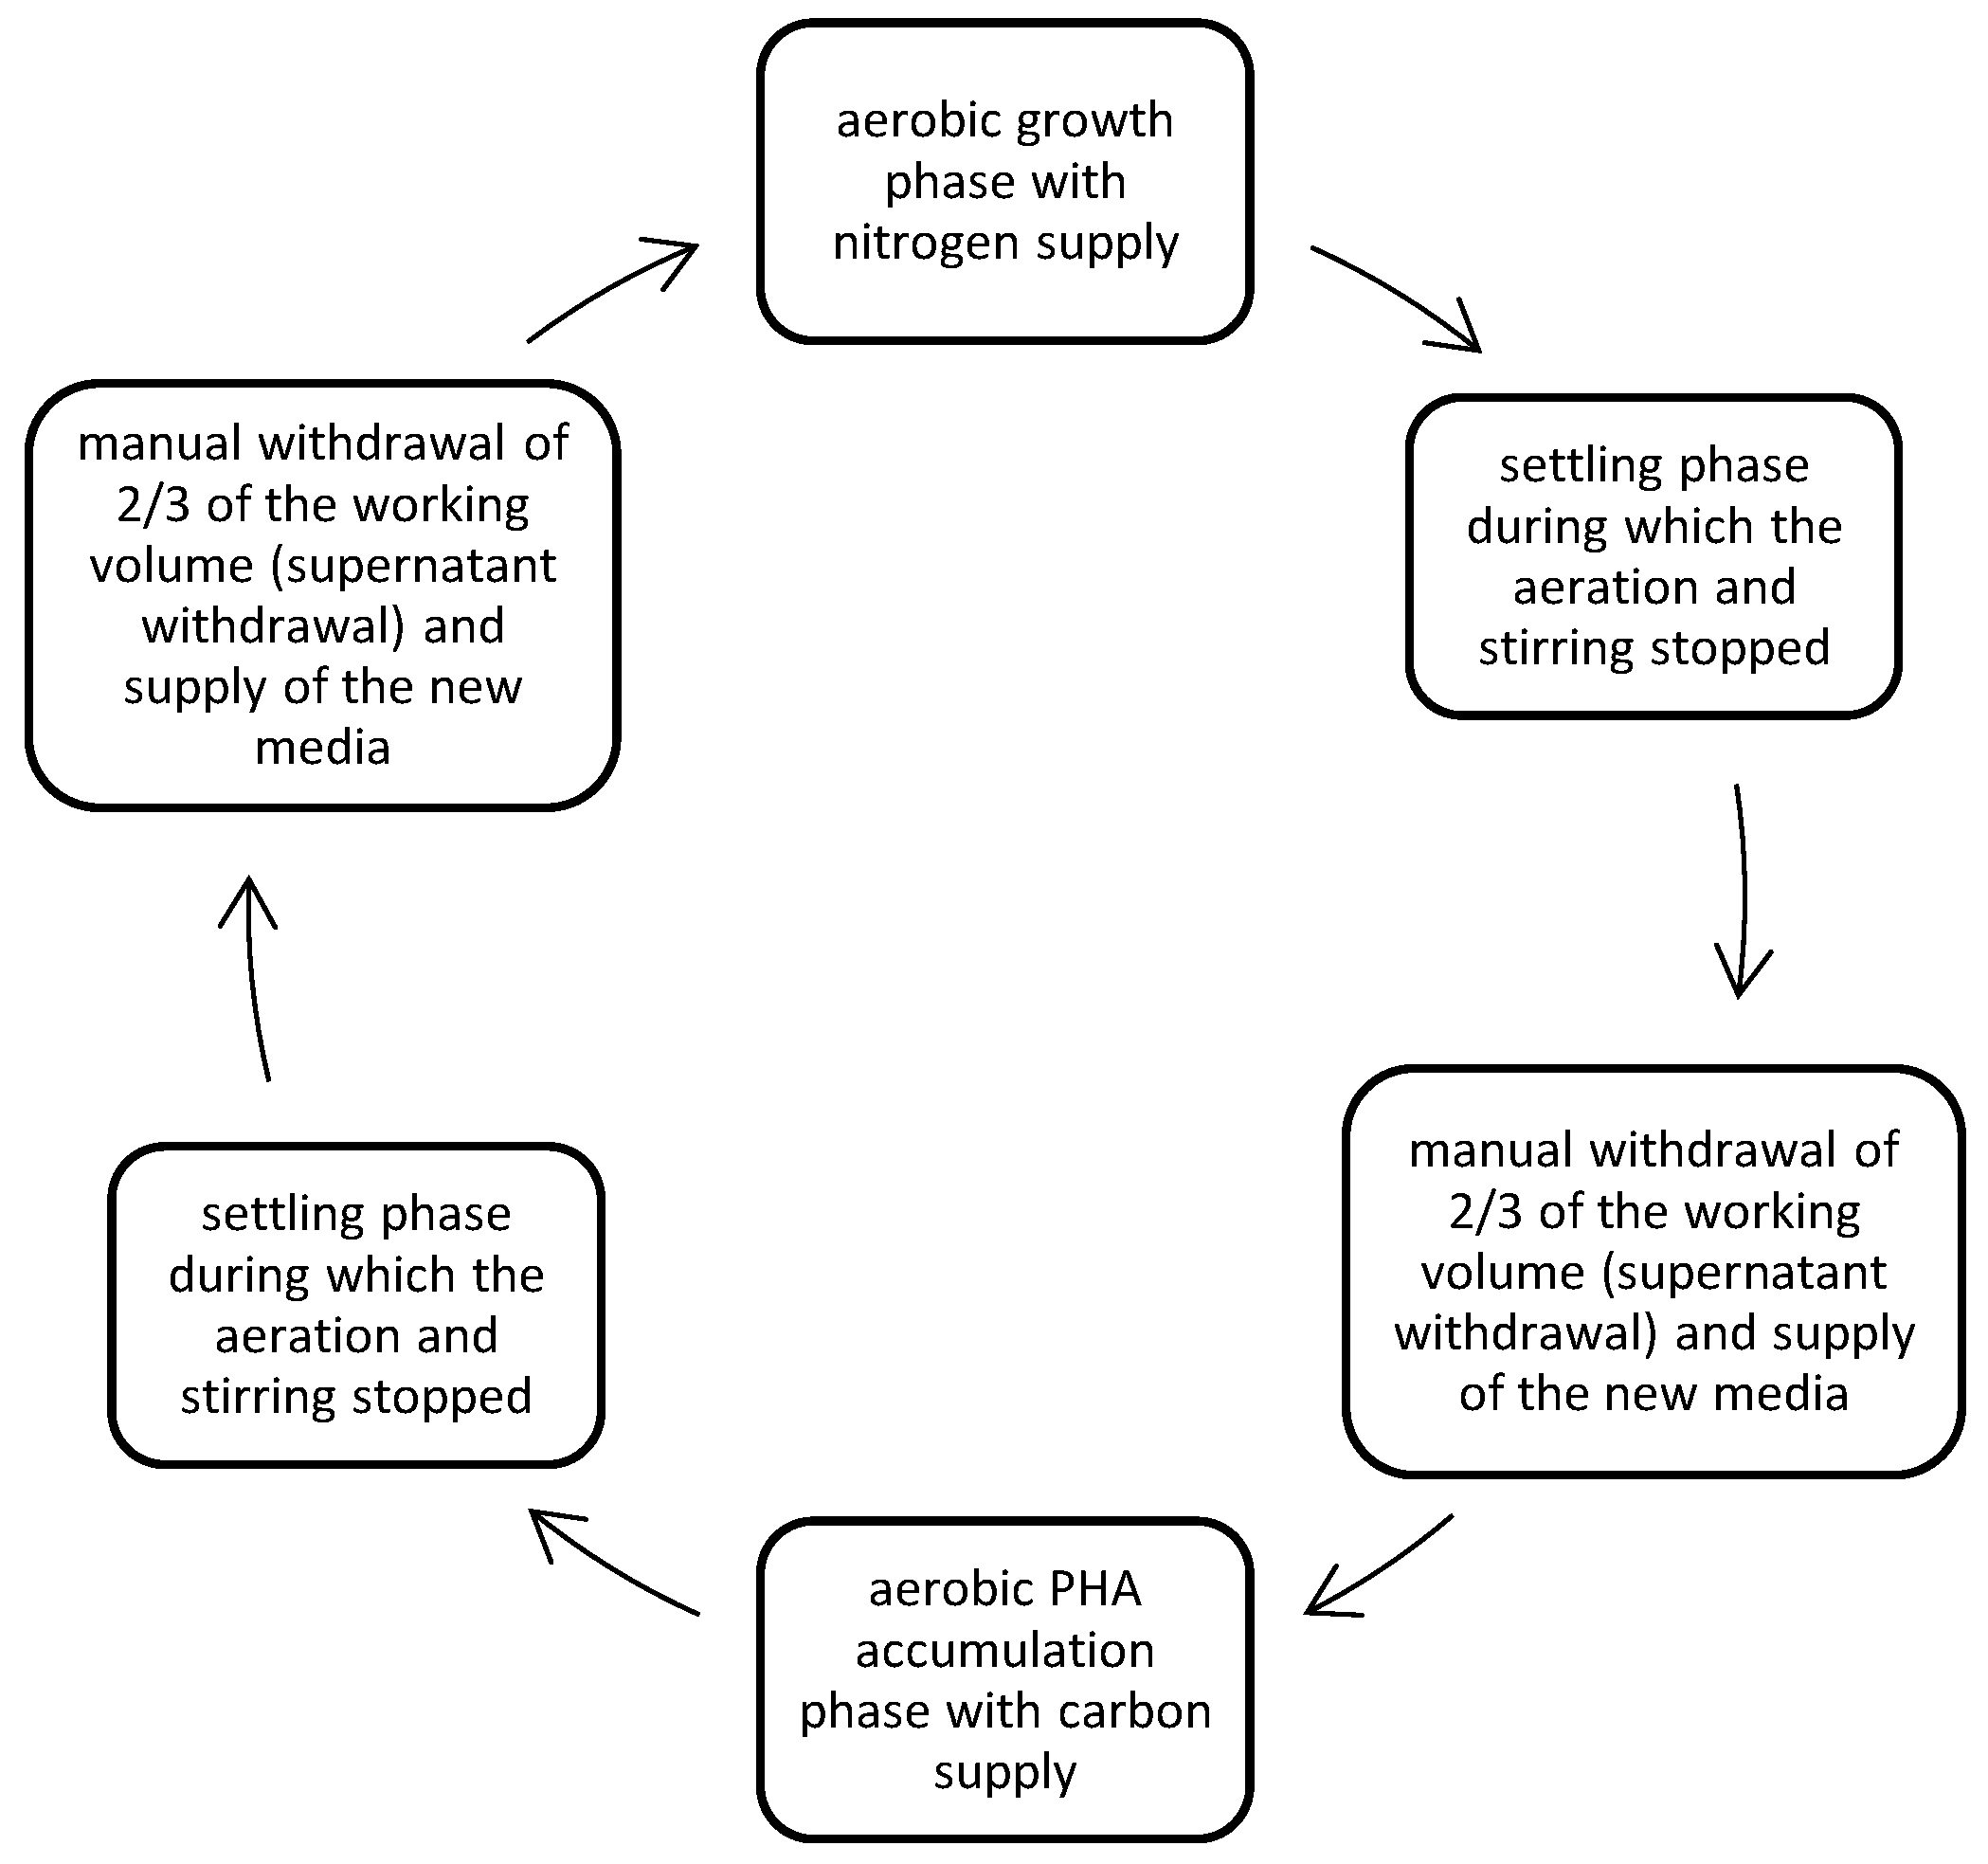
Figure 2.
Monitoring of the DFRs used for the development of the PHAs accumulating culture in terms of pH and OD600nm.
Figure 2.
Monitoring of the DFRs used for the development of the PHAs accumulating culture in terms of pH and OD600nm.
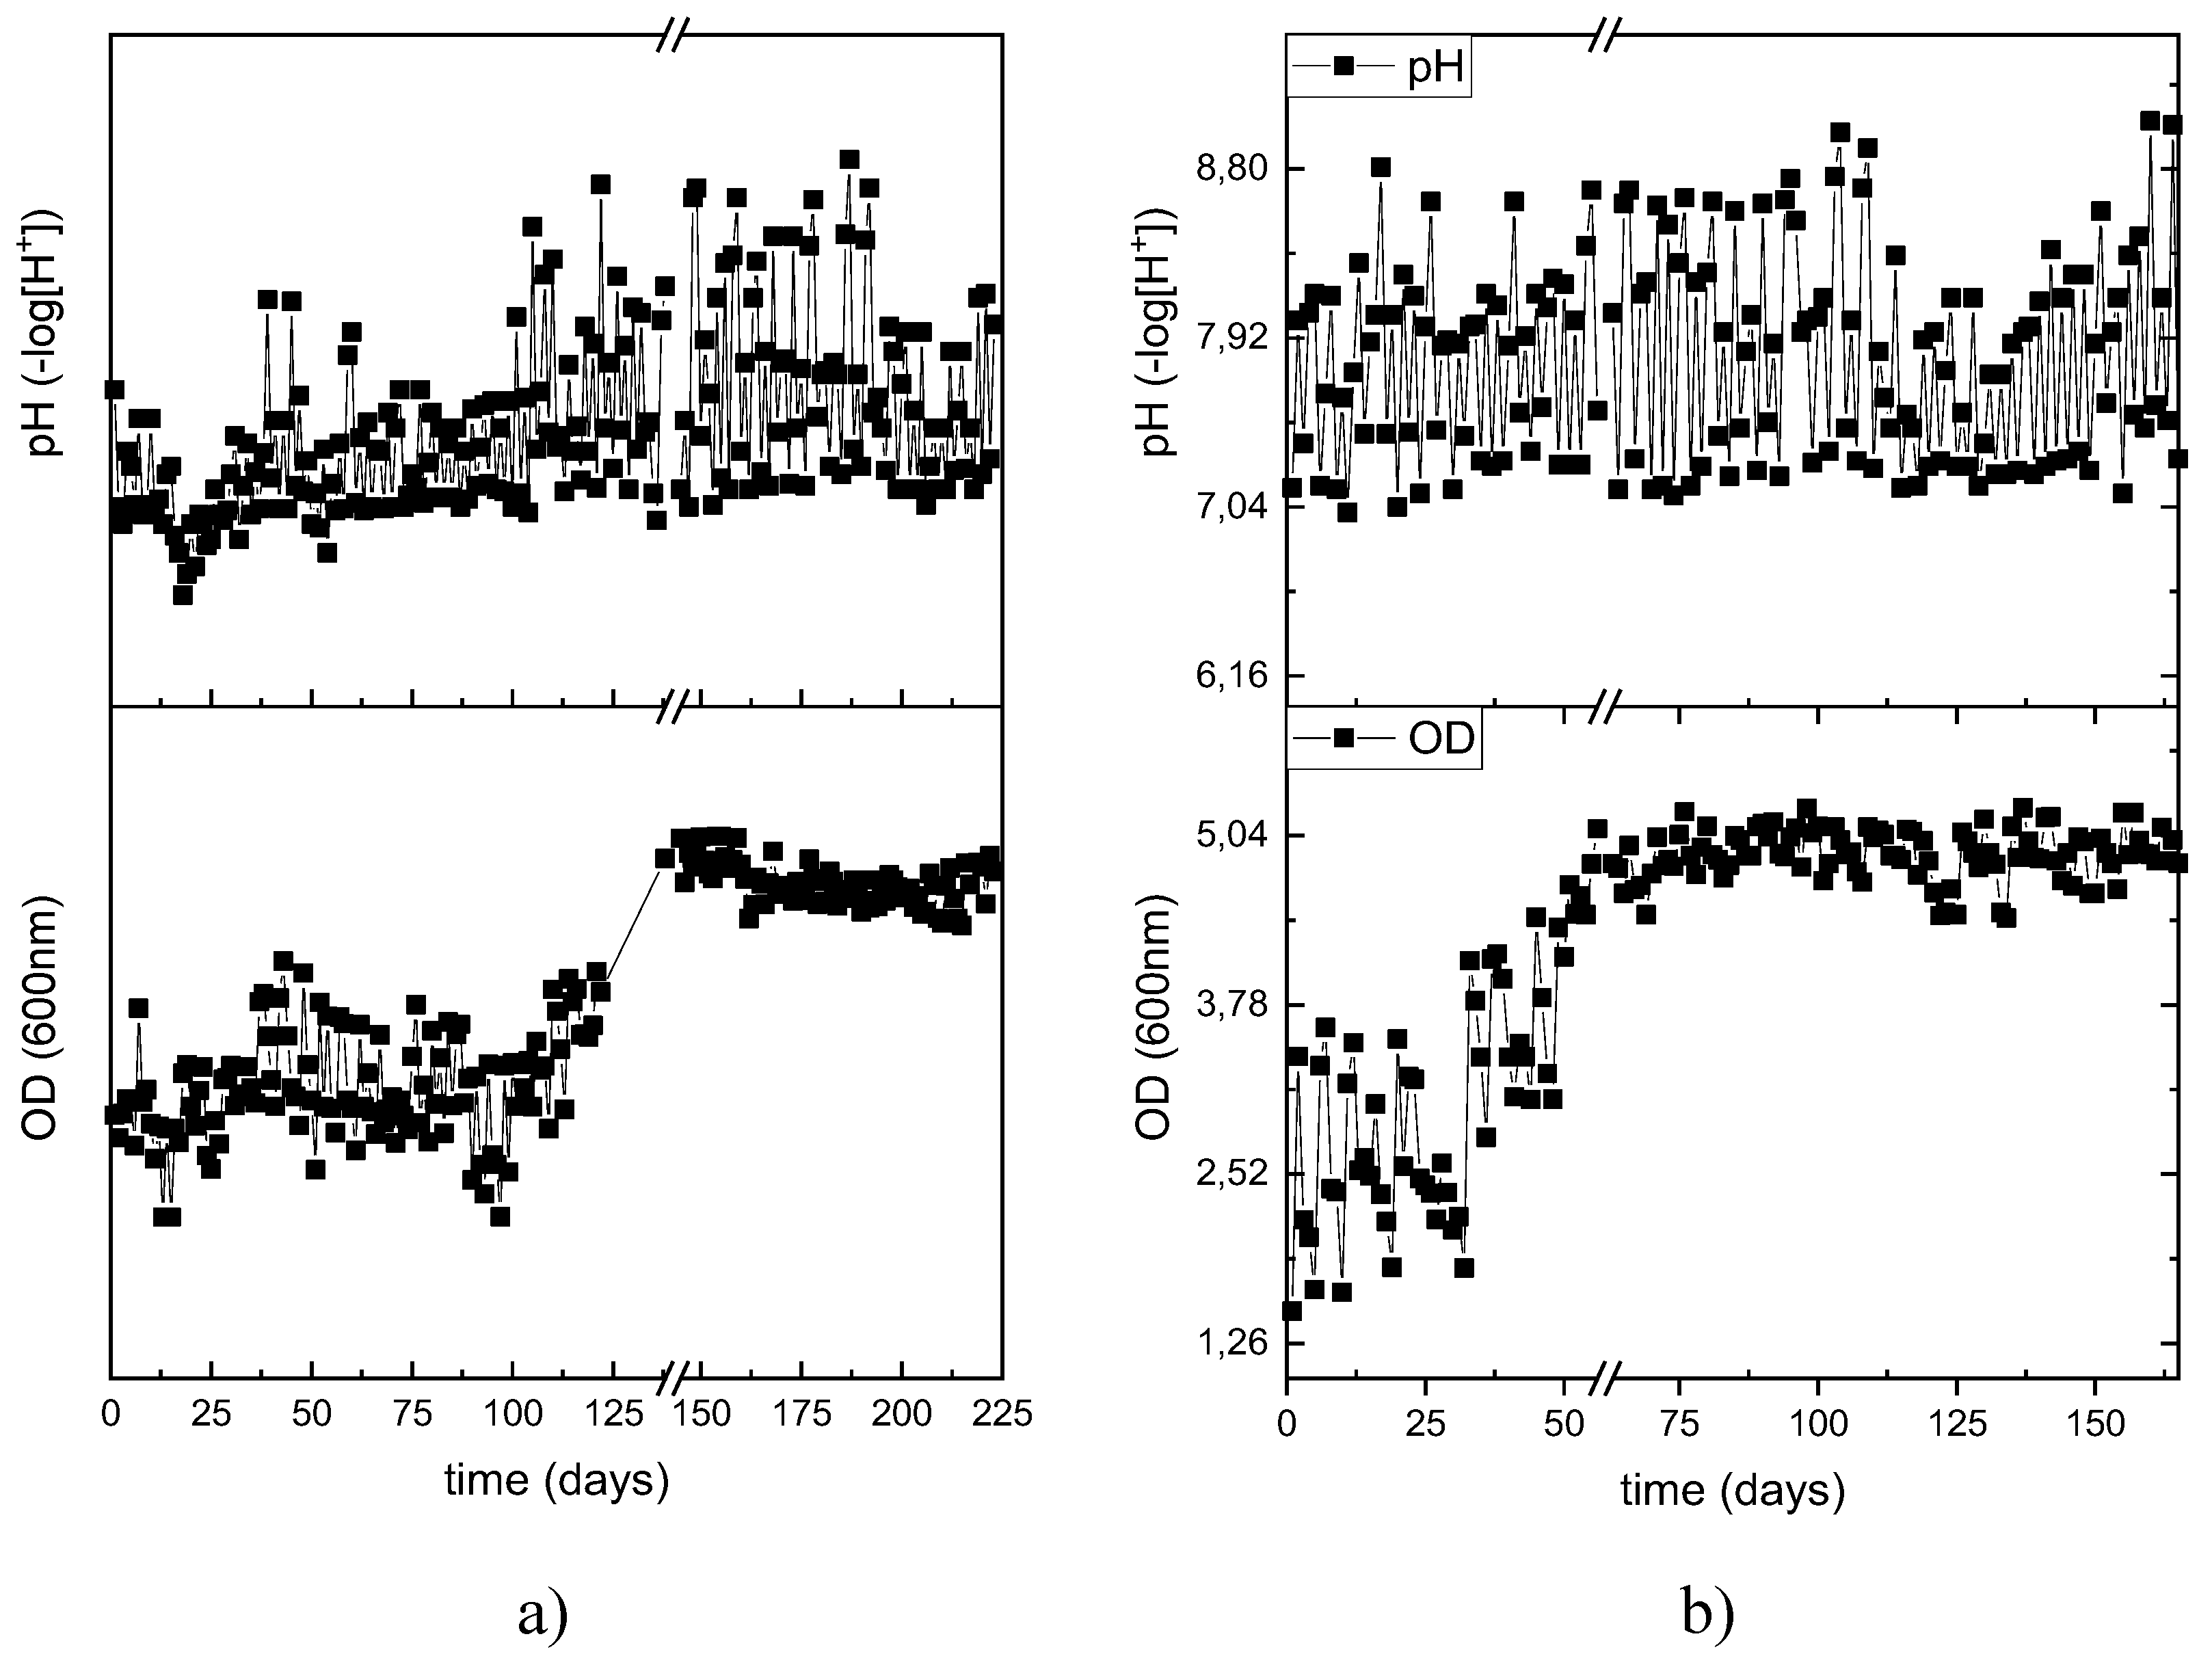
Figure 3.
Operation of the biomass growth in both PHAs producing reactors a) DFR-1 and b) DFR-2.
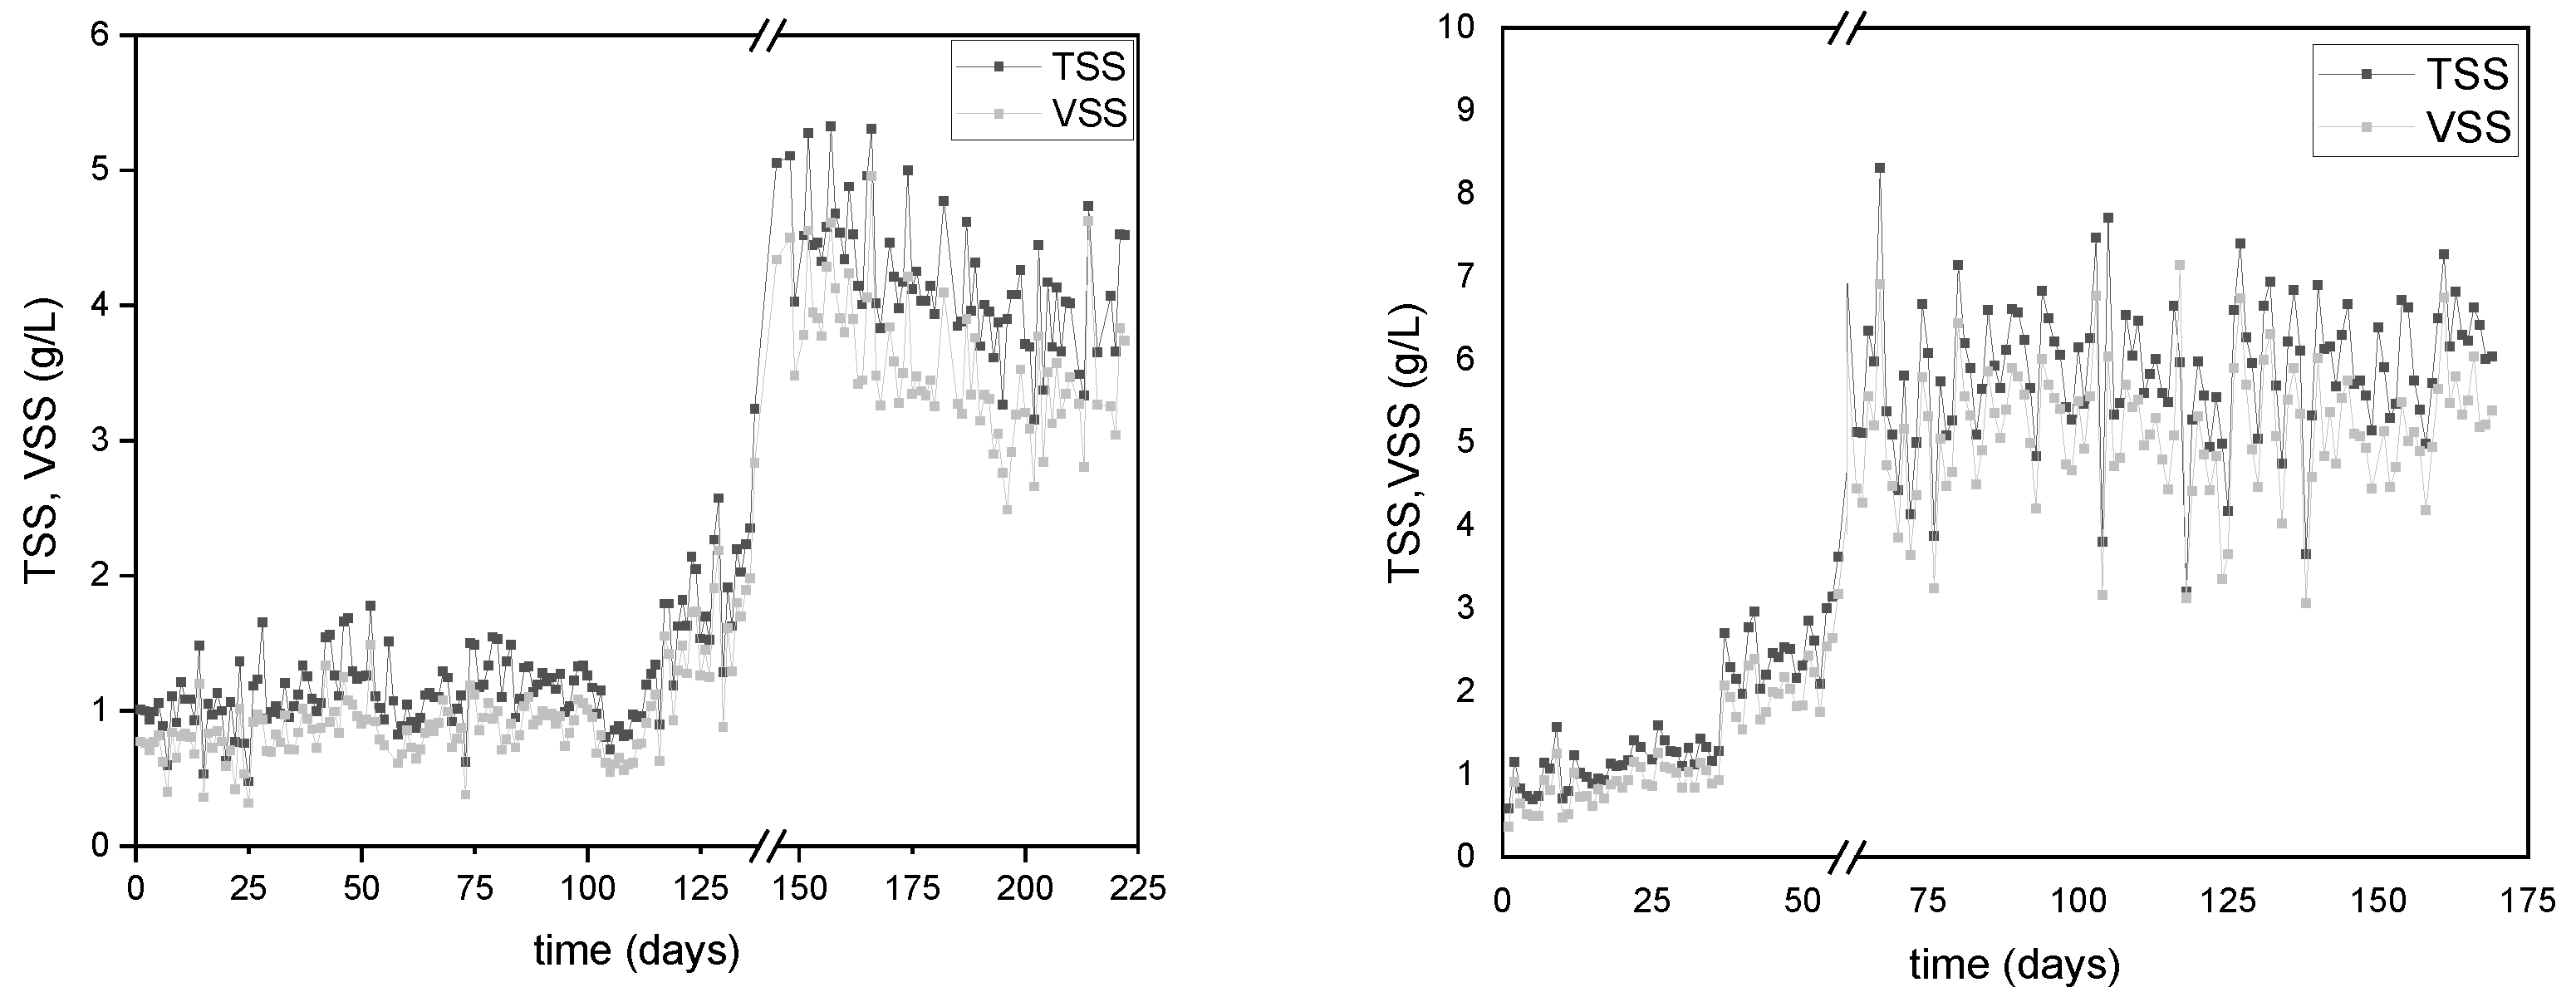
Figure 4.
Monitoring of the consumption of a) s-COD and b) TN in the PHAs producing reactor DFR-1.
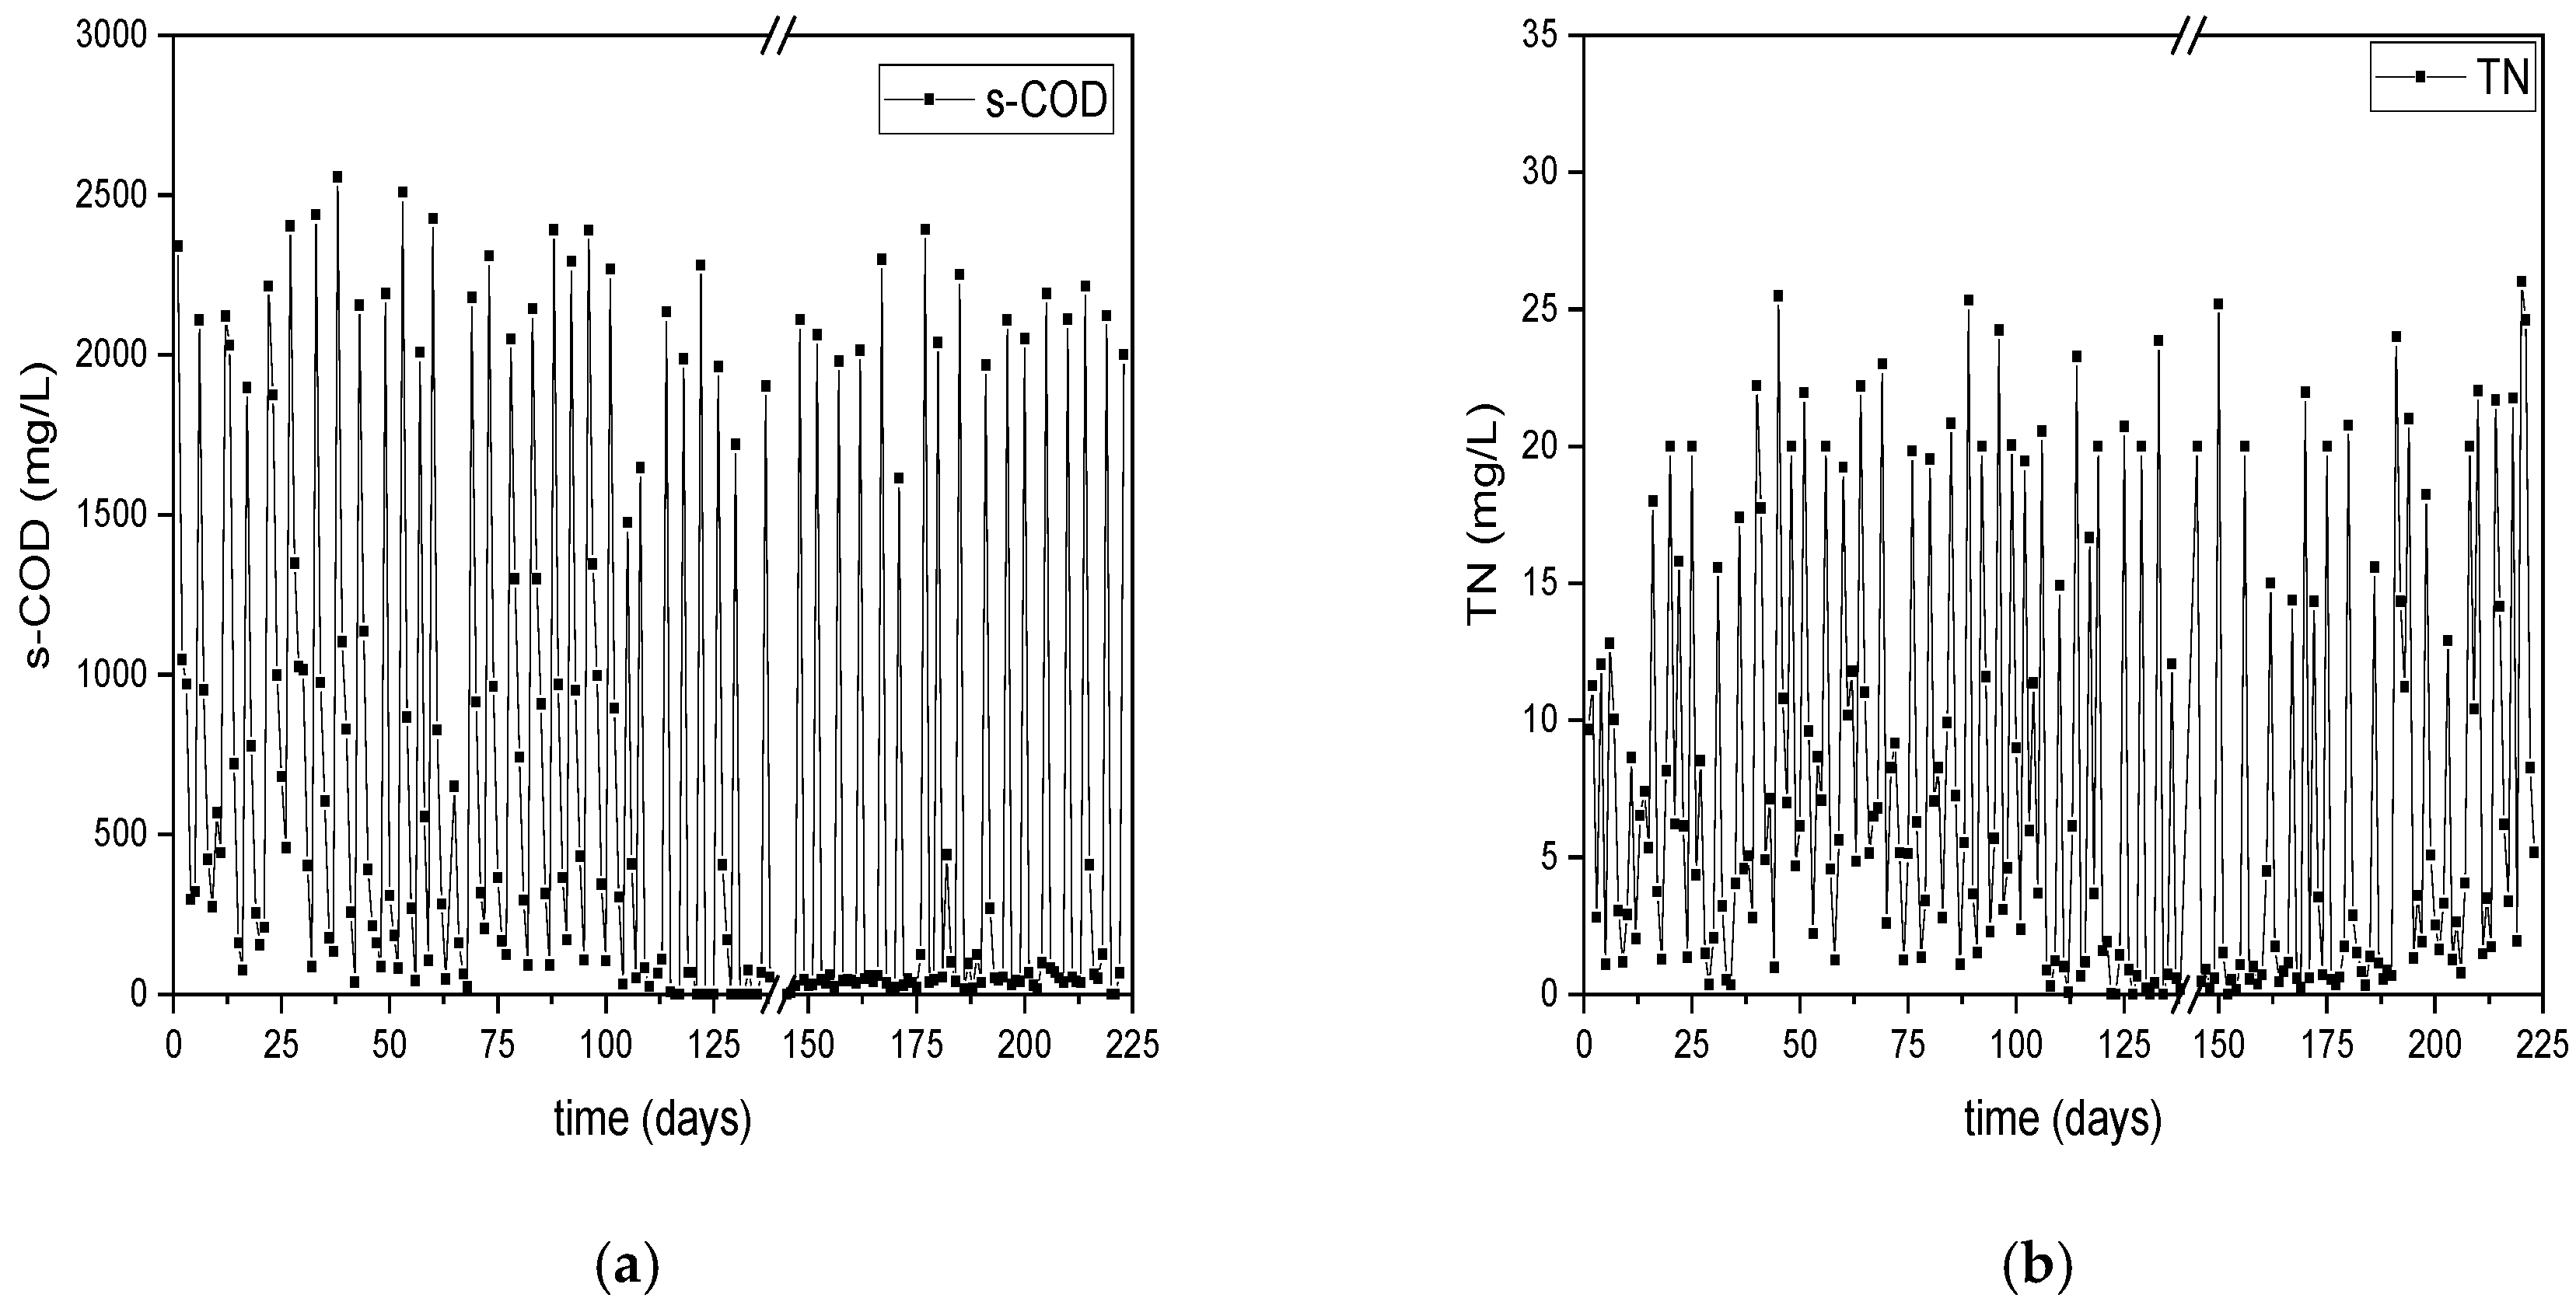
Figure 5.
Monitoring of the consumption of a) s-COD and b) TN in the PHAs producing reactor DFR-2.
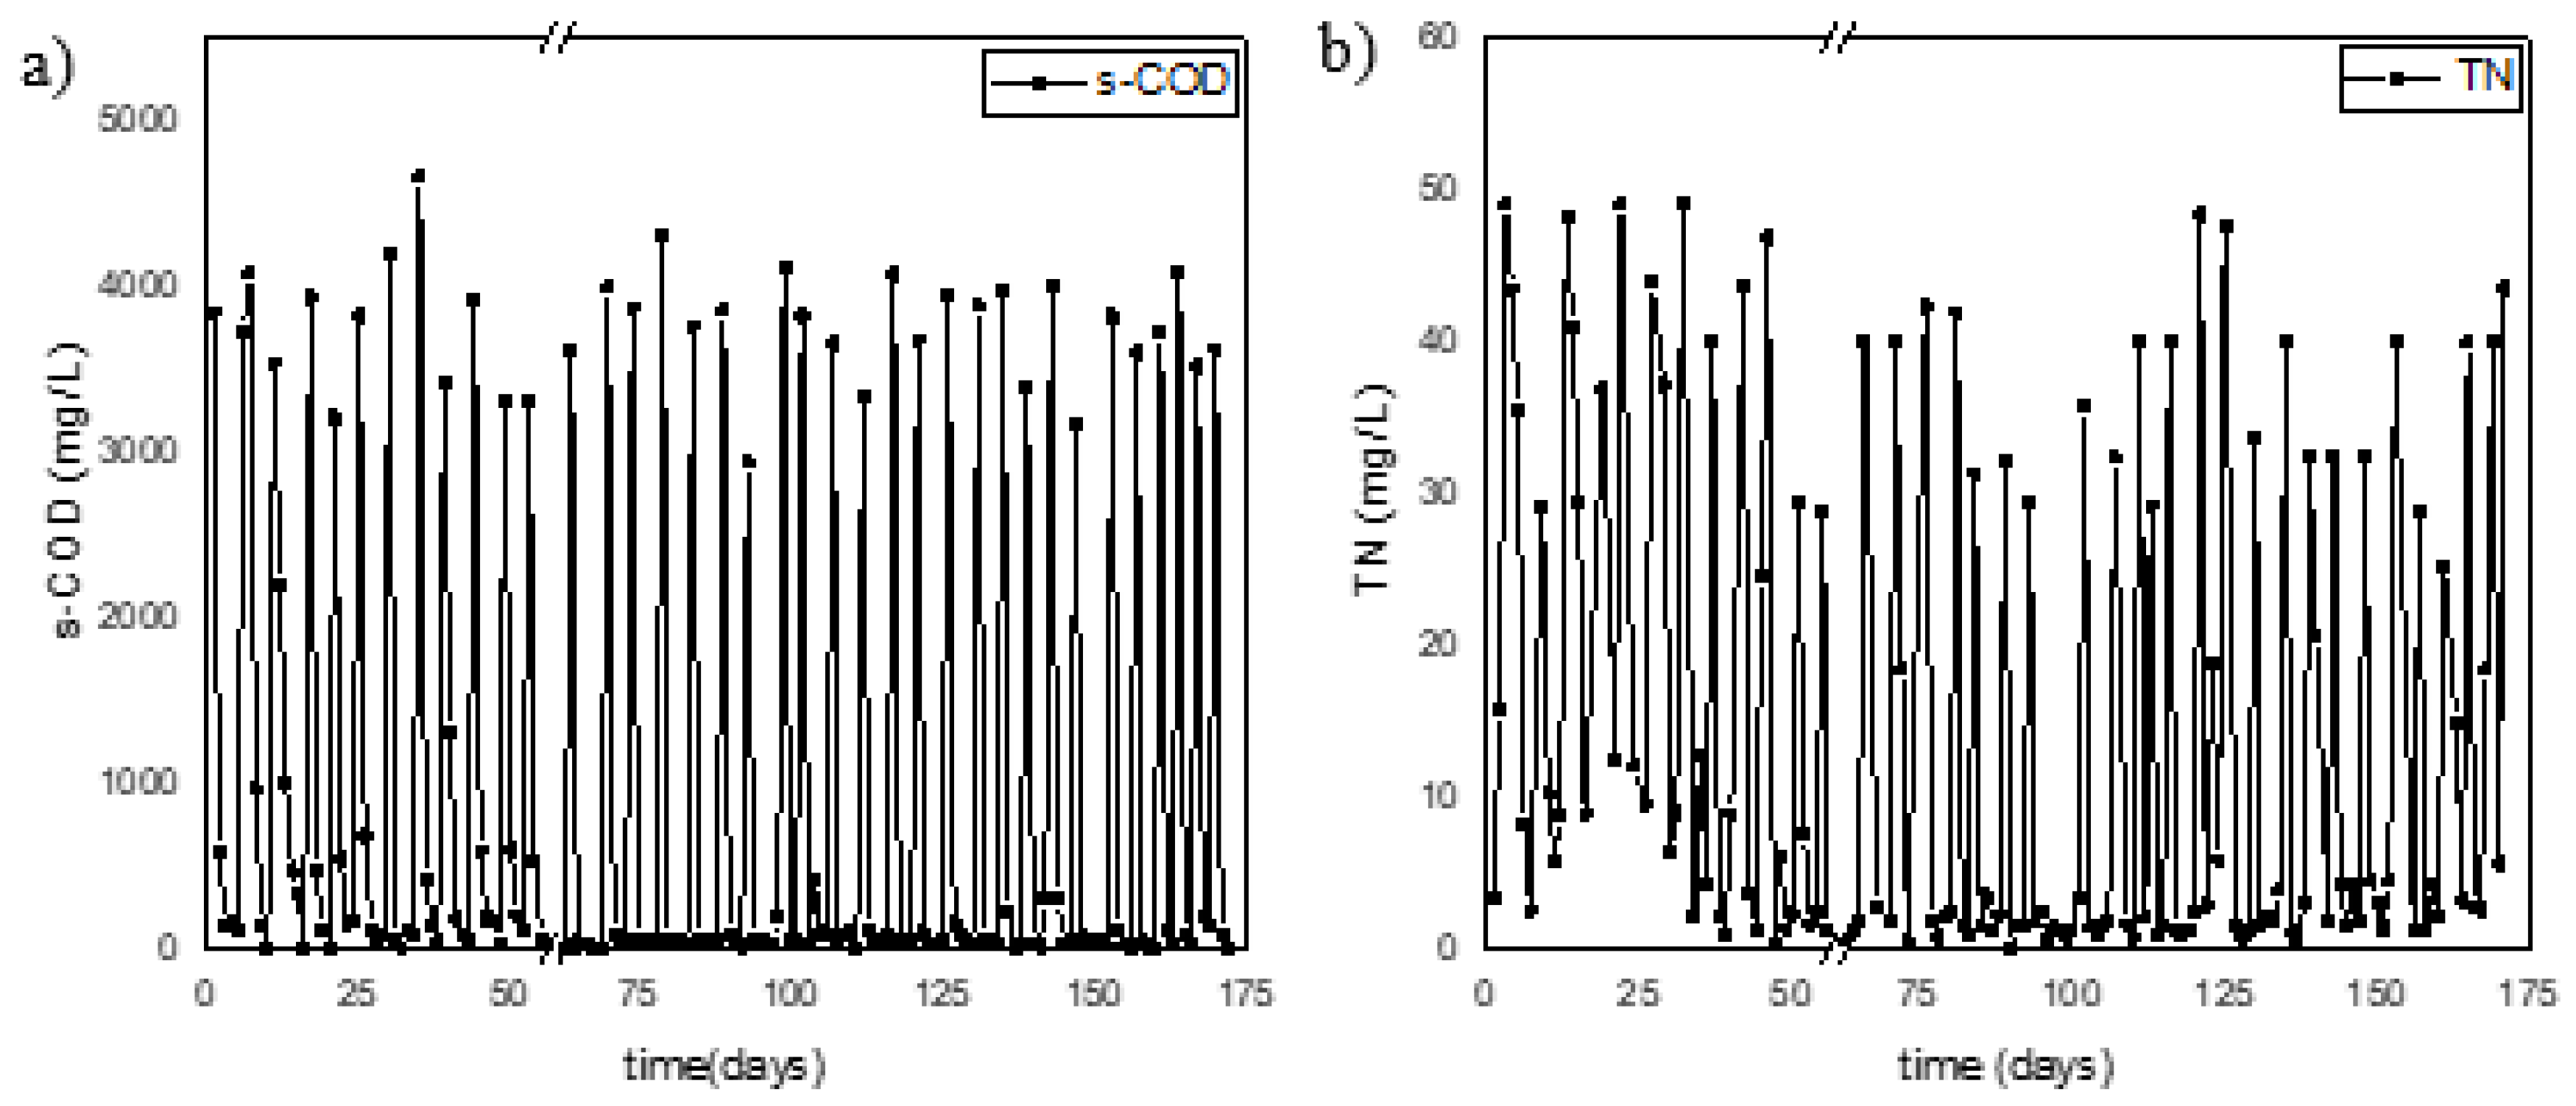
Figure 6.
Alterations of the yields of PHAs accumulated at the end of carbon phases and COD reduction during the operation of the DFR-1 (a) and DFR-2 (b).
Figure 6.
Alterations of the yields of PHAs accumulated at the end of carbon phases and COD reduction during the operation of the DFR-1 (a) and DFR-2 (b).
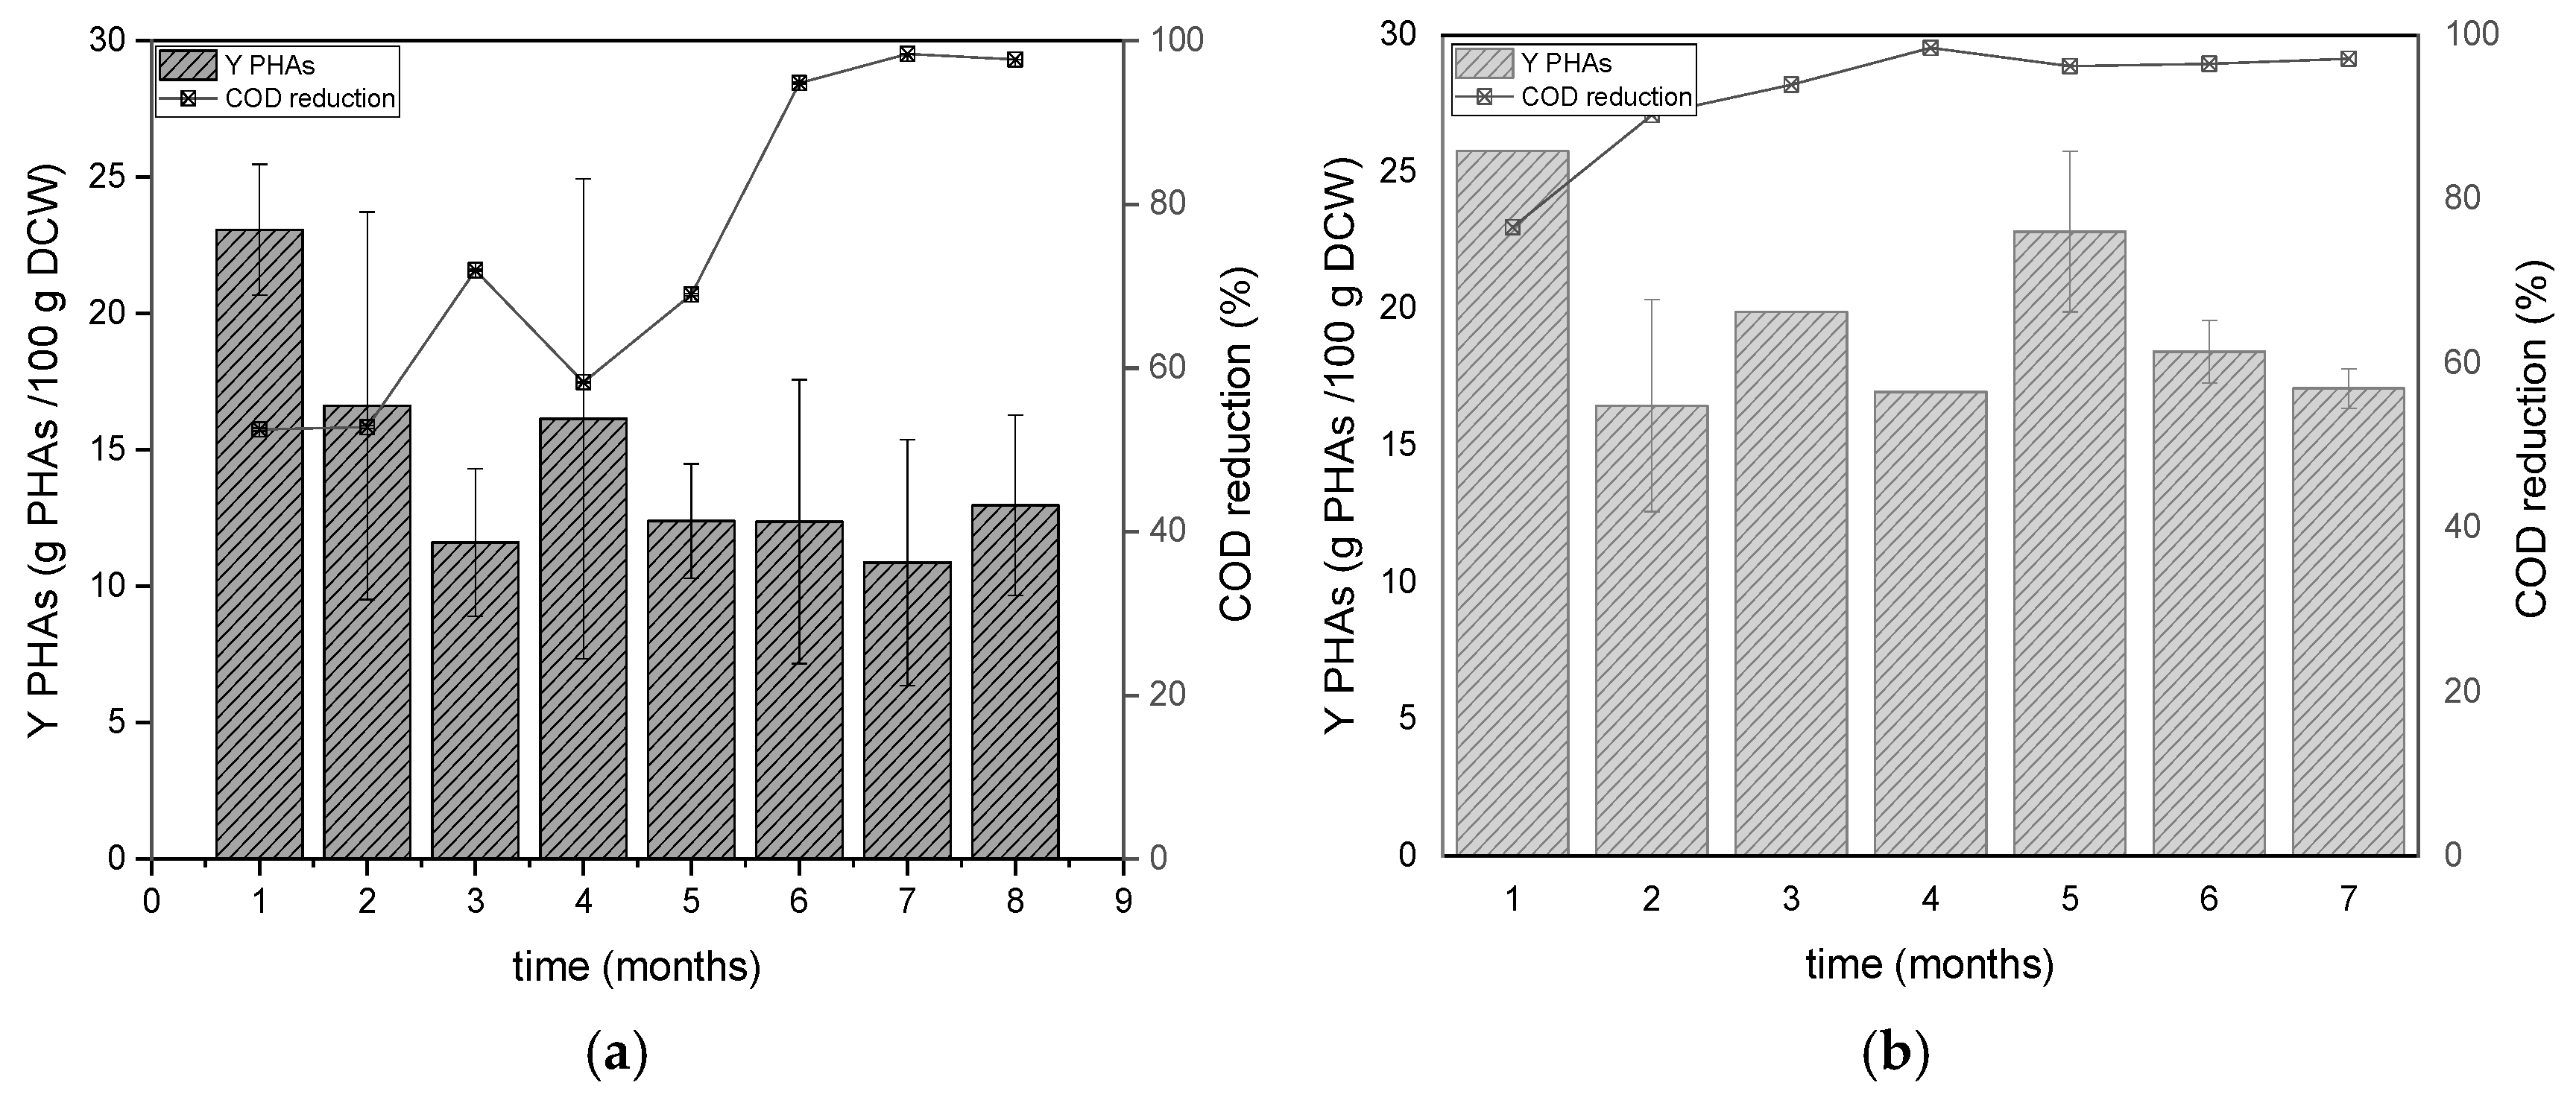
Figure 7.
Monomeric Composition of the PHAs accumulated at the end of carbon phases during the operation of the DFR-1 (a) and DFR-2 (b).
Figure 7.
Monomeric Composition of the PHAs accumulated at the end of carbon phases during the operation of the DFR-1 (a) and DFR-2 (b).
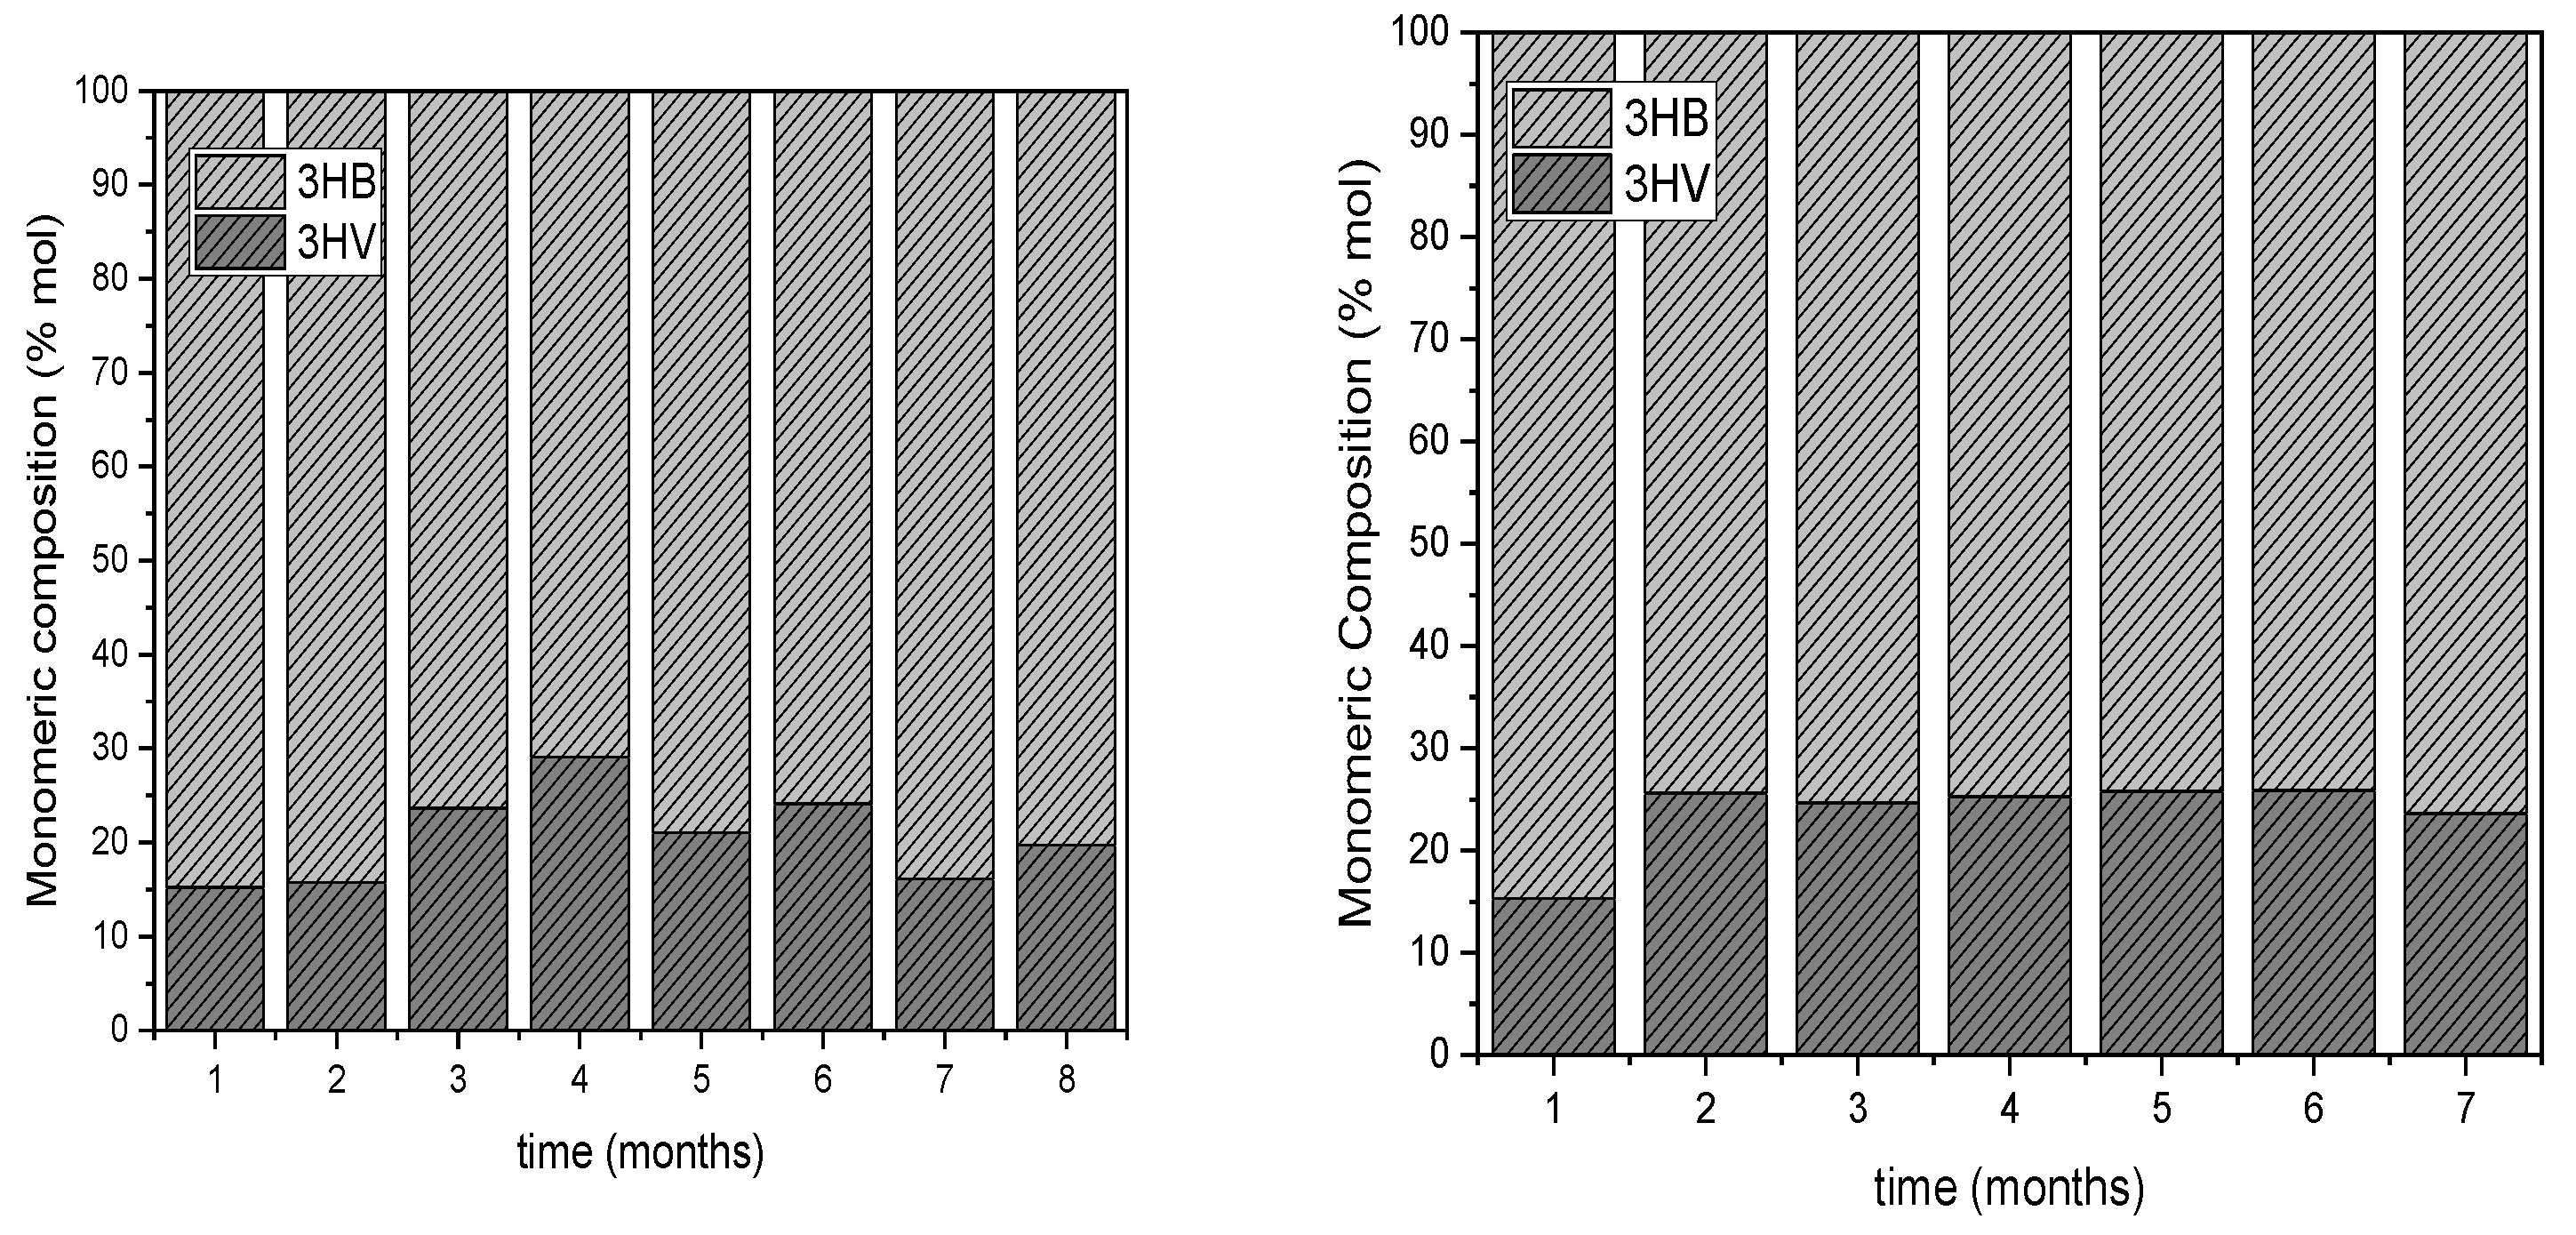
Figure 8.
Relative abundance of microbial taxa at phylum level (above) and at genera during start-up and in the two draw and fill reactors that were used for the development of the mixed microbial culture (MMC) using synthetic condensate as carbon source.
Figure 8.
Relative abundance of microbial taxa at phylum level (above) and at genera during start-up and in the two draw and fill reactors that were used for the development of the mixed microbial culture (MMC) using synthetic condensate as carbon source.
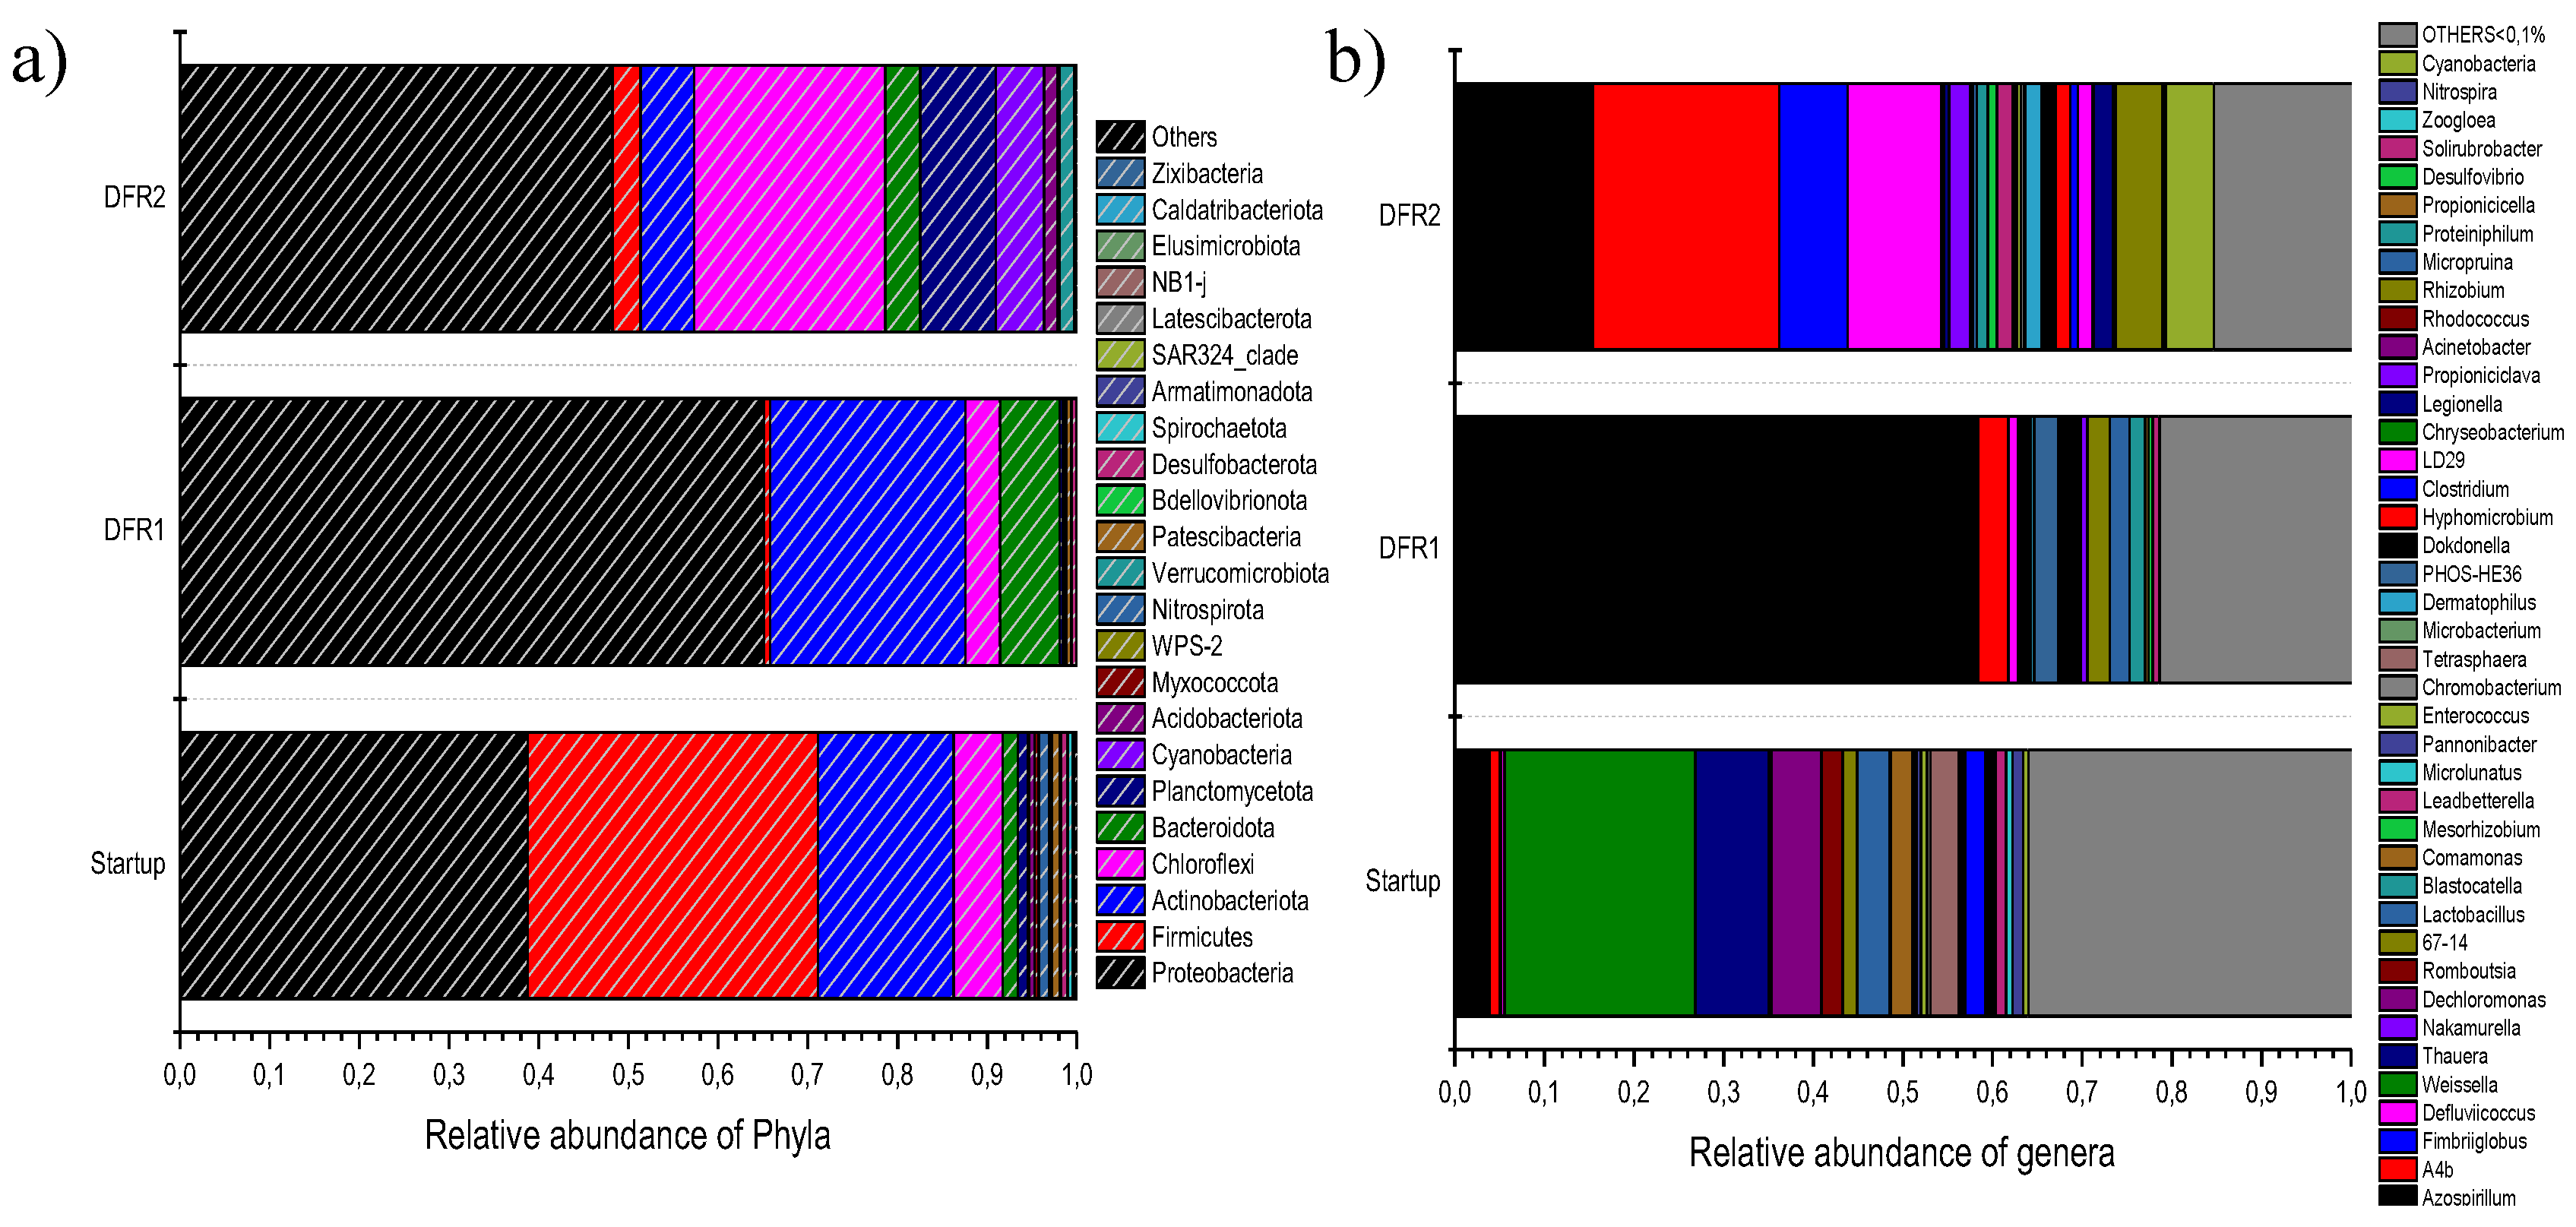

Table 1.
Operational Parameters for the two bioreactors.
| Bioreactor | C / N | OL (g COD/L) | Days of Operation |
|---|---|---|---|
| DFR-1 | 100 | 2 ± 0,5 | 223 |
| DFR-2 | 100 | 3.8 ± 0,6 | 172 |
Table 2.
Summary of the statistical results from the comparison of the two reactors.
| DFR-1 | DFR-2 | p-value | |
|---|---|---|---|
| TSS (g/L) | 2.42 ± 1.44 | 4.34 ± 2.12 | 0.0000 |
| VSS (g/L) | 2.12 ± 1.46 | 3.84 ± 1.93 | |
| % PHAs | 15.19 ± 6.00 | 19.05 ± 7.18 | 0.0653 |
| % HB | 81.41 ± 6.21 | 73.79 ± 3.80 | 0.0236 |
| % HV | 18.59 ± 6.21 | 26.21 ± 3.80 | 0.0317 |
Table 3.
Identification of the strains during start-up and in both DFR reactors to the PHA forming bacteria cultures by partial 16S rRNA gene.
Table 3.
Identification of the strains during start-up and in both DFR reactors to the PHA forming bacteria cultures by partial 16S rRNA gene.
| Start-up | DFR-1 | DFR-2 | |||
|---|---|---|---|---|---|
| Weissella (F) | 21,30% | Azospirillum (P) | 58,40% | A-4b (C) | 20,79% |
| Thauera (P) | 8,25% | Dokdonella (P) | 2,06% | Azospirillum (P) | 15,43% |
| Dechloromonas (P) | 5,52% | Microbulbifer (P) | 3,33% | Defluviicoccus (P) | 10,45% |
| Lactobacillus (F) | 3,56% | PHOS-HE36 (B) | 2,72% | Fimbriiglobus (PL) | 7,59% |
| Tetrasphaera (A) | 3,14% | Rhizobium (P) | 2,50% | Rhizobium (P) | 5,18% |
| Comamonas (P) | 2,39% | Micropruina (A) | 2,18% | Nakamurella (A) | 2,31% |
| Romboutsia (F) | 2,39% | Proteiniphilum (B) | 1,74% | Legionella (P) | 2,19% |
| Clostridium (F) | 2,33% | Defluviicoccus (P) | 1,08% | Dermatophilus (A) | 1,82% |
| 67-14 genera (A) | 1,62% | Propioniciclava (A) | 0,75% | Leadbetterella (B) | 1,78% |
| Nitrospira (N) | 1,18% | Solirubrobacter (A) | 0,72% | Dokdonella (P) | 1,52% |
| Sum top-10 | 51,69% | 75,49% | 67,55% | ||
F, Firmicutes; P, Proteobacteria; A, Actinobacteria; N, Nitrospirota; B, Bacteroidita; C, Chloroflexi; PL, Plancomycetota.
Disclaimer/Publisher’s Note: The statements, opinions and data contained in all publications are solely those of the individual author(s) and contributor(s) and not of MDPI and/or the editor(s). MDPI and/or the editor(s) disclaim responsibility for any injury to people or property resulting from any ideas, methods, instructions or products referred to in the content. |
© 2025 by the authors. Licensee MDPI, Basel, Switzerland. This article is an open access article distributed under the terms and conditions of the Creative Commons Attribution (CC BY) license (http://creativecommons.org/licenses/by/4.0/).
Copyright: This open access article is published under a Creative Commons CC BY 4.0 license, which permit the free download, distribution, and reuse, provided that the author and preprint are cited in any reuse.


