
Submitted:
25 March 2025
Posted:
26 March 2025
You are already at the latest version
Abstract
Self-similar data streams are characterized by their similarity across multiple time scales, exhibiting distinct nonlinear and discrete features. These characteristics complicate the accurate identification of data points associated with soft error features, thereby making it difficult to effectively discern the intricate relationship between the data flow and soft error data. This, in turn, severely impacts the accuracy of soft error detection in self-similar data streams. In this study, we propose a novel approach to address this challenge. Leveraging the suddenness and long-range correlation inherent in self-similar data streams, we construct a time series model to capture the data stream based on linear correlation and straight-line fitting features. By incorporating relationship parameters to fit neighboring flow points, we utilize a structural mapping model to establish the local angular relationship between the data streams and soft error data. Additionally, we construct a structural mapping network using flow features to achieve soft error detection in self-similar data streams. Experimental results demonstrate that our proposed method achieves high accuracy and low time overhead for soft error detection in self-similar data streams.
Keywords:
Structure mapping
; self-similar data flow
; soft error detection
; core functions
; linear correlation
1. Introduction
Data flow, as an important process of network transmission, refers to the transfer of information from one point to another in the system, including the generation, transmission, storage, processing, and analysis of data. However, due to the influence of different network structures, high complexity, or noise, data flow is affected by the existence of data transmission errors, storage errors, etc., which are called soft errors. Soft errors can pose a serious threat to the stability and reliability of the system. In order to improve the accuracy of data stream processing, soft error detection becomes an urgent problem.
Ahmed Maged [1] and others proposed an anomaly detection method through real-time monitoring of high-dimensional event data. They extract statistical properties, distribution patterns, and time series features, and analyze and calculate the data to derive anomaly scores or labels for each data point. Appropriate thresholds are set to distinguish between normal and abnormal data, and the system issues timely alerts when abnormal data are detected. The computational complexity increases dramatically with the increase in data dimensions. Distance calculations between data points in high-dimensional space, cluster analysis, and density estimation become very time-consuming.
Zheng Junhua [2] et al. proposed an abnormal data stream detection method based on feature complementation. Considering noise interference, they use data preprocessing combined with feature complementation techniques to complement and analyze data features. Missing data is used as the feature target to find the comparison data stream to complete the detection. In order to achieve high-precision feature complementation, complex algorithms need to be applied, and the excessive consumption of computational resources may lead to slow operation of nodes and deadlock phenomena, which affect the real-time performance of the entire network.
Zhang Lei [3] et al. proposed a soft error detection algorithm based on the instruction set architecture of the computer for data streams. They use the parallelism of instruction set architecture technology to improve the efficiency of software redundancy algorithms. The original code and redundant code are converted into high-efficiency instruction set architecture code to generate a reinforcement program with error detection capability. By vectorizing the data in the data stream, the algorithm is able to detect multiple data points simultaneously. Although this approach improves the efficiency of the software redundancy algorithm by exploiting the parallelism of the instruction set architecture technique, generating a hardened program with error detection capability may require extensive modification and optimization of the original code, which increases the complexity and cost of implementation.
Since self-similar data streams have significant nonlinear and discrete properties, it is difficult to accurately determine the data points associated with soft error features. Traditional detection methods may not be able to capture these complex relationships effectively, leading to a decrease in detection accuracy. In this study, we propose a soft error detection method for self-similar data streams based on structural mapping, which takes advantage of the self-similarity property of data streams, i.e., they have similar statistical laws in certain local characteristics and local ranges.
2. Materials and Methods
Self-similar data streams exhibit the property of similarity across multiple time scales, which usually manifests itself in the form of bursty and long correlation of traffic, i.e., the traffic increases dramatically over a short period of time and maintains this trend over a longer period of time. Such characteristics make the patterns of data flows difficult to predict and model, increasing the complexity of soft error detection and making it difficult to effectively capture the dynamic characteristics of self-similar data flows. The exponential estimation algorithm is used to scale the time series, which makes the dynamic characteristics more intuitive and precise, and helps soft error detection to make the correct judgement.
The time series [5] of the self-similar data stream is set to be,Divide into subsequences, calculate subsequence [6] means and convert to aggregated sequences The formula is:
where is the sequence length; is the number of data streams; and is the data stream. Calculate the variance of as:
In the formula, there is a linear relationship between the coordinates of and in the self-similar sequence [7]; and there is a straight line fitting relationship between the coordinates of and [8], from which the exponential relationship between the variables can be found based on the equation of the slope of the straight line, as shown in Figure 1.
Setting the data stream base scale to 1, for , the standard deviation of the series based on linear correlation and straight line fitting correlation [9] , is calculated.
where is the average value of the data stream. The data stream neighbourhood points are calculated to find the time series feature of the final self-similarity data stream as:
where , are the difference between neighbouring data points,.
Repeat the above operation to calculate the linear correlation and straight line fitting correlation of features between average neighbouring points between self-similar data streams, and substitute the field parameters into the formula to solve iteratively, so that the data points related to soft error features can be judged to help achieve accurate detection.
Soft errors in self-similar data streams often occur during data transmission, storage or processing due to incorrect signals or data. And the time series characteristics of self-similar data streams are often complex and variable. Under the influence of the complexity and irregularity of the data, screening soft errors can reduce the detection accuracy due to the inability to accurately obtain sample point features. In order to ensure the accuracy and efficiency of soft error detection, the time series of data streams obtained by the above process is used as the initial value of structure mapping, and the local angle relationship between data streams and soft error data is continuously established, so as to achieve effective detection through comparison.
Structure mapping algorithm for data stream soft error detection, which belongs to a nonlinear dimensionality reduction algorithm [10], can go through the local angle [11] to establish the relationship between data streams, and at the same time reflect the stream shape structure. Its specific implementation process is to take the parameter in Eq. (4) as the initial structure mapping target, giving the objective function as:
where and are sample points; is the period parameter; and is the connection weight between and [12].
First, determine whether an edge connection is set between samples and . If exists in the nearest neighbourhood of , set a connection connecting the two via edge connection . , calculate the size of the weights, using the core function i.e., set the connection weights as:
In Eq. is the connection coefficient. Here we can make , all neighbouring data stream weights are set to , and all other are connections are 0. This gives a symmetric connection matrix.
The minimisation function [13] is established to ensure that the two points can also be kept similar after the sum mapping, expressed as Eq:
is the Laplace matrix satisfying the diagonal mapping [14]; is the Laplace matrix satisfying the linear mapping.
To ensure that the vectors corresponding to the obtained data stream feature values are the output values after the dimensionality reduction mapping, the initial samples are dimensionality reduced by to obtain , where , are the results after the dimensionality reduction of and . Based on the stream shape features [15], the structure mapping network is given and computed to obtain:
is the corresponding neuron [16] value of the input data stream feature; is the activation factor [17,18]; and are the neuron bias.
The final detection output layer in the layer consists of 2 neurons , , when its output value is greater than 0.5, it represents the presence of soft error and the absence of soft error two output results, the formula is:
is the bias of the detection result output [19]; is the weight difference between the corresponding input sample feature and the output feature; is the difference between the normal data stream and the soft error data stream. Finally, the self-similar data stream soft error detection is achieved by comparing the weights of the data streams:
is the soft data error label gradient [20]; is the sample output label gradient.
In order to further ensure the accuracy of soft error detection of self-similar data streams obtained by Eq. (10), the results of accurate soft error detection are further verified by calculating the weights and gradient bias coefficients of the detected samples, and verifying the results of accurate soft error detection through coefficient comparisons. Calculate the output gradient comparison formula for the detection samples as:
Update the weights and bias coefficients as:
is the data stream bias factor. Comparison is made through Eq. (13), when the value of self-similar data stream samples , is greater than 1, it represents that the self-similar data stream soft error detection is accurate.
3. Results
3.1. Experimental Environment
In order to verify the practical application performance of the self-similar data stream soft error detection method based on structure mapping proposed in the paper, the background network traffic data of a school is used as the original data. In the simulation experiments, in order to ensure the intuitiveness and comparability of the experimental data, an equal-length time series is set up, and considering the existence of multiple types and forms of data stream soft data, the sample data of a short period of time may not meet the detection conditions, and the external fault input is used to generate data stream soft errors. Meanwhile, experiments will be conducted simultaneously with the anomaly detection method through real-time monitoring of high-dimensional event data, and the network anomaly data stream detection algorithm based on feature complementation as a comparison method.
The detailed parameters related to the network are shown in Table 1, and the network experimental environment is shown in Figure 2.
During the experiment, a time series is set for the original data, in which the burstiness parameter of the data stream is set to 0.8 and the long correlation parameter is set to 0.6 to ensure the self-similarity characteristics of the data stream. When constructing the time series, linear correlation and straight line fitting methods are used to extract the features, with the linear correlation coefficient threshold set to 0.75 and the straight line fitting error not exceeding 0.05. In the structural mapping model, the eigenvalues of the data stream of the time series are used as the initial input, the Gaussian kernel is selected for the core function, the weight decay coefficient is set to 0.1 for the calculation of the feature weights, and the step size of the gradient derivation at the sample points is set to 0.01. Using the above parameters, the proposed method constructs the local angle relationship between the data stream and the soft error data, and is trained by a structure mapping network containing 100 neuron nodes, and finally determines the existence or non-existence of the soft error by the output values of the two neurons (with the threshold set to 0.5).
In order to verify the practical application effect of the proposed method, the flow amplitude of the self-similar data streams in the network is used as an index to give the results of the variation of the flow amplitude, as shown in Figure 3.
As can be seen in Figure 3, the proposed method has a high degree of agreement between the traffic amplitude of the data stream and the real results, and the traffic amplitude of this paper is around 10bits in the 3s time point position, while the actual results are around 11bits, with a small difference. The above results show that the proposed method has high accuracy in detecting the change of data flow amplitude, and it can accurately capture the position and change of high amplitude soft error flow, and the performance of peak and trough fluctuation of flow is also the same as the real situation.
4. Discussion
In practice, the data loss rate of queue transmission can also reflect the data flow soft error situation, the more serious the packet loss phenomenon represents more soft errors. The experimental results of the three methods are shown in Figure 4.
As can be seen from Figure 4, the agreement between the queue packet loss rate curves of the proposed method and the real results is the highest among the three methods. Moreover, the fluctuation of the curves at different time nodes hardly exhibits a large gap, which indicates that the accuracy of the detection results based on packet loss rate is higher. In contrast, there is a large gap between the curves of the other two methods and the actual situation.
Soft error detection imposes additional running time, i.e., time overhead, on the program. A smaller value of time overhead represents a shorter execution time for the detection algorithm, a quicker soft error detection process, and a lower number of detection errors. The results of the comparison of the three methods are shown in Figure 5.
From Figure 5, it can be seen that among the three methods, the distribution of the time overhead curve for the proposed method is the lowest, and there is no significant upward trend. In contrast, the overhead curves of the other two methods are higher. This indicates that under the same conditions, the method proposed in this paper can achieve highly accurate soft error detection with the fastest and lowest time consumption.
Detection results based on packet loss rate of the data stream queue: As can be seen from Figure 4, the agreement between the queue packet loss rate curves of the proposed method and the real results is the highest among the three methods. Moreover, the fluctuation of the curves at different time nodes hardly exhibits any large deviations.
5. Conclusions
In order to improve the stability and efficiency of network data stream transmission, a soft error detection method for self-similar data streams based on structural mapping is proposed. A feature analysis model based on time series is established, leveraging the self-similarity law of self-similar data streams to extract the linear correlation and straight-line fitting correlation features of adjacent nodes. These extracted features serve as a reference for subsequent soft error detection, thereby enhancing detection efficiency.
The features of the soft error data stream are used as structural mapping factors. By continuously iterating and comparing the data stream weights and gradients, efficient soft error detection is achieved. Experimental data demonstrate that the detection algorithms possess strong practical application capabilities. Each method has its own specific scenarios and scope of application. Future research will primarily focus on developing customized anomaly detection methods tailored to practical application scenarios to meet the needs of different domains and businesses. These directions will help to advance the field of structured data anomaly detection and improve its reliability and effectiveness in practical applications.
6. Patents
This research was funded by :
- (1)
- Natural Science Foundation of Fujian Province, grant number 2023J011807
- (2)
- Natural Science Foundation of Fujian Province, grant number 2023J011800
- (3)
- Educational Research Programme for Young and Middle-aged Teachers in Fujian Province,grant number:JAT210557
References
- Maged, A.; Zwetsloot, I. Anomaly Detection via Real-Time Monitoring of High-Dimensional Event Data. IEEE Trans. Ind. Informatics 2023, 20, 2856–2864. [CrossRef]
- Zheng Junhua, Wei JinHong. Anomaly Data Flow Detection in Wireless Sensor Networks Based on Feature Completion [J]. Chinese Journal of Sensors and Actuators, 2024, 37 (06): 1061-1066.
- Zhang Lei, Peng Fei, Cao Zining, et al. Data Flow Soft Error Detection Algorithm Based on SIMD Vectorization [J]. Journal of Chinese Computer Systems, 2023, 44 (05): 1114-1120.
- Gao R , Wei X S , Chen A D W .Leveraging DNA-Based Nanostructures for Advanced Error Detection and Correction in Data Communication[J].ACS nano, 2023, 17(18):18055-18061.
- Wei Debin, Pan Chengsheng, Yang Li, et al. Adaptive Random Early Detection Algorithm Based on Network Traffic Level Prediction [J]. Journal of Communications, 2023, 44 (06): 154-166.
- Yin Xiaokang, Lu Bin, Cai Ruijie, et al. Memory Copy Function Identification Technique with Control Flow and Data Flow Analysis [J]. Journal of Computer Research and Development, 2023, 60 (02): 326-340.
- Huang Fenglan, Ni Feng, Liu Jiang, et al. Data flow modeling and verification of complex BPMN collaboration models based on HCPN [J]. Computer Integrated Manufacturing Systems, 2024, 30 (05): 1754-1769.
- Gong Xiaoxing, Dong Peixin. A Traffic Flow Anomaly Data Detection Model Based on Improved Isolation Forest Algorithm [J]. Journal of Chongqing Jiaotong University (Natural Science Edition), 2024, 43 (05): 61-69+90.
- An T , Yan P , Zuo J ,et al. Enhancing Cross-Lingual Sarcasm Detection by a Prompt Learning Framework with Data Augmentation and Contrastive Learning[J].electronics,2024,13(11):2163.
- Schultz V , Hedderich D M , Schmitz-Koep B ,et al. Removing outliers from the normative database improves regional atrophy detection in single-subject voxel-based morphometry[J].Neuroradiology,2024,66(4):507-519.
- Su Xiangjing, Deng Chao, Li Fengyong, et al. Interpretable Detection Method for False Data Injection Attack on Power Grid Based on Multi-head Graph Attention Network and Time Convolution Network Model [J]. Automation of Electric Power Systems, 2024, 48 (02): 118-127.
- Chen M , Hu Y . An image-based runway detection method for fixed-wing aircraft based on deep neural network[J].IET image processing,2024,18(8):1939-1949.
- Wang Dewen, Pan Xiaofei, Zhao Hongbo. Temporal Data Anomaly Detection Based on Improved Generative Adversarial Networks [J]. Computer Engineering and Design, 2024, 45 (03): 762-768.
- Jiang Z , Zhou C . Age detection by optimizing the structure of layers and neurons in the neural network[J].Journal of optics,2024,53(2):1186-1202.
- Wang Shaorong, Huang Weichun, Zong Bo. Defect Dynamic Feature Classification Algorithm Based on Manifold Learning Dimensionality Reduction[J]. Computer Simulation,2023,40(11):475-479.
- Chen Weitong, Xu Xin, Zhu Changqing, et al. Copyright protection algorithm for remote sensing object detection dataset based on backdoor watermarking and region of interest encryption [J]. Acta Geodaetica et Cartographica Sinica, 2024, 53 (11): 2086-2098.
- Miyazaki, K.; Ida, M. Performance evaluation of character-level CNNs using tweet data and analysis for weight perturbations. Artif. Life Robot. 2024, 29, 266–273. [CrossRef]
- Liu Y , Xu J , Yee A L . The analysis of Iris image acquisition and real-time detection system using convolutional neural network[J].Journal of supercomputing,2024,80(4):4500-4532.
- Xu Tianhui, Guo Qiang, Zhang Caiming. A serial autoencoders based method for detecting time series anomalies [J]. Control and Decision, 2023, 38 (12): 3507-3515.
- Drner S , Clausius J , Brink C S T .Learning Joint Detection, Equalization and Decoding for Short-Packet Communications[J].IEEE Transactions on Communications, 2023, 71(2):837-850.
- Guan, S.; He, Z.; Ma, S.; Gao, M. Multivariate time series anomaly detection with variational autoencoder and spatial–temporal graph network. Comput. Secur. 2024, 142. [CrossRef]
- Gensler, A.; Sick, B. Performing event detection in time series with SwiftEvent: an algorithm with supervised learning of detection criteria. Pattern Anal. Appl. 2017, 21, 543–562. [CrossRef]
- Zhang S, Zhou C, Zhang P, et al. Multiple hypothesis testing for anomaly detection in multi-type event sequences[C]//2023 IEEE International Conference on Data Mining (ICDM). IEEE, 2023: 808-817.
- Yang G, Kulkarni N, Dua P, et al. Anomaly detection for spatiotemporal data in action[C]//Proceedings of the 28th ACM SIGKDD Conference on Knowledge Discovery and Data Mining. 2022: 4844-4845.
- Hassan E, Shroff G, Agarwal P. Multi-sensor event detection using shape histograms[C]//Proceedings of the 2nd ACM IKDD Conference on Data Sciences. 2015: 20-29.
- Nguyen H V, Vreeken J. Linear-time detection of non-linear changes in massively high dimensional time series[C]//Proceedings of the 2016 SIAM International Conference on Data Mining. Society for Industrial and Applied Mathematics, 2016: 828-836.
- Xiao, X.; Chen, P.; Ye, Z.; Tsui, K.-L. On computing multiple change points for the gamma distribution. J. Qual. Technol. 2020, 53, 267–288. [CrossRef]
- Yamin K, Wang H, Montreuil B, Xie Y. Online detection of supply chain network disruptions using sequential change-point detection for Hawkes processes. arXiv preprint arXiv:2211.12091. 2022 Nov 22.
- Cao, Y.; Xie, L.; Xie, Y.; Xu, H. Sequential Change-Point Detection via Online Convex Optimization. Entropy 2018, 20, 108. [CrossRef]
- Leland WE, Taqqu MS, Willinger W, Wilson DV. On the self-similar nature of Ethernet traffic. InConference proceedings on Communications architectures, protocols and applications 1993 Oct 1 (pp. 183-193).
- Roquer T, Arancibia G, Crempien JG, Mery D, Rowland J, Sepúlveda J, Veloso EE, Nehler M, Bracke R, Morata D. Multi-scale flow structure of a strike-slip tectonic setting: A self-similar model for the Liquiñe-Ofqui Fault System and the Andean Transverse Faults, Southern Andes (39–40° S). Geothermics. 2022 Jul 1;103:102424.
- Uritsky, V.M.; Karpen, J.T.; Raouafi, N.E.; Kumar, P.; DeVore, C.R.; Deforest, C.E. Self-similar Outflows at the Source of the Fast Solar Wind: A Smoking Gun of Multiscale Impulsive Reconnection?. Astrophys. J. 2023, 955, L38. [CrossRef]
- Coluccio, M.L.; Gentile, F.; Das, G.; Nicastri, A.; Perri, A.M.; Candeloro, P.; Perozziello, G.; Zaccaria, R.P.; Gongora, J.S.T.; Alrasheed, S.; et al. Detection of single amino acid mutation in human breast cancer by disordered plasmonic self-similar chain. Sci. Adv. 2015, 1, e1500487. [CrossRef]
- Karimov, A.; Babkin, I.; Rybin, V.; Butusov, D. Matryoshka multistability: Coexistence of an infinite number of exactly self-similar nested attractors in a fractal phase space. Chaos, Solitons Fractals 2024, 187. [CrossRef]
- Anjos, P.H.A.; Zhao, M.; Lowengrub, J.; Li, S. Electrically controlled self-similar evolution of viscous fingering patterns. Phys. Rev. Fluids 2022, 7, 053903. [CrossRef]
- Sadegh, S.; Higgins, J.L.; Mannion, P.C.; Tamkun, M.M.; Krapf, D. Plasma Membrane is Compartmentalized by a Self-Similar Cortical Actin Meshwork. Phys. Rev. X 2017, 7, 011031. [CrossRef]
- Han, C.; Xiong, W.; Yu, R. A Hybrid Forecasting Model for Self-Similar Traffic in LEO Mega-Constellation Networks. Aerospace 2024, 11, 191. [CrossRef]
- Trabes, E.; Jordan, M.A. A Node-Based Method for SLAM Navigation in Self-Similar Underwater Environments: A Case Study. Robotics 2017, 6, 29. [CrossRef]
- Expert, P.; Lambiotte, R.; Chialvo, D.R.; Christensen, K.; Jensen, H.J.; Sharp, D.J.; Turkheimer, F. Self-similar correlation function in brain resting-state functional magnetic resonance imaging. J. R. Soc. Interface 2010, 8, 472–479. [CrossRef]
- Mahdavi, H.; Poulios, K.; Niordson, C.F. A Pragmatic Approach for the Evaluation of Depth-Sensing Indentation in the Self-Similar Regime. J. Appl. Mech. 2021, 89, 1–24. [CrossRef]
Figure 1.
Exponential relationship between variables.
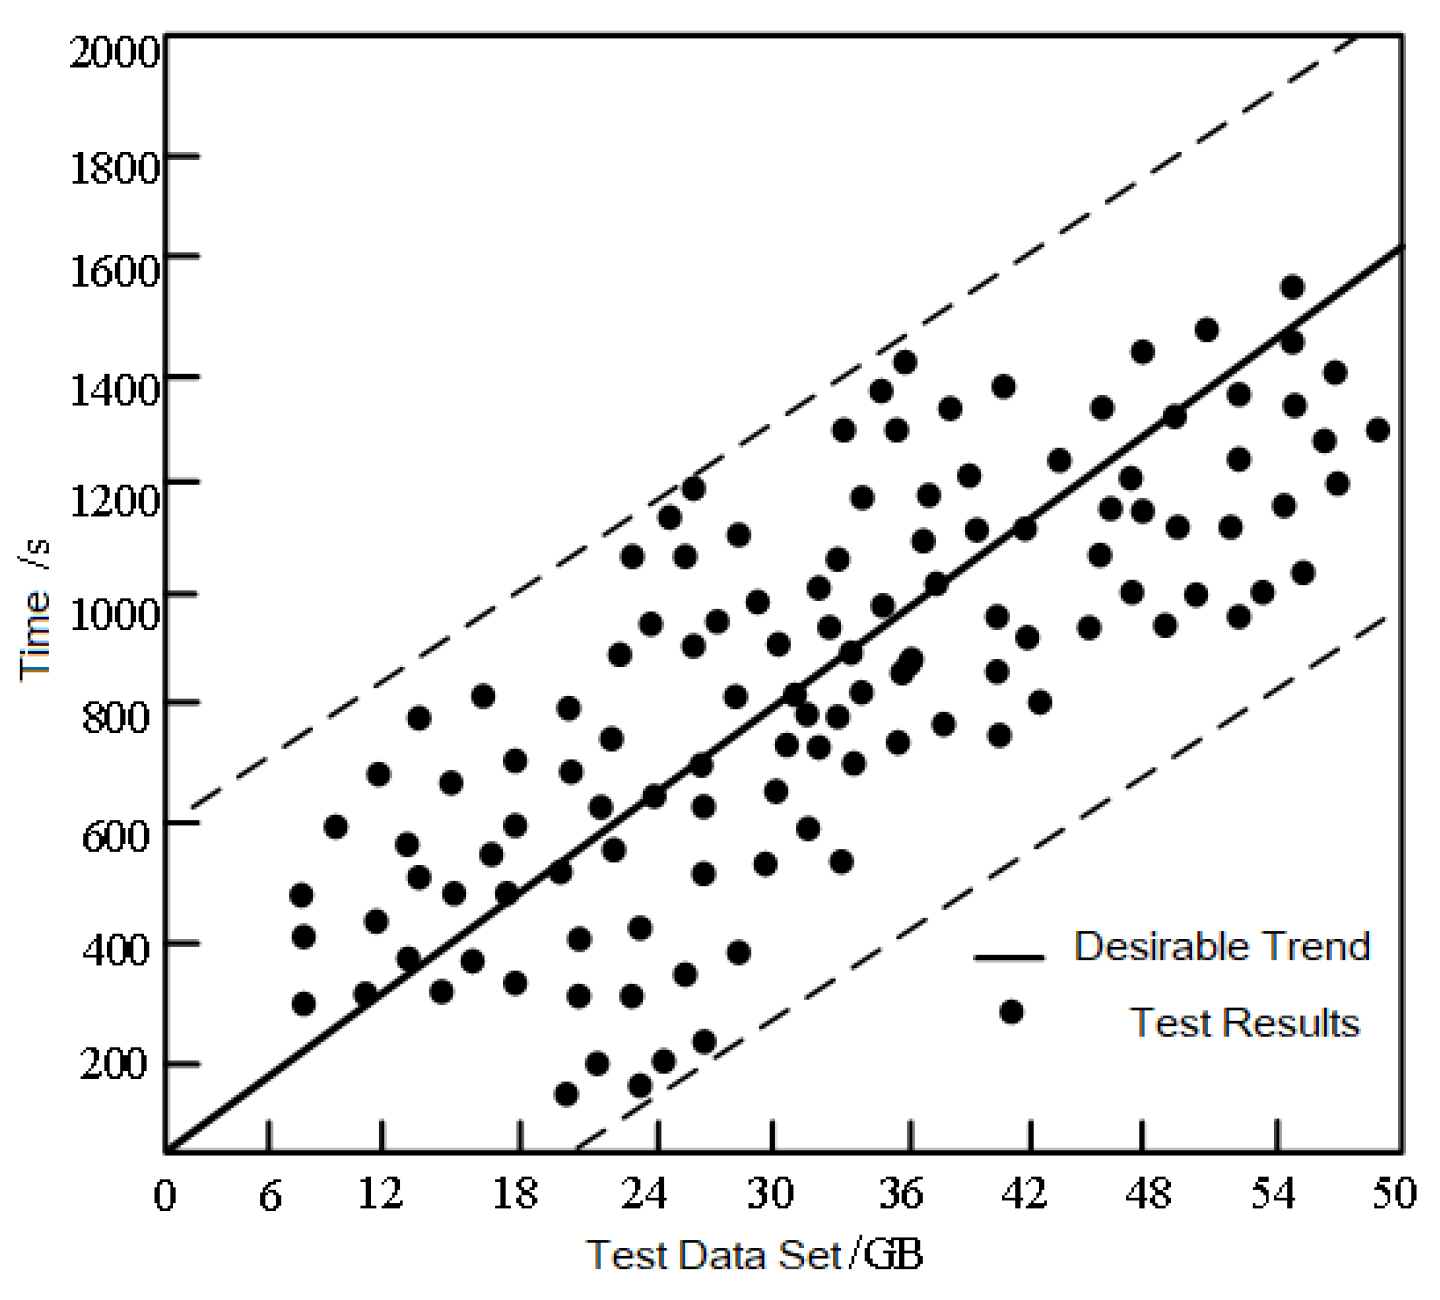
Figure 2.
Schematic diagram of network experiment environment.
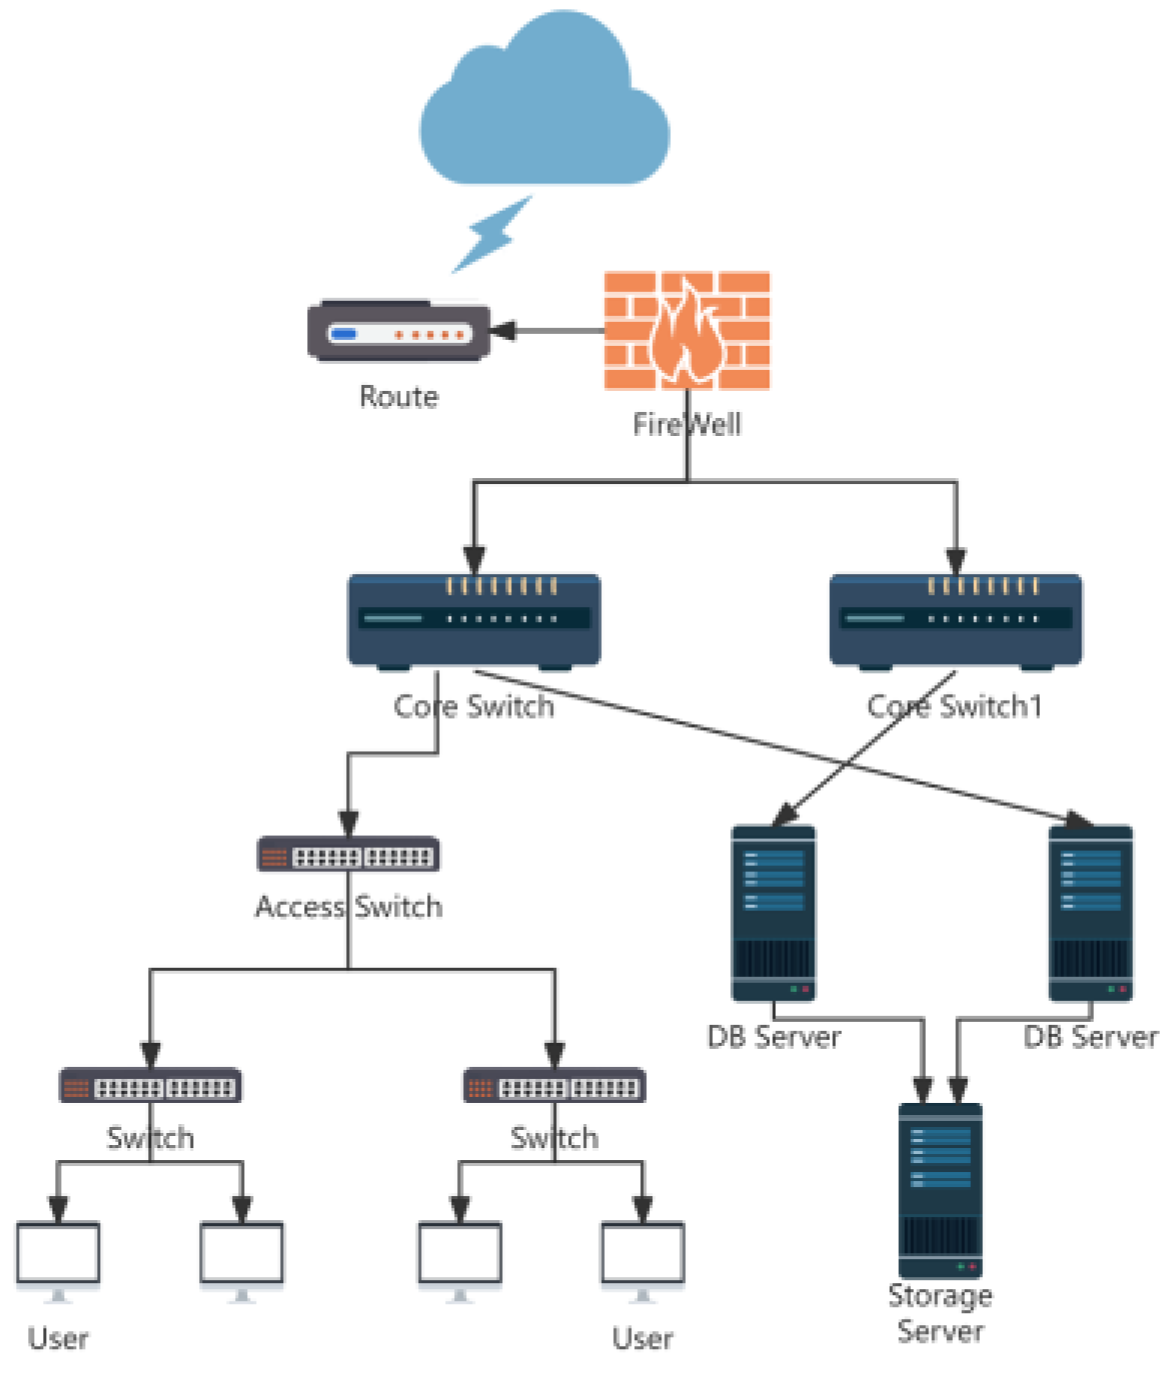
Figure 3.
Comparison results of traffic amplitude detection for self similar data streams: (a) Actual amplitude change from similar data streams; (b) Changes in the amplitude of the data stream of the proposed method.
Figure 3.
Comparison results of traffic amplitude detection for self similar data streams: (a) Actual amplitude change from similar data streams; (b) Changes in the amplitude of the data stream of the proposed method.
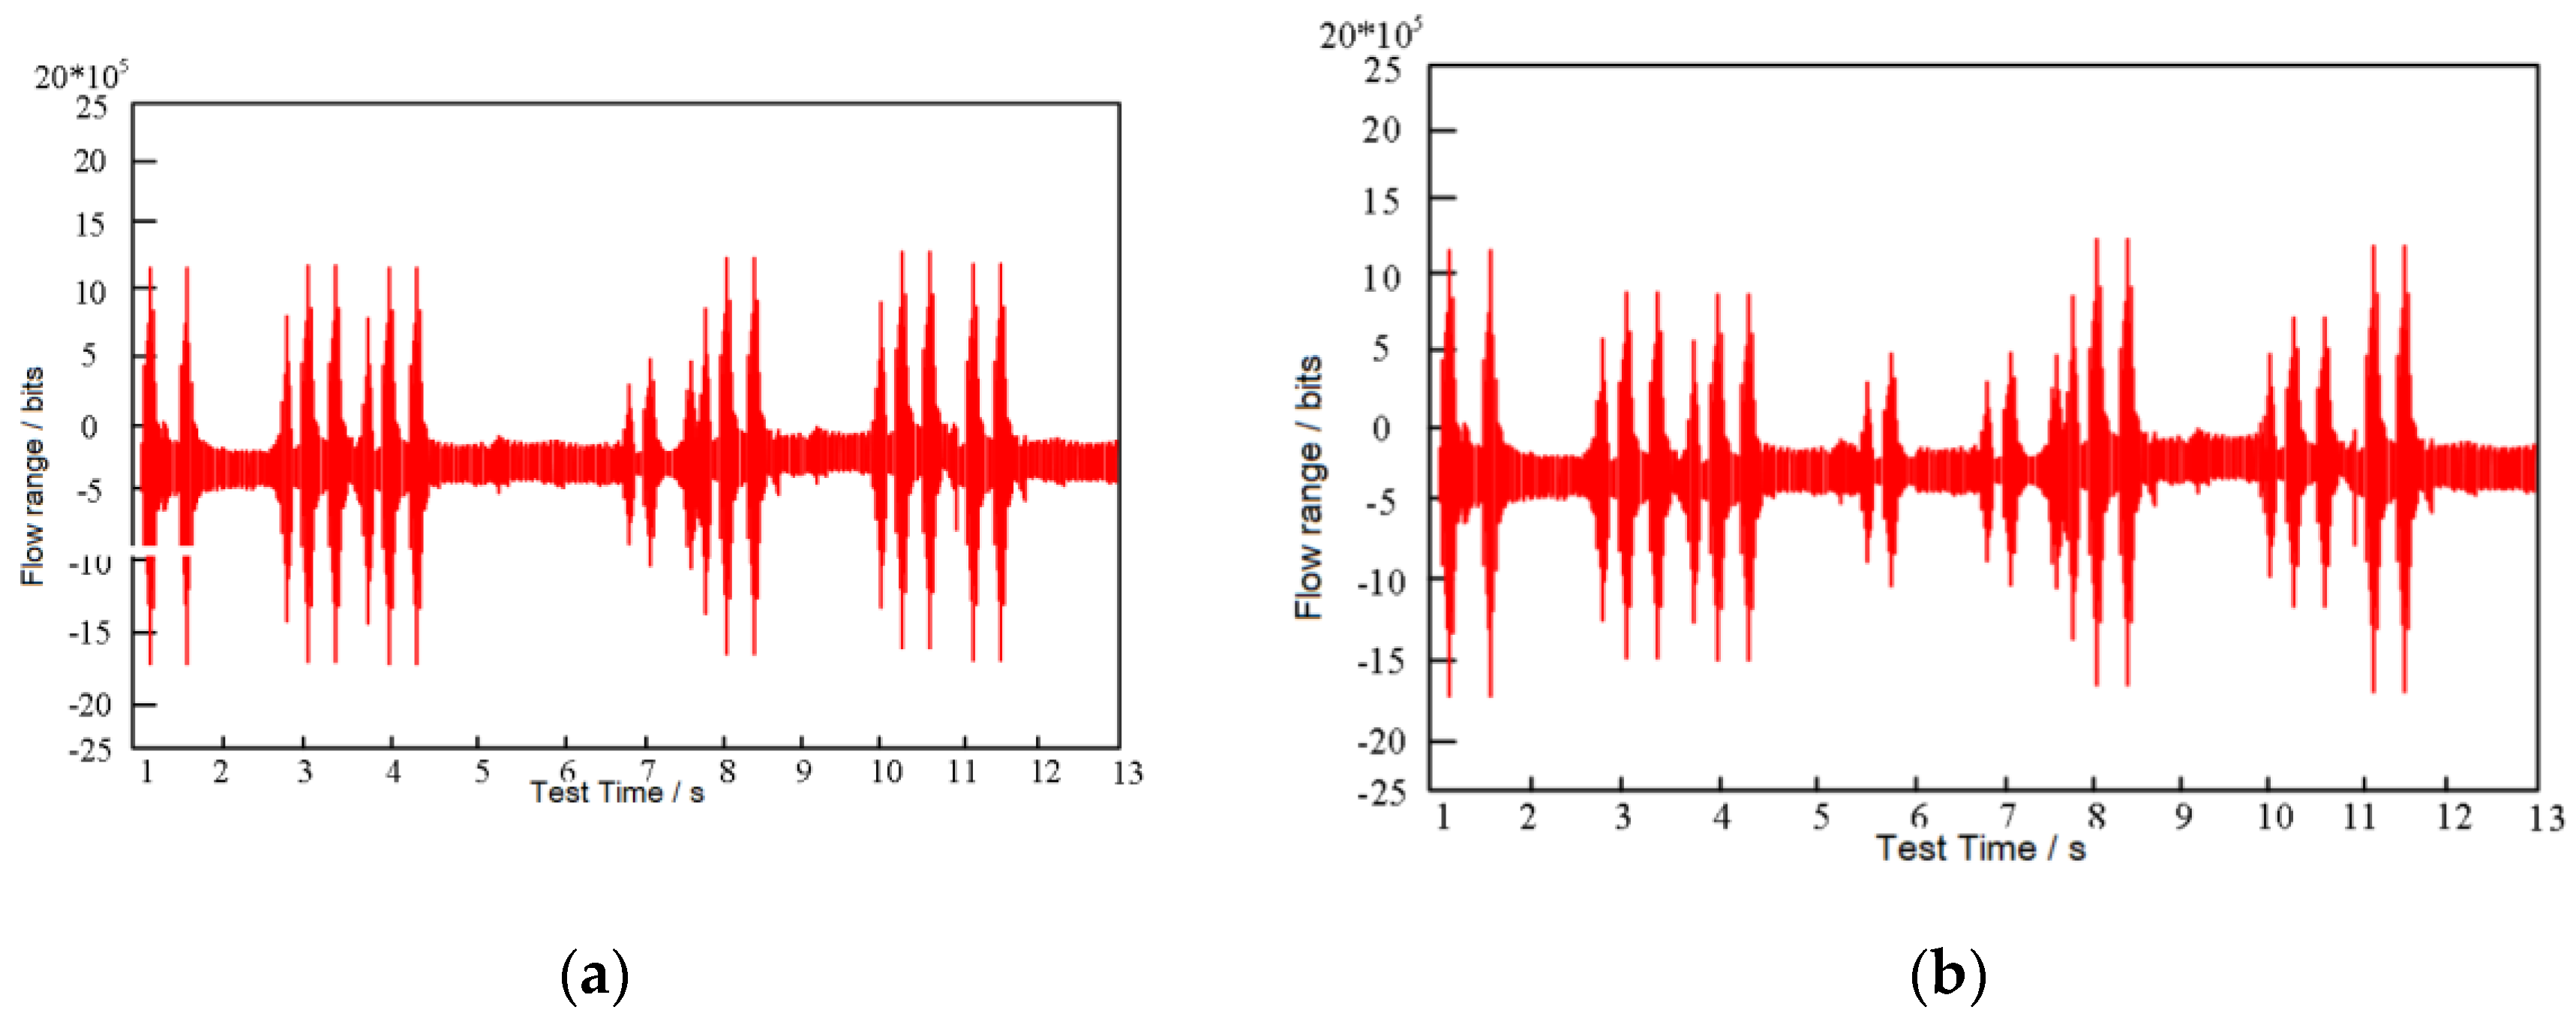
Figure 4.
Detection results based on packet loss rate of data stream queue.
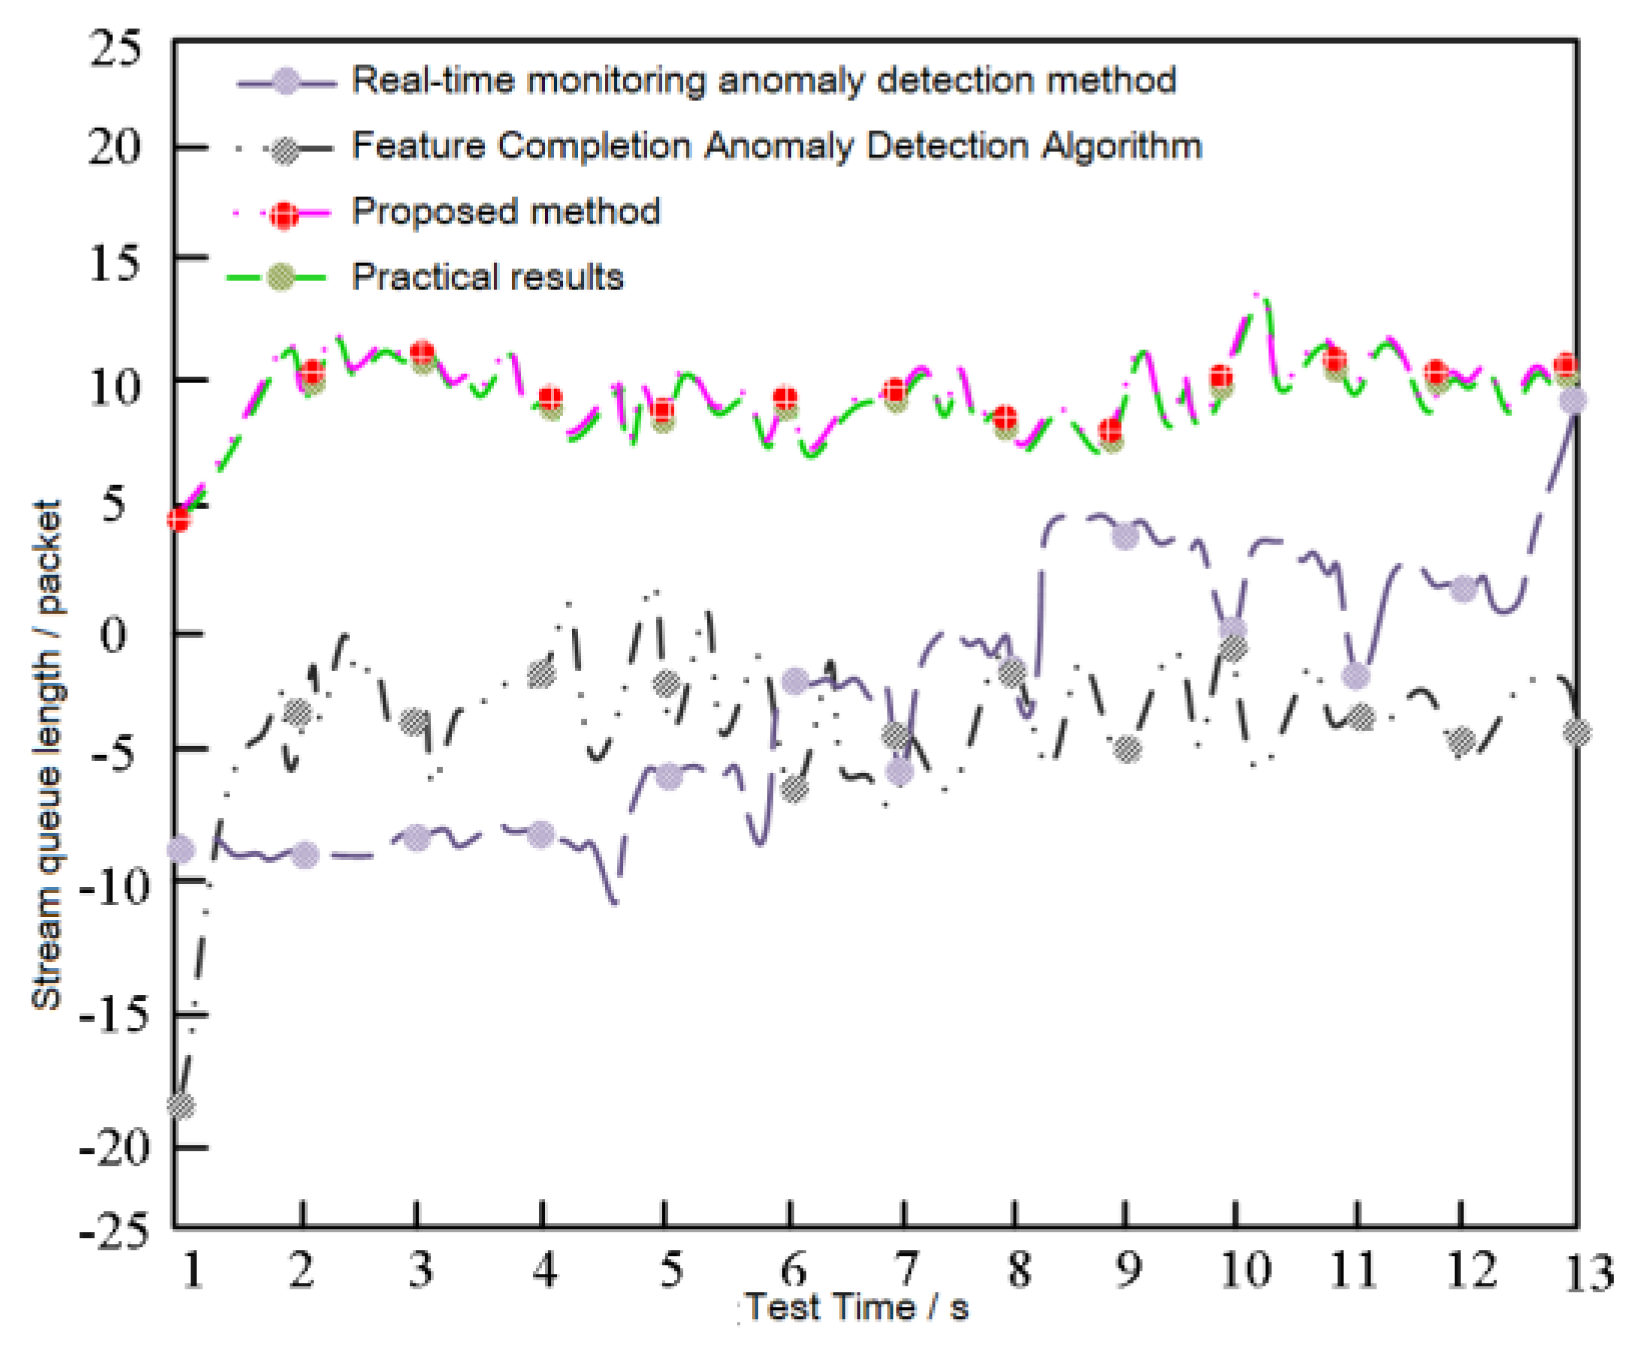
Figure 5.
Comparison curve based on time cost.

Table 1.
Schematic diagram of detailed network related parameters.
| Item | Parameter |
| Transmission Rate | 1000Mbps |
| Frequency bandwidth | 100MHz |
| Attenuation Coefficient | 22dB |
| Frequency Response | ±300dB |
| Baud rate | 0*0001 words |
| Communication channel byte number | 2316bytes |
Disclaimer/Publisher’s Note: The statements, opinions and data contained in all publications are solely those of the individual author(s) and contributor(s) and not of MDPI and/or the editor(s). MDPI and/or the editor(s) disclaim responsibility for any injury to people or property resulting from any ideas, methods, instructions or products referred to in the content. |
© 2025 by the authors. Licensee MDPI, Basel, Switzerland. This article is an open access article distributed under the terms and conditions of the Creative Commons Attribution (CC BY) license (http://creativecommons.org/licenses/by/4.0/).
Copyright: This open access article is published under a Creative Commons CC BY 4.0 license, which permit the free download, distribution, and reuse, provided that the author and preprint are cited in any reuse.


