Submitted:
24 March 2025
Posted:
25 March 2025
You are already at the latest version
Abstract
In Finland, municipal wastewater treatment has significantly improved in recent decades, leading to a substantial reduction in wastewater-induced nutrient loads on water bodies. For example, in the marine area off Turku in the Archipelago Sea, located in the northern Baltic, the total phosphorus load from wastewater has decreased to about one-eighth of its early 1990s level. Simultaneously, the total nitrogen load has been reduced to one-fifth, and the ammonium nitrogen load is now less than 5% of its peak in 1994. However, the effects of reduced wastewater nutrient loads have been difficult to identify unambiguously, as riverine nutrient inputs have remained unchanged, and the overall ecological state of the Archipelago Sea has continued to deteriorate. This study examines in detail how water quality parameters and phytoplankton indicators in wastewater-affected areas have changed over the same period during which wastewater loads have significantly decreased. Despite the reductions in wastewater loading, improvements in the ecological state of water bodies have remained surprisingly minor. For example, in Raisio Bay, where wastewater discharges ceased entirely in 2008 due to centralization, total phosphorus concentrations have remained in the bad category. However, the phytoplankton-related variable, chlorophyll a concentration, improved from bad to poor. Over the past 15 years, the biomass of nitrogen-fixing cyanobacteria appears to have increased in the Northern Airisto. This trend is driven by a decrease in external nitrogen loading alongside an increase in internal phosphorus loading. The inner archipelago’s water bodies continue to receive excessive nutrient loads from the surrounding catchment area, and internal loading significantly slows down the restoration process.
Keywords:
Archipelago Sea
; wastewater load
; reduction
; restoration
1. Introduction
Almost all indices related to anthropogenic environmental change and natural resource consumption began accelerating in the 1950s [1,2]. This trend was also evident in the increasing nutrient loads in the Baltic Sea. In Finland, for instance, the volume of water pumped into the sewage system in 1969 was 3.7 times higher than in 1950 [1]. The rise in nutrient discharge was likely even greater, as phosphate-containing detergents became widely used during the same period. At the time, most municipal and industrial wastewater from Baltic Sea countries was discharged into waterways either with minimal filtration or entirely untreated. This era also marked a shift in agricultural practices, with farms increasingly replacing manure with synthetic fertilizers [1]. It has been estimated that the nutrient load entering the Baltic Sea increased up to eightfold during the 20th century, with the majority of this growth occurring between 1950 and 1980 [3].
Various statistics suggest that eutrophication related to sewage pollution began around 1955 in the central Baltic Sea [4]. The Eutrophication Ratio (ER) [5] indicates that eutrophication emerged in the mid-1950s, peaked in the 1980s, and subsequently improved significantly. Andersen et al. [5] documented these improvements, which are a direct result of long-term efforts to reduce nutrient inputs.
In Finland, wastewater treatment only began after the Water Act came into effect in 1962. The law prohibited activities that polluted water bodies and required polluters to apply for permits to discharge wastewater. However, the processing of wastewater permits was slow, and obtaining decisions took a long time. The largest wastewater polluter in the Archipelago Sea was the city of Turku. Turku’s first wastewater treatment plant was completed relatively late, only at the end of the 1960s. Until then, the city’s wastewater was discharged into the Aura River, which became increasingly polluted year by year. Over time, the lower reaches of the river began to resemble an open sewer.
In the 1960s, Turku had approximately 120,000 residents, while its neighboring municipalities—Raisio, Naantali, and Kaarina—had a combined population of around 25,000. By the late 1960s, before wastewater treatment plants were built, the wastewater from 145,000 people was discharged directly into the sea off Turku. It is estimated that this wastewater contributed approximately 120 tons of phosphorus and 740 tons of nitrogen per year to the Archipelago Sea. By 2023, the estimated phosphorus load from wastewater discharged into the sea by the Turku region’s central wastewater treatment plant had decreased to 3.4 tons per year, while the nitrogen load had dropped to 212 tons per year [6].
The ecological state of the Archipelago Sea has deteriorated over the decades, similar to the rest of the Baltic Sea, but there are significant regional differences between the various archipelago zones [7]. The inner archipelago is predominantly sheltered and strongly influenced by riverine inputs and, in the past, by local wastewater loads. In the joint monitoring program conducted in the sea area off Turku, the development of water quality has been comprehensively monitored annually since the 1960s. Despite this, the long-term effects of reduced wastewater loads on the ecological state of the sea area have been surprisingly little studied in the Archipelago Sea region. The first summaries in Finnish [8,9] were made in the 1990s, when, for example, the phosphorus load from wastewater was still more than four times higher than the current level. In his 2011 review on the development of the state of the Archipelago Sea, Suomela [10] examined the overall effects of wastewater load reduction.
This study examines in more detail how water quality parameters in wastewater-affected areas off Turku, in the eastern Archipelago Sea, have changed over the same period during which wastewater loads have significantly decreased. For this research, various statistics on wastewater loads have been combined, and environmental management information systems, which store all water quality data, have been utilized. The analysis also investigates changes in the abundance of blue-green algae based on phytoplankton samples. Based on this extensive analysis, the aim is to assess whether achieving good ecological status in the inner archipelago of the Archipelago Sea is possible by further reducing the critical nutrient load.
2. Materials and Methods
2.1. Study Areas
The Archipelago Sea is located between the Baltic proper and the Bothnian Bay (Figure 1). Descriptions of its characteristics, nutrient loads, and water quality trends are presented in the previous articles [7,11]. This study has focused on the eastern inner archipelago zone of the Archipelago Sea, whose area has previously been estimated at 679 km² [7], particularly in the coastal area off Turku. In this context, it is important to emphasize that the total phosphorus and nitrogen load brought to the sea by the largest river flowing into the marine area off Turku, the Aura River, has not significantly changed over the period from 1995 to 2025. According to statistics from the Finnish Environment Institute the total phosphorus load of the Aura River has been approximately 56 tons per year, while the total nitrogen load has been around 610 tons per year.
2.2. Waste Water Treatment Plants and Load Data
The Turku central wastewater treatment plant officially began operations in 1968, when wastewater from the western part of Turku was directed to the plant. The treatment method used was biological purification based on the activated sludge process. When the central treatment plant was completed in the late 1960s, wastewater from the eastern part of Turku was still discharged directly into the river mouth. The sewer tunnel under the Aura River was completed in 1972, after which almost all of Turku’s wastewater was treated before being discharged into the sea.
In Raisio and Kaarina, wastewater treatment with their own treatment plants began around the late 1960s. The Turku central, Raisio and Kaarina wastewater treatment plants ceased operations when the current so-called Kakola wastewater treatment plant was commissioned in 2009. In Turku, the wastewater discharge location did not change after centralization (Figure 1).
The Kakola wastewater treatment plant is a biological-chemical activated sludge facility, enhanced with post-filtration of wastewater using sand filters. Phosphorus is precipitated through simultaneous precipitation with ferrous sulfate. The plant’s enhanced total nitrogen removal is based on the denitrification-nitrification process in aeration [6]. Its designed population equivalent is 315,000, but the current influent load corresponds to a population of just under 300,000. In 2023, the wastewater treatment plant’s influent load was 580 kg/day of total phosphorus, equivalent to 211.7 tons per year, and 4,200 kg/day of total nitrogen, amounting to 1,533 tons per year, of which 76.2% was ammonium nitrogen. The treatment plant’s environmental permit requires a removal efficiency of 95% for total phosphorus and 75% for total nitrogen. In 2023, the actual removal rates achieved were 98% for total phosphorus, 87% for total nitrogen, and 99% for ammonium nitrogen [6].
Nutrient load data from wastewater treatment plants for different years were obtained from the environmental administration’s environmental protection information system (Vahti). Load data has been available since 1983. Previous assessments of wastewater load have been based on population data from the city of Turku and its neighboring municipalities, along with the load coefficients provided in Government Decree 157/2017. According to the decree, the untreated domestic wastewater load per person per day is 2.2 grams of total phosphorus and 14 grams of total nitrogen.
2.3. Water Quality and Phytoplankton Data
The water quality of the Archipelago Sea has been monitored for an extended period with standard methods, and the results are available through the open data service of the Finnish Environment Institute (https://www.syke.fi/avoindata accessed on 15 March 2025). The water quality analysis presented here is primarily based on total phosphorus concentrations and on algae production-related chlorophyll-a concentration in the surface water during the ecological classification period (1 July–7 September). In the laboratory-based method, chlorophyll in algae is extracted into ethanol, and the concentration is measured spectrophotometrically. In addition, time series of ammonium nitrogen, nitrate nitrogen and phosphate phosphorus concentrations in surface water during winter (January 1—March 31) have been examined at various observation stations in the coastal area off Turku. Wintertime concentrations of dissolved nutrients can be used as an index for summer conditions when they cannot be directly measured from surface water because during the summer season in the northern Baltic Sea inorganic nutrients are rapidly (within hours) assimilated by organisms [12]. DIN:DIP nutrient ratios were also analyzed using the ecological classification period data from station 220 for data below the production layer (deeper than 20 m). The Redfield ratio (N:P 16, based on molar concentrations) is often used as an indicator of which nutrient puts a limit to the growth: when the ratio is above 16, phosphorus is the limiting factor, and when it is below 16, nitrogen [13].
A total of 34 monitoring stations provided the analyzed data (Figure 1). For comparison, some water quality data from the intensive stations Seili (Figure 1) and Brändö were also analyzed. Brändö is located at the northern boundary of the Archipelago Sea (N6732217-E176832, ETRS-TM35FIN). The first observations of total phosphorus concentrations date back to 1965. Measurements of chlorophyll-a concentrations in surface water began in the 1980s. In this study, the time series of various variables have been analyzed in more detail at stations in Raisio Bay (Turm 260) and near Rauvola Bay in Kaarina (Turm 175) (Figure 1). Wastewater discharge at these locations ended in 2009, and the wastewater was redirected to the Turku Kakola treatment plant. Responses have also been studied at station 190, located off the treatment plant. The extent of the wastewater impact area has been assessed by examining water quality responses at observation stations 210 and 220, which are located in Airisto but still belong to the inner archipelago zone.
Samples have been collected from the intensive stations of the marine area’s joint monitoring during the July and August sampling rounds for phytoplankton species and biomass determination. In this study, I have analyzed data from the Turm 210 station in Northern Airisto and the Seili reference station (Figure 1). Phytoplankton biomasses and cell counts have been determined at the species level from the phytoplankton samples in accordance with the water and marine management method guidelines [14].
The statistical processing of water quality data, such as the calculation of phosphorus-chlorophyll regressions, was done using Excel software.
3. Results
Nutrient Loads
The total phosphorus load from wastewater to the sea in the coastal area off Turku was an average of 24 t/a in the 1980s. After that, between 1991 and 2008, it remained at around 16 t/a. After the Kakola central wastewater treatment plant began operations, the phosphorus load was halved and continued to decrease, now being less than 4 t/a (Figure 2).
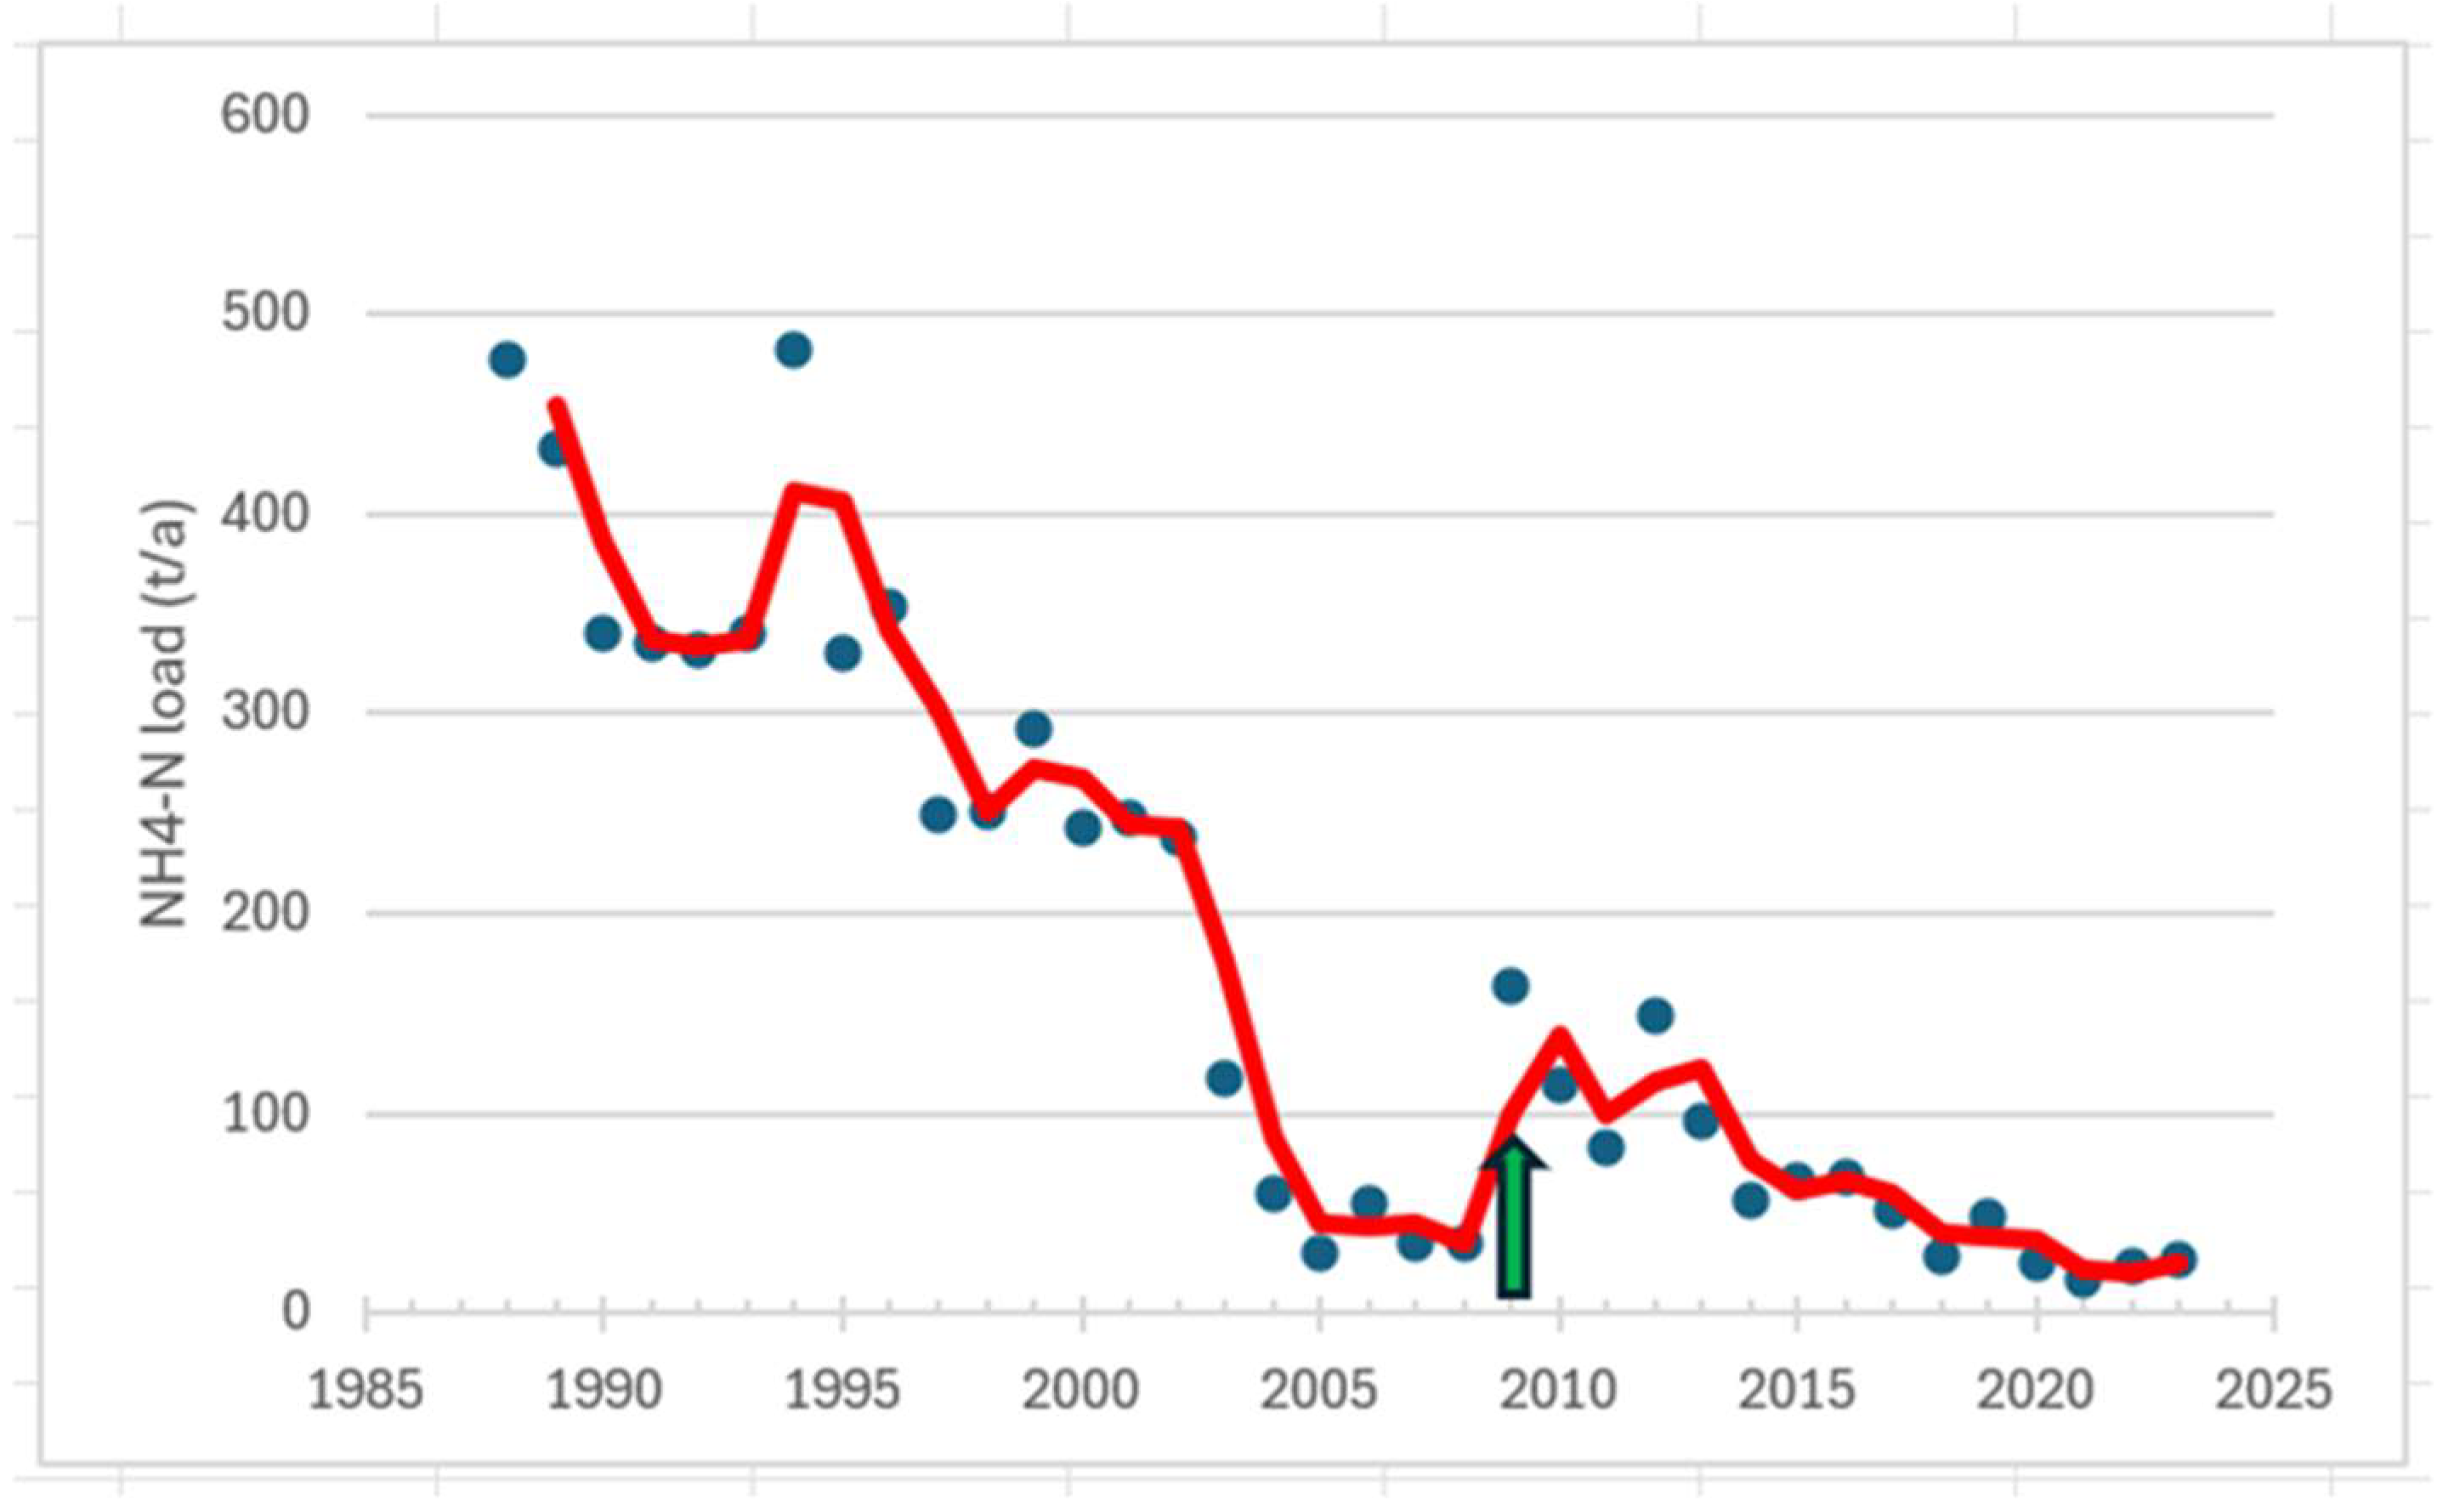
The total nitrogen load has decreased more steadily than the phosphorus load since the 1980s, when it peaked at over 900 t/a. Today, the total nitrogen load from wastewater to the sea is just over 200 t/a. Ammonium nitrogen load has decreased even more significantly than the total nitrogen load. At the turn of the 1980s and 1990s, 60% of the total nitrogen load (around 800 t/a) was in the form of ammonium nitrogen. When the Kakola treatment plant started operating, the share of ammonium nitrogen had decreased to 30%, and in recent years, it has been only around 10%. The ammonium nitrogen load from Turku’s treatment plant had already dropped to 40 t/a between 2005 and 2008 but tripled when the new treatment plant was commissioned in 2009 and began receiving wastewater from Raisio and Kaarina as well (Figure 5). After 2013, the NH4 load started to decrease again and was only 23 t/a in 2021-2023.
Figure 3.
Total nitrogen load (t/a) of waste waters to the sea in the coastal area off Turku.
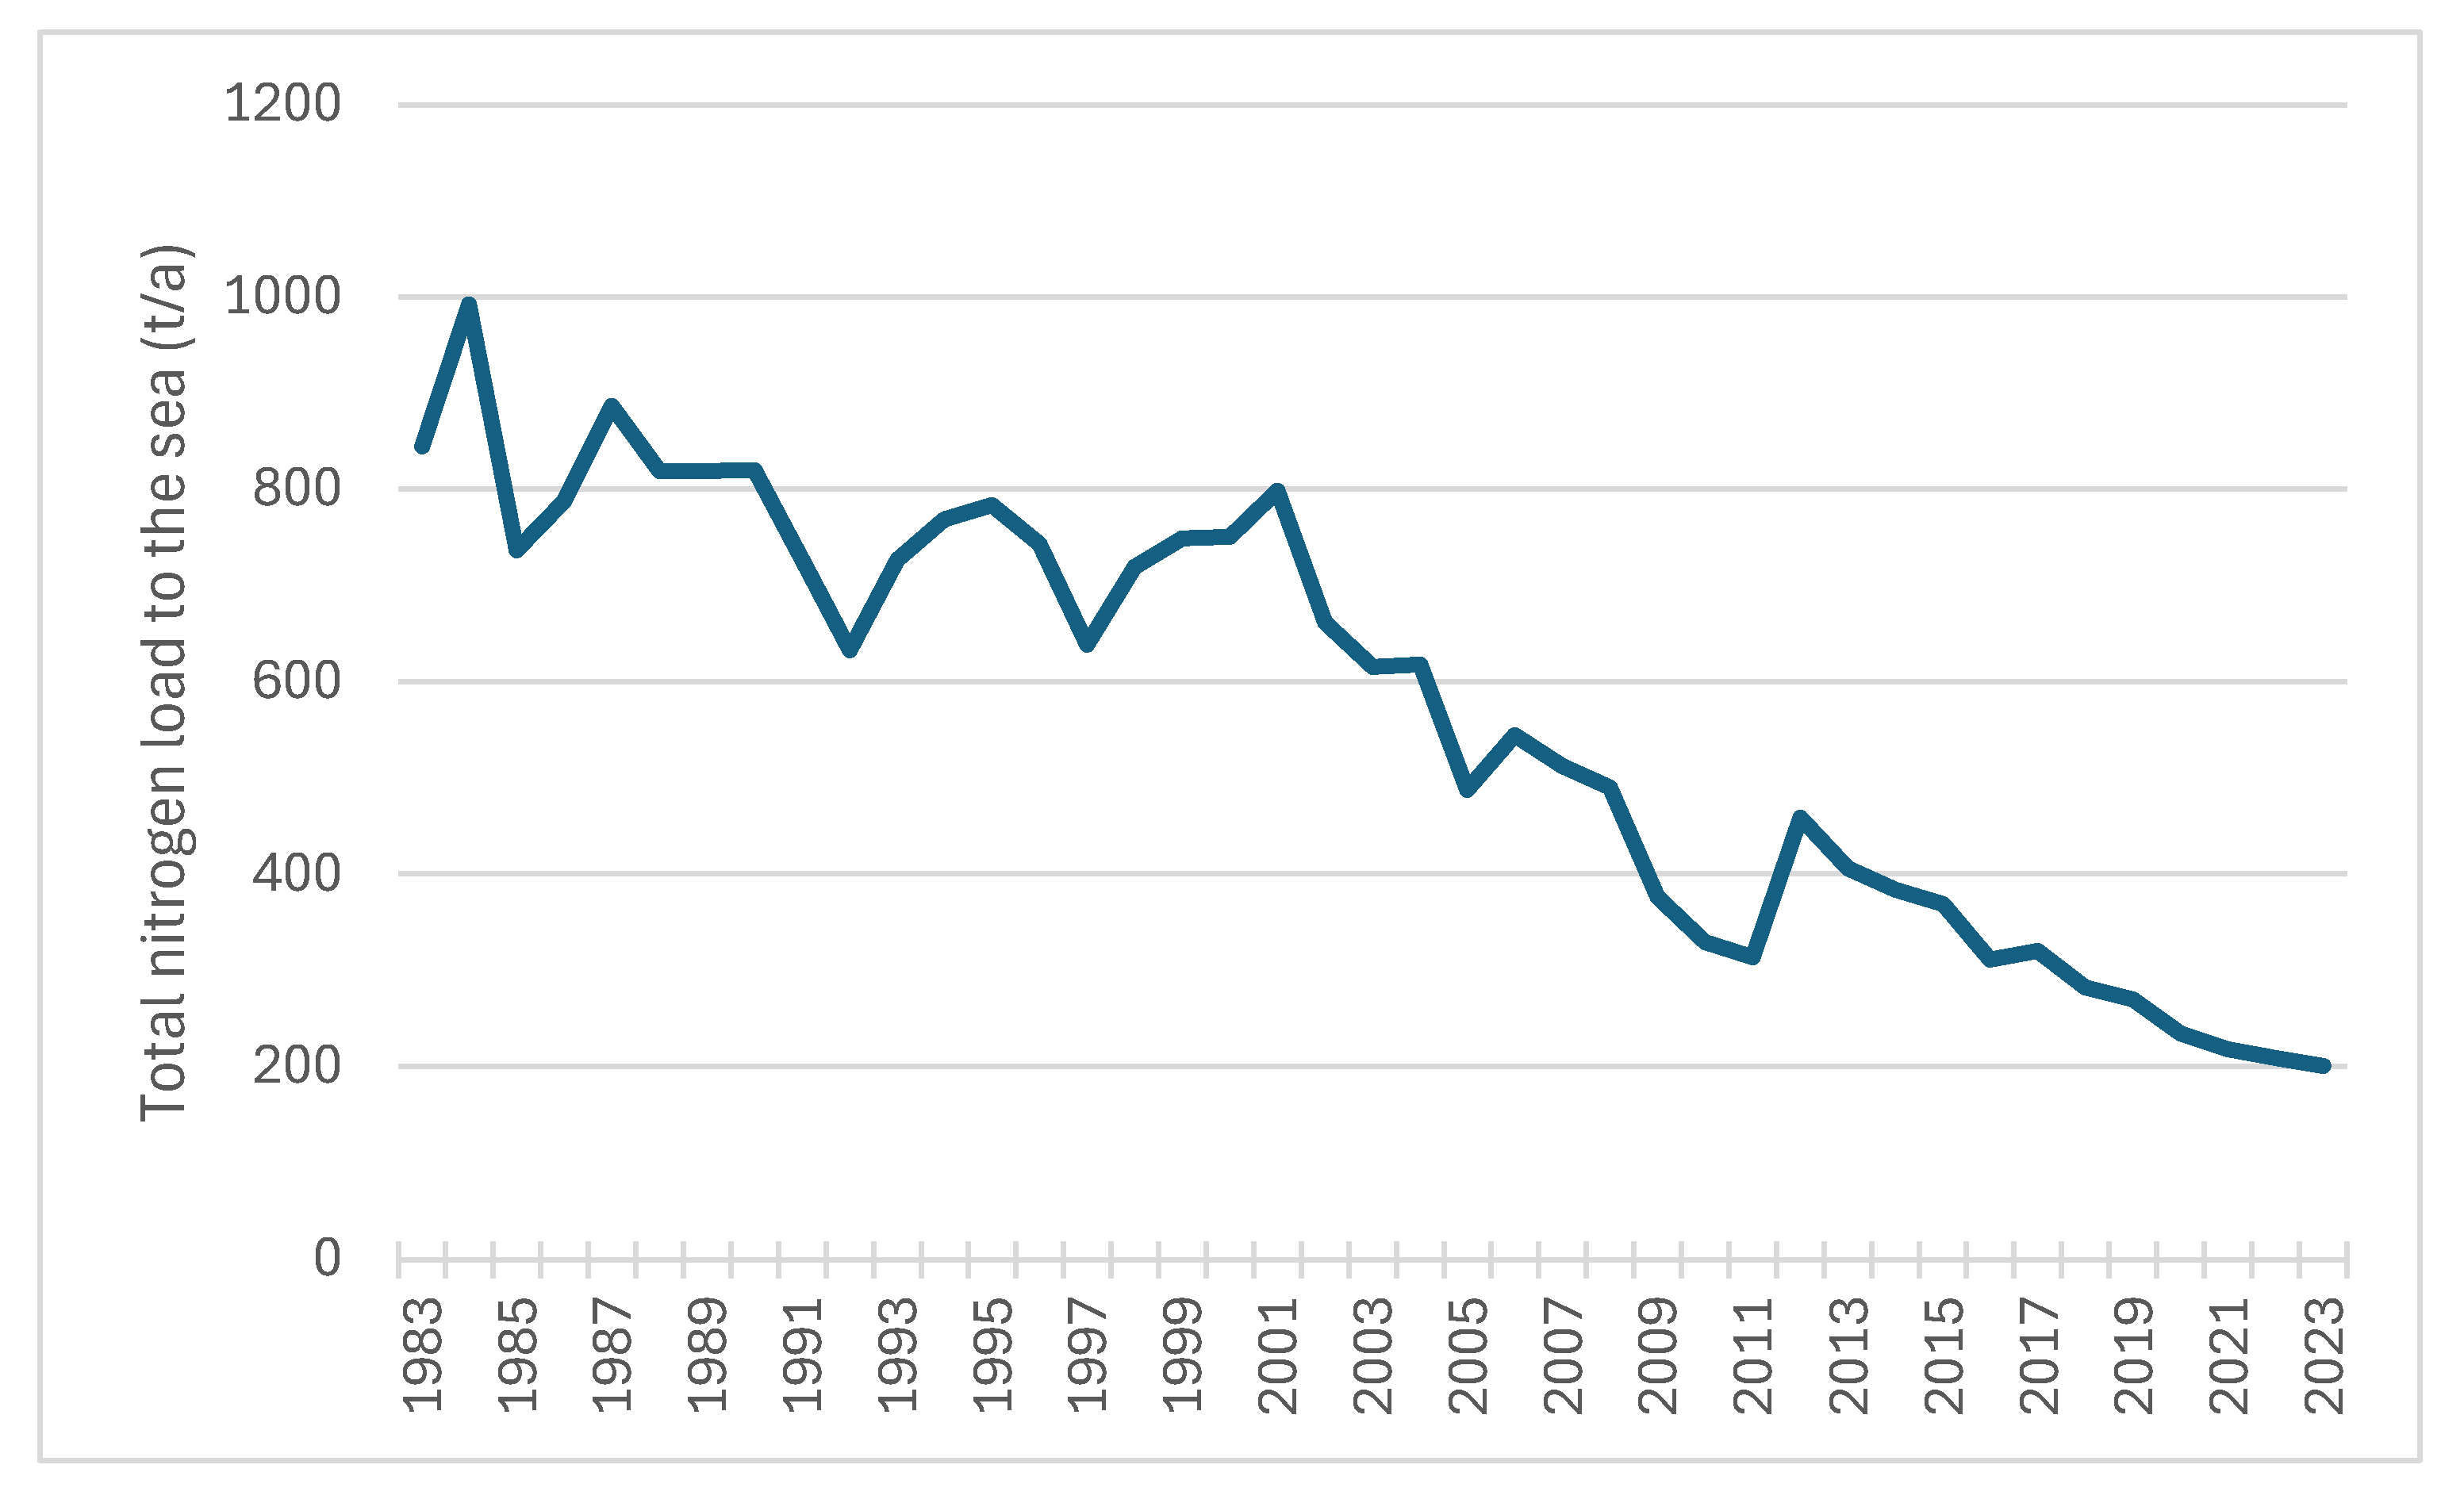
Figure 4.
Ammonium nitrogen (NH4-N) load (t/a) of waste waters to the sea in the coastal area off Turku.
Figure 4.
Ammonium nitrogen (NH4-N) load (t/a) of waste waters to the sea in the coastal area off Turku.
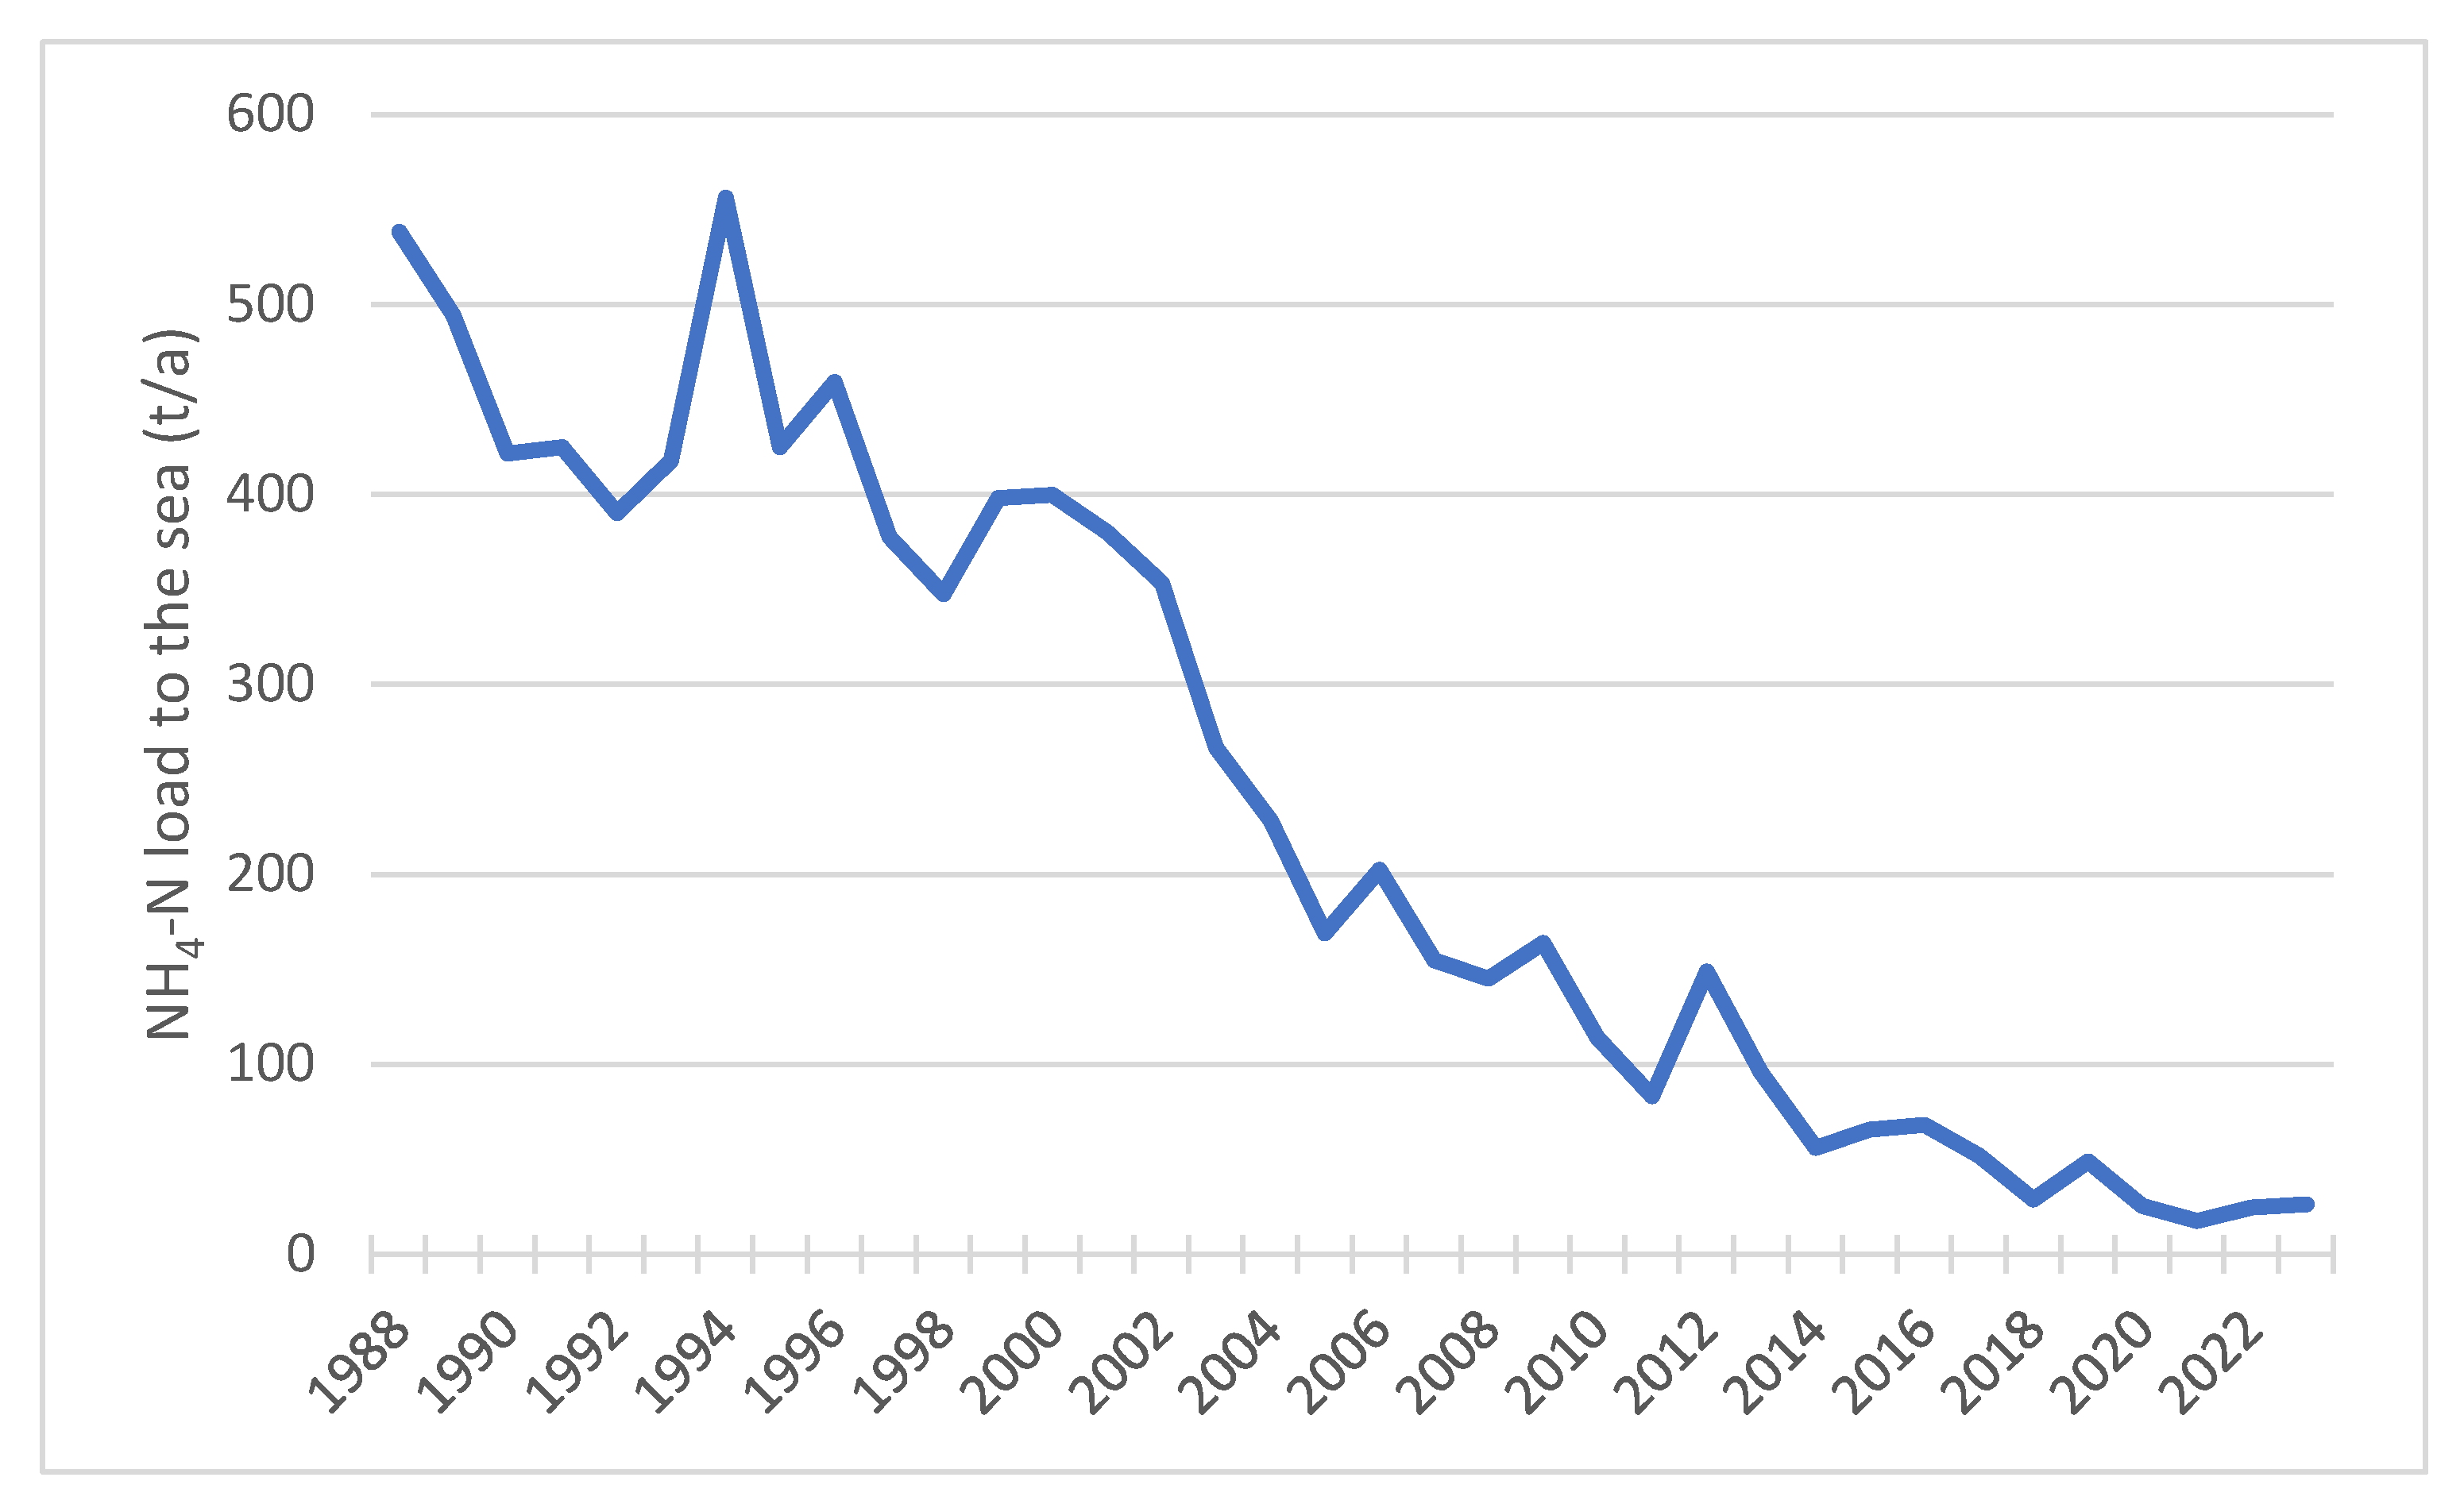
Figure 5.
Ammonium nitrogen (NH4-N) load (t/a) of waste waters to the sea from Turku wastewater discharge site. The green arrow indicates the time when Kaarina’s and Raisio’s wastewater began to be directed to Turku’s Kakola treatment plant (2009).
Figure 5.
Ammonium nitrogen (NH4-N) load (t/a) of waste waters to the sea from Turku wastewater discharge site. The green arrow indicates the time when Kaarina’s and Raisio’s wastewater began to be directed to Turku’s Kakola treatment plant (2009).
Responses in Water Quality
The history of the entire wastewater load is most clearly visible in the water quality of Raisio Bay at the Turm 260 station (Figure 6). The phosphorus concentrations in the early 1970s indicate a level (300-400 µg/l) that was present before wastewater treatment began. In the 1980s, when the treatment plant’s operations began to stabilize, the concentrations decreased to 110 µg/l, and in the 1990s, to 70 µg/l. In the early 2000s, the treatment efficiency declined, and the phosphorus concentrations in Raisio Bay averaged 92 µg/l before the load completely ended in 2009. The average phosphorus concentration of 62 µg/l from 2010 to 2024 still indicates the lowest, or bad, quality level in ecological classification.
The decrease in total nitrogen content is also reflected in changes in its ecological classification (Figure 7). In the early 1970s, nitrogen concentrations were at 1200 µg/l, from which they decreased by one-third in the 1980s. At this level (800 µg/l), the concentrations remained on average until 2009, when wastewater loading ceased. The threshold for poor status (575 µg/l) was crossed in 2010. The lowest nitrogen concentrations were recorded in 2017–2018, averaging 329 µg/l, which was already close to the upper limit for good status (325 µg/l). From 2019 to 2024, the average was 447 µg/l, which corresponds to a poor status.
The wintertime decrease in soluble nitrogen concentrations (NH4 and NO23) in Raisio Bay corresponds to the development of wastewater loading (Figure 8). Between 1990 and 1998, NH4-N concentrations had already decreased to a level of 200 µg/l from the previous peak values (for example 1984: 1785 µg/l). Then, they increased again by approximately four times during the period from 1999 to 2006. After the cessation of wastewater loading, NH4 concentrations decreased rapidly and were on average only 18 µg/l during the years 2021-2024. The cessation of wastewater loading did not seem to affect NO23-N nitrate concentrations anymore, and they remained at a level of 280 µg/l.
The chlorophyll-a concentration, which represents algal production, appears to decrease in Raisio Bay in the same proportion as the summer total nitrogen concentrations and wintertime NH4-N concentrations (Figure 9). The decrease in phosphorus concentration has also influenced the development. Between 2000 and 2009, the chlorophyll concentration was 38.5 µg/l, which is classified as bad. After the cessation of wastewater loading, the concentration decreased by 68% and has averaged 12.3 µg/l, which is classified as poor. The poor status lower threshold (moderate/poor) is 7.0 µg/l.
In Kaarina’s Rauvola Bay (nearest monitoring station Turm 175), where wastewater loading also ended in 2009, the total phosphorus concentration has decreased over time and has averaged 56.5 µg/l during the years 2010-2024, still classified as bad (Figure 10). The chlorophyll concentration has been 26.7 µg/l between 2001 and 2007, classified as bad (Figure 11). After the cessation of wastewater discharge, it halved and temporarily dropped to the poor category. After that, the concentrations became more variable, and between 2011 and 2024, the average has been 17.1 µg/l, right on the borderline between poor and bad (17 µg/l).
At monitoring station Turm 190, near the wastewater discharge site of Turku’s central treatment plant and Kakola treatment plant, wintertime ammonium nitrogen concentrations have varied according to the load (Figure 12; see also Figure 5). The chlorophyll-a concentration at station 190 was on average 21.2 µg/l between 1983 and 1999, classified as bad. After that, it began to decrease, reaching its lowest level in 2007-2008, with an average of 8.2 µg/l, classified as poor but close to the upper limit of moderate (7 µg/l). When the Kakola treatment plant began operations, the chlorophyll concentration increased again and was 17.3 µg/l between 2011 and 2020, slightly above the bad threshold (17 µg/l). In 2021-2023, the concentrations had slightly decreased to 16.5 µg/l, placing them in the poor category.
In the northern part of Airisto, at observation station Turm 210, the impact of wastewater on total phosphorus concentration was evident in the 1970s. At that time, the average phosphorus concentration in surface water was 33 µg/l, classified as poor. As wastewater treatment improved, the phosphorus concentration stabilized at 25 µg/l in the 1980s, falling into the moderate category. Phosphorus concentrations then began to rise from the early 1980s until the early 2000s, so that during the years 1999–2007, the average (32.5 µg/l) indicated a return to the poor category. This increase was not related to wastewater discharge but was instead driven by the overall development of the Archipelago Sea. Since 2010, the situation has improved and based on the average phosphorus concentration of 29 µg/l, the classification is moderate (with the upper limit for moderate being 32 µg/l).
NH4-N concentrations in winter (Figure 15) followed a similar trend and variation as observed at station Turm 190, near Turku’s wastewater discharge site (Figure 12). The difference lies in the concentration levels, which indicate dilution. While the NH₄ concentrations at station Turm 190 averaged 340 µg/l around the turn of the 2000s, the corresponding value at station 210 was 97 µg/l. And while the NH₄ concentration at station 190 was 45 µg/l during the years 2021–2024, the corresponding value at station 210 was 15 µg/l.
Chlorophyll-a concentration was at its lowest in the early 1990s and again during the years 2008–2011, averaging 6.2 µg/l, which falls into the moderate category (Figure 16). The highest concentration was observed during the years 1998–2007, with an average of 10.2 µg/l (classified as poor). From 2012 to 2024, the chlorophyll concentration has remained in the poor category, with an average of 9.3 µg/l.
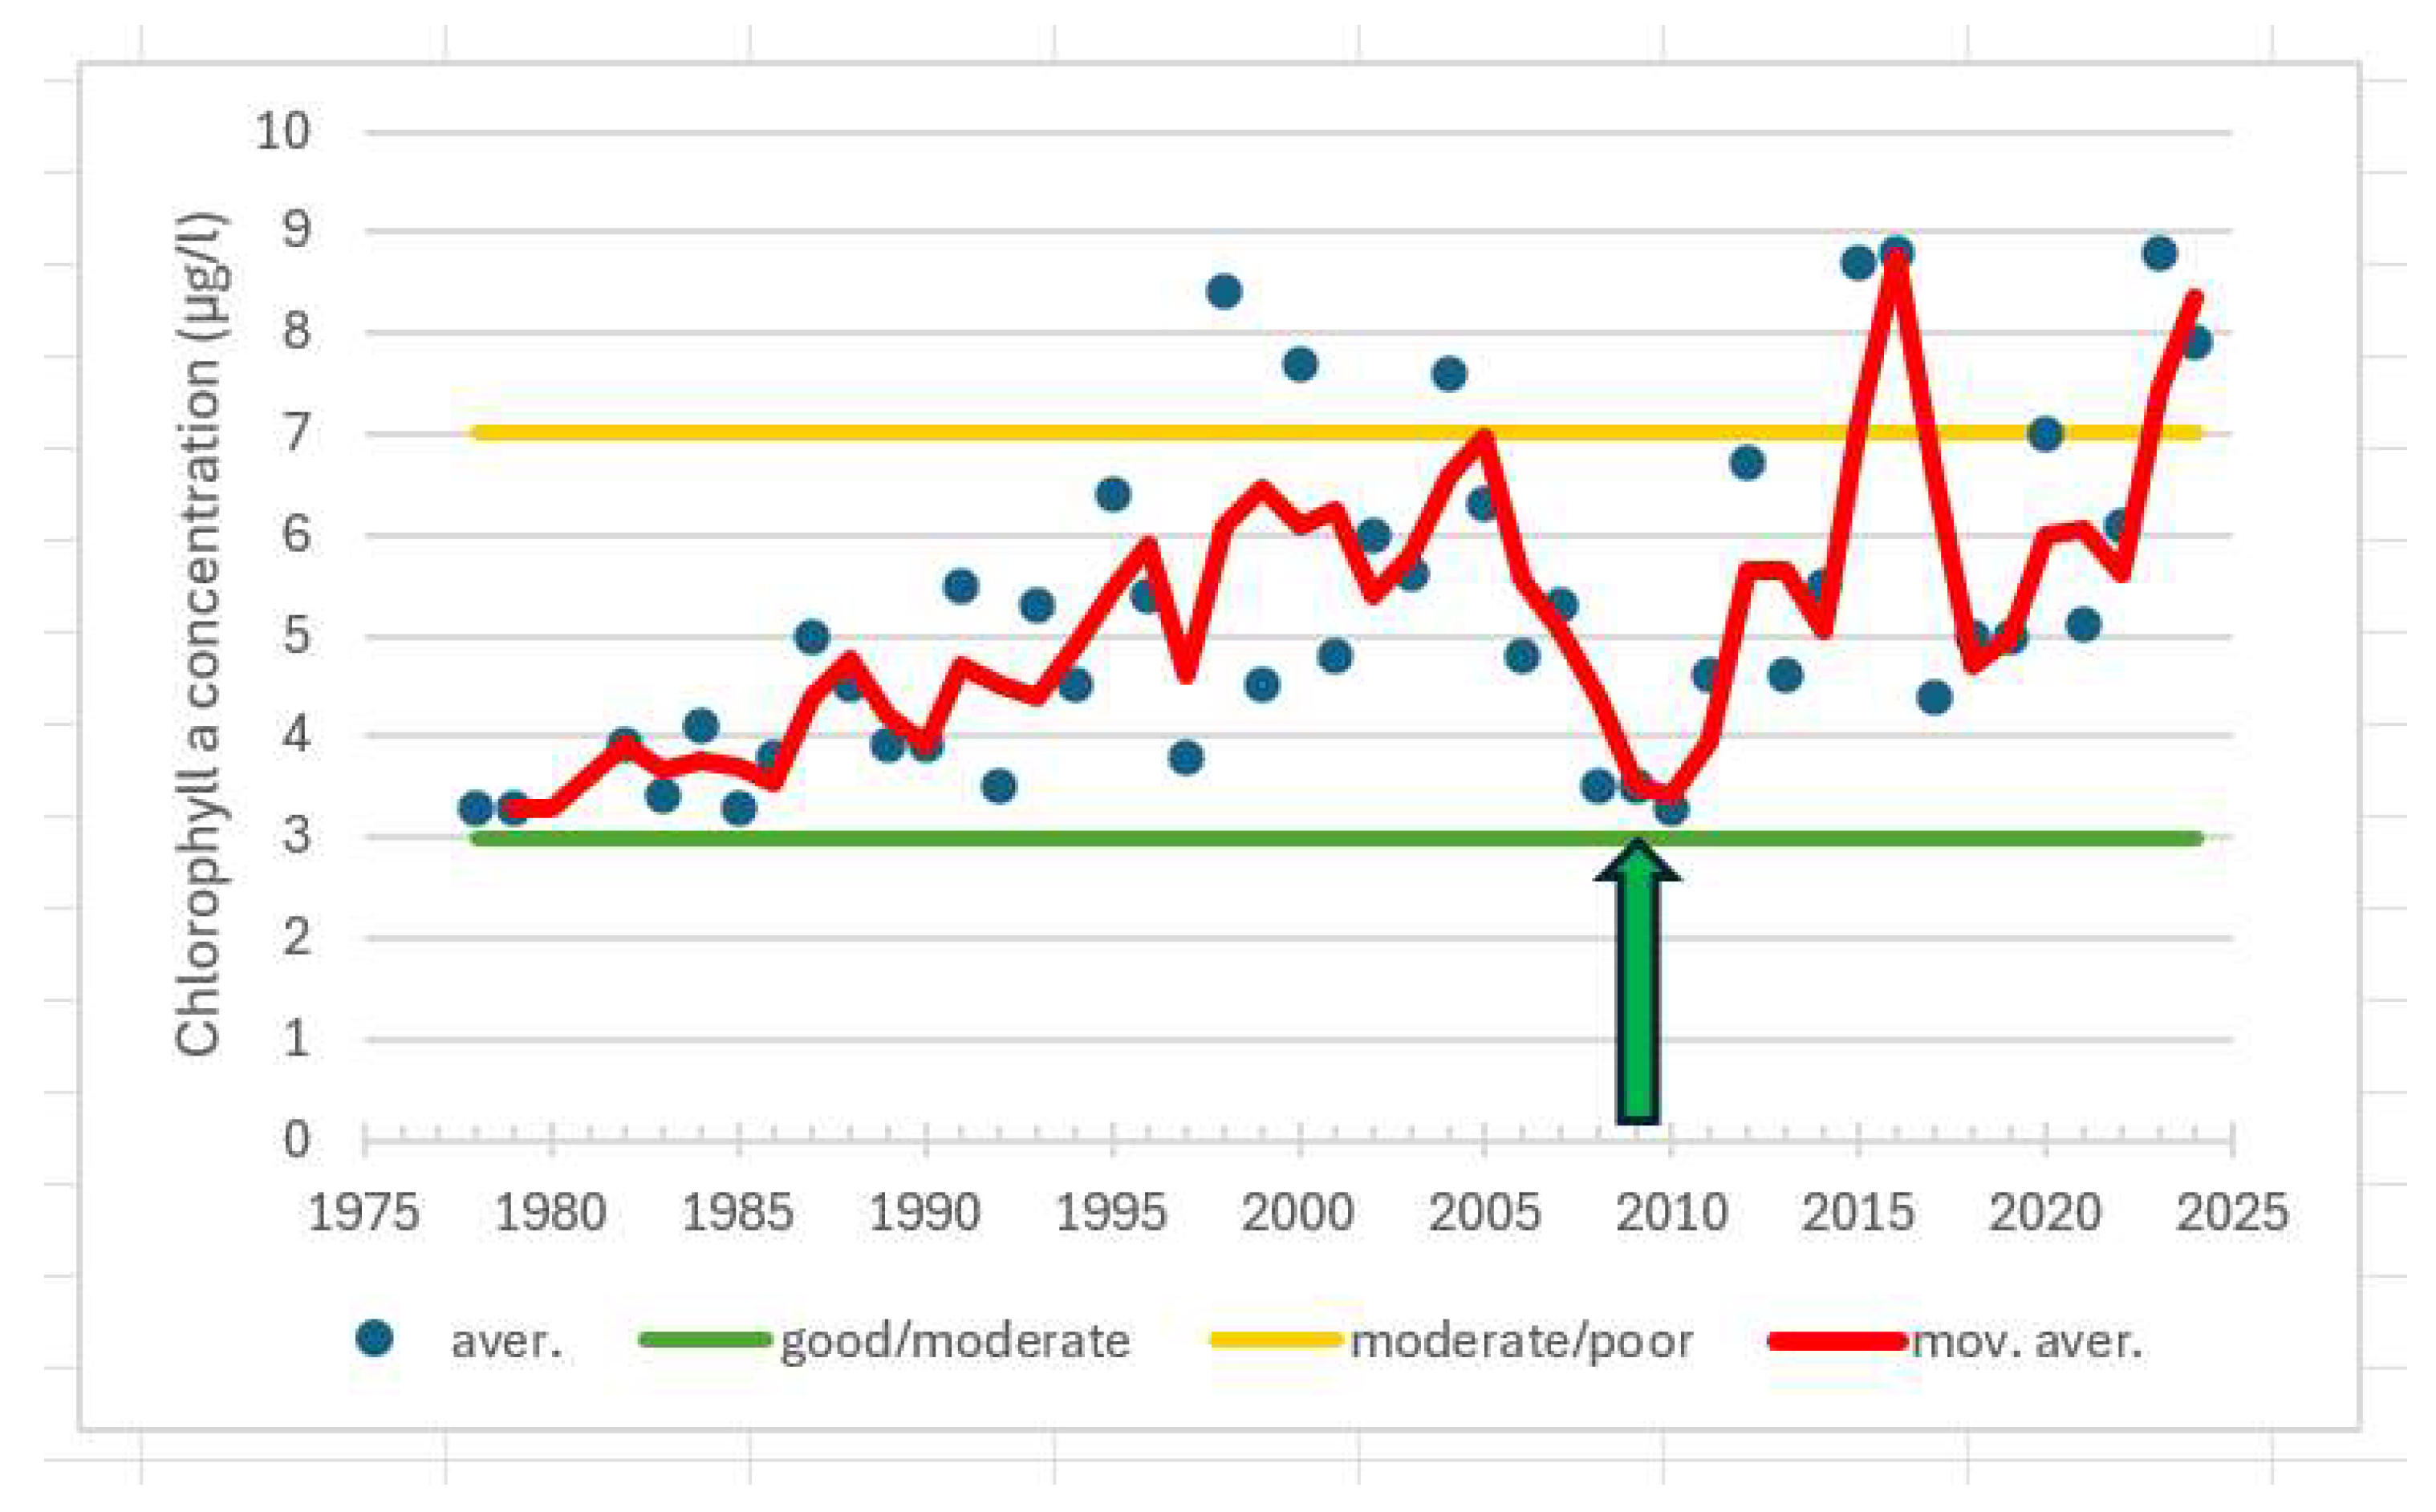
At observation station 220, located about 3 km south of station 210 in Airisto, chlorophyll-a concentrations have been lower than those at the more inner station, even though the variation has been similar to that at station 210 (Figure 17). For example, the 2000s minimum occurred during the same years, 2008–2011. At station 220, the average was 3.7 µg/l, which was 40% lower than at station 210. From 2012 to 2024, chlorophyll concentrations averaged 6.4 µg/l, falling into the moderate category. The difference compared to station 210 was about 30 %.
Figure 14.
Total phosphorus concentrations (µg/l) of surface water in monitoring station Turm 210 during the ecological classification period (1 July–7 September) from 1965 to 2024. The good status upper threshold (good/moderate) is 23 µg/l, the moderate status upper threshold (moderate/poor) 32 µg/L and the poor status upper threshold upper (poor/bad) 52 µg/L. The red line indicates the moving average in the total phosphorus concentration over the entire period under review. The green arrow indicates the time when Turku’s Kakola wastewater treatment plant began operations in 2009.
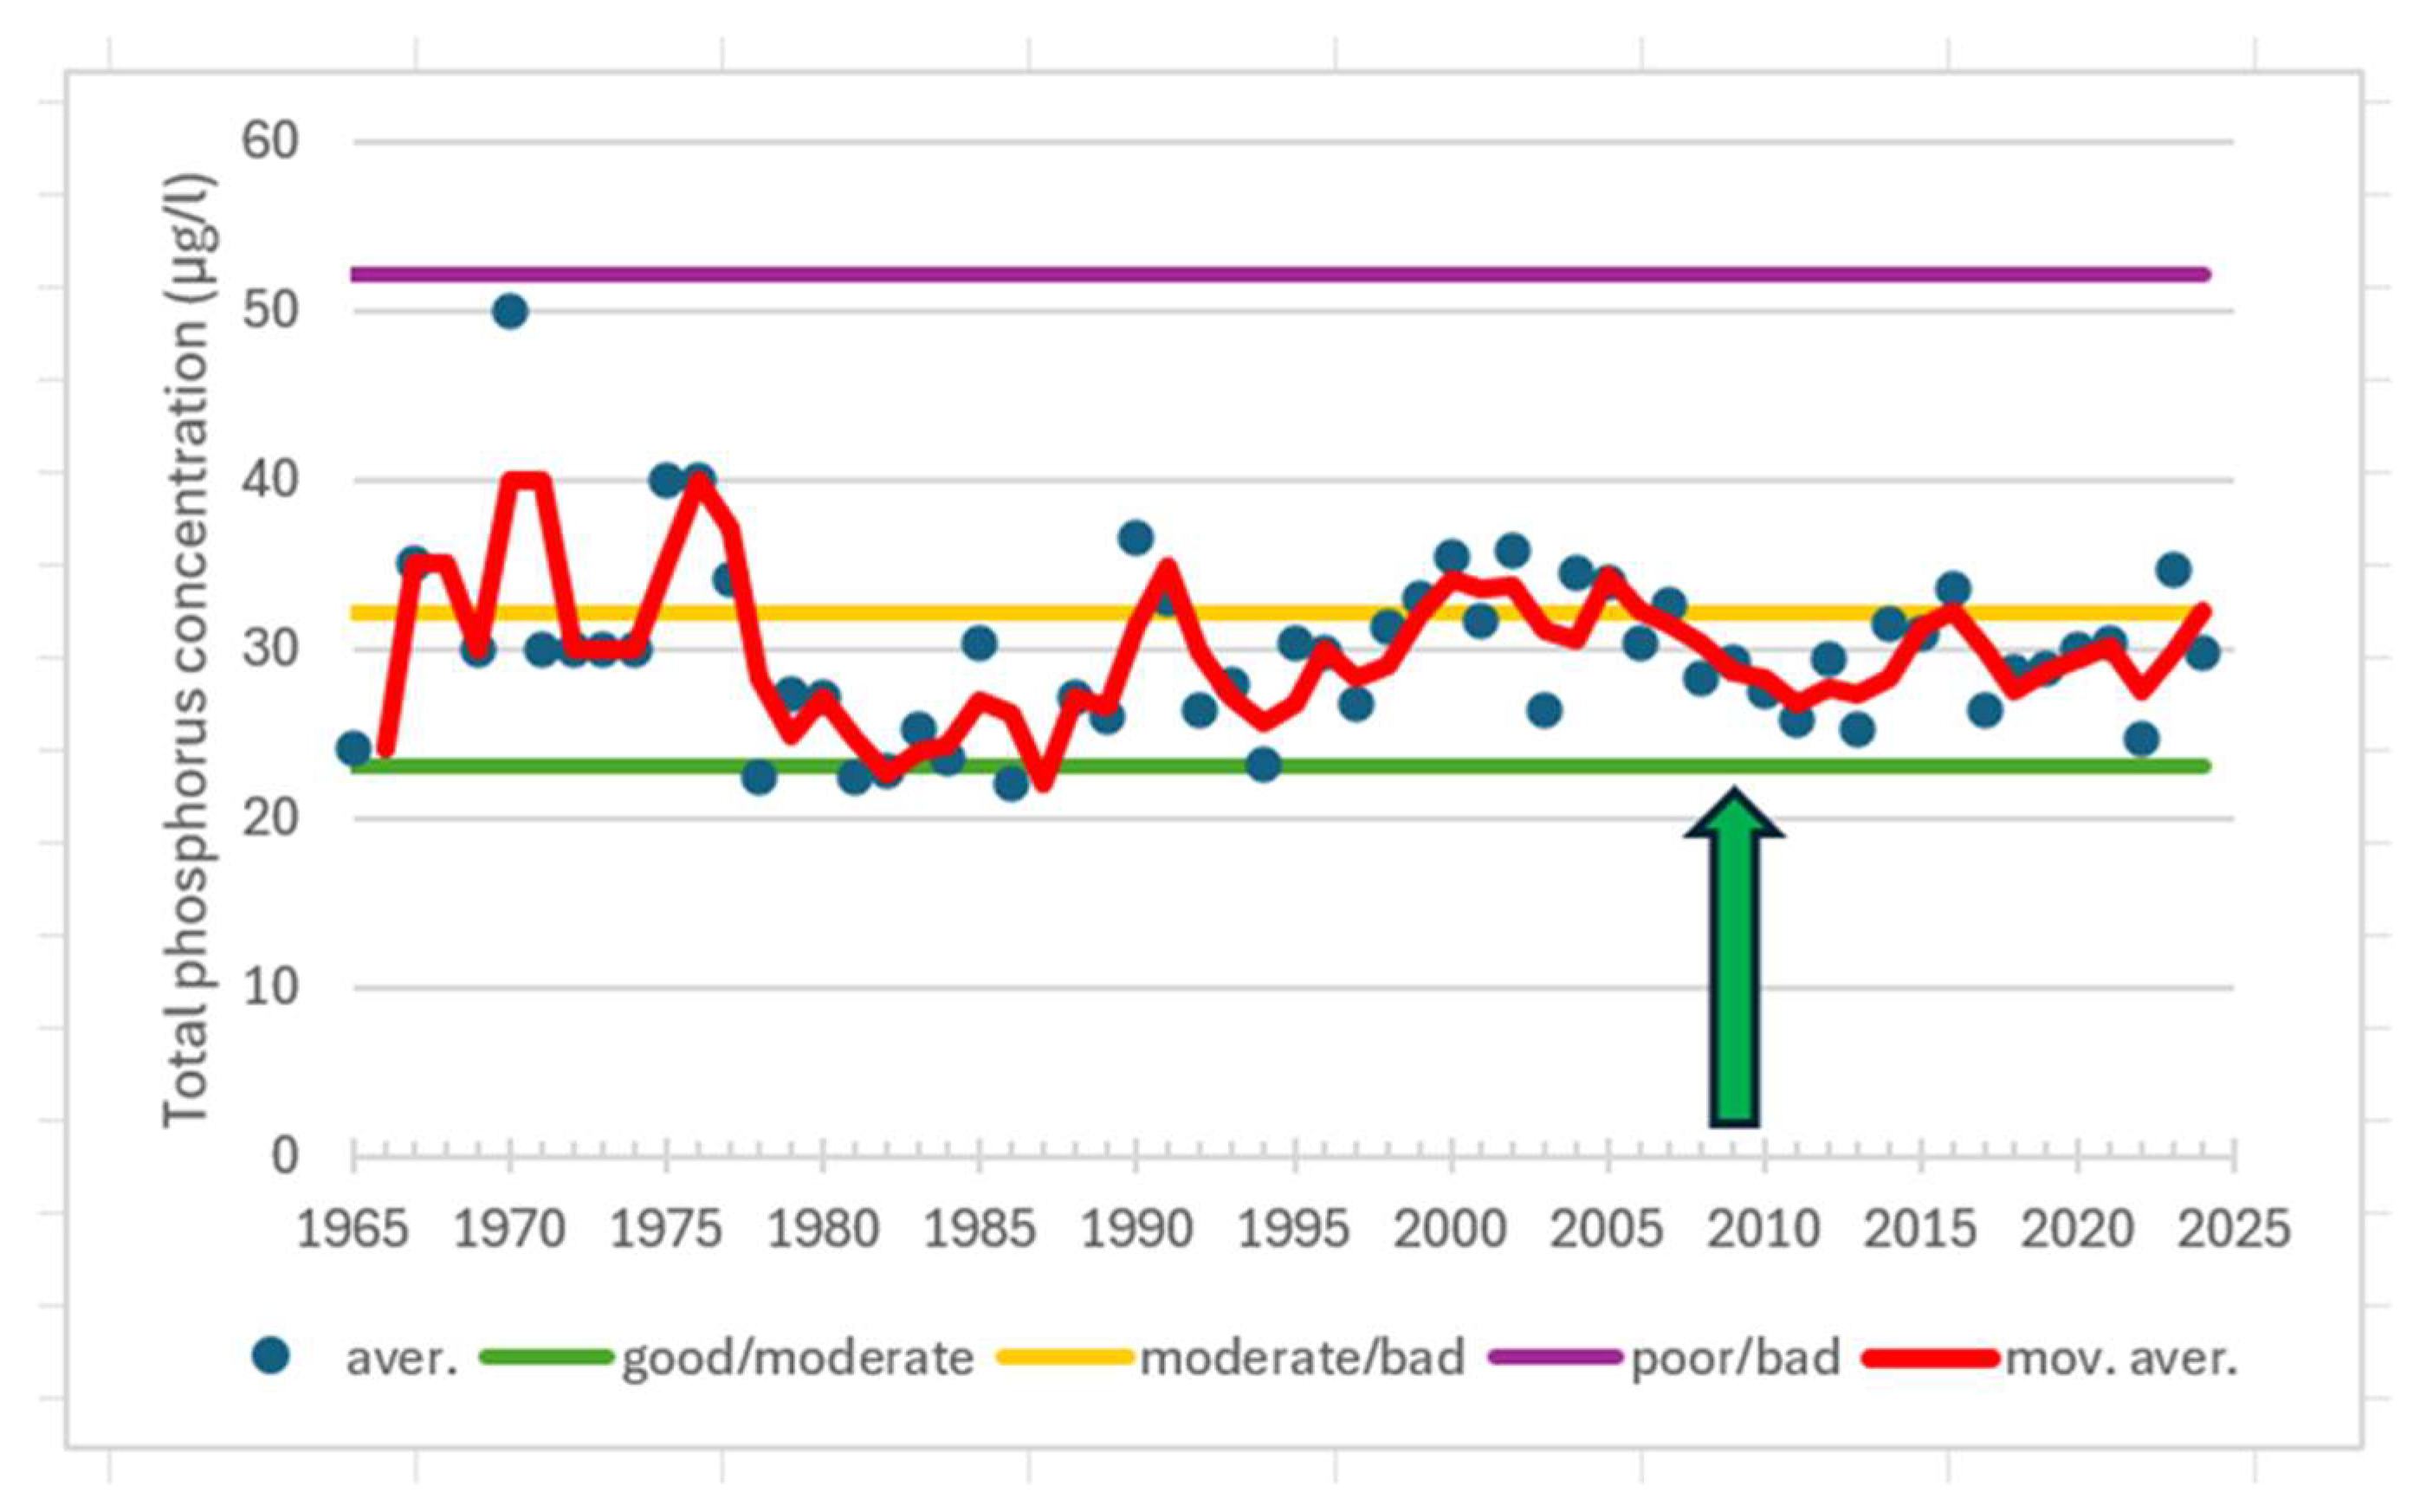
Figure 15.
Ammonium nitrogen (NH4-N) concentrations (µg/l) of surface water in monitoring station Turm 210 during the wintertime (1 January–31 March) from 1995 to 2024. The green arrow indicates the time when Kaarina’s and Raisio’s wastewater began to be directed to Turku’s Kakola treatment plant (2009).
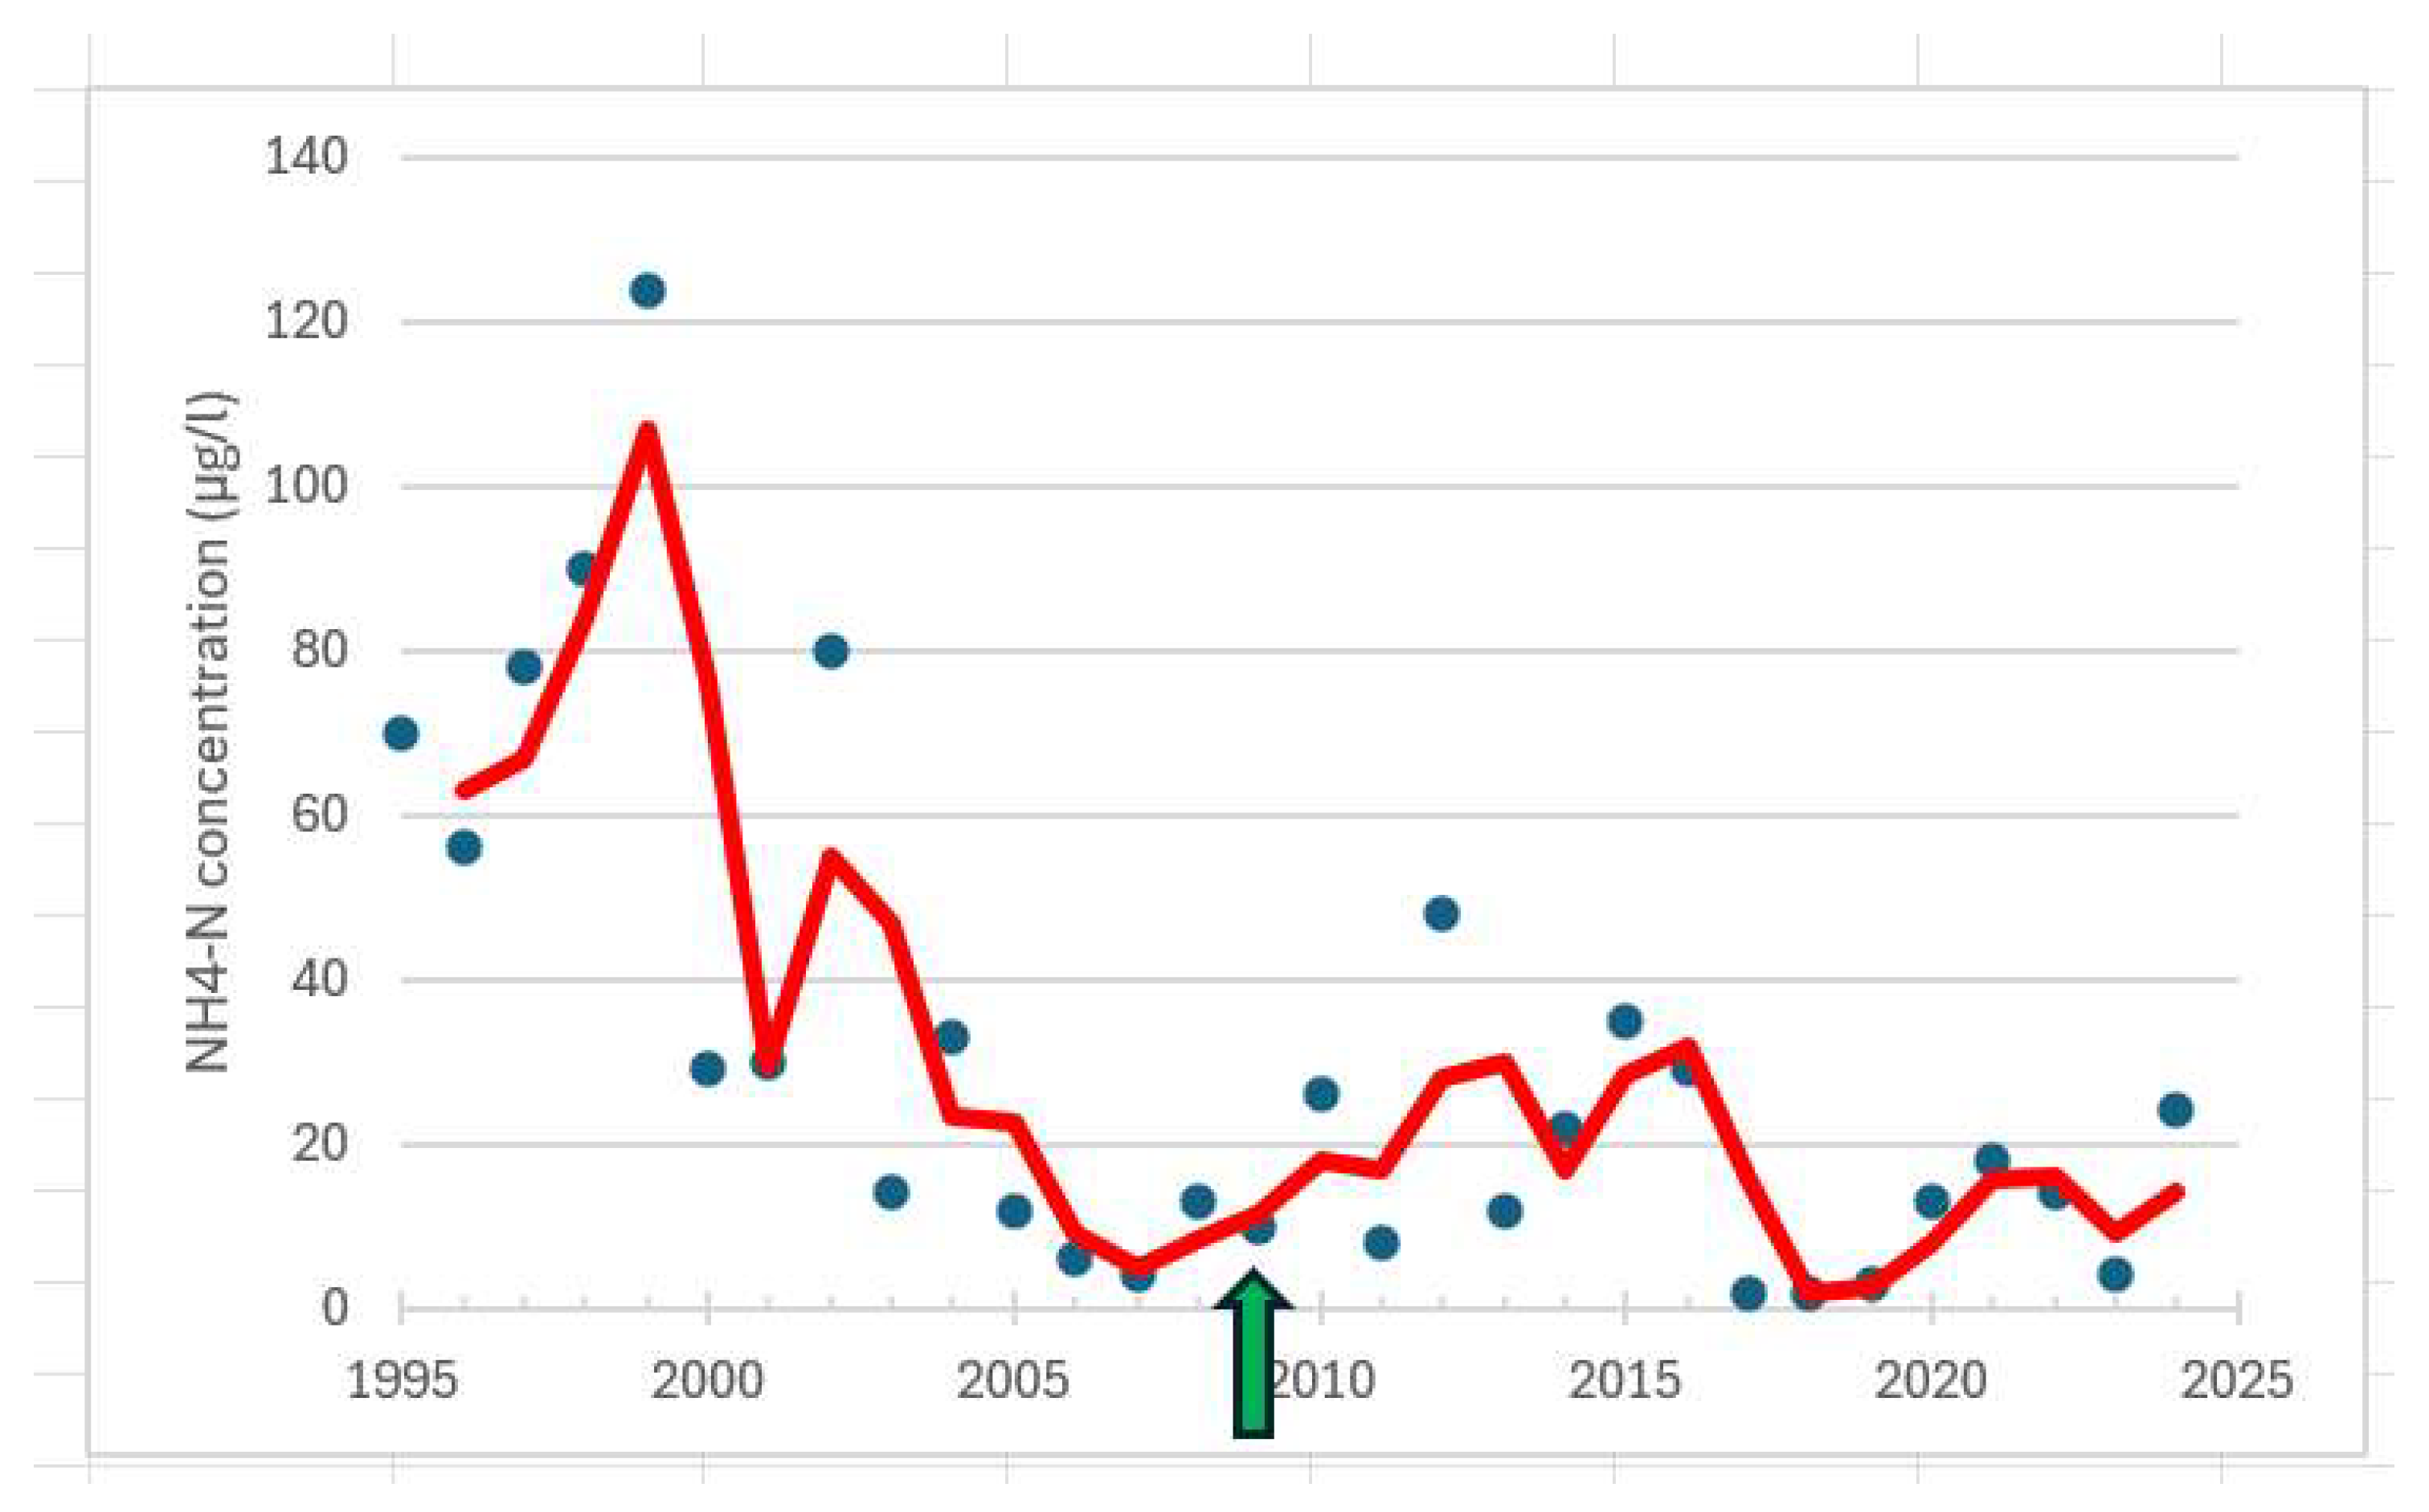
Figure 16.
The concentration of chlorophyll-a (µg/l) of surface water in monitoring station Turm 210 during the ecological classification period (1 July–7 September) from 1992 to 2024. The good status upper threshold (good/moderate) is 3 µg/l, the moderate status upper threshold (moderate/poor) 7 µg/L and the poor status upper threshold upper (poor/bad) 17 µg/L. The red line indicates the moving average in the total phosphorus concentration over the entire period under review. The green arrow indicates the time when Turku’s Kakola wastewater treatment plant began operations in 2009.
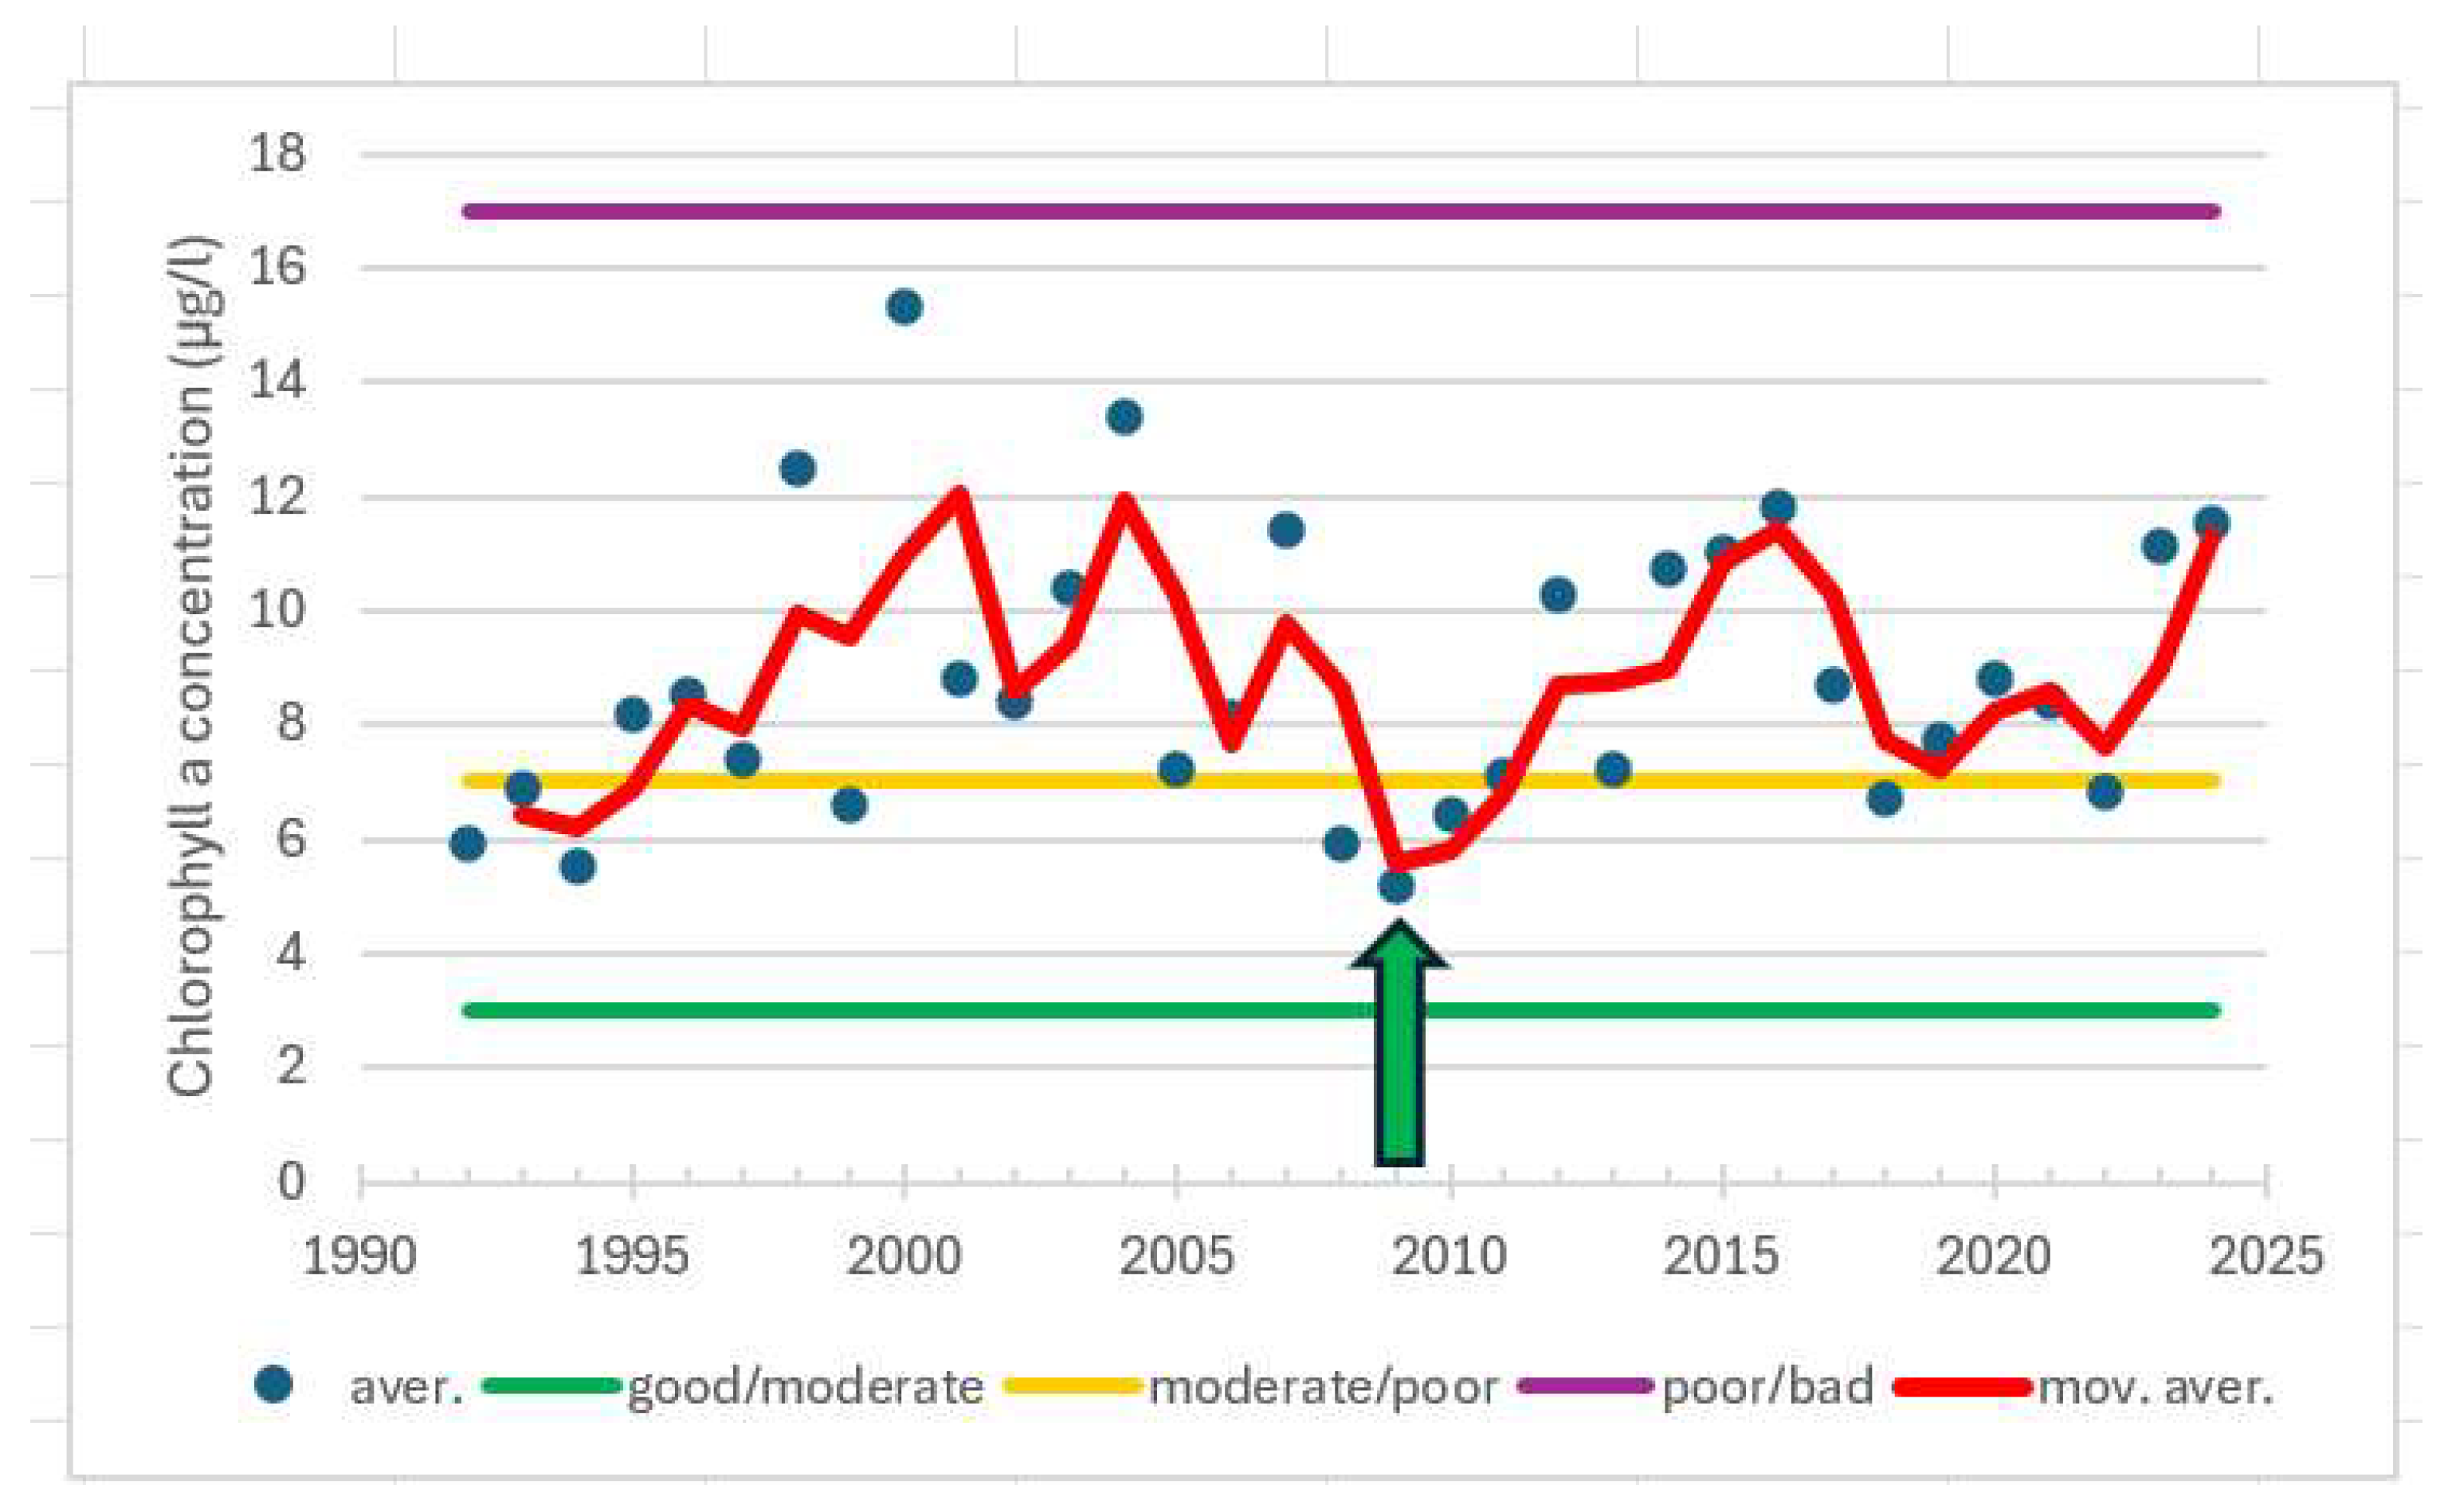
Figure 17.
The concentration of chlorophyll-a (µg/l) of surface water in monitoring station Turm 220 during the ecological classification period (1 July–7 September) from 1978 to 2024. The good status upper threshold (good/moderate) is 3 µg/l, the moderate status upper threshold (moderate/poor) 7 µg/l. The red line indicates the moving average in the total phosphorus concentration over the entire period under review. The green arrow indicates the time when Turku’s Kakola wastewater treatment plant began operations in 2009.
Nutrient Ratios and Cyanobacteria
At the Raisio Bay station 260, the wintertime nutrient ratio DIN:DIP indicates clear phosphorus limitation throughout the entire measurement period from 1997 to 2024, even though the ratio dropped to less than half by 2007, a couple of years before the complete cessation of wastewater discharge. The DIN:DIP ratio averaged 34 during the years 2007–2021 and 21 during 2022–2024, exceedingly still the phosphorus limitation threshold, above 16 (Figure 18).
In Northern Airisto, at stations 210 and 220, the wintertime (January 1–March 31) DIN:DIP ratio decreased from the 1990s until the early 2010s, dropping from a level of 45 to near the Redfield ratio of 16 (Figure 19). For a few years, the ratio fell below 16, but not significantly. After 2011, the ratio has increased, averaging 26 at station 210 and 17 at station 220 during the years 2021–2024. Ratios mainly indicate phosphorus limitation, but occasionally also combined N + P limitation, for example in years 2009-2011. The changes observed in the DIN:DIP ratios can be explained by the different trends in the concentrations of dissolved nitrogen and dissolved phosphorus (Figure 20). From 1995 to 2010, DIN concentrations decreased by about 30%, while DIP concentrations increased by the same amount. The decrease in dissolved nitrogen is partly related to the reduction in nitrogen load from wastewater, while the increase in dissolved phosphorus is linked to other factors. Since 2011, both concentrations have shown considerable variability between years, which is also reflected in their ratios.
In the summer, during the ecological classification period (July 1–September 7), a clearer change in the DIN:DIP ratio below the production layer (deeper than 20 m) has occurred since 2008 compared to wintertime ratios (Figure 21). In the 1990s, the DIN:DIP ratio averaged 15.5, and during the years 2000–2007, it was only slightly lower at 14.8. However, since 2008, it has halved to an average of 7.4, which is clearly below the Redfield ratio of 16.
At the comparison stations in the outer archipelago, Seili and the northern boundary of the Archipelago Sea in Brändö, the DIN:DIP ratios in wintertime have indicated mainly either combined N+P limitation or purely nitrogen limitation (Figure 22). At Seili ratios. At the Seili station in the 1990s, the DIN:DIP ratio was still 19, indicating phosphorus limitation. From 2001 to 2024, the DIN:DIP ratio at the Seili station has averaged 14.5, while at Brändö, it has averaged 9.5.
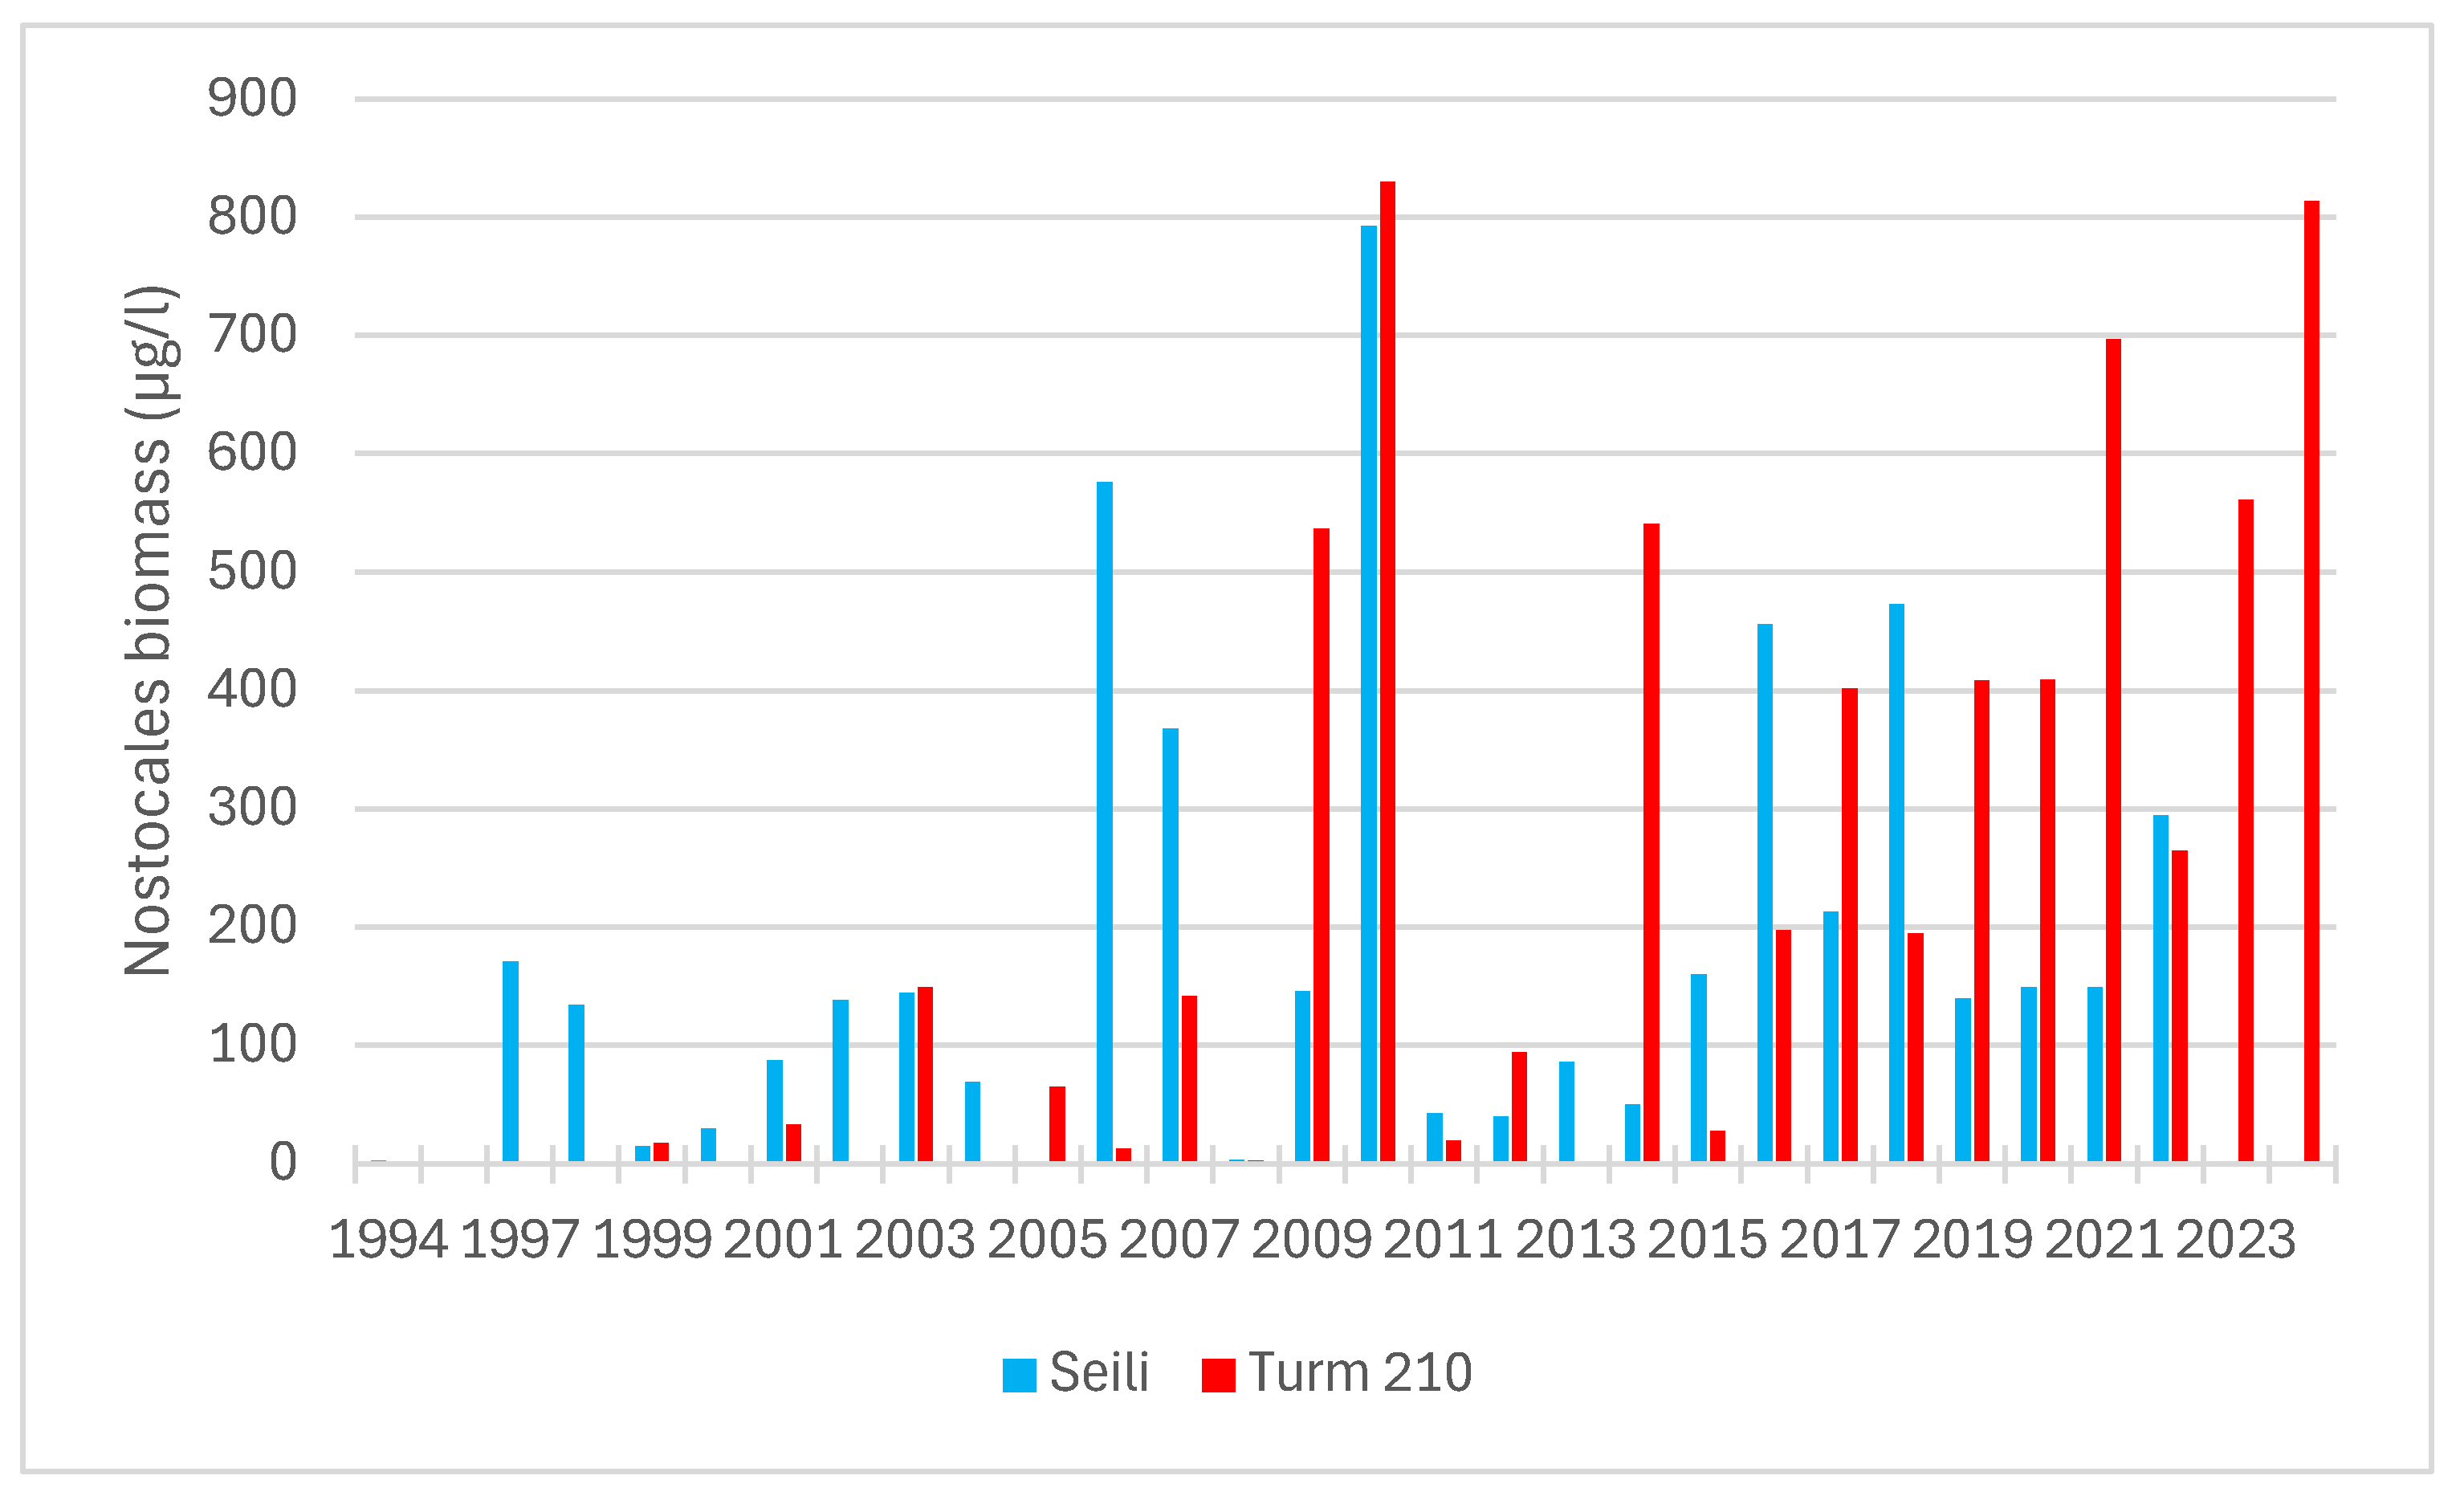
In Northern Airisto, at stations 210 and 220, the biomass of cyanobacteria has increased throughout the 2000s (Figure 22). Most of them belong to the order Nostocales, with the dominant species being Aphanizomenon sp., and they can utilize atmospheric nitrogen for growth. At the Seili station in South Airisto, nitrogen-fixing cyanobacteria from the order Nostocales began to appear in samples in the late 1990s, coinciding with the DIN:DIP ratio dropping below 16 (Figure 23).
In Northern Airisto, at station 210, the first abundant observations of Nostocales were made in 2009 and 2010, coinciding with the DIN:DIP ratio being close to the Redfield value of 16, here too. Since 2011, the biomass of the Nostocales order in Northern Airisto has been significantly higher than in the southern parts (Figure 23). From 1999 to 2008, the average Nostocales biomass at Seili was 159 µg/l, while at station 210, it was 60 µg/l (a difference of -62%). From 2011 to 2022, the biomass at Seili was 188 µg/l, while at station 210, it increased to 296 µg/l (a difference of +57%).
Summary: Analysis of 34 Monitoring Stations Data
During the years 2021–2024, the average total phosphorus concentration measured in surface water within the impact area of Turku’s wastewater during the ecological classification period (July 1–September 7) was 42.1 µg/l. This concentration falls within the poor classification, which ranges from 32 µg/l to 52 µg/l. In the 1970s, the corresponding total phosphorus concentration averaged 79.3 µg/l, which fell into the bad classification. In the 1980s, it decreased to 50.9 µg/l, placing it in the poor classification. The chlorophyll-a concentration in the 1980s was approximately the same as in recent years, at 11.7 µg/l. The chlorophyll-a concentration peaked at an average of 15 µg/l during the years 1991–2009, when the phosphorus concentration was 48.3 µg/l.
The total phosphorus concentration (µg/l) explains 66.4% of the observed variation in chlorophyll-a concentration in a statistically significant regression model (p < 0.001) based on the entire dataset (number of observations = 1,179; Figure 25). 95% confidence interval for the regression coefficient 0.314 is 0.301-0.327.
4. Discussion
The total phosphorus load in the marine area off Turku was at its highest before the introduction of wastewater treatment in the late 1960s. At that time, the phosphorus load from wastewater into the sea was estimated at 120 t/a, while the phosphorus load from the Aura River was slightly lower than today, at 40 t/a [10], totaling 160 t/a. The peak nitrogen load, on the other hand, occurred in the early 1980s, when Turku’s population had risen to 160,000 and nitrogen removal at treatment plants was inefficient. At that time, the nitrogen load from wastewater into the sea was approximately 1,000 t/a, while the nitrogen load from the Aura River was at a level similar to today, around 600 t/a, totaling 1,600 t/a. In recent years, the total phosphorus load to the sea off Turku has been 60 t/a, and the total nitrogen load has been 820 t/a. The phosphorus load has decreased by 62.5%, and the nitrogen load has decreased by 49%. Nevertheless, the nutrient load is still too high, as the ecological status of the marine area off Turku in the inner archipelago has, on average, only improved from bad to poor. Only at the outer boundary of the inner archipelago (station 220) has the total phosphorus concentration (22.7 µg/l) during the years 2021–2024 been just barely within the good classification (threshold 23 µg/l). However, even there, the chlorophyll-a concentration (7 µg/l) has remained at a moderate level.
Based on previous studies, it is known that the total phosphorus concentration in the surface water of the Archipelago Sea has in recent years been at a level of 20 µg/l in the intermediate and outer archipelago zones [7]. This can be considered a background concentration, below which the total phosphorus concentration in the inner archipelago off Turku would not decrease, even if all local load from the catchment area were to cease. By combining this information with the previously described reduction in phosphorus load and the measured average total phosphorus concentrations, a simple load model is obtained: y = 0.369 x + 19.95, where y is the average phosphorus concentration (µg/l) and x is the phosphorus load into the sea (t/a) (n = 3, p = 0.0015, R2 = 1).
Using the equation, it can be calculated that achieving a phosphorus concentration of 32 µg/l (the upper limit of the moderate status) would require reducing the phosphorus load to 32.7 t/a from the current 60 t/a, a 45.5% reduction. Similarly, reaching the threshold for good status, a concentration of 23 µg/l, would require lowering the load to 8.3 t/a, representing an 86.2% reduction. Achieving good status in phosphorus concentration would therefore require reducing the phosphorus load from the Aura River from the current 56 t/a to 5 t/a, a 91% reduction, since further phosphorus removal from wastewater is practically no longer feasible. Such a requirement is undoubtedly impossible.
Moreover, even achieving good status in total phosphorus concentration would not result in a good status for phytoplankton. Responses in chlorophyll a concentration to reduced total phosphorus levels can be examined using the previously presented regression equation y = 0.314 x–1.19, where y is the average chlorophyll a concentration (µg/l) and x is the average phosphorus concentration (µg/l) (Figure 25). Using the equation, it can be calculated that a phosphorus concentration of 32 µg/l (the upper limit of moderate status) would correspond to a chlorophyll a concentration of 8.9 µg/l, while a phosphorus concentration of 23 µg/l (the upper limit of good status) would correspond to 6.0 µg/l. However, the ecological class threshold is much stricter, especially for the good status, which requires a chlorophyll a concentration of 3 µg/l, while the threshold for moderate status is 7 µg/l.
And conversely: achieving the good status threshold for chlorophyll a concentration would require a total phosphorus concentration of 13.3 µg/l, while the satisfactory status threshold would require 26 µg/l. The requirement for good status is so strict that, in practice, it would demand extensive measures across the entire Baltic Sea region, including a 50% reduction in the Baltic Sea’s total phosphorus concentration from current levels, in addition to significant local emission reductions. In fact, very similar conclusions were reached when using the FICOS model to calculate nutrient load ceilings for different Finnish marine areas [7,15].
When developing an ecological classification system reference concentrations of chlorophyll a were calculated by substituting the historical values of Secchi depth into the type-specific equations on the relationships between chlorophyll a and Secchi depth [15]. However, statistical modeling could not be used for inner coastal types because historical Secchi depth values were missing. For inner coastal types, reference values have been estimated by relating the 5th percentile of current monitoring results to the reference values of outer coastal types [16].
While it seems obvious that, in the inner archipelago zone, the requirements for good status would be too strict and impossible to achieve, one option would be to refine the classification thresholds by reanalyzing the observation data. In the inner archipelago, it might be sufficient to adjust the current upper limit for moderate status (7 µg/l) to be the threshold for good status, redefine the lower limit for poor status (17 µg/l) as moderate, and set the poor status threshold at around 30 µg/l.
In any case, the wastewater treatment implemented has led to positive developments in water quality in the marine area off Turku, even though the goal of good status is still a way off. In Raisio Bay, the chlorophyll-a concentration, which indicates algal production, decreased by 68% when wastewater discharge was transferred to Kakola. Similarly, in Rauvola Bay near Kaarina, the reduction in chlorophyll-a concentration was estimated to be 36%. At the outer boundary of the inner archipelago, in Airisto at stations 210 and 220, the observed decrease in chlorophyll concentration in the early 2000s—approximately 40% between 2000 and 2009—appears to be linked to a significant reduction in ammonium nitrogen loading from wastewaters.
What’s interesting at these Airisto stations 210 and 220, however, is the development since 2009. Chlorophyll concentrations started to rise again, and the variation between years also increased, even though ammonium nitrogen and phosphorus loading from wastewater continued to decrease. Between 2009 and 2011, NH4-N loading to the sea was about 120 tons per year, while between 2021 and 2023, it was 23 tons per year. It is also worth noting that before the Kakola treatment plant started operating, in 2007-2008, NH4 loading had decreased to 35 tons per year. Phosphorus loading, on the other hand, has steadily decreased throughout the entire observation period. Between 2009 and 2011, it was 6.3 tons per year, while between 2021 and 2023, it was 3.7 tons per year.
Since 2009, cyanobacterial biomass at the Airisto stations 210 and 220 has clearly increased compared to previous years and the situation in southern Airisto at the Seili station. Nutrient ratio analyses show that, at the same time, the system seems to have shifted towards nitrogen limitation, which favors nitrogen-fixing cyanobacteria, such as species of the Nostocales order like Aphanizomenon sp. [17,18] Due to the ability of nitrogen fixation, cyanobacteria are a nitrogen source for the system [19]. So, we can think that they, in part, nullify the work of wastewater treatment plants in reducing nitrogen removal. If internal phosphorus loading increases simultaneously and more dissolved phosphorus becomes available for phytoplankton, the result is an increase in algal production. This kind of development has been observed in the chlorophyll-a concentrations at Airisto stations 210 and 220 since 2009 (Figure 16 and Figure 17). The temporal development of internal P loading intensity has not been studied in detail in the Archipelago Sea. The observed increase in wintertime dissolved phosphorus concentration at station 201 (Figure 20) does indeed suggest a strengthening of internal loading. It is also known that if the relative loading is calculated based on the amount of phosphorus reaching the upper surface layers (0–20 m), it is highest in the inner archipelago [7].
In this study, the interpretation of the minimum nutrient was based on the dissolved nutrient DIN:DIP ratios derived from monitoring data. This approach has limitations compared to, for example, similar experimental studies [20]. During the summer, dissolved nutrients cannot be measured from the productive surface layer using traditional water analyses, as all the available nutrient fractions are utilized by phytoplankton species and bacteria [12]. Therefore, nutrient ratios measured at other times of the year must be used as indicators for assessing nutrient availability. In this study, winter nutrient data were primarily used, as they are suitable for evaluating concentrations caused by steady wastewater loading. The data from Airisto station 220 were also used to calculate DIN:DIP ratios which based on molar concentrations of deep-water layers (over 20 m) during the ecological classification period (1 July–7 September). Based on this, a clearer change was observed from 2009 onwards compared to the DIN:DIP ratios based on winter data. Earlier analysis like [P] have in any case shown that rather simple ratios can reflect phytoplankton requirement for nutrients. However, from the management point of view, it is important to be aware that prevailing N-limitation will be more difficult to detect from nutrient data than prevailing P-limitation [13].
Cyanobacteria blooms and N2 fixation have been closely linked to eutrophication of the Baltic Sea. Enhanced internal loading of phosphorus and the removal of dissolved inorganic nitrogen leads to lower nitrogen to phosphorus ratios, which are one of the main factors promoting nitrogen-fixing cyanobacteria blooms [21]. Vahtera et al. described the coupled processes inducing internal loading, nitrogen removal, and the prevalence of nitrogen-fixing cyanobacteria as a potentially self-sustaining “vicious circle” [21]. They concluded that to effectively reduce cyanobacteria blooms and overall signs of eutrophication, reductions in both nitrogen and phosphorus external loads appear essential.
But on the other hand, at least the results of ecosystem modeling by Neumann et al. [22] predicted that, in a medium-term perspective, a proportional reduction of nitrogen and phosphorus at the same time does not have the desired reducing effect on phytoplankton development in the open sea. In summer, the shortage of nitrogen has inhibitory effects on all phytoplankton groups, with exception of cyanobacteria. Neumann et al. concluded that a possible solution can be an early and increased reduction of phosphorus load [21]. All phytoplankton groups are limited by phosphorus availability. An increased reduction of phosphorus can be supported by the fact that the increase in phosphorus load was twice compared with nitrogen in the last century [23].
5. Conclusions
The wastewater treatment implemented has led to positive developments in water quality in the marine area off Turku, even though the goal of good status is still a way off. It also seems evident that, in the inner archipelago zone of the Archipelago Sea, the requirements for good ecological status would be too strict and practically impossible to achieve through any load reduction measures. Based on the research, it appears that the biomass of nitrogen-fixing cyanobacteria has increased in the Northern Airisto over the past 15 years. This is driven by a decrease in external nitrogen loading and an increase in internal phosphorus loading. All phytoplankton groups are limited by phosphorus availability. Therefore, further reduction of all external phosphorus loading can be recommended. In the long term, this may also lead to a decrease in internal loading.
Funding
This research was funded by The Ministry of Environment. Support for the implementation of the project is granted under the Supporting Water and Environmental Management (decision September 3, 2024, VN/19624/2024 757/2021).
Data Availability Statement
Data supporting the reported results can be found at http://www.syke. fi/avoindata (accessed on 22 March 2025).
Acknowledgments
This study was conducted at the Centre for Economic Development, Transport, and the Environment, Turku (VARELY). The monitoring data were collected from databases in the VARELY and the Finnish Environment Institute (SYKE). Special thanks to Chief Inspector Titta Lahtinen for co-operation.
Conflicts of Interest
The research was conducted in the absence of any commercial or financial relationships that could be construed as a potential conflict of interest.
References
- Räsänen, T. Alarism and denialism in environmental science: the case of the nutrient pollution in the Baltic Sea in the 1960’s and 1970’s. Scandinavian Journal of History, 2018, 43:5, 646-665. [CrossRef]
- Pfister, C. The “1950s Syndrome” and the Transition from a Slow-Going to a Rapid Loss of Global Sustainability. In: The Turning Points of Environmental History, edited by Frank Uekötter, University of Pittsburgh Press, 2010.
- Myrberg, K.; Leppäranta, M.; Kuosa, H. Itämeren fysiikka, tila ja tulevaisuus. Yliopistopaino, Helsinki, 2006. (in Finnish).
- Kaiser, J.; Lerch, M. Sedimentary faecal lipids as indicators of Baltic Sea sewage pollution and population growth since 1860 AD. Environmental Research, 2022, 204, 112305.
- Andersen, J.H.; Carstensen, J.; Conley, D.J.; Dromph, K.; Fleming-Lehtinen, V.; Gustafsson, B.G.; Josefson, A.B.; Norkko, A.; Villnäs, A.; Murray, C. Long-term temporal and spatial trends in eutrophication status of the Baltic Sea. Biol. Rev. 2017, 92, 135–149. [Google Scholar] [CrossRef] [PubMed]
- Räisänen, R. Turun ympäristön merialueen velvoitetarkkailututkimus. Vuosiraportti 2023. Lounais-Suomen vesi- ja ympäristötutkimus Oy, Raportti, 2024, nro 153–24–3683. (in Finnish).
- Helminen, H. The Role of Internal Phosphorus Loading in the Archipelago Sea Ecological Status. Water, 2025, 17, 248. 17. [CrossRef]
- Jumppanen, K.; Mattila, J. Saaristomeren tilan kehitys ja siihen vaikuttavat tekijät. Lounais-Suomen vesiensuojeluyhdistys r.y. Julkaisu, 1994, 82. Turku. (in Finnish).
- Helminen, H.; Häkkilä, K.; Keränen, M.; Koponen, J.; Laihonen, P.; Ylinen, H. Turun edustan merialueen virtaus- ja vedenlaatumalli. Suomen Ympäristö, 1998, 203.
- KirkkSuomela, J. Kirkkaasta sameaan. Meren kuormitus ja tila Saaristomerellä ja Ahvenanmaalla. Varsinais-Suomen elinkeino-, liikenne—ja ympäristökeskuksen julkaisuja, Turku, Finland, 2011; Volume 6. (In Finnish).
- Helminen, H.; Inkala, A. Modelled Water and Phosphorus Transports in the Archipelago Sea and through the Åland Sea and Northern Baltic Sea and Their Links to Water Quality. J. Mar. Sci. Eng. 2024, 12, 1252. [Google Scholar] [CrossRef]
- Andersson, A.; Höglander, H.; Karlsson, C.; Huseby, S. Key role of phosphorus and nitrogen in regulating cyanobacterial community composition in the northern Baltic Sea. Estuar. Coast Shelf Sci. 2015, 164, 161–171. [Google Scholar] [CrossRef]
- Ptacnik, R.; Andersen, T.; Tamminen, T. Performance of the Redfield Ratio and a Family of Nutrient Limitation Indicators as Thresholds for Phytoplankton N vs. P Limitation. Ecosystems, 2010, 13, 1201–1214. [CrossRef]
- Vuorio, K.; Lehtinen, S.; Järvinen, M.; Hällfors, H. Kasviplanktonseurannan menetelmäohje vesien- ja merenhoitoon. Suomen Ympäristökeskus, 2022. (in Finnish).
- Fleming, V.; Berninger, K.; Aikola, T.; Huttunen, M.; Iho, A.; Kuosa, H.; Niskanen, L.; Piiparinen, J.; Räike, A.; Salo, M.; et al. Rannikkovesien Ravinteiden Kuormituskatot ja Kuormituksen Vähentämisen Keinoja: Loppuraportti; Valtioneuvoston Selvitys- ja Tutkimustoiminnan Julkaisusarja: Helsinki, Finland, 2023; Volume 45. (In Finnish).
- Kauppila, P. Phytoplankton quantity as an indicator of eutrophication in Finnish coastal waters. Application within the Water Framework Directive. Helsinki, Finnish Environment Institute. Monographs of the Boreal Environment Research, 2007, 31. 58 s. http://hdl.handle.net/10138/39341.
- Zakrisson, A.; Larsson, U. Regulation of heterocyst frequency in Baltic Sea Aphanizomenon sp. Journal of Plankton Research, 2014, Volume 36, Issue 5, 1357–1367. 36. [CrossRef]
- Klawonn, I.; Nahar, N.; Walve, J.; Andersson, B.; Olofsson, M.; Sveden, J.B.; Littmann, S.; Whitehouse, M.J.; Kuypers, M.M.M.; Ploug, H. Cell-specific nitrogen- and carbon-fixation of cyanobacteria in a temperate marine system (Baltic Sea). Environmental Microbiology, 2016, 18(12), 4596–4609. [CrossRef]
- Granéli, E.; Granéli, W. Nitrogen in Inland Sea. In Nitrogen in the Marine Environment (eds. Capone, et al.), 2008, p. 683-704.
- Lagus, A.; Suomela, J.; Sipura, J.; Helminen, H. Impacts of nutrient enrichment and sediment on phytoplankton community structure in the northern Baltic Sea. Hydrobiologia 2007, 579, 351–368. [Google Scholar]
- Vahtera, E.; Conley, D.J.; Gustafsson, B.G.; Kuosa, H.; Pitkänen, H.; Savchuk, O.P.; Tamminen, T.; Viitasalo, M.; Voss, M.; Wasmund, N.; et al. Internal ecosystem feedbacks enhance nitrogen-fixing cyanobacteria blooms and complicate management in the Baltic Sea. Ambio 2007, 36, 186–194. [Google Scholar] [PubMed]
- Neumann, T.; Schernewski, G. An ecological model evaluation of two nutrient abatement strategies for the Baltic Sea. Journal of Marine Systems 2005, 56, 195–206. [Google Scholar]
- Larsson, U., Elmgren. Euthropication and the Baltic Sea: causes and consequences. Ambio 1985, 14, 9–14. [Google Scholar]
Figure 1.
Map of the study area and the locations of water quality monitoring stations, which are marked on the map with red triangles. The discharge pipes of wastewater treatment plants are marked with stars: Yellow—Naantali, Kaarina, Green—The current central wastewater treatment plant of the Turku region.
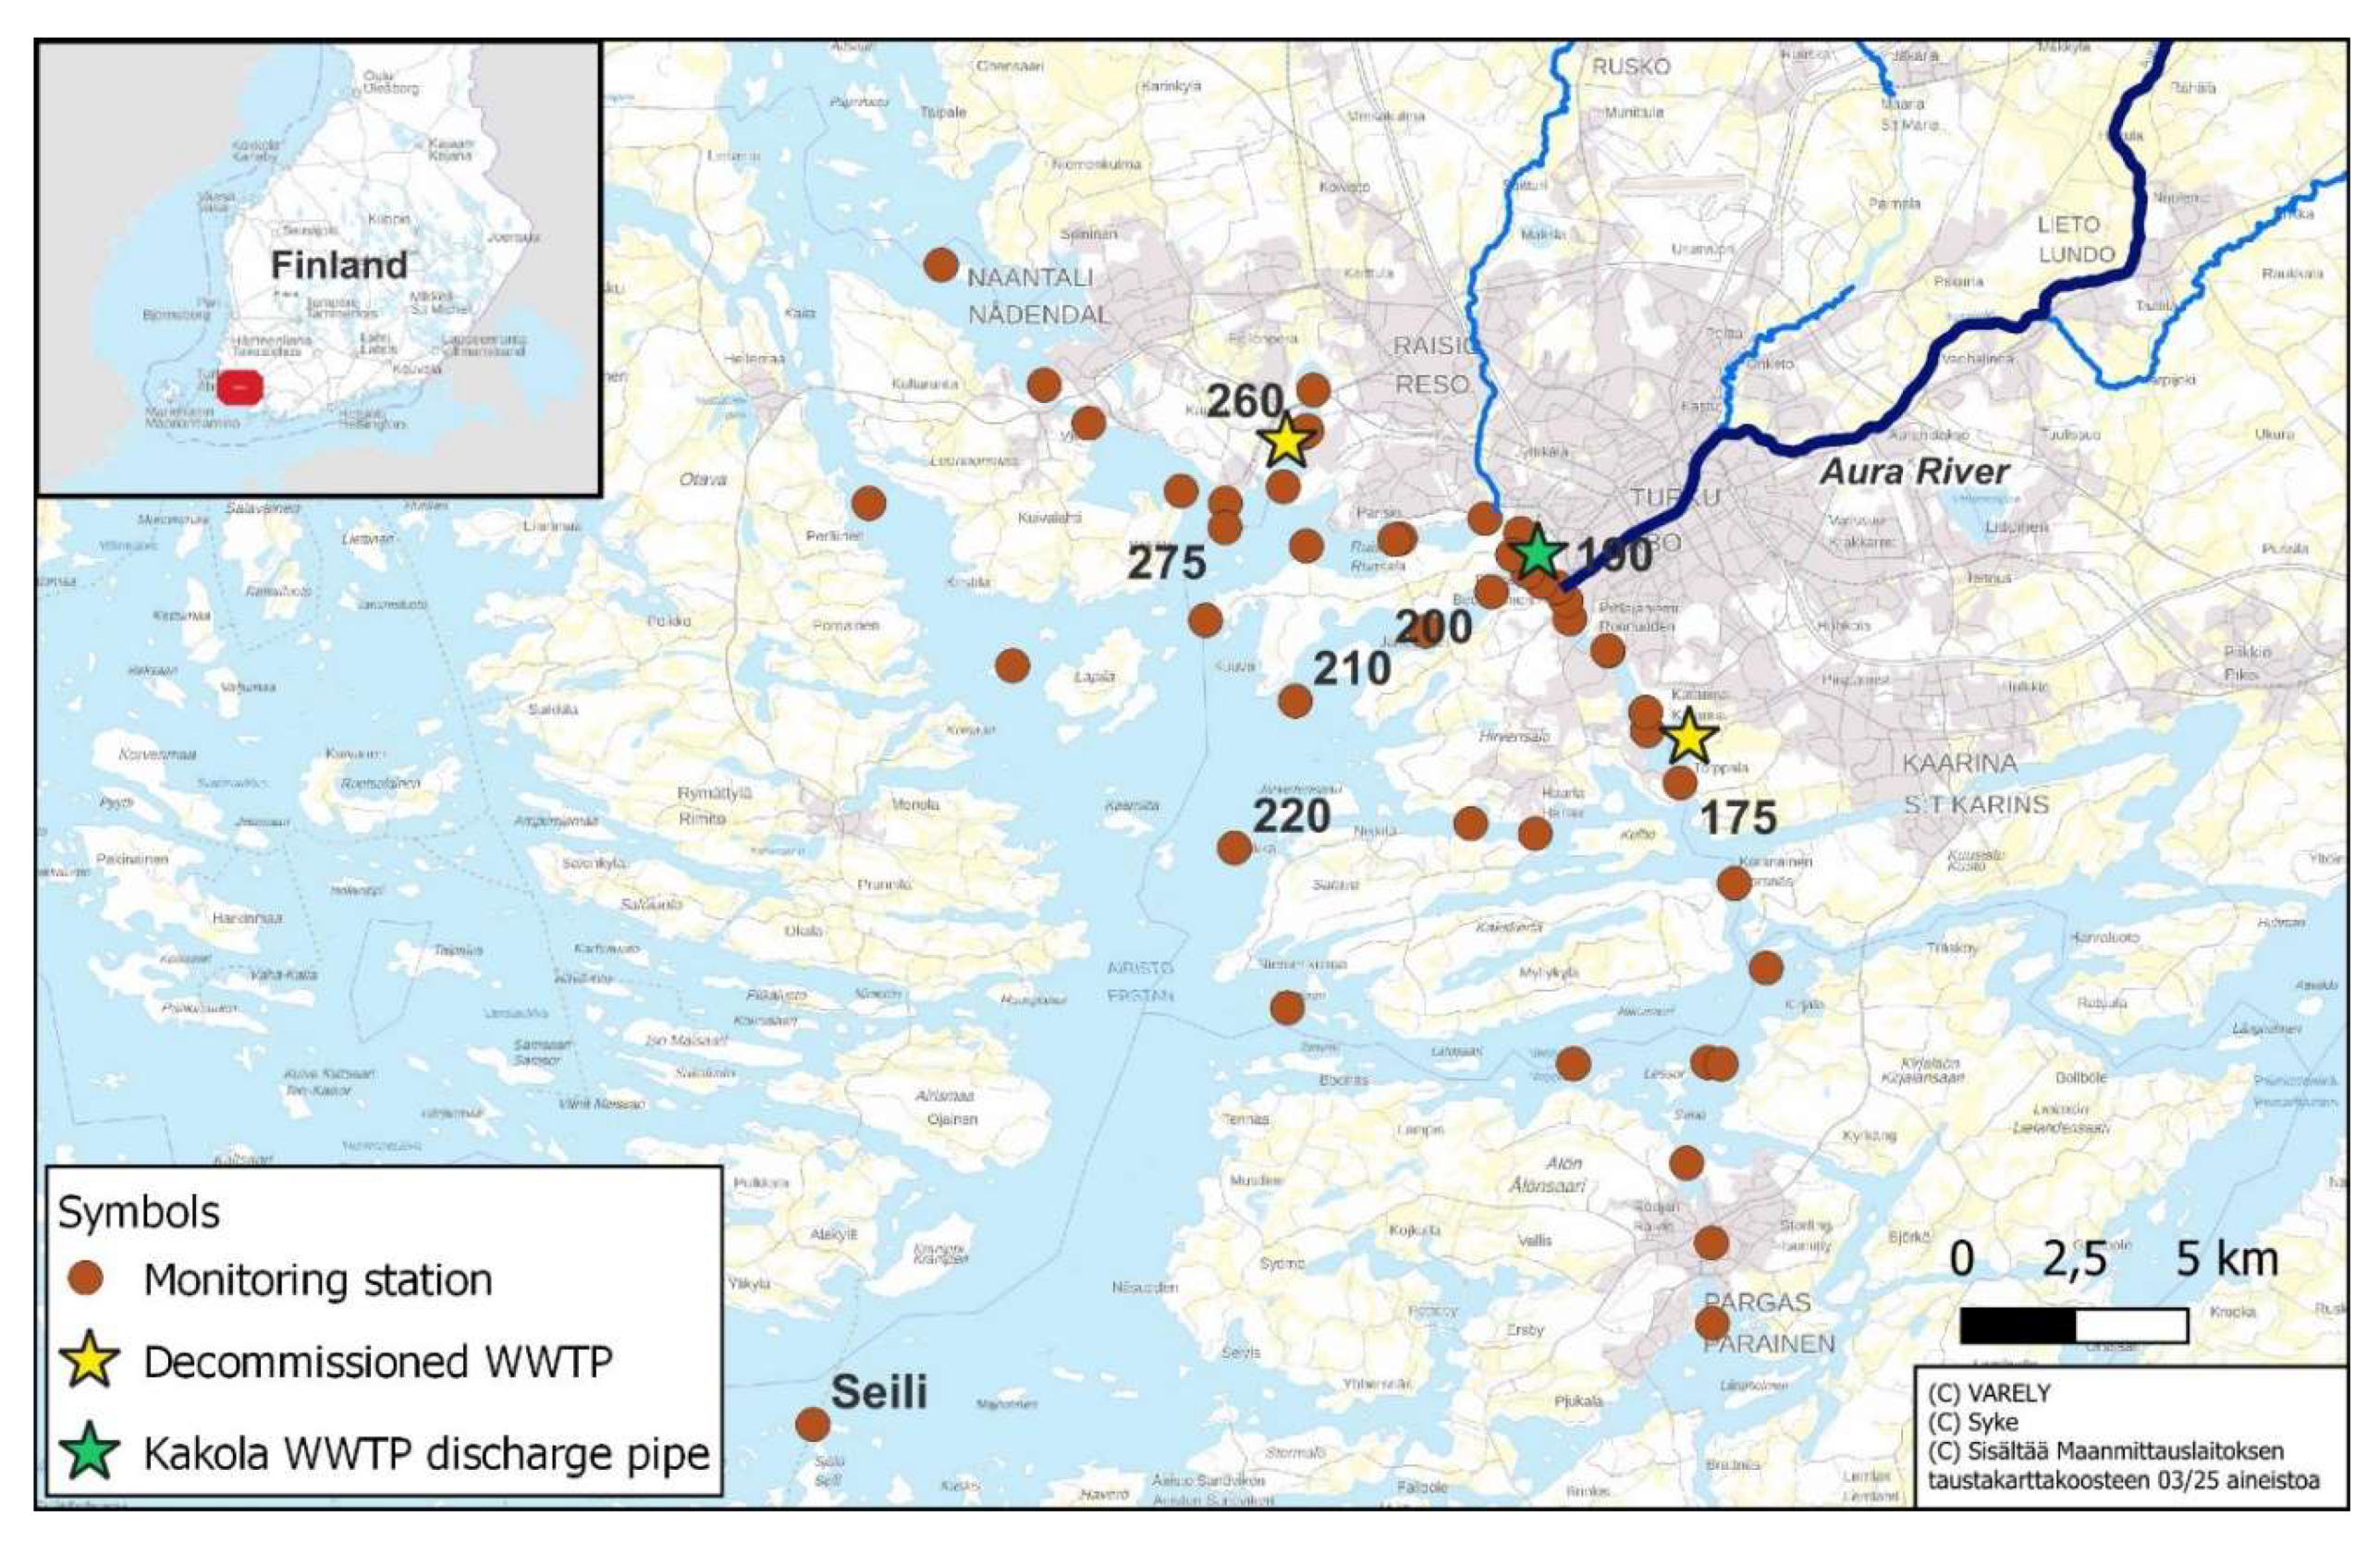
Figure 2.
Total phosphorus load (kg/a) of waste waters to the sea in the coastal area off Turku.
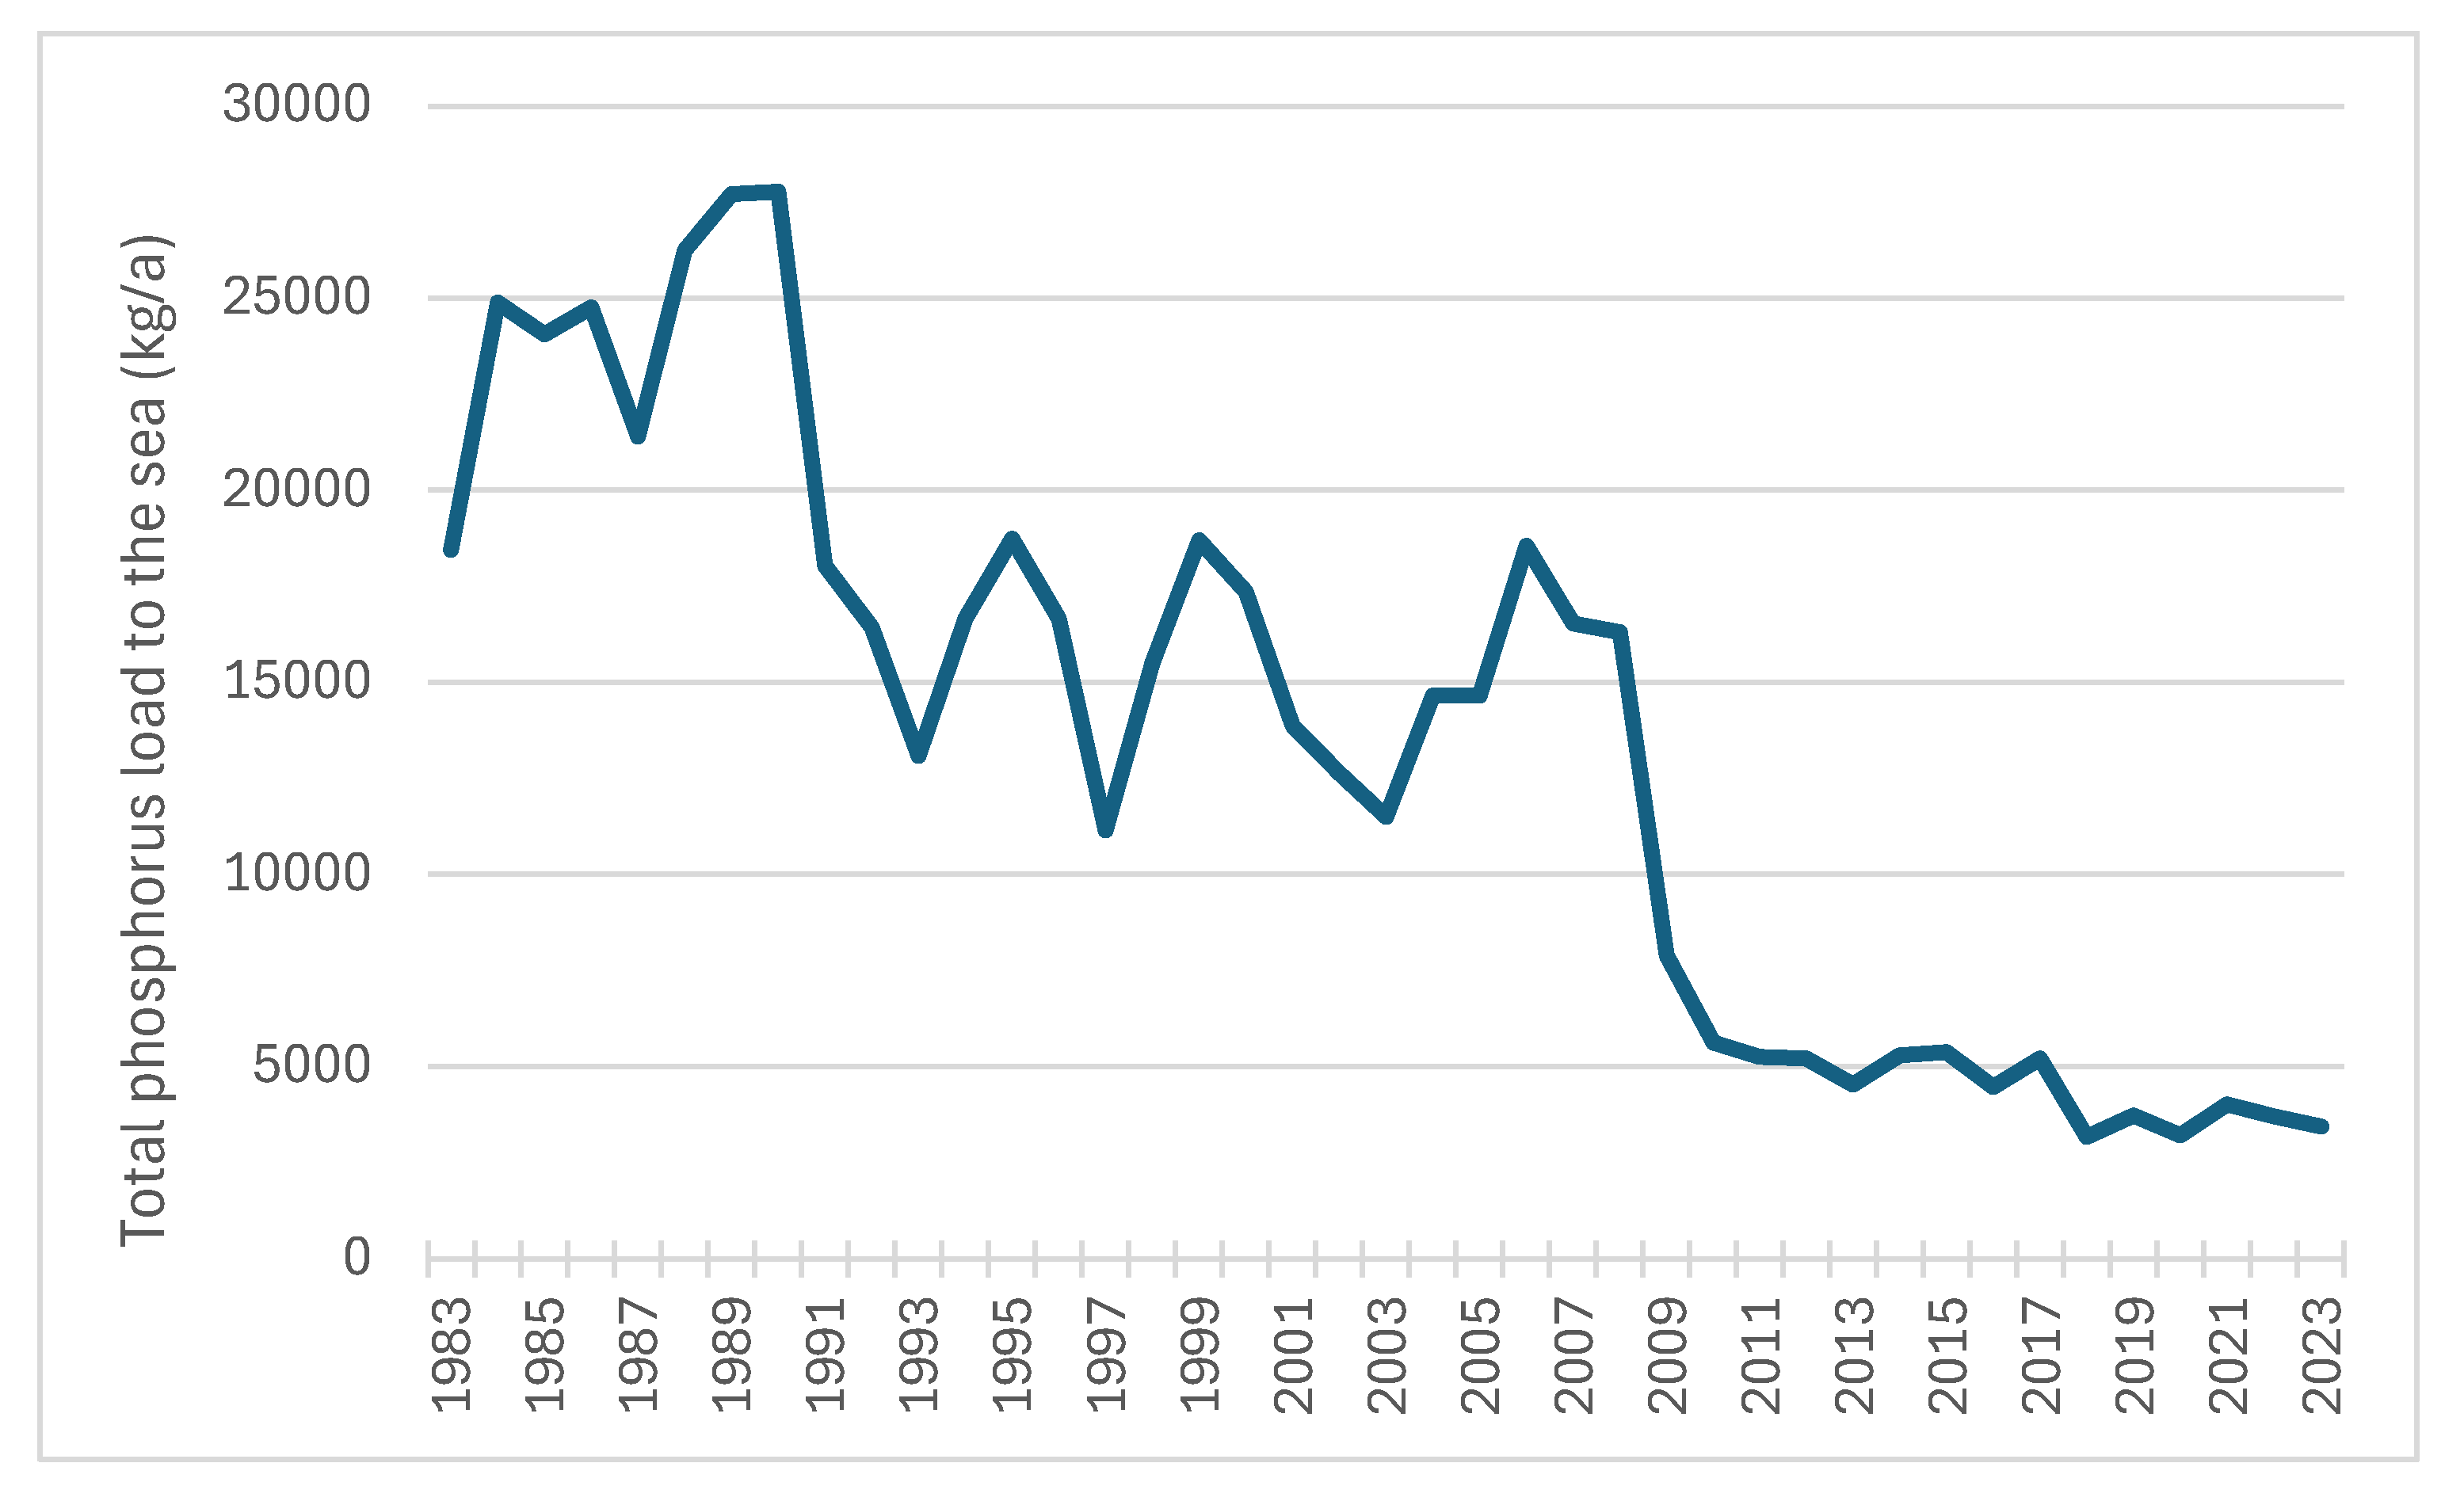
Figure 6.
Total phosphorus concentrations (µg/l) of surface water in monitoring station Turm 260 during the ecological classification period (1 July–7 September) from 1970 to 2024. The poor status lower threshold (moderate/poor) is 32 µg/L and the upper (poor/bad) is 52 µg/L. The red line indicates the moving average in the total phosphorus concentration over the entire period under review. The green arrow indicates the time when the wastewater load ceased (2009).
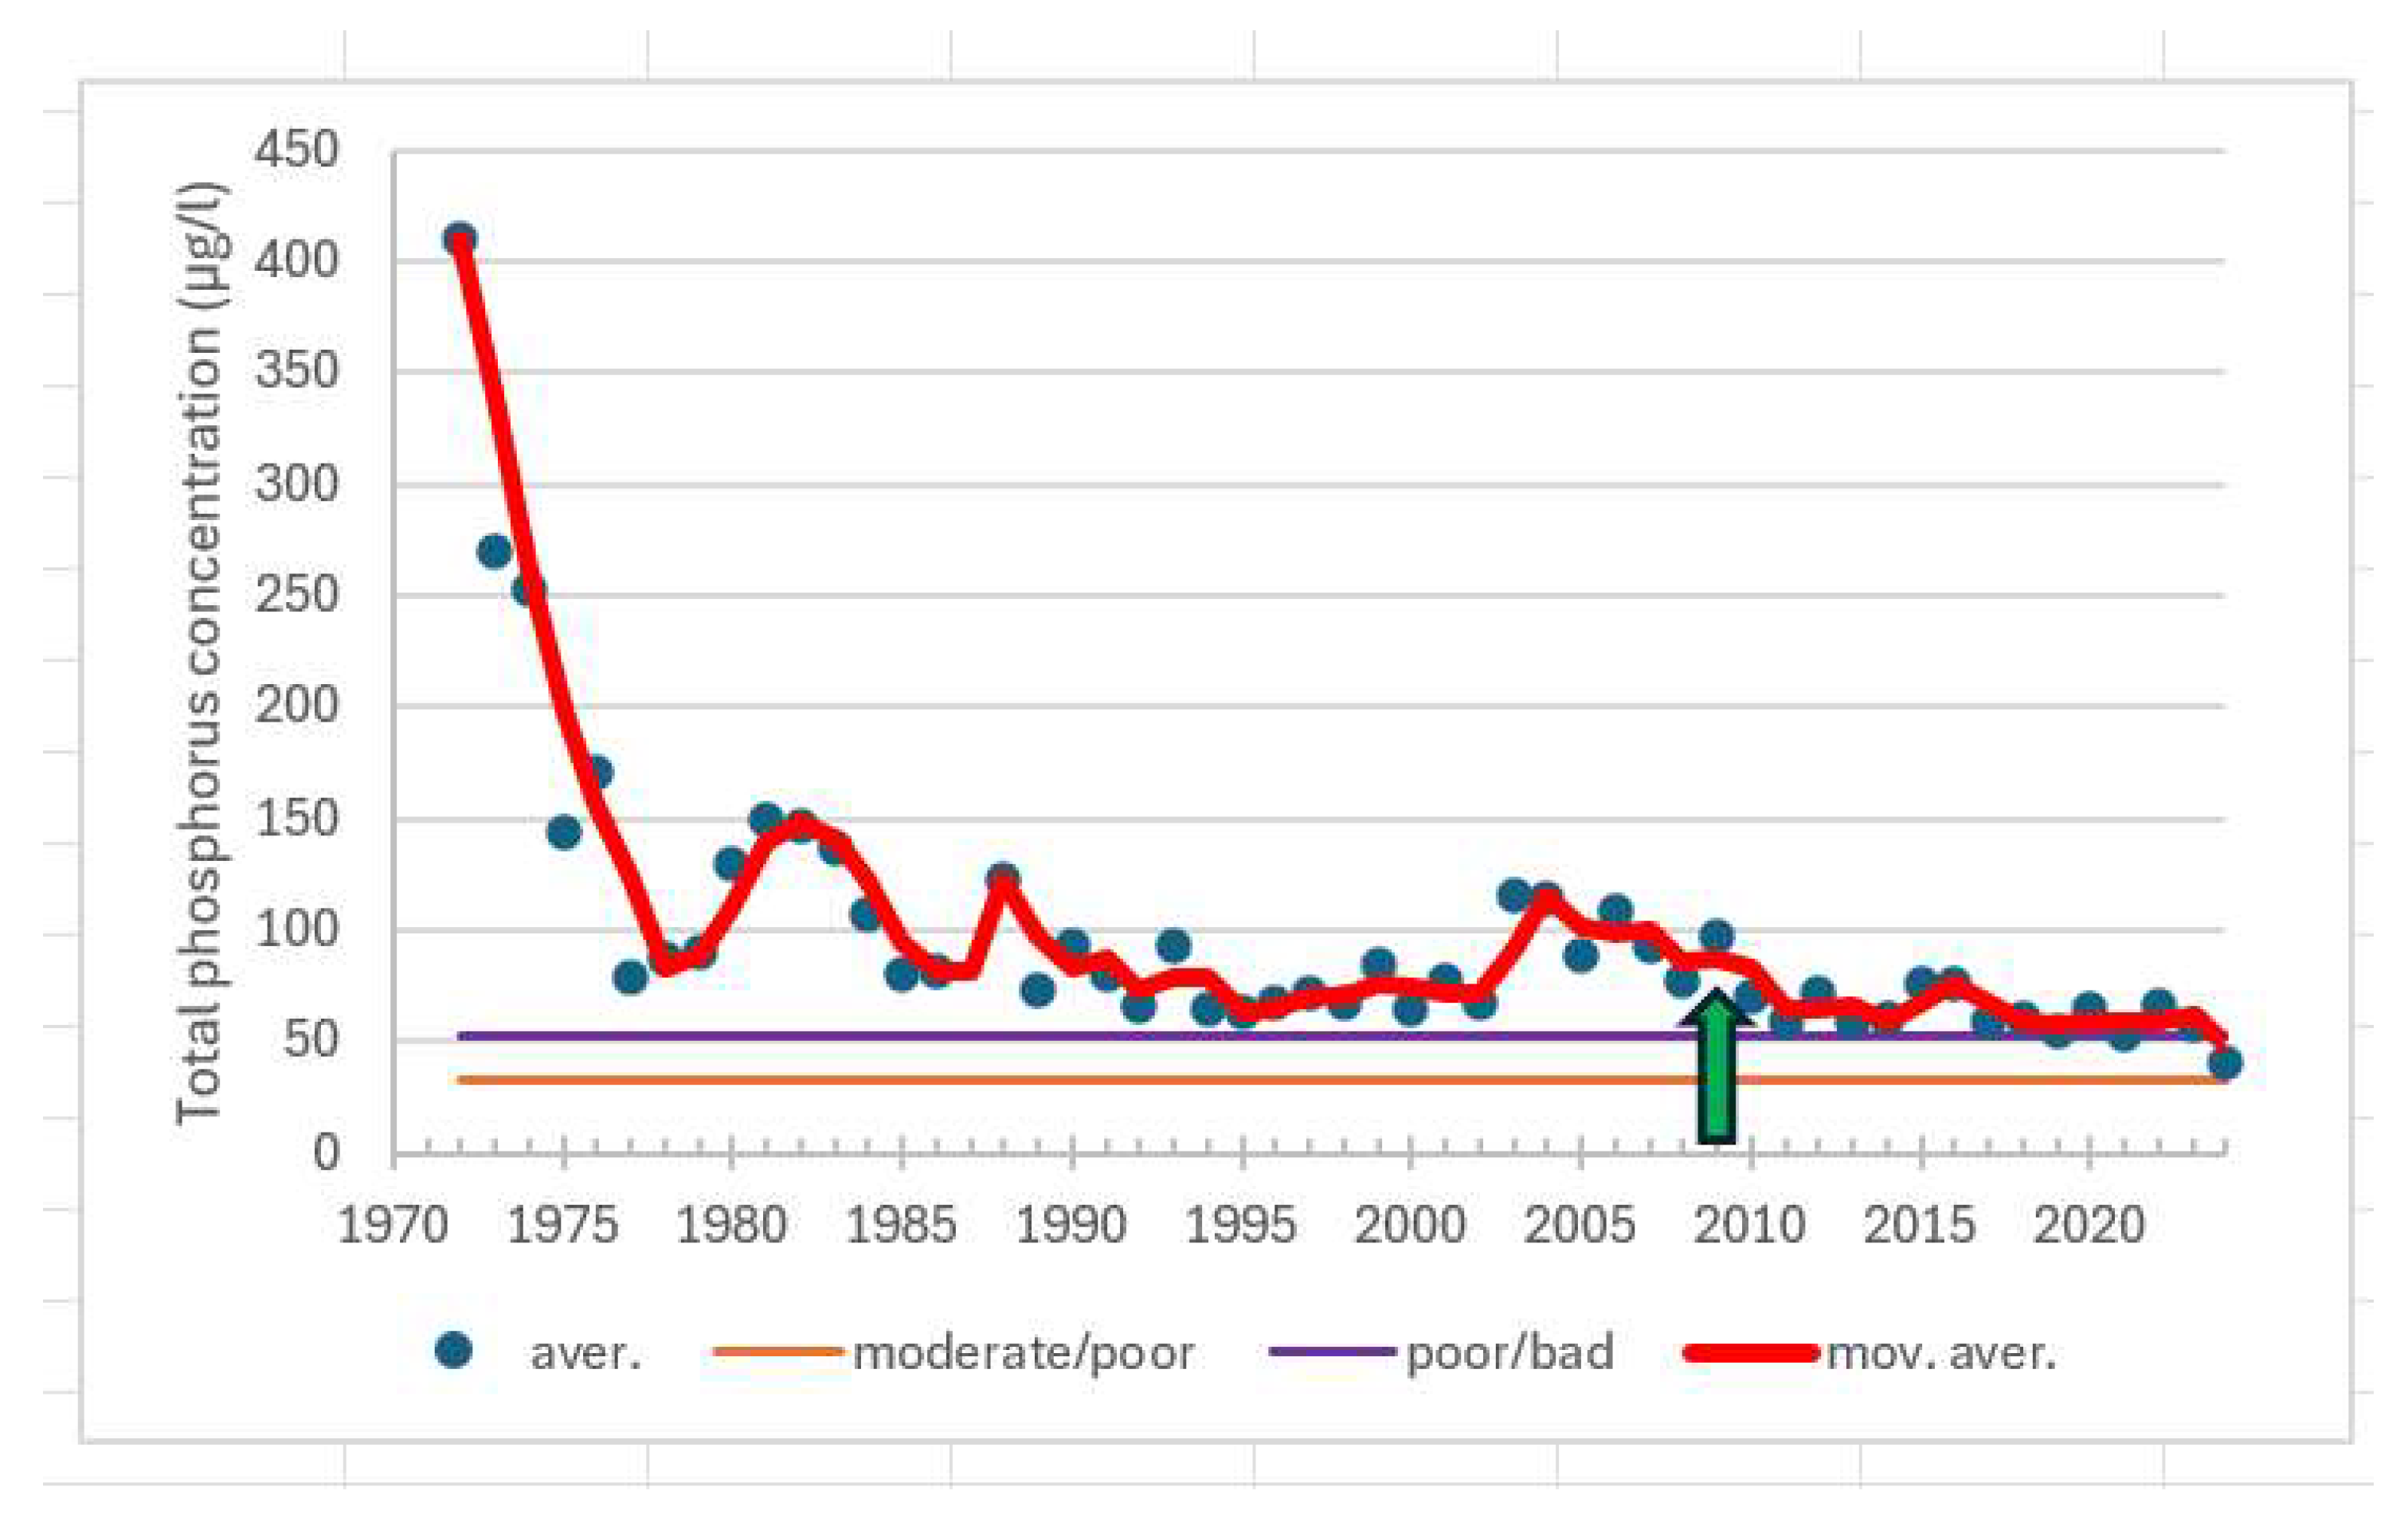
Figure 7.
Total nitrogen concentrations (µg/l) of surface water in monitoring station Turm 260 during the ecological classification period (1 July–7 September) from 1969 to 2024. The moderate status lower threshold (good/moderate) is 325 µg/L and the upper (moderate/poor) is 430 µg/L. The bad status lower threshold (poor/bad) is 575 µg/L The red line indicates the moving average in the total phosphorus concentration over the entire period under review. The green arrow indicates the time when the wastewater load ceased (2009).
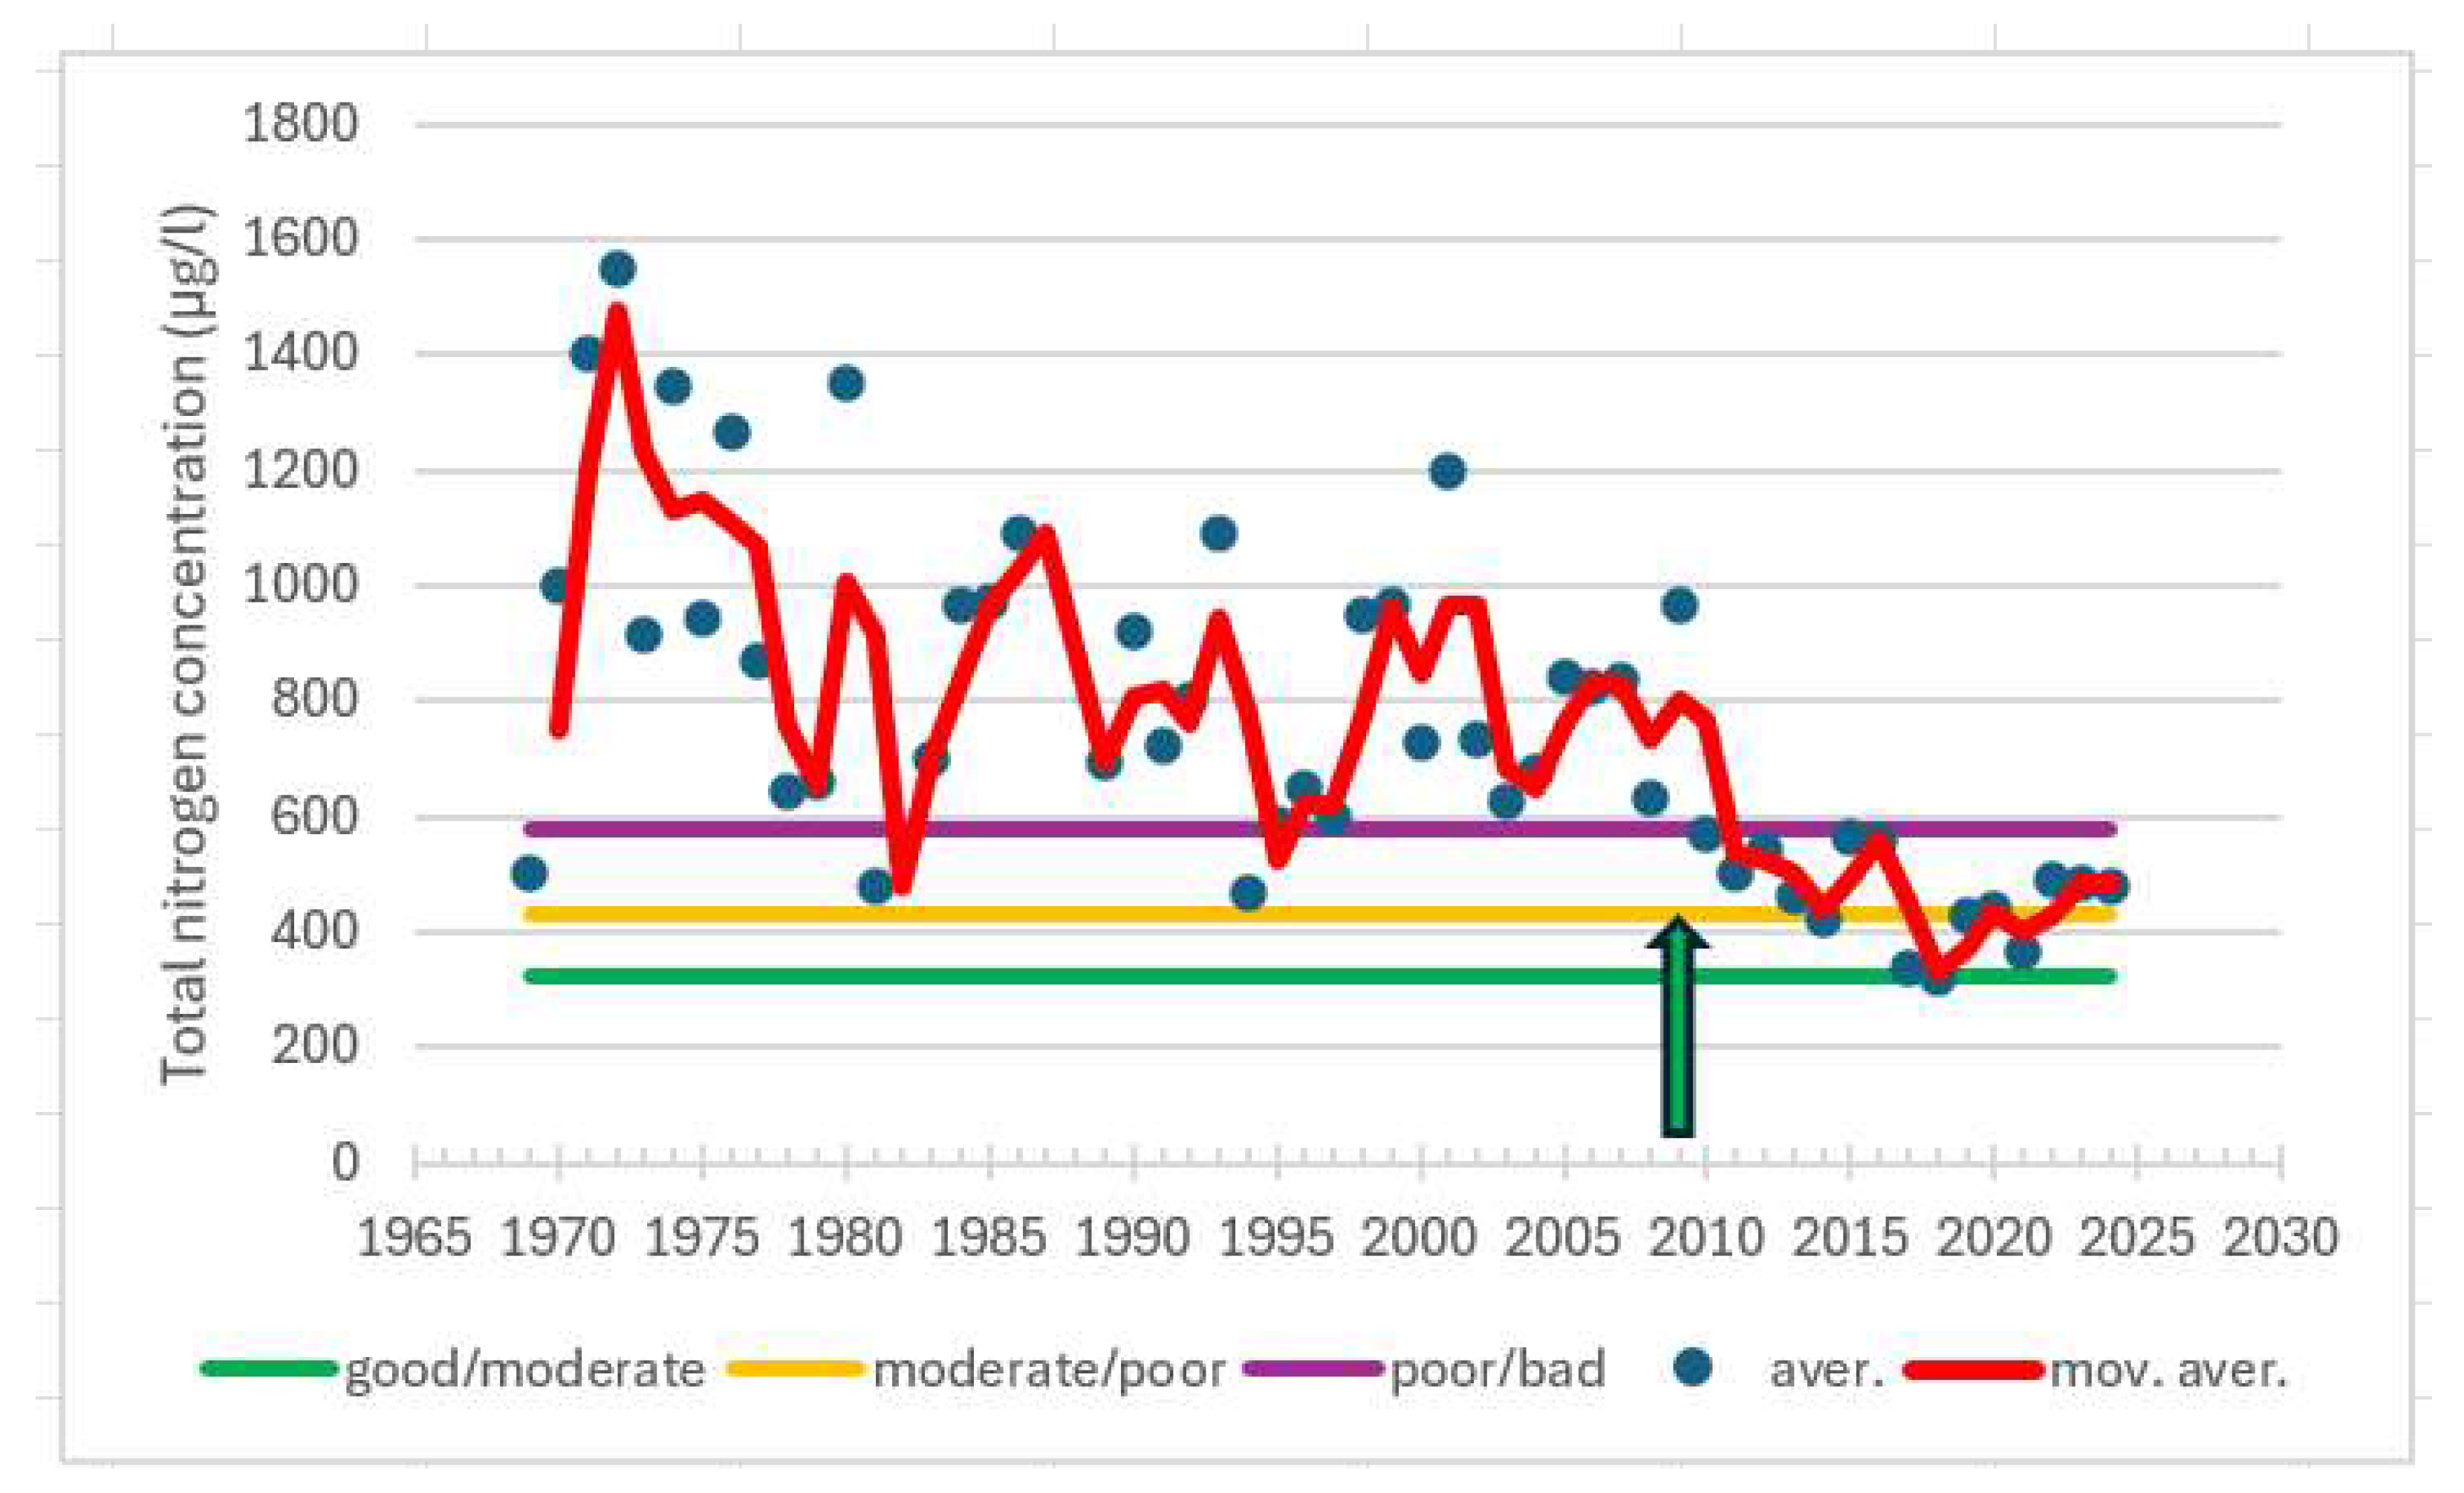
Figure 8.
Ammonium nitrogen (NH4-N) and nitrite-nitrate nitrogen (NO23-N) concentrations (µg/l) of surface water in monitoring station Turm 260 during the wintertime (1 January–31 March) from 1970 to 2024. The green arrow indicates the time when the wastewater load ceased (2009).
Figure 8.
Ammonium nitrogen (NH4-N) and nitrite-nitrate nitrogen (NO23-N) concentrations (µg/l) of surface water in monitoring station Turm 260 during the wintertime (1 January–31 March) from 1970 to 2024. The green arrow indicates the time when the wastewater load ceased (2009).
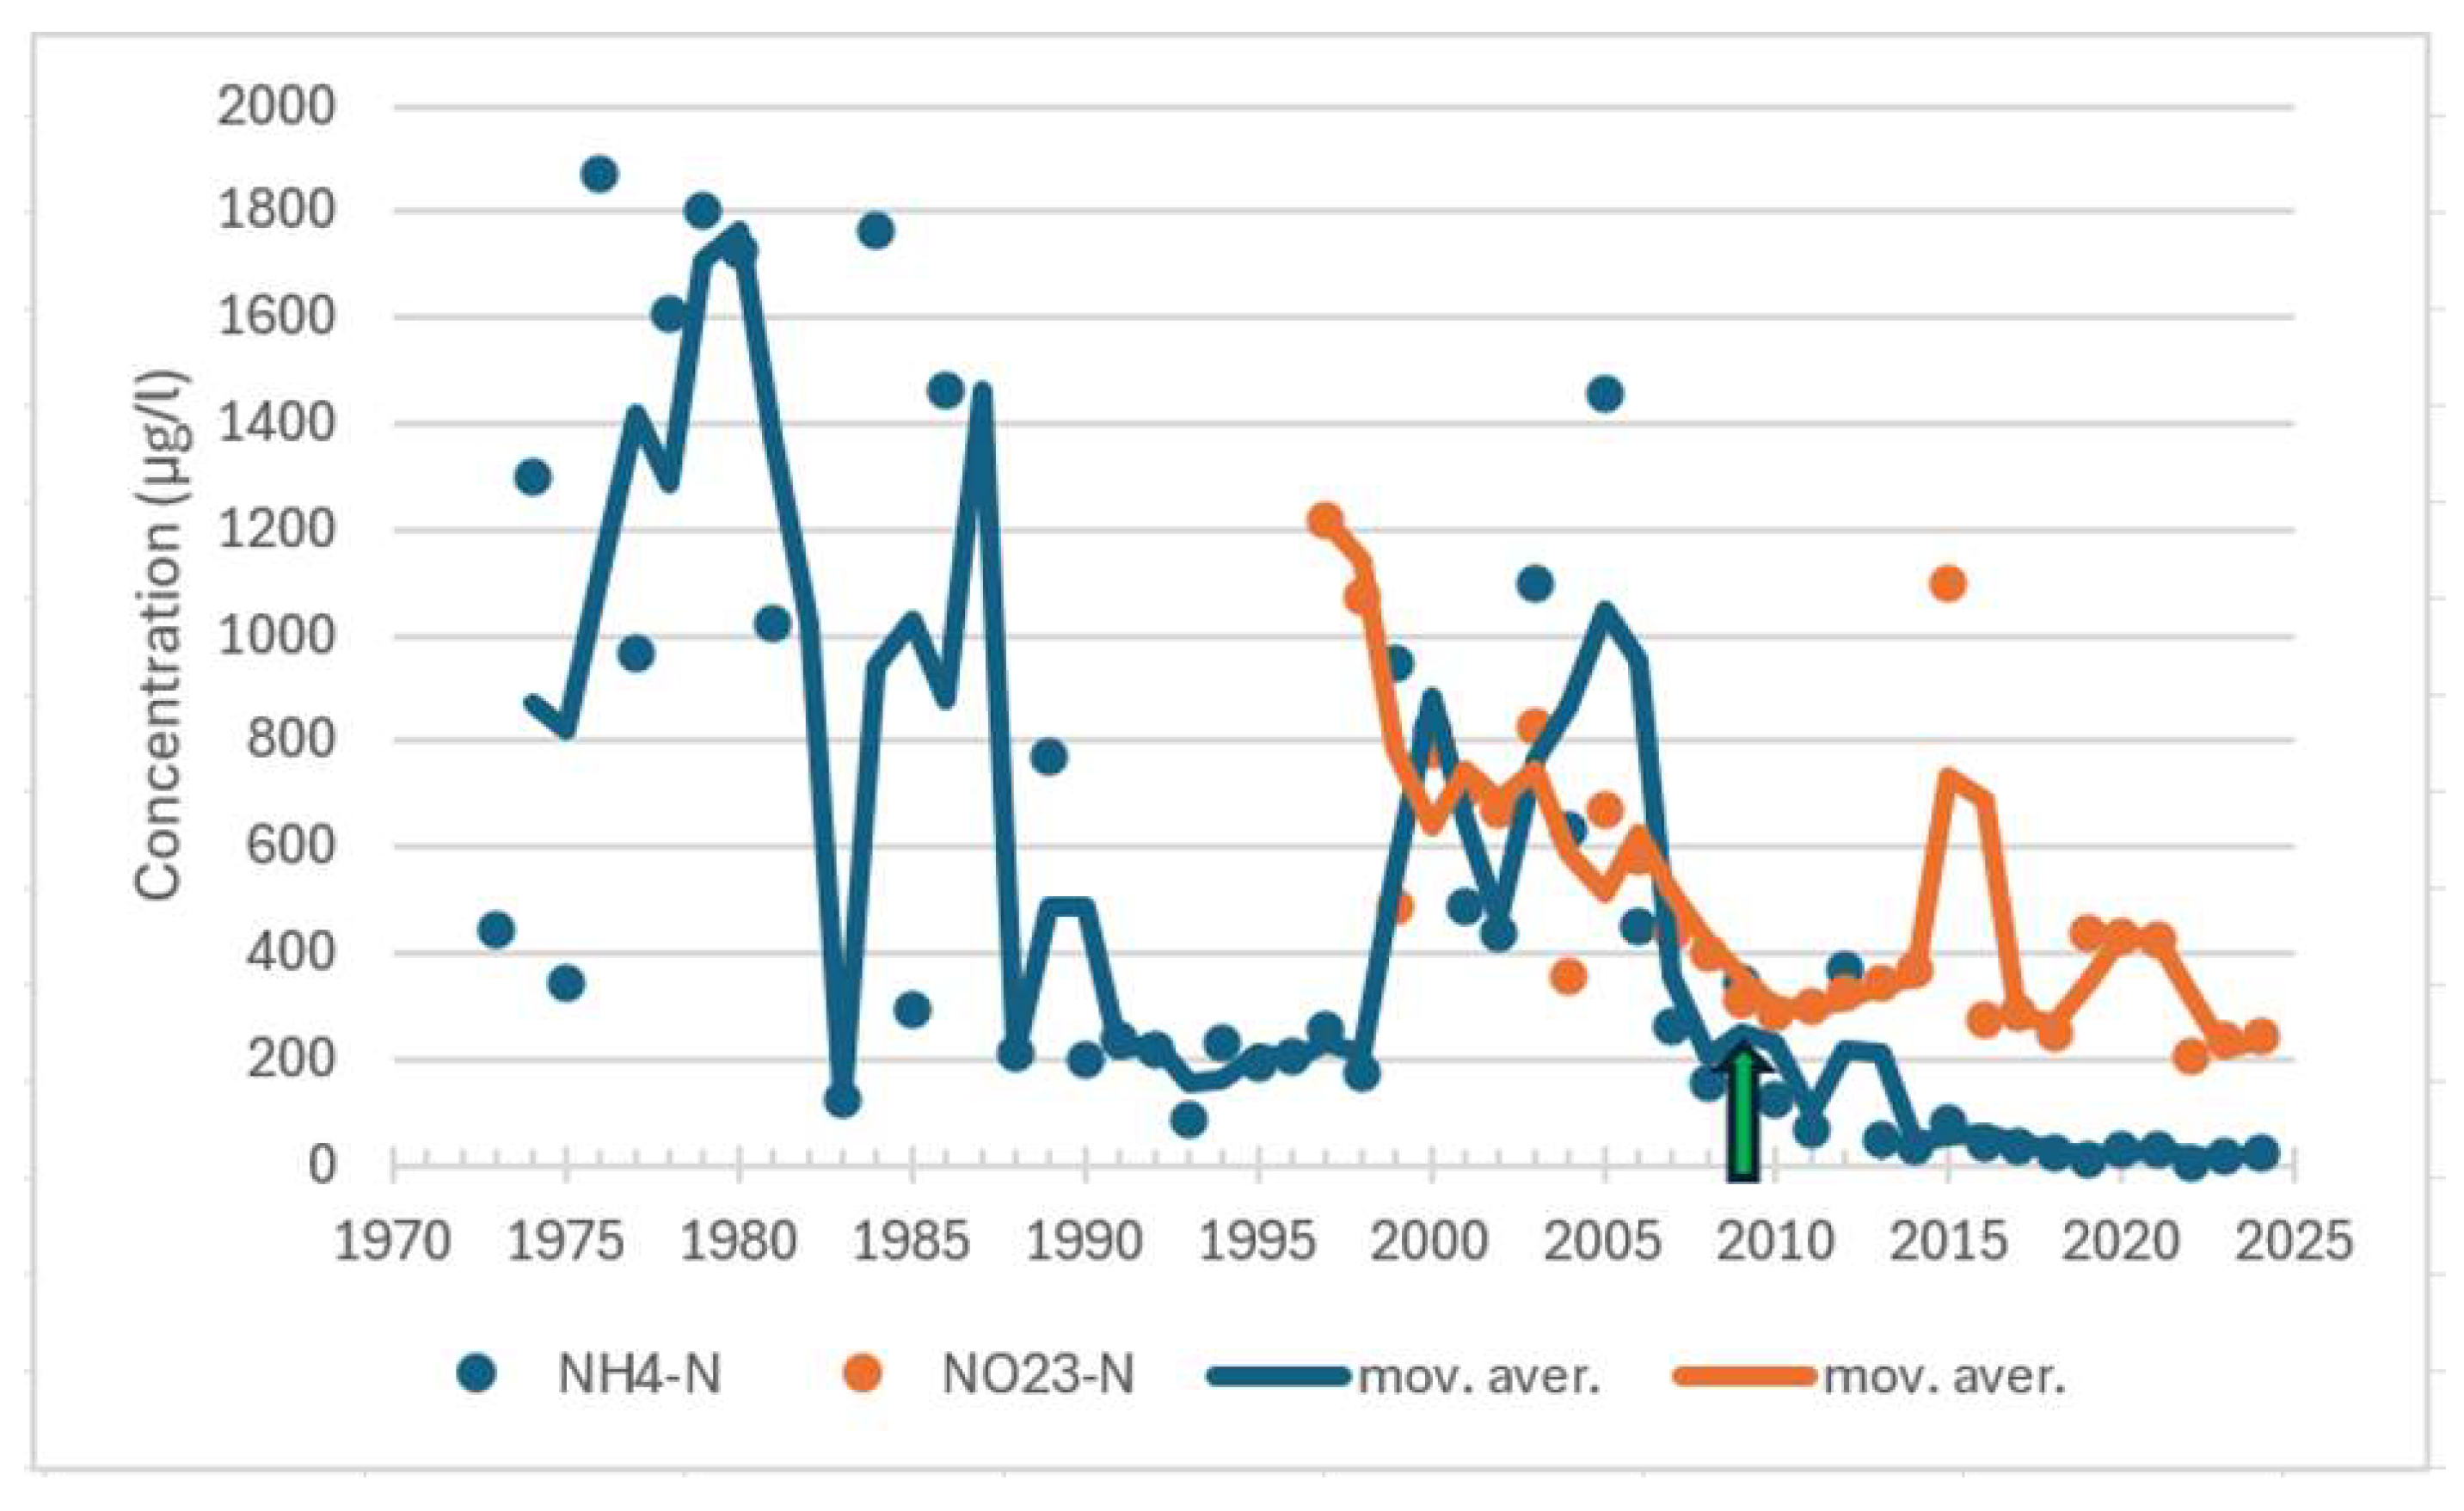
Figure 9.
The concentration of chlorophyll-a (µg/L) in surface water (0–10 m) at observation station Turm 260 during the ecological classification period (1 July–7 September) from 1979 to 2024. The poor status lower threshold (moderate/poor) is 7.0 µg/L and the upper (poor/bad) is 17.0 µg/L. The red line indicates the moving average in the chlorophyll-a concentration over the entire period under review. The green arrow indicates the time when the wastewater load ceased (2009).
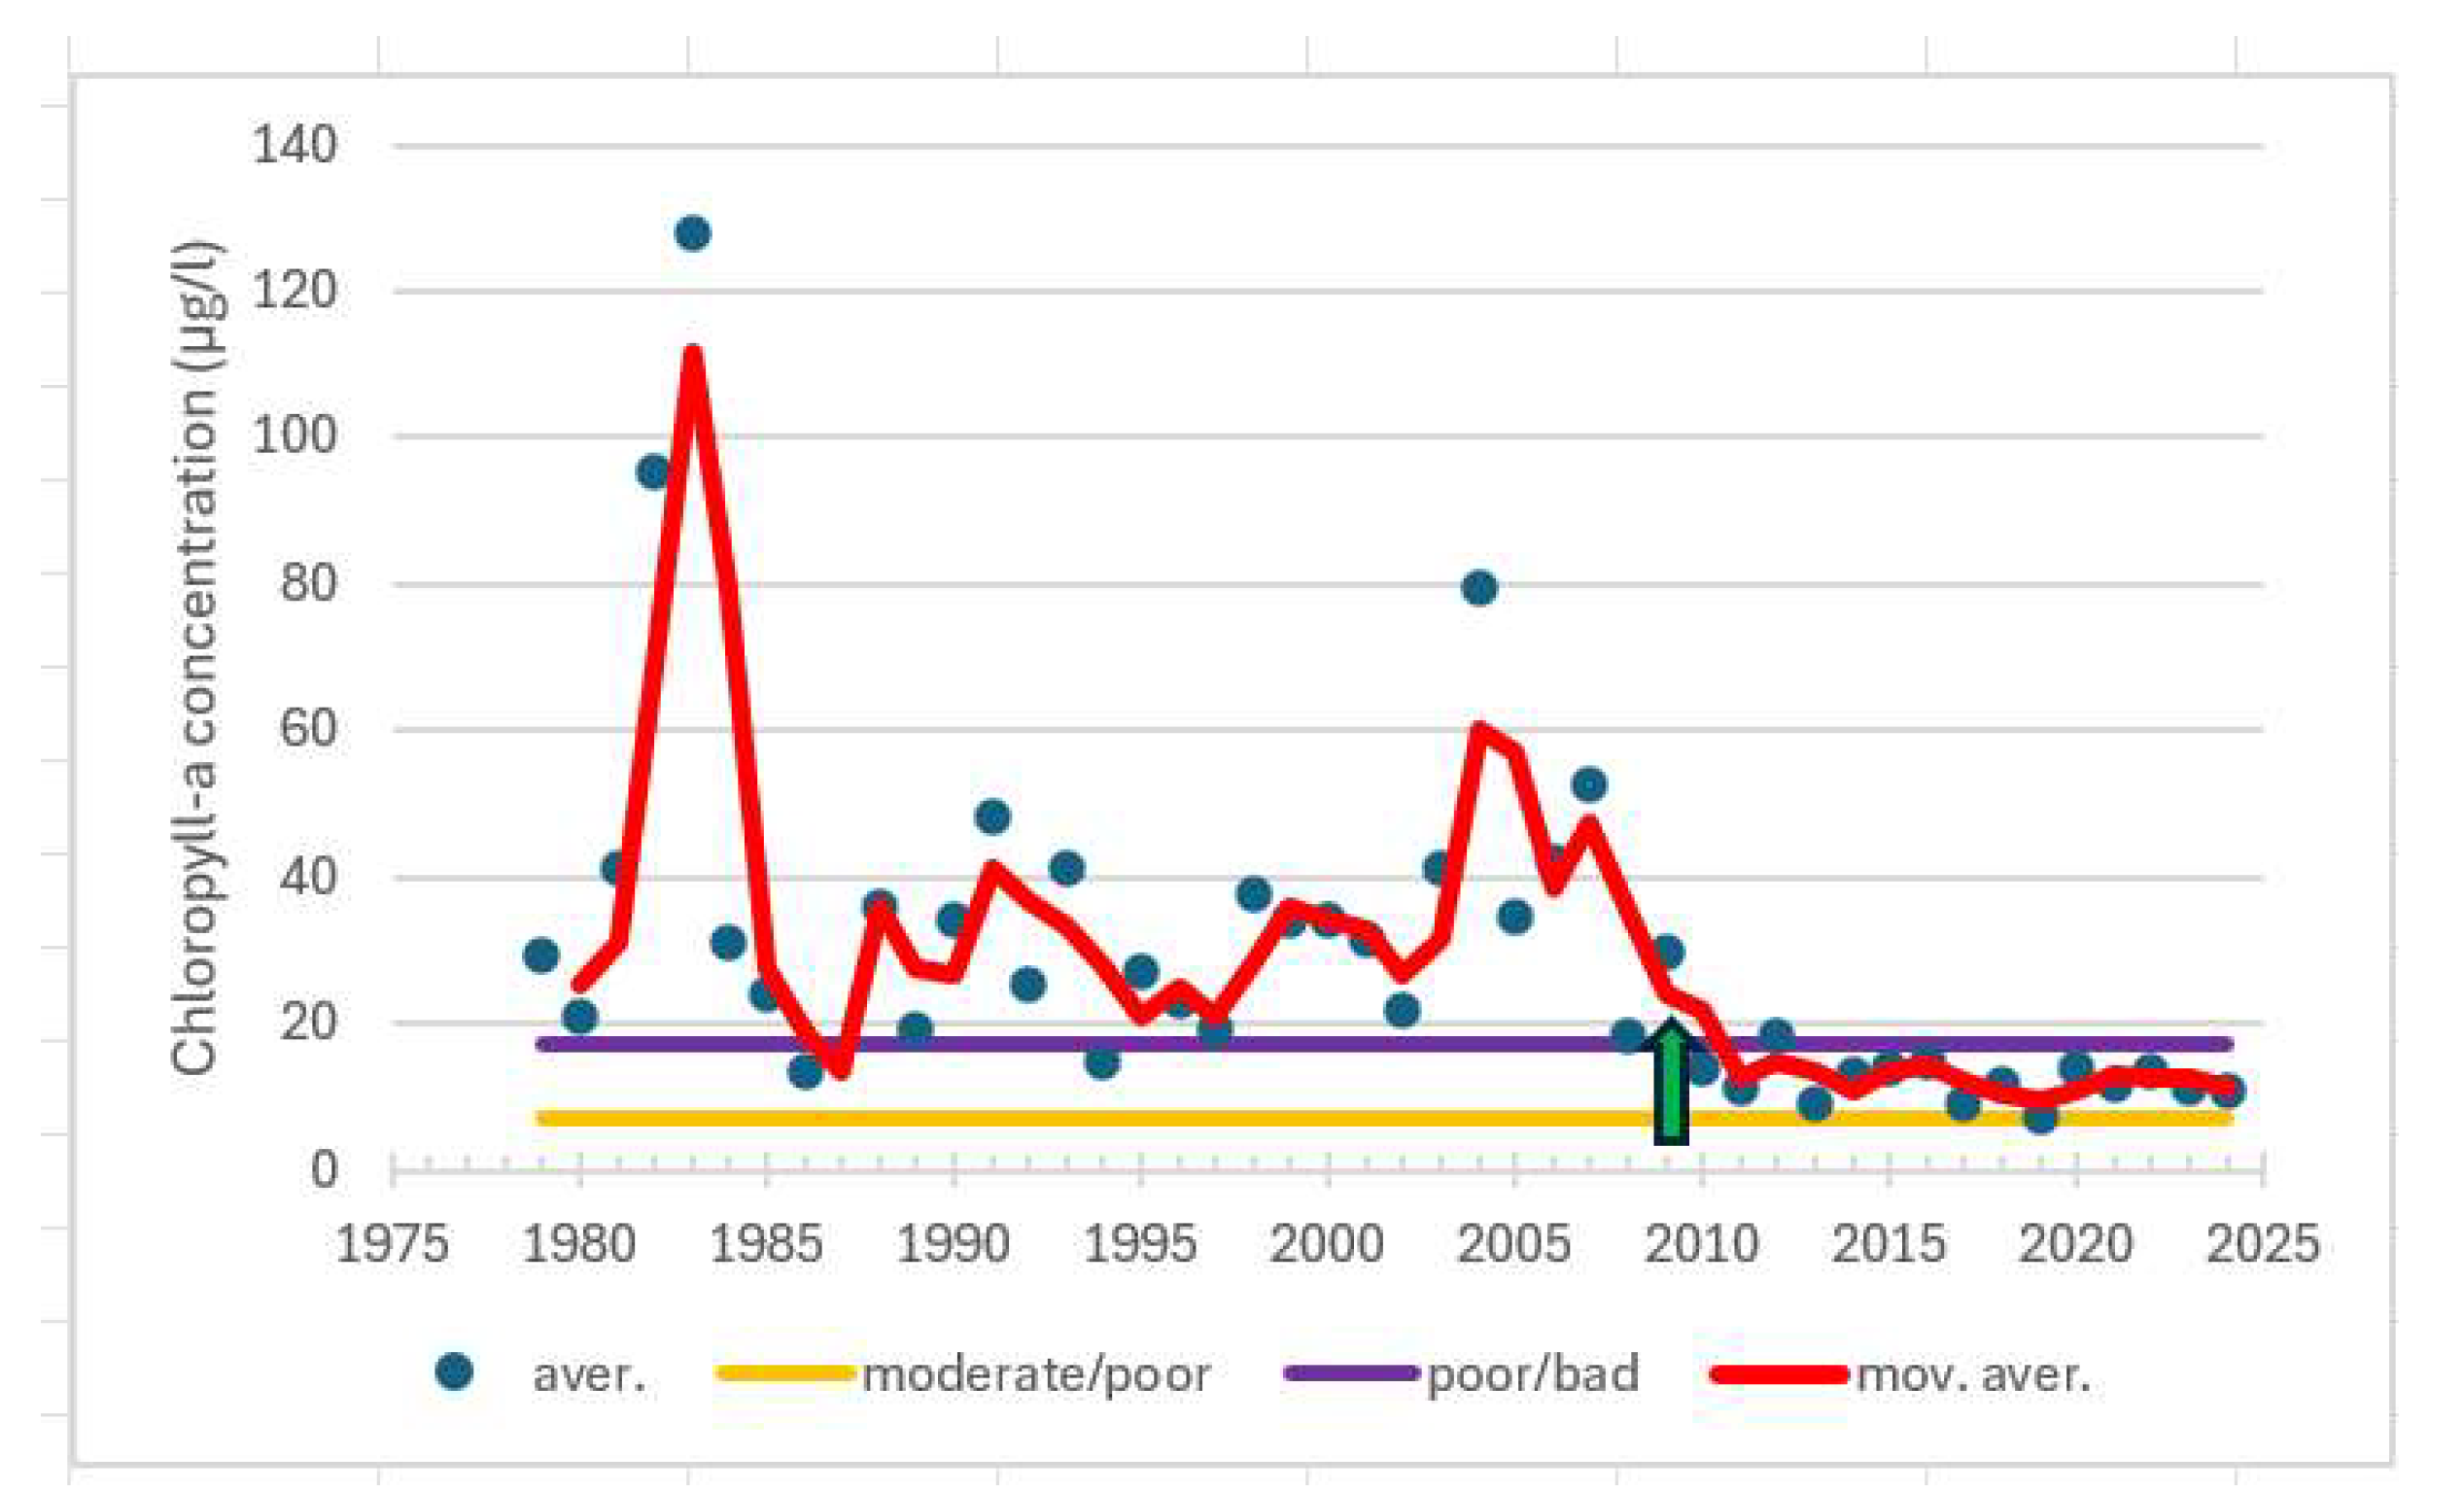
Figure 10.
Total ph osphorus concentrations (µg/l) of surface water in monitoring station Turm 175 during the ecological classification period (1 July–7 September) from 1970 to 2024. The poor status lower threshold (moderate/poor) is 32 µg/L and the upper (poor/bad) is 52 µg/L. The red line indicates the moving average in the total phosphorus concentration over the entire period under review. The green arrow indicates the time when the wastewater load ceased (2009).
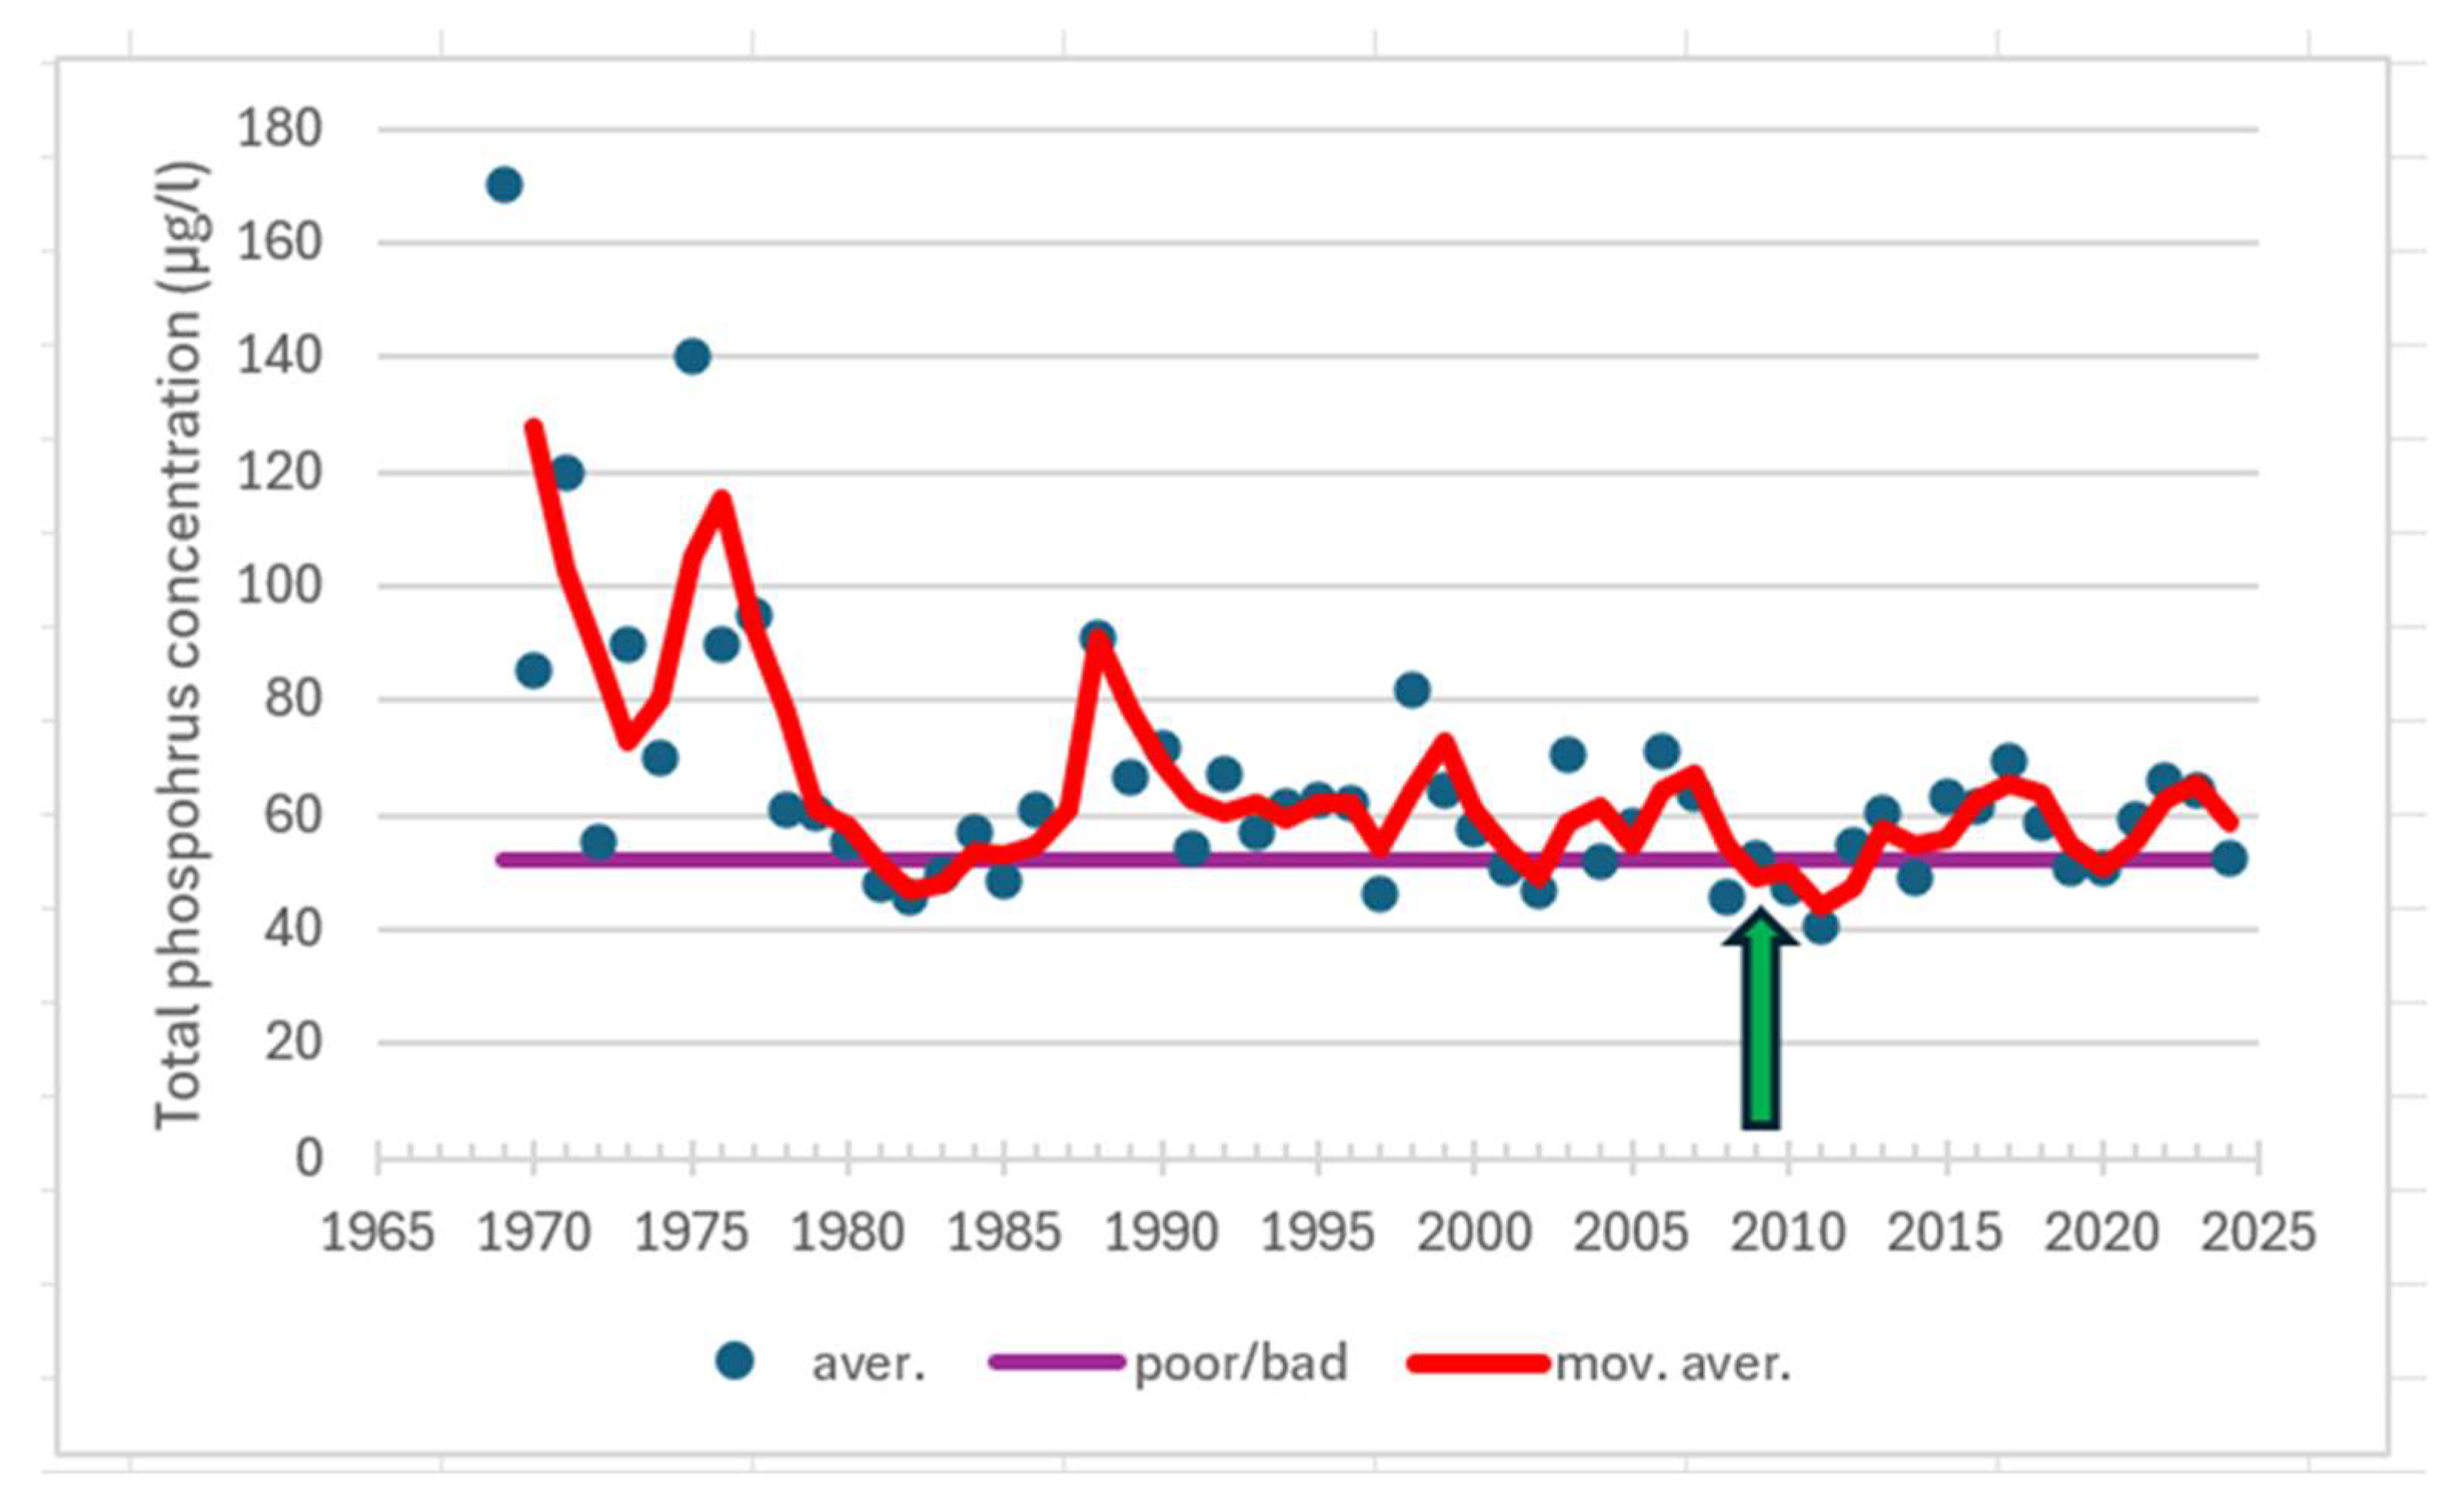
Figure 11.
The concentration of chlorophyll-a (µg/L) in surface water (0–10 m) at observation station Turm 175 during the ecological classification period (1 July–7 September) from 1979 to 2024. The poor status lower threshold (moderate/poor) is 7.0 µg/L and the upper (poor/bad) is 17.0 µg/L. The red line indicates the moving average in the chlorophyll-a concentration over the entire period under review. The green arrow indicates the time when the wastewater load ceased (2009).
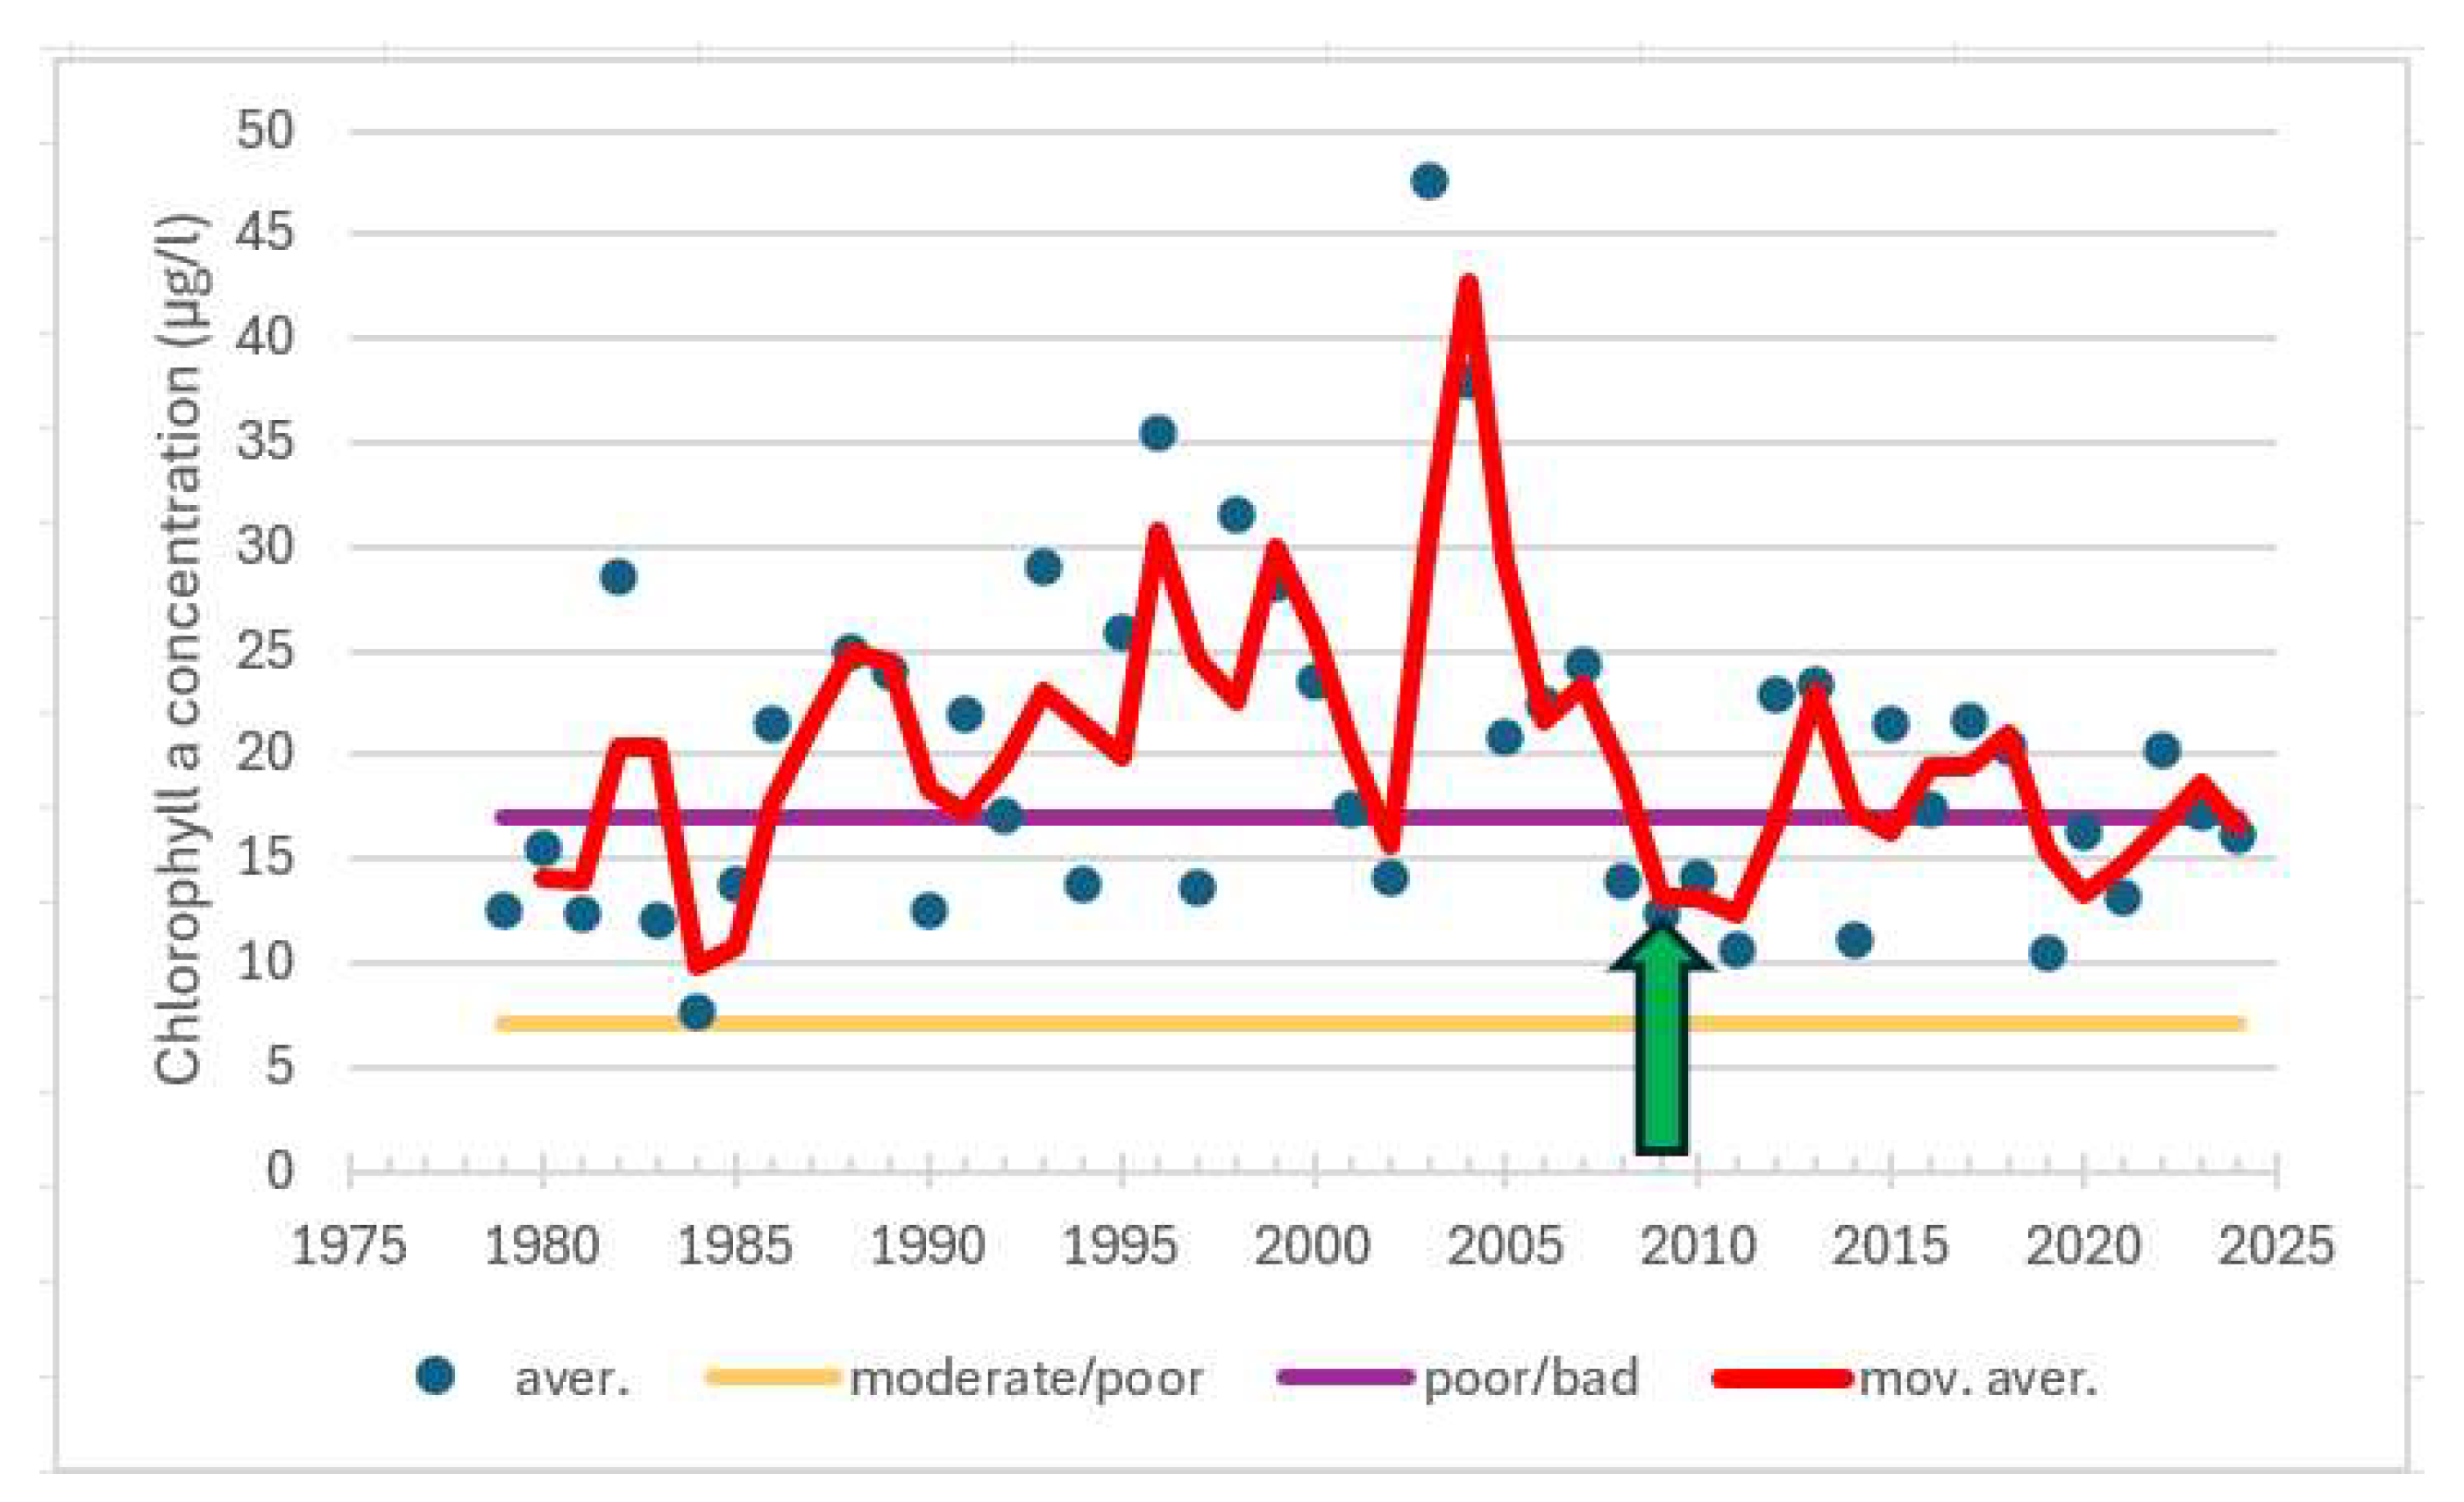
Figure 12.
Ammonium nitrogen (NH4-N) concentrations (µg/l) of surface water in monitoring station Turm 190 during the wintertime (1 January–31 March) from 2000 to 2024. The green arrow indicates the time when Kaarina’s and Raisio’s wastewater began to be directed to Turku’s Kakola treatment plant (2009).

Figure 13.
The concentration of chlorophyll-a (µg/L) in surface water (0–10 m) at observation station Turm 190 during the ecological classification period (1 July–7 September) from 1983 to 2024. The poor status lower threshold (moderate/poor) is 7.0 µg/L and the upper (poor/bad) is 17.0 µg/L. The red line indicates the moving average in the chlorophyll-a concentration over the entire period under review. The green arrow indicates the time when Kaarina’s and Raisio’s wastewater began to be directed to Turku’s Kakola treatment plant (2009).
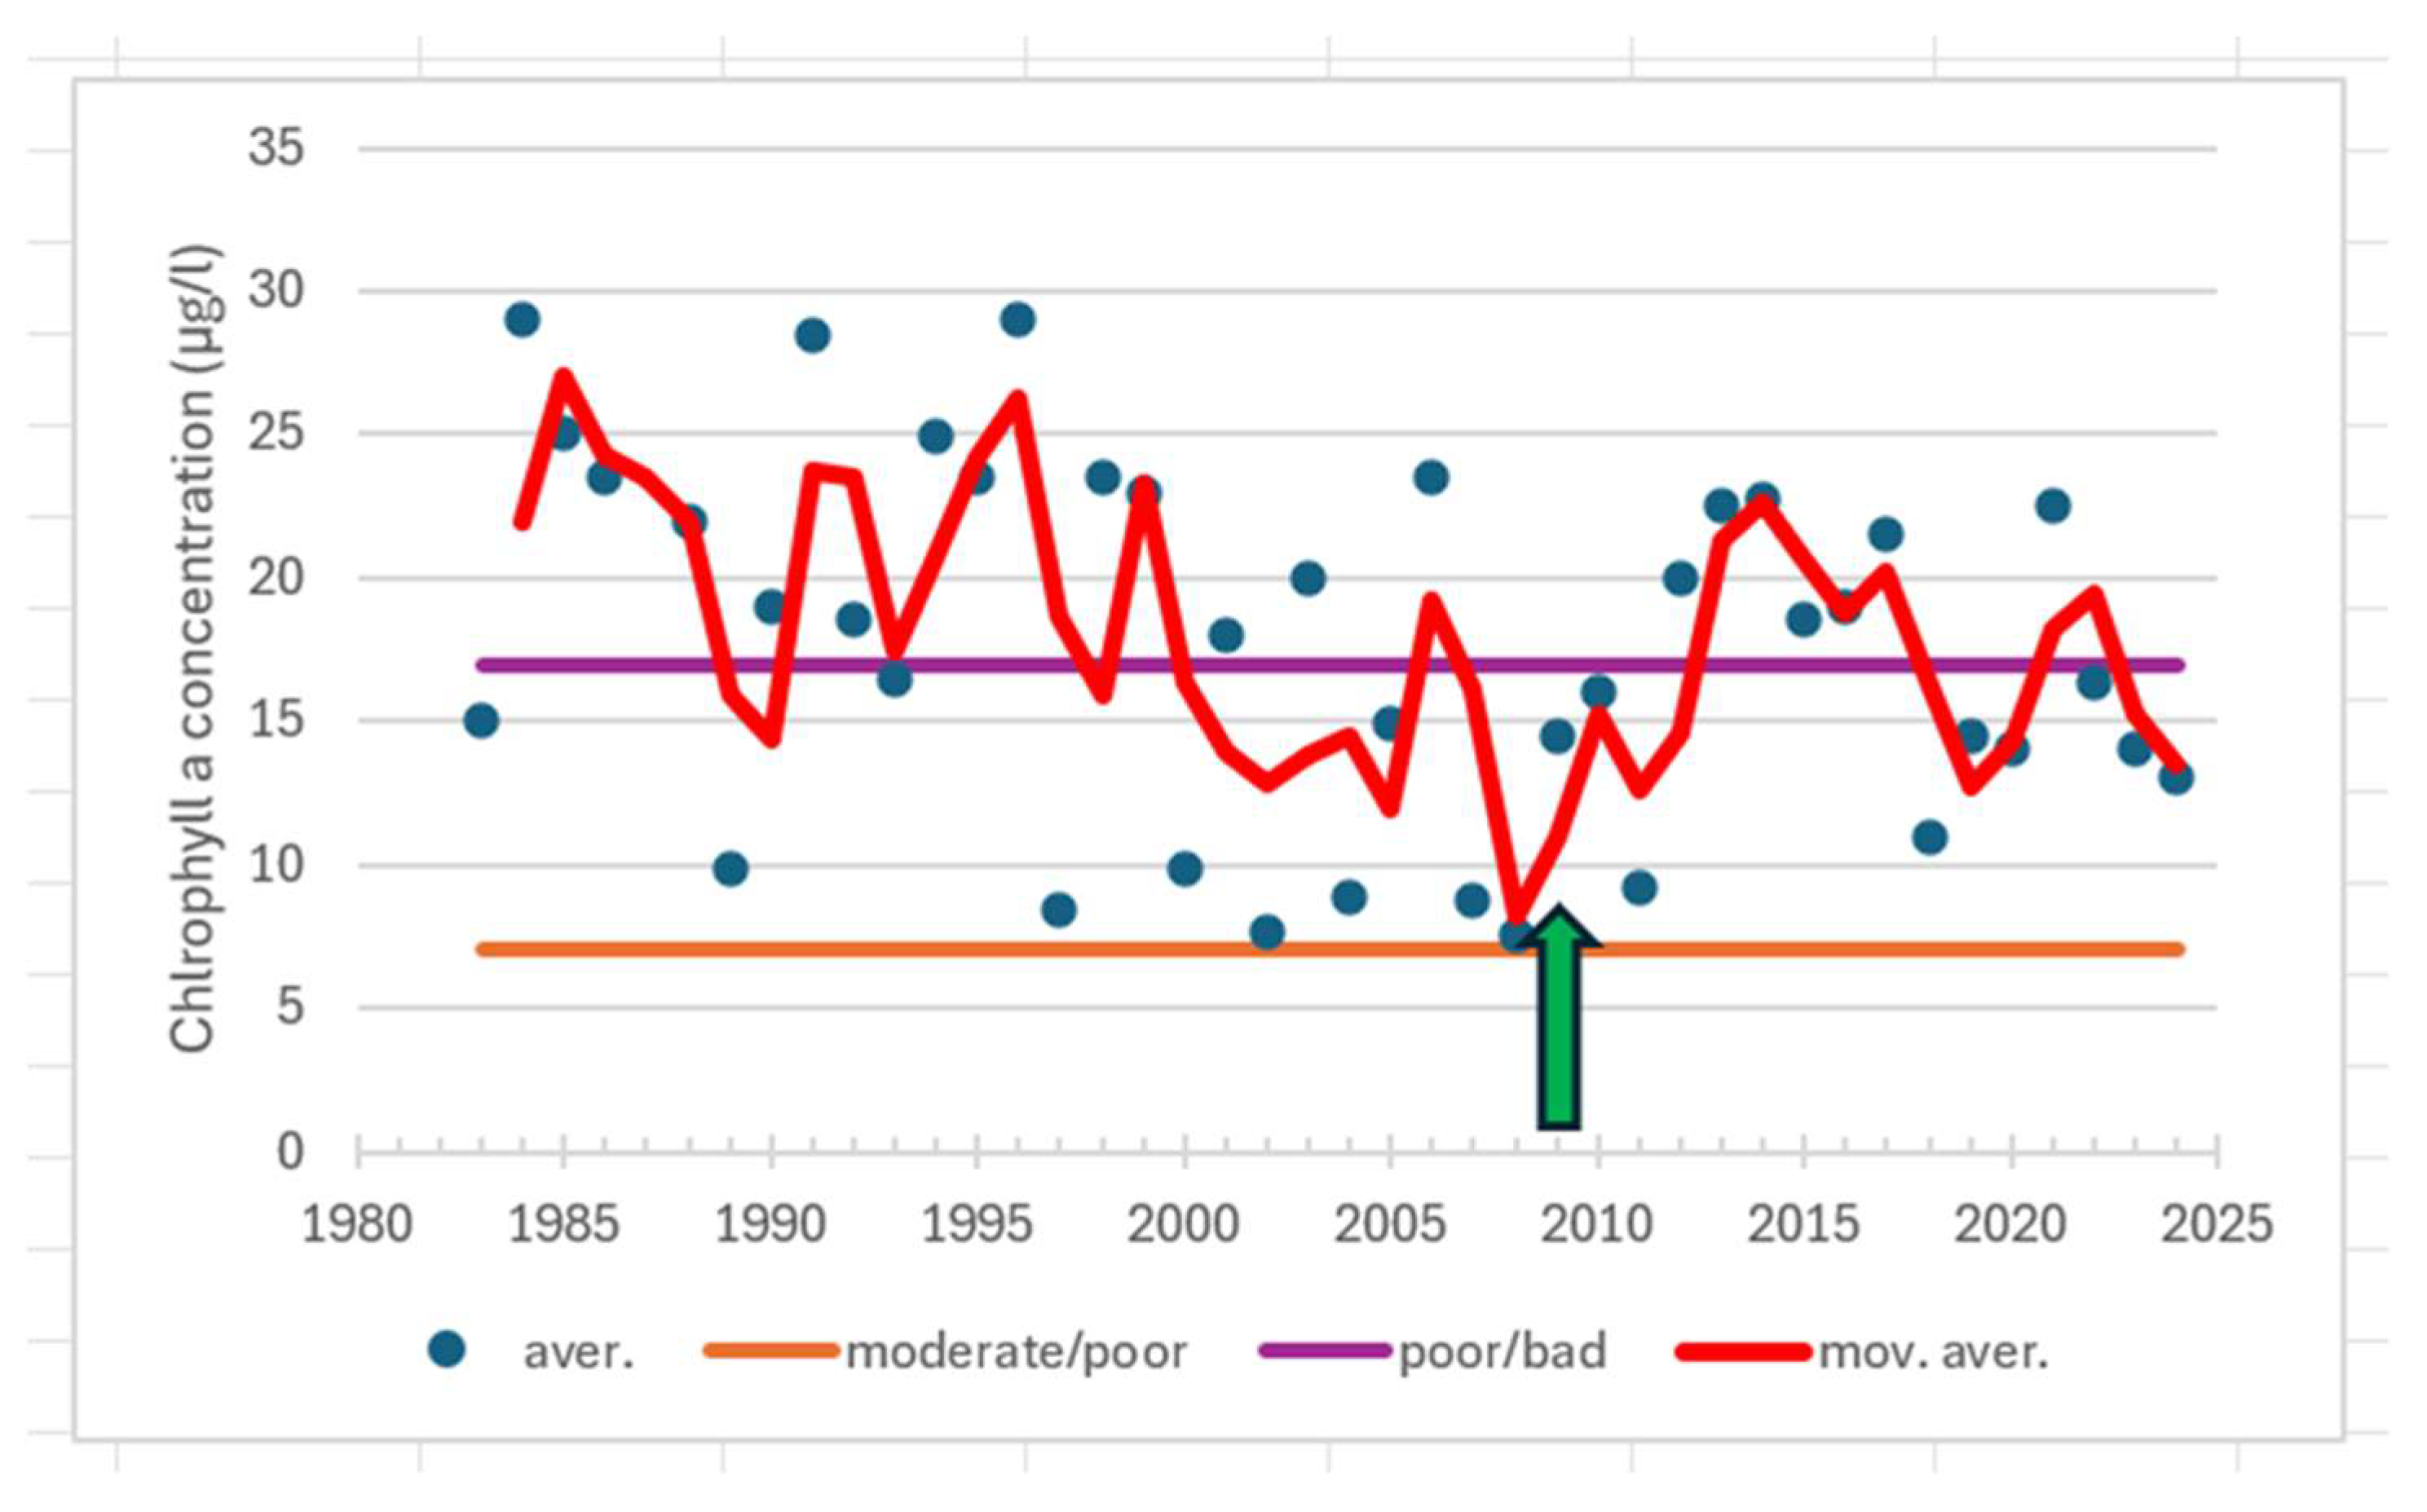
Figure 18.
The wintertime (January 1–March 31) DIN:DIP ratios based on molar concentrations at the Raisio Bay station 260 during 1997-2024. The Redfield ratio 16:1 is marked with a green crossline. The green arrow indicates the time when the wastewater load ceased (2009).
Figure 18.
The wintertime (January 1–March 31) DIN:DIP ratios based on molar concentrations at the Raisio Bay station 260 during 1997-2024. The Redfield ratio 16:1 is marked with a green crossline. The green arrow indicates the time when the wastewater load ceased (2009).
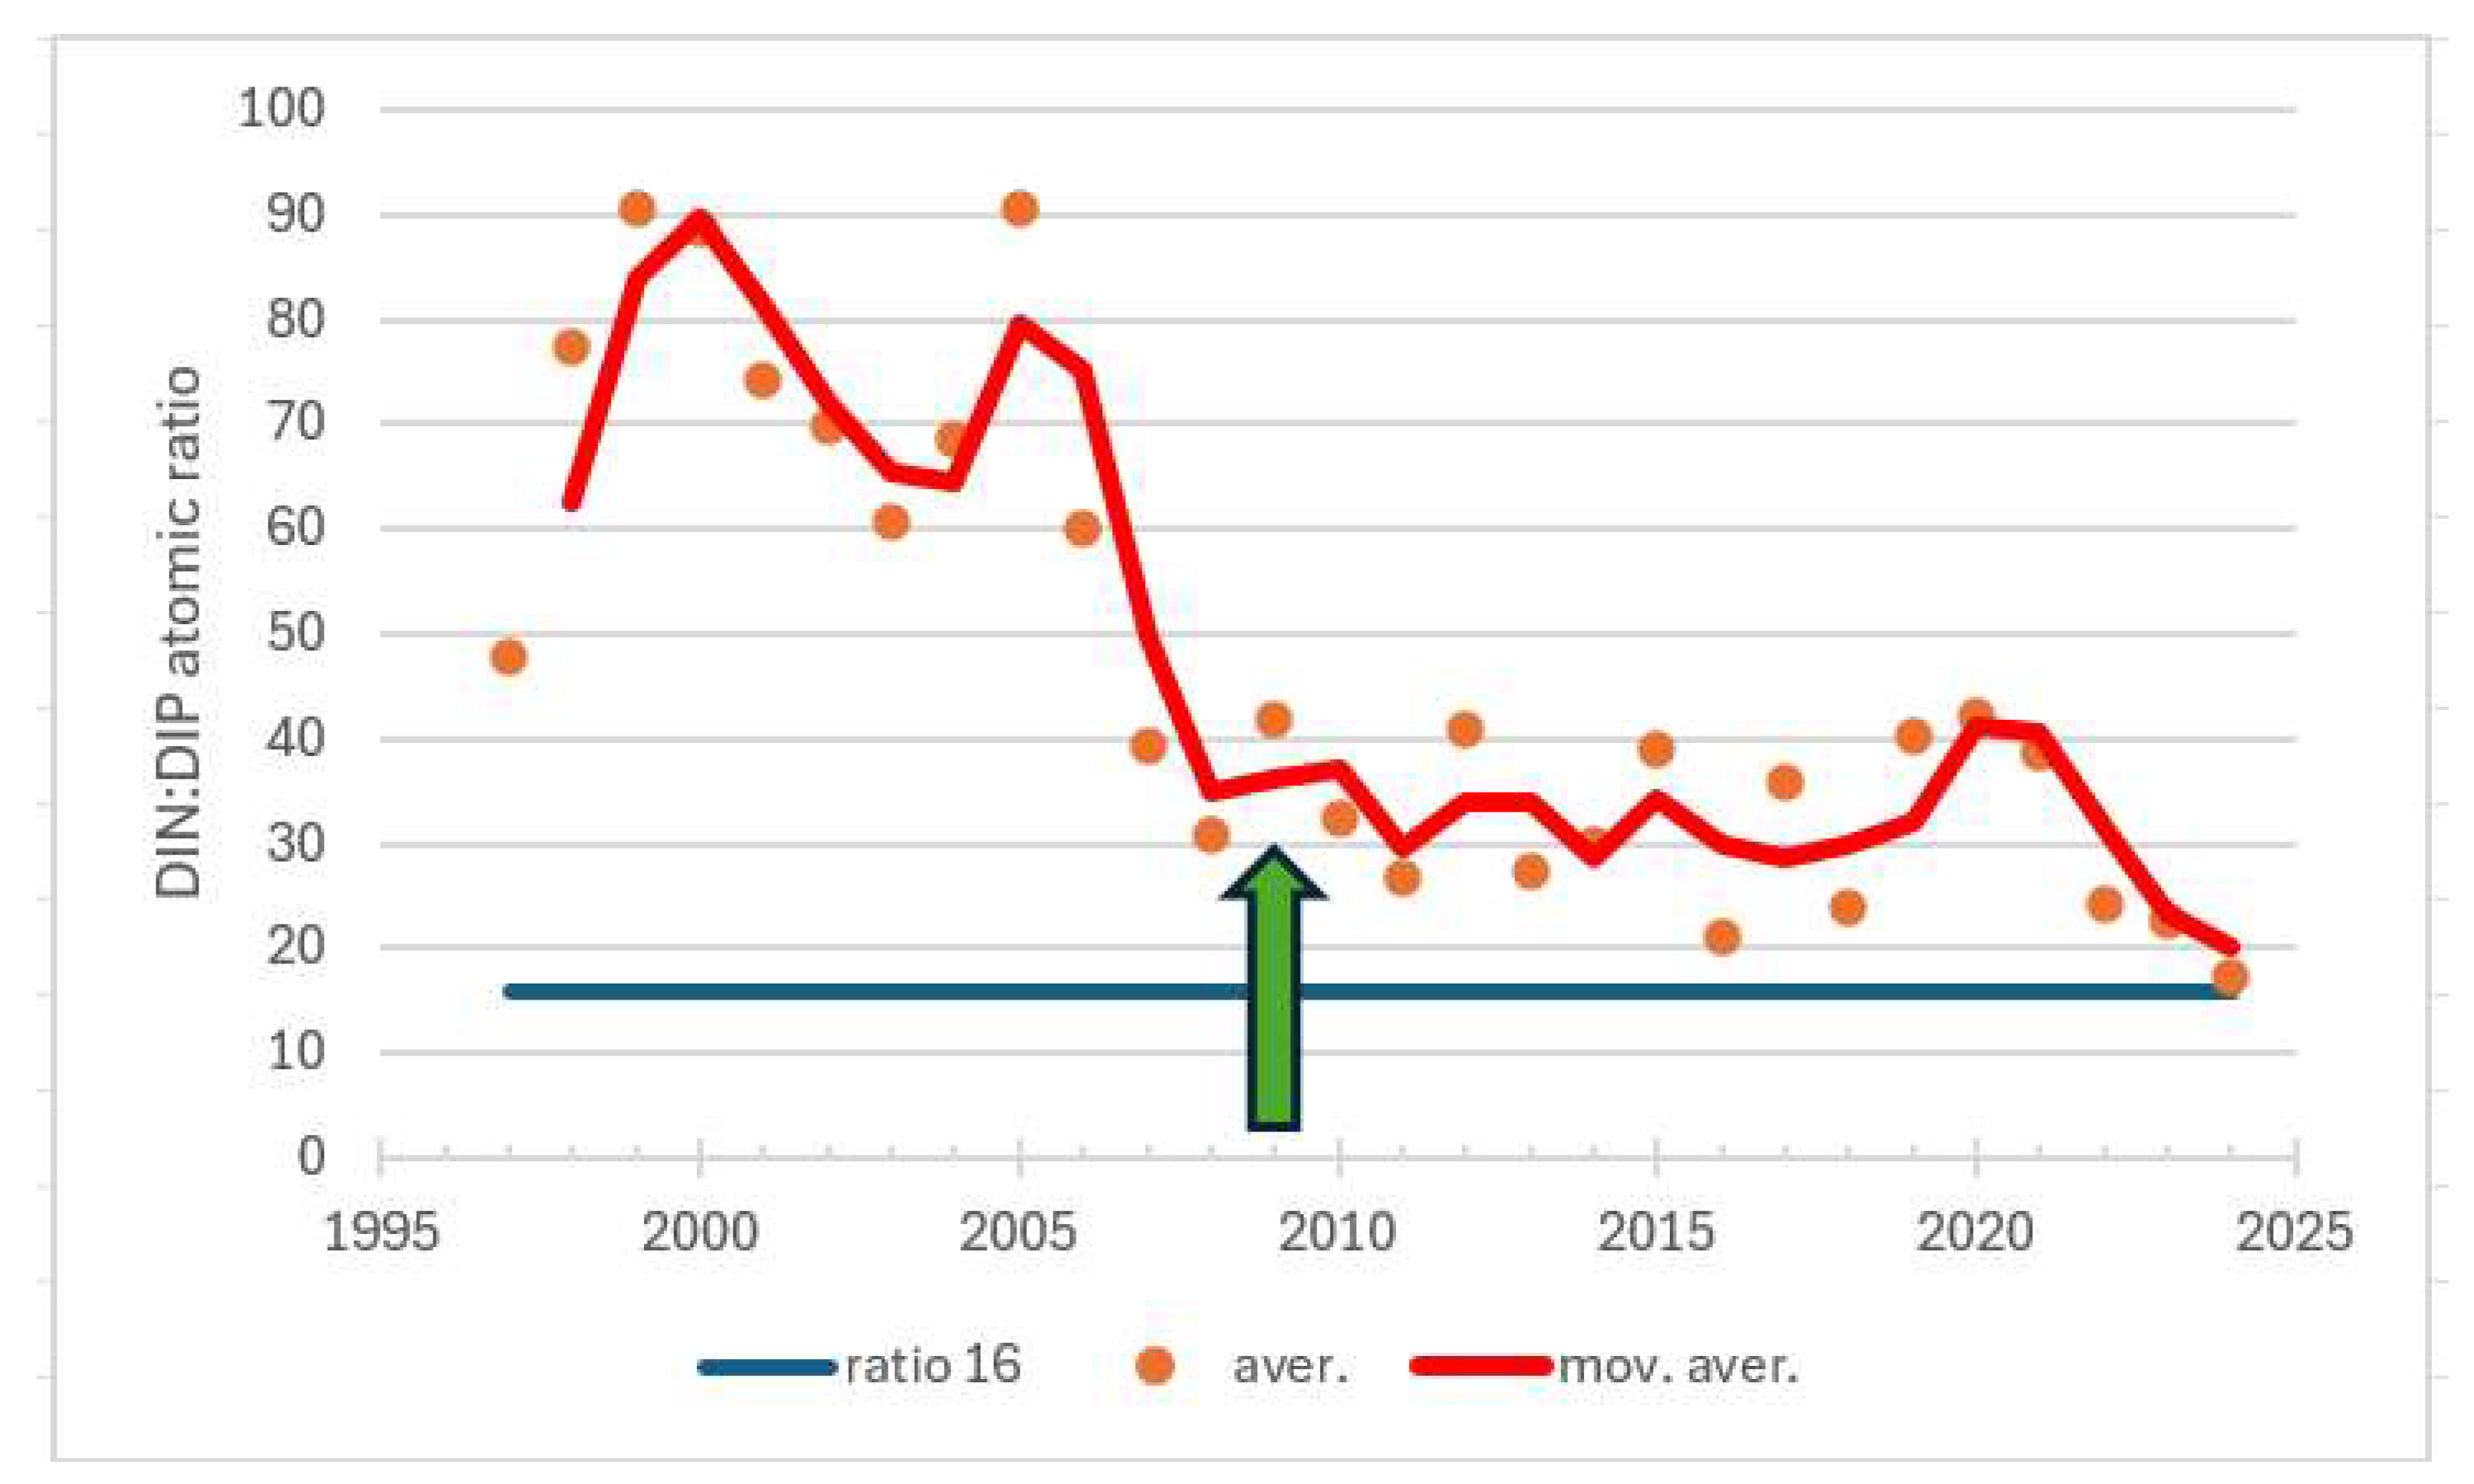
Figure 19.
The wintertime (January 1–March 31) DIN:DIP ratios based on molar concentrations at the Airisto stations 210 and 220 during 1997-2024. The Redfield ratio 16:1 is marked with a green crossline.
Figure 19.
The wintertime (January 1–March 31) DIN:DIP ratios based on molar concentrations at the Airisto stations 210 and 220 during 1997-2024. The Redfield ratio 16:1 is marked with a green crossline.
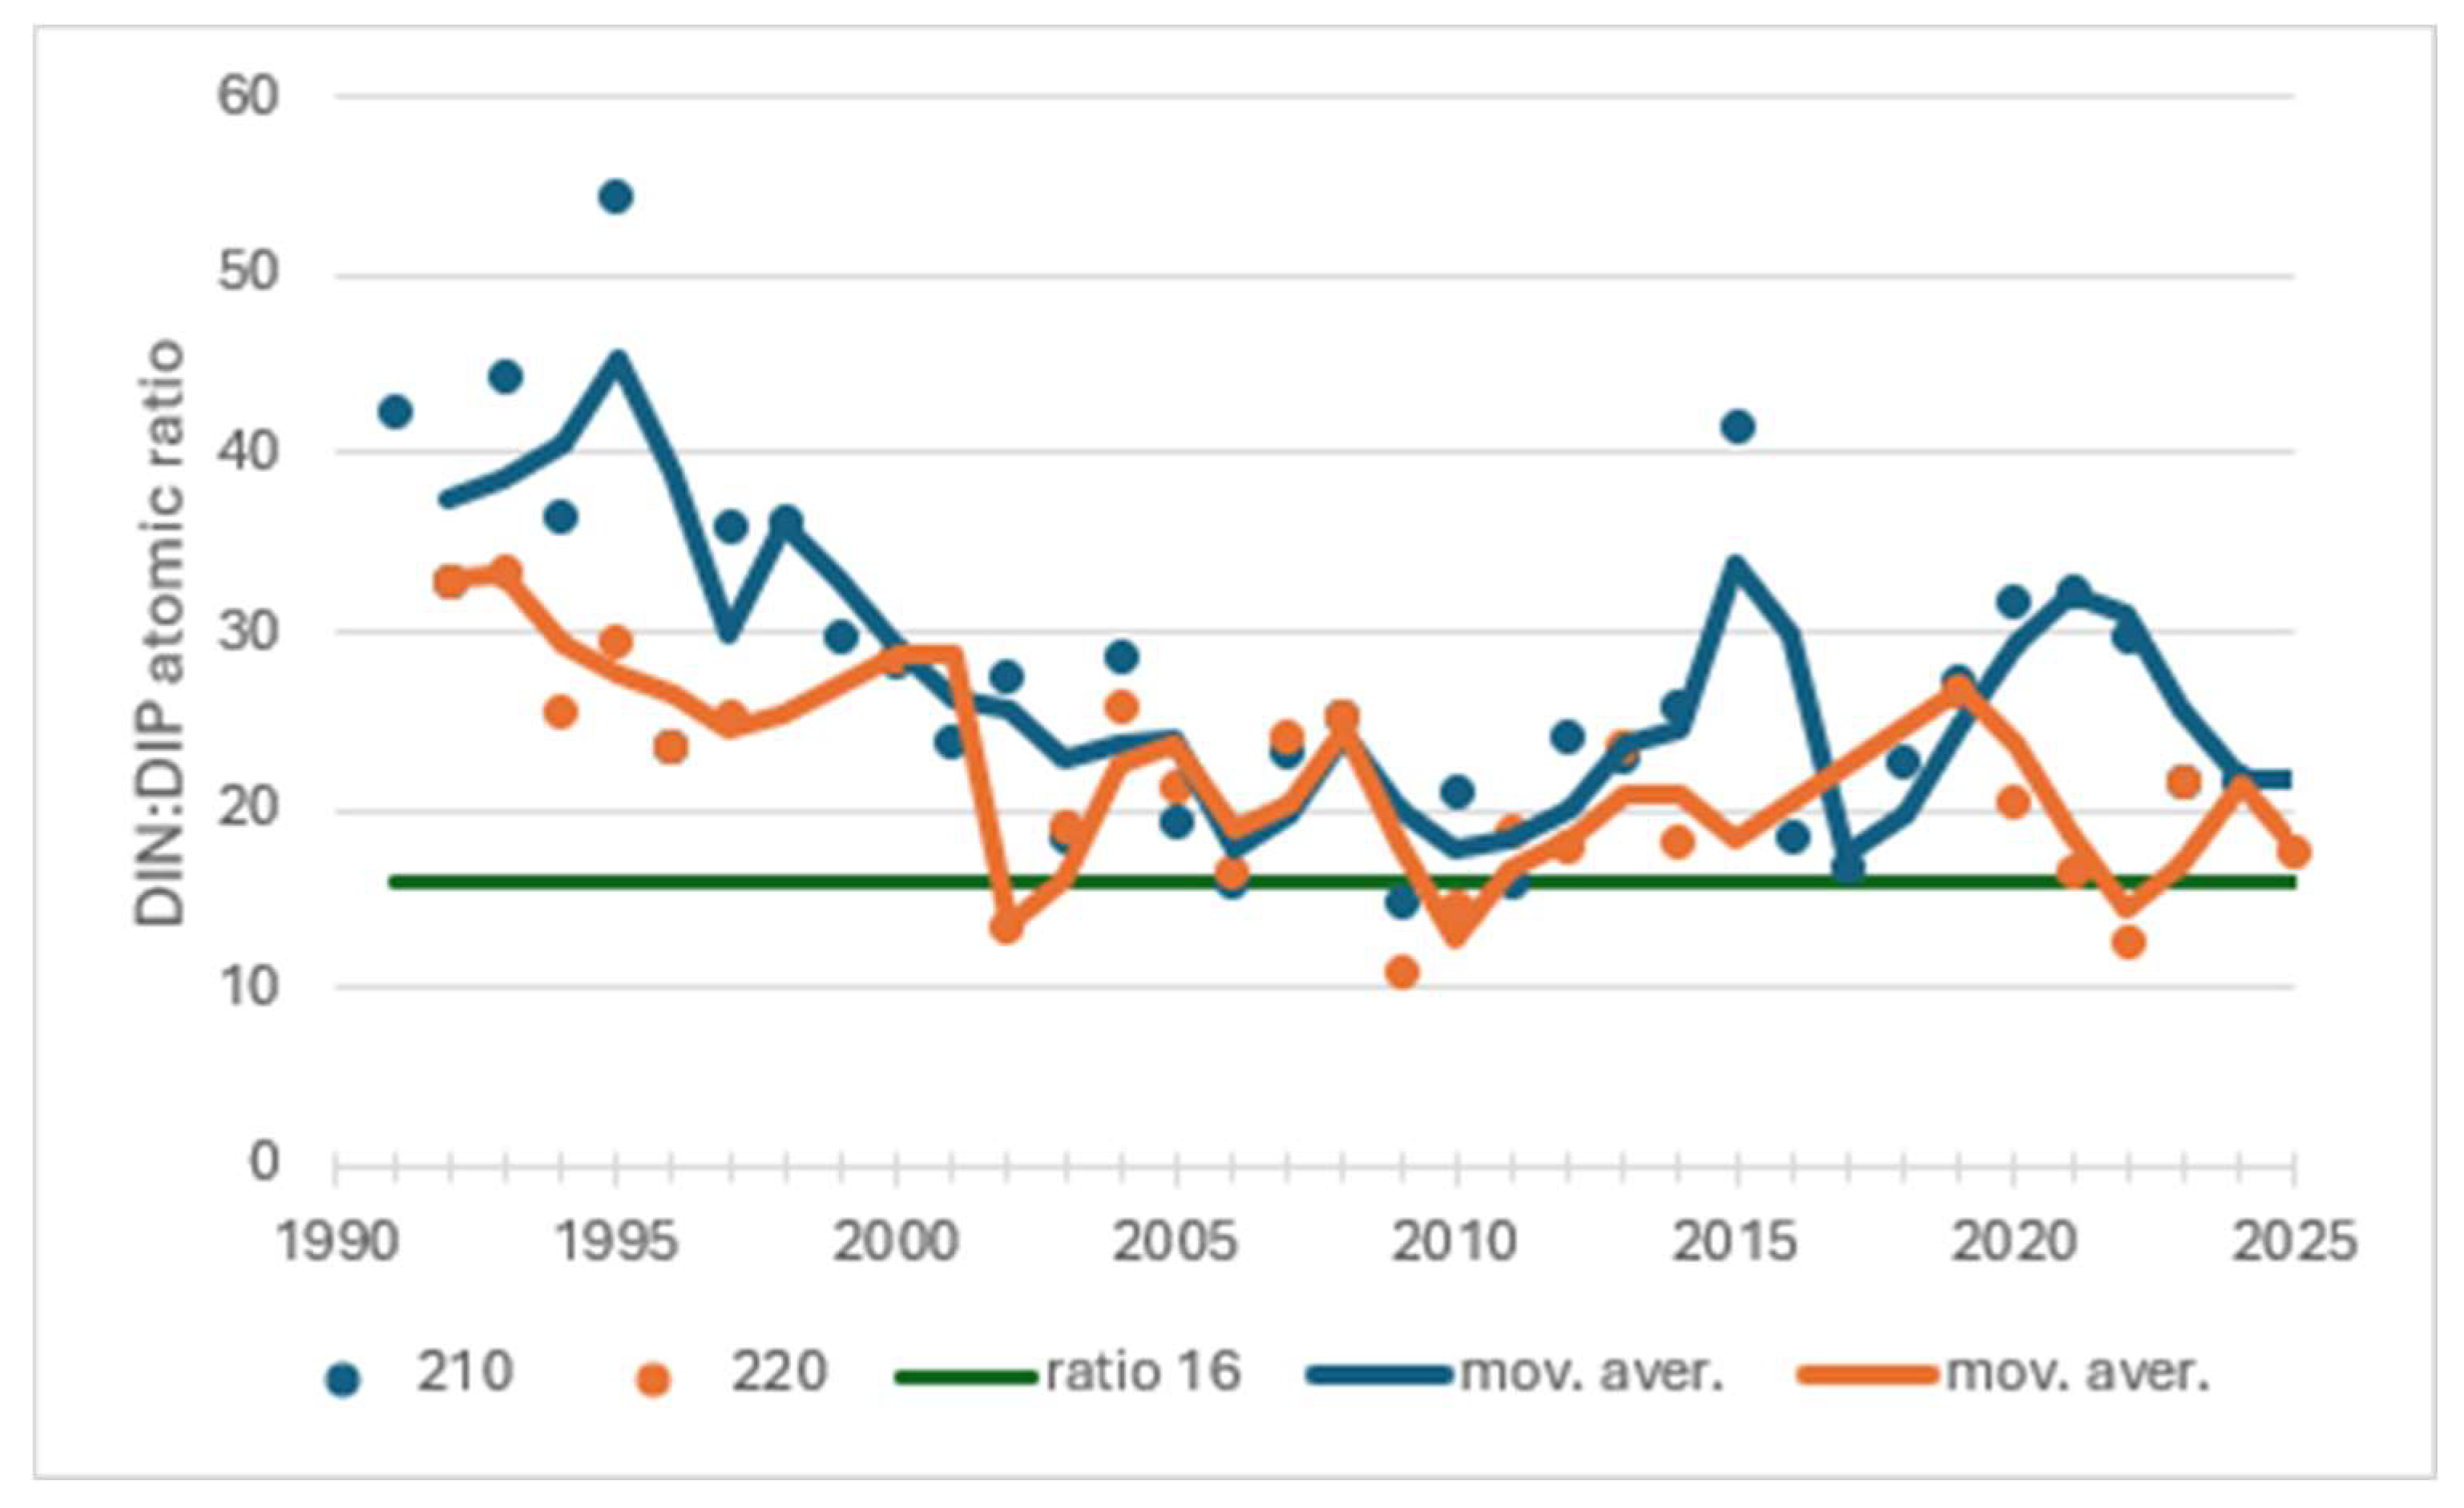
Figure 20.
The wintertime (January 1–March 31) DIN (NH4 + NO23) and DIP concentrations (µg/l) at the Airisto station 210 during 1991-2024.
Figure 20.
The wintertime (January 1–March 31) DIN (NH4 + NO23) and DIP concentrations (µg/l) at the Airisto station 210 during 1991-2024.
Figure 21.
DIN:DIP ratios based on molar concentrations of deep-water layers (over 20 m) in monitoring station Turm 220 during the ecological classification period (1 July–7 September) from 1991 to 2024The Redfield ratio 16:1 is marked with a green crossline.
Figure 21.
DIN:DIP ratios based on molar concentrations of deep-water layers (over 20 m) in monitoring station Turm 220 during the ecological classification period (1 July–7 September) from 1991 to 2024The Redfield ratio 16:1 is marked with a green crossline.
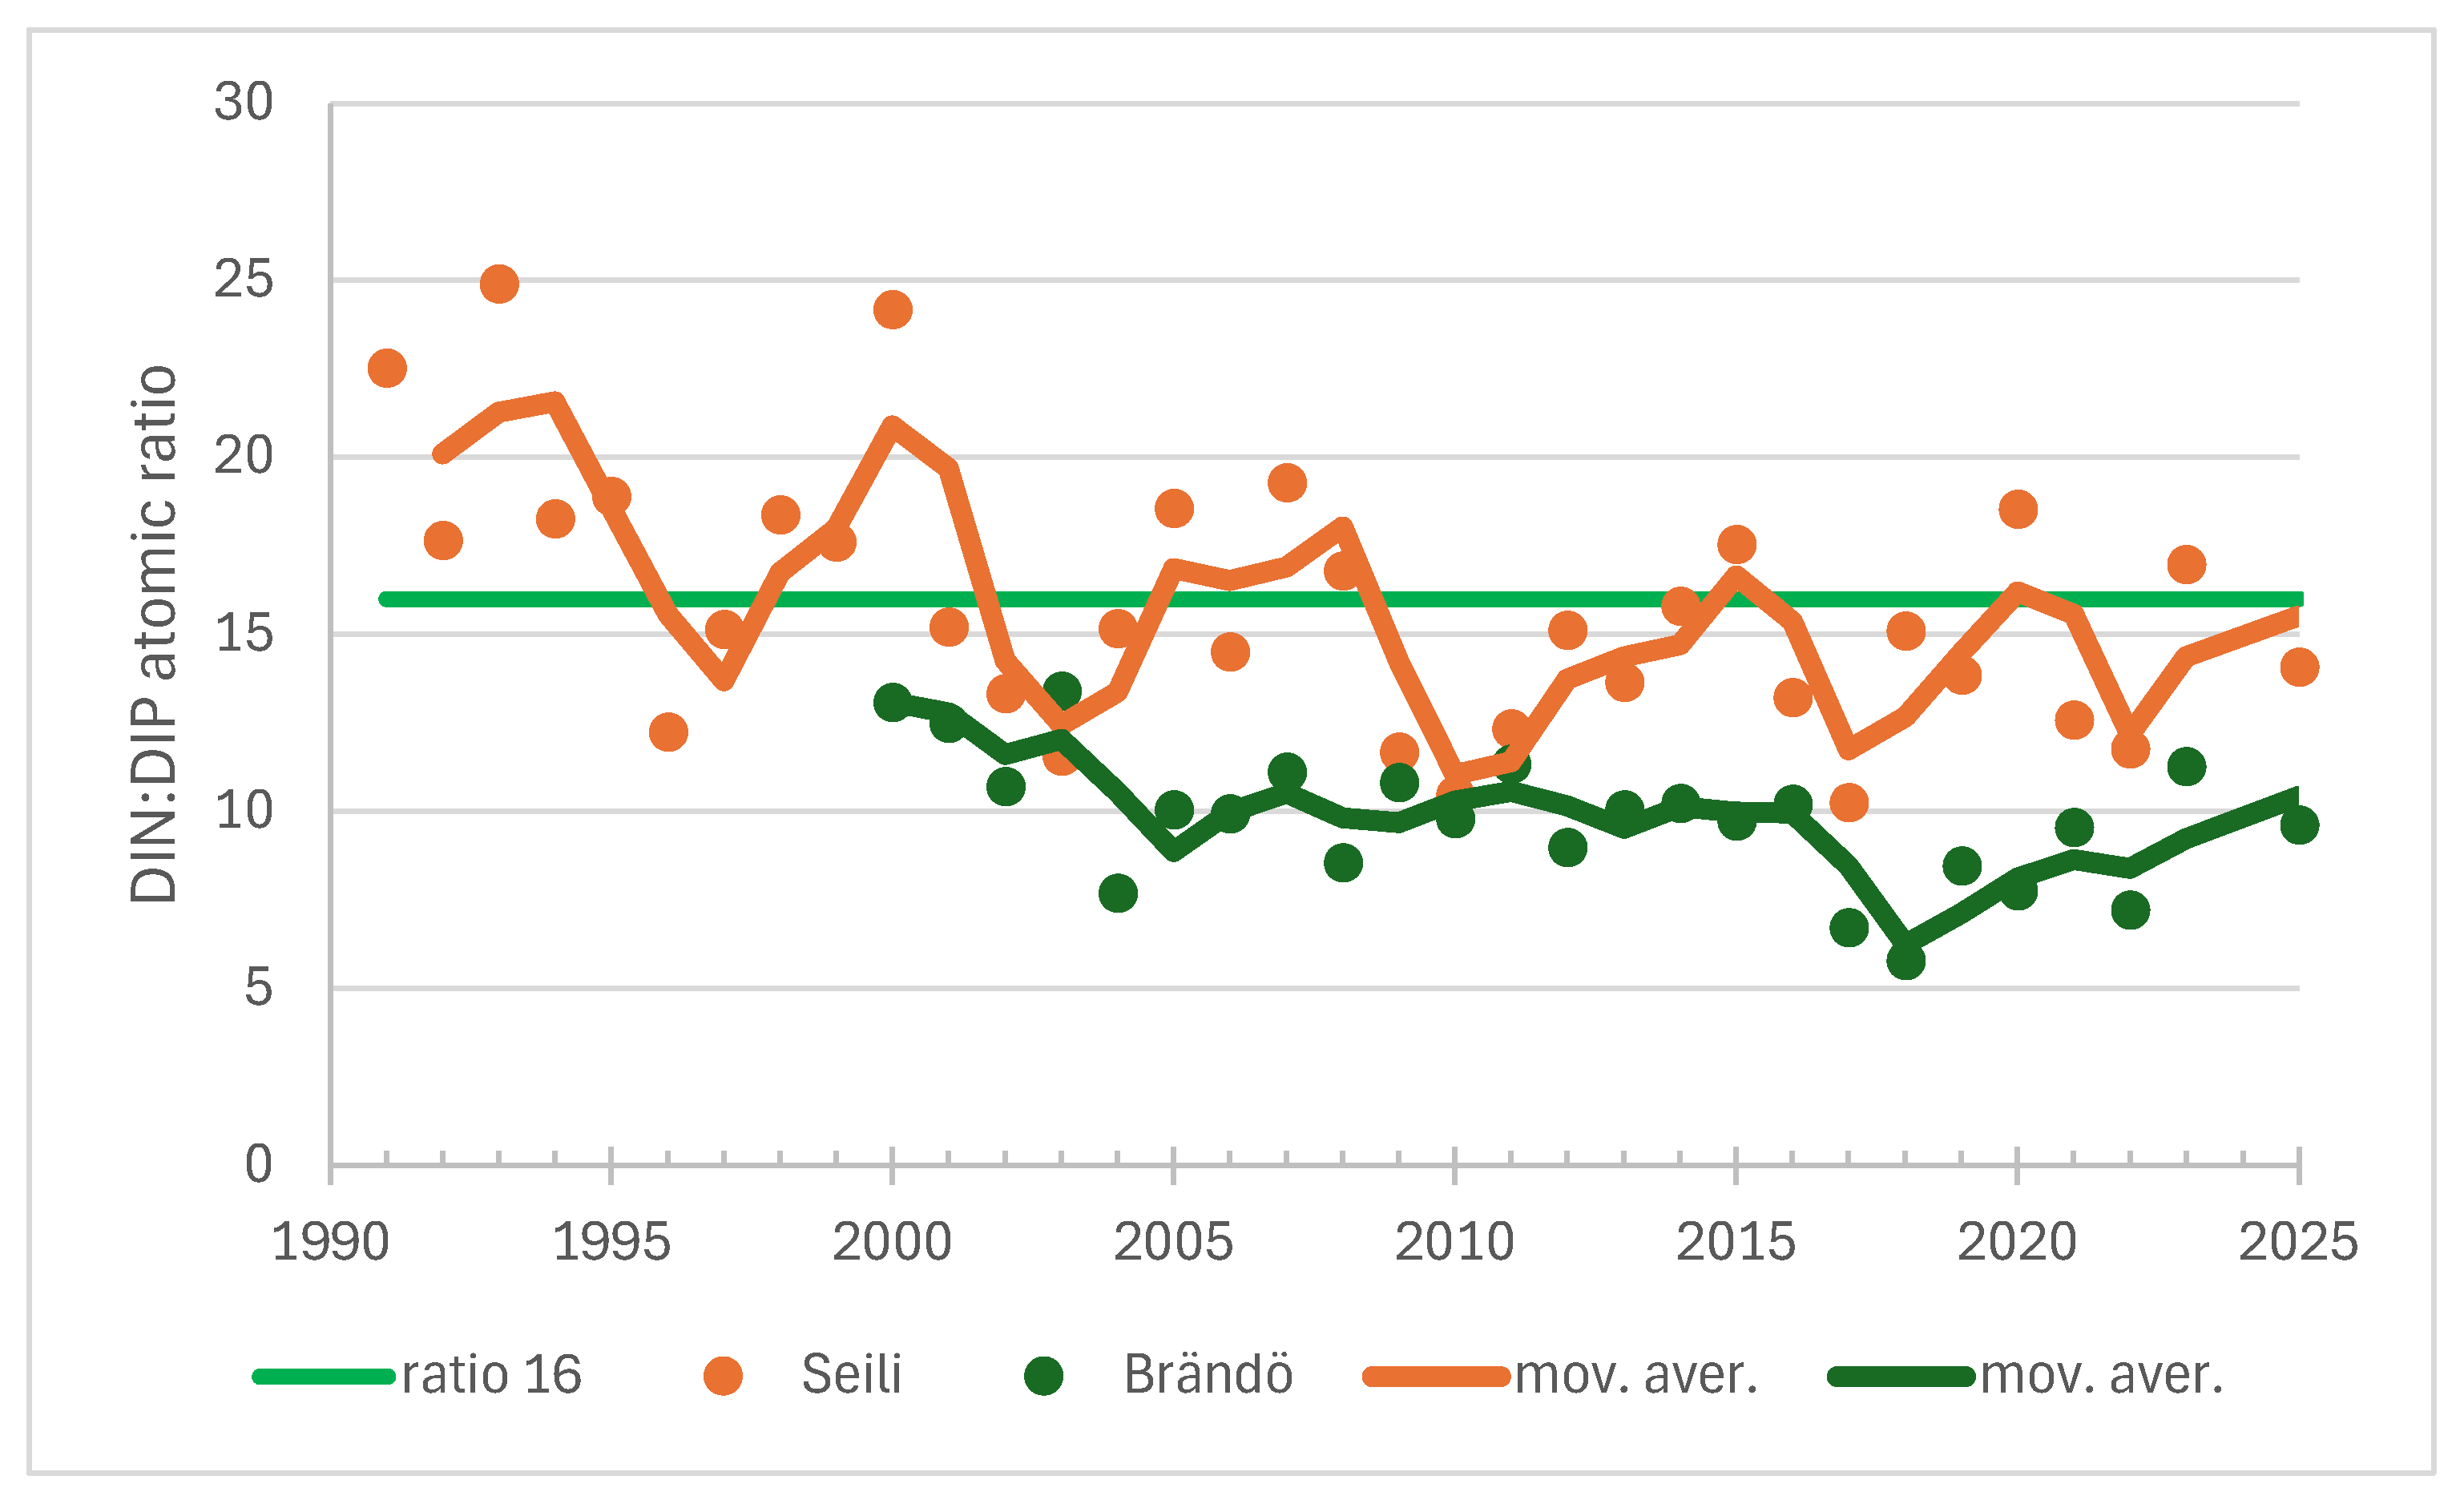
Figure 22.
The wintertime (January 1–March 31) DIN:DIP ratios based on molar concentrations at the Seili and Brändö stations during 1991-2024. The Redfield ratio 16:1 is marked with a green crossline.
Figure 22.
The wintertime (January 1–March 31) DIN:DIP ratios based on molar concentrations at the Seili and Brändö stations during 1991-2024. The Redfield ratio 16:1 is marked with a green crossline.
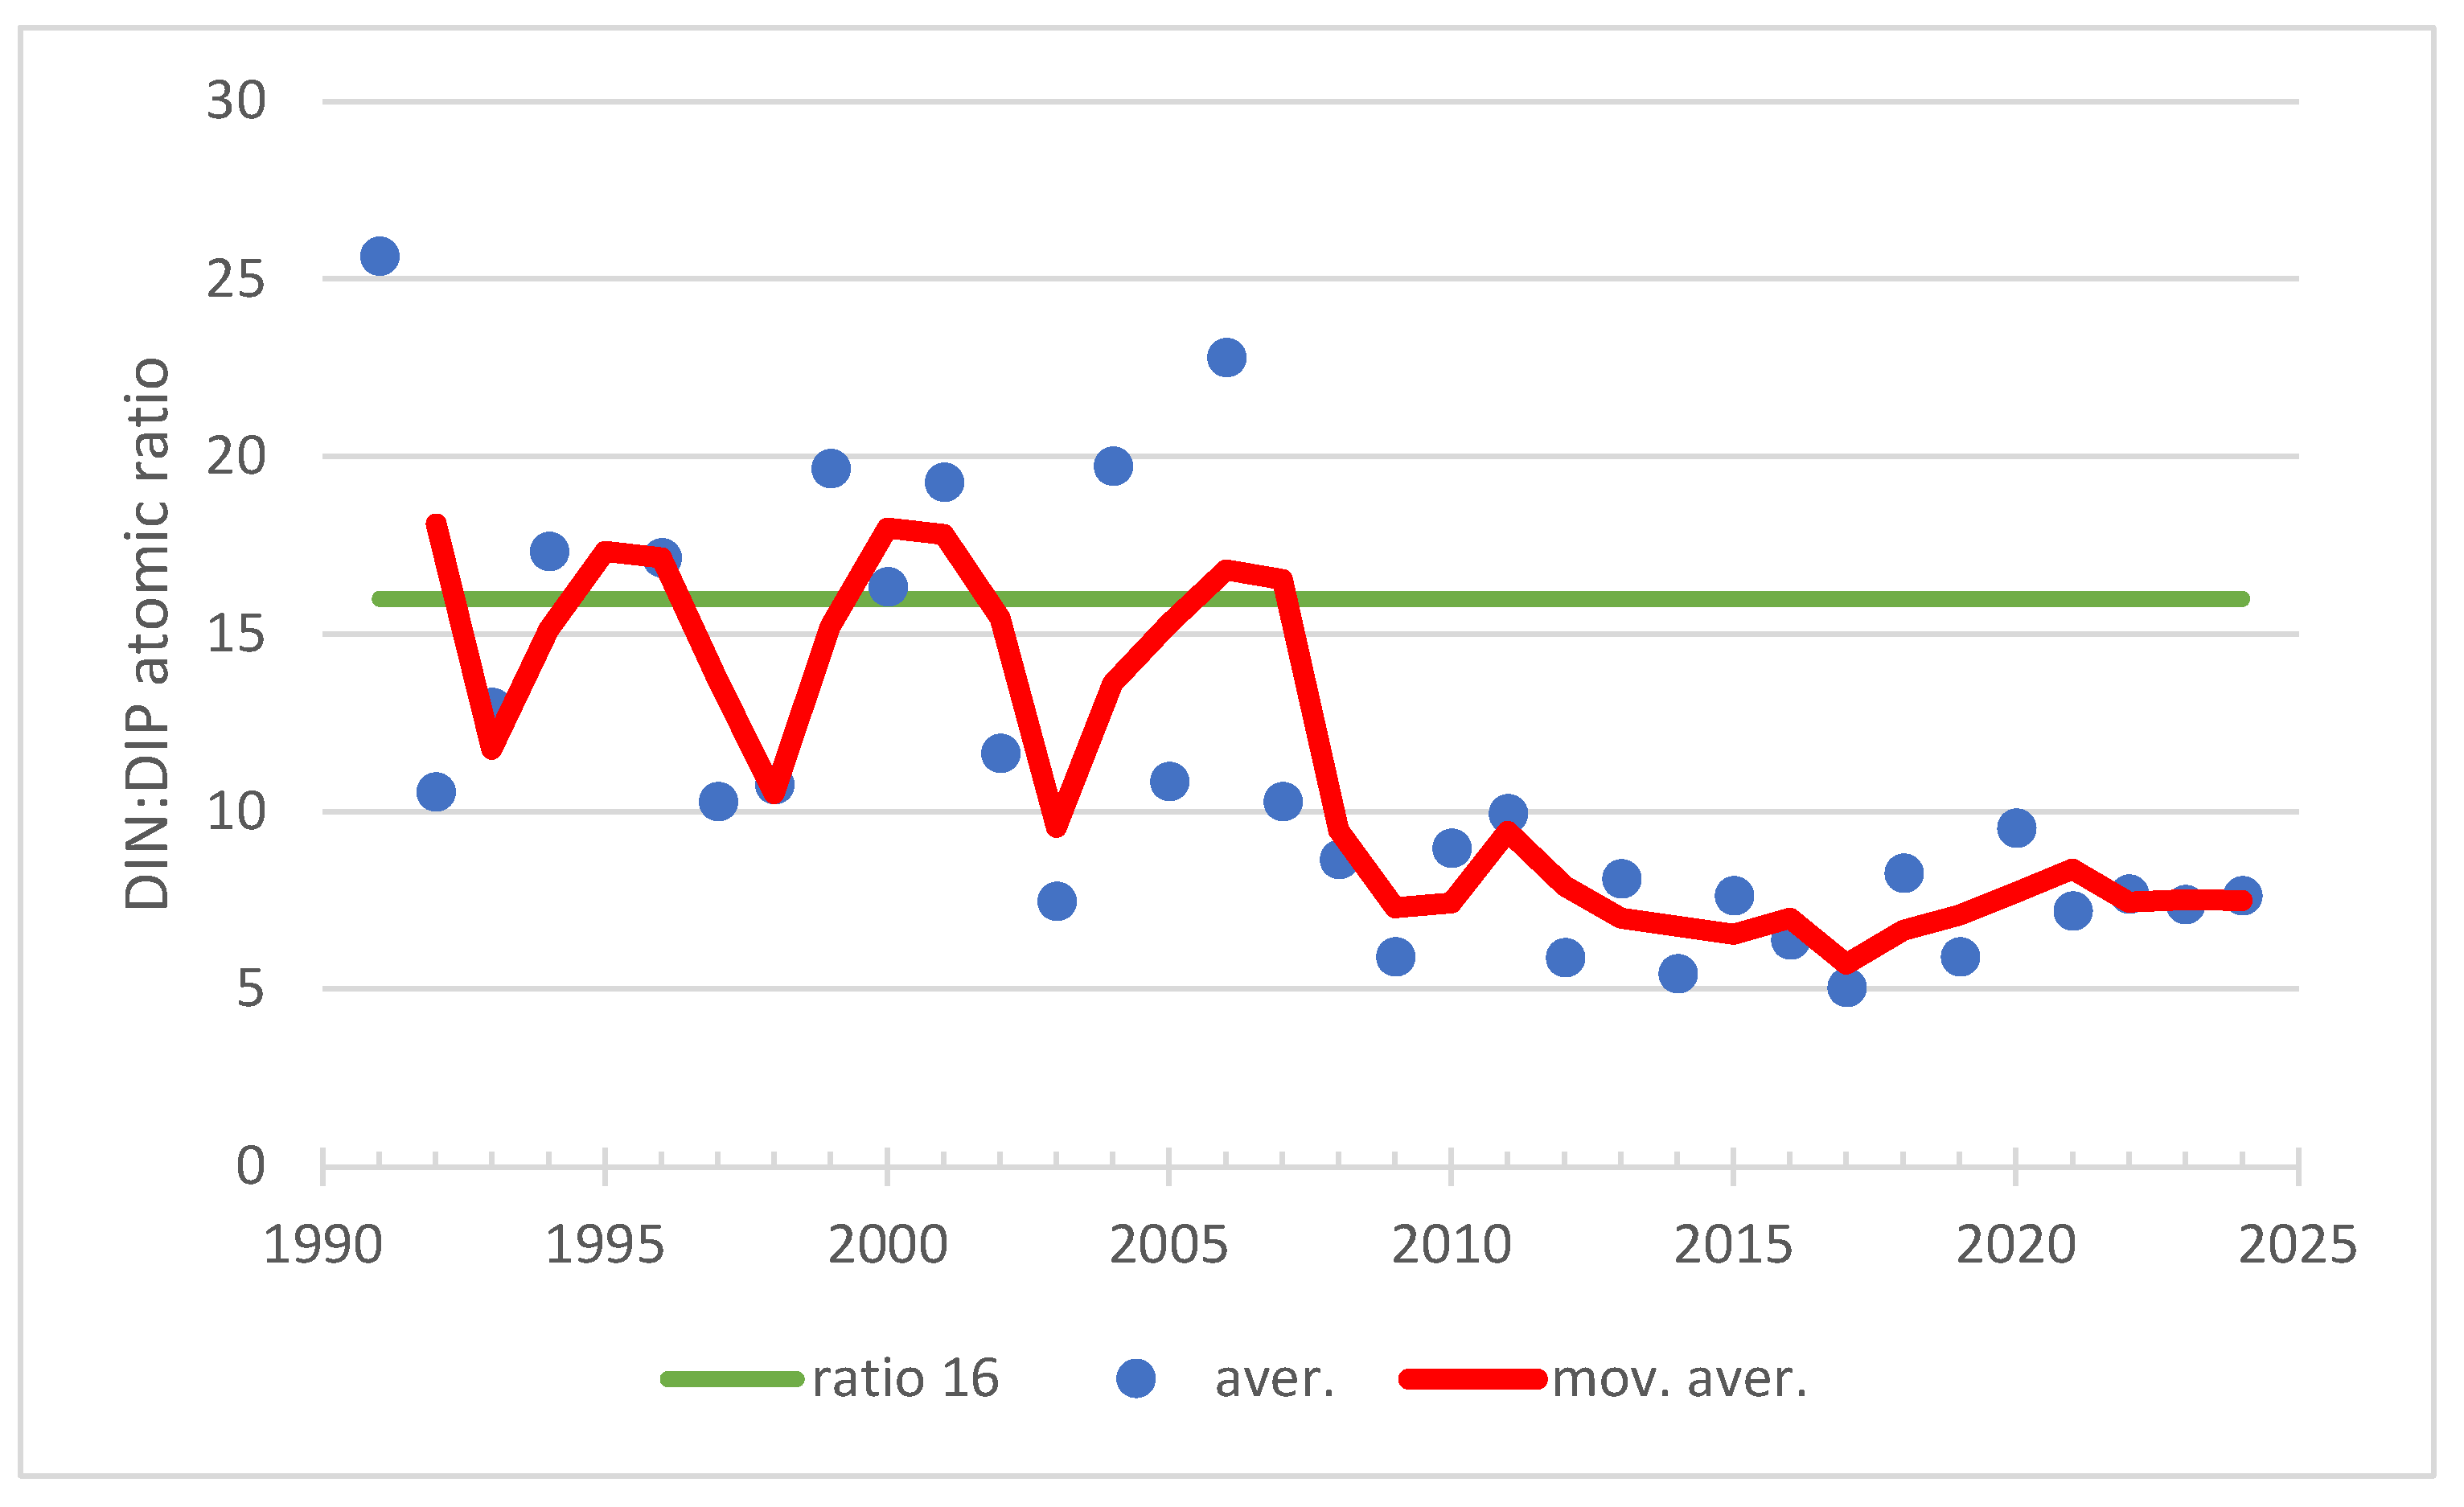
Figure 23.
Cyanophycaeae biomasses (µg/l) in surface water in July-August during 1999-2024 at the Airisto stations 210 and 220.
Figure 23.
Cyanophycaeae biomasses (µg/l) in surface water in July-August during 1999-2024 at the Airisto stations 210 and 220.

Figure 24.
Cyanophycaeae, order Nostocales biomasses (µg/l) in surface water in July-August during 1999-2024 at the Airisto stations 210 and Seili.
Figure 24.
Cyanophycaeae, order Nostocales biomasses (µg/l) in surface water in July-August during 1999-2024 at the Airisto stations 210 and Seili.
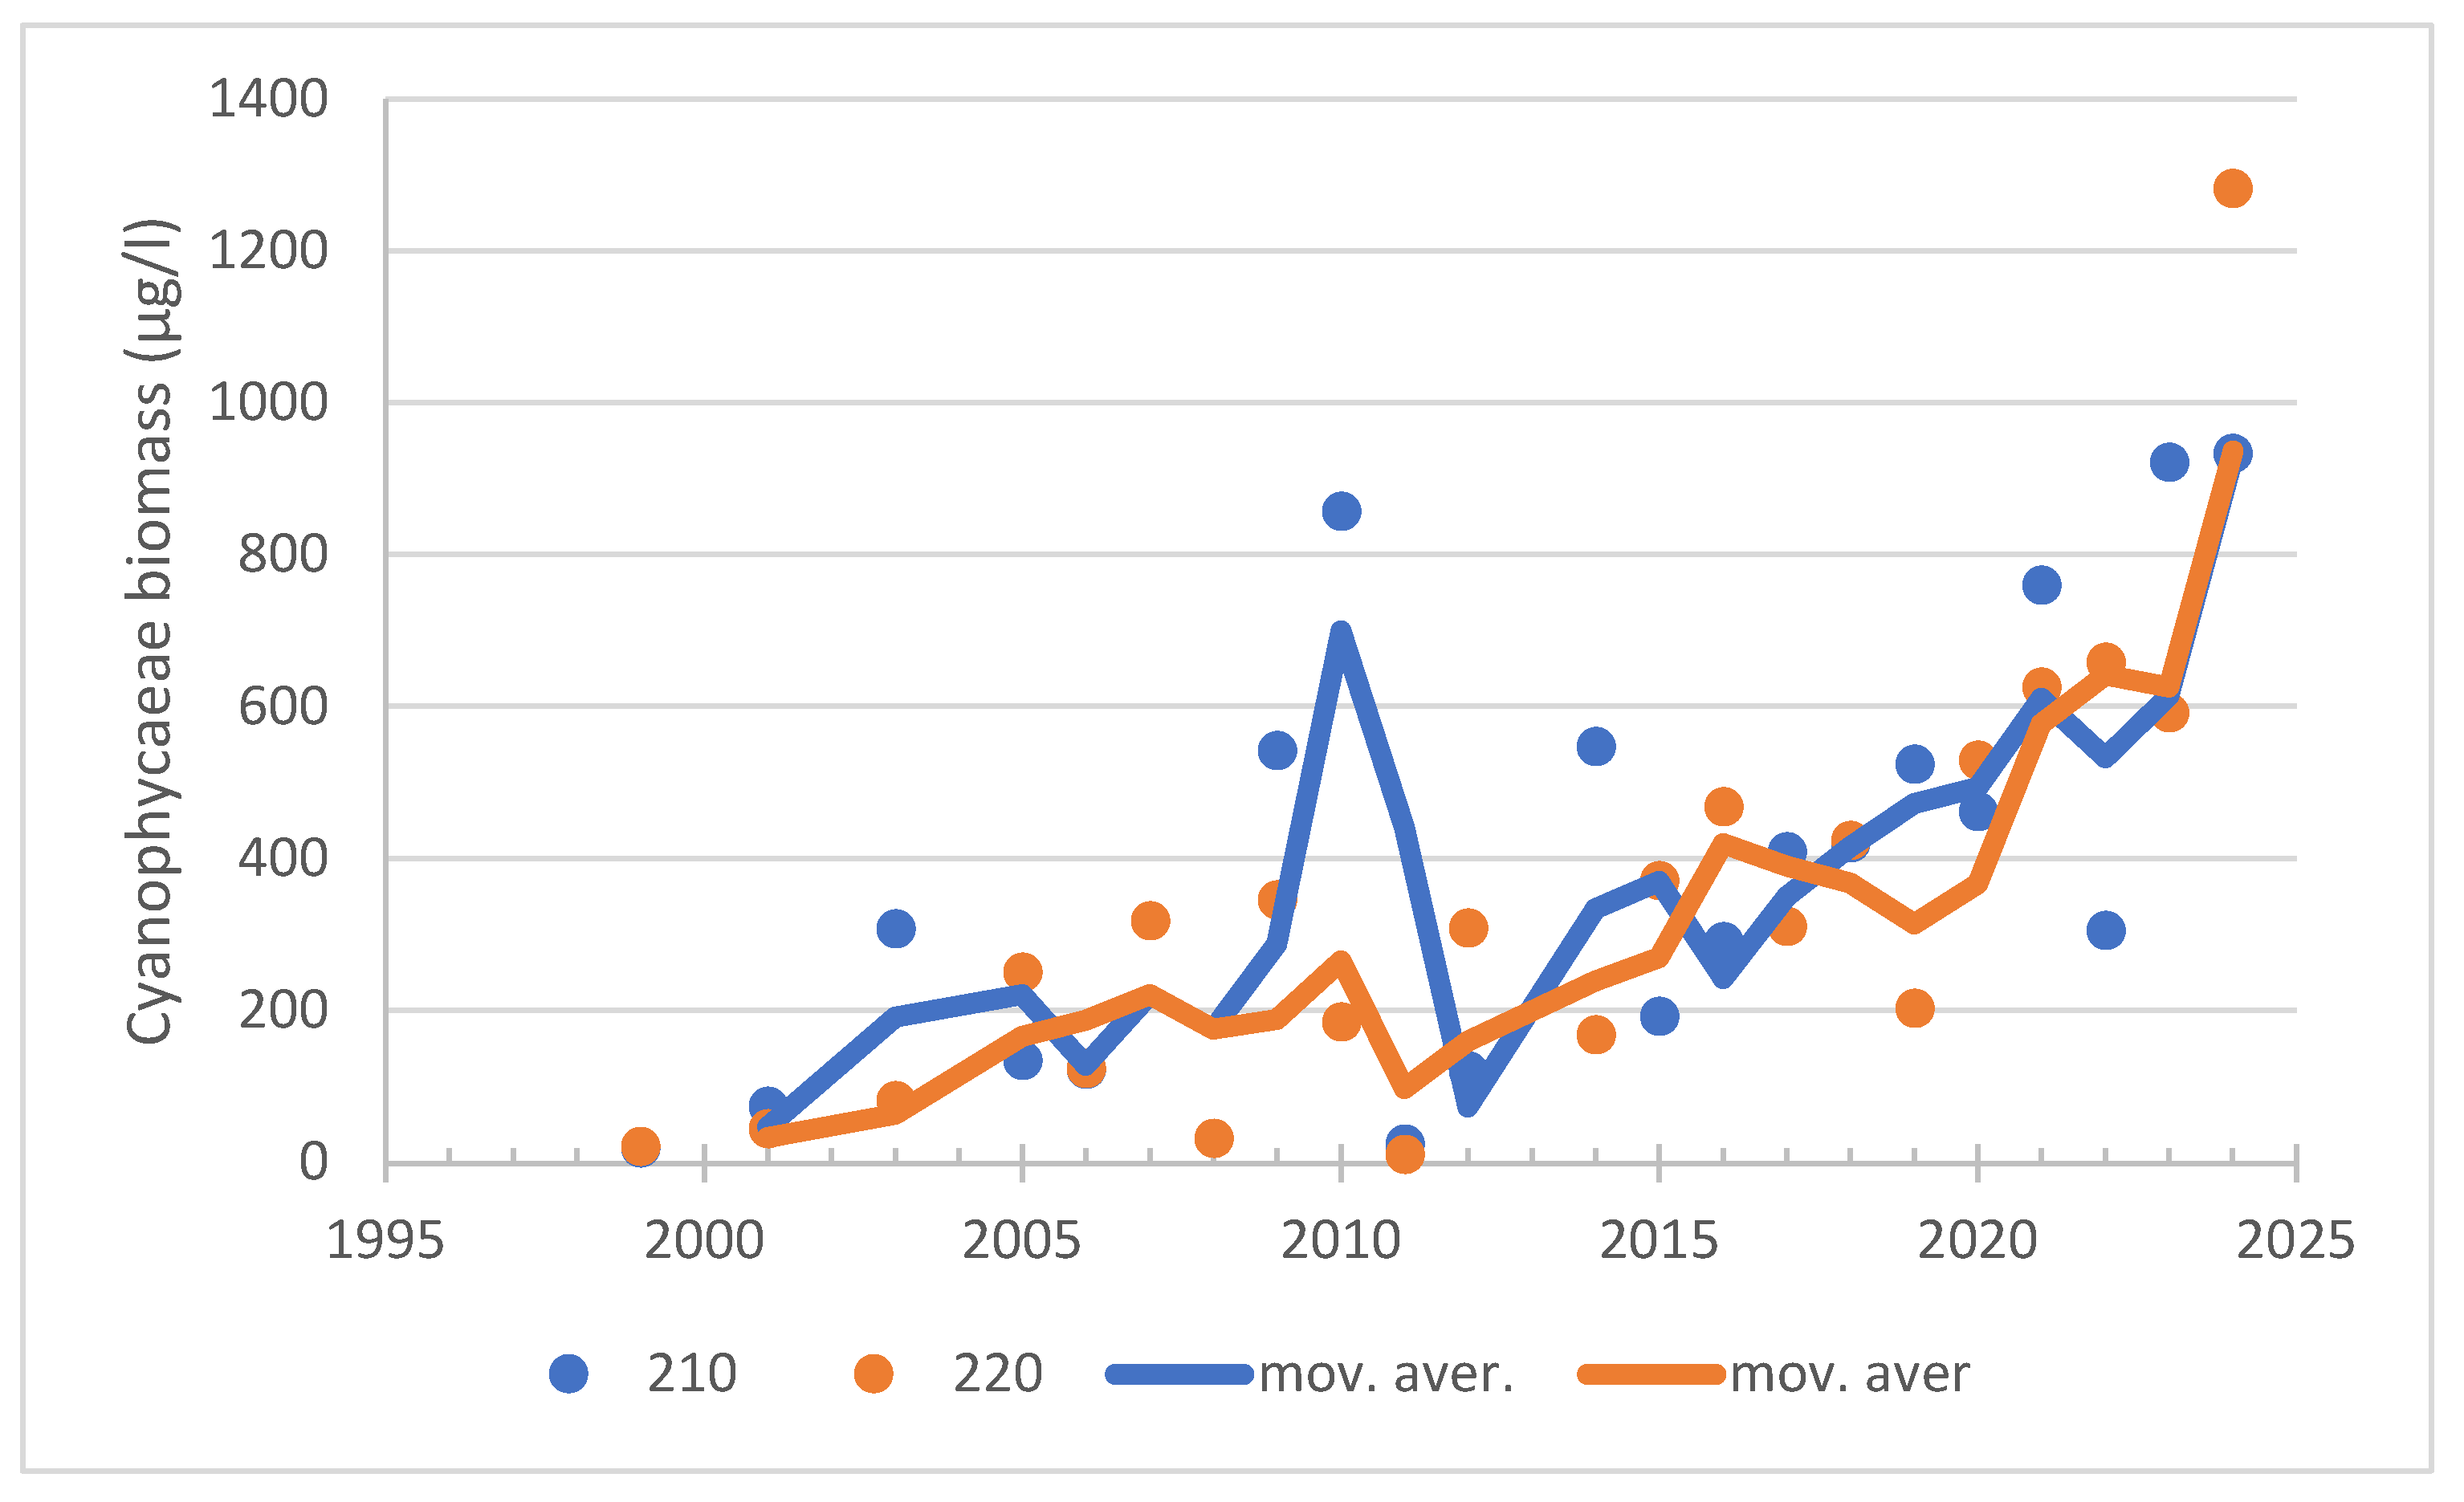
Figure 25.
The statistically significant relationship between total phosphorus concentrations (µg/l) and chlorophyll-a concentrations in the marine area off Turku at 34 monitoring stations during the years 1980–2024.
Figure 25.
The statistically significant relationship between total phosphorus concentrations (µg/l) and chlorophyll-a concentrations in the marine area off Turku at 34 monitoring stations during the years 1980–2024.
Disclaimer/Publisher’s Note: The statements, opinions and data contained in all publications are solely those of the individual author(s) and contributor(s) and not of MDPI and/or the editor(s). MDPI and/or the editor(s) disclaim responsibility for any injury to people or property resulting from any ideas, methods, instructions or products referred to in the content. |
© 2025 by the authors. Licensee MDPI, Basel, Switzerland. This article is an open access article distributed under the terms and conditions of the Creative Commons Attribution (CC BY) license (http://creativecommons.org/licenses/by/4.0/).
Copyright: This open access article is published under a Creative Commons CC BY 4.0 license, which permit the free download, distribution, and reuse, provided that the author and preprint are cited in any reuse.


