
Submitted:
05 March 2025
Posted:
06 March 2025
You are already at the latest version
Abstract
Natural surfaces offer valuable insights into the mechanisms of hydrophobicity. Characterizing these surfaces through the contact angle of droplets provides a direct quantification. The widely used but debated Cassie-Baxter model attempts to relate contact angle with surface topography and liquid wetting properties. Surface tension establishes an initial chemical affinity in wetting, and surface roughness is known to enhance hydrophobicity. However, research lacks standardized metrics to explain how topography influences this behavior. In this study, we introduce a new model for droplet balance that complements the Cassie-Baxter model by considering the latest research findings on the significant effect of the triple line on droplet contact angle. We characterized the surfaces of accessible leaves using ISO standard roughness parameters, contact angle measurements, and surface topography analysis through confocal microscopy. Statistical screening of roughness parameters identified those with high correlation to contact angle model parameters, enabling the quantification of the effect of standard metrics of surface topography on contact angle through the model. Our results provide an enriched contact angle model that incorporates parameters capable of linking contact angle with the assessment of surface topography measured through engineering metrics, paving the way to emulate natural hydrophobicity on engineered surfaces.
Keywords:
contact angles
; cassie-baxter model
; surface roughness
; plant surfaces
; leaf roughness
; triple line
; design of hydrophobic surfaces
; adhesion
1. Introduction
The diverse behavior or interaction of liquids and solids in surface wetting is a property of interest for functional reasons in engineered surfaces [1,2] that can be observed in nature, both in animals and plants [3,4,5,6,7]. Water is an essential element in our environment, so hydrophobic or hydrophilic surfaces are of prevalent interest for natural observation and engineering creation. Their spread on the surface characterizes the wetting of liquids. The contact angle of small droplets on the surface evaluates the wetting capability of the liquid on the surface [8]. Contact angle quantification of a small droplet on a surface was initially formulated by Young [9] through its equation that establishes the balance at the boundary of solid, liquid, and air of a liquid droplet on a solid surface. Surface tension (force by length unit), as the work necessary to separate from contact the interphases of solid-liquid (σsl), solid-vapor in equilibrium with liquid vapor (σsl), and liquid (σl) must be balanced, in particular at the triple boundary of the droplet. The Young equation relates the cosine of the contact angle (θY) and the surface tensions by (1).
The mechanical equilibrium expressed by (9) includes an ideal three-phase system partially wet by the liquid on a rigid, smooth surface, in a chemically homogeneous, nonreactive system. While Young's formula is dated in the XIX century, later in the XX century, it was also deduced from the minimization of the surface energy to create those surfaces [10], and the reason to consider the contact angle as a thermodynamic property of systems in equilibrium. Beyond this static theoretical equilibrium (static and stable), the observation of significant variability of maximum and minimum values (beyond measurement uncertainty) of contact angle for the same liquid and surface introduced the need to consider the hysteresis of contact angles. The maximum CA is associated with the advance of the droplet and the minimum with the receding angle, which also reflects the angle in the separation of the drop from the surface. Even when only the ad-vance and receding angles are the consistent ones for experimental reproduction, very often the static or equilibrium angles are reported as an average of maximum and minimum [11], so they are considered a second order effect in the main wetting behaviour.
The energy necessary to create a surface by separating two phases in contact introduces the work of adhesion (Wsl) of inmiscible phases as an alternative explanation mechanism of the liquid droplet balance on a solid surface. The Dupré expression (2) establishes the algebraic surface energy addition at the triple phase, which represents the work necessary to separate both phases.
Equations (1) and (2) can be combined in the so-called Young-Dupré equation (3) that expresses the work of adhesion (Wsl) in relationship with the contact angle (θY). Note that (3) includes the hypothesis of the ideal smooth surface of Young's contact angle expression, but also the mechanical balance of surface tension at the triple line together with the energy balance for surface creation by Dupré.
Equation (3) has been ordinarily used to indirectly measure the adhesion energy of a liquid on a surface through the observed contact angle. While this expression has been deduced from the ideal smooth surface inherent to Young's original equation, recent research has experimentally proved the essential relationship of (3) between the observed contact angle on real surfaces and the measures of work of adhesion [12]. In between the work of adhesion and the contact angle (dimensionless), we find the liquid tension (σl) (by length) or energy (by surface) that links each other. Note that surface tension includes its associated vectorial nature as a force that can be used in static configurations for balance evaluation. Meanwhile, the energy approach is a scalar that requires considering the thermodynamic balance around equilibrium, so small displacements in compatible directions from the stable state should return to the equilibrium state and give evidence to the surface energy.
The direct measurement of interfacial tension (γs ) or the equivalent surface energy (γs) of a solid cannot be obtained directly, so indirect methods have been proposed, in particular, those based on the CA measurement with different liquids' interaction on the solid surface [13]. The component of the surface energy include dispersive (γsd) and non-dispersive interactions (γsnd), and in the case of liquids of higher surface energy than solid (the fact that they don’t wet them is a starting point to presume it) and with neglectable film pressure on the solid (water on wax would be a case of application), Fowkes [14] developed a direct relationship between the Young’s contact angle and the dispersive forces of the solid and liquid (4).
Later, equation (4) was completed by other researchers to include the non-dispersive forces and even the acid-base interactions [13]. To reach a precise quantification of surface energy, the use of 2 or 3 liquids facilitates the components quantification of dispersive, non-dispersive or acid-base, based on the resolution of 2 or 3 equations.
The contact angle included in equations (1),(3) and (4) is the Young angle, but it was observed that the roughness of the surface modifies the measured contact angle of small water droplets, where the weight influence is negligable for water under about 2 mm and the shape spherical with good aproximation [15]. The influence of the roughness has been formulated through two main models by Wenzel and Cassie- Baxter (CB).
Wenzel’s model [16] proposes a proportional relationship between the cosine apparent observed angle and the cosine of Young’s angle (5). The roughness factor (r) is the ratio of the true surface area of contact to its projection; as it was perfectly smooth, r is higher than the unit. The hypothesis of application includes the penetration of the liquid inside the valleys in a homogeneous wet surface. Roughness facilitates wetting, and the boserved contact angle (θ) is higher than Young’s angle (θY). Wenzel’s equation is an approximation when capillary effects that could appear in the rough surface are at a lower scale than the size of the drop. Roughness r increases the wetting effect, so it becomes θ <θY.
The Cassie-Baxter model for contact angle (θCB) departs from the Cassie equation for the contact angle (θC) heterogeous surfaces [17], where a linear fractional weighted composition of roughness effects from phases 1 and 2 is translated into the observed contact angle (6), with f1 + f2 = 1. As in the Wenzel’s model, this approximation is good when the heterogeneities are small relative to drop size [18].
When the liquid is unable to penetrate inside the valleys of the surface roughness, the fraction f2 of liquid that remains confined by air pockets has a cosine angle -1 and (6) becomes (7), where f1 is the solid-liquid interface and f2 the liquid-air interface per unit of projected area, so in in general f1+f2>1
The Cassie-Baxter model is expressed by (8), where fs is the fraction of liquid in contact with the solid and 1-fs with air, while r1 counts for the roughness wet on the solid contact. In general, r1 is not the roughness factor by Wenzel’s model. Note that in Cassie-Baxter equation in the liquid-air interface, there is an assumption of a smooth and flat boundary. Meanwhile, in real contact, it would show the curvature of the liquid meniscus supported on the local surface texture.
Despite the experimental approximation of the Wenzel or Cassie-Baxter models and their consideration as reference models, their formulation has been challenged as a part of systematic research in the field. In particular, the Cassie-Baxter model that is the reference for hydrophobic surfaces was experimentally refuted in the contribution of the real contact surface to the apparent contact angle. In both models, roughness increases the effect of the basic regime by increasing wettability in the Wenzel contact regime or the repellence regime. Through experimentation, it was shown that the roughness in the inner surface at the contact of a droplet on a rough surface has no significant effect on the contact angle; that is, it seems to be determined by the triple line where the three phases meet each other [19,20]. Since then, the experimental evidence has been tried to be reconciled with the usefulness of the model in certain conditions [21]. Other derivative models [22] have been found in the research field, but the alternating disregard and support for the models might dim and converge each to the other by the research of the triple contact line [23]. This is one of the contribution objectives of the present research.
The contact angle explanatory model is static so far. The underlying surface energy and the adhesion behavior include contact onset or separation of the surfaces that modifies the configuration balance in a dynamic process. The macroscopic balance of small droplets involves specific force and work (energy) that, for the geometry of a small spherical droplet, can be characterized by the observed contact angle. Also, contact angle hysteresis is observed in the movement/deposition/separation of the sessile drop from the surface and some variability in the experimental results, even in apparent static stable configuration. From the real behavior of liquid-solid in contact, the Wenzel or Cassie-Baxter model can be considered only a partial approach to the contact angle explanation. They are derived from the horizontal balance in the droplet, while the vertical equilibrium does not participate in the quantification. The measurement of the separation force of a droplet that creates a free surface on the solid has a direct connection with the adhesion, and it is introduced in our research to complement the CB model to progress in the understanding of roughness in hydrophobicity.
The natural behavior of hydrophobic plant leaves is a main source of biomimetic inspiration in the hard task of disclosing the mechanisms of hydrophobicity. Leaf wetting is also important for the sustainability or adaptation of plants in their environment [24]. Two main effects are identified in the observed hydrophobicity in agreement with the main component of the models: the surface energies of the liquid and solid in contact, together with the surface roughness. Surface roughness is also relevant in adhesion in biotissues [25].
The influence of roughness scale has been researched by concluding in theoretical basic research [26] that the roughness at nanometer scale is not determining the contact angle of hydrophobic surfaces, so the micrometer scale where long wavelength roughness can be appreciated has the main influence. Nevertheless, some other experimental studies associate nanobumps at the top of microbumps surface as a main contribution to hydrophobicity, more than the micrometer roughness [27]. Also important, hysteresis decreases in hydrophobic leaves as hydrophobicity increases. There is compatibility of the optimal multiscale roughness (micro and nanoroughness in plants of high hydrophobilicty) with a main hydrophobicity mechanism at micrometer scale. This would facilitate the possibility of biomimetic initial inspiration from topography at micrometer level as a first step, by-passing the extremely complex living structures of natural organisms at nanometer scale. Water droplets of different sizes are repelled by surfaces with only one scale of roughness, as far as the size of the droplet is larger that the details of the roughness [1,28]. This supports the existence of main surface characteristics, at a proper scale level smaller than the droplet, which are main contribution to hydrophobicity, together with the liquid and solid surface energy. The CB model includes roughness through a generic roughness parameter that increases the surface interface. Connecting those parameters with standard roughness parameters used in surface dimensional metrology is believed to be a proper path to support experimentation, so different results could be compared as a key element of biomimicry progress. Therefore, the natural topography of plant leaf surfaces should offer metrics about hidrophbicity that could facilitate the creation of engineered hydrophobic surfaces.
This research presents a semi-experimental model of the vertical balance of the triple line of a droplet. This model quantifies the total contact length connected with the Cassie-Baxter (CB) model parameters. Using this extended model, we first quantify the model’s coherence with experimental data from the literature. The results show a good qualitative trend with the conceptual meaning of the parameters and a strong correlation with the experimental contact angles (CA) observed on hydrophobic plant leaves. Next, we conduct new experiments to map standard ISO roughness parameters against the model. We find a partial correlation of significant parameters, contributing to the reproduction of hydrophobic surfaces inspired by biomimetics. Throughout the paper, we progressively discuss these findings. In the Conclusions section, we outline the main contributions and suggest directions for future research.
2. Materials and Methods
In the next section, the Cassie-Baxter contact angle model for the hydrophobic regime is complemented by the vertical balance approximation of the droplet. A semi-empirical equation is developed, with parameters evaluated based on literature data of measured leaf contact angles.
Next, we selected accessible leaves exhibiting hydrophobic behavior and measured their surfaces using a LeicaSCAN DCM 3D confocal microscope with a 20x objective (resolution in the Z-axis: 0.2 µm, XY-axis: 0.28 µm). The 20x magnification provided consistent micrometer-level results, balancing scanning speed and surface coverage. The surface area covered was at least 3 x 3 mm², suitable for small droplets of 1 µL, within the 0.5 to 10 µL range, ensuring a spherical cap due to the radius being smaller than the capillary length. Three samples were taken from each specimen. Data acquisition was processed using the microscope’s proprietary software and Mountains by Digital Surf. The roughness parameters considered are defined in ISO 25178-2:2021. Samples from the domestic garden were carefully laid out on glass, supported by double-sided adhesive tape to ensure a flat surface for topography analysis. While curvature effects and leaf inclination impact real leaf wetting behavior, the standard contact angle for comparison is considered on a flat surface.
Values of contact angles for common plants were retrieved from the literature and verified using image analysis with ImageJ software, employing the Low Bond Axisymmetric Drop Shape Analysis method through a dedicated plugin (Figure 1). Measurements were performed using a MAKO U-130B camera equipped with an Edmund Optics 63747 3.0 x 40mm objective. Water droplets of 1 µL were precisely deposited using a high-precision micro-syringe.
3. Contact Angle Model Based on the Balance of the Triple Line
The application of the Cassie-Baxter (CB) model presents challenges in determining (r1) and (fs). The model has been criticized because experimental evidence shows that the roughness of the surface under the droplet does not influence the contact angle (CA). However, the validity of the CB model is defended for superhydrophobic surfaces based on the virtual work principle, considering the fine structure of the triple line, including a precursor film. This low-energy area at the triple line could also explain the observed decrease in contact angle with the size of the bubble in previous research [15,32].
The focus of research is shifting towards the triple line and its balance. According to Pease [33], the balance at the triple line is essentially unidimensional and not surface-related. Young’s equation balances the triple line through surface tension only in the horizontal direction. Experimentally, it has been shown that the triple line establishes the balance for the observed contact angle. Therefore, the vertical balance of the triple line should be considered, as the liquid surface tension in its vertical component is compensated by an attractive net force to achieve vertical balance. Additionally, the Laplace pressure at the triple line must be considered in the droplet surface and at the limit of the triple line.
Tadmor’s research [34] on the separation force of a droplet concludes that the work of separation is an intensive property and equal to the work of adhesion. This provides an opportunity to relate the vertical force to the observed contact angle through the Young-Dupré equation (3). The formulation of the vertical separation force (F) is expressed in equation (9) for a perfect circular triple line of radius (r), where (ΔP) is the Laplace pressure, considered for a convex curvature with principal radii (r) and (R) (see Figure 2). The force per unit length of the triple line ( h ) is (F/h).
In the superhydrophobicity regime on a rough surface, in addition to the contact on the solid surface, the liquid bridges the air pockets under the tiple line and follows the details of the roughness topography where wets the solid. In consequence, 2πrφ1 is the total length of contact with the solid and 2πrφ2 with the air on the triple line, so 2πrφ = 2πrφ1 + 2πrφ2 is the total length of the real triple line. In addition, considering the spherical geometry r = Rsinθ and we obtain (10)
In the experimental process of droplet detachment by Sun [35], the difference between the initial detachment force and the maximum separation force can be observed. The initial detachment force is measured when the sessile droplet has a roughly spherical shape (point B, see Figure 3). The maximum separation force is reached when the droplet is distorted, with the contact angle on the solid surface being approximately 90° at point D, just before effective separation occurs.
The vertical force of droplet separation was measured by Tadmor [24] and estimated in relation to the receding angle θr at the point of critical spontaneous detachment, F/2πr=γ(1+ cosθr). However, for hydrophobic liquids, (r) is not directly the radius of the triple line of a static droplet but rather the complex shape of the droplet just before detachment. Later, Daniel [26] correlated the detachment force and found the force correlation F/πR=γ(1+ cosθ) in the hydrophobic regime, while no direct correlation with contact angle was found in hydrophilic behavior.
In Figure 3, it can be observed that the measured force at point D is roughly double that at point B. Since r=Rsinθ, we can approximate F/h(r,θ) =γ(1+ cosθ), where h(r,θ) is a function that may depend on the wetting regime. In our proposed model, a droplet in equilibrium from a hydrophobic liquid is approached by the force initially measured at point B, where the spherical geometry and contact angle can be distinguished. This also represents the point of initial separation in the detachment process. Therefore, the vertical force of separation measures the vertical adhesion, which, together with surface tension, establishes the contact angle. The measured adhesion force compensates for the vertical component of the liquid tension (Figure 2).

From (11) we can get the total length of the triple line as a function of the contact angle in (12)
Assuming the estimation h(r,θ) =πr/sinθ, we get (13). This function is represented in Figure 4. Athe perfect hydrophilic (0°) and hydrophobic (180°) situation are singular limit values for increasing contact length φ. The length of the triple line increases both towards the perfect wetting regime and the superhydrophobic situation, with a value φ=1.5 for 90° and a minimum for about 110° of φ=1.4.
The physical interpretation of a perfect wetting liquid is that it wets and follows the peaks and valleys in the surface roughness in an increasingly long triple line. In the other bound, for superhydrophobicity, the liquid has little contact support on the solid, so the length must also increase in contact with decreasing support on the solid surface, in addition to the multiple air pockets that are bridged on the triple line contour.
We hold the hypothesis that the CB model represents the basic hydrophobic function dependence of the CA with the contact with two phases, solid and air pockets, but fs and r1 are the length fractions of solid contact and the roughness factor along the triple line. Thus, the total length of contact is 2πrφ and the two phases (solid and air in pocket under the triple line) φ = φ1 + φ2 =r1fs+(1-fs), with fs=1- φ2, and r1=φ1/fs, by (14), but in general, it can be φ>1.
The Cassie-Baxter model (8) contains three parameters, r1, fs and θY. According to the experimental evidence, the surface fractions r1 and fs should be considered in the topography of the triple line where its balance seems to determine the contact angle, so they become locally more presentative in terms of length fractions of the triple line. As providing θY for two liquids by (4) on the same surface, r1, fs could be determined by (8), with two equations and 2 unknowns. Note that the two liquids approach assumes an average behavior of surface roughness through r1 and fs not dependent on the liquid. We assume the Young contact angle (smooth surface without roughness) is determined only by the liquid in contact with the surface by (4), water (W) or diiodomethane (D), independent from the roughness. In addition, fs and r1 depend only on the surface topography under the triple line. The CBTLM model allows for calculating r1 and fs from two liquids, W and D, by (15).
This includes the assumption that the wet topography depends only on the roughness, so the surface tension between the liquid and the solid is independent of the topography and evaluated exclusively in the model by θY. We call this model Cassie-Baxter Triple Line Model (CBTLM). It evaluates wetting topography (r1 and fs) based the horizontal equilibrium of the triple line and the Young angle of two liquids on the same surface. The possibility of estimating the influence of surface topography in a hydrophobic regime can be checked by comparing the results with three different pairs of liquids on a leaf surface with wax. Experimental data reported in [13] are included in Table 1, for water W, diiodomethane D and glycerol G, and the values of r1 and fs for the pairs of liquids WG, WD or GD. The Young contact angle is calculated by (4) taken the reference values [13] for water (W) γW=72.8 mJ m-2 , γWd=21.8 mJ m-2, for diiodomethane (D) γD=50.8 mJ m-2 , γDd=49.0 mJ m-2, and for glycerol (G) γG=63.7 mJ m-2 , γGd=33.6 mJ m-2 For wax it can be estimated [14] γwax=25.5 mJ m-2.
Table 1 gives evidence that even when r1 and fs characterize surface roughness and a fraction of solid contact, for a given surface, none of them seems to be independent of the liquid in contact on the surface.
In addition, we have formulated the Vertical Balance Triple Line Model (VBTLM) from (11) across of the triple line of length 2πrφ, deducing φ(θ), φ1(θ) and φ2(θ) that are given by (13-14). Assuming the Cassie-Baxter principle of two phases with angle contact 180° for liquid on the air pockets under the triple line, we can calculate directly the roughness factor and the solid fraction from (14). This is noted as r1v and fsv. They are calculated from the vertical balance of the triple line based on the adhesion force, but based on just the liquid in contact. The vertical balance offers a quantification of the total length of contact in the triple line that can be used to estimate the fraction of contact in the solid and the air pockets. In the next section, we examine the experimental behavior of the VBTLM.
4. Contact Angle on Hydrophobic Leaves
To check the coherence of the model with experimental data in the hydrophobic regime, a set of contact angles from plant leaves that exhibit hydrophobic behavior with water has been retrieved from a group of experimental data [37] in Table 2 and Table 3. Contact angles on leaves with epicuticular wax crystals on the surface have been selected. Wax is present in plant leaves as a functional mechanism in the form of microcrystals with nanometric size [24], so at that scale influencing the topography and following the topography at the micrometer level, where we research the main wetting behavior, as argued in the Introduction section.
In Table 2 and Table 3 are compiled the results of contact angles for water (W) and diiodomethane (D), retrieve from [37], for adaxial (AD) and abaxial (AB) leave surfaces with wax, without trichomes, including for reference the parameters of the CBTLM (r1, fs) and the VBTLM (r1v, fsv). VBTLM allows calculating the total length of the triple line and the Cassie-Baster parameters roughness factor and solid fraction, calculated alternatively from φ (θ), φ1(θ) and φ2(θ) by (14) and noted r1v and fsv in Table 2 and Table 3. The values of r1, fs and r1v, fsv are experimental, with indirect measurement through two different models, CBTLM from the measured contact angle of two liquids and the VBTLM for water W and diiodomethane (D), on leaf surfaces with wax through both models.
In Figure 5, all experimental results for AD from Table 2 are presented for r1, fs and r1v, fs1 with significant correlation with the experimental contact angle. The first approach functional linear trend of both models is similar, and there is a higher agreement in the estimation of fs with a higher correlation. In both models, the higher the contact angle, the higher the roughness parameter r1 and the lower the contact fraction with the solid. The r1v and fsv values for W and D show a similar trend with convergence for superhydrophobicity towards contact angle 180. The roughness factor r1v is higher for the lower surface tension liquid, D, in coherence with its higher wetting capacity.
In the case of fs, the values from the two-liquid method CBTLM seems to be in between those obtained individually for W and D by the VBTLM, so averaging the two liquids effect. Also, the liquid of lower surface tension D reaches the balance at the triple line with lower fs, because its capability of wetting the same surface is higher than W, with a higher roughness multiplicative factor r1 the contact (adhesion) on solid. In consequence, fs can be lower, but sufficient to balance the low surface tension of D at the triple line, with a higher fraction of air pockets (1-fs) and a lower contact angle with D than with W. Worhty to remember that wax has even lower surface tension than D. Also note that for fs the two liquid method averages the influence of liquid surface tension in the calculation, consistent in qualitative terms. Nevertheless, the estimation of r1 through CBTLM cannot be linked with the two liquids' properties. As it is appreciated in Figure 1, the model evaluates a lower r1 than any of the two liquids and with low correlation compared to VBTLM.
In Figure 6, the results from Table 3 of AB surfaces are represented. We got similar qualitative results for AD data. There are some specimens with hydrophilic behavior,r so cosθ is positive. Also, diiodomethane (D) is a liquid of slightly higher surface tension than wax, so with a high roughness factor r1 it can hold a low contact on solid fs with sufficient adhesion to balance the (lower) surface tension of D across the triple line. The trend of r1 for D exhibits a reverse slope, compatible with an increase of contact angle while fs is almost constant (about 0.6). Even when the CBTLM and VBTLM are formulated for hy-drophobic behavior, model consistency requires the two-way continuity in the transition between hydrophilic and hydrophobic behavior. This transition can be evaluated in the VBTLM through negative values of φ2=1-fs that will correspond to the basic Cassie-Baxter model without air pockets under the triple line towards a hydrophilic behavior. While the explanation of wetting and repellence in the horizontal balance of the triple line requires two model mechanisms, Wenzel and Cassie-Baxter, we suggest the possibilities of the vertical balance of the triple line to link the transition. It might offer a continuous interpretation of the contact angle in the same model for different wetting regimes. The vertical balance establishes the equilibrium of adhesive forces, liquid tension, and the Laplace pressure at the triple line of the droplet.
5. Standard Roughness Parameters for Hydrophobic Surface Assessment
The quantification of roughness concerning the contact angle has been researched in a limited extension with standard roughness parameters. Many studies try to characterize the effect of roughness structures on contact angle [38,39,40] with ad hoc parameters, including hydrohobicity increase based on fractal roughness [41], but the characterization of complex hydrophobic structures with standard roughness parameters used in engineering can offer a bridge to fruitful biomimetics of hydrophobicity. Roughness evaluation is a dimensional metrology task at the micrometer level that has evolved from simple unidimensional parameters to the standardization of a battery of available metrics that can cover many technical needs. Meanwhile, plant or animal living structures are very different from human-made surfaces on non-organic materials. The biomimetic field should meet the techniques of both fields to approach and facilitate the possibility of translating natural configurations into engineered developments. The international standard ISO 25178-2:2021 [42] provides a comprehensive set of roughness metrics based on the tridimensional geometry of the surface. With primitive origin in the basic roughness parameters evaluated through sampling straight lines (for instance Ra), there are standard roughness parameters that can be indicators of complex surface topography. The aereal parameters of surface texture are grouped into sets by the dominant characteristic of the parameter on the tridimensional geometry. The height parameters focus on the metrics with only the distribution of height (Sq, Sss, Sku, Sp, Sv, Sz or Sa), while the spatial parameters are indicators of their distribution on the surface (Sal, Str, Std, Ssw). Some hybrid parameters measure the ratios of vertical to horizontal variation (Sdq or Sdr). Fixing the attention on the Abbot curve of the distribution of heights, different metrics characterize that distribution (Smr, Smc Sdc). There is another group of parameters adequate for stratified surfaces because it contains features (peaks, pits, hills or dales) that in many cases are of functional interest (Sk, Spk, Spkx, Svk, Svkx Smrk1, Smrk2, Sak1 Sak2). In addition, there are two groups to characterize the areal material probability distribution (Svq, Spq or Smq), the volume (voids and peaks) distribution (Vv, Vvv, Vvc, Vm(p), Vmp, Vmc), or the geometric features (peaks, pits, hills or dales) (Spd, Svd, Spc, Svc, S5p, S5v S10z, for hill and dales Sh_ or Sd_ parameters). Finally, some parameters fix the attention on the scale of measurement, with multiscale parameters (Smvs, Sas, Sls, Svsfc, Sasfc., Ssrc). With such a big group of indicators of the surface topography, the first attempt should be to correlate the influential parameters of the contact angle with some of those indicators to create bioinspired hydrophobic surfaces supported in metrics that are indicators of the wetting behaviour.
We look at that relationship through the measurement of hydrophobic leaves of easy access. Their name have been set from the botanic nomenclature in Latin for the sake of clarity, avoiding the several names that plants receive in different languages and countries. There is no botanic traceability on the specimen nor the purpose of botanic characterization in their use, so their easy access has facilitated to retrieve the contact angle value of water in some cases from literature in some specimen the contact angle has been checked through by image processing and measurement (Figure 4). All specimens have wax on the adaxial surface evaluated. Those samples have been measured by confocal microscopy to get the surface topography and the corresponding surface texture parameters. After an overall screening, in Table 4 and 5 only appear parameters which correlation coefficient (R2) are with some model parameters over 0.7.
The parameters of the VBTLM presented for each plant leave are included in Table 6. The corresponding r1v and fsv by (14) are also included.
The experimental results with the coefficient of regression of the roughness texture parameters with the contact angle and the VBTLM parameters are presented in Table 7. The contact angle correlated directly with Spkx, that is, the maximum peak height of reduced peaks in the distribution of heigths (Abbot curve). Also with Sp (largest peak value) and the S5p parameter that evaluates the mean height of the 5 highest peaks, and also with S10z that is the addition of 5 peaks and 5 pit depth. There is a clear relationship with the geometry of contact where peaks and pits are the boundaries of the rough solid surface, but also the enabler of the air pockets where the droplet lays out. Note that the correlation is negative so those singular pronounced peaks and pits do not contribute efficiently to higher contact angles. With the same negative correlation, the amplitude parameter A, so the higher the characteristic amplitude (higher wavelength of the Fourier transformation of the ordinate profile) ,the lower the contact angle. There is a high positive correlation with Shffq (hills form factor variability). This spatial influences suggest that hidrophobicity is favoured by not an abrupt variation on the height at the micrometer level but also the features should appear in high frequency repetition with short amplitude in the characteristic repetition. The asperities characterized by the hills' form factor variance correlates highly with the contact angle, suggesting that the variety in the form factor of those hills can contribute better to a high contact angle instead of the uniformity.
Fixing the attention on the length of the triple line φ, it follows the same pattern of influences that the contact angle, suggesting that the triple line length could be a main contribution to hydrophobicity with decreasin areas of contact of the droplet and even with a nonlinear effect with the contact angle (see Figure 1).
The coefficient of regression of the roughness texture parameters with the contact angle and the VBTLM parameters are presented in Table 7.
Regarding the fraction of the total length on the air pockets under the triple line, 2, it correlates with the parameters that evaluate the dales. A positive correlation with Sdffq (variance of factor form of the dales), so the hypothesis around the hills variety of forms can be translated into the explicative mechanisms of the air pockets. The total length under the triple line is favoured with high variety of dale form factor, instead of uniformity.The negative correlation with Sdv and Sdvq that evaluates the volume and its variance in the dales. It indicates that small, uniform, small-volume dales will contribute better to high contact angles than big ones. Note that this correlation seems to be opposite to the high variance in form factor, but is the size and not the form that is evaluated by these last two parameters. Also related to the size of the dales, Sded evaluates the equivalent dale diameter, with negative correlation with φ2, so the smaller the dales, the higher its contribution to high contact angles. Note that φ2=1-fs, so fs exhibit opposite correlation. Finally, the most representative parameter with a positive correlation with 2 is Shffq, hills form factor variance, indicating that a distribution of asperities of diverse size (form factor variance) is a main contributor for a high contact angle.
Regarding the roughness factor r1, it negatively correlates with all factors that directly correlate with the contact angle. Since φ1=r1.fs the positive correlation of φ1 with the contact angle should be maintained with higher increases in fs, which reduce r1 to provide additional contact length across the triple line. Experimental results have not shown a significant direct correlation between φ1 and other standard ISO roughness areal texture parameters. Given that φ1=r1.fs, the lack of correlation when considering r1 and fs separately is consistent.
All previous qualitative considerations about the areal surface texture topography and the VBTLM support the physical interpretation and significance of the model parameters. These considerations also highlight the potential for linking surface topography evaluation with contact angle prediction.
In addition to the correlation results, it is worth noting that there has not been an appreciated correlation with some other roughness parameters of the surface in these experimental results. This doesn’t mean that there is no relationship, but it could be highly non-linear so difficult to appreciate through the correlation analysis. There has not been an appreciated correlation with Sq, an important parameter in mechanical contact. Some research [27,43,44] identify that the variance of the surface height influences the wetting properties of a random surface. Nevertheless, the roughness of hydrophobic leaves are not properly random with texture direction and periodic structures. Also in relationship with the asperities in mechanical contact, the hybrid parameters that evaluate the local slope or the area aspect ratio that provide the area following the topography on its horizontal projection, parameters Sdq or Sdr. They were initially considered potential metrics to explain the droplet contact on the rough surface. In particular, the area aspect ratio is in fact the area fraction handled in the Wenzel or Cassie-Baxter original models. This negative result is consistent with the importance of the triple line balance and not the surface topography under the droplet. The group of spatial parameters were a priori candidates to show correlation with contact angle. One of them, the amplitude of the characteristic periodic structure of the motivs on the surface, has shown direct relationship, also consistent with the influence of the correlation length [43], but not the fractal dimension of the topography. In correspondence with the previous argument on the scale of the main mechanisms of hydrophobilicity, the existence of recursive structures on living surfaces at two levels of roughness can overboosts the basic mechanisms to superhydrophobicity (for instance, nanometric protrusions on micrometer features or trichomes), but it is believed compatible with a main effect of hydrophobicity at micrometer scale. With the difficulty of emulating in artificial structures those details at several levels, perhaps the biomimetic approach should relay initially on the main influence mechanisms at one appropriated scale, before trying to improve it with more complexity and multiple scales of roughness that living organisms frequently exhibit.
6. Conclusions
We have developed an alternative experimental model that complements the original Cassie-Baxter (CB) model for hydrophobicity with a semi-empirical approach to the vertical triple line, allowing for the estimation of its length. The participation of two phases (solid and air pockets) from the CB model remains the primary mechanism for achieving a high contact angle. The adhesion force across the triple line balances the vertical component of the liquid’s surface tension, along with the Laplace pressure, to maintain the curvature of the spherical droplet.
Based on contact angle measurements from a set of plant leaves, we demonstrated that using a reverse method with two liquids to calculate the roughness parameters of the CB model is ineffective. This is because experiments with three liquids showed a clear influence of the liquid on the CB model, indicating that length fractions are not independent of the liquid in contact. Additionally, we proposed the Vertical Balance of the Triple Line Model (VBTLM), which has shown the capability to evaluate the fractions of solid contact and the roughness factor for each liquid, exhibiting consistent behavior in experimental trials. The calculated parameters r1v and fs1 link the vertical balance with the basic mechanisms of the CB model’s horizontal balance, allowing for the quantification of the solid contact fraction and roughness parameters, which are often referenced in the literature but lack proper quantification.
In our research on the influence of roughness on contact angle, we screened the most relevant ISO standard areal texture parameters and identified the most significant ones in correlation with the contact angle and model parameters. We believe that a crucial step in facilitating biomimicry is the proper characterization of roughness using standard reproducible parameters, even though future hydrophobicity studies may require new specific roughness indicators. Another point of interest from the experimental results is that pinned structures exhibiting hydrophobic behavior might perform better with a variety of sizes and forms in the pins (hills) that support the droplet contact on the surface, rather than regularity in the paths. Such size dispersion is naturally found in living structures and has been observed in the experimental correlation with plant leaves.
Future work will include refining the evaluation of the adhesion force at the beginning of the detachment process, where adhesion counteracts the surface tension on a static droplet. Regarding the modeling process, there are two models with different parameters (Wenzel and Cassie-Baxter), so the regime changes when the liquid penetrates the air pockets or stays on them. Developing a model that represents both regimes by including the triple line balance and adhesion values in the vertical balance is an attractive possibility, as an immediate criticism of the Young, Wenzel, and Cassie-Baxter models is that they formulate mechanical equilibrium only in the horizontal direction.
Author Contributions
Conceptualization, R.C. and O.J.; methodology, R.C.; software, M.B.; validation, R.C., O.J. and M.B.; formal analysis, R.C.; investigation, O.J.; resources, M.B.; data curation, R.C.; writing—original draft preparation, R.C.; writing—review and editing, O.J. and MB. All authors have read and agreed to the published version of the manuscript.
Funding
This research received no external funding.
Data Availability Statement
The original contributions presented in this study are included in the article/supplementary material. Further inquiries can be directed to the corresponding author(s).
Acknowledgments
The authors would like to thank E.T.S. de Ingeniería y Diseño Industrial at the Universidad Politécnica de Madrid, for providing access to the LIMIT Laboratory facilities, where the experimental part of this paper has been carried out.
Conflicts of Interest
The authors declare no conflicts of interest.
References
- Nosonovsky, M.; Bhushan,B. Superhydrophobic surfaces and emerging applications: Non-adhesion, energy, green engineering. Current Opinion in Colloid & Interface Science, 2009, 14(4), 270-280. [CrossRef]
- Sotoudeh, F. et al. Natural and synthetic superhydrophobic surfaces: A review of the fundamentals, structures, and applications. Alexandria Engineering Journal, 2023, 68, 587-609. [CrossRef]
- Hensel, R.; Neinhuis, Ch.; Werner, C. The springtail cuticle as a blueprint for omniphobic surfaces. Chemical Society Reviews, 2016, 45(2), 323-341. [CrossRef]
- Neinhuis, Ch.; Barthlott, W. Characterization and distribution of water-repellent, self-cleaning plant surfaces. Annals of botany, 1997, 79(6), 667-677. [CrossRef]
- Yu, C., et al. Nature–Inspired self–cleaning surfaces: Mechanisms, modelling, and manufacturing. Chemical Engineering Research and Design, 2020, 155,48-65. [CrossRef]
- Barthlott, W.; et al. Plant surfaces: structures and functions for biomimetic innovations. Nano-Micro Letters, 2017, 9,1-40. [CrossRef]
- Liu, M.; Wang, S.; Jiang, L. Nature-inspired superwettability systems. Nature Reviews Materials, 2017, 2(7),1-17. [CrossRef]
- Yuan, Y.; Lee, T. R. Contact angle and wetting properties. In: Surface science techniques. Berlin, Heidelberg: Springer Berlin Heidelberg, 2013, 3-34. [CrossRef]
- Drelich, J. W.; Boinovich, L.; Chibowski, E.; Della Volpe, C.; Hołysz, L.; Marmur, A.; Siboni, S. Contact Angles: History of over 200 Years of Open Questions. Surface Innovations 2020, 8 (1–2), 3–27. [CrossRef]
- Adamson, A.W. Physical Chemistry of Surfaces. Wiley, Hoboken, NJ, USA, 1982.
- Sulman H. L. A contribution to the study of flotation. Transactions of the Institution of Mining and Metallurgy, 1919, 29,44-138.
- Tadmor, R.; Das, R.; Gulec, S.; Liu, J.; E. N’guessan, H.; Shah, M.; S. Wasnik, P.; Yadav, S. B. Solid–Liquid Work of Adhesion. Langmuir 2017, 33 (15), 3594–3600. [CrossRef]
- Fernández, V.; Khayet, M. Evaluation of the surface free energy of plant surfaces: toward standardizing the procedure. Frontiers in plant science, 2015, 6, 510. [CrossRef]
- Fowkes, F. M. Attractive forces at interfaces. Industrial & Engineering Chemistry, 1964, 56 (12), 40-52. [CrossRef]
- Good, R. J.; Koo, M. N. The effect of drop size on contact angle. Journal of Colloid and Interface Science, 1979, 71(2), 283-292. [CrossRef]
- Wenzel, R. N. Resistance of solid surfaces to wetting by water. Industrial & engineering chemistry, 1936, 28(8), 988-994. [CrossRef]
- Cassie, A. B. D. Contact angles. Discussions of the Faraday society, 1948, 3,11-16.
- Brandon, S., et al. Partial wetting of chemically patterned surfaces: The effect of drop size. Journal of colloid and interface science, 2003, 263(1), 237-243. [CrossRef]
- 19. Gao, L,; McCarthy, T. J. How Wenzel and Cassie were wrong. Langmuir, 2007, 23(7),3762-3765. [CrossRef]
- Ebil, H. Y.; Cansoy, C. E. Range of applicability of the Wenzel and Cassie− Baxter equations for superhydrophobic surfaces. Langmuir, 2009, 25(24),14135-14145. [CrossRef]
- Erbil, H. Y. The debate on the dependence of apparent contact angles on drop contact area or three-phase contact line: A review. Surface Science Reports, 2014, 69(4),325-365. [CrossRef]
- Huang, Z. New equations of wetting. Philosophical Magazine Letters, 2020, 100( 4),181-188. [CrossRef]
- Erbil, H. Y. Dependency of contact angles on three-phase contact line: a review. Colloids and Interfaces, 2021, 5(1), 8 . [CrossRef]
- Gorb, E. V.; Gorb, S. N. Anti-adhesive effects of plant wax coverage on insect attachment. Journal of Experimental Botany, 2017, 68(19),5323-5337. [CrossRef]
- Ciavarella, M. et al. The role of adhesion in contact mechanics. Journal of the Royal Society Interface, 2019, 16(151), 20180738. [CrossRef]
- Yang, C.; Tartaglino, U.; Persson, B.N.J. Influence of surface roughness on superhydrophobicity. Physical review letters, 2006, 97(11), 116103. [CrossRef]
- Bhushan, B.; Jung, Y.C. Micro-and nanoscale characterization of hydrophobic and hydrophilic leaf surfaces. Nanotechnology, 2006, 17(11), 2758. [CrossRef]
- Webb, H.K.; Crawford, R. J.; Ivanova, E. P. Wettability of natural superhydrophobic surfaces. Advances in colloid and interface science, 2014, 210, 58-64. [CrossRef]
- De Gennes, P.-G.; Brochard-Wyart, F.; Quéré, D. Capillarity and wetting phenomena: drops, bubbles, pearls, waves. Springer Science & Business Media, 2003.
- Zhao, T.; Jiang, L. Contact angle measurement of natural materials. Colloids and Surfaces B: Biointerfaces, 2018, 161, 324-330. [CrossRef]
- Bormashenko,E. Why does the Cassie–Baxter equation apply?. Colloids and Surfaces A: Physicochemical and Engineering Aspects, 2008, 324(1-3), 47-50. [CrossRef]
- Herzberg, W. J.; Marian, J.E. Relationship between contact angle and drop size. Journal of Colloid and Interface Science, 1970, 33(1), 161-163. [CrossRef]
- Pease, D. C. The significance of the contact angle in relation to the solid surface. The Journal of Physical Chemistry, 1945, 49, (2), 107-110. [CrossRef]
- Tadmor, R., et al. Solid–liquid work of adhesion. Langmuir, 2017, 33(15), 3594-3600. [CrossRef]
- Sun, Y., et al. Direct measurements of adhesion forces of water droplets on smooth and patterned polymers. Surface Innovations, 2017, 6( 1–2), 93-105. [CrossRef]
- Daniel, D.; Koh, X. Q.. Droplet detachment force and its relation to Young–Dupre adhesion. Soft matter, 2023, 19(43), 8434-8439. [CrossRef]
- Wang, H., et al. The effects of leaf roughness, surface free energy and work of adhesion on leaf water drop adhesion. PloS one, 2014, 9(9), e107062. [CrossRef]
- Herminghaus, S. Roughness-induced non-wetting. Europhysics Letters, 2000, 52(2),165. [CrossRef]
- Bell, M. S., et al. Effects of hierarchical surface roughness on droplet contact angle. Langmuir, 2015, 31(24), 6752-6762. [CrossRef]
- Lai, Y., et al. In situ surface-modification-induced superhydrophobic patterns with reversible wettability and adhesion. Advanced Materials (Deerfield Beach, Fla.), 2012, 25(12),1682-1686. [CrossRef]
- Onda, T., et al. Super-water-repellent fractal surfaces. Langmuir, 1996, 12(9),2125-2127. [CrossRef]
- ISO 25178-2:2021. Geometrical product specifications (GPS)—Surface texture: Areal—Part II: Terms, definitions and surface texture parameters. 2012.
- Nosonovsky, M.; Bhushan, B. Biologically inspired surfaces: broadening the scope of roughness. Advanced Functional Materials, 2008, 18 (6),843-855. [CrossRef]
- Nosonovsky, M.; Bhushan B. Roughness optimization for biomimetic superhydrophobic surfaces. Microsystem Technologies, 2005, 11,535-549. [CrossRef]
Figure 1.
Water contact angle on plant leaf: measurement through image processing.
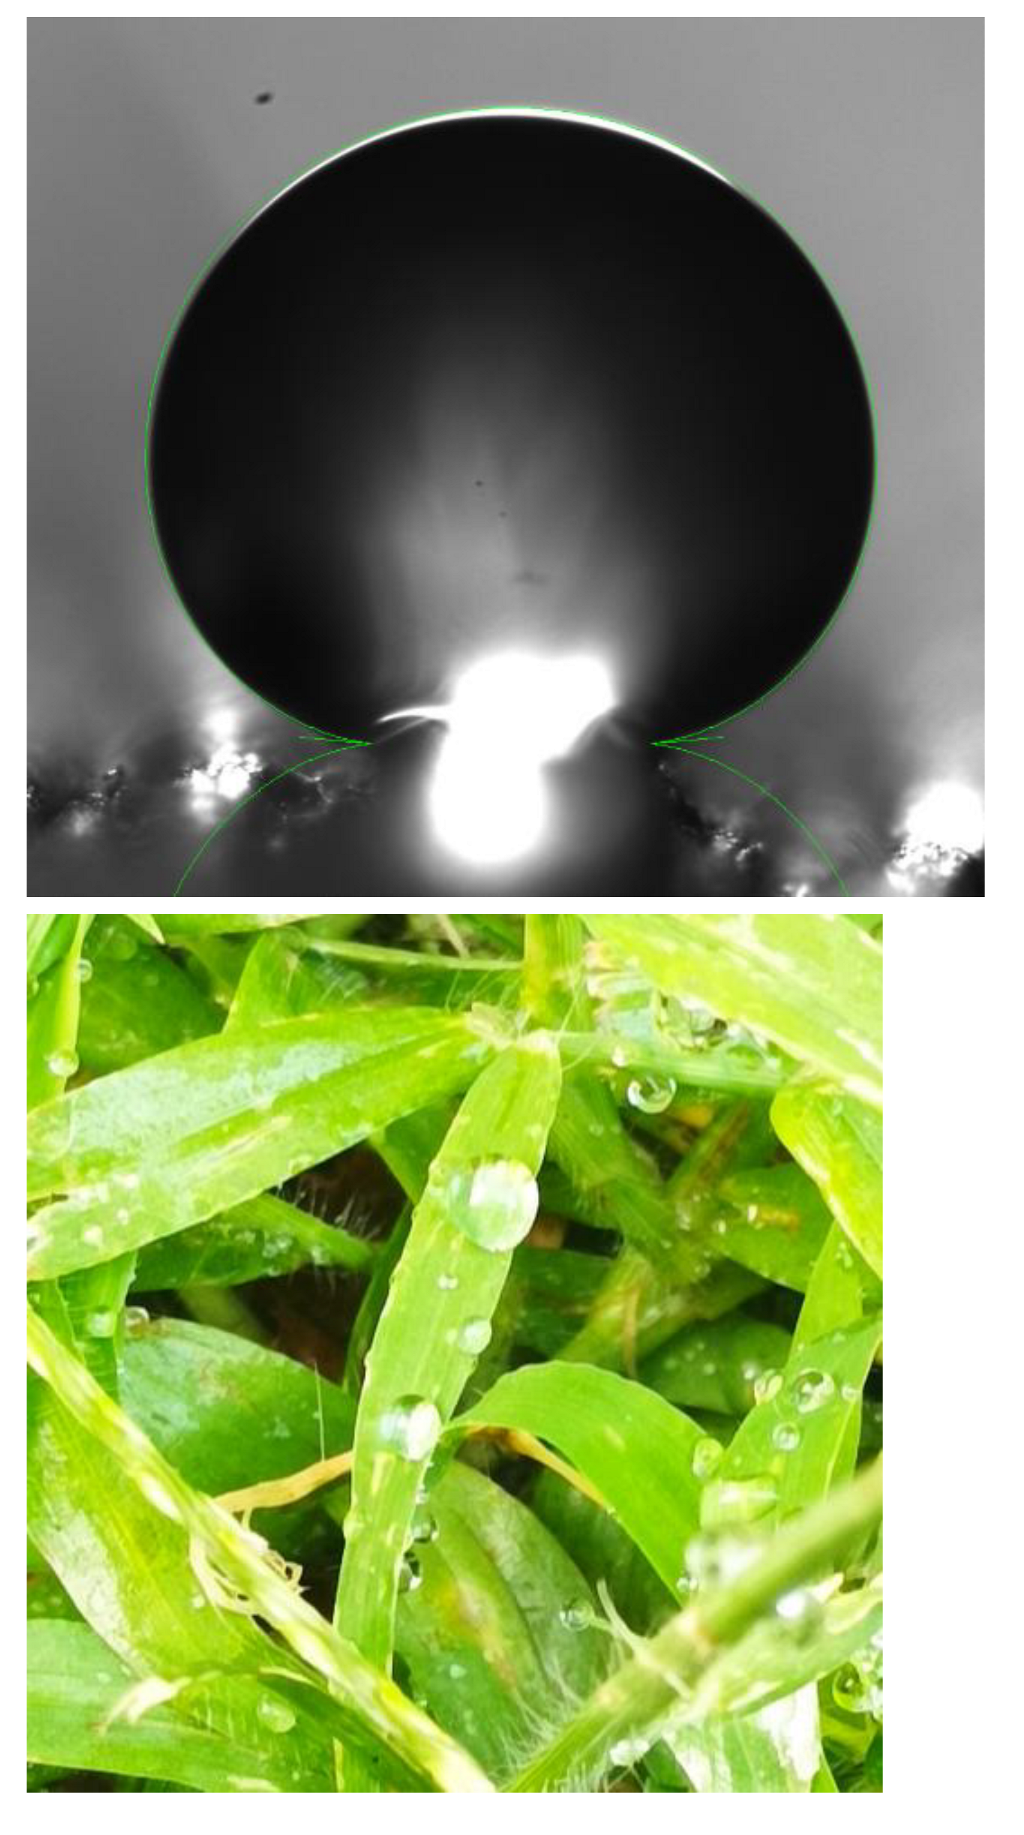
Figure 2.
Droplet triple line balance by forces per unit of length (γ and F/h) and the Laplace pressure ΔP.
Figure 2.
Droplet triple line balance by forces per unit of length (γ and F/h) and the Laplace pressure ΔP.
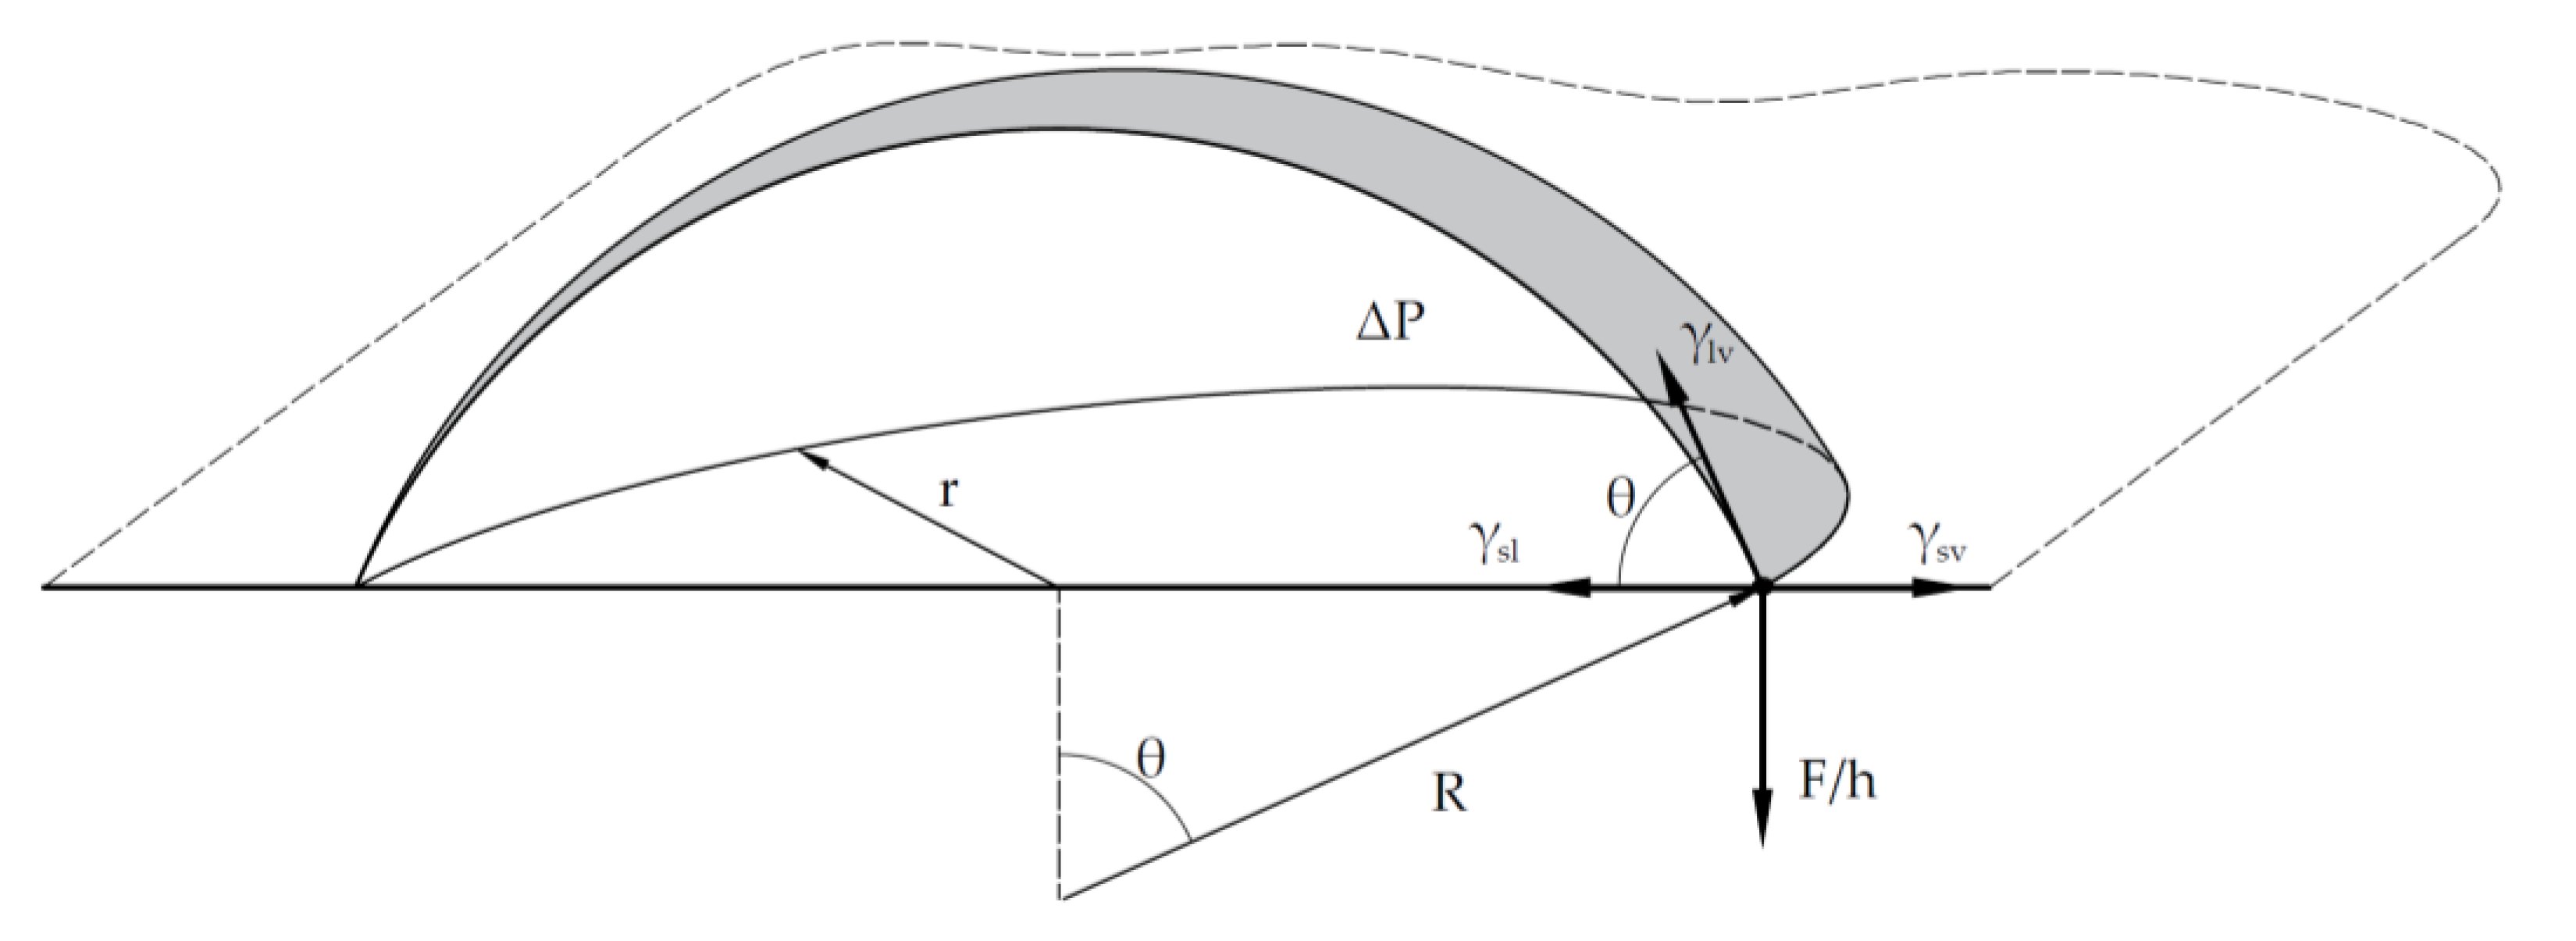
Figure 3.
Detachement force Fd measurement diagramme. Adapted from [25].
Figure 3.
Detachement force Fd measurement diagramme. Adapted from [25].
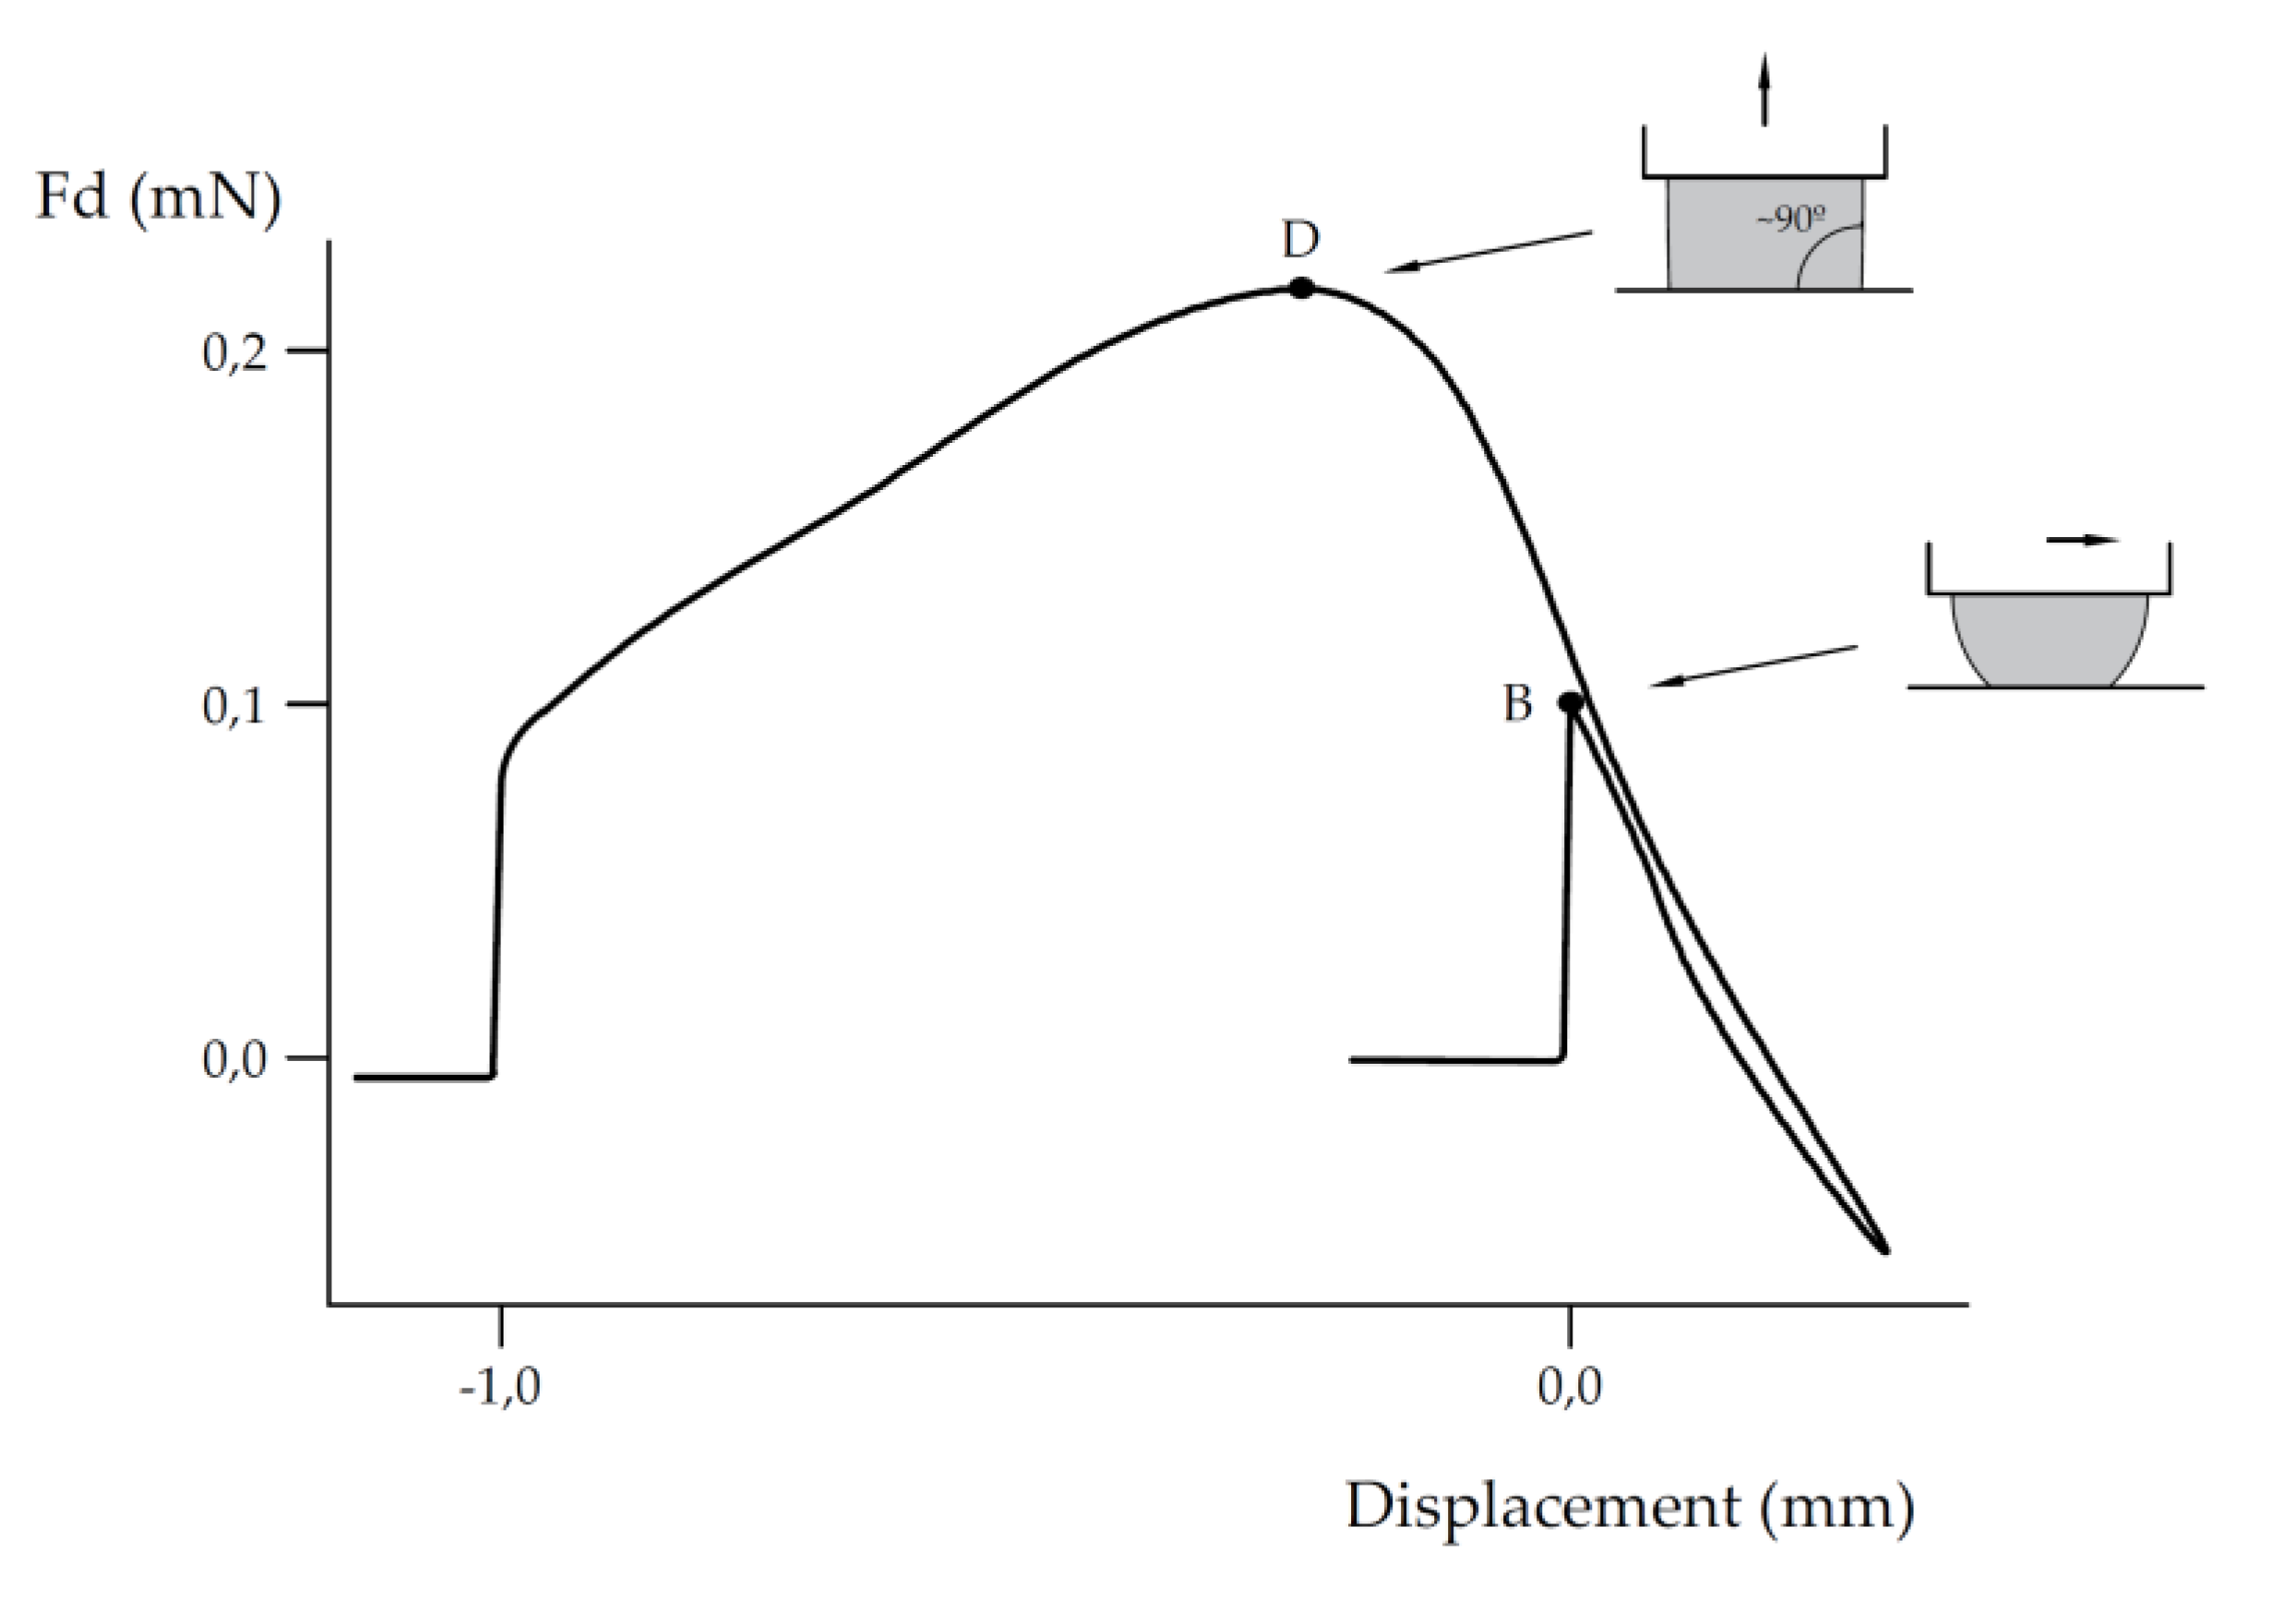
Figure 4.
Total length of triple line 2πφ function of the contact angle θ for the model of vertical balance of the triple line, by (12).
Figure 4.
Total length of triple line 2πφ function of the contact angle θ for the model of vertical balance of the triple line, by (12).
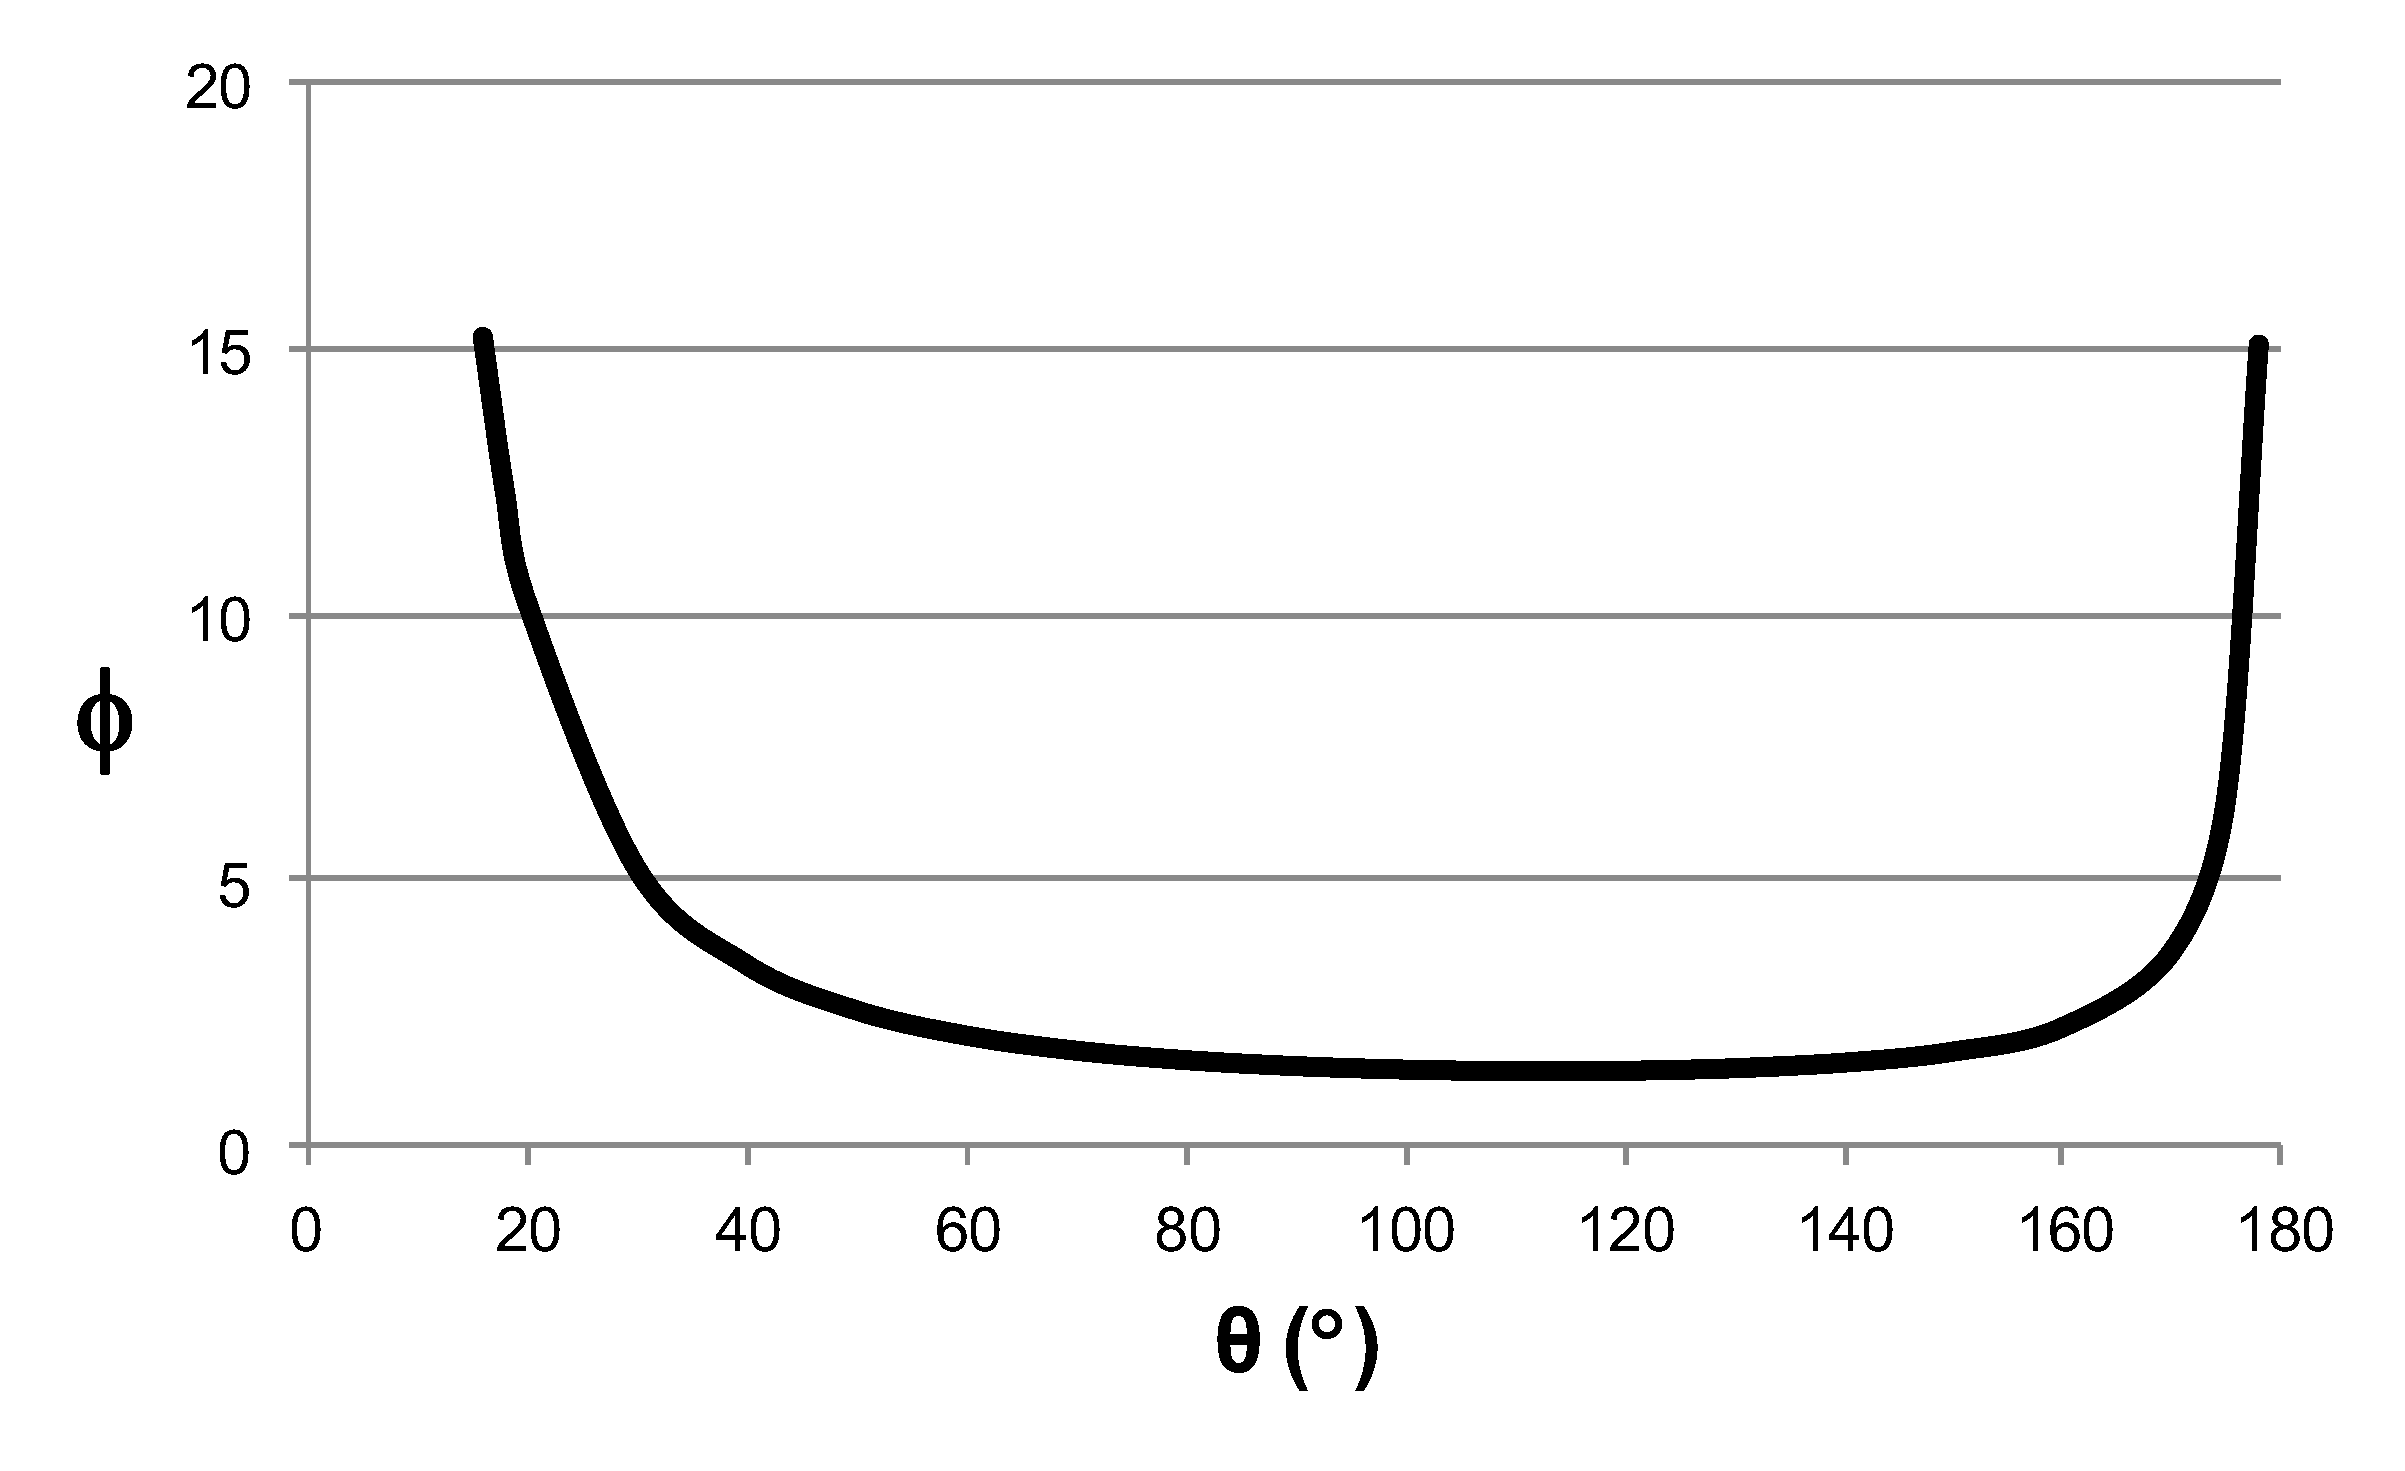
Figure 5.
Comparison of r1 and fs vs. r1v and fsv for the adaxial (AD) leaves’ surface.
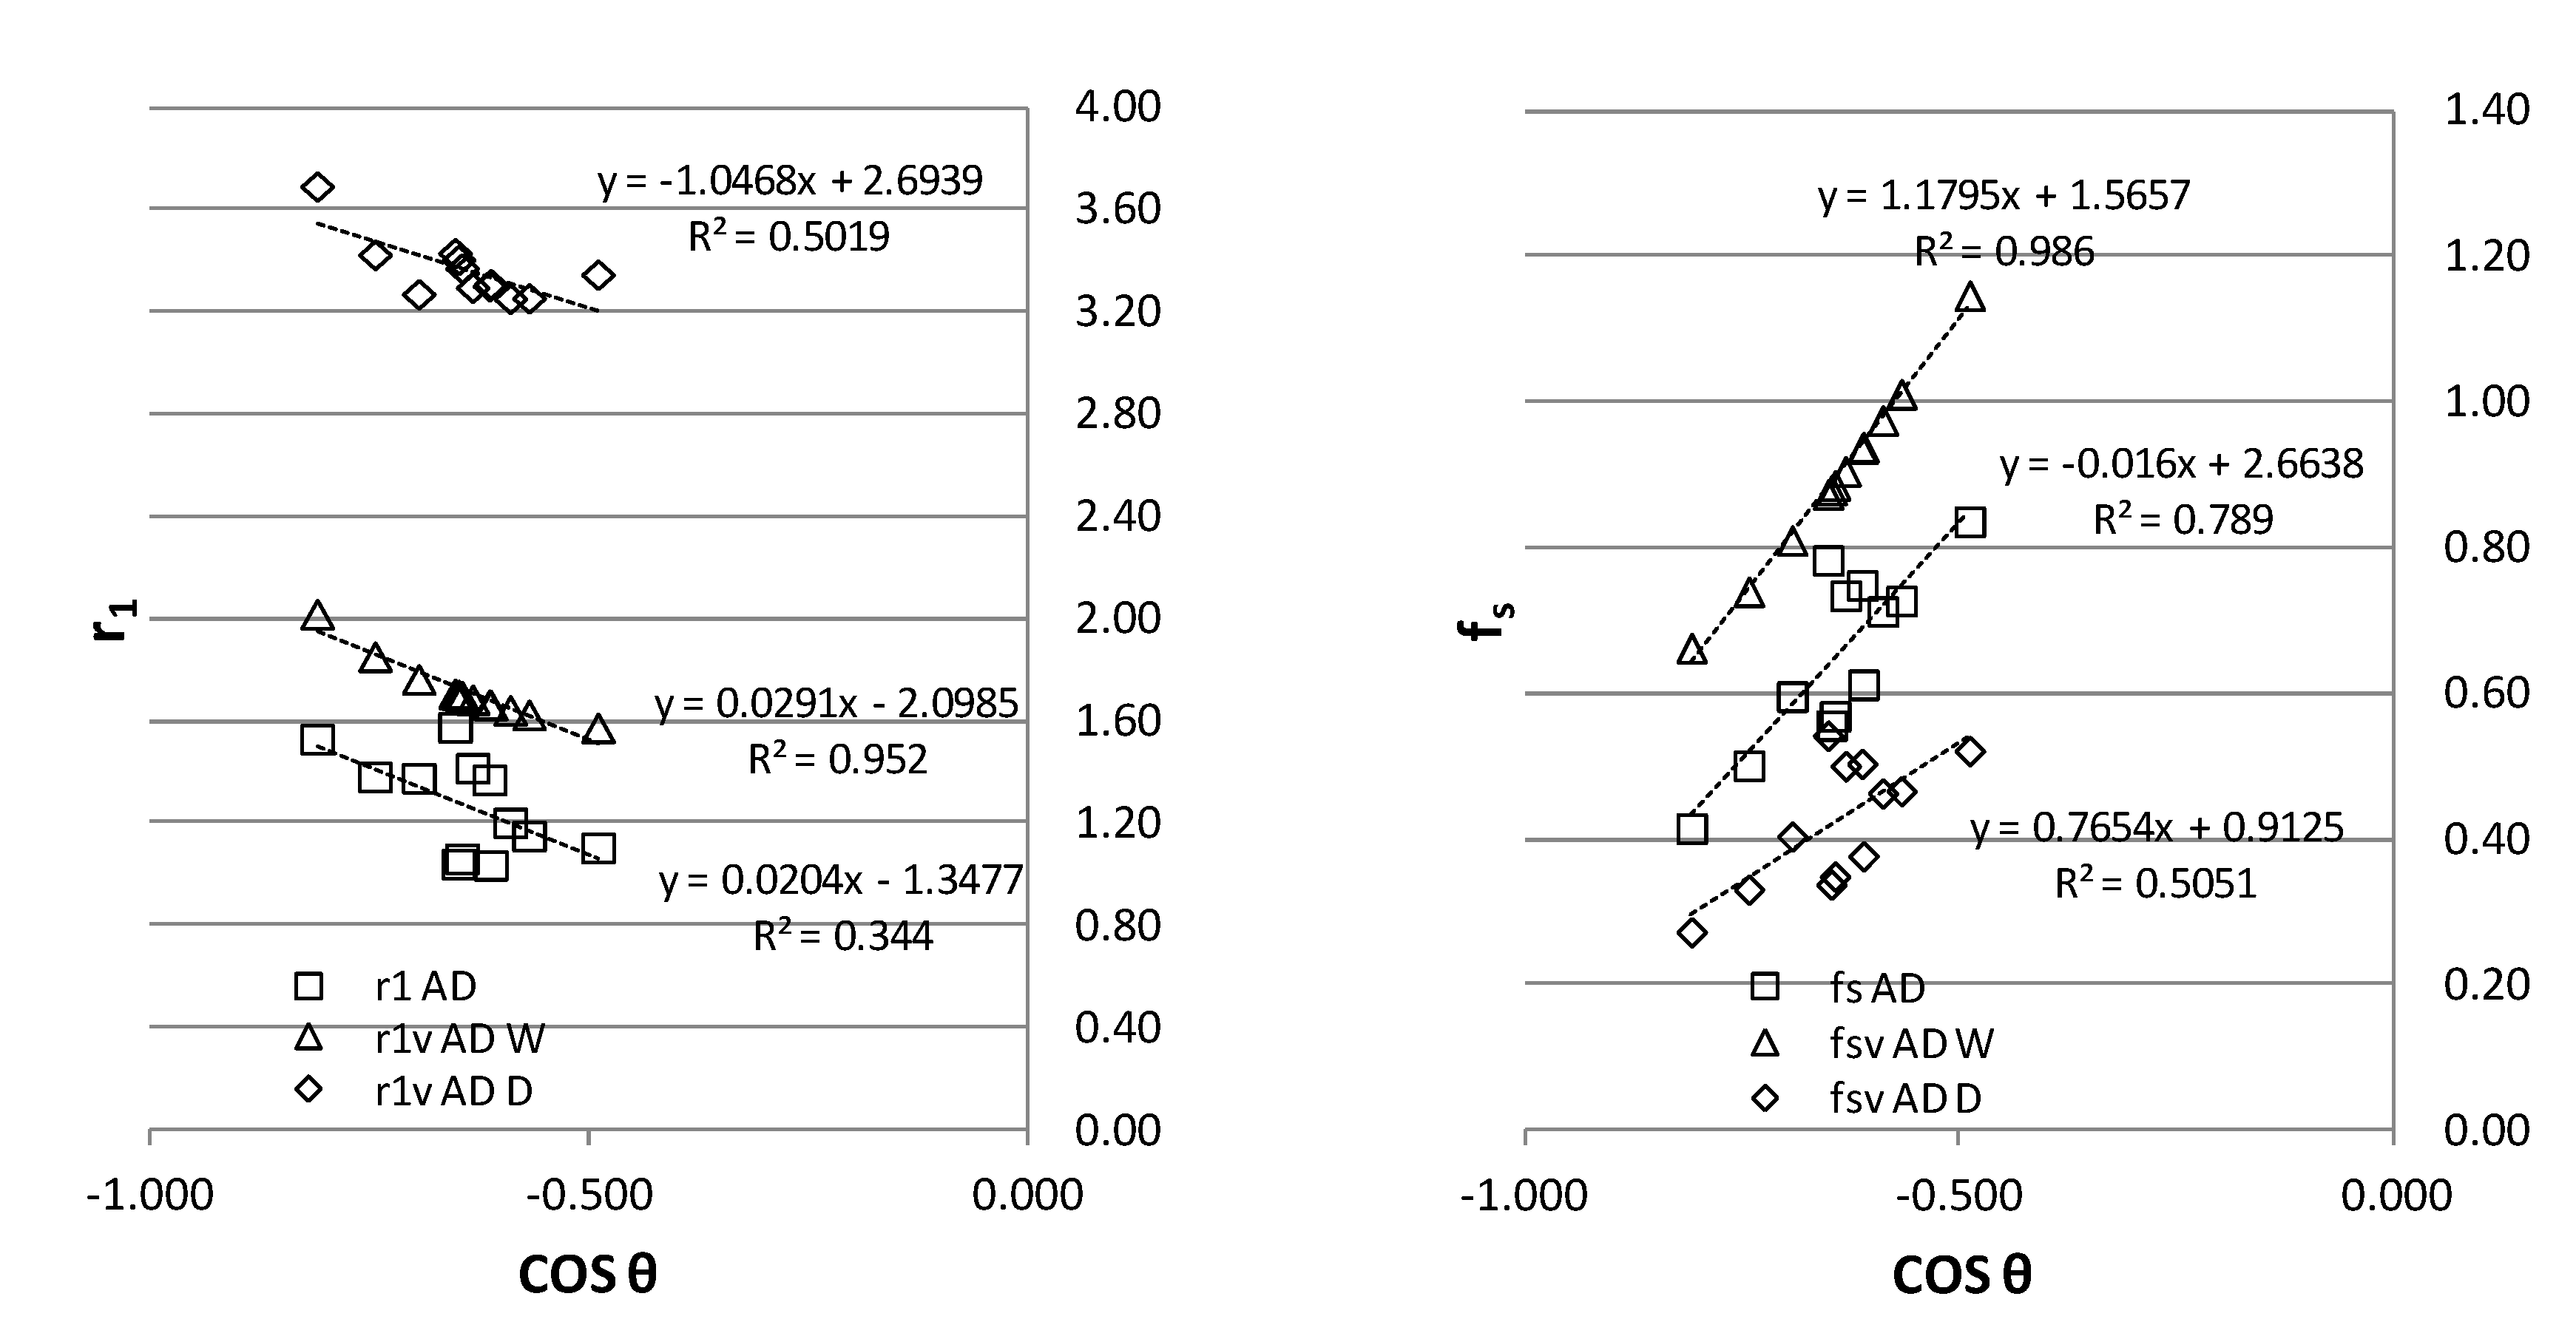
Figure 6.
Comparison of r1 and fs vs. r1v and fsv for the abaxial (AB) leaves’ surface.
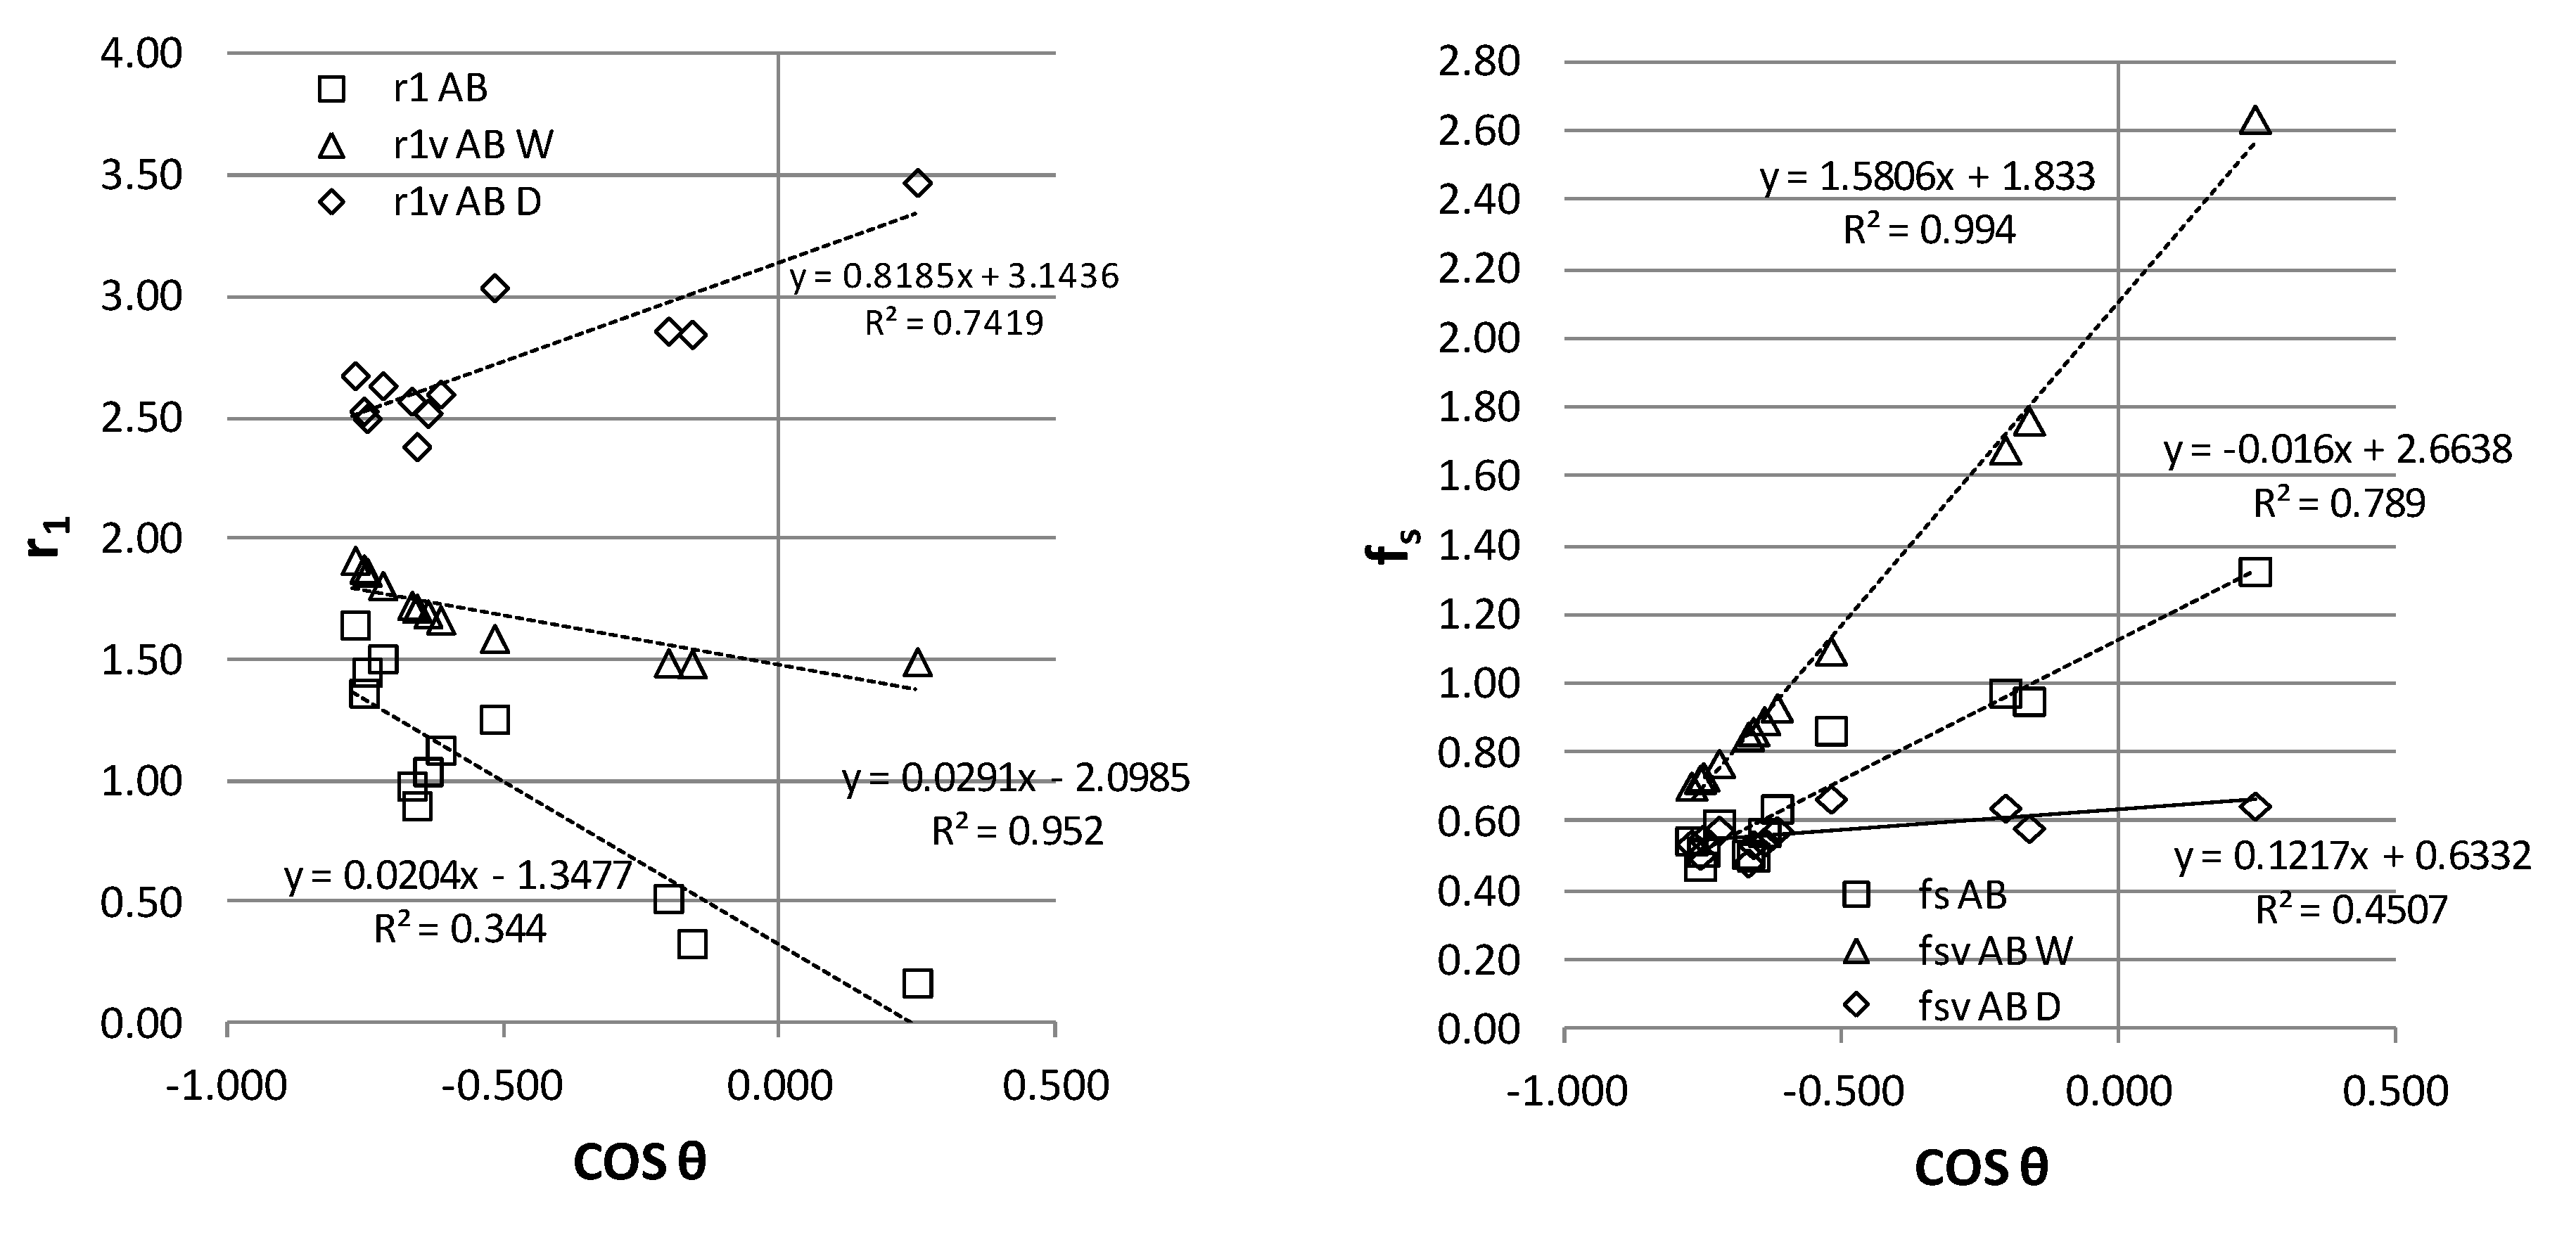

Table 1.
Leave adaxial surface (AD) contact angle (θ) [37] for water (W) and diiodomethane (D).
Table 1.
Leave adaxial surface (AD) contact angle (θ) [37] for water (W) and diiodomethane (D).
| θW | θG | θD | cosθWY | cosθGY | cosθDY | r1 WD | fs WD | r1WG | fs WG | r1 GD | fs GD | |
| Bluegum eucalypt | 142.58 ± 6.70 | 136.52 ± 11.15 |
84.03 ± 6.99 |
-0.352 | -0.122 | 0.385 | 0.959 | 0.001 | 1.919 | 0.007 | -0.006 | 2.000 |
|
Chilean myrtle |
100.48 ± 4.97 | 98.24 ± 6.49 |
60.01 ± 2.65 |
-0.352 | -0.122 | 0.385 | 0.191 | 0.040 | 0.809 | 0.030 | -0.007 | 2.001 |
Table 2.
Contact angle (CA) on adaxial surface (AD) and model parameters for water (W) and diiodomethane (D).
Table 2.
Contact angle (CA) on adaxial surface (AD) and model parameters for water (W) and diiodomethane (D).
| θW (°) | θD (°) | CBTLM | VBTLM for W VBTLM for D | ||||||||
| # | Species | AD | AD | r1 AD | fs AD | | r1v AD | fsv AD | | r1v AD | fsv AD |
| 1 | Agropyron mongolicum | 138 | 103.5 | 1.382 | 0.501 | 1.631 | 1.853 | 0.740 | 1.803 | 3.426 | 0.331 |
| 2 | Bupleurum | 127.7 | 98.3 | 1.036 | 0.612 | 1.623 | 1.664 | 0.939 | 1.870 | 3.312 | 0.376 |
| 3 | Euphorbia lunulata | 130.7 | 75.1 | 1.577 | 0.783 | 1.618 | 1.708 | 0.873 | 2.318 | 3.433 | 0.542 |
| 4 | Ixeris polycephala | 133.9 | 95.1 | 1.377 | 0.596 | 1.619 | 1.765 | 0.810 | 1.917 | 3.272 | 0.403 |
| 5 | Lespedeza bicolor | 126.1 | 87.6 | 1.202 | 0.713 | 1.627 | 1.643 | 0.975 | 2.043 | 3.254 | 0.463 |
| 6 | Leymus chinensis | 130.4 | 102.8 | 1.042 | 0.556 | 1.619 | 1.703 | 0.880 | 1.811 | 3.407 | 0.337 |
| 7 | Populus davidiana | 119.3 | 79 | 1.104 | 0.836 | 1.659 | 1.575 | 1.147 | 2.222 | 3.348 | 0.521 |
| 8 | Robinia pseudoacacia | 130.1 | 101.5 | 1.062 | 0.569 | 1.619 | 1.699 | 0.886 | 1.827 | 3.374 | 0.348 |
| 9 | Rosa xanthina | 129.2 | 82.3 | 1.416 | 0.734 | 1.620 | 1.685 | 0.905 | 2.149 | 3.298 | 0.500 |
| 10 | Sophora davidii | 127.8 | 81.8 | 1.370 | 0.748 | 1.623 | 1.665 | 0.936 | 2.160 | 3.304 | 0.503 |
| 11 | Sophora flavescens | 124.6 | 87.2 | 1.151 | 0.727 | 1.632 | 1.625 | 1.011 | 2.051 | 3.256 | 0.466 |
| 12 | Stipa capillata | 144 | 110 | 1.530 | 0.414 | 1.676 | 2.020 | 0.662 | 1.732 | 3.694 | 0.272 |
Table 3.
Contact angle (CA) on adaxial surface (AD) and model parameters for water (W) and diiodomethane (D).
Table 3.
Contact angle (CA) on adaxial surface (AD) and model parameters for water (W) and diiodomethane (D).
| θW (°) | θD (°) | CBTLM | VBTLM for W VBTLM for D | ||||||||
| # | Species | AB | AB | r1 AB | fs AB | | r1v AB | fsv AB | | r1v AB | fsv AB |
| 1 | Agropyron mongolicum | 99.2 | 85.9 | 0.330 | 0.951 | 1.858 | 1.486 | 1.763 | 2.076 | 2.847 | 0.582 |
| 2 | Bupleurum | 128 | 94.8 | 1.130 | 0.639 | 1.622 | 1.668 | 0.932 | 1.921 | 2.600 | 0.576 |
| 3 | Euphorbia lunulata | 121.2 | 73.5 | 1.258 | 0.865 | 1.648 | 1.591 | 1.097 | 2.361 | 3.040 | 0.667 |
| 4 | Ixeris polycephala | 140.4 | 96.2 | 1.646 | 0.546 | 1.644 | 1.914 | 0.705 | 1.900 | 2.677 | 0.537 |
| 5 | Lespedeza bicolor | 129.7 | 101.6 | 1.041 | 0.570 | 1.619 | 1.692 | 0.895 | 1.826 | 2.522 | 0.543 |
| 6 | Leymus chinensis | 101.7 | 80.3 | 0.517 | 0.975 | 1.825 | 1.491 | 1.679 | 2.193 | 2.861 | 0.641 |
| 7 | Populus davidiana | 131.2 | 109.1 | 0.900 | 0.500 | 1.618 | 1.716 | 0.863 | 1.741 | 2.384 | 0.536 |
| 8 | Robinia pseudoacacia | 131.9 | 107.5 | 0.981 | 0.508 | 1.618 | 1.728 | 0.849 | 1.757 | 2.571 | 0.482 |
| 9 | Rosa xanthina | 136.1 | 93.4 | 1.507 | 0.596 | 1.624 | 1.810 | 0.771 | 1.943 | 2.636 | 0.577 |
| 10 | Sophora davidii | 139 | 106.2 | 1.366 | 0.473 | 1.636 | 1.878 | 0.725 | 1.771 | 2.530 | 0.504 |
| 11 | Sophora flavescens | 138.5 | 101.5 | 1.452 | 0.514 | 1.633 | 1.865 | 0.732 | 1.827 | 2.500 | 0.551 |
| 12 | Stipa capillata | 75.6 | 65.6 | 0.330 | 0.951 | 2.305 | 1.495 | 2.638 | 2.601 | 3.475 | 0.647 |
Table 4.
Surface texture parameters (heigth, features and stratified surface) vs. contact angle, for a selection of hydrophobic leaves.
Table 4.
Surface texture parameters (heigth, features and stratified surface) vs. contact angle, for a selection of hydrophobic leaves.
| # |
θW (°) |
Amplitud A (µm) |
Sp (µm) |
Sz (µm) |
S10z (Poda=5%Sz) (1/mm²) |
S5p (Poda=5%Sz) (mm³) |
Spkx (mm) |
|
| 1 | Allium sativum | 150 | 6660.2 | 54.1 | 105.1 | 13.6 | 90.6 | 13.6 |
| 2 | Acer pseudoplatanus | 155 | 6899.1 | 49.8 | 104.6 | 36.3 | 95.2 | 36.3 |
| 3 | Bambusa vulgaris | 152 | 2229.8 | 44.5 | 91.7 | 28.7 | 85.6 | 28.7 |
| 4 | Arundo donax | 134.8 | 132629.2 | 186.6 | 334.6 | 143.7 | 315.5 | 143.7 |
| 5 | Iris Germanica | 146 | 6883.8 | 57.6 | 121.2 | 42.8 | 109.9 | 42.8 |
| 6 | Loropetalumchinese | 126 | 60865.0 | 103.4 | 181.5 | 84.5 | 169.3 | 84.5 |
| 7 | Populus Tremula | 130.9 | 222409.6 | 272.4 | 529.0 | 206.2 | 526.0 | 206.2 |
| 8 | Tradescantia pallida | 143.1 | 5317.5 | 141.3 | 323.5 | 119.3 | 303.2 | 119.3 |
| 9 | Liriodendron tulipifera | 148 | 4157.1 | 89.2 | 145.1 | 74.5 | 112.4 | 74.5 |
Table 5.
Surface texture parameters (dales and hills features) vs. contact angle, for a selection of hydrophobic leaves.
Table 5.
Surface texture parameters (dales and hills features) vs. contact angle, for a selection of hydrophobic leaves.
| # |
θW (°) |
Sdv (Poda=5%Sz) (mm³) |
Sdvq (Poda=5%Sz) (mm³) |
Shffq (Poda=5%Sz) (no unit) |
Sdffq (Poda=5%Sz) (no unit) |
Sded (Poda=5%Sz) (mm) |
|
| 1 | Allium sativum | 150 | 6660.2 | 54.1 | 105.1 | 13.6 | 90.6 |
| 2 | Acer pseudoplatanus | 155 | 6899.1 | 49.8 | 104.6 | 36.3 | 95.2 |
| 3 | Bambusa vulgaris | 152 | 2229.8 | 44.5 | 91.7 | 28.7 | 85.6 |
| 4 | Arundo donax | 134.8 | 132629.2 | 186.6 | 334.6 | 143.7 | 315.5 |
| 5 | Iris Germanica | 146 | 6883.8 | 57.6 | 121.2 | 42.8 | 109.9 |
| 6 | Loropetalumchinese | 126 | 60865.0 | 103.4 | 181.5 | 84.5 | 169.3 |
| 7 | Populus Tremula | 130.9 | 222409.6 | 272.4 | 529.0 | 206.2 | 526.0 |
| 8 | Tradescantia pallida | 143.1 | 5317.5 | 141.3 | 323.5 | 119.3 | 303.2 |
| 9 | Liriodendron tulipifera | 148 | 4157.1 | 89.2 | 145.1 | 74.5 | 112.4 |
Table 6.
Model parameters vs. contact angle of VBTLM, for a selection of hydrophobic leaves .
| # | θW (°) | φ | φ2 | φ1 | r1v | fsv | |
| 1 | Allium sativum | 150 | 1.77 | 0.48 | 1.28 | 2.49 | 0.52 |
| 2 | Acer pseudoplatanus | 155 | 1.95 | 0.47 | 1.48 | 2.77 | 0.53 |
| 3 | Bambusa vulgaris | 152 | 1.83 | 0.48 | 1.35 | 2.60 | 0.52 |
| 4 | Arundo donax | 134.83 | 1.50 | 0.37 | 1.13 | 1.79 | 0.63 |
| 5 | Iris Germanica | 146 | 1.67 | 0.47 | 1.19 | 2.27 | 0.53 |
| 6 | Loropetalumchinese | 126 | 1.43 | 0.23 | 1.20 | 1.56 | 0.77 |
| 7 | Populus Tremula | 130.9 | 1.46 | 0.31 | 1.15 | 1.67 | 0.69 |
| 8 | Tradescantia pallida | 143.1 | 1.61 | 0.46 | 1.15 | 2.12 | 0.54 |
| 9 | Liriodendron tulipifera | 148 | 1.71 | 0.48 | 1.23 | 2.38 | 0.52 |
Table 7.
Correlation coefficient of aereal texture parameters with contact angle and VBTLM parameters, for a selection of hydrophobic leaves .
Table 7.
Correlation coefficient of aereal texture parameters with contact angle and VBTLM parameters, for a selection of hydrophobic leaves .
| θW | A | Sp | Sz | Spkx | S10z | S5p | Sdv | Sdvq | Shffq | Sdffq | Sded | |
| θW | 1.00 | -0.73 | -0.72 | -0.67 | -0.73 | -0.67 | -0.72 | -0.62 | -0.66 | 0.73 | 0.60 | -0.55 |
| φ | 0.96 | -0.69 | -0.75 | -0.71 | -0.76 | -0.70 | -0.74 | -0.49 | -0.57 | 0.58 | 0.47 | -0.39 |
| φ2 | 0.94 | -0.68 | -0.59 | -0.53 | -0.60 | -0.54 | -0.61 | -0.75 | -0.71 | 0.84 | 0.71 | -0.72 |
| φ1 | 0.72 | -0.51 | -0.67 | -0.66 | -0.68 | -0.64 | -0.64 | -0.14 | -0.30 | 0.21 | 0.14 | -0.01 |
| r1v | 0.99 | -0.73 | -0.76 | -0.71 | -0.77 | -0.71 | -0.75 | -0.54 | -0.60 | 0.67 | 0.55 | -0.46 |
| fsv | -0.94 | 0.68 | 0.59 | 0.53 | 0.60 | 0.54 | 0.61 | 0.75 | 0.71 | -0.84 | -0.71 | 0.72 |
Disclaimer/Publisher’s Note: The statements, opinions and data contained in all publications are solely those of the individual author(s) and contributor(s) and not of MDPI and/or the editor(s). MDPI and/or the editor(s) disclaim responsibility for any injury to people or property resulting from any ideas, methods, instructions or products referred to in the content. |
© 2025 by the authors. Licensee MDPI, Basel, Switzerland. This article is an open access article distributed under the terms and conditions of the Creative Commons Attribution (CC BY) license (http://creativecommons.org/licenses/by/4.0/).
Copyright: This open access article is published under a Creative Commons CC BY 4.0 license, which permit the free download, distribution, and reuse, provided that the author and preprint are cited in any reuse.


