
Submitted:
28 February 2025
Posted:
03 March 2025
You are already at the latest version
Abstract
The Anthropocene is a concept that highlights the profound changes humans have made to nearly every aspect of the Earth. It serves as a compelling narrative that challenges us to examine public perceptions and interests regarding human-nature interactions in an integrated way. These interactions are widespread but can vary significantly over time, across cultures, and under different economic conditions, making them difficult to monitor effectively on a large scale. Recent advancements in digital technology, such as the ability to track online searches through tools like Google Trends-Glimpse and the near real-time monitoring of news broadcasts via the GDELT Project, present new opportunities. These tools can analyze data in multiple languages around the world, encouraging innovative approaches to integrate the diverse and complex information generated within this multi-language, multi-concept, and varied time-scale environment of human activity and beliefs. We propose a transformed version of Markowitz’s multi-asset optimization theory that encompasses over 5.5 billion people, several languages, and concepts since 2004. This approach is a functional ensemble where ecology and economics intersect, at least mechanistically. Our findings indicate that while there is a general increase in people’s interest in Anthropocene-related issues, significant differences exist across cultures. We also identify several sources of data noise and evidence that interfere with the overall methodology. Addressing these issues in future research will help to extend the validity of our approach, especially if it increases interest in conservation culturomics.
Keywords:
conservation
; biodiversity
; sustainability
; climate change
; multi-asset optimization
; risk-return theory
1. Introduction
In 2024, the International Union of Geological Sciences (IUGS) made a balanced decision to reject the proposal for the Anthropocene inclusion in the Geologic Time Scale, as a geological epoch distinct from the Holocene, based on chrono-statigraphic criteria. They, however, recognized that “the Anthropocene as a concept will continue to be widely used not only by Earth and environmental scientists, but also by social scientists, politicians and economists, as well as by the public at large. As such, it will remain an invaluable descriptor in human-environment interactions” [1] (p.3). Thus, the Anthropocene, a term coined and popularized by Crutzen and Stoermer [2], has moved beyond formal nomenclature and the more complex scientific debates regarding whether it accurately reflects the geology of humankind [3], its chronological framework, e.g., the rise of agriculture, the invention of the steam engine or the first detonation of atomic bomb [4,5,6], its connection to the Great Acceleration [7], or the accumulation of human-made materials on Earth [8]. Instead, it has become a key element in the narratives’ landscape surrounding conservation efforts [9]. The overall process reveals contrasting philosophies and the various meanings assigned to them during the numerous years of scientific debate.
In this paper, the concept of the Anthropocene is used as a conservation narrative [9], highlighting humans’ impacts on Earth’s oceans, geology, landforms, landscapes, freshwater systems, hydrology, ecosystems, biodiversity, and climate. This concept is linked to the idea of Accelerating Change [10], which refers to the rapid and exponential rate of technological advancement observed in recent history. This acceleration may indicate a more abrupt and profound transformation in the social, political, economic, and cultural factors that shape human-nature relationships [11] and, to some extent, changes or shifts in relative beliefs, perceptions, or preferences of public opinion [12].
In geology, the terms “golden peak” and “golden spike” refer to markers that define the boundaries of geological time periods. Similarly, we can identify disruptions in conservation narratives and practices that help us understand the accelerating changes of the Anthropocene narrative. First, there is the issue of the politicization of conservation science [13,14,15]. Key concepts in environmental discourse, such as conservation, biodiversity, climate change, and sustainability, are largely re-formulations of scientific ideas that have been around for decades. These terms often serve, currently, to support political decisions and advance policy agendas.
Secondly, ’bureaucratic capture’ [16] and the corporate mindset of the conservation establishment, such as international Environmental Non-Governmental Organizations [17] (pp. 7-8), have resulted in the articulation of conservation priorities and needs that align with prevailing development policies [18,19]. As several authors state, the almost avoidance of public recognition that action to protect nature happens when arguments are framed in terms that resonate with the combination of imagination, feelings, and rationality that guide decision-making in people’s everyday lives [20,21] could be a social Anthropocene’s marker. Thirdly, as a plausible extension of the previous, the denial of scientific findings in the area of environmental science and policy, especially regarding existentialistic risks, mostly climate change and emerging diseases [22], is neither a new phenomenon nor disconnected from conspiracy theories and distrust to scientists’ practices and integrity [23,24,25]. The phenomenon’s extent and severity might be a marker of the Anthropocene’s counter-narratives.
However, the accelerating change in the Anthropocene narrative [10] is rooted in technological change and progress, the advent of the Internet and the World Wide Web [26], and the technology of digitizing printed material [27,28]. The recording of internet users’ searches, mostly through Google web search engine and its services Google Trends offered the technical foundations for establishing culturomics [29] and conservation culturomics [30,31] and the processing of internet searches’ records in almost real-time. The recent extension of Google Trends-Glimpse [32] recording the Absolute Search Volume in Google (ASVG) without normalization increased further the technological capacity, revolutionizing the extent of the boundaries of rigorous quantitative inquiry to a wide array of new phenomena spanning the social sciences and the humanities [29] (p. 176). The same stands for conservation culturomics [30] (p. 269), focusing on demonstrating public interest in nature, identifying conservation emblems, providing new metrics and tools for near-- real-time environmental monitoring and supporting conservation decision-making, and framing conservation issues and promoting public understanding.
The above gain is enhanced and multiplied with the introduction of the technological capabilities of The GDELT Project [33], summarized in the document Culturomics 2.0 [34]. As Leetaru [34] explains, “the traditional Culturomics approach treats every word or phrase as a generic object with no associated meaning and measures only the change in the frequency of its usage over time. The Culturomics 2.0 approach extends this model by imbuing the system with higher–level knowledge about each word, specifically focusing on “news tone” and geographic location, given their importance to understanding news coverage. Translating textual geographic references into mappable coordinates and quantifying the latent “tone” of news into computable numeric data permits an entirely new class of research questions to be explored via the news media, not possible through the traditional frequency count approach”. The GDELT Project monitors the world’s broadcast, print, and web news from nearly every corner of every country in over 100 languages.
Conservation Culturomics 2.0 is a subtle nod to the original Culturomics 2.0 and should be regarded as a subfield of the almost limitless, real-time evolving GDELT thesaurus [33]. This study aims to explore how advances in technology, specifically through monitoring public opinion via internet user searches (using tools like Google Trends- Glimpse), can complement the efforts to analyze how the ‘same’ public opinion as information receivers interact with key concepts such as conservation, biodiversity, climate change, and sustainability (as seen in the GDELT Project). By examining dominant communication streams, the research addresses doubts, inconsistencies, and variations in the existing literature concerning the early phase of conservation culturomics [35]. After all, as described on the Society of Conservation Biology website ‘Conservation Culturomics’ [36], its scientific program focuses on ‘insights that could prove to be key in allocating funds for conservation projects, increasing their visibility and success, and ultimately incorporating social aspects of conservation on a broad scale in a quantitative fashion’.
As a reminder, three key elements highlight the controversies that characterized the early phase of Conservation Culturomics from 2013 to 2020. First, there are questions regarding the validity and replicability of normalized Google Trends data reflecting public searches on relevant keywords [37,38,39,40,41]. Second, the language in which these searches were conducted raises additional concerns [42]. Third, various independent confounding factors, such as internet penetration rates by country, literacy levels, press freedom, and access to information, further complicate the analysis [43].
In this contribution, we aim to shift focus from the typical questions raised during the early phase of conservation culturomics, as previously outlined. We aim to harness the methodological similarities between ecology, economics, and control theory [44,45]. Our objective is to identify statistical descriptives of environmental topics related to the Anthropocene narrative across major languages used in online searches. This is particularly important in a world where the flow of information holds significant practical implications. Environmental awareness is a fundamental motivator for individuals to engage in behaviors that protect the environment [46].
However, this massive flow of information, projected to reach 149 zettabytes by 2024, of data created, captured, copied, and consumed globally often exceeds individuals’ capacity to remember pieces of information or understanding. People have a specific capacity for remembering pieces of information, the entropy of which can be expected to influence the rate at which they distort information or make mistakes [47]. This can lead to secondary undesirable social phenomena, such as the diffusion of damaging rumors [48,49], the spread of misinformation, or the distortion of truth [50].
We examine two questions: (1) Can we compare measures of size vs. variation of public interest regarding the flag keywords of the Anthropocene narrative, i.e., conservation, biodiversity, sustainability, and climate change, across the major languages of web searches as a proxy of conceptual differentiation of human-nature relationships worldwide? (2) Is it feasible to estimate the effect of information entropy on the conservation of environmental awareness in people’s memory in various languages as a proxy of social and cultural conditions? We assume that such answers might help uncover public interest deficits in various cultural setups that warrant increased conservation community efforts.
2. Materials and Methods
Consider a population of N individuals whose searches on k environmental topics related to the Anthropocene narrative (k = 1…4, conservation, biodiversity, sustainability, climate change) are recorded for a period t ( = 1…21 years, or = 1…252 months, from January 1, 2004, to December 2024). These individuals are categorized into l major Internet languages (l = 1…9, including English, Chinese, Spanish, Portuguese, French, German, Arabic, Russian, and Japanese). It is important to note that we focused on nine out of the top ten languages consistently present on Internet surveillance web pages [51]. The tenth language was excluded from our analysis due to its inconsistency during the observation period, as it alternated between Italian, Indo-Malaysian, Turkish, and Persian.
The methodology consists of two parts. The first part involves studying the evolution of the ratio of the population of internet users, serving as a proxy for public opinion, to the volume of mass media information on environmental topics related to the Anthropocene narrative over a specific period. This ratio will be referred to symbolically as the Public Opinion Response to Information Entropy (PRIE).
To analyze PRIE, we will calculate its expected (or average) value and standard deviation during a defined period (t). PRIE can be considered as a multi-language (l) ensemble based on a specific flag keyword (k) or, conversely, as a multi-keyword (k) ensemble tied to a particular language (l). In both cases, the individual elements comprising the variable PRIEt must be weighed, ensuring that the total weight is 1 or 100%.
This methodology requires matrix algebra and is analogous to the process of calculating the “efficient frontier,” inspired by H. Markowitz’s risk-return relationship for multi-asset portfolios [52]. In the present context, the ‘efficient frontier’ represents a set of values of optimal highest expected PRIE for a given level of PRIE’s standard deviation (SD) or the lowest SD for a given level of expected PRIE. Specifically, for the time series of data for PRIE related to a language (or a keyword), we will have l = 8 (or k = 4) and a total of tm = 96 months, covering the period from January 2017 to December 2024. Our goal is to identify combinations that yield either the highest expected PRIEt with the lowest PRIE standard deviation, or vice versa.
Here are two important remarks concerning the data: (1) The first remark addresses the adjustment of the Absolute Search Volume in Google-Glimpse (ASVG henceforth) for 2004-2024 across the k topics in the top 9 languages used for internet searches. This adjustment accounts for the evolution of the internet penetration rate. It is noteworthy that the total number of internet users in 2005 was approximately 1,023 billion, whereas it reached 5.5 billion by 2024 [51]; (2) To make these adjustments, we calculated each language’s cumulative growth rate (either per year or per month), using the formula
where ty represents the time period. We then multiplied the ASVG per l and k per time unit over the entire observation period. Google Translate also translated the searched keywords into each language used (see Appendix A). We also collected data on the geographical distribution of ASVG frequencies by language and keyword and a world map highlighting the countries and territories with the highest frequencies for each language and keyword.
We focused on the period from January 2017 to December 2024 for the GDELT Project, which made its data publicly available at that time (refer to the Introduction section). This timeframe represents a total of ty = 7 years or tm = 96 months. The GDELT data collection follows the same consistent rationale, utilizing the same k keywords and l languages while analyzing information sources around the world. The specific GDELT query we employed is https://api.gdeltproject.org/api/v2/summary/summary?d=web&t=compare [53]. This query assesses the volume of up to four web and TV news keywords across various networks. It enables us to analyze human faces’ average “tone” in images, capturing both positive and negative expressions. By combining these expressions, we generated raw data reflecting the frequency of appearance for each keyword, presented as a precise time series without any smoothing applied. It is important to note that Japanese data were excluded at this stage, as we did not receive GDELT returns after the end of 2022.
The variable of interest in this analysis is the ratio of ASVG to the GDELT appearance frequency for each keyword and language over a specified period. Information entropy Hfi for PRIE(t,k,l) is calculated using the classical Shannon information entropy formula, defined as follows
where fi is the frequency of information type i, corresponding to the PRIE value for keyword ki (i = 1…4) at a specific language and time ti. It is important to note that a high fi indicates that interested individuals frequently receive this information or that the GDELT value for ki is elevated. In the context of the Anthropocene narrative, information related to environmental topics can be expressed as a binary string of length k (for instance, ‘1011’ when k = 4). Given that information is represented in a binary format, there are 2k possible types of information, each labeled with an integer 0 ≤ i ≤ 15. Additionally, entropy increases as the distribution of different types of information approaches uniformity (when fi → 1/2k). In that case, Hmax = LN(4). Conversely, entropy decreases when one type of information begins to dominate (when fi → 1).
Although it is a broad generalization, we assume that an individual searcher/receiver of information is an average representative of a PRIE(t,k,l).This assumption allows us to connect information entropy, memory span, and mental speed, thereby determining the information entropy associated with short-term memory capacity, which in turn serves as a limiting factor for cognitive functions [47]. Furthermore, this approach enables us to link language and cognition with the likelihood of a person or group remembering, understanding, interpreting, or correctly diffusing information. This probability is represented by a formula inspired by [50]:
The coefficient Ac is referred to as the ‘conservation awareness factor’. It represents an individual’s (or group’s) ability to accurately retain flag keywords’ true or undisputed meaning in each language. This factor is essential for calculating the likelihood of adopting firmly held beliefs within the various components of the Anthropocene narrative.
By definition, Ac is ≥ 0. When Ac is large, the ability to control information distortion is strong, and vice versa. As Hfi approaches Hmax, the probability of distortion approaches a maximal value of 0.5, whereas as Hfi approaches zero, the probability of distortion approaches a minimal value of 1/(eAc + 1).
In the context of the ‘efficient frontier’ of the PRIE, there are four categories of interest to consider. These are: l, representing the languages studied (l = 1…8); m, referring to the months of observation (m = 1…96, covering January 2017 – December 2024); k, denoting the keywords of interest (k = 1…4); and, w, indicating the weights assigned per language (or keyword), which sum to 1 or 100%. The ‘return’ R of the composite PRIE is represented by a matrix of size m x l, for a given k. Mathematically, this is expressed as:
For reasons of notational simplicity, each element rm,lof the matrix symbolizes the ratio ASVGm,l/DELTm,l. Each row of the matrix represents a vector of ‘expected’ (or average) monthly ‘return’ for a specific l. The mean ‘return’ for the entire observation period is calculated by multiplying this vector by tm = 96. The overall expected PRIE return is computed by multiplying this result by a l x 1 vector of languages’ weights, or
Thus, the expected PRIE return is (Note: w and r are l x 1 column vectors, so wT is a row vector of size 1 x l). The PRIE ‘risk’ or Standard Deviation is calculated as the covariance matrix of the ensemble of languages l, given a keyword, for the observation period. Calculations are as follows:
Covariance matrix:
where:
- X is the m x l matrix of the ‘excess returns’, e.g., LN(rli,ti/rli,ti+1), or (rli,ti – average li), for each individual language.
- XT is the l x m transpose of X.
- m is the months of observation.
- Σ is the l x l covariance matrix
The PRIE variance is σ2 = , or (1 x l)x(l x l)x(l x 1), and the PRIE SD is .
The same procedure for calculating expected PRIE returns and standard deviation (SD) can be applied to a size m x k matrix, given a specific language l. Figure 1 illustrates an indicative case of data collection, organization, and calculations in Excel that explore the relationship between the expected (or average) value of PRIE vs. its standard deviation for l = 8 languages and the keyword ‘biodiversity,’ covering a period of 96 months (January 2017 -December 2024). This operation involves 103 Monte Carlo simulations to assign relative weights to each of the height languages within the examined linguistic ensemble. We used the ’RANDARRAY(1,8)’ function in Excel to generate random or dummy weight values, which we then summed. The weight assigned to each language is derived from the random weight divided by the total random weight, ensuring the sum equals 1 or 100%. The expected PRIElis calculated as
Further, it is important to note that the Monthly Variation of PRIE/l can be calculated in two ways: either using the formula LN(PRIEl,t/PRIEl,t+1) or by calculating (PRIEl,ti-averagePRIEl). This approach helps to normalize (or compress) the variations in values for both the numerator and the denominator, which may differ across languages due to varying internet penetration rates and the population size of users. Overall, through this procedure, we expect to generate a ‘cloud’ of expected PRIE vs. SD points, a series of which corresponds to the ‘efficient frontier’.
The model that extended the expected PRIE vs. its SD by incorporating the information entropy and the ‘conservation awareness factor’, Af, also required Monte Carlo simulations to explore the range of Af. This approach combines PRIE calculations (as illustrated in Figure 1) with information entropy estimations over time periods t, with k and l, leading to two main outcomes: (1) it represents the ‘efficient frontier’ for expected PRIE vs. its SD, and (2) it enables the calculation of confidence intervals and probabilities related to misunderstandings, memory failures, or lapses among individuals, considering different languages and various keywords.
Simulations were conducted using TREEPLAN SimVoi 2024. Monte Carlo simulations for Af are based on a ‘randtruncnormal’ distribution incorporating mean, SD, min and max entropy values, with truncation values ranging from 0 to 4. Figure 2 presents a specific case where the relationship between the expected (or average) value of PRIE and its SD aligns with the earlier calculations in Excel. In this instance, we focus on the four Anthropocene flag keywords in the studied languages, covering the same 96-month period (January 2017 -December 2024).
3. Results
We will now present a selection of results that summarize our entire procedure. The first result (Table 1) provides an overview of the descriptive statistics for Internet usage across eight languages and four key terms of interest. This summary serves as the foundation for all calculations related to the efficient frontier, which illustrates the relationship between expected PRIE and the standard deviation of PRIE for ’l’ languages and ’k’ keywords that highlight the concepts of the Anthropocene narrative.
The findings in Table 1 indicate that there is no clear, uniform global pattern regarding public opinions on perceptions of the Anthropocene narrative. The population size for each language and the relative volume of searches suggest that historical and cultural factors play a significant role. For instance, conservation is a priority in English-speaking countries, while sustainability is emphasized in Germany. Socio-political conditions, such as those in China, and a particular interest in nature observed in the Global South (as indicated by Spanish and Portuguese searches in South America) also influence these perceptions. While there is a growing interest in climate change, it cannot be concluded that this interest consistently dominates the Anthropocene narrative over the long term.
Figure 3 illustrates the evolution of four keywords related to the Anthropocene in the three most commonly used languages for internet searches: English, Chinese, and Spanish, from 2004 to 2024. This provides an additional perspective on the quantitative results presented in Table 1. In addition to significant differences in public interest evolution between the Chinese population and those of European origin, two key observations can be made: (1) conceptual priorities vary among cultures. For example, English speakers tend to prioritize conservation for most of the studied period, while Spanish speakers focus more on biodiversity; (2) since around 2020, there has been a noticeable increase in interest in climate change across all three languages, with several monthly peaks of interest evident in the data
Figure 4 illustrates the results of the Expected PRIE versus SD PRIE methodology for the matrix of time by language (m x l) for k = 4. This means that each concept related to the Anthropocene narrative is analyzed separately, with results displayed on the same graph to facilitate keyword comparison. A total of one thousand points per keyword were simulated using a Monte Carlo (normal) procedure. The centroids of each cloud/keyword indicate the perceptional distance on a global scale, representing all languages combined for the period from 2017 to 2024.
Notably, the concepts of conservation and biodiversity appear to share a common conceptual framework that transcends cultures and languages, as their centroids are nearly aligned on the graph. On the other hand, sustainability is the most compact concept, as the area covered by its corresponding data cloud is significantly smaller than that of the other concepts. In contrast, the data cloud for climate change exhibits the highest standard deviation (SD) in PRIE, suggesting substantial variations in perceptions of this phenomenon across different languages and cultures.
Figure 5 illustrates the Efficient Frontier line for the matrix of m x k, categorized by each language l. The y-axis represents the Expected PRIE, while the x-axis shows the standard deviation of PRIE (PRIE SD). Values that fall on the Efficient Frontier are considered optimal, as they provide the best possible Expected PRIE for a given level of PRIE SD. In contrast to the previous results shown in Figure 4, the Efficient Frontier highlights the trade-off between Expected PRIE and PRIE SD. Values located below the frontier are deemed sub-optimal, as they do not yield sufficient Expected PRIE for the corresponding level of PRIE SD. Notably, Spanish and Russian exhibit the steepest slopes on the Efficient Frontier, suggesting that these languages have a significant variability in public interest across different keywords, regardless of the size of the interested population.
Finally, Figure 6 presents a combination of the previous partial results, enhanced by the information entropy related to time, language, and keywords (refer to Figure 2 in the Methods section for details). The noteworthy aspect of this exercise is our ability to calculate confidence intervals and assess the high/low probability ranges for memory failures or misunderstandings of flagged keywords. An awareness ratio of 1 indicates that a person or the public fully remembers or understands the meaning of all the keywords, while a value of 0 signifies a complete disconnection or distortion of their meanings.
There is no clear reason to believe that people who speak different languages have a natural tendency to forget or misunderstand information on Anthropocene-related concepts. However, several intangible factors might contribute to these differences. These factors could include the structure of the language itself, social and political conditions, varying perceptions of nature, the influence of dominant narratives, differences in literacy levels, and familiarity with online searching.
4. Discussion
This discussion serves as a self-reflective essay regarding our contributions. We want to emphasize that the most significant element in the paper’s title is the question mark that follows “Conservation Culturomics 2.0.” We assert that evidence supports the proposed methodology’s feasibility, particularly highlighting the shared foundations of functionalism in ecology and economics [44].
Our findings confirm that ideas expressed years ago remain relevant today when examined from a fresh perspective. For example, there is growing global concern about issues related to the Anthropocene narrative, especially with regard to conservation [54]. Support for conservation policies has been increasing worldwide. However, pro-conservation behaviors appear to be inconsistent and varied among cultures [55]. The emergence of online search technologies and the development of culturomics and conservation culturomics scientific programs have revealed several classic methodological challenges in social science that previously hindered comprehensive assessments of people’s perceptions of conservation. Traditional approaches, such as participatory appraisal, ethnographic studies, focus groups, electronic and mail surveys, public comments, and knowledge co-production, have often proven to be time-consuming and resource-intensive [56].
The transformation of Markowitz’s multi-asset optimization theory, combined with Information Entropy, is technically feasible and significantly enhances the traditional use of online public searches for issues and themes related to the Anthropocene narrative.
However, carefully evaluating our findings leads us to express reasonable reservations about their generalization. Although the rationale and computations seem solid and error-free, one could raise the question of the noisy historical, social-ecological environment in which the primary data are generated.
First, as the Introduction section emphasizes, there is a notable trend of reinterpreting longstanding ecological concepts to support new political agendas and policy proposals. For example, the roots of conservation can be traced back to influential figures like Shelford, as well as organizations such as The Ecological Society of America and The Nature Conservancy, which were established in 1915 and 1940, respectively. The idea of biodiversity is grounded in Tansley’s concept of ecosystems, while the term itself is a catchy adaptation of Lovejoy’s original notion of biological diversity [57,58]. Additionally, Arrhenius laid the groundwork for explaining global warming [59] long before J. Hansen alerted Congress in 1988 to the dangers of climate change. The concept of sustainability, popularized by the commission led by Norwegian politician Gro Harlem Brundtland, has roots that reach back to ancient farming practices {60]. In an age where science has lost some of its esteemed status established during the Enlightenment, much public space is now available for science denial and conspiracy theories [61,62].
A significant source of error arises from translating English terms into other languages, even when using tools like Google Translation. For example, the official term ’sustainability’ in English can evoke both ’sustainable development’ and ’sustainable growth.’ This conceptual distinction, often unnoticed in public discourse, is frequently and mistakenly regarded as equivalent [63]. In French, the term ’développement durable’ dominates public discussions, while in German, the distinction between ’Biodiversität’ and ’Artenvielfalt’ creates confusion among the public, as evidenced by Eurobarometer polls.
The methodology uses historical data. The interesting part of this exercise is that it might uncover existing comparative deficits between languages/cultures. Further, it could help create scenarios using sensitivity analysis techniques. It also helps to understand the cultural/linguistic compromise one can discern in the foundational conceptual model of IPBES [64], where it is flagrant that two cultural archetypes coexist. “Quality of life – Human well-being – Living in harmony with nature” or “Nature’s contributions to people – Nature gift – Ecosystem goods and services” show different worldviews that unavoidably will reflect public opinion and people’s searches for information online.
Focusing exclusively on broadcast news validates the information presented, but it overlooks a vast amount of content, particularly the opinions that thrive on social media platforms like Twitter, Instagram, and Facebook [66]. While these platforms have significantly expanded the reach of awareness-raising campaigns and public discussions about conservation, they also have a negative side. They contribute to the spread of rumors, distorted information, and anti-science ideologies. Finding the balance or the filtering of authoritative information in such platforms will increase the mass of data and the accuracy of our methodology.
Author Contributions
“Conceptualization, AYT. and HS.; methodology, AYT; software, HS; validation, HS., and AYT; formal analysis, AYT; investigation, HS; resources, HS; data curation, HS; original draft preparation, HS; writing—review and editing, AYT; visualization, HS and AYT; supervision, AYT. All authors have read and agreed to the published version of the manuscript.
Funding
“This research received no external funding”.
Data Availability Statement
Data are available upon request. After acception of the paper, data will be made available on a repository according to Editor’s instructions.
Conflicts of Interest
“The authors declare no conflicts of interest.”.
Abbreviations
The following abbreviations are used in this manuscript:
| GT | Google Trends |
| ASVG | Absolute Search Volume Google Trends-Glimpse |
| DELT | Global Database of Events, Language, and Tone. |
| PRIE | Public opinion Response to Information Entropy |
| CAGR | Cumulative Annual Growth Rate (percentage per year over 20 years) |
| CMGR | Cumulative Monthly Growth Rate (percentage per month over 252 months) |
| CC | Climate change |
Appendix A

Table A1.
Translation using the Google Translate tool of the keywords conservation, biodiversity, sustainability, and climate change in the eight most used languages for searches in the Google web search engine.
Table A1.
Translation using the Google Translate tool of the keywords conservation, biodiversity, sustainability, and climate change in the eight most used languages for searches in the Google web search engine.
| English | conservation | biodiversity | sustainability | climate change |
| Chinese | 保护 | 生物多样性 | 可持续性 | 气候变化 |
| Spanish | conservación | biodiversidad | sostenibilidad | cambio climático |
| Arabic | الحفاظ على البيئة | التنوع البيولوجي | الاستدامة | تغير المناخ |
| Portuguese | conservação | biodiversidade | sustentabilidade | mudança climática |
| Russian | oхрана oкружающей среды | биoлoгическoе разнooбразие | устoйчивoе развитие | изменение климата |
| French | conservation | biodiversité | durabilité | changement climatique |
| German | Naturschutz | Biodiversität | Nachhaltigkeit | Klimawandel |
References
- International Union of Geological Sciences. The Anthropocene: Joint statement by the IUGS and ICS on the vote by the ICS Subcommission on Quaternary Stratigraphy”. https://quaternary.stratigraphy.org/working-groups/anthropocene. Accessed on January 3, 2025.
- Crutzen, P.; Stoermer, E. The “Anthropocene.” Global Change Newsl., 2000, 41, 17–18.
- Crutzen, PJ. Geology of mankind. Nature, 2002, 415, 6867, 23. [CrossRef]
- Kirch, PV. The Holocene record. Annual Review of Environment and Resources 2005, 30, 1, 409–440. [CrossRef]
- Lovelock, J; Appleyard, B. Novacene : the coming age of hyperintelligence. Allen Lane: London. ISBN 9780241399361.
- Ripple, J.; Wolf, C.; van Vuuren, DP.; Gregg, JW.; Lenzen, M. An environmental and socially just climate mitigation pathway for a planet in peril. Environmental Research Letters, 2024, 19, 2, 021001. [CrossRef]
- Mcneill, JR. The Great Acceleration: An Environmental History of the Anthropocene since 1945. Cambridge: Harvard University Press. 2014. ISBN 978-0674545038.
- Elhacham, E; Ben-Uri, L.; Grozovski, J.; Bar-On, YM.; Milo, R. Global human-made mass exceeds all living biomass. Nature, 2020, 588, 7838, 442. [CrossRef]
- . [CrossRef]
- Moravec H. When will computer hardware match the human brain? Journal of Evolution and Technology, 1998, 1 Available online: https://web.archive.org/web/20060615031852/http://transhumanist.com/volume1/moravec.htm Accessed on: 9.2.2025.
- Malm, A; Hornborg, A. The geology of mankind? A critique of the Anthropocene narrative. Anthropocene Review, 2014, 11, 1, 62-69. [CrossRef]
- Heurtebise, JY. Sustainability and Ecological Civilization in the Age of Anthropocene: An Epistemological Analysis of the Psychosocial and “Culturalist” Interpretations of Global Environmental Risks. Sustainability, 2017, 9, 8, 1331 DOI10.3390/su9081331.
- Gough, Μ.(Ed.) Politicizing ApScience: The Alchemy of Policymaking. Hoover Institution Press Publication.
- Pielke, RA. When scientists politicize science: making sense of controversy over The Skeptical Environmentalist. Environmental Science & Policy, 2004, 7, 5, 405-417. [CrossRef]
- Johns, D. Like it or not, politics is the solution. Conservation Biology, 2007, 21, 2, 287-288. [CrossRef]
- Young, W.; Meijaard, J. Political culture, economic structure, and policy — The Laffont-Tirole model extended to modern Japan.
- American Journal of Economics and Sociology, 2002, 61, 301–326.
- Terborgh, J. Requiem for Nature. Island Press, Washington D.C., 1999, p. 234.
- Sirá, E.; Kotulic, R.; Vozárová, IK.; Danová, M. Sustainable Development in EU Countries in the Framework of the Europe 2020 Strategy. Processes, 2021, 9, 3, 443. [CrossRef]
- Jepson, P.; Canney, S. Values-led conservation. Global Ecology and Biogeography, 2003, 12, 4, 271-274. [CrossRef]
- Midgley, M. Gaia. The next big idea. Demos, London. 2001.
- Lakoff, G. Why it matters how we frame the environment. Environ. Commun. 2010, 4, 70–81.
- Troumbis, AY. Did the COVID-19 Crisis Reframe Public Awareness of Environmental Topics as Humanity’s Existential Risks? A Case from the UK. WORLD, 2024, 5, 4, 1194-1210. [CrossRef]
- Björnberg, KE.; Karlsson, M.; Gilek, M.; Hansson, SO. Climate and environmental science denial: A review of the scientific literature published in 1990-2015. Journal of Cleaner Production, 2017, 167, 229-241. [CrossRef]
- Dobson, GP. Wired to Doubt: Why People Fear Vaccines and Climate Change and Mistrust Science. Frontiers in Medicine, 2022, 809395. [CrossRef]
- Tam, KP.; Chan, HW. Conspiracy theories and climate change: A systematic review. Journal of Environmental Psychology, 2023, 91, 102129. [CrossRef]
- Kernighan, BW. The World Wide Web. In Understanding the Digital World: What You Need to Know about Computers, the Internet, Privacy, and Security. Princeton University Press. pp. 163–182. 2017. [CrossRef]
- Lansdall-Welfare, T.; Sudhahar, S.; Thompson, J.; Lewis, J.; Cristianini, N. Content analysis of 150 years of British periodicals. PNAS, 2017, 114, 4, E457-E465. [CrossRef]
- Google Books Ngram Viewer. Available online: https://books.google.
- Michel, J.B.; Shen, Y.K.; Aiden, A.P.; Veres, A.; Gray, M.K.; Pickett, J.P.; Hoiberg, D.; Clancy, D.; Norvig, P.; Orwant, J.; et al. Quantitative Analysis of Culture Using Millions of Digitized Books. Science 2011, 331, 176–182.
- Ladle, R.J.; Correia, R.A.; Do, Y.; Joo, G.J.; Malhado, A.C.M.; Proulx, R.; Roberge, J.M.; Jepson, P. Conservation culturomics. Front. Ecol. Environ. 2016, 14, 270–276. https://doi.org/10.1002/fee.1260.
- Correia, R.A.; Ladle, R.; Jaric, I.; Malhado, A.C.M.; Mittermeier, J.C.; Roll, U.; Soriano-Redondo, A.; Veríssimo, D.; Fink, C.; Hausmann, A.; et al. Digital data sources and methods for conservation culturomics. Conserv. Biol. 2021, 35, 398–411.
- Google Trends-Glimpse. Available online: https://meetglimpse.
- The GDELT Project. Available online: https://www.gdeltproject.org/ (accessed on 15 September 2024).
- Leetaru, K.H. Culturomics 2.0: Forecasting large-scale human behavior using global news media tone in time and space. First Monday, 2011, 16, 9. [CrossRef]
- Conservation Culturomics. Digital corpora for conservation culturomics. http://www.conservationculturomics.com/digital-corpora.html (Accessed on: 10.10.2024).
- Conservation Culturomics. http://www.conservationculturomics.com/ (Accessed on: 3.4.2024).
- Troumbis, AY.; Iosifidis, S. A decade of Google Trends-based Conservation culturomics research: A critical evaluation of an evolving epistemology. Biological Conservation, 248, 108647. [CrossRef]
- McCallum, M.L.; Bury, G.W. Google search patterns suggest declining interest in the environment. Biodivers. Conserv. 2013, 22, 1355–1367.
- Ficetola, G.F. Is interest toward the environment really declining? The complexity of analyzing trends using internet search data. Biodivers. Conserv. 2014, 22, 2983–2988.
- Troumbis AY. Declining Google Trends of public interest in biodiversity: semantics, statistics or traceability of changing priorities? Biodivers Conserv, 2017, 26, 6, 1495–1505. [CrossRef]
- Burivalova, Z.; Butler, R.A.; Wilcove, D.S. Analyzing Google search data to debunk myths about the public’s interest in conservation. Front. Ecol. Environ. 2018, 16, 509–514.
- Funk SM.; Rusowsky D. The importance of cultural knowledge and scale for analysing internet search data as a proxy for public interest toward the environment. Biodivers Conserv, 2014, 23, 3101–3112.
- Troumbis, AY. The time and timing components of conservation culturomics cycles and scenarios of public interest in the Google era. Biodivers Conserv, 2019, 28, 7, 1717-1727. [CrossRef]
- Lantremange, H. Functionalism in ecology and economics: Epistemological affinities and temptations. Biological Conservation, 2024, 298, 110762 DOI10.1016/j.biocon.2024.110762.
- Loehle, C. Control theory and the management of ecosystems. Journal of Applied Ecology, 2006, 43, 5, 957-966. [CrossRef]
- Xie, PX.; Zhang, Y.; Chen, RX.; Lin, Z.; Lu, N. Social media’s impact on environmental awareness: a marginal treatment effect analysis of WeChat usage in China. BMC Public Health, 2024, 24, 1, 3237. [CrossRef]
- Weiss, V. The relationship between short-term memory capacity and EEG power spectral capacity. Biological Cybernetics, 1992, 68, 2, 165-172 DOI10.1007/BF00201438.
- Maki, D P.; Thomson, M. Mathematical Models and Applications. Springer, Singapore, 1973.
- Daley, DJ; Kendall, DG. Stochastic rumours. J. Appl. Math, 1965, 1, 42–55.
- Wang, C.; Tan, ZX.; Ye, Y.; Wang, L.; Cheong, KH.; Xie, NG. A rumor spreading model based on information entropy. Scientific Reports, 2017, 7, 9615. [CrossRef]
- Statista. Number of internet users worldwide from 2005 to 2024. Available on: https://www.statista.com/statistics/273018/number-of-internet-users-worldwide/ (accessed 5.9.2024).
- Markowitz, HM. Portfolio Selection: Efficient Diversification of Investments. 1959. 2nd ed. Basil Blackwell, 1991, ISBN 978-1-55786-108-5.
- Blake, K. A short intro to GDELT. Available on: https://drkblake.com/gdeltintro/ (accessed on: 15.9.2024).
- Hawkins, JP.; O’Leary, BC.; Bassett, N.; Peters, H.; Rakowski, S.; Reeve, G.; Roberts, CM.. ]Public awareness and attitudes towards marine protection in the United Kingdom. Marine Pollution Bulletin, 2016, 111, 1-2, 231-236. [CrossRef]
- Easman, ES.; Abernethy, KE.; Godley, BJ. Assessing public awareness of marine environmental threats and conservation efforts. Marine Policy, 2018, 87, 234-240. [CrossRef]
- Nel, JL.; Roux, DJ.; Driver, A.; Hill, L.; Maherry, AC.; Snaddon, K.; Petersen, CR.; Smith-Adao, LB.; [1] ; Van Deventer, H.; Reyers, B. Conservation Biology, 2016, 30, 1, 176-188. [CrossRef]
- Lovejoy, TE. Biological diversity. Issues in Science and Technology, 1986, 2, 2, 13.
- Takacks D. The Idea of Biodiversity: Philosophies of Paradise. The Johns Hopkins University Press. 1996. p. 500.
- Arrhenius S. On the Influence of Carbonic Acid in the Air upon the Temperature of the Earth. Publications of the Astronomical Society of the Pacific, 1896, 9, 54, 14. [CrossRef]
- Brundtland GH. Our Common Future. Report of the World Commission on Environment and Development, General Assembly of the United Nations, Oxford University Press, U.S.A. 1990, p.420.
- Johnson, BB. Climate Change Communication: A Provocative Inquiry into Motives, Meanings, and Means. Risk Analysis, 2012, 32, 6, 973-991. [CrossRef]
- Mendy, L.; Karlsson, M.; Lindvall, D. Counteracting climate denial: A systematic review. Public Understanding of Science, 2024, 33, 4, 504-520. [CrossRef]
- Voulvoulis, N.; Burgman, MA. The contrasting roles of science and technology in environmental challenges. Critical Reviews in Environmental Science and Technology, 2019, 49, 12, 1079-1106. [CrossRef]
- IPBES Conceptual Framework. Available online: https://www.ipbes.net/conceptual-framework (accessed on on 20/3/2020).
- Toivonen, T.; Heikinheimo, V.; Fink, C.; Hausmann, A.; Hiippala, T.; Järv, O.; Tenkanen, H.; Di Minin, E.
- Social media data for conservation science: A methodological overview. Biological Conservation, 2019, 233, 298-315. [CrossRef]
Figure 1.
Illustrative example of data collection, organization, and calculations comparing the PRIE expected value to its standard deviation in Excel. This approach is inspired by H. Markowitz’s theory on return vs. risk in multi-asset portfolio optimization [52]. In this example, the data is derived from public searches, represented in absolute volumes per month using the Google Trends-Glimpse tool, as well as the volume of information conveyed to the public through the GDELT database. This dataset encompasses almost 100 countries, in height major internet languages, covering the keyword ‘biodiversity’. The entire procedure is explained in detail in the maintext.
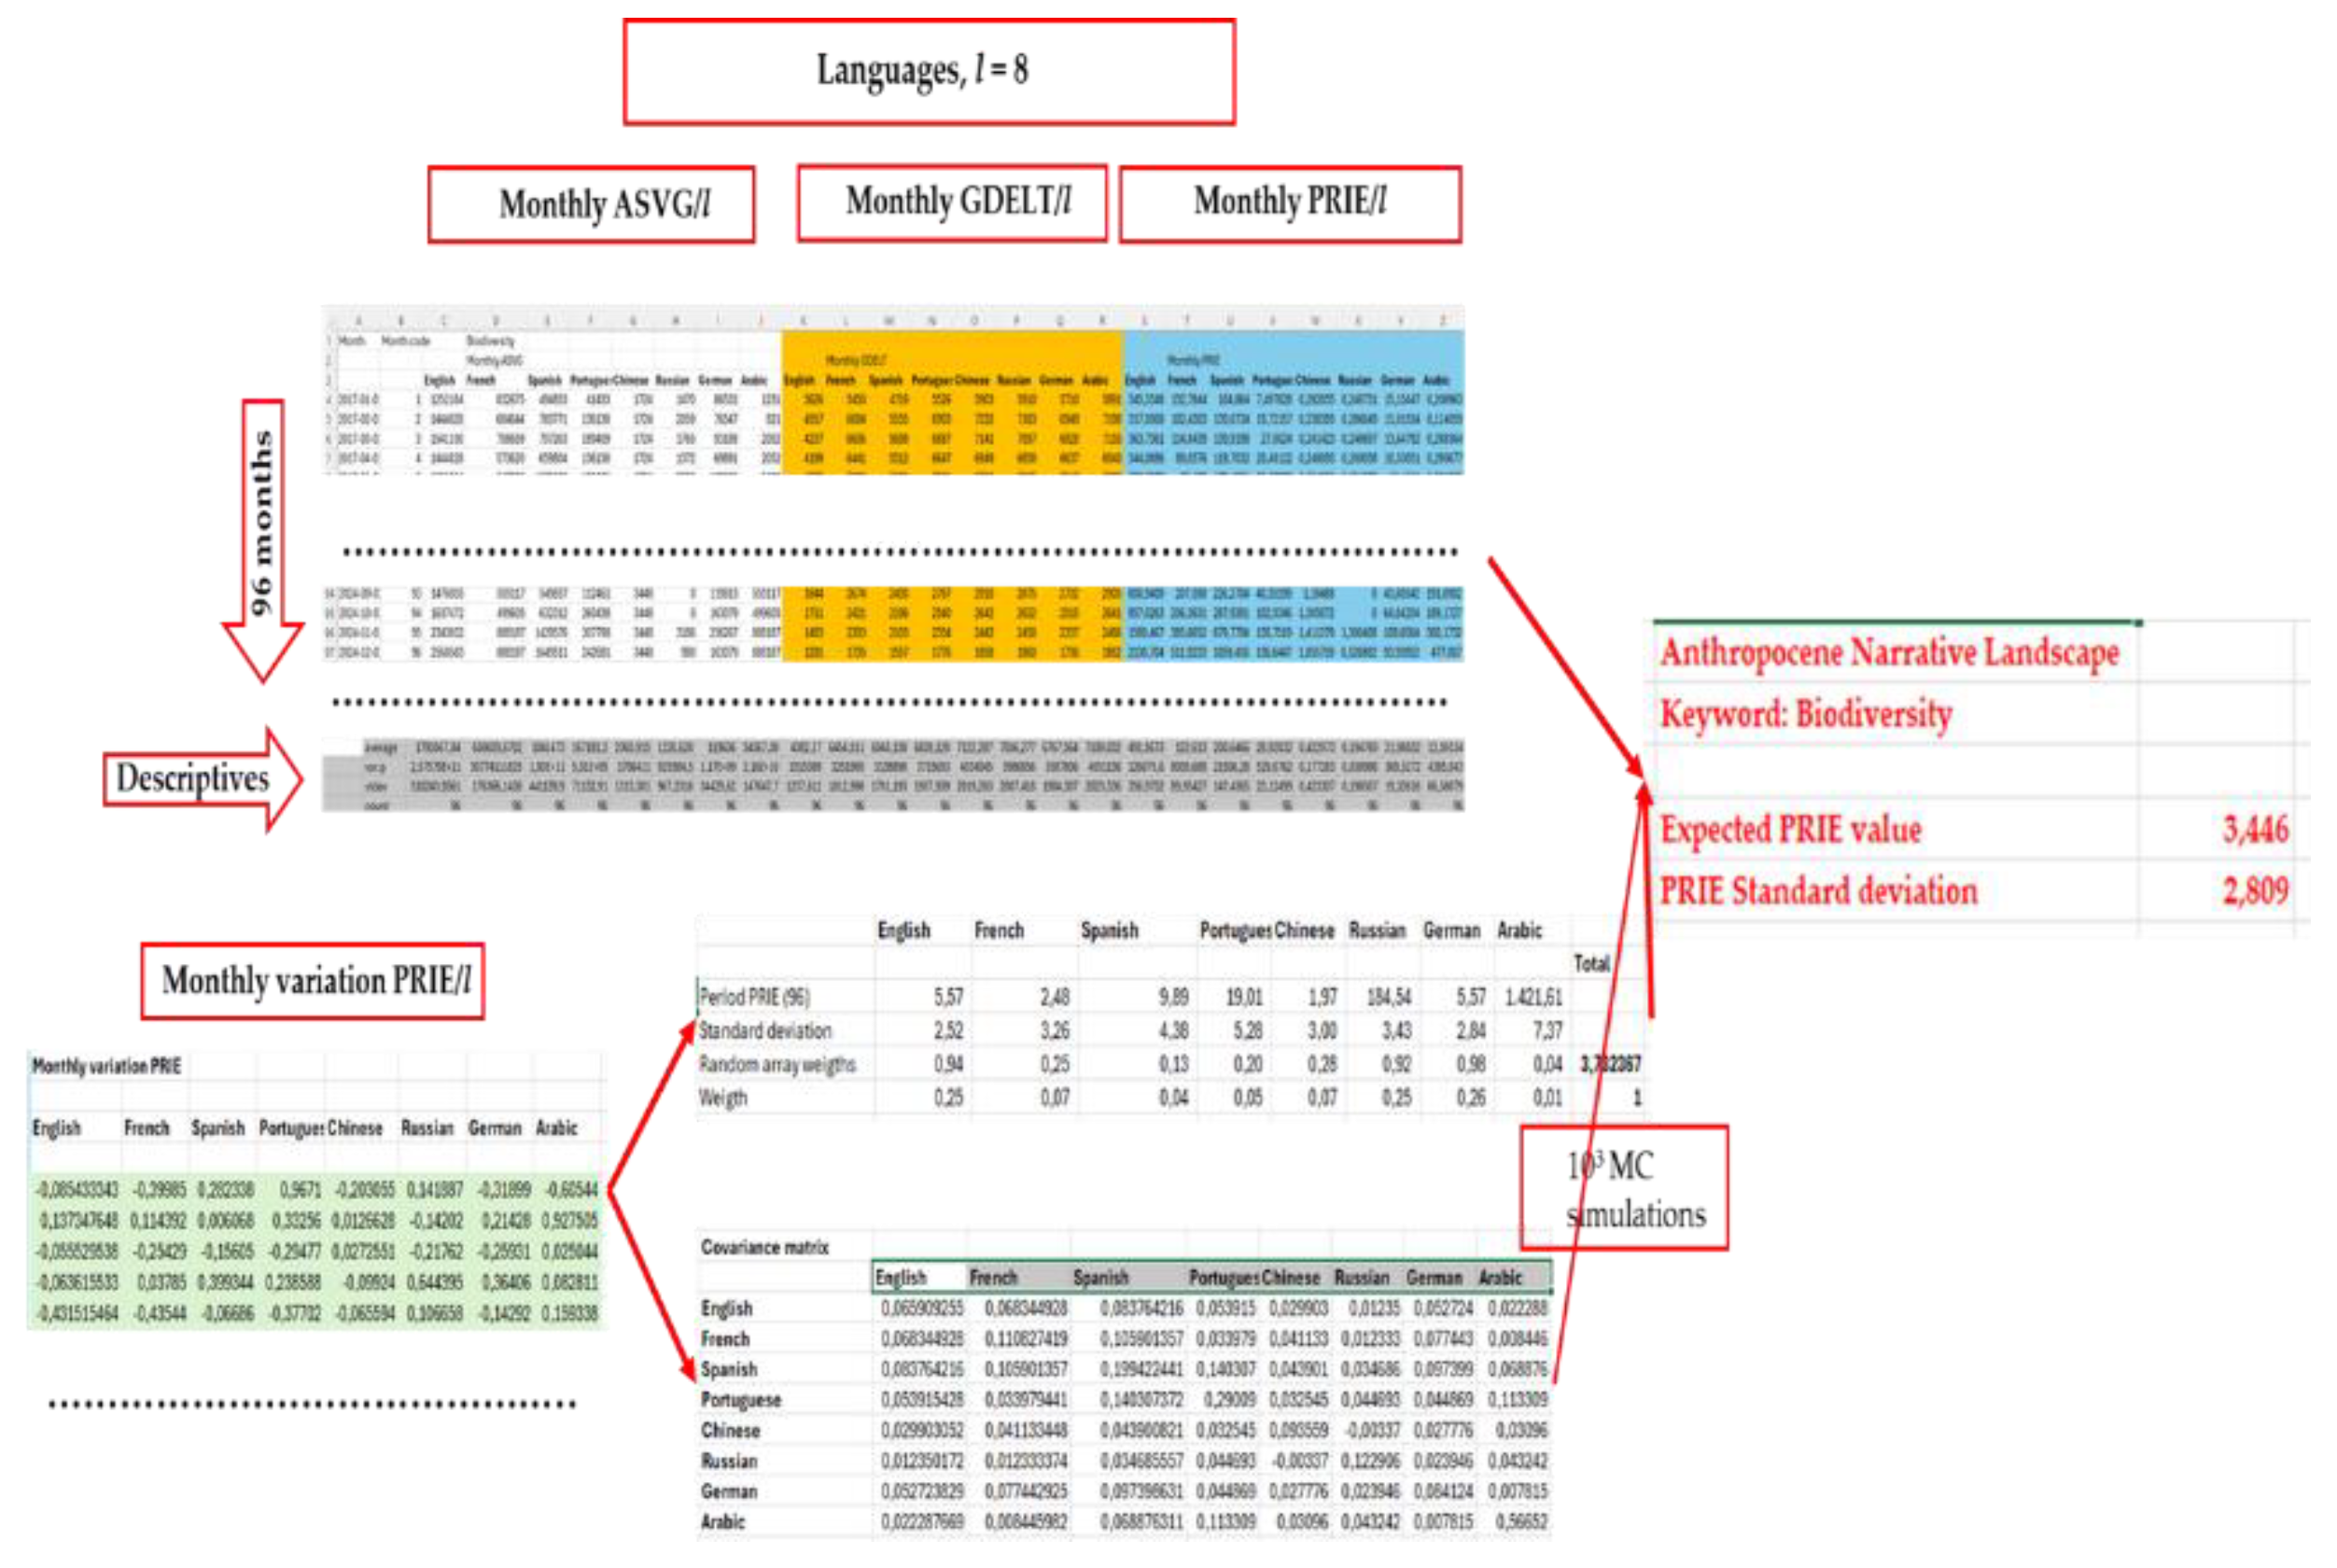
Figure 2.
An illustrative example of results generated after combining typical ‘Markowitz’ multi-asset return-risk theory and information entropy calculations for the Anthropocene flag keywords (k=4). English is used as indicating language, and a random truncated normal distribution for 103 simulations of individual searchers’ misunderstandings or memory lapses. The entire procedure is explained in detail in the maintext.
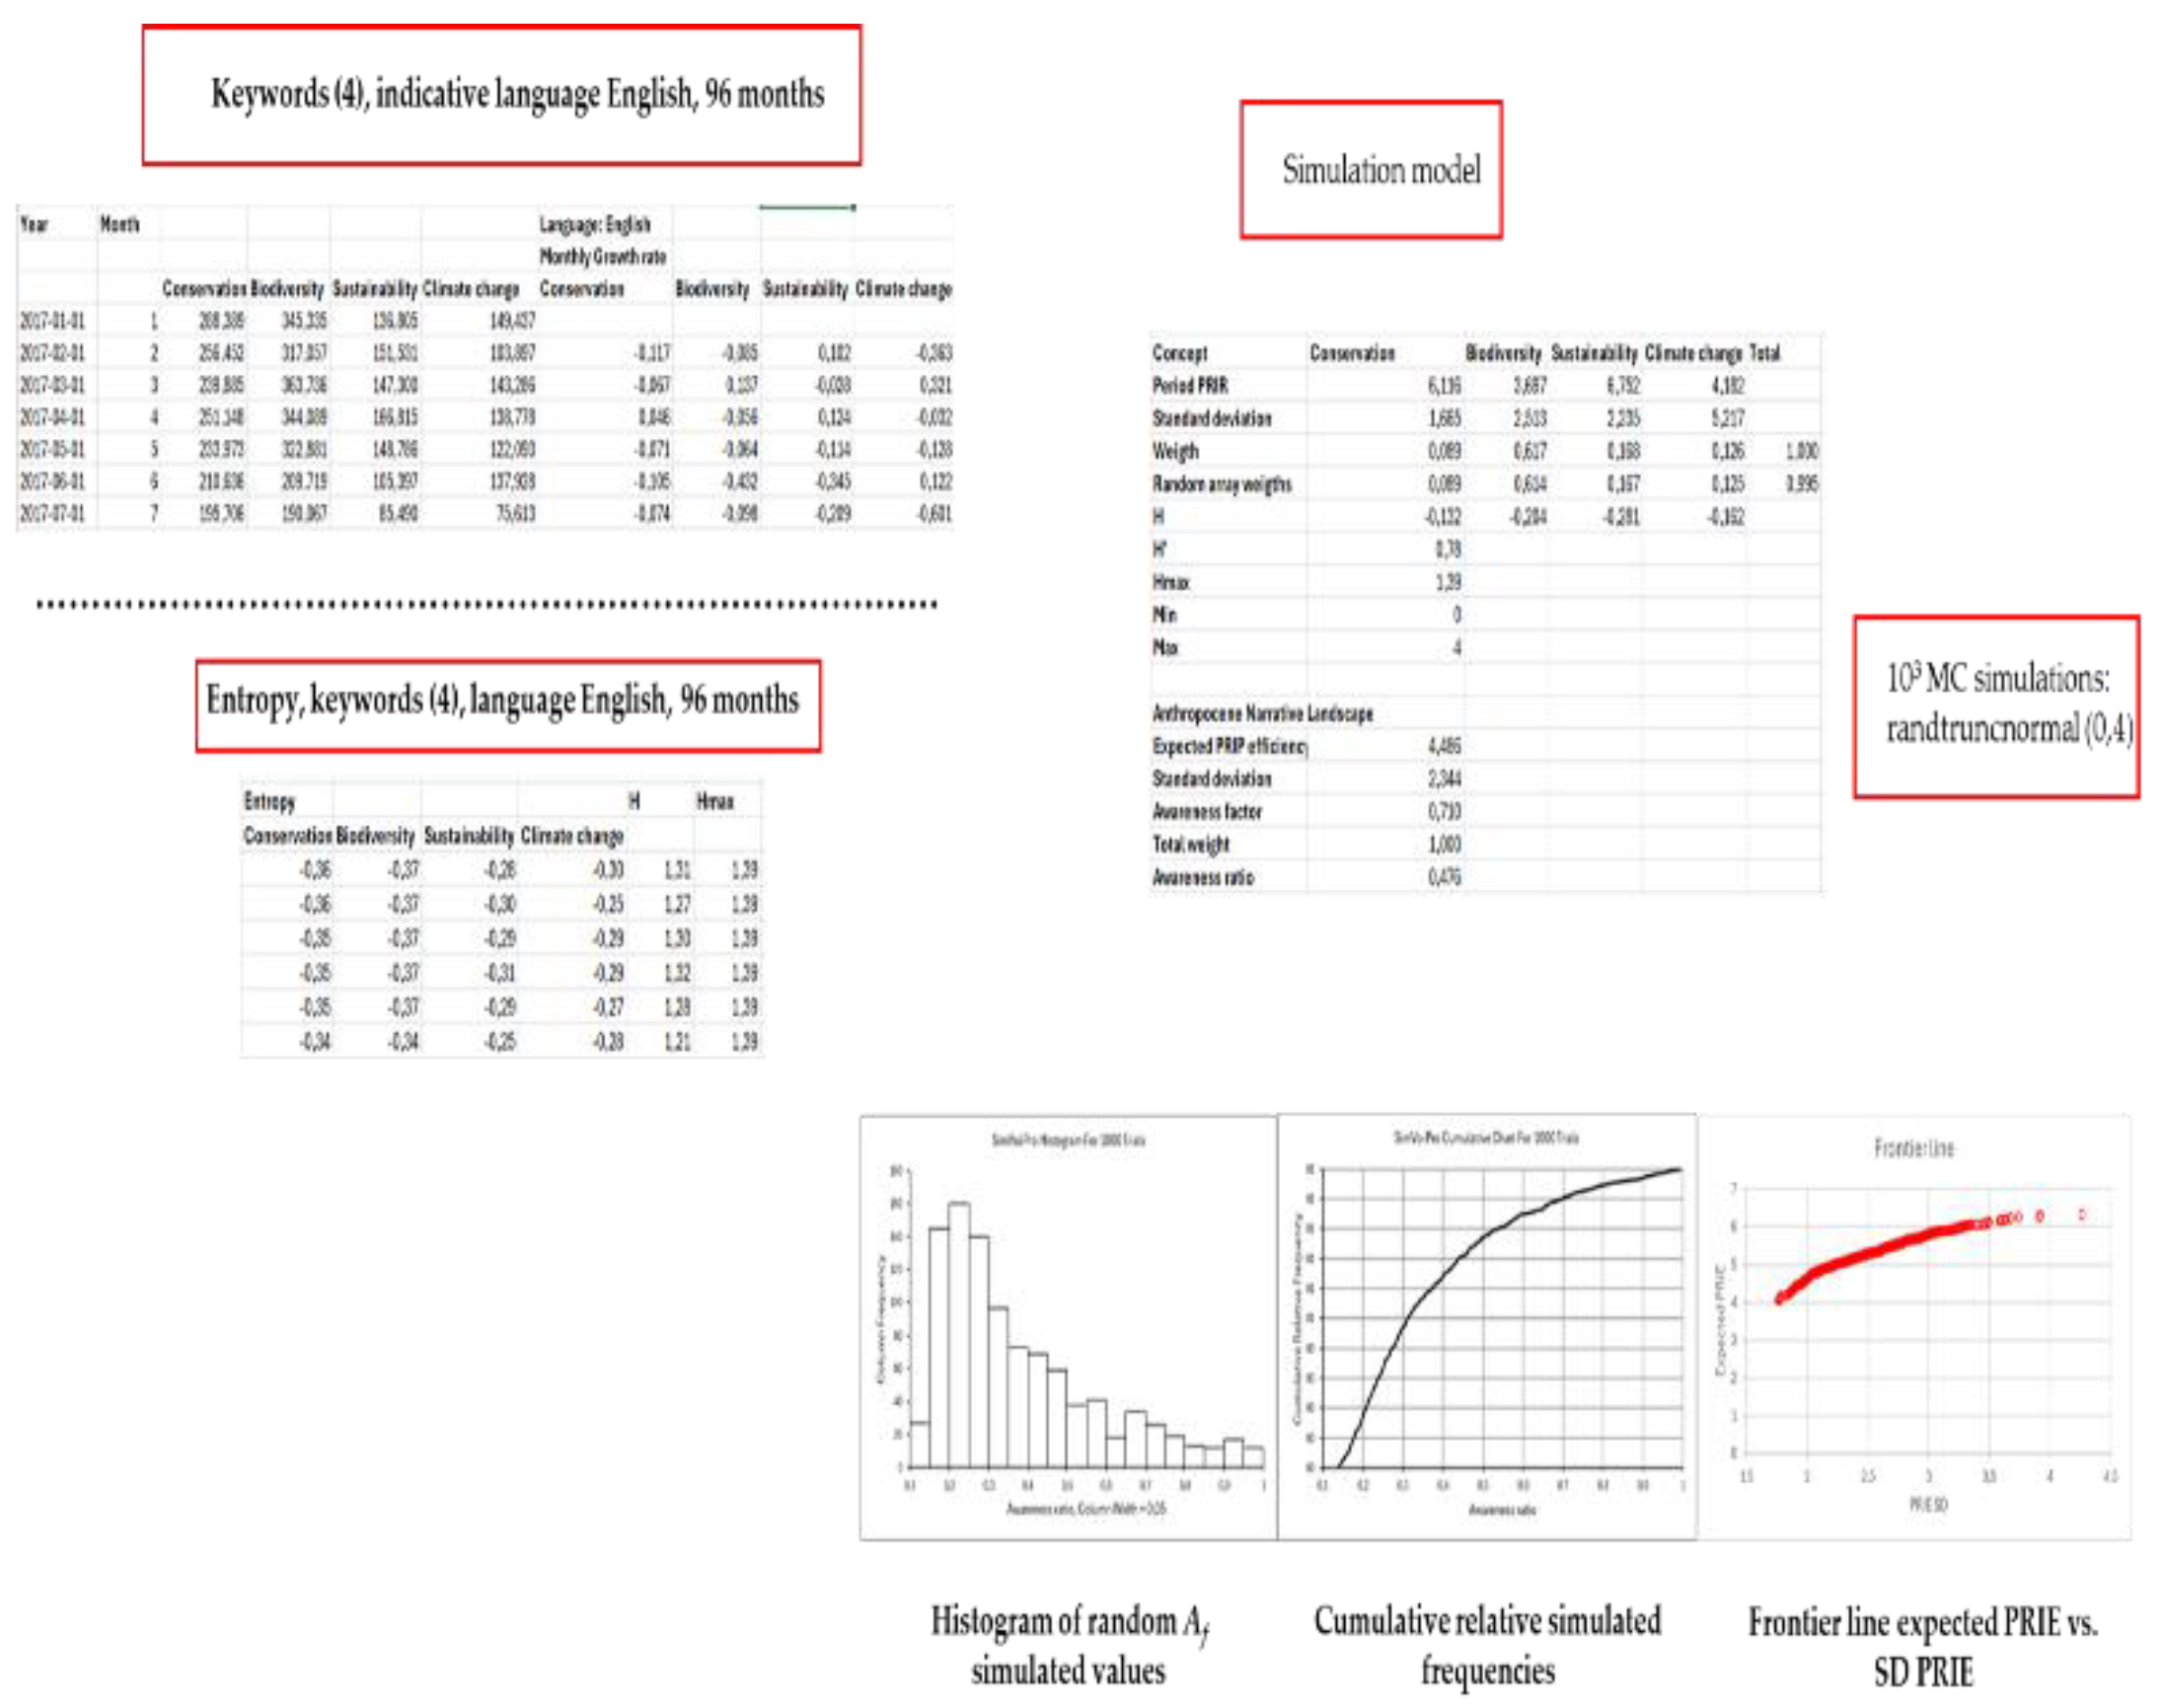
Figure 3.
illustrates the evolution of public interest in the keywords “conservation” (orange), “biodiversity” (green), “sustainability” (blue), and “climate change” (purple) across the three most commonly used languages for online searches. The searches’ scale is logarithmic to highlight the unique trends in the Chinese data. Red circles indicate periods when peaks in global public interest coincided with increased climate change awareness.
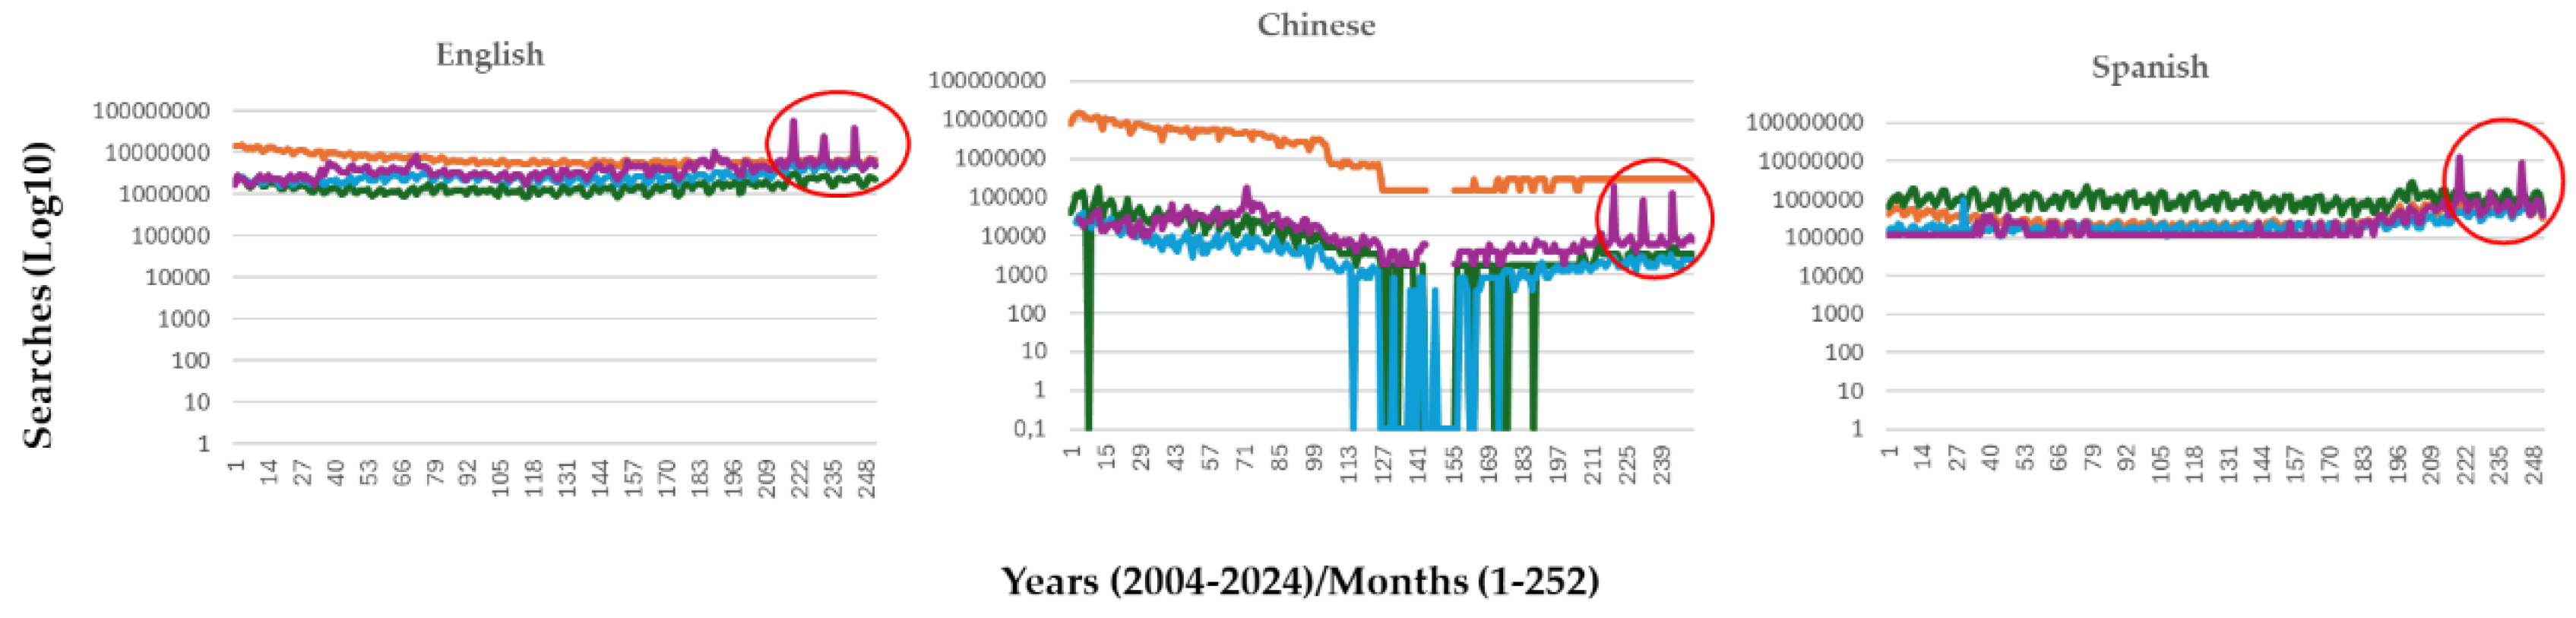
Figure 4.
displays the clouds of values for Log10Expected PRIE versus PRIE Standard Deviation after conducting 103 Monte Carlo simulations with a normal distribution, as outlined in Figure 1 of the Methods section. The intersection of the vertical and horizontal lines indicates the centroid for each keyword: conservation (dark blue), biodiversity (light blue), sustainability (orange), and climate change (green).
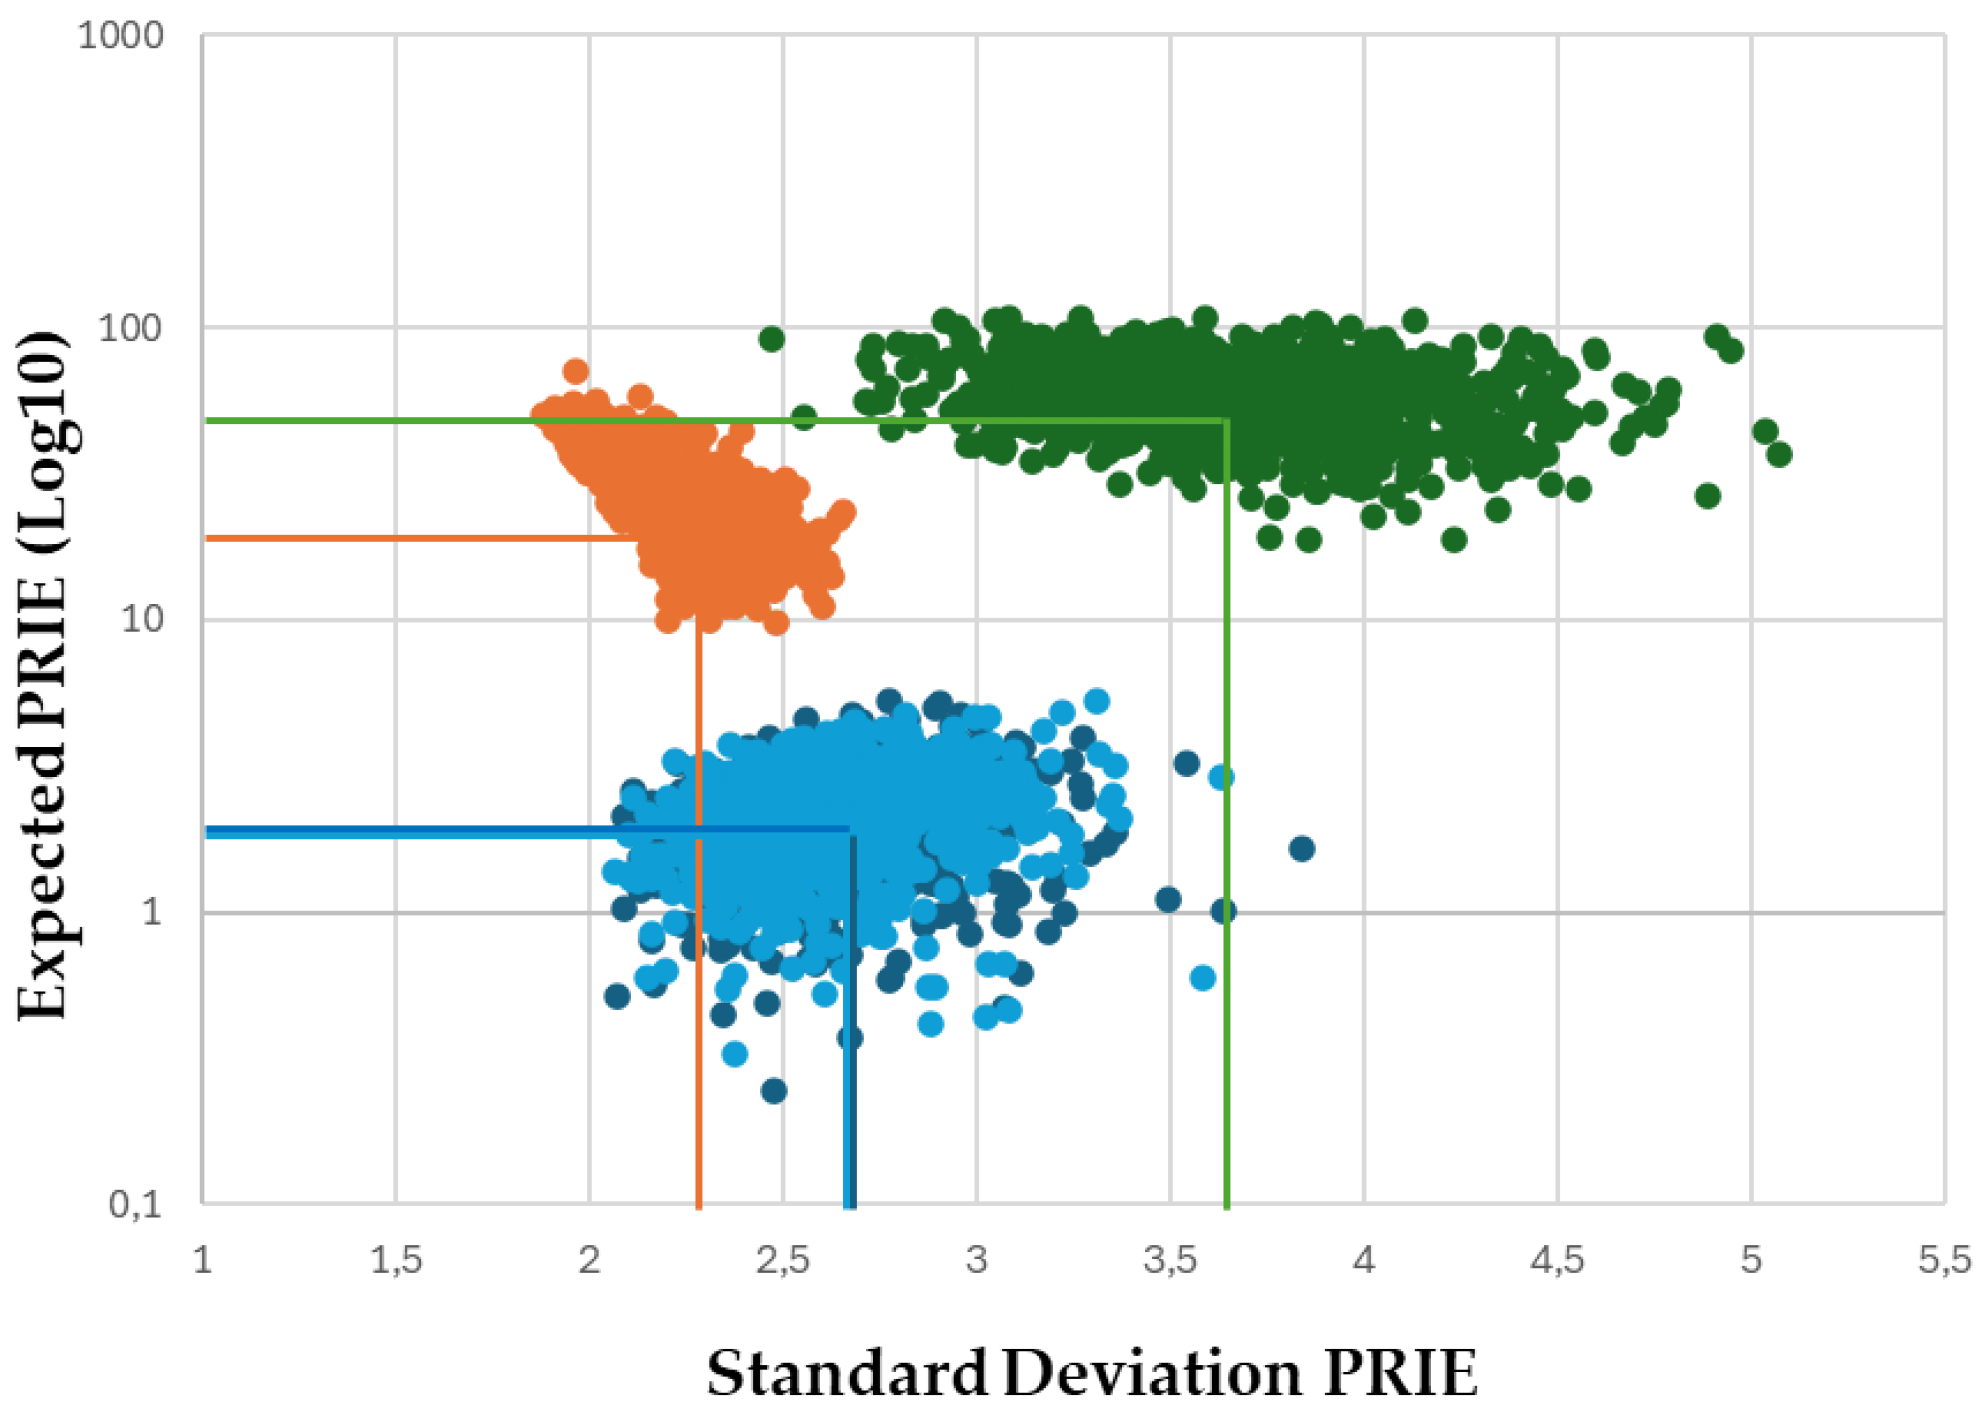
Figure 5.
Presentation of the Efficient Frontier line in European and Non-European languages, for the ensemble of Anthropocene- related keywords. See maintext for specific details.
Figure 5.
Presentation of the Efficient Frontier line in European and Non-European languages, for the ensemble of Anthropocene- related keywords. See maintext for specific details.
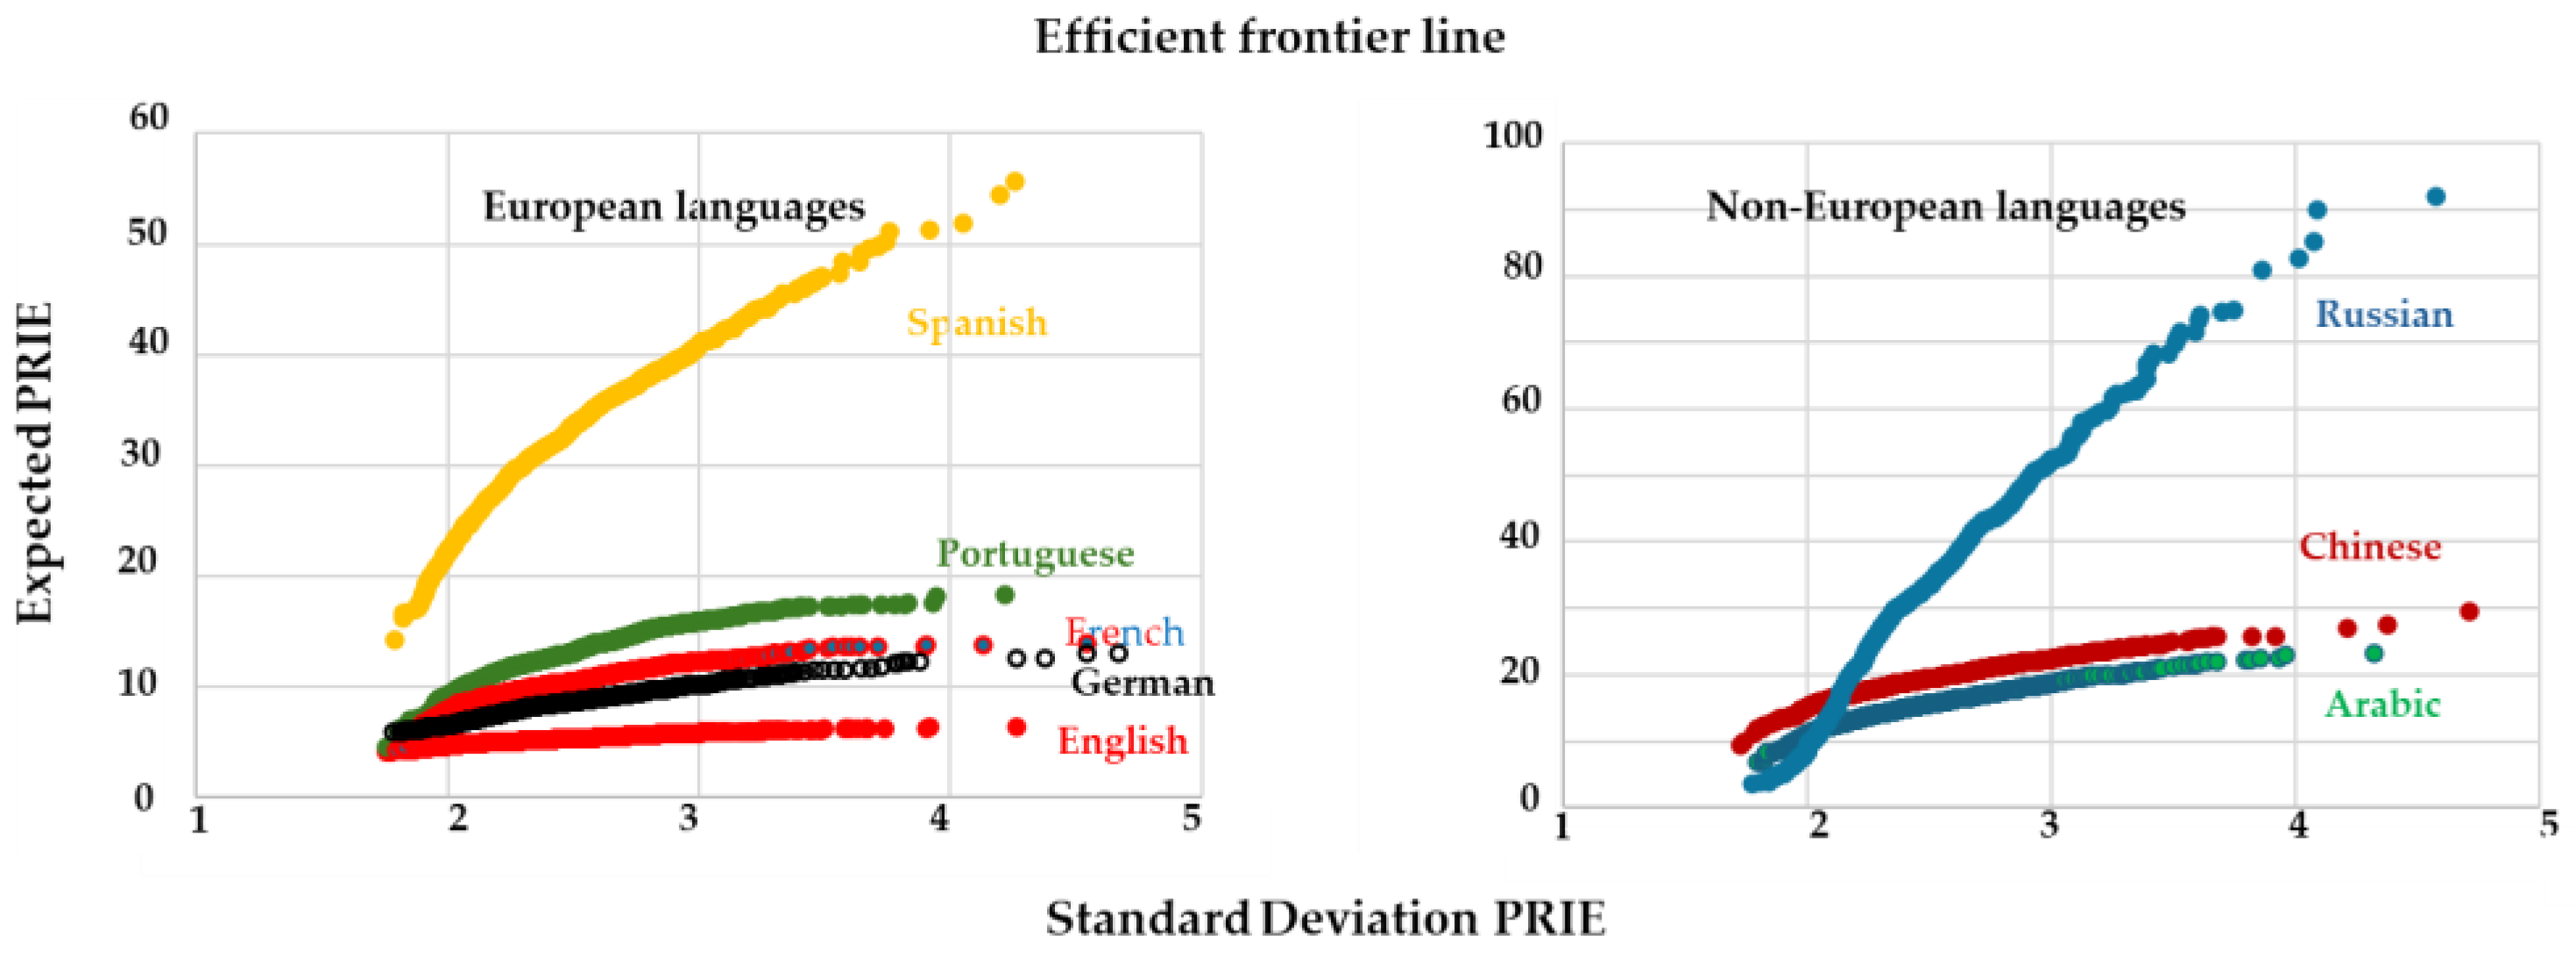
Figure 6.
The relationship between the awareness ratio for the ensemble of four keywords with the Cumulative relative frequency after 103 ‘randtruncnormal’ MonteCarlo simulations (min=0, max=4) across all studied languages for the period 2017-2024. Simulations performed on TREEPLAN SimVoi 2024 platform.
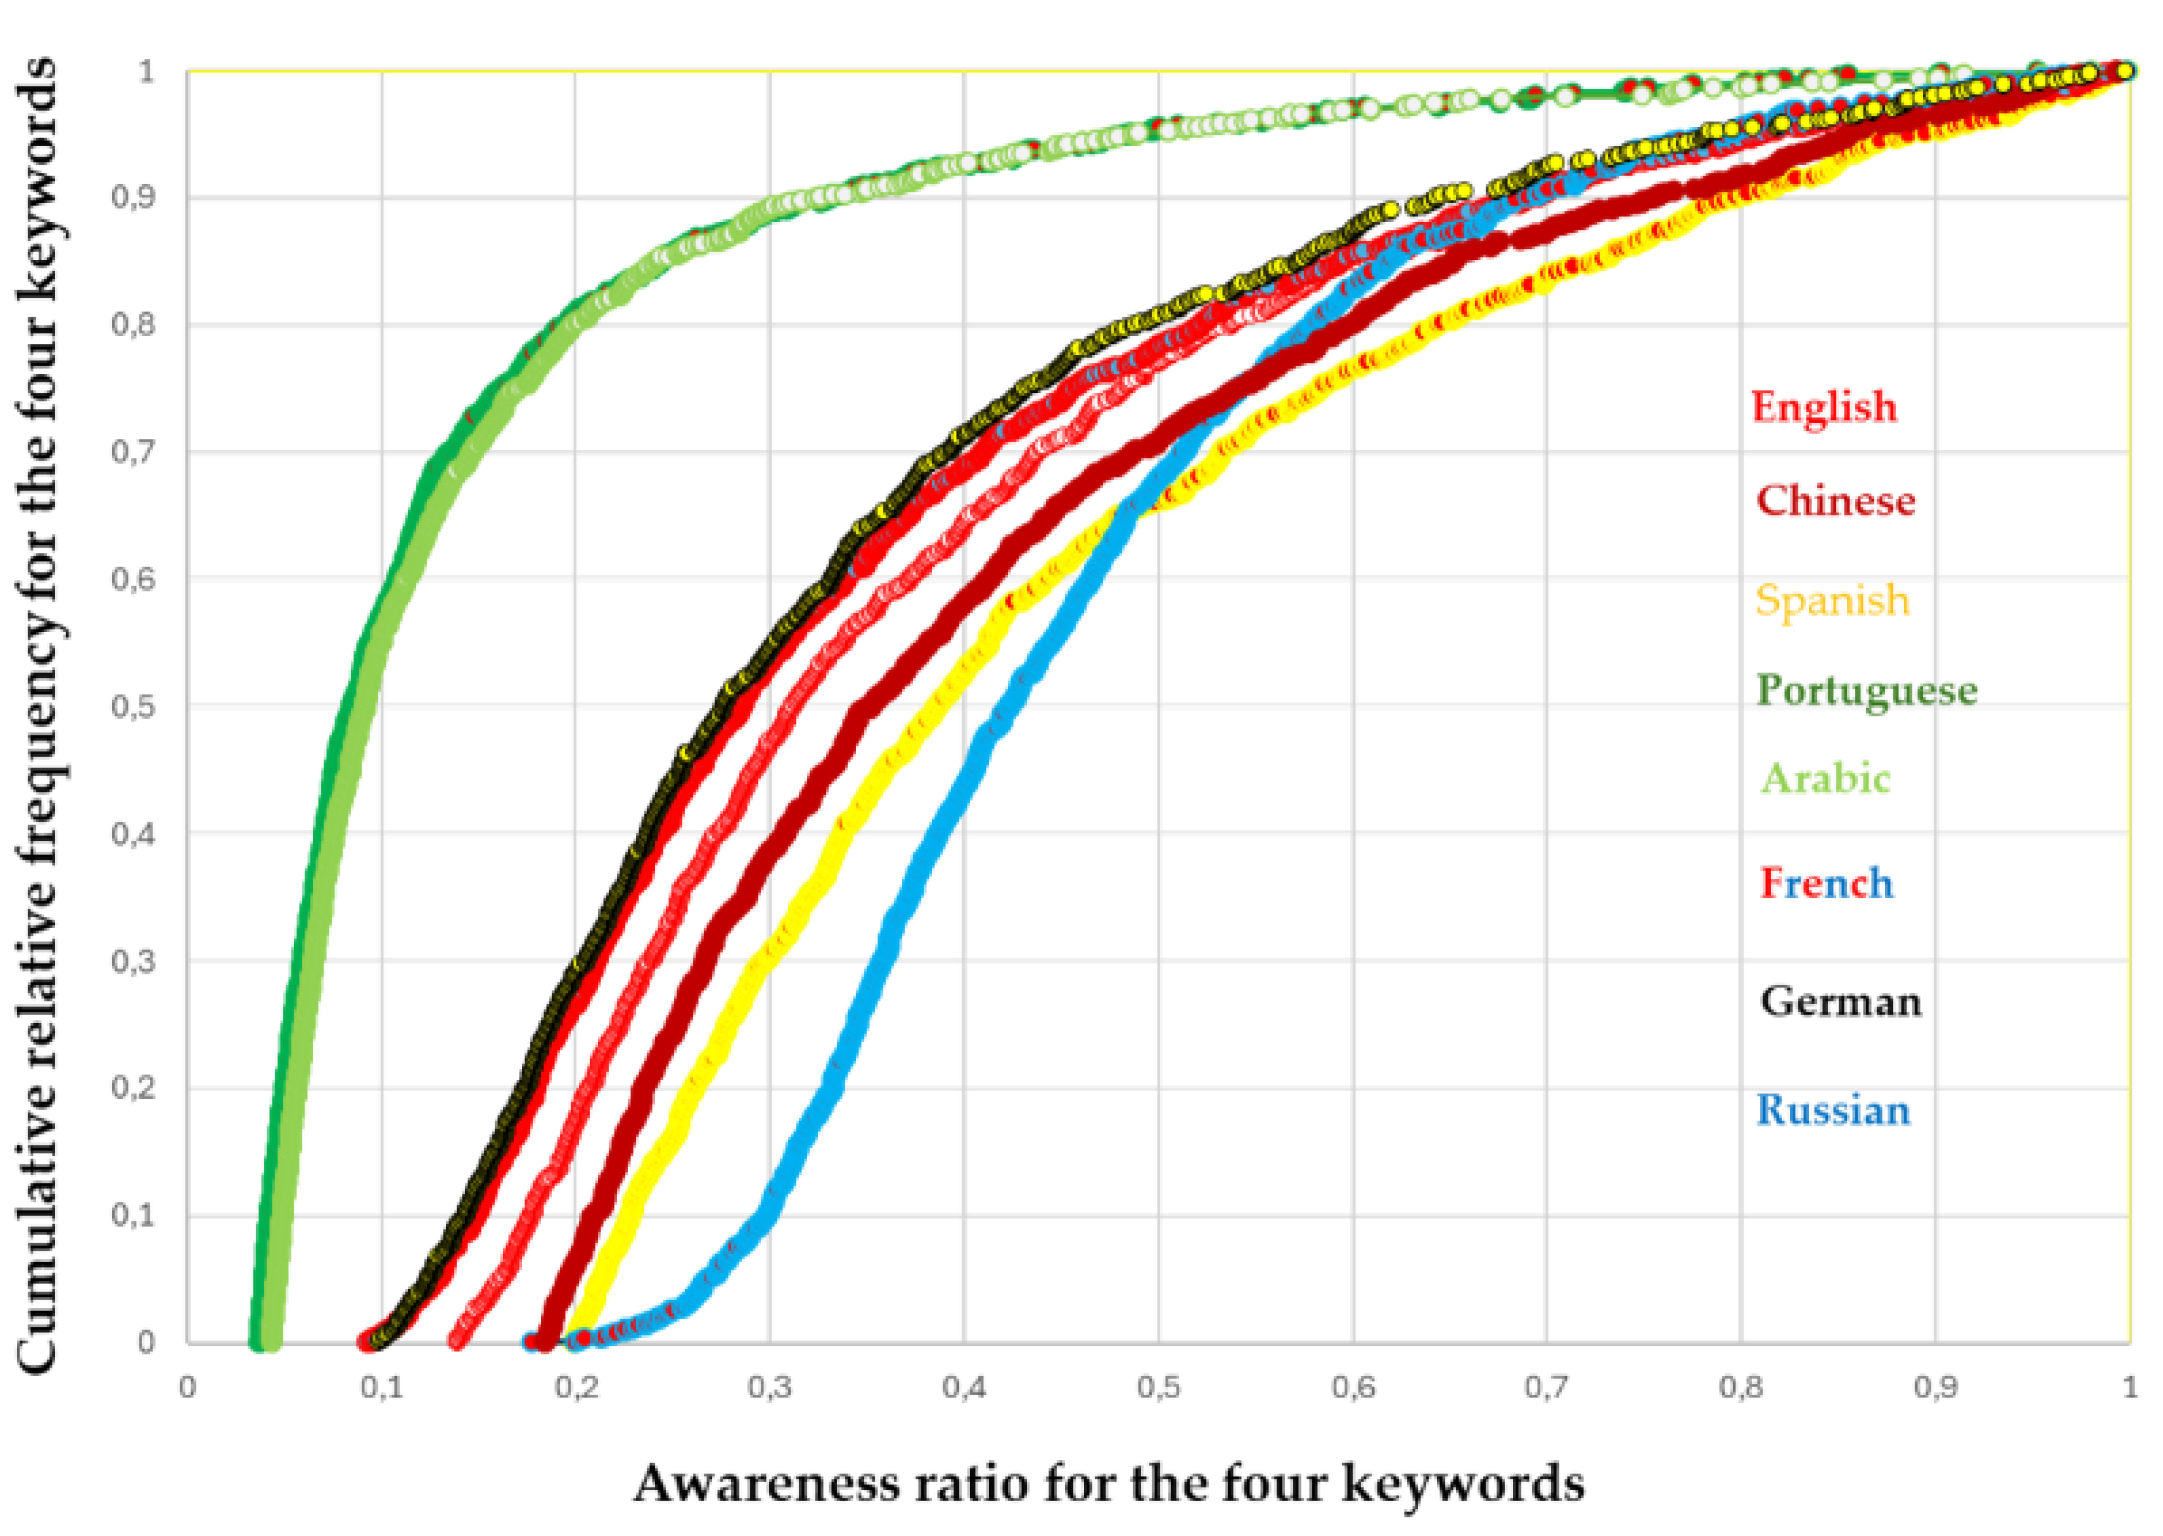
Table 1.
A compilation of descriptive statistics on: (1) Internet usage during 2005-2024 in eight consistently most used languages worldwide; (2) the total, average, and standard deviation for the four key Anthropocene narrative concepts (conservation, biodiversity, sustainability, and climate change) for the period January 2017 – December 2024. CAGR: cumulative or compound annual growth rate; Diaspora: the number of countries and/or territories where searches on keywords of interest in a certain language were made; % Internet corresponds to the total Internet use for any search.
| Languages | Users 2024 (Million) |
CAGR (2005-2024) | % Internet | Diaspora (Countries/ Territories) |
Keywords (2017-2024) | |||
|---|---|---|---|---|---|---|---|---|
| Conservation (Total/Mean/SD) |
Biodiversity (Total/Mean/SD) | Sustainability (Total/Mean/SD) | Climate Change (Total/Mean/SD) | |||||
| English | 1,500 | 0,083 | 25.3 | 222 | 574,847,424 5,987,994 558,591.2 |
173,090,398 1,803,025 509,225.9 |
329,434,345 3,431,607.8 1,098,060.7 |
583,240,438 6,075,421.2 6,559,533.8 |
| Chinese | 1,000 | 0,122 | 19.8 | 30 | 24,716,399 254,808.2 65,504.7 |
229,292 2,388.5 1,308.7 |
48,489 494.8 249.8 |
4,191,000 9,408.1 23,899.4 |
| Spanish | 500 | 0,122 | 8 | 41 | 5,770,107,355 60,105,285 13315358,92 |
19,968,393,101 208,004,094.8 30,696,820.74 |
3,885,962,749 40,478,778.6 8,547,190.2 |
4,162,012,983 43,354,301.9 20,490,893.7 |
| Arabic | 300 | 0,145 | 4.8 | 34 | 116,927,708 1,217,996.9 262,244.2 |
70,177,237 731,012.9 122,360.1 |
136,516,205 1,422,043.8 832,179.4 |
144,575,673 1,505,996.6 693,359.5 |
| Portuguese | 250 | 0,112 | 4.1 | 74 | 9,654,936,945 100,572,259.8 11,709,081.7 |
4,031,627,486 41,996,119.6 4,790,914.9 |
10,706,406,275 111,525,065.4 14,815,664.3 |
7,314,075,779 76,188,289.4 14,815,664.3 |
| Russian | 110 | 0,051 | 2.8 | 41 | 1,014,342 10,566.1 4,750.8 |
117,435 1,223.3 958.7 |
1,480,095 15,417.6 4,724.7 |
3,331,596 34,704.1 165,075.4 |
| French | 100 | 0,035 | 2.8 | 132 | 574,847,424 5,987,994 558,591.2 |
63,745,894 657,174.2 181,872.3 |
16,318,298 168,229.9 75,149.9 |
59,001,666 608,264.6 1,613,688 |
| German | 90 | 0,041 | 2.2 | 41 | 11,591,915 119,504.3 35,258.1 |
2,286,758 23,574.8 6,728.6 |
158,298,630 1,631,944.6 494,845.3 |
53,944,524 556,129.1 565,087.4 |
Table 2.
Synthesis of statistics for the extended model includes calculations of the Expected PRIE and the Standard Deviation (SD) of PRIE, along with the information entropy per time interval, keyword, and language for the period from 2017 to 2024. The high and low ranges of the probability of memory failure or misunderstandings are calculated as the cumulative relative frequency for P < 0.10 and P < 0.50, adjusted by adding or subtracting 1.96 times the square root of the product of cumulative frequency and (1 - cumulative frequency), divided by 1000 (the number of simulations).
| Language | Exp PRIE | SD PRIE | Awareness Ratio (AR) | MSE | ± 95CI AR |
± P (<0.1) AR |
± P(<0.5) AR |
|---|---|---|---|---|---|---|---|
| English | 5.189 | 2.447 | 0.379 | 0.006 | 0.366-0.391 | 0 | 0.743-0.795 |
| Chinese | 18.651 | 2.461 | 0.418 | 0.006 | 0.405-0.431 | 0 | 0.680-0.736 |
| Spanish | 31.802 | 2.464 | 0.451 | 0.006 | 0.438-0.464 | 0 | 0.632-0.690 |
| Portuguese | 12.412 | 2.432 | 0.144 | 0.004 | 0.134-0.153 | 0.539-0,601 | 0.956-0.956 |
| Arabic | 14.805 | 2.443 | 0.150 | 0.004 | 0.140-0.160 | 0.522-0.584 | 0.951 |
| French | 10.032 | 2.445 | 0.353 | 0.006 | 0.340-0.366 | 0.080-0.117 | 0.759-0.809 |
| Russian | 30.230 | 2.447 | 0.459 | 0.005 | 0.450-0.469 | 0 | 0.649-0.709 |
| German | 8.376 | 2.458 | 0.349 | 0.002 | 0.345-0.353 | 0-0.003 | 0.782-0.803 |
Disclaimer/Publisher’s Note: The statements, opinions and data contained in all publications are solely those of the individual author(s) and contributor(s) and not of MDPI and/or the editor(s). MDPI and/or the editor(s) disclaim responsibility for any injury to people or property resulting from any ideas, methods, instructions or products referred to in the content. |
© 2025 by the authors. Licensee MDPI, Basel, Switzerland. This article is an open access article distributed under the terms and conditions of the Creative Commons Attribution (CC BY) license (http://creativecommons.org/licenses/by/4.0/).
Copyright: This open access article is published under a Creative Commons CC BY 4.0 license, which permit the free download, distribution, and reuse, provided that the author and preprint are cited in any reuse.


