
Submitted:
27 February 2025
Posted:
28 February 2025
You are already at the latest version
Abstract
Plant microbiomes provide significant fitness advantages to their plant hosts, especially in the sub-nival belt. Studies to date have primarily focused on belowground communities in this region. Here we utilized high-throughput DNA sequencing to quantify bacterial communities in the rhizosphere soil as well as in the root and leaf endosphere compartments of Silene nigrescens to uncover the differentiation and interconnections of these bacterial communities along the soil-to-plant continuum. Our findings revealed that the bacterial communities exhibit notable variation across different plant compartment niches: the rhizosphere soil, root endosphere, and leaf endosphere. There was a progressive decline in diversity, network complexity, network modularity, and niche breadth from the rhizosphere soil to the root endosphere, and further to the leaf endosphere. Conversely, both the host plant selection effect and the stability of these communities showed an increasing trend. Total nitrogen and total potassium emerged as crucial factors accounting for the observed differences in diversity and composition, respectively. Moreover, source-tracking analysis indicated a migration of bacterial communities between the rhizosphere soil, root endosphere, and leaf endosphere. The genera Pseudomonas, Mycobacterium, Conexibacter, Arthrobacter, Sphingomonas, Aureimonas, Devosia, Pseudarthrobacter, and Pseudonocardia constituted the core of the bacterial microbiome. These taxa are shared across all three compartment niches and function as key connector species. Notably, Pseudomonas stands out as the predominant taxon among these bacteria, with nitrogen being the most significant factor influencing its relative abundance. These findings provide a novel, integrative perspective on the plant microbiome within sub-nival ecosystems.
Keywords:
differentiation
; connection
; bacteria community
; Silene nigrescent
; subnival belt
1. Introduction
The sub-nival belt, situated near the alpine snowline, represents the highest terrestrial habitat on Earth [1]. In this extreme environment, plants operate at the brink of their physiological and ecological limits [1,2,3]. However, these plants are not isolated entities; they function as holobionts, consisting of the host plants and their associated microbiomes[4]. The microbiome, which inhabits the rhizosphere, roots, and other plant tissues, plays a crucial role in enhancing plant growth, health, and resilience to environmental stressors[5,6,7]. Given the importance of these microbial partnerships, it is imperative to deepen our understanding of plant microbiomes in sub-nival ecosystems to uncover how plants survive and adapt to climate change in such extreme environments.
Different plant compartment niches, such as the rhizosphere soil, root endosphere, and leaf endosphere, provide unique biotic and abiotic conditions that support diverse microbial communities [8,9,10]. The microbial communities in these niches vary significantly in density, diversity, and composition [5,11,12]. Moreover, these communities display unique life strategies based on the plant compartment they occupy, with their responses to environmental conditions being specific to these niches [13,14,15,16]. Despite these differences, previous studies have suggested potential interconnections between microbiomes in different plant compartment niches[10,17,18]. Our previous research has also shown that numerous microbial taxa are shared across different plant compartment niches, indicating the existence of potential pathways for microbial exchange among these diverse niches[19,20]. These findings underscore the need for an integrated, systematic approach to studying plant-microbe interactions, which is particularly important given the differing phenological responses of aboveground and belowground plant components to climate change [21]. However, the research on the plant microbiome in the sub-nival belt has predominantly focused on belowground microbial communities, such as those in the rhizosphere and root-associating microbes [22,23,24,25,26,27,28,29], there has been limited exploration into the differentiation and interconnections of microbial communities along the soil-to-plant continuum in these regions.
In the process of coevolution, plants attract beneficial microbes through specific signals and use their immune systems and nutrients to select them [30,31,32]. Additionally, a growing body of evidence suggests that microbiome assembly along the soil-plant continuum is primarily determined by the plant compartment niche, rather than environmental factors such as site location or fertilization practices [15,18,33,34,35,36,37]. These studies underline the crucial role of host plant identity or plant compartment niche in shaping microbial communities. However, it is important to note that the levels and ratios of nitrogen (N), phosphorus (P), and potassium (K) — the three essential nutrients for plant growth and development — significantly influence plant health [38,39,40]. These nutrients directly or indirectly affect the formation, stabilization, and maintenance of plant-associated microbial diversity [41,42,43,44]. Therefore, exploring the relationship between the levels and ratios of these essential nutrients in plants and their associated microbial communities is crucial. However, our understanding of how these nutrient dynamics affect microbial communities associated with plants in the sub-nival belt remains limited.
To bridge the gap in understanding plant microbiomes in sub-nival ecosystems, we utilized next-generation high-throughput sequencing to analyze the bacterial communities in the rhizosphere soil, root endosphere, and leaf endosphere of Silene nigrescens (S. nigrescens). This perennial herb, belonging to the family Caryophyllaceae, sparsely occupies soils in deglaciated areas. Our study aimed to answer the following questions: (i) How do the bacterial communities associated with S. nigrescens differ across various plant compartment niches, and what role do N, P, and K levels and their ratios play in influencing their diversity and composition? (ii) How are the bacterial communities in each plant compartment niche related, and is there a core taxon that connects these communities? By exploring these questions, we seek to provide an integrative perspective on the plant microbiome in extreme environments.
2. Results
2.1. Bacterial Community Diversity Across Different Plant Compartment Niches
High-throughput Illumina sequencing generated a total of 406,306 raw reads. Following quality control, chimera removal, and denoising, 249,642 high-quality reads were retained. These high-quality reads were clustered into 1,576 ASVs. To standardize sampling depth, reads per sample (ranging from 6,368 to 22,395) were rarefied to the minimum read count (6,368). This rarefaction process resulted in a final dataset containing 1,551 bacterial ASVs. Based on our analyses, the rarefaction curves for ASV richness and Shannon diversity reached a saturation plateau (Figure S2). This suggests that we captured the majority of the diversity present in the plant microbiome. Additionally, the high Good's coverage scores, ranging from 99.81% ± 0.0007% to 99.97% ± 0.0005% (Figure 1f), further confirm that our sequencing depth was adequate to reliably characterize the plant microbiome.
The alpha diversity indices, including Richness, Shannon, Pielou, Chao1, and ACE, showed a significant decline along the continuum from rhizosphere soil to root endosphere, and further to the leaf endosphere (Figure 1a–e). The optimized aggregated boosted tree model identified total nitrogen (TN) as the most influential factor driving variations in the alpha diversity indices (Figure 1g–k).
2.2. Bacterial Community Composition Across Different Plant Compartment Niches
There was a significant differentiation in community composition across different plant compartment niches (Table 1). TK was the most significant factor influencing community compositions (Mantel test, r = 0.692, P = 0.0001), followed by TN (r = 0.599, P = 0.0004), TN:TK (r = 0.517, P = 0.0007), TN:TP:TK (r = 0.459, P = 0.0011), and TN:TP (r = 0.445, P = 0.0005) (Table S3). However, the TP and TP:TK had not a significant effect on community composition (Table S3).
At the genus level, differences in the relative abundance of the top 10 taxa were observed across various plant compartment niches. Pseudomonas, with a relative abundance of 93.28%, accounted for the greater relative abundance of taxa in the leaf endosphere (Figure 2a). In the root endosphere, a higher relative abundance of taxa was primarily attributed to Pseudomonas (55.53%), followed by Conyzicola (12.09%), Devosia (1.73%), Allorhizobium-Neorhizobium-Pararhizobium-Rhizobium (1.72%), Pseudonocardia (1.17%), and Actinoplanes (1.60%) (Figure 2a,b,e,g,h,j). By contrast, in the rhizosphere soils, taxa with higher relative abundance included Pseudomonas (29.25%), Blastococcus (5.01%), Nocardioides (3.89%), Pseudonocardia (2.49%), Mycobacterium (2.46%), and Sphingomonas (2.38%) (Figure 2a,c,d–f,i).
The optimized aggregated boosted tree model indicated that TN was the most significant factor in explaining variations in the relative abundance of several bacterial genera: Pseudomonas (66.34%), Nocardioides (77.99%), Sphingomonas (47.51%), Allorhizobium-Neorhizobium-Pararhizobium-Rhizobium (38.09%), and Devosia (76.10%) (Figure 3a,c,f,g, j). The ratio of TN to TP accounted for 41.55% of the variation in the relative abundance of Conyzicola (Figure 3b). Meanwhile, the TP to TK ratio explained 64.51% and 38.11% of the variation in the relative abundance of Blastococcus and Actinoplanes, respectively (Figure 3c,h). Additionally, TP was responsible for 47.75% and 31.87% of the variation in the relative abundance of Pseudonocardia and Mycobacterium, respectively (Figure 3e,i).
Indicator species analysis revealed that there were 5 indicator ASVs for the leaf endosphere, with 4 of these ASVs belonging to members of the Pseudomonas genus (Table 2). For the root endosphere, there were 4 indicator ASVs, belonging to the genera Conyzicola, Polaromonas, Brevundimonas, and Delftia (Table 2). By contrast, the rhizosphere soil had 15 indicator ASVs. Of these, 4 were from Blastococcus, 2 from Nocardioides, 2 from Allorhizobium-Neorhizobium-Pararhizobium-Rhizobium, and the remaining ASVs were associated with members of the Frankiales, Gaiella, MB-A2-108, Microbacteriaceae, Beijerinckiaceae, Sporichthyaceae, and Gemmatimonadaceae (Table 2).
The plant compartment niche/bacteria preference analysis demonstrated that specific bacterial ASVs were favored by the three plant compartment niches, with a strong preference observed in the leaf endosphere (P < 0.0001) (Figure 4a). Additionally, 13 abundant bacterial ASVs exhibited significant preferences for plant compartment niches (P < 0.001). These include ASV1-3 and 5-7(Pseudomonas), ASV11(Actinoplanes), ASV12(Carnobacterium), ASV18(Bosea), ASV32(Delftia), ASV33(Allorhizobium-Neorhizobium-Pararhizobium-Rhizobium), ASV48 Blastococcus), and ASV51(Beijerinckiaceae).In our dataset, 6 pairs of plant compartment niches and abundant bacterial ASVs exhibited remarkably strong preferences, with two-dimensional preference (2DP) values greater than 3. These pairs include the leaf endosphere with ASV7 (Pseudomonas) and ASV12 (Carnobacterium), and the rhizosphere soil with ASV48 (Blastococcus), ASV51 (Beijerinckiaceae), and ASV54 (Sporichthyaceae) (Figure 4c,d).
2.3. Bacterial Community Co-Occurrence Networks Across Different Plant Compartment Niches
Construction of correlation-based networks of the bacterial communities resulted in three networks, consisting of 35, 152, and 359 nodes connected by 66, 932, and 3424 edges, respectively (Table 3). The values of the average clustering coefficient, average path length, and modularity of each plant compartment niche Erdős-Rényi random network exhibited lower than those of the respective observed network, suggesting that the observed network was non-random and modular structure (Table 3).
we found more modular structures in rhizosphere soil and root endosphere networks due to their larger modularity values (Table 3). Similarly, the node degree was significantly larger for the rhizosphere soil and root endosphere networks than for the leaf endosphere network (Figure 5B). In contrast, the node closeness centrality within both the rhizosphere soil network and the root endosphere network was significantly lower compared to that of the leaf endosphere networks (Table 3). Additionally, we identified 66, 26, and 4 nodes as connectors in the rhizosphere soil, root endosphere, and leaf endosphere networks, respectively (Table S4). The species composition of connectors varied significantly across different plant compartments. For instance, all connectors in the leaf endosphere network were identified as Pseudomonas (family Pseudomonadaceae). In the rhizosphere soil network, most connectors belonged to families such as Geodermatophilaceae (e.g., Geodermatophilus, Blastococcus, Modestobacter), Pseudonocardiaceae (e.g., Lechevalieria, Pseudonocardia), Solirubrobacteraceae (e.g., Solirubrobacter, Conexibacter), Microbacteriaceae (e.g., Microbacterium, Clavibacter, Rathayibacter), Beijerinckiaceae (e.g., Methylobacterium-Methylorubrum, Microvirga), Devosiaceae (e.g., Devosia), Pseudomonadaceae (e.g., Pseudomonas), and Sphingomonadaceae (e.g., Sphingomonas) (Table S4).
2.4. Bacterial Community Niche Breadth, Stability and Host Selection Processes Across Different Plant Compartment Niches
The niche breadth and AVD of the community showed a gradual decline as they transitioned from the rhizosphere soil to the root endosphere, and further to the leaf endosphere (Figure 6a,b). Furthermore, we assessed the depleting effect of host plants on their associated bacterial taxa. Host plants exerted significant selection pressure on taxa originating from the rhizosphere soil (Figure 6c,d). For instance, stronger selection pressure was observed on taxa within the leaf endosphere, as indicated by the highest DI value (14.07) recorded in this region (Figure 6d).
2.5. The Connections Among Bacterial Communities Within Different Plant Compartments
The 56 ASVs, representing 3.6% of the total ASVs, shared among the rhizosphere soil, root endosphere, and leaf endosphere, predominantly belong to the genera Pseudomonas, Pseudarthrobacter, Nocardioides, IMCC26256, Gaiella, Bradyrhizobium, and Sphingomonas. (Figure 7a and Table S7). Meanwhile, 222 ASVs, accounting for 8.6% of the total ASVs, are commonly found in both the rhizosphere soil and root endosphere. These ASVs predominantly originate from the genera Pseudomonas, Pseudonocardia, Allorhizobium-Neorhizobium-Pararhizobium-Rhizobium, Nocardioides, Mycobacterium, Bradyrhizobium, Blastococcus, Aureimonas, Solirubrobacter, and Sphingomonas (Figure 7a and Table S7). Additionally, 100 ASVs, making up 6.4% of the total ASVs, are shared between the rhizosphere soil and leaf endosphere. The majority of these belong to the genera Pseudomonas, Sphingomonas, IMCC26256, Nocardioides, Gaiella, Conyzicola, Brevundimonas, and Arthrobacter (Figure 7a and Table S7). Furthermore, the root endosphere and leaf endosphere share 103 ASVs, accounting for 6.6% of the total ASVs. These predominantly belong to the genera Pseudomonas, Nocardioides, Massilia, IMCC26256, Corynebacterium, Brevundimonas, Chryseobacterium, and Bradyrhizobium (Figure 7a and Table S7).
Source tracking analysis indicated that 6.14% of the taxa in the root endosphere originated from rhizosphere soil, while 50.93% was derived from the leaf endosphere (Figure 7b). By contrast, 91.51% of the taxa in the leaf endosphere were traced back to the root endosphere (90.34%) and rhizosphere soil (1.17%) (Figure 7b). Furthermore, we found that the Pseudomonas and Delftia were significantly enriched and overlapped in two plant compartment niches (root endosphere and leaf endosphere) (Figure 7c). However, taxa from Conexibacter, Blastococcus, 67-14, and Nakamurella were significantly depleted in the endospheres of both leaves and roots (Figure 7d).
We also created a Zi-Pi plot to clarify the topological roles of nodes in the co-occurrence network, encompassing all taxa present in rhizosphere soil, root endosphere, and leaf endosphere (Figure 7e,f, Table S5) results showed that most nodes (227 or 92.73%) were classified as peripherals, with 52 nodes (18.64%) identified as connectors (Table S5). All connectors primarily belonged to the following genera: Pseudomonas (9.61% of all connectors), Mycobacterium (7.69%), Conexibacter (5.77%), Arthrobacter (3.85%), Aureimonas (3.85%), Devosia (3.85%), Pseudarthrobacter (3.85%), Pseudonocardia (3.85%), and Sphingomonas (3.85%) (Table S5).
3. Discussion
3.1. Variations in Bacterial Community Across Different Plant Compartment Niches
Plants provide varied compartment niches for microbes, each with distinct environmental conditions. The rhizosphere is a complex, nutrient-rich environment supported by root-exuded carbon compounds and nutrients [59]. The root system, by contrast, offers an internal environment with high humidity and stable nutrient availability, while leaves are subject to external factors such as light, temperature, and atmospheric composition [60]. These differing conditions lead to specific microbial community structures. Rhizospheric microbes benefit from root-released nutrients, whereas plants selectively curate microbes in the root and leaf endospheres based on nutrient availability and immune defenses [60,61]. Our study shows that the diversity, composition, niche breadth, stability, and co-occurrence network properties of bacterial communities vary significantly across the rhizosphere soil, root endosphere, and leaf endosphere. Notably, the diversity, network complexity, network modularity, and niche breadth progressively decrease from the rhizosphere to the root endosphere and then to the leaf endosphere. These differences are largely driven by the unique conditions and selective pressures of each plant compartment niche. Additionally, these results further support the view that the rhizosphere provides diverse and suitable ecological niches for microbial communities [62]. In contrast, the internal plant environments are more selective, which limits the number of microbial species that can successfully adapt and persist [63].
The stability of a microbiome is primarily attributed to species diversity, with a general consensus that biodiversity positively influences microbiome stability [64]. For example, previous studies have demonstrated that higher diversity can enhance community stability [51], supporting the notion that diverse ecosystems are better equipped to adapt to and withstand environmental disturbances. However, in this study, we found a negative correlation between diversity and stability of bacterial communities (Table S6). Notably, we observed that the leaf endosphere, despite having the lowest bacterial diversity, exhibited the highest community stability (Figure 1a–e and Figure 6b). This apparent paradox can be explained by its co-occurrence network, which is characterized by high closeness centrality and low modularity. High closeness centrality indicates well-connected nodes within the network, enabling rapid flow of information and resources across the community [65]. This connectivity boosts collective responsiveness to environmental changes. On the other hand, low modularity points to a more integrated network structure, with fewer distinct modules and increased interactions, contributing to overall stability [66].
We have identified a significant difference in the indicator taxa and connector taxa among the rhizosphere soil, root endosphere, and leaf endosphere. This indicates that bacterial communities exhibit a high degree of compartmentalization and specialization, reflecting distinct ecological dynamics and functional roles within each plant compartment niche. This adaptation may involve physiological and metabolic traits that confer advantages under the particular conditions of each compartment niche, such as nutrient availability, host interactions, and defense strategies [4]. Additionally, this study revealed a significant preference between specific taxa and plant compartment niches, suggesting a dynamic evolutionary relationship from a co-evolutionary perspective. This reciprocal adaptive process underscores the complexity and interdependence within plant-microbe ecosystems, highlighting the importance of considering evolutionary history in studies of plant-microbe interactions.
In the rhizosphere soil, taxa such as Blastococcus, Beijerinckiaceae, and Sporichthyaceae function as indicator species, showing a strong preference for this environment. This suggests they are well-adapted to the unique conditions of the rhizosphere, indicating a symbiotic relationship where both the microorganisms and the rhizosphere benefit, potentially through nutrient exchange and enhanced root health [59]. Such mutual preferences highlight the adaptive strategies these taxa employ to thrive in their specific niche. In the root endosphere, Conyzicola, Polaromonas, Brevundimonas, and Delftia were identified as indicator species, with Conyzicola and Delftia also acting as connector genera. The dual role of Conyzicola and Delftia as indicators and connectors highlights their importance in enhancing nutrient dynamics and supporting a stable microbial community in the root endosphere, which was supported by previous studies. For instance, Research on maize endophytes has shown that Conyzicola can solubilize insoluble zinc compounds and produce siderophores [67]. Additionally, Delftia species have been found to produce indole-3-acetic acid, fix atmospheric nitrogen, and solubilize essential minerals such as phosphorus and potassium [68]. In the leaf endosphere, the bacterial microbiome was primarily composed of Pseudomonas, which acted as both an indicator and connector genus for leaf endophytes. Moreover, there was a significant mutual preference between Pseudomonas and leaf endosphere. The dominance of Pseudomonas in the leaf endosphere, serving as both an indicator and connector genus, is largely due to its exceptional metabolic diversity and ability to form beneficial interactions with host plants, such as enhancing nutrient uptake or providing pathogen resistance [69]. These abilities give Pseudomonas a significant adaptive advantage, allowing it to effectively colonize and thrive within the leaf endosphere, which in turn supports its role as a key component of the microbial community. This mutual preference likely results from co-evolutionary dynamics that optimize plant-microbe interactions for mutual benefit.
3.2. The Relationship Between Nitrogen, Phosphorus, and Potassium Levels and Ratios and the Diversity and Composition of Bacterial Communities
The concentrations and ratios of nitrogen, phosphorus, and potassium influence plant-associated microbial communities both directly and indirectly. For instance, an increase in nitrogen levels can stimulate the proliferation of bacteria that utilize nitrogen, thereby enhancing nitrogen availability to plants [70]. In contrast, imbalanced nutrient ratios may inhibit beneficial microbes such as mycorrhizal fungi, which impairs the efficiency of phosphorus uptake [71]. Additionally, adequate potassium levels can support the presence of bacteria that contribute to disease resistance, fostering a healthier and more resilient microbial community within the rhizosphere [72,73].
Our findings indicate that total nitrogen was the crucial factor in accounting for the differences in diversity and composition. This strong correlation underscores the critical role of nitrogen in shaping the diversity of bacterial communities associated with S. nigrescens, likely due to its pivotal functions in metabolic processes and overall productivity of these ecosystems. The ratios of total nitrogen, total phosphorus, and total potassium have significantly impacted the diversity (e.g., Shannon and Chao1 indices) and composition of the bacterial community associated with S. nigrescens. These findings underscore the importance of considering the combined effects of nitrogen, phosphorus, and potassium, as their integrative influence significantly impacts microbial diversity and composition. This comprehensive interaction likely reflects complex nutrient cycling processes and their synergistic effects on the structure of microbial communities associated with S. nigrescens. Additionally, our findings indicate that total potassium is the most significant factor influencing bacterial community composition. This supports previous research emphasizing potassium as a crucial element in various biochemical pathways within both plants and microbes. For example, potassium is vital for enzyme activation and osmoregulation, influencing plant growth and microbial metabolism [72,74].
3.3. The Connection of Bacterial Communities Across Various Plant Compartment Niches
The results of our current study reveal that numerous ASVs are shared among the rhizosphere soil, root endosphere, and leaf endosphere. We further assess the source and sink relationships of the bacterial communities associated with the rhizosphere soil, root endosphere, and leaf endosphere. The results indicate that the rhizosphere soil contributes 6.14% to the root endophytes and 1.17% to the leaf endophytes, respectively. Moreover, root and leaf endophytes serve as sources and sinks for one another. On the one hand, these results indicate an interconnection of bacterial taxa among the rhizosphere soil, root endosphere, and leaf endosphere; on the other hand, these results demonstrate that the nearby species pool is a potential source of plant endophytes. In line with our results, similar findings have also been reported in crop microbiomes[10,18]. However, contrary to previous findings suggesting that soils serve as a primary reservoir for plant-associated microbiomes [8,75,76], our results reveal a surprisingly low contribution from the rhizosphere soil, with only 6.14% of the bacteria in the root endosphere originating from this source. Previous studies have shown that the adaptive strategies of Silene acaulis in the sub-nival belt are primarily attributed to the morphology and functions of its canopy, rather than rhizosphere-mediated effects that recruit and foster growth-promoting microbial communities [26]. This characteristic of Silene acaulis may potentially disrupt the interconnection between rhizosphere microbes and endophytes. Furthermore, seeds serve as a primary vehicle for parent plants to transmit microbes to their offspring [77]. Consequently, we hypothesize that seed-borne bacteria are likely to be the predominant source of bacteria associated with Silene species.
In our current study, we discovered that Pseudomonas, Mycobacterium, Conexibacter, Arthrobacter, Sphingomonas, Aureimonas, Devosia, Pseudarthrobacter, and Pseudonocardia are shared across the rhizosphere, root endosphere, and leaf endosphere. Moreover, these taxa have been identified as key connector species in the bacterial community networks. Notably, Pseudomonas was the predominant genus in the rhizosphere, root, and leaf endospheres, with significant enrichment in the leaf and root endospheres. These findings demonstrate that these bacterial taxa, particularly those within the Pseudomonas genus, form the core microbiome of S. nigrescens, playing a crucial role in maintaining the integrity and stability of its associated bacterial community. Studies have shown that taxa within the Pseudomonas genus possess a remarkable ability to colonize plant environments, promote plant growth, and inhibit plant pathogens [69]. The Mycobacterium is known for its flexibility in energy metabolism, and this taxon can significantly enhance stress tolerance of host plant through 1-aminocyclopropane-1-carboxylic acid deaminase activity [78,79]. Arthrobacter has been reported as part of the core microbiota for many plants [80,81,82]. The genome of Arthrobacter sp. contains several genes responsible for the synthesis of plant hormones, and its inoculation has demonstrated a significantly positive effect on plant growth [88]. Sphingomonas are usually found in multiple parts (roots, leafs, flowers) of mature plants and can promote plant growth and enhance plant resistance to osmotic stress [47,85]. Conexibacter has been shown to enhance the stability of microbial communities in adverse environmental conditions [86]. Genome analysis of taxa within Aureimonas revealed traits for exopolysaccharide synthesis, protein secretion, biofilm production, and stress adaptation, as well as a significant positive impact on plant health [87]. Devosia is a symbiotic nitrogen-fixing bacterium that can enhance plant growth through the production of siderophores and indole-3-acetic acid [83]. The taxa belonging to Pseudarthrobacter are potential cold-adapted bacteria [89] and have shown beneficial effects on plant growth and flavonoid content [90]. Strains of the Pseudonocardia genus, isolated from plant tissues like stems, leaves, and root nodules [91], are of interest for their ability to produce glycosylated polyenes and novel antifungal compounds [92]. Based on the evidence from these studies, we summarize the characteristics of the core bacteria of S. nigrescens as follows: 1) they can colonize various plant environments, 2) they possess beneficial traits for the plant, 3) they play a crucial role in maintaining the stability and integrity of the microbial community, and 4) Pseudomonas is the notably predominant taxon. Furthermore, the theoretical framework of coevolution suggests that plants and their microbiomes have evolved together over millions of years, with most of these interactions being mutually beneficial [30,32]. Consequently, we speculate that the symbiotic relationship between S. nigrescens and its core bacteria may represent a key adaptive mechanism that enables S. nigrescens to withstand the harsh conditions of the sub-nival belts.
Previous studies have demonstrated that certain taxa within the Pseudomonas genus possess nitrogen-fixing capabilities [93]. Inoculating plants with these taxa can enhance nitrogen fixation and, in turn, promote plant growth [94]. In our study, we observed that the relative abundance of Pseudomonas and the total nitrogen levels increased progressively from the rhizosphere soil to the roots and leaves. Notably, total nitrogen was identified as the most significant factor explaining the variations in the relative abundance of Pseudomonas. These findings suggest a strong association between nitrogen availability and the colonization and proliferation of Pseudomonas within S. nigrescens. The increased nitrogen levels may create a favorable environment for Pseudomonas, facilitating their growth and potential nitrogen-fixing activity, which could further contribute to the nitrogen availability within the plant system. This relationship underscores the potential role of Pseudomonas in enhancing plant nutrient uptake and growth through nitrogen fixation. In contrast, although total nitrogen is the key factor for variations in their relative abundance, Sphingomonas and Devosia exhibit an opposite trend to nitrogen levels from rhizosphere soil to roots and leaves. This observation implies that the relative abundance trends in Sphingomonas and Devosia are likely the result of complex interactions between multiple biotic and abiotic factors, rather than being driven solely by nitrogen levels. Further studies incorporating environmental, genetic, and ecological aspects could help unravel these complex interactions. Additionally, we identified total phosphorus as the most significant factor explaining the variations in the relative abundance of Pseudonocardia and Mycobacterium. Interestingly, the rhizosphere soil exhibited the highest relative abundance of both genera and also had the highest total phosphorus levels. Microbes related to Pseudonocardia possess the ability to mobilize organic phosphorus through the secretion of phosphatase enzymes[95]. Research has indicated that Mycobacterium-related strains possess genes encoding an inorganic phosphorus transporter system, such as pstSCAB [96]. Given these observations, it is evident that total phosphorus level plays a crucial role in affecting the relative abundance of Pseudonocardia and Mycobacterium associated with S. nigrescens.
4. Materials and Methods
4.1. Site Depiction and Sampling
This study was conducted in the Qiangyong Glacier Basin (28°53′N, 90°13′E), situated on the northern flank of the Himalayas (Figure S1a,b). In August 2020, we selected ten healthy individual plants (>20 m apart from each other) at the Qiangyong glacier terminus zone (Figure S1c, Table S1). The glacier terminus zone is positioned between the glacier terminus and the confluence of the west and east glacier runoff. Its formation dates back to the Little Ice Age (approximately 0.13 ± 0.02 to 0.36 ± 0.09 ka BP) [45] (Figure S1b,c). The whole plants with intact root systems were excavated using sterilized spades, shaking off the loosely bound rhizosphere soil. Subsequently, the leaves and roots were collected from each plant, placed in individual sterilized polyethylene bags, labeled, immediately stored in a refrigerator (-20°C), and transported to the laboratory. Additionally, soil that was not in contact with the root systems and situated at least 50 cm away from each sampled plant was collected after removing the topsoil. All collected soil samples were placed in sterilized plastic bags and immediately frozen at -20°C until they arrived at the laboratory.
4.2. Sample Collection of Rhizosphere Soil, Root Endosphere, and Leaf Endosphere Fractions
The leaves were washed with sterile cooled TE (Tris-EDTA, 10 mM Tris, 1 mM EDTA, pH 7.5) buffer, and then the washed leaves were disinfected by consecutive immersion for 1 min in 80% (vol/vol) ethanol, 5 min in 3.25% (vol/vol) sodium hypochlorite, and 30 s in 80% ethanol. Sterilization was completed with three sequential 2 min rinses in sterile distilled water, followed by leaves that were dried with sterile absorbent paper. To validate the effectiveness of surface sterilization, the sterile water (100 μL) used in the final rinse was added to TSA (Tryptic Soy Agar) and cultured in the dark for 7 d at 28℃ to check for the appearance of colonies. The fibrous roots (diameter < 2 mm) separated from the taproot using sterilized scissors, and then root samples were placed into 50 mL sterile centrifuge tubes and were washed with PBS buffer (10 mM, pH 7.4) on a shaking table (150 rpm) for 1h, followed by the fibrous roots were separated from suspension. The soil particles directly dislodged from the fibrous root were defined as the rhizosphere soil, which was pelleted by centrifugation (10000 × g for 10 min) in 50 ml sterile centrifuge tubes. The root samples were then separated, surface-sterilized, and verified as described above for leaf samples. In total, 30 samples (1 plant species × 10 individual plants × 3 compartments) were used in this study. All the samples were stored at -80°C until required for DNA extraction.
4.3. DNA Extraction and PCR Amplification
The roots and leaves were aseptically cut, and freeze-dried in liquid nitrogen, followed by homogenized with a mortar and pestle under aseptic conditions. The genome DNA extracting from homogenized tissues and rhizosphere soils was performed via DNeasy R PowerSoil R Kit (Mo Bio Laboratories, Carlsbad, CA, United States) with their standard protocol. Qubit double stranded DNA assay kit (Invitrogen, Singapore) was used for quantifying genomic DNA. The extracted DNA was subjected to bacterial 16s region amplification using primers 799F (AACMGGATTAGATACCCKG) and 1193R (ACGTCATCCCCACCTTCC). PCR was performed in a 20 μL reaction solution containing 5 × FastPfu Buffer (4 μl), 2.5 mM each dNTP (2 μl), 5 μM of each primer (0.8 μl), FastPfu Polymerase (0.4 μl), BSA (0.2 μl) and 10 ng of template DNA. The PCR conditions were set at 95°C for 3 min, 27 cycles for denaturation at 95 °C for 30 s, annealing at 55°C for 30 s, and extension at 72°C for 45 s, followed by a final extension at 72 °C for 10 min. PCR products were cleaned and purified using AxyPrep DNA Gel Extraction Kit (Axygen Biosciences, Union City, CA, United States) and quantified using Quantus™ Fluorometer (Promega, United States). The sequencing library was constructed by the addition of an Illumina sequencing adaptor to the product using NEXTFLEX R Rapid DNA-Seq Kit (Bioo Scientific, United States), according to the manufacturer’s protocol. Libraries were sequenced on the Illumina MiSeq PE 250 platform with a Paired-End protocol at the Majorbio Bio-Pharm Technology, Co., Ltd. (Shanghai, China).
4.4. Quantification of Total Nitrogen, Total Phosphorus, and Total Potassium Contents in Soil, Roots, and Leaves
To measure total nitrogen (TN), air-dried soil samples (0.5 g) were digested with a mixture of K₂SO₄, CuSO₄, and Se (100:10:1 ratio) and 5 mL of H₂SO₄. After cooling, the digest was diluted to 20 mL with distilled water, filtered, and analyzed colorimetrically at 660 nm using a SEAL AutoAnalyzer 3 (Bran-Luebbe, Germany). The total phosphorus (TP) content in the soil was determined using the NaOH melting-molybdenum antimony colorimetric method. Air-dried soil samples (0.25 g) were fused with NaOH in nickel crucibles at 720 °C using a muffle furnace. The resulting digest was transferred to a 50 mL volumetric flask to fix the solution volume for phosphorus (P) measurement. An aliquot of 2-10 mL of this solution was then mixed with a Mo-Sb chromogenic agent, and the absorbance was measured at 700 nm using a spectrophotometer (Shimadzu UV-1900i, Japan). The total potassium (TK) content was determined by mixing air-dried soil samples (0.25 g) with 2.0 g of NaOH in a nickel crucible and heating at 720°C for 15 minutes in a muffle furnace. After cooling, the fusion product was dissolved in 10 mL of deionized water and adjusted to a final volume of 50 mL in a volumetric flask. The emission intensity of the resulting solution was measured using a flame photometer (FP6410, China).
The root and leaf samples were first washed with tap water and distilled water, then oven-dried at 80°C for 48 hours and weighed. The dried samples were ground to pass through a 0.5 mm sieve. A 0.3 g portion of the dry root or leaf sample was soaked in 10 mL sulfuric acid (H2SO4) for 24 hours and subsequently digested in a digestion system within a fume hood, heated to 180°C for 3 hours, followed by the addition of 5 mL hydrogen peroxide (H2O2). The digested solution was transferred into a 100 mL volumetric flask and diluted to 100 mL with deionized water for the analysis of TN, TP, and TK. The TN concentration was analyzed using the SEAL AutoAnalyzer 3 (Bran-Luebbe, Germany). TP concentration was measured using the molybdenum antimony colorimetric method. TK concentration was determined with a flame photometer (FP6410, China).
4.5. Bioinformatic Analysis
Raw sequencing was processed using the bioinformatic pipeline QIIME2 (version 2022.2) [46]. The16S rRNA gene sequences were demultiplexed using the cutadapt plugin in Qiime2 [41]. The QIIME2 plugin DADA2 was used for quality control, filtering, chimera identification, denoising, clustering of the sequences to amplicon sequence variation (ASV), and producing the feature table. Sequences were assigned to taxonomy with the QIIME2 plugin feature classifier [47] by pretrained naive Bayes classifiers [48] trained on the SILVA 138 database [49] for the 16S rRNA gene sequences. After then, ASVs that were identified as chloroplast, mitochondria and unclassified were removed from the 16S rRNA gene sequences. Phylogenetic trees were built using the MAFFT alignment in QIIME 2 and FastTree algorithm [50]. . The 16S rRNA sequences have been submitted to the NCBI Sequence Read Archive and will be made publicly available following the acceptance of this manuscript.
4.6. Statistical Analysis
All statistical analyses were conducted in R (version 4.3.3), using the ggplot2 package (version 3.5.1) for visualization. However, the co-occurrence network visualizations were executed using Gephi version 0.10. Furthermore, the Wilcoxon Test was conducted to identify significant differences among the groups.
The alpha diversity indices, including Richness, Shannon, Pielou's evenness, Chao1, ACE, and Good's coverage, were calculated using the picante package (version 1.8.2). Niche breadth was assessed using the niche.width function from the spaa package (version 0.2.2). The Average Variation Degree (AVD) was determined according to the approach outlined by [51]. Indicator species analysis was conducted using the multipatt function from the indicspecies package (version 1.7.14). Three distinct permutation tests were executed: permutational multivariate analysis of variance (ADONIS), analysis of similarity (ANOSIM), and multiple response permutation procedure (MRPP). These tests utilized the adonis, anosim, and mrpp functions, respectively, from the vegan package (version 2.6-6.1), and were based on Bray-Curtis and Unifrac dissimilarity measures. For differential abundance analysis, the cpm, glmFit, and glmLRT functions from the edgeR package (version 4.0.16) were used for data filtering, model fitting, and differential expression testing, respectively. SOURCETRACKER (version 1.0), based on a Bayesian approach, was employed to estimate the potential sources[52]. The VennDiagram package (version 1.7.3) was used to determine the shared and unique elements among different groups. The plant compartment niche/bacterium preferences were evaluated based on the methodologies outlined by [53] and [9].
Co-occurrence networks were constructed by calculating Spearman's rank coefficients (r) between Amplicon Sequence Variants (ASVs). Relationships were deemed statistically robust with r > 0.8 and statistically significant with P < 0.01. Node topology features, such as node degree and closeness centrality, were computed using the igraph package (version 2.0.3). Additionally, 10,000 Erdős-Rényi model random networks were generated[54]. To further explore keystone species within co-occurrence networks, within-module connectivity (Zi) and inter-module connectivity (Pi) were calculated using the Hmisc package (version 5.1-3) and the igraph package (version 2.0.3). Nodes are classified into four functional types based on their topological characteristics, as described by [55]: Connectors, which exhibit high connectivity between different modules (Zi < 2.5 and Pi > 0.62); Module Hubs, which have high connectivity within a single module (Zi > 2.5 and Pi < 0.62); Network Hubs, which show high overall connectivity both within and between modules (Zi > 2.5 and Pi > 0.62); and Peripherals, which do not display high connectivity in either context (Zi < 2.5 and Pi < 0.62).
The relative significance of the levels and ratios of TN, TP, and TK in explaining variations in alpha diversity and the relative abundance of dominant taxa was analyzed using Aggregated Boosted Tree models [56,57]. To investigate the relationship between the Bray-Curtis community dissimilarity index and the Euclidean distances of TN, TP, TK, TN:TP, TN:TK, TP:TK, and TN:TP:TK values, the Mantel statistic was applied [58]. Furthermore, the relationship between alpha diversity and Average Variation Degree (AVD) was assessed using Spearman's correlation.
5. Conclusions
Collectively, our findings demonstrate that the bacterial communities associated with S.nigrescens vary significantly across the rhizosphere soil, root endosphere, and leaf endosphere. Total nitrogen and total potassium emerged as the crucial factor accounting for the observed differences in diversity and composition, respectively. Additionally, we revealed the interconnectedness of bacterial communities within different compartment niches of S.nigrescens and identified the core bacterial taxa associated with the plant. Notably, Pseudomonas stands out as the predominant taxon among these core bacteria, with total nitrogen being the most significant factor influencing its relative abundance. This study provides a novel, integrative perspective on the plant microbiome in sub-nival ecosystems. It deepens our understanding of the bacterial communities associated with pioneer plants along the soil-to-plant continuum in the sub-nival belt. Further investigation using other technologies, such as metagenome or meta-transcriptome approaches, is necessary to deeply understand the interactions of bacterial communities within various compartment niches of pioneer plants in the sub-nival belt.
Supplementary Materials
The following supporting information can be downloaded at the website of this paper posted on Preprints.org, Table S1 The geographic information of the Silene nigrescens (S.nigrescens) were collected from the sub-nival belt of the Qiangyong glacier. Table S2 The differences in levels and ratios of total nitrogen (TN), total phosphorus (TP), and total potassium (TK) among soil, roots, and leaves. Different lowercase letters denote significant differences in the levels and ratios of total nitrogen (TN), total phosphorus (TP), and total potassium (TK) among soil, roots, and leaves, as identified by the Wilcoxon Test with a significance level of P < 0.05. Table S3. The correlation between the levels and ratios of TN (total nitrogen), TP (total phosphorus), and TK (total potassium) and the bacterial community composition was determined using the Mantel test. Table S4. Keystone nodes in the co-occurrence networks of the bacterial communities associated with the rhizosphere soil, root endosphere, and leaf endosphere. Table S5. Keystone nodes in the co-occurrence networks of bacterial community, encompassing all taxa present in rhizosphere soil, root endosphere, and leaf endosphere. Table S6. The Spearman correlation between alpha diversity and the average variation degree (AVD) of the bacterial community. ***P < 0.001. Table S7. Amplicon Sequence Variants (ASVs) that are common among the rhizosphere soil, root endosphere, and leaf endosphere. Table S8. Key topological properties of bacterial co-occurrence networks, encompassing all taxa within the rhizosphere soil, leaf endosphere, and root endosphere. Figure S1. The location of the Qiangyong glacier (a, b), and the Silene nigrescens (S.nigrescens) grow in the Qiangyong glacier terminus (c). Figure S2. Rarefaction curves of ASV richness and Shannon diversity.
Author Contributions
This work was conceived by Yongqin Liu. Fieldwork was conducted by Wangchen Sonam and Luming Ren. Wangchen Sonam performed the laboratory work and data analysis and also authored the manuscript. All authors were involved in revising the manuscript critically.
Funding
This work was supported by the National Natural Science Foundation of China (42330410), the Second Tibetan Plateau Scientific Expedition and Research (STEP) Program (2019QZKK0503).
Conflicts of Interest
The author(s) declare no conflict of interest.
References
- Yang, J.; Jiang, H.; Dong, H.; Liu, Y. A Comprehensive Census of Lake Microbial Diversity on a Global Scale. Sci. China Life Sci. 2019, 62, 1320–1331. [Google Scholar] [CrossRef]
- Thomas, E.K.; Huang, Y.; Morrill, C.; Zhao, J.; Wegener, P.; Clemens, S.C.; Colman, S.M.; Gao, L. Abundant C4 Plants on the Tibetan Plateau during the Lateglacial and Early Holocene. Quat. Sci. Rev. 2014, 87, 24–33. [Google Scholar] [CrossRef]
- Given, C.; Häikiö, E.; Kumar, M.; Nissinen, R. Tissue-Specific Dynamics in the Endophytic Bacterial Communities in Arctic Pioneer Plant Oxyria Digyna. Front. Plant Sci. 2020, 11. [Google Scholar] [CrossRef]
- Vandenkoornhuyse, P.; Quaiser, A.; Duhamel, M.; Le Van, A.; Dufresne, A. The Importance of the Microbiome of the Plant Holobiont. New Phytol. 2015, 206, 1196–1206. [Google Scholar] [CrossRef] [PubMed]
- Trivedi, P.; Leach, J.E.; Tringe, S.G.; Sa, T.; Singh, B.K. Plant–Microbiome Interactions: From Community Assembly to Plant Health. Nat. Rev. Microbiol. 2020, 18, 607–621. [Google Scholar] [CrossRef] [PubMed]
- Trivedi, P.; Mattupalli, C.; Eversole, K.; Leach, J.E. Enabling Sustainable Agriculture through Understanding and Enhancement of Microbiomes. New Phytol. 2021, 230, 2129–2147. [Google Scholar] [CrossRef]
- Trivedi, P.; Batista, B.D.; Bazany, K.E.; Singh, B.K. Plant–Microbiome Interactions under a Changing World: Responses, Consequences and Perspectives. New Phytol. 2022, 234, 1951–1959. [Google Scholar] [CrossRef]
- Bai, Y.; Müller, D.B.; Srinivas, G.; Garrido-Oter, R.; Potthoff, E.; Rott, M.; Dombrowski, N.; Münch, P.C.; Spaepen, S.; Remus-Emsermann, M.; Hüttel, B.; McHardy, A.C.; Vorholt, J.A.; Schulze-Lefert, P. Functional Overlap of the Arabidopsis Leaf and Root Microbiota. Nature 2015, 528, 364–369. [Google Scholar] [CrossRef]
- Yao, H.; Sun, X.; He, C.; Maitra, P.; Li, X.C.; Guo, L.D. Phyllosphere Epiphytic and Endophytic Fungal Community and Network Structures Differ in a Tropical Mangrove Ecosystem. Microbiome 2019, 7, 57. [Google Scholar] [CrossRef]
- Xiong, C.; He, J.Z.; Singh, B.K.; Zhu, Y.G.; Wang, J.T.; Li, P.P.; Zhang, Q.B.; Han, L.L.; Shen, J.P.; Ge, A.H.; Wu, C.F.; Zhang, L.M. Rare Taxa Maintain the Stability of Crop Mycobiomes and Ecosystem Functions. Environ. Microbiol. 2020, 23, 1907–1924. [Google Scholar] [CrossRef]
- Bulgarelli, D.; Rott, M.; Schlaeppi, K.; Ver Loren van Themaat, E.; Ahmadinejad, N.; Assenza, F.; Rauf, P.; Huettel, B.; Reinhardt, R.; Schmelzer, E.; Peplies, J.; Gloeckner, F.O.; Amann, R.; Eickhorst, T.; Schulze-Lefert, P. Revealing Structure and Assembly Cues for Arabidopsis Root-Inhabiting Bacterial Microbiota. Nature 2012, 488, 91–95. [Google Scholar] [CrossRef]
- Müller, D.B.; Vogel, C.; Bai, Y.; Vorholt, J.A. The Plant Microbiota: Systems-Level Insights and Perspectives. Annu. Rev. Genet. 2016, 50, 211–234. [Google Scholar] [CrossRef] [PubMed]
- Ren, G.; Zhu, C.; Alam, M.S.; Tokida, T.; Sakai, H.; Nakamura, H.; Usui, Y.; Zhu, J.; Hasegawa, T.; Jia, Z. Response of Soil, Leaf Endosphere and Phyllosphere Bacterial Communities to Elevated CO2 and Soil Temperature in a Rice Paddy. Plant Soil 2015, 392, 27–44. [Google Scholar] [CrossRef]
- Sun, A.; Jiao, X.Y.; Chen, Q.; Wu, A.L.; Zheng, Y.; Lin, Y.X.; He, J.Z.; Hu, H.W. Microbial Communities in Crop Phyllosphere and Root Endosphere Are More Resistant than Soil Microbiota to Fertilization. Soil Biol. Biochem. 2021, 153, 108113. [Google Scholar] [CrossRef]
- Zhong, Y.Q.W.; Sorensen, P.O.; Zhu, G.Y.; Jia, X.Y.; Liu, J.; Shangguan, Z.P.; Wang, R.W.; Yan, W.M. Differential Microbial Assembly Processes and Co-Occurrence Networks in the Soil-Root Continuum along an Environmental Gradient. iMeta 2022, 1, e18. [Google Scholar] [CrossRef] [PubMed]
- Shao, L.; Li, X.; Xiao, T.; Lu, T.; Li, J.; Deng, J.; Xiao, E. Variations in Microbial Assemblage between Rhizosphere and Root Endosphere Microbiomes Contribute to Host Plant Growth under Cadmium Stress. Appl. Environ. Microbiol. 2023, 89, e00960–23. [Google Scholar] [CrossRef] [PubMed]
- Turner, T.R.; James, E.K.; Poole, P.S. The Plant Microbiome. Genome Biol. 2013, 14, 209. [Google Scholar] [CrossRef]
- Xiong, C.; Zhu, Y.G.; Wang, J.T.; Singh, B.; Han, L.L.; Shen, J.P.; Li, P.P.; Wang, G.B.; Wu, C.F.; Ge, A.H.; Zhang, L.M.; He, J.Z. Host Selection Shapes Crop Microbiome Assembly and Network Complexity. New Phytol. 2021, 229, 1091–1104. [Google Scholar] [CrossRef]
- Sonam, W.; Liu, Y.; Guo, L. Endophytic Bacteria in the Periglacial Plant Potentilla Fruticosa Var. Albicans Are Influenced by Habitat Type. Ecol. Process. 2023, 12, 57. [Google Scholar] [CrossRef]
- Sonam, W.; Liu, Y. Plant Compartment Niche Is More Important in Structuring the Fungal Community Associated with Alpine Herbs in the Subnival Belt of the Qiangyong Glacier than Plant Species. Symbiosis 2024, 92, 289–304. [Google Scholar] [CrossRef]
- Liu, H.; Wang, H.; Li, N.; Shao, J.; Zhou, X.; van Groenigen, K.J.; Thakur, M.P. Phenological Mismatches between Above- and Belowground Plant Responses to Climate Warming. Nat. Clim. Chang. 2022, 12, 97–102. [Google Scholar] [CrossRef]
- Miniaci, C.; Bunge, M.; Duc, L.; Edwards, I.; Bürgmann, H.; Zeyer, J. Effects of Pioneering Plants on Microbial Structures and Functions in a Glacier Forefield. Biol. Fertil. Soils. 2007, 44, 289–297. [Google Scholar] [CrossRef]
- Teixeira, L.C.R.S.; Peixoto, R.S.; Cury, J.C.; Sul, W.J.; Pellizari, V.H.; Tiedje, J.; Rosado, A.S. Bacterial Diversity in Rhizosphere Soil from Antarctic Vascular Plants of Admiralty Bay, Maritime Antarctica. The ISME Journal 2010, 4, 989–1001. [Google Scholar] [CrossRef]
- Knelman, J.E. Bacterial Community Structure and Function Change in Association with Colonizer Plants during Early Primary Succession in a Glacier Forefield. Soil Biol. 2012, 46, 172–180. [Google Scholar] [CrossRef]
- Ciccazzo, S.; Esposito, A.; Rolli, E.; Zerbe, S.; Daffonchio, D.; Brusetti, L. Different Pioneer Plant Species Select Specific Rhizosphere Bacterial Communities in a High Mountain Environment. SpringerPlus 2014, 3, 391–401. [Google Scholar] [CrossRef] [PubMed]
- Massaccesi, L.; Benucci, G.M.N.; Gigliotti, G.; Cocco, S.; Corti, G.; Agnelli, A. Rhizosphere Effect of Three Plant Species of Environment under Periglacial Conditions (Majella Massif, Central Italy). Soil Biol. Biochem. 2015, 89, 184–195. [Google Scholar] [CrossRef]
- Mapelli, F.; Marasco, R.; Fusi, M.; Scaglia, B.; Tsiamis, G.; Rolli, E.; Fodelianakis, S.; Bourtzis, K.; Ventura, S.; Tambone, F.; Adani, F.; Borin, S.; Daffonchio, D. The Stage of Soil Development Modulates Rhizosphere Effect along a High Arctic Desert Chronosequence. The ISME Journal 2018, 12, 1188–1198. [Google Scholar] [CrossRef]
- Praeg, N.; Pauli, H.; Illmer, P. Microbial Diversity in Bulk and Rhizosphere Soil of Ranunculus Glacialis Along a High-Alpine Altitudinal Gradient. Front. Microbiol. 2019, 10, 1429. [Google Scholar] [CrossRef]
- Sun, S.; Ma, B.; Wang, G.; Tan, X. Linking Microbial Biogeochemical Cycling Genes to the Rhizosphere of Pioneering Plants in a Glacier Foreland. Sci.TotalEnviron. 2023, 872, 161944. [Google Scholar] [CrossRef]
- Foster, K.R.; Schluter, J.; Coyte, K.Z.; Rakoff-Nahoum, S. The Evolution of the Host Microbiome as an Ecosystem on a Leash. Nature 2017, 548, 43–51. [Google Scholar] [CrossRef]
- Martin, F.M.; Uroz, S.; Barker, D.G. Ancestral Alliances: Plant Mutualistic Symbioses with Fungi and Bacteria. Science 2017, 356, eaad4501. [Google Scholar] [CrossRef] [PubMed]
- Cordovez, V.; Dini-Andreote, F.; Carrión, V.J.; Raaijmakers, J.M. Ecology and Evolution of Plant Microbiomes. Annu. Rev. Microbiol. 2019, 73, 69–88. [Google Scholar] [CrossRef]
- Coleman-Derr, D.; Desgarennes, D.; Fonseca-Garcia, C.; Gross, S.; Clingenpeel, S.; Woyke, T.; North, G.; Visel, A.; Partida-Martinez, L.P.; Tringe, S.G. Plant Compartment and Biogeography Affect Microbiome Composition in Cultivated and Native Agave Species. New Phytol. 2016, 209, 798–811. [Google Scholar] [CrossRef] [PubMed]
- Zheng, Y.; Gong, X. Niche Differentiation Rather than Biogeography Shapes the Diversity and Composition of Microbiome of Cycas Panzhihuaensis. Microbiome 2019, 7, 152. [Google Scholar] [CrossRef]
- Zheng, Y.; Li, X.; Cao, H.; Lei, L.; Zhang, X.; Han, D.; Wang, J.; Yao, M. The Assembly of Wheat-Associated Fungal Community Differs across Growth Stages. Appl. Microbiol. Biotechnol. 2021, 105, 7427–7438. [Google Scholar] [CrossRef]
- Guo, Y.; Bei, Q.; Dzomeku, B.M.; Martin, K.; Rasche, F. Genetic Diversity and Community Composition of Arbuscular Mycorrhizal Fungi Associated with Root and Rhizosphere Soil of the Pioneer Plant Pueraria Phaseoloides. iMeta 2022, 1, e51. [Google Scholar] [CrossRef] [PubMed]
- Huang, Y.; Chai, X.; Wang, X.; Gao, B.; Li, H.; Han, Z.; Xu, X.; Zhang, X.; Wu, T.; Wang, Y. Niche Differentiation Shapes the Bacterial Diversity and Composition of Apple. Hortic. Plant J. 2023, 9, 35–44. [Google Scholar] [CrossRef]
- Vance, C.P.; Uhde-Stone, C.; Allan, D.L. Phosphorus Acquisition and Use: Critical Adaptations by Plants for Securing a Nonrenewable Resource. New Phytolo. 2003, 157, 423–447. [Google Scholar] [CrossRef]
- Pettigrew, W.T. Potassium Influences on Yield and Quality Production for Maize, Wheat, Soybean and Cotton. Physiol. Plant. 2008, 133, 670–681. [Google Scholar] [CrossRef]
- Xu, G.; Fan, X.; Miller, A.J. Plant Nitrogen Assimilation and Use Efficiency. Annu. Rev. Plant Biol. 2012, 63, 153–182. [Google Scholar] [CrossRef]
- Friesen, M.L.; Porter, S.S.; Stark, S.C.; Wettberg, E.J. von; Sachs, J.L.; Martinez-Romero, E. Microbially Mediated Plant Functional Traits. Annu. Rev. Ecol. Evol. S. 2011, 42, 23–46. [Google Scholar] [CrossRef]
- Wang, C.; Masoudi, A.; Wang, M.; Yang, J.; Shen, R.; Man, M.; Yu, Z.; Liu, J. Community Structure and Diversity of the Microbiomes of Two Microhabitats at the Root–Soil Interface: Implications of Meta-Analysis of the Root-Zone Soil and Root Endosphere Microbial Communities in Xiong’an New Area. Can. J. Microbiol. 2020, 66, 605–622. [Google Scholar] [CrossRef]
- Li, H.; Qiu, Y.; Yao, T.; Han, D.; Gao, Y.; Zhang, J.; Ma, Y.; Zhang, H.; Yang, X. Nutrients Available in the Soil Regulate the Changes of Soil Microbial Community alongside Degradation of Alpine Meadows in the Northeast of the Qinghai-Tibet Plateau. Sci. Total Environ. 2021, 792, 148363. [Google Scholar] [CrossRef]
- Molefe, R.R.; Amoo, A.E.; Babalola, O.O. Communication between Plant Roots and the Soil Microbiome; Involvement in Plant Growth and Development. Symbiosis 2023, 90, 231–239. [Google Scholar] [CrossRef]
- Sun, Y.; Xu, X.; Zhang, L.; Liu, J.; Zhang, X.; Li, J.; Pan, B. Numerical Reconstruction of Three Holocene Glacial Events in Qiangyong Valley, Southern Tibetan Plateau and Their Implication for Holocene Climate Changes. Water 2020, 12, 3205. [Google Scholar] [CrossRef]
- Bolyen, E.; Rideout, J.R.; Dillon, M.R.; Bokulich, N.A.; Abnet, C.C.; Al-Ghalith, G.A.; Alexander, H.; Alm, E.J.; Arumugam, M.; Asnicar, F.; Bai, Y.; Bisanz, J.E.; Bittinger, K.; Brejnrod, A.; Brislawn, C.J.; Brown, C.T.; Callahan, B.J.; Caraballo-Rodríguez, A.M.; Chase, J.; et al. Reproducible, Interactive, Scalable and Extensible Microbiome Data Science Using QIIME 2. Nat. Biotechnol. 2019, 37, 852–857. [Google Scholar] [CrossRef] [PubMed]
- Bokulich, N.A.; Kaehler, B.D.; Rideout, J.R.; Dillon, M.; Bolyen, E.; Knight, R.; Huttley, G.A.; Gregory Caporaso, J. Optimizing Taxonomic Classification of Marker-Gene Amplicon Sequences with QIIME 2’s Q2-Feature-Classifier Plugin. Microbiome 2018, 6, 90. [Google Scholar] [CrossRef]
- Pedregosa, F.; Gae ̈l, V.; Alexandre, G.; Vincent, M.; Bertrand, T. Scikit-Learn: Machine Learning in Python. J. Mach. Learn. Res. 2011, 12, 2825–2830. [Google Scholar]
- Quast, C.; Pruesse, E.; Yilmaz, P.; Gerken, J.; Schweer, T.; Yarza, P.; Peplies, J.; Glöckner, F.O. The SILVA Ribosomal RNA Gene Database Project: Improved Data Processing and Web-Based Tools. Nucleic Acids Res. 2013, 41, D590–D596. [Google Scholar] [CrossRef]
- Price, M.N.; Dehal, P.S.; Arkin, A.P. FastTree 2 – Approximately Maximum-Likelihood Trees for Large Alignments. PLOS ONE 2010, 5, e9490. [Google Scholar] [CrossRef]
- Xun, W.; Liu, Y.; Li, W.; Ren, Y.; Xiong, W.; Xu, Z.; Zhang, N.; Miao, Y.; Shen, Q.; Zhang, R. Specialized Metabolic Functions of Keystone Taxa Sustain Soil Microbiome Stability. Microbiome 2021, 9, 35. [Google Scholar] [CrossRef]
- Knights, D.; Kuczynski, J.; Charlson, E.S.; Zaneveld, J.; Mozer, M.C.; Collman, R.G.; Bushman, F.D.; Knight, R.; Kelley, S.T. Bayesian Community-Wide Culture-Independent Microbial Source Tracking. Nat Methods 2011, 8, 761–763. [Google Scholar] [CrossRef] [PubMed]
- Toju, H.; Tanabe, A.S.; Ishii, H.S. Ericaceous Plant–Fungus Network in a Harsh Alpine–Subalpine Environment. Mol. Ecol. 2016, 25, 3242–3257. [Google Scholar] [CrossRef] [PubMed]
- Erdös, P.; Rényi, A. On the Evolution of Random Graphs. In The Structure and Dynamics of Networks; Princeton University Press, 2011, 38–82, ISBN 978-1-4008-4135-6.
- Guimerà, R.; Nunes Amaral, L.A. Functional Cartography of Complex Metabolic Networks. Nature 2005, 433, 895–900. [Google Scholar] [CrossRef]
- De’ath, G. Boosted Trees for Ecological Modeling and Prediction. Ecology 2007, 88, 243–251. [Google Scholar] [CrossRef] [PubMed]
- Ge, Y.; He, J.; Zhu, Y.; Zhang, J.; Xu, Z.; Zhang, L.; Zheng, Y. Differences in Soil Bacterial Diversity: Driven by Contemporary Disturbances or Historical Contingencies? The ISME Journal 2008, 2, 254–264. [Google Scholar] [CrossRef]
- Andersson, M.G.I.; Berga, M.; Lindström, E.S.; Langenheder, S. The Spatial Structure of Bacterial Communities Is Influenced by Historical Environmental Conditions. Ecology 2014, 95, 1134–1140. [Google Scholar] [CrossRef]
- Philippot, L.; Raaijmakers, J.M.; Lemanceau, P.; Van Der Putten, W.H. Going Back to the Roots: The Microbial Ecology of the Rhizosphere. Nat. Rev. Microbiol. 2013, 11, 789–799. [Google Scholar] [CrossRef]
- Qian, X.; Li, H.; Wang, Y.; Wu, B.; Wu, M.; Chen, L.; Li, X.; Zhang, Y.; Wang, X.; Shi, M.; Zheng, Y.; Guo, L.; Zhang, D. Leaf and Root Endospheres Harbor Lower Fungal Diversity and Less Complex Fungal Co-Occurrence Patterns Than Rhizosphere. Front. Microbiol. 2019, 10. [Google Scholar] [CrossRef]
- Yao, H.; Sun, X.; He, C.; Li, X.C.; Guo, L.D. Host Identity Is More Important in Structuring Bacterial Epiphytes than Endophytes in a Tropical Mangrove Forest. FEMS Microbiol. Ecol. 2020, 96, fiaa038. [Google Scholar] [CrossRef]
- Buée, M.; De Boer, W.; Martin, F.; van Overbeek, L.; Jurkevitch, E. The Rhizosphere Zoo: An Overview of Plant-Associated Communities of Microorganisms, Including Phages, Bacteria, Archaea, and Fungi, and of Some of Their Structuring Factors. Plant Soil. 2009, 321, 189–212. [Google Scholar] [CrossRef]
- Beckers, B.; Op De Beeck, M.; Weyens, N.; Boerjan, W.; Vangronsveld, J. Structural Variability and Niche Differentiation in the Rhizosphere and Endosphere Bacterial Microbiome of Field-Grown Poplar Trees. Microbiome 2017, 25. [Google Scholar] [CrossRef] [PubMed]
- Loreau, M.; de Mazancourt, C. Biodiversity and Ecosystem Stability: A Synthesis of Underlying Mechanisms. Ecol. Lett. 2013, 16, 106–115. [Google Scholar] [CrossRef] [PubMed]
- Kratou, M.; Maitre, A.; Abuin-Denis, L.; Piloto-Sardiñas, E.; Corona-Guerrero, I.; Cano-Argüelles, A.L.; Wu-Chuang, A.; Bamgbose, T.; Almazan, C.; Mosqueda, J.; Obregón, D.; Mateos-Hernández, L.; Said, M.B.; Cabezas-Cruz, A. Disruption of Bacterial Interactions and Community Assembly in Babesia-Infected Haemaphysalis Longicornis Following Antibiotic Treatment. BMC Microbiol. 2024, 24, 322. [Google Scholar] [CrossRef]
- Hernandez, D.J.; David, A.S.; Menges, E.S.; Searcy, C.A.; Afkhami, M.E. Environmental Stress Destabilizes Microbial Networks. The ISME Journal 2021, 15, 1722–1734. [Google Scholar] [CrossRef] [PubMed]
- Verma, S.; Kumar, M.; Kumar, A.; Das, S.; Chakdar, H.; Varma, A.; Saxena, A.K. Diversity of Bacterial Endophytes of Maize (Zea Mays) and Their Functional Potential for Micronutrient Biofortification. Curr. Microbiol. 2021, 79, 6. [Google Scholar] [CrossRef]
- Khan, M.A.; Khatun, A.; Islam, T. Promotion of Plant Growth by Phytohormone Producing Bacteria. Microbes in action; Nova Science Publishers: New York, NY, USA, 2016. [Google Scholar] [CrossRef]
- Purtschert-Montenegro, G.; Cárcamo-Oyarce, G.; Pinto-Carbó, M.; Agnoli, K.; Bailly, A.; Eberl, L. Pseudomonas Putida Mediates Bacterial Killing, Biofilm Invasion and Biocontrol with a Type IVB Secretion System. Nat. Microbiol. 2022, 7, 1547–1557. [Google Scholar] [CrossRef]
- Dellagi, A.; Quillere, I.; Hirel, B. Beneficial Soil-Borne Bacteria and Fungi: A Promising Way to Improve Plant Nitrogen Acquisition. J. Exp. Bot 2020, 71, 4469–4479. [Google Scholar] [CrossRef]
- Van Nuland, M.E.; Peay, K.G. Symbiotic Niche Mapping Reveals Functional Specialization by Two Ectomycorrhizal Fungi That Expands the Host Plant Niche. Fungal Ecol. 2020, 46, 100960. [Google Scholar] [CrossRef]
- Saeed, Q.; Xiukang, W.; Haider, F.U.; Kučerik, J.; Mumtaz, M.Z.; Holatko, J.; Naseem, M.; Kintl, A.; Ejaz, M.; Naveed, M.; Brtnicky, M.; Mustafa, A. Rhizosphere Bacteria in Plant Growth Promotion, Biocontrol, and Bioremediation of Contaminated Sites: A Comprehensive Review of Effects and Mechanisms. Int. J. Mol. Sci. 2021, 22, 10529. [Google Scholar] [CrossRef]
- Yang, B.; Zhang, C.; Guan, C.; Feng, X.; Yan, D.; Zhang, Z.; Qin, Y.; Xiong, S.; Zhang, W.; Cai, X.; Hu, L. Analysis of the Composition and Function of Rhizosphere Microbial Communities in Plants with Tobacco Bacterial Wilt Disease and Healthy Plants. Microbiol. spectr. 2024, 12, e00559-24. [Google Scholar] [CrossRef] [PubMed]
- Wang, M.; Zheng, Q.; Shen, Q.; Guo, S. The Critical Role of Potassium in Plant Stress Response. Int. J. Mol. Sci. 2013, 14, 7370–7390. [Google Scholar] [CrossRef] [PubMed]
- Zarraonaindia, I.; Owens, S.M.; Weisenhorn, P.; West, K.; Hampton-Marcell, J.; Lax, S.; Bokulich, N.A.; Mills, D.A.; Martin, G.; Taghavi, S.; van der Lelie, D.; Gilbert, J.A. The Soil Microbiome Influences Grapevine-Associated Microbiota. mBio 2015, 6, 10. [Google Scholar] [CrossRef]
- Wagner, M.R.; Lundberg, D.S.; del Rio, T.G.; Tringe, S.G.; Dangl, J.L.; Mitchell-Olds, T. Host Genotype and Age Shape the Leaf and Root Microbiomes of a Wild Perennial Plant. Nat. Commun. 2016, 7, 12151. [Google Scholar] [CrossRef]
- Abdelfattah, A.; Tack, A.J.M.; Lobato, C.; Wassermann, B.; Berg, G. From Seed to Seed: The Role of Microbial Inheritance in the Assembly of the Plant Microbiome. Trends. Microbiol. 2023, 31, 346–355. [Google Scholar] [CrossRef]
- Dell’Amico, E.; Cavalca, L.; Andreoni, V. Improvement of Brassica Napus Growth under Cadmium Stress by Cadmium-Resistant Rhizobacteria. Soil Biol. Biochem. 2008, 40, 74–84. [Google Scholar] [CrossRef]
- Berney, M.; Cook, G.M. Unique Flexibility in Energy Metabolism Allows Mycobacteria to Combat Starvation and Hypoxia. PLOS ONE 2010, 5, e8614. [Google Scholar] [CrossRef]
- Rastogi, G.; Sbodio, A.; Tech, J.J.; Suslow, T.V.; Coaker, G.L.; Leveau, J.H.J. Leaf Microbiota in an Agroecosystem: Spatiotemporal Variation in Bacterial Community Composition on Field-Grown Lettuce. The ISME Journal 2012, 6, 1812–1822. [Google Scholar] [CrossRef]
- Ortega, R.A.; Mahnert, A.; Berg, C.; Müller, H.; Berg, G. The Plant Is Crucial: Specific Composition and Function of the Phyllosphere Microbiome of Indoor Ornamentals. FEMS Microbiol. Ecol. 2016, 92, fiw173. [Google Scholar] [CrossRef]
- Zhou, X.; Wang, J.T.; Zhang, Z.F.; Li, W.; Chen, W.; Cai, L. Microbiota in the Rhizosphere and Seed of Rice From China, With Reference to Their Transmission and Biogeography. Front. Microbiol. 2020, 11. [Google Scholar] [CrossRef]
- Chhetri, G.; Kim, I.; Kang, M.; Kim, J.; So, Y.; Seo, T. Devosia rhizoryzae sp. nov., and Devosia oryziradicis sp. nov., Novel Plant Growth Promoting Members of the Genus Devosia, Isolated from the Rhizosphere of Rice Plants. J Microbiol. 2022, 60, 1–10. [Google Scholar] [CrossRef] [PubMed]
- Asaf, S. Osmoprotective Functions Conferred to Soybean Plants via Inoculation with Sphingomonas sp. LK11 and Exogenous Trehalose. Microbiol. Res. 2017, 135–145. [Google Scholar] [CrossRef] [PubMed]
- Chen, X.; Wang, J.; You, Y.; Wang, R.; Chu, S.; Chi, Y.; Hayat, K.; Hui, N.; Liu, X.; Zhang, D.; Zhou, P. When Nanoparticle and Microbes Meet: The Effect of Multi-Walled Carbon Nanotubes on Microbial Community and Nutrient Cycling in Hyperaccumulator System. J. Hazard. Mater. 2022, 423, 126947. [Google Scholar] [CrossRef] [PubMed]
- Becker, R.; Ulrich, K.; Behrendt, U.; Schneck, V.; Ulrich, A. Genomic Characterization of Aureimonas altamirensis C2P003—A Specific Member of the Microbiome of Fraxinus Excelsior Trees Tolerant to Ash Dieback. Plants 2022, 11, 3487. [Google Scholar] [CrossRef]
- Bautista, V.V.; Monsalud, R.G.; Yokota, A. Devosia yakushimensis sp. nov., Isolated from Root Nodules of Pueraria Lobata (Willd.) Ohwi. Int. J. Syst. Evol. Micr. 2010, 60, 627–632. [CrossRef]
- Chhetri, G.; Kim, I.; Kang, M.; So, Y.; Kim, J.; Seo, T. An Isolated Arthrobacter sp. Enhances Rice (Oryza Sativa L.) Plant Growth. Microorganisms 2022, 10, 1187. [Google Scholar] [CrossRef]
- Lu, G.H.; Cao, R.; Fazal, A.; Zheng, K.; Na, Z.; Yang, Y.; Sun, B.; Yang, H.; Na, Z.-Y. Composition and Diversity of Root-Inhabiting Bacterial Microbiota in the Perennial Sweet Sorghum Cultivar at the Maturing Stage. Plant Growth Regul. 2023, 99, 567–582. [Google Scholar] [CrossRef]
- Ham, S.H.; Yoon, A.R.; Oh, H.E.; Park, Y.G. Plant Growth-Promoting Microorganism Pseudarthrobacter sp. NIBRBAC000502770 Enhances the Growth and Flavonoid Content of Geum Aleppicum. Microorganisms 2022, 10, 1241. [Google Scholar] [CrossRef]
- Sakiyama, Y.; Thao, N.K.N.; Vinh, H.V.; Giang, N.M.; Miyadoh, S.; Hop, D.V.; Ando, K. Pseudonocardia babensis sp. nov., Isolated from Plant Litter. Int. J. Syst. Evol. Microbiol. 2010, 60, 2336–2340. [Google Scholar] [CrossRef]
- Whatmough, B.; Holmes, N.A.; Wilkinson, B.; Hutchings, M.I.; Parra, J.; Duncan, K.R. Microbe Profile: Pseudonocardia: Antibiotics for Every Niche. Microbiology 2024, 170, 001501. [Google Scholar] [CrossRef]
- Desnoues, N.; Lin, M.; Guo, X.; Ma, L.; Carreño-Lopez, R.; Elmerich, C. Nitrogen Fixation Genetics and Regulation in a Pseudomonas stutzeri Strain Associated with Rice. Microbiology 2003, 149, 2251–2262. [Google Scholar] [CrossRef]
- Li, Q.; He, Y.; Feng, J.; He, Y.; Zhang, S. Pseudomonas fluorescens Inoculation Enhances Salix matsudana Growth by Modifying Phyllosphere Microbiomes, Surpassing Nitrogen Fertilization. Plant. Cell. Environ. 2025, 48, 599–614. [Google Scholar] [CrossRef] [PubMed]
- Zhang, G.; Wang, L.; Li, J.; Zhou, Y. Pseudonocardia profundimaris sp. nov., Isolated from Marine Sediment. Int. J. Syst. Evol. Micr. 2017, 67, 1693–1697. [Google Scholar] [CrossRef]
- Pan, L.; Chen, J.; Ren, S.; Shen, H.; Rong, B.; Liu, W.; Yang, Z. Complete Genome Sequence of Mycobacterium Mya-Zh01, an Endophytic Bacterium, Promotes Plant Growth and Seed Germination Isolated from Flower Stalk of Doritaenopsis. Arch. Microbiol. 2020, 202, 1965–1976. [Google Scholar] [CrossRef] [PubMed]
Figure 1.
Comparison of bacterial alpha diversity in the rhizosphere soil, root endosphere, and leaf endosphere (a-f). The relationship between the levels and ratios of TN (total nitrogen), TP (total phosphorus), and TK (total potassium) and the indices of bacterial alpha diversity (Richness, Shannon, Pielou, Chao1, and ACE) was identified using the optimized aggregated boosted tree model (g-k). Wilcoxon Test were performed to reveal significant differences in alpha diversity among the rhizosphere soil, root endosphere, and leaf endosphere. ns., no significant; *P < 0.05; **P < 0.01 (a-f). TN represents the total nitrogen, TP represents the total phosphorus, TK represents the potassium (g-k).
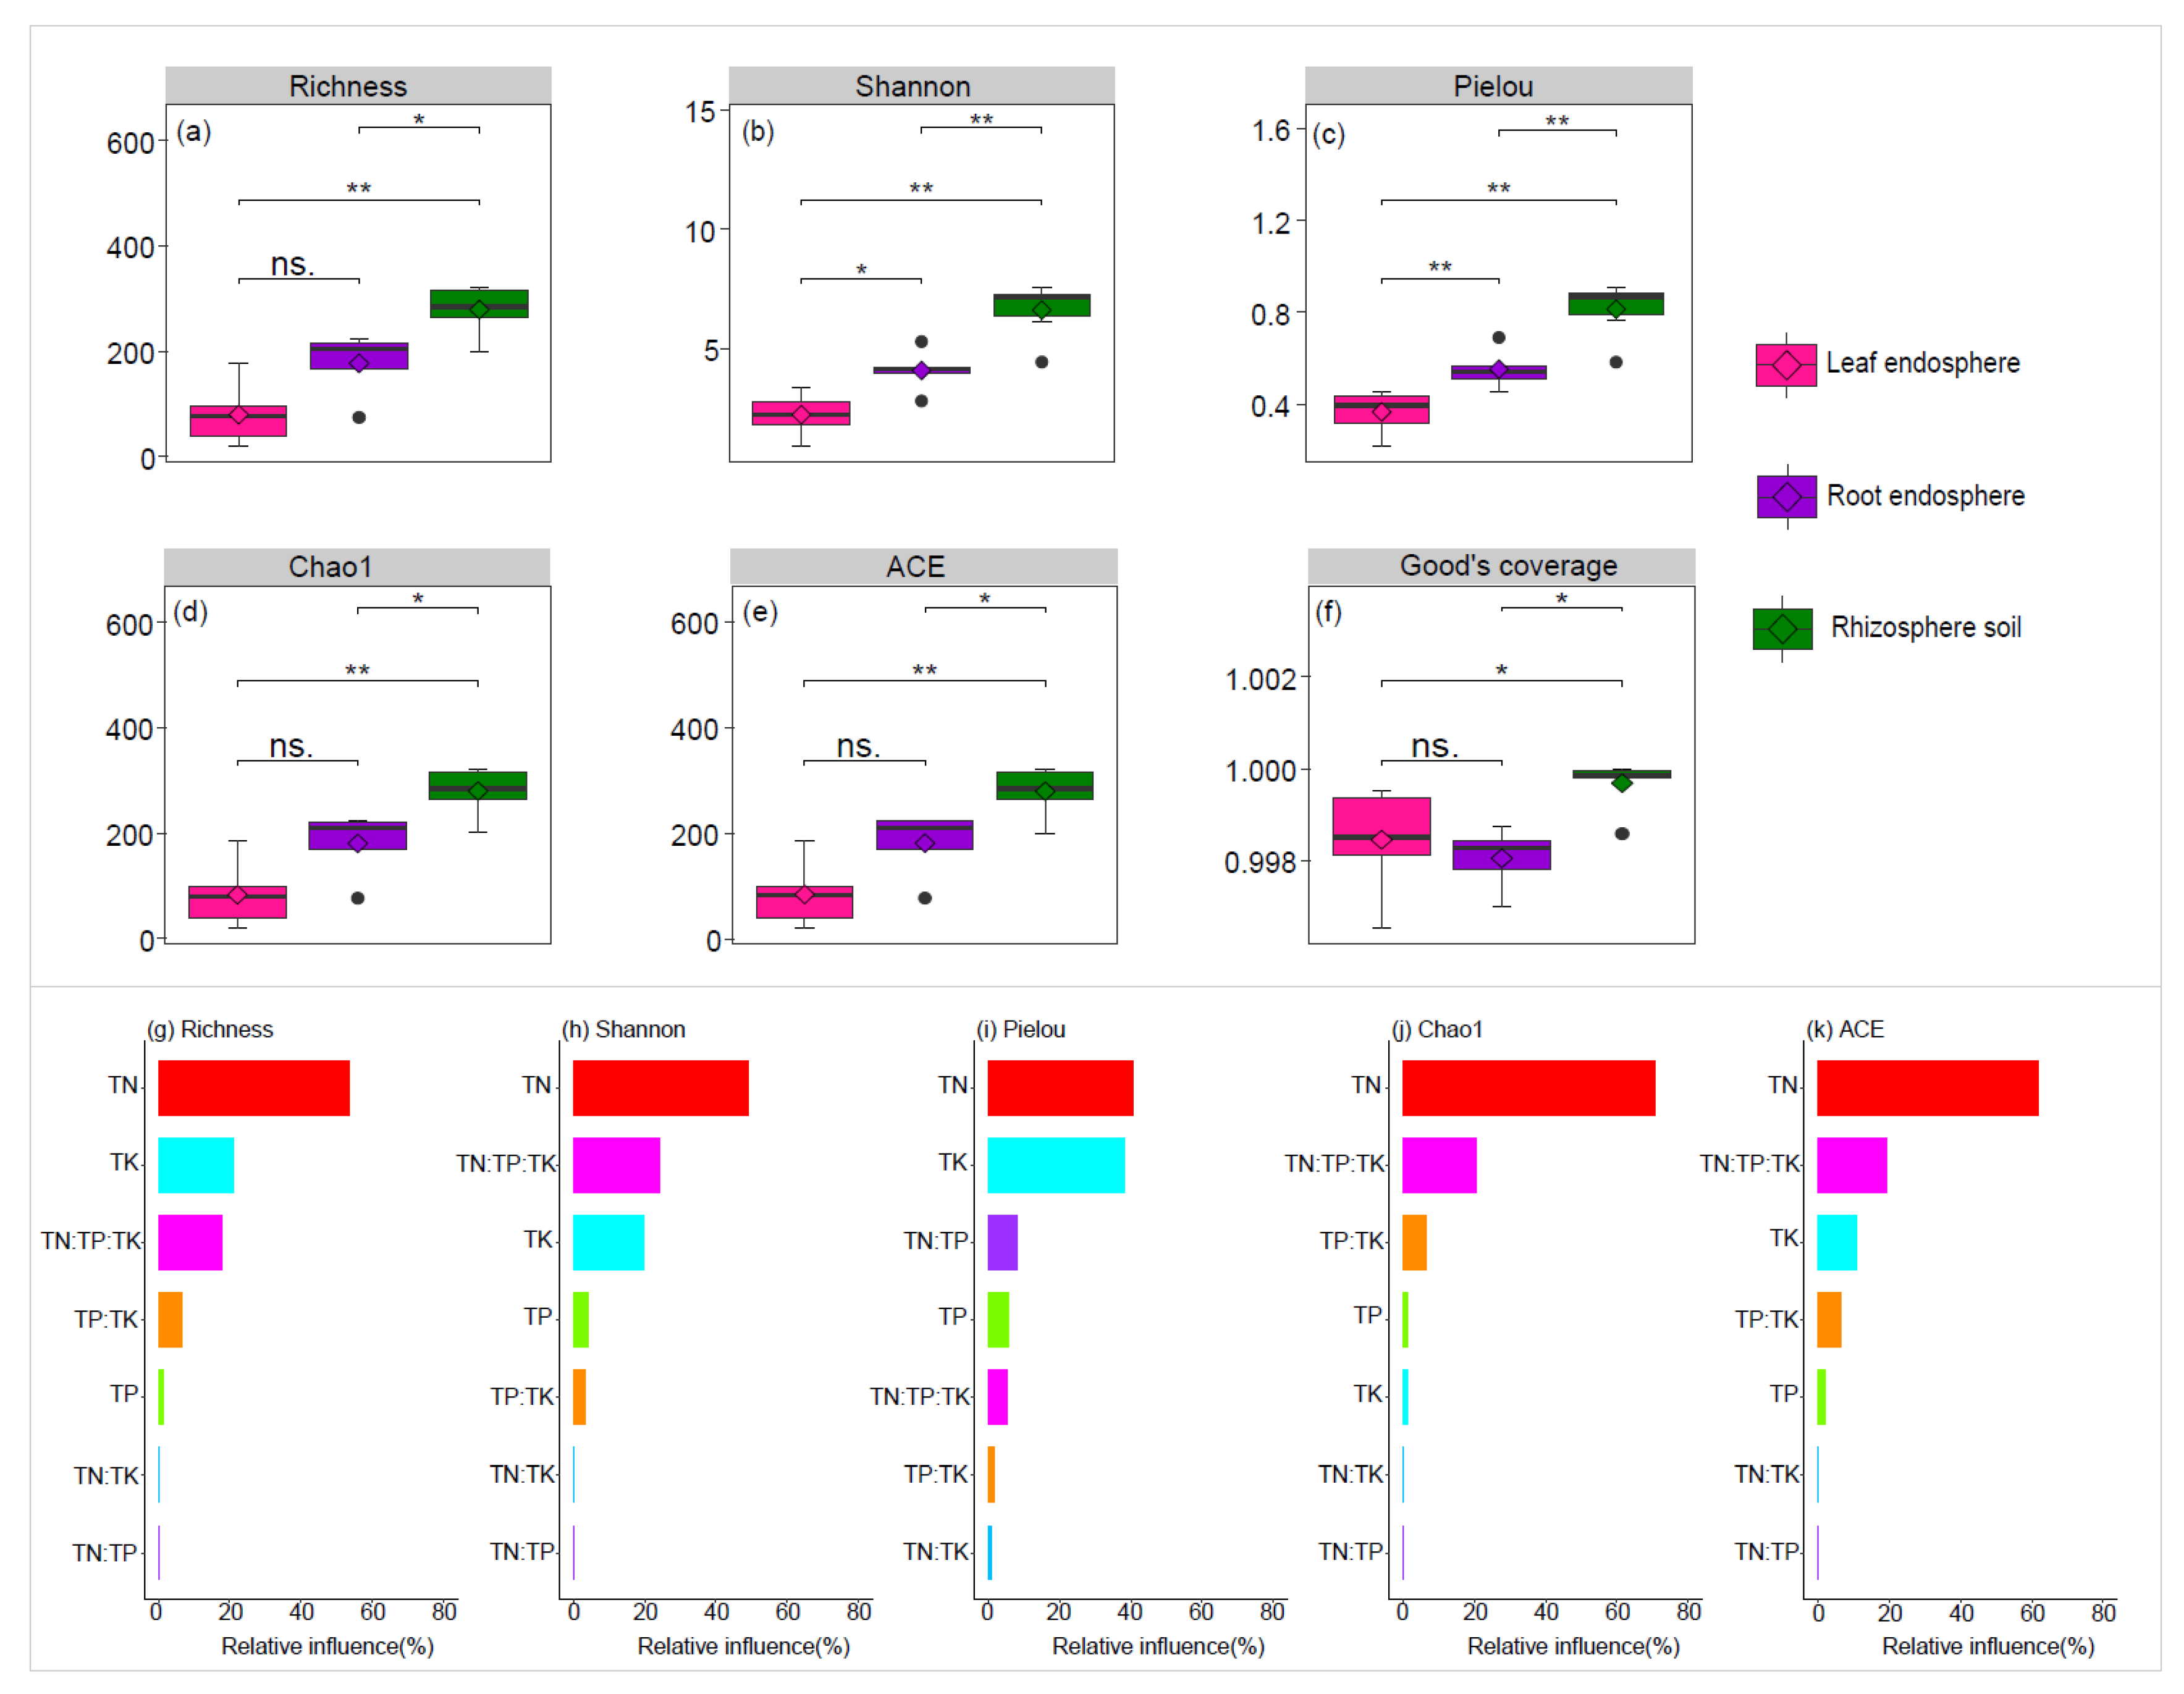
Figure 2.
Taxonomic composition of the bacterial communities at the genus level. Bars labeled with different lowercase letter show significant differences in the relative abundances of bacterial taxa across various plant compartment niches, as identified by the Wilcoxon Test with a significance level of P < 0.05.
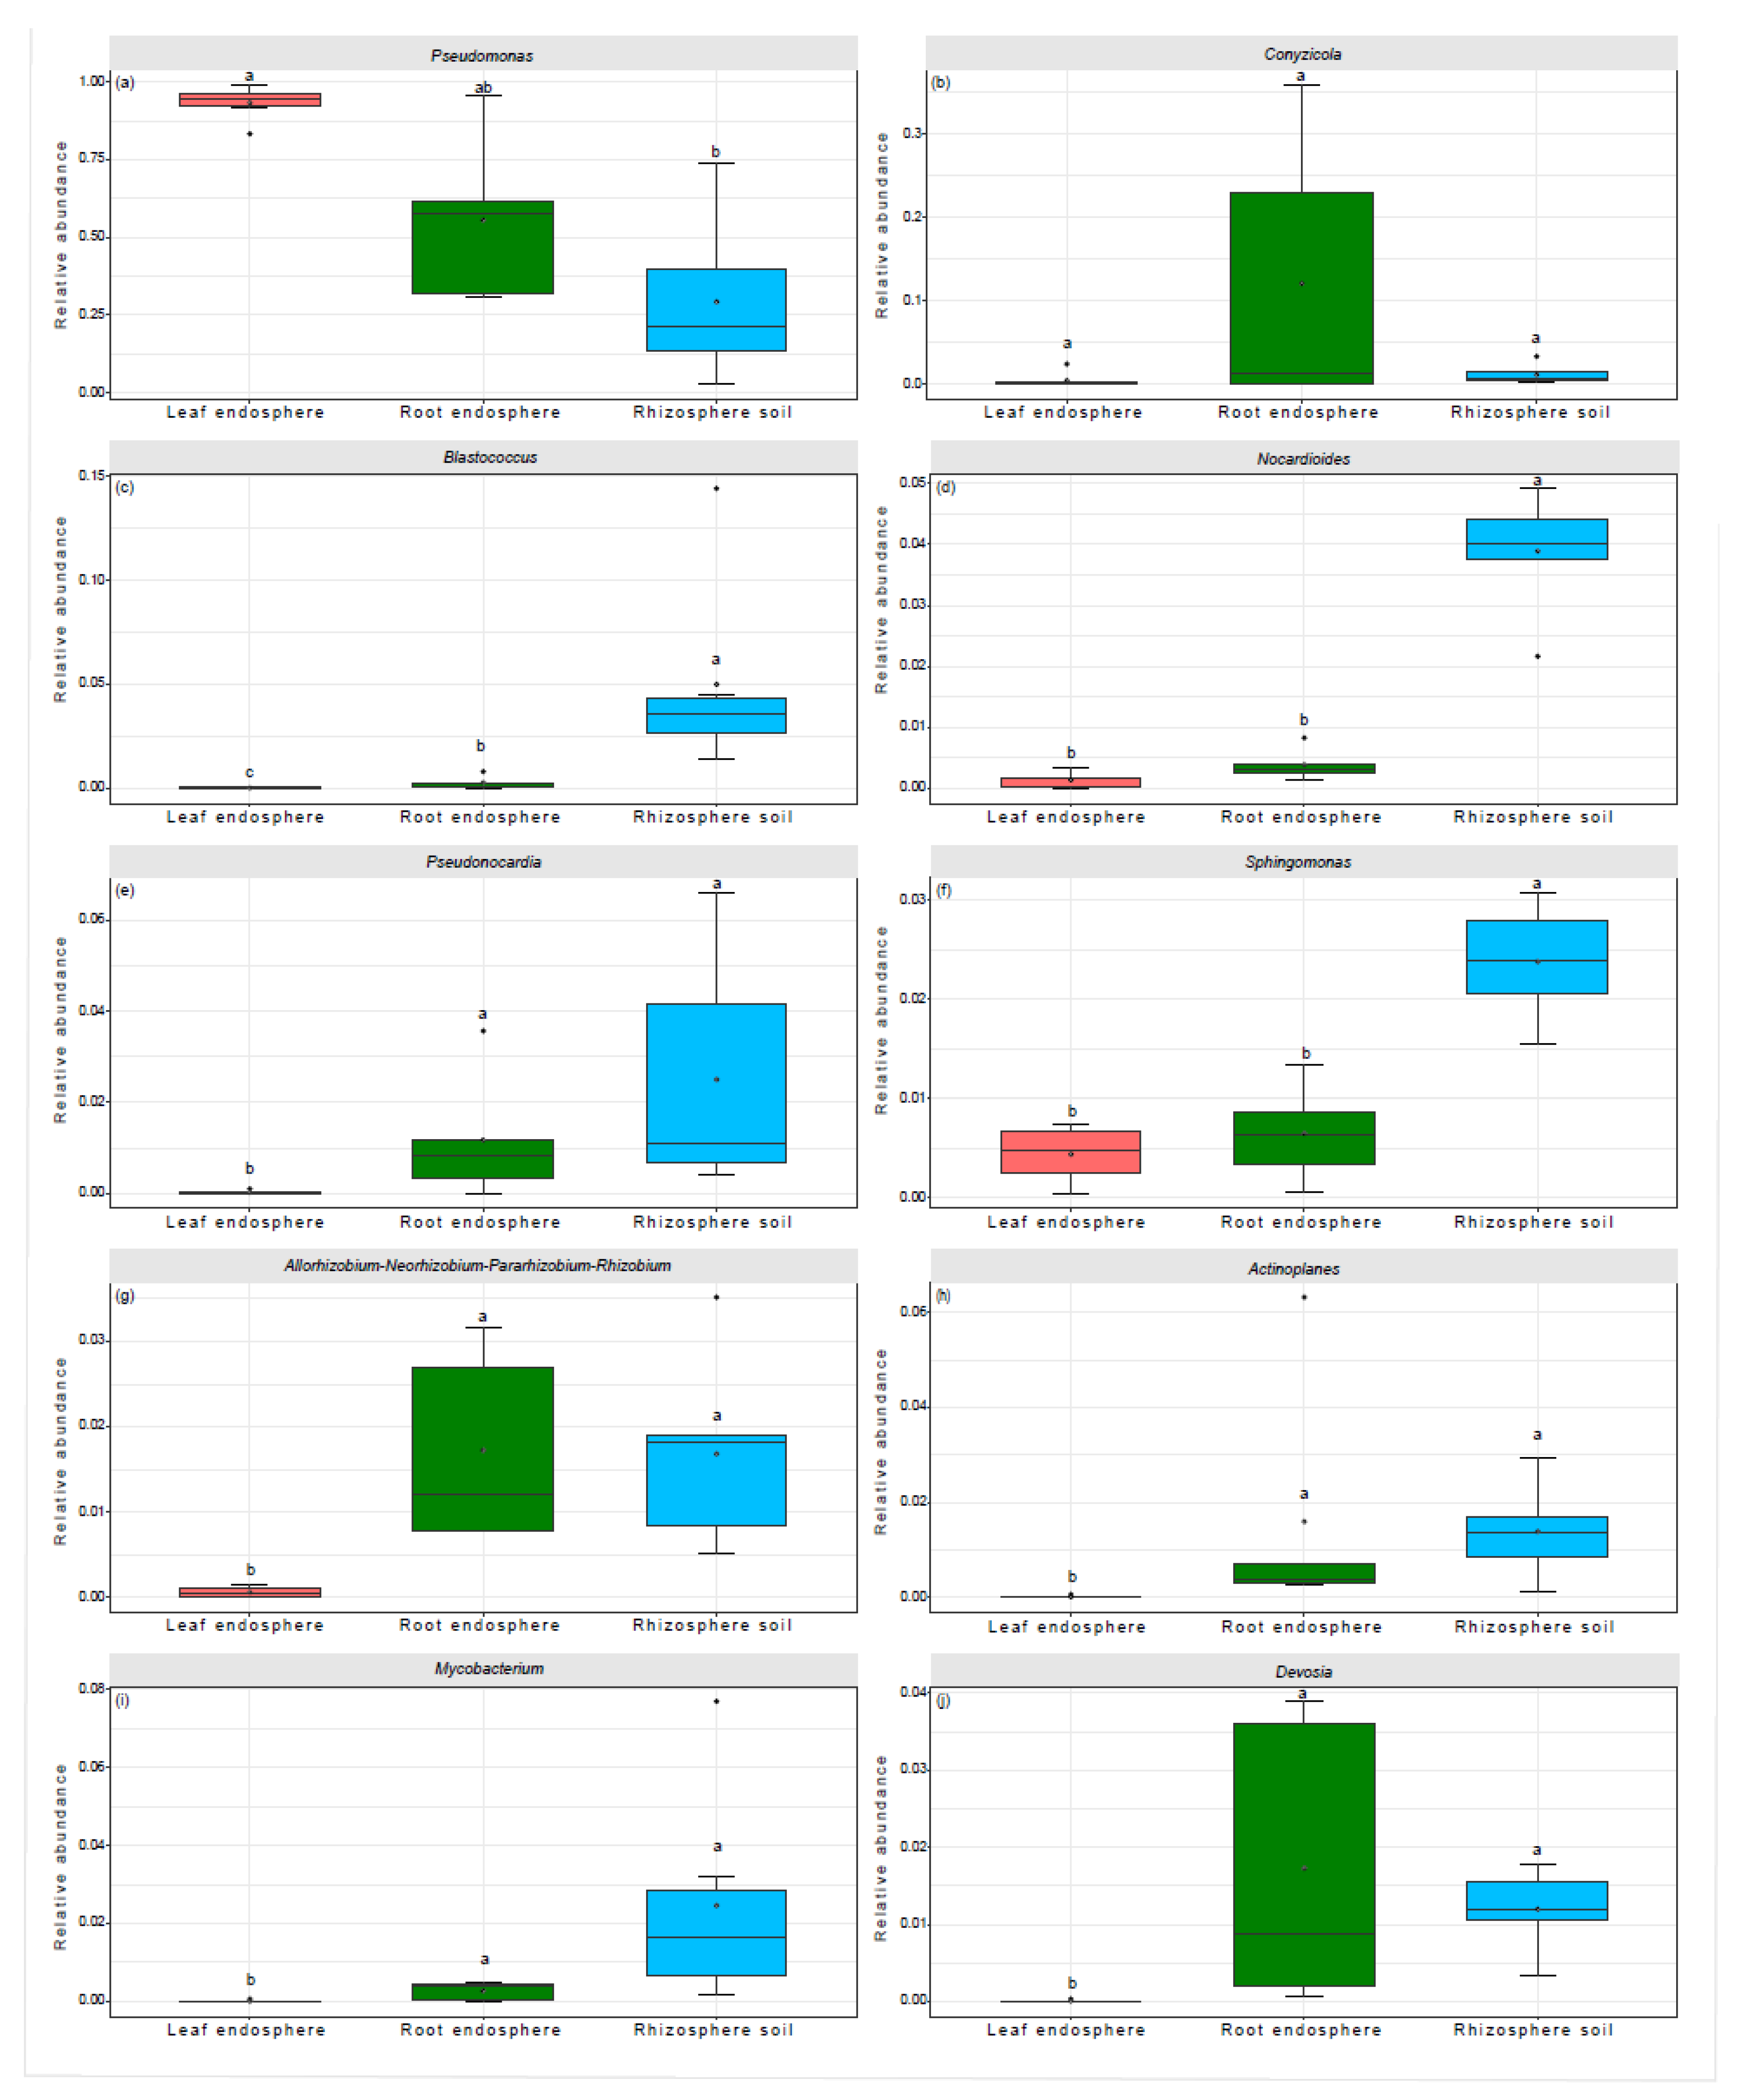
Figure 3.
The relationship between the levels and ratios of TN (total nitrogen), TP (total phosphorus), and TK (total potassium) and the relative abundance of the top 10 genera was identified using an optimized aggregated boosted tree model.
Figure 3.
The relationship between the levels and ratios of TN (total nitrogen), TP (total phosphorus), and TK (total potassium) and the relative abundance of the top 10 genera was identified using an optimized aggregated boosted tree model.
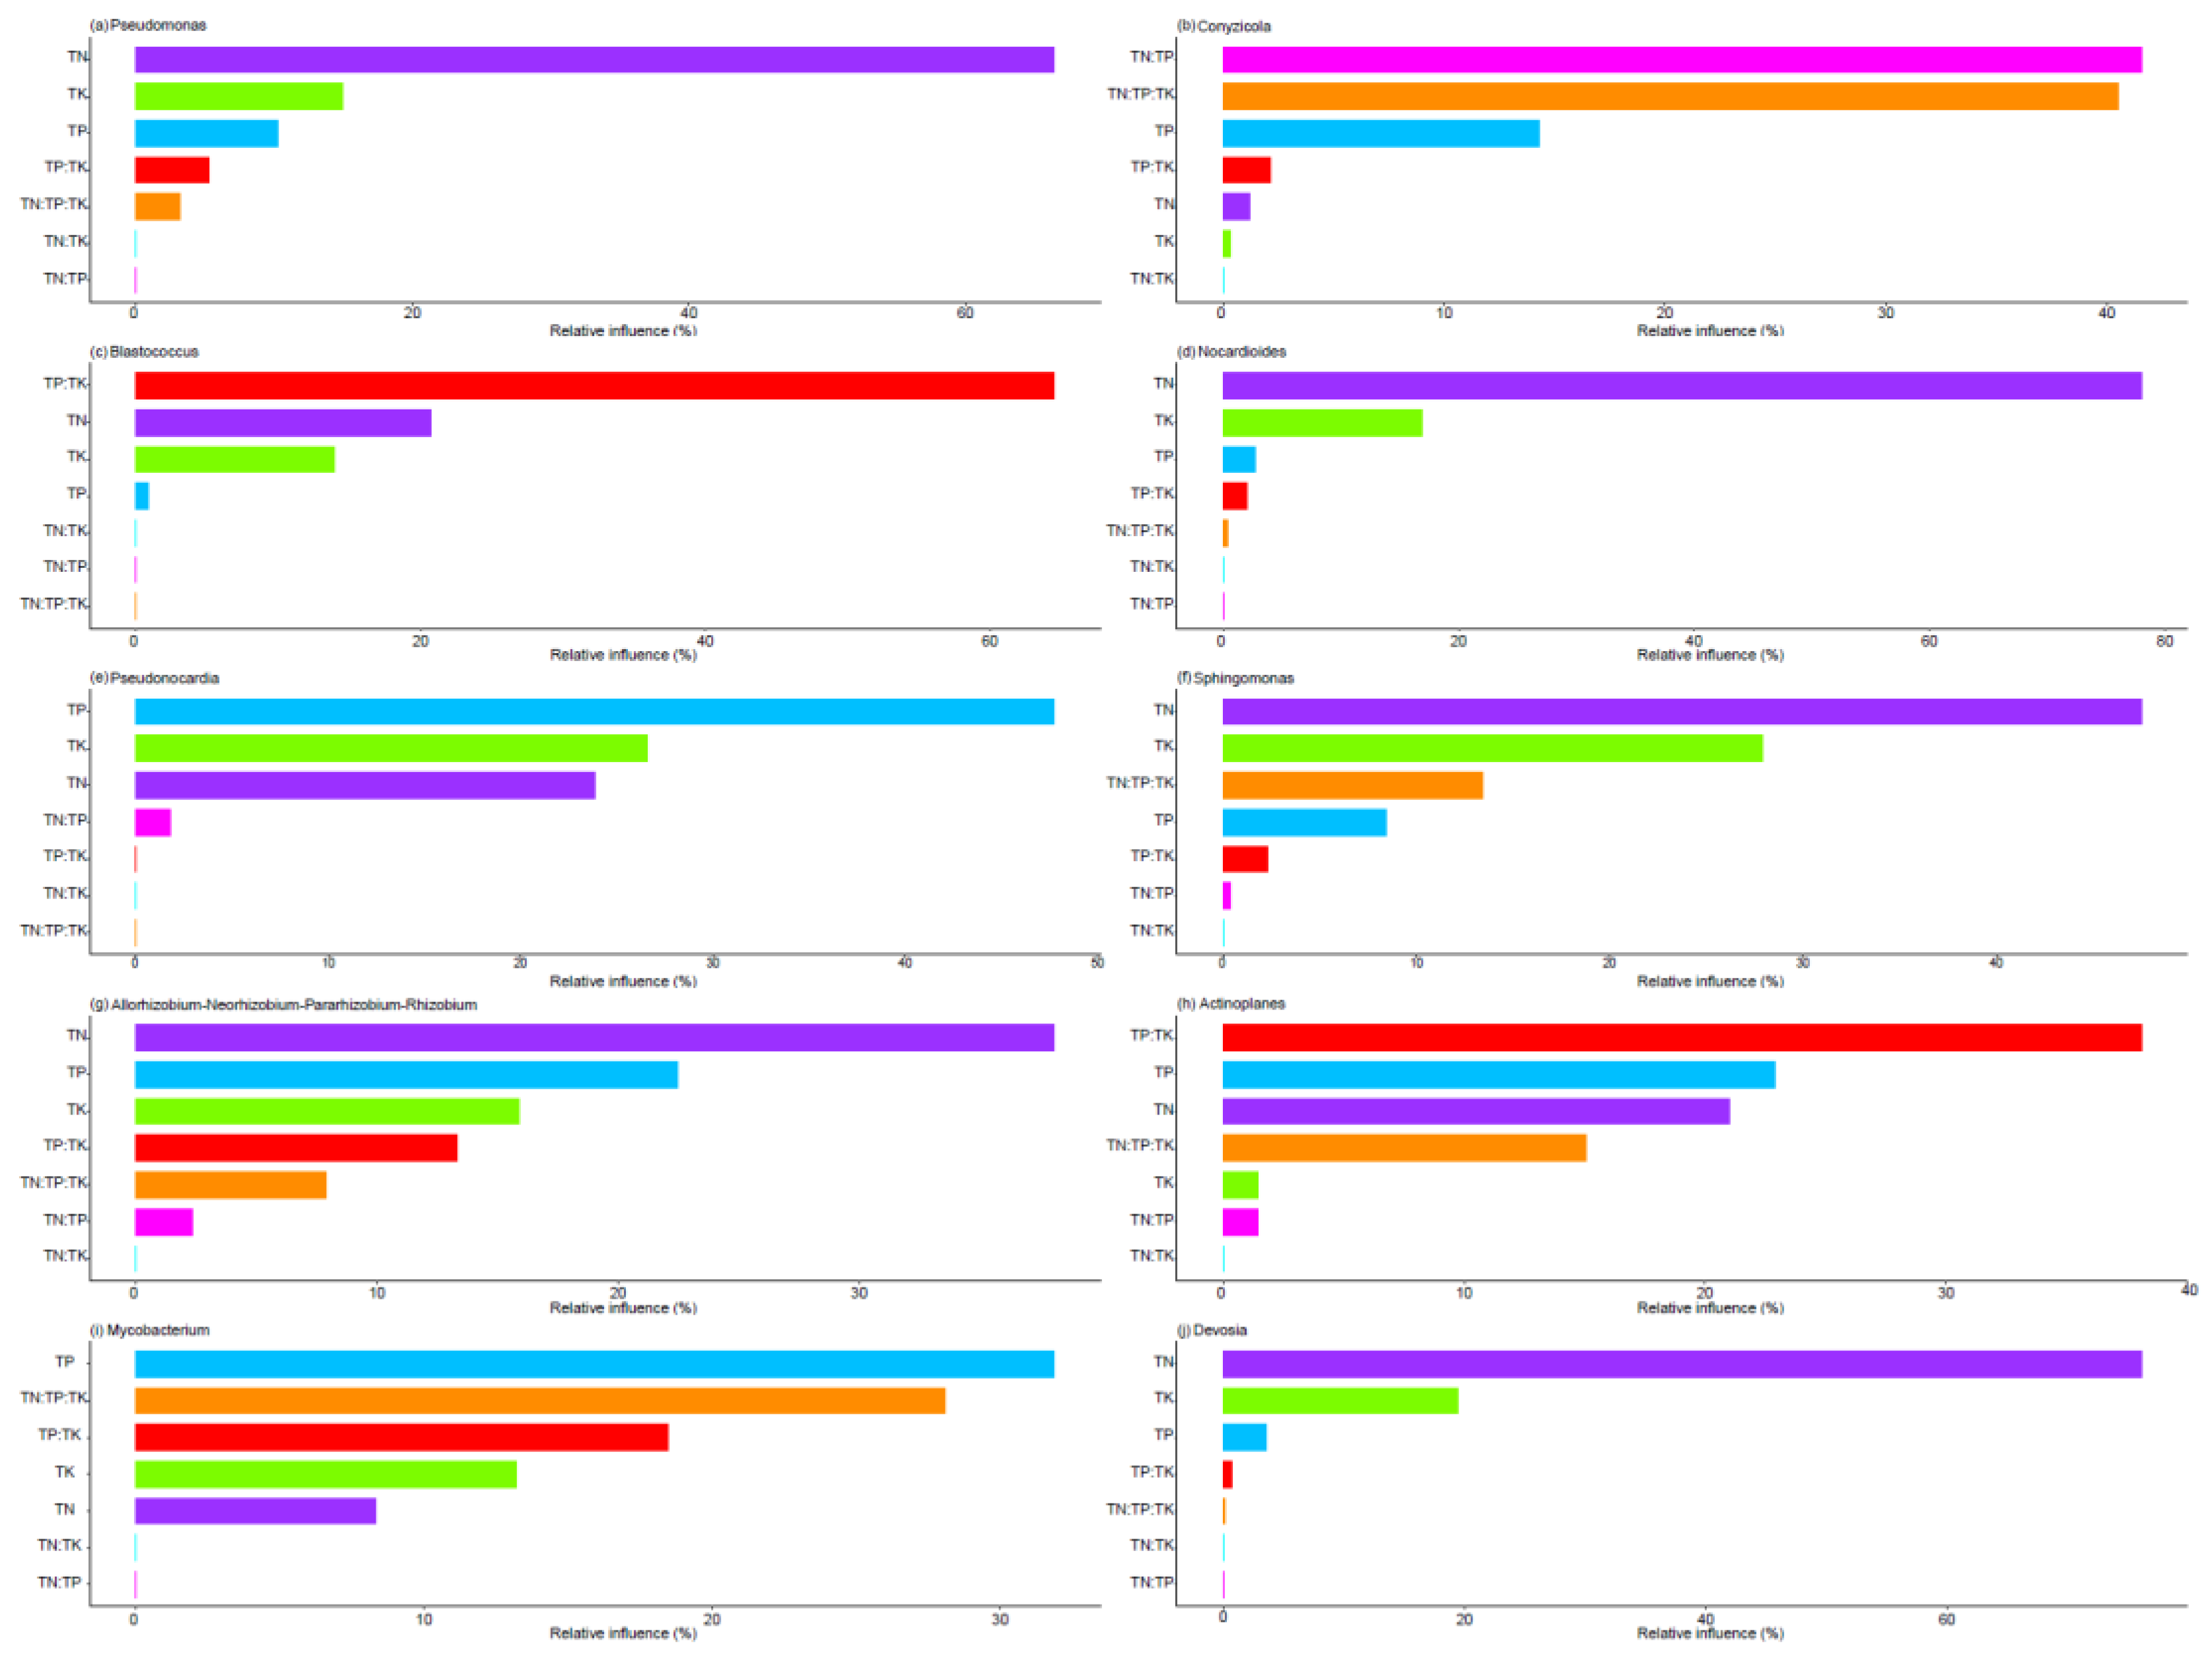
Figure 4.
Preferences observed in plant compartment niche-bacteria associations. The standardized d′ estimate of preferences for bacterial amplicon sequence variations (ASVs) is shown for each plant compartment niche (row). Likewise, the standardized d′ estimate of preferences for plant compartment niche is indicated for each of the observed bacterial ASVs (column). Each cell in the matrix indicates a two-dimensional preference (2DP) estimate, which measures to what extent the association of a plant compartment niche-bacteria pair was observed more or less frequently than would be expected by chance. The P values were adjusted based on the false discovery rate (FDR). The relationship between 2DP and FDR-adjusted P values shows that 2DP values larger than 3.0 represented strong preference (PFDR < 0.05).
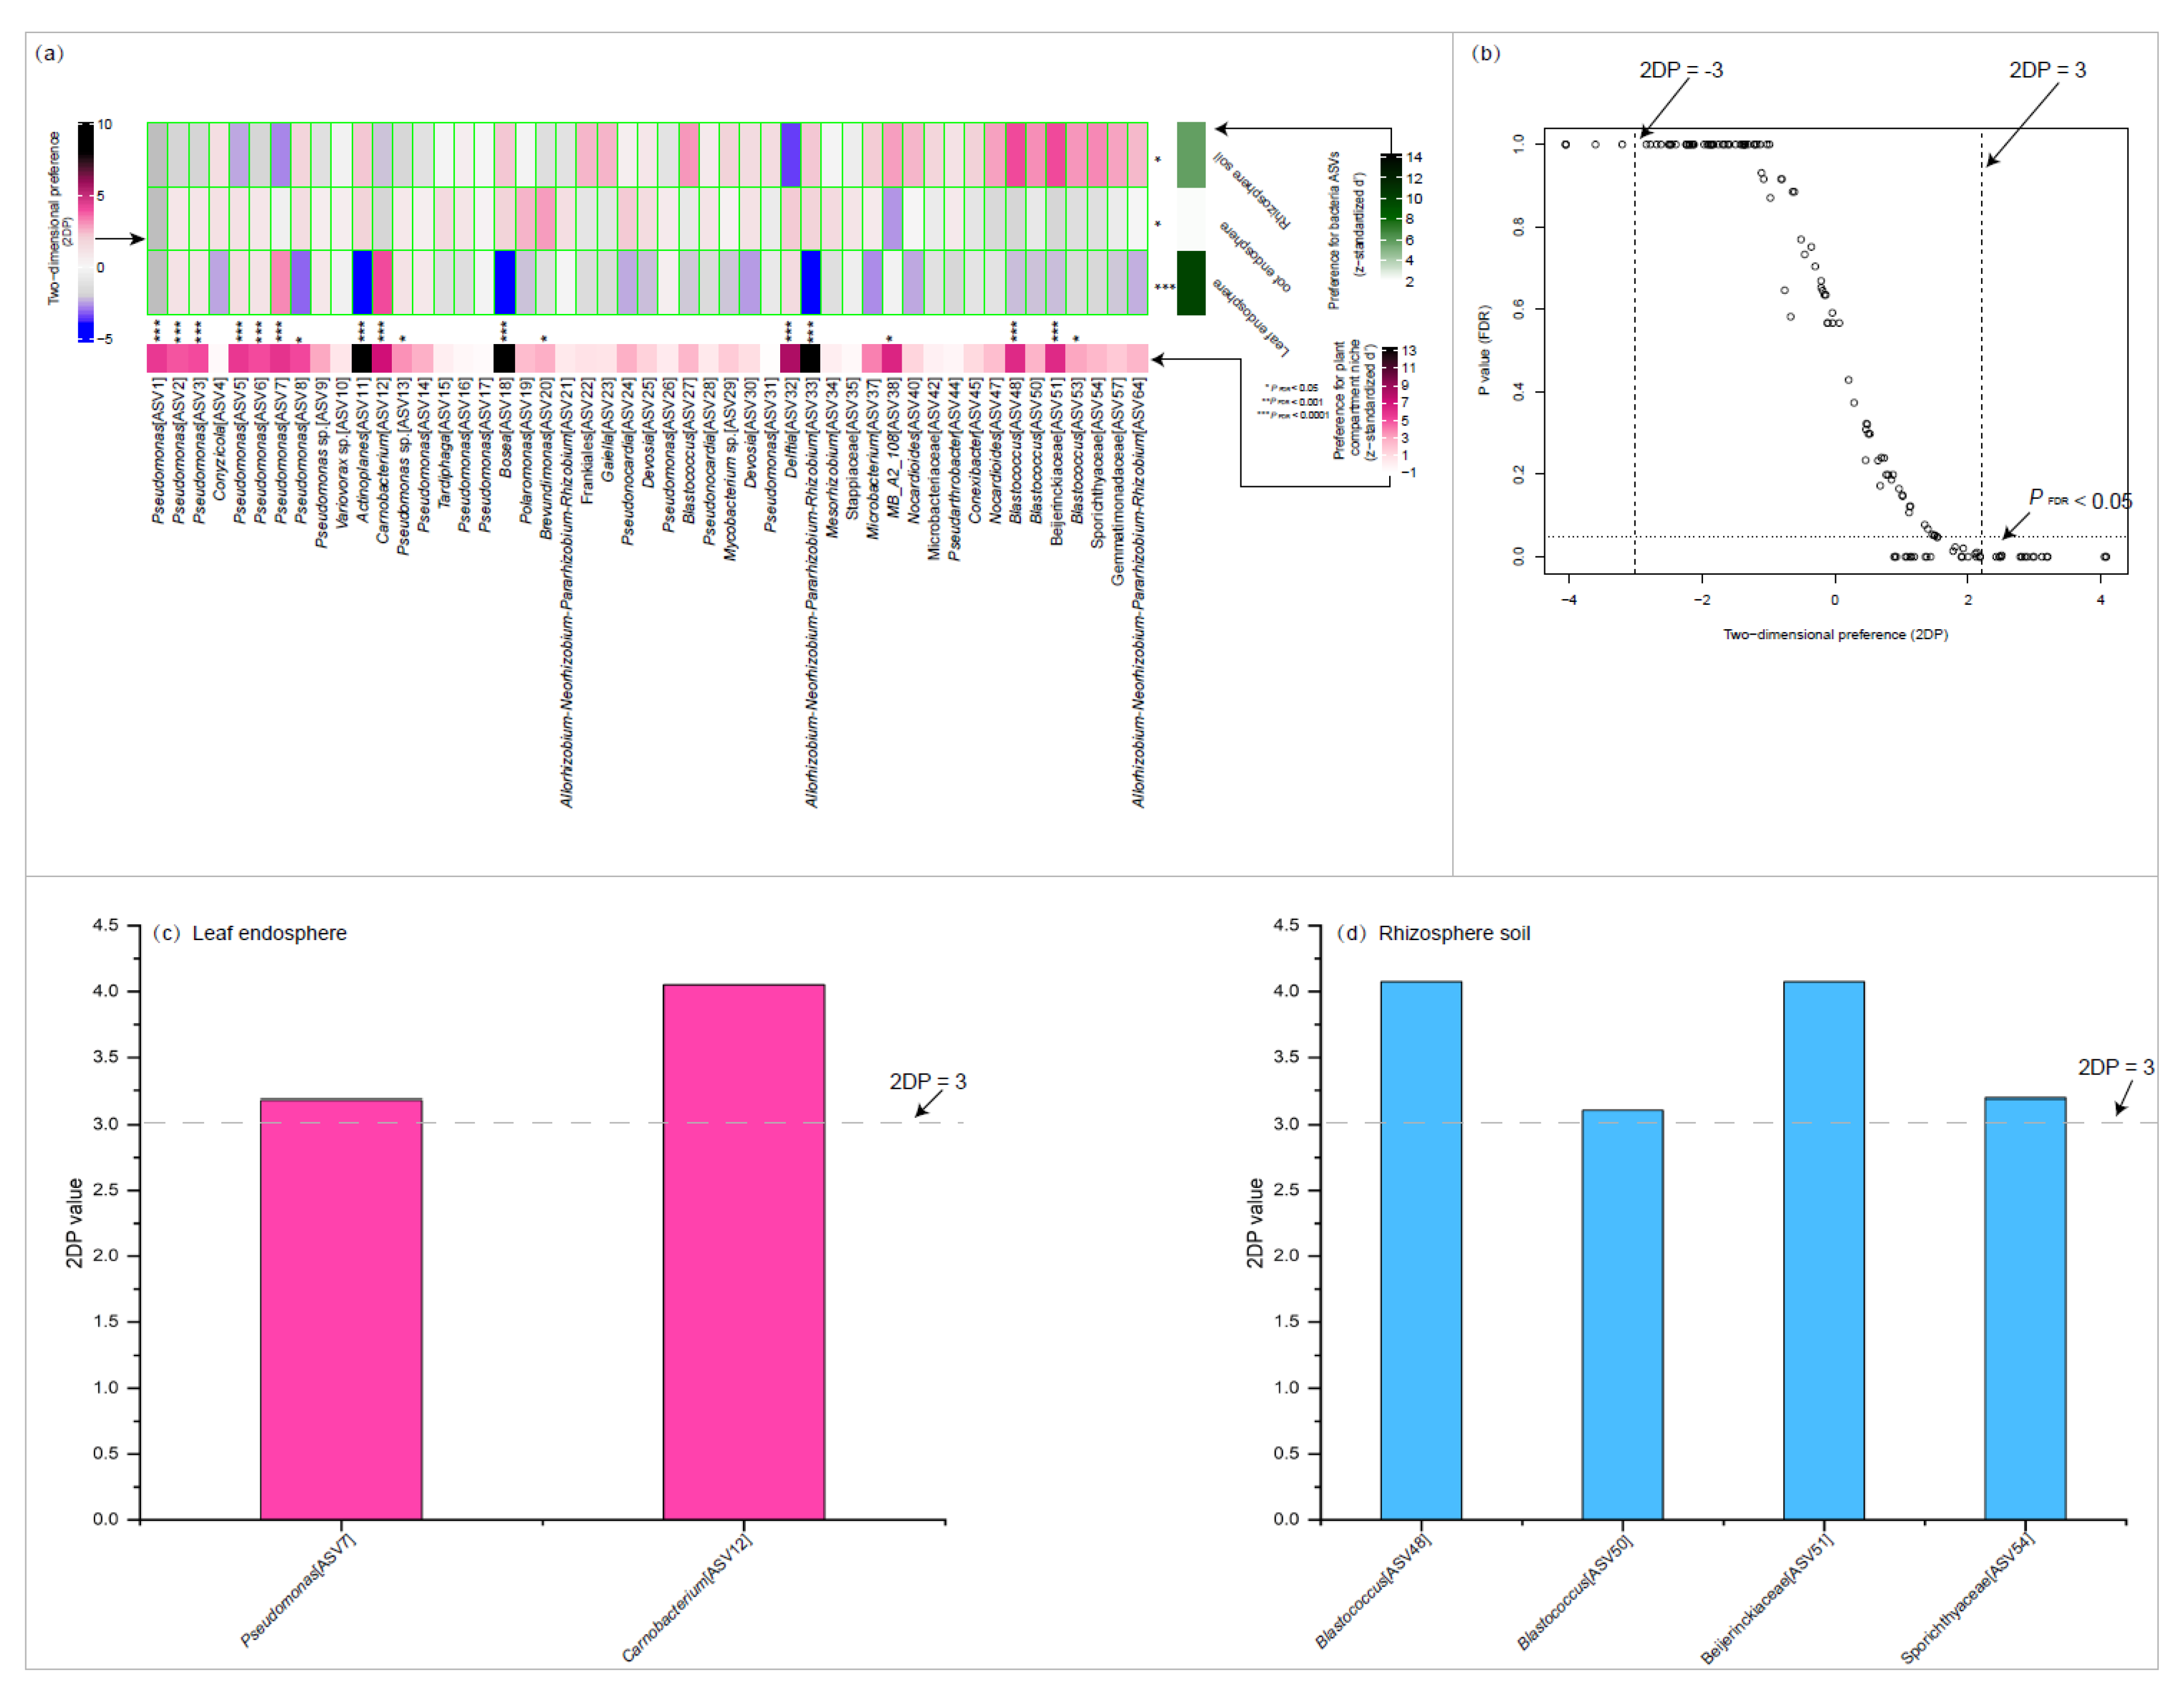
Figure 5.
Correlation-based networks of bacterial communities in the rhizosphere soil, root endosphere, and leaf endosphere(A). Comparison of node-level topological properties across the rhizosphere soil network, root endosphere network, and leaf endosphere network (B). Bacterial Amplicon Sequence Variants (ASVs) are represented as nodes, while significant statistical correlations between these nodes are illustrated as edges. The size of each node is proportional to the ASV degree. The node color indicates the corresponding module (A). Asterisks indicate significant differences as determined by the Wilcoxon Test (*P < 0.05; **P < 0.01; ***P < 0.001).
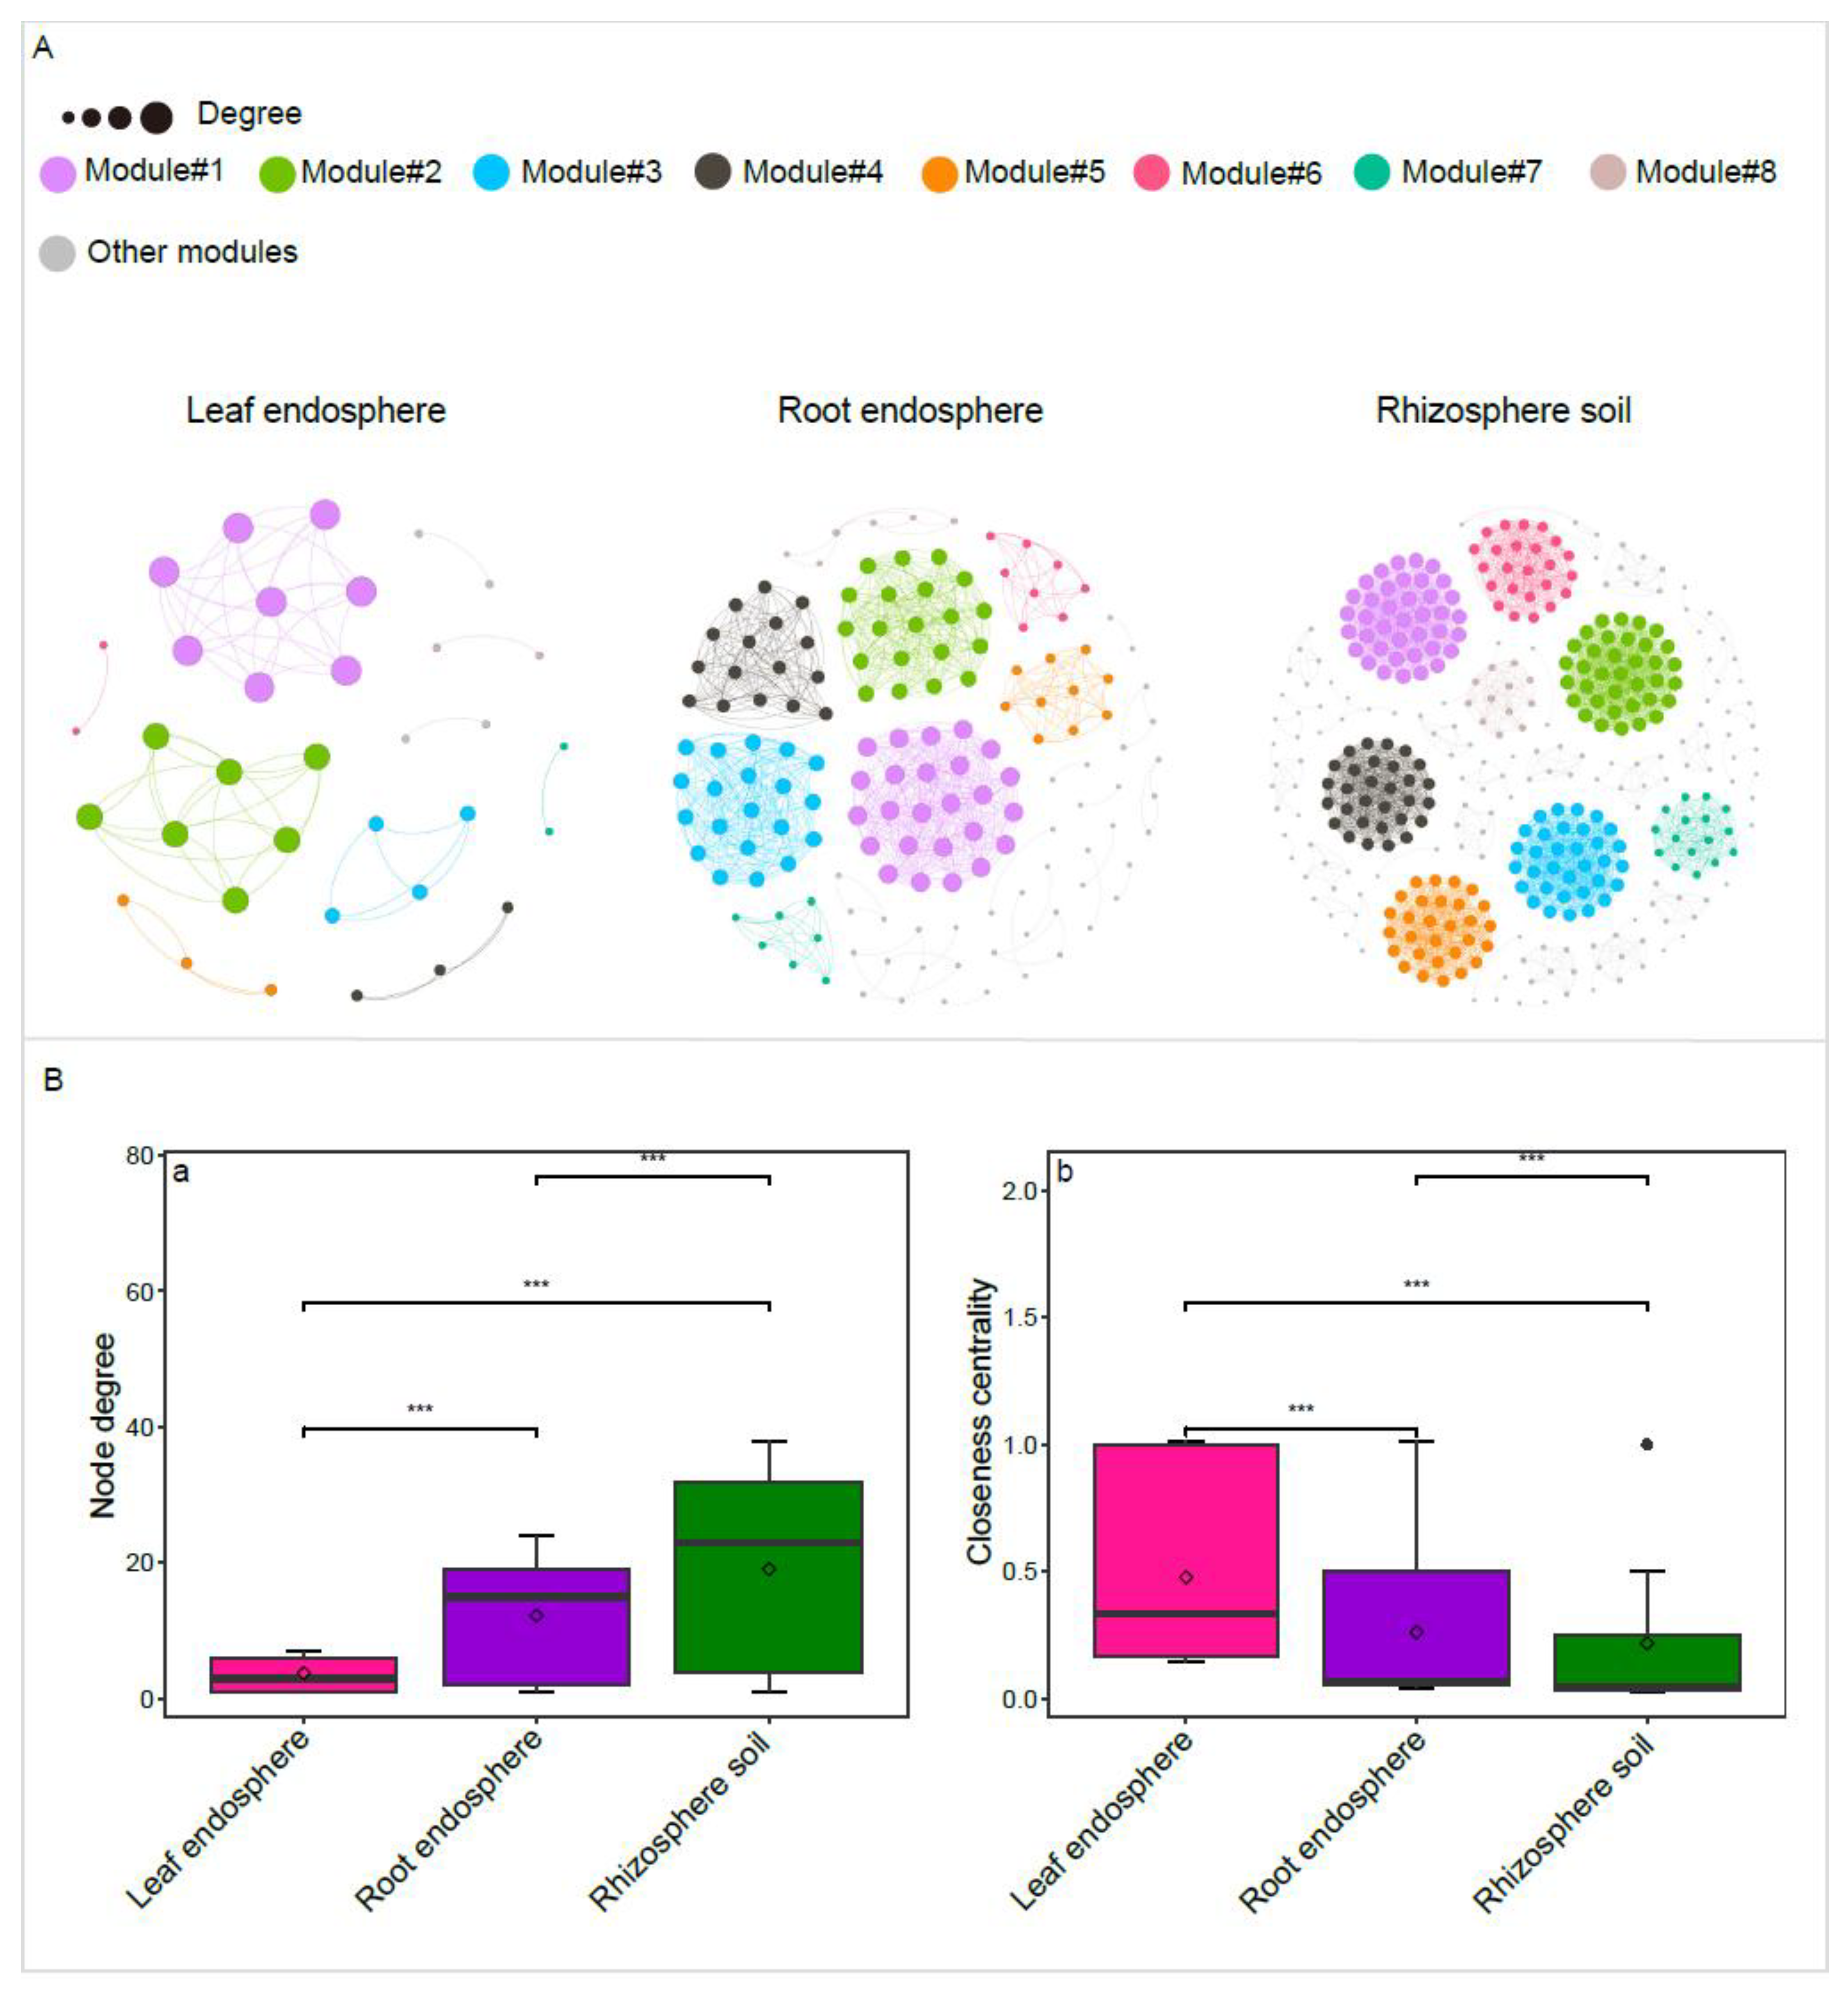
Figure 6.
Comparison of niche breadth and average variation degree (AVD) of bacterial community among rhizosphere soil, root endosphere, and leaf endosphere (a, b). The volcano plot illustrating the enrichment and depletion patterns of the bacterial community in root endosphere and leaf endosphere, and the higher DI value represents greater depleted effect (c, d). Asterisks indicate significant differences as determined by the Wilcoxon Test (*P < 0.05; **P < 0.01; ***P < 0.001).
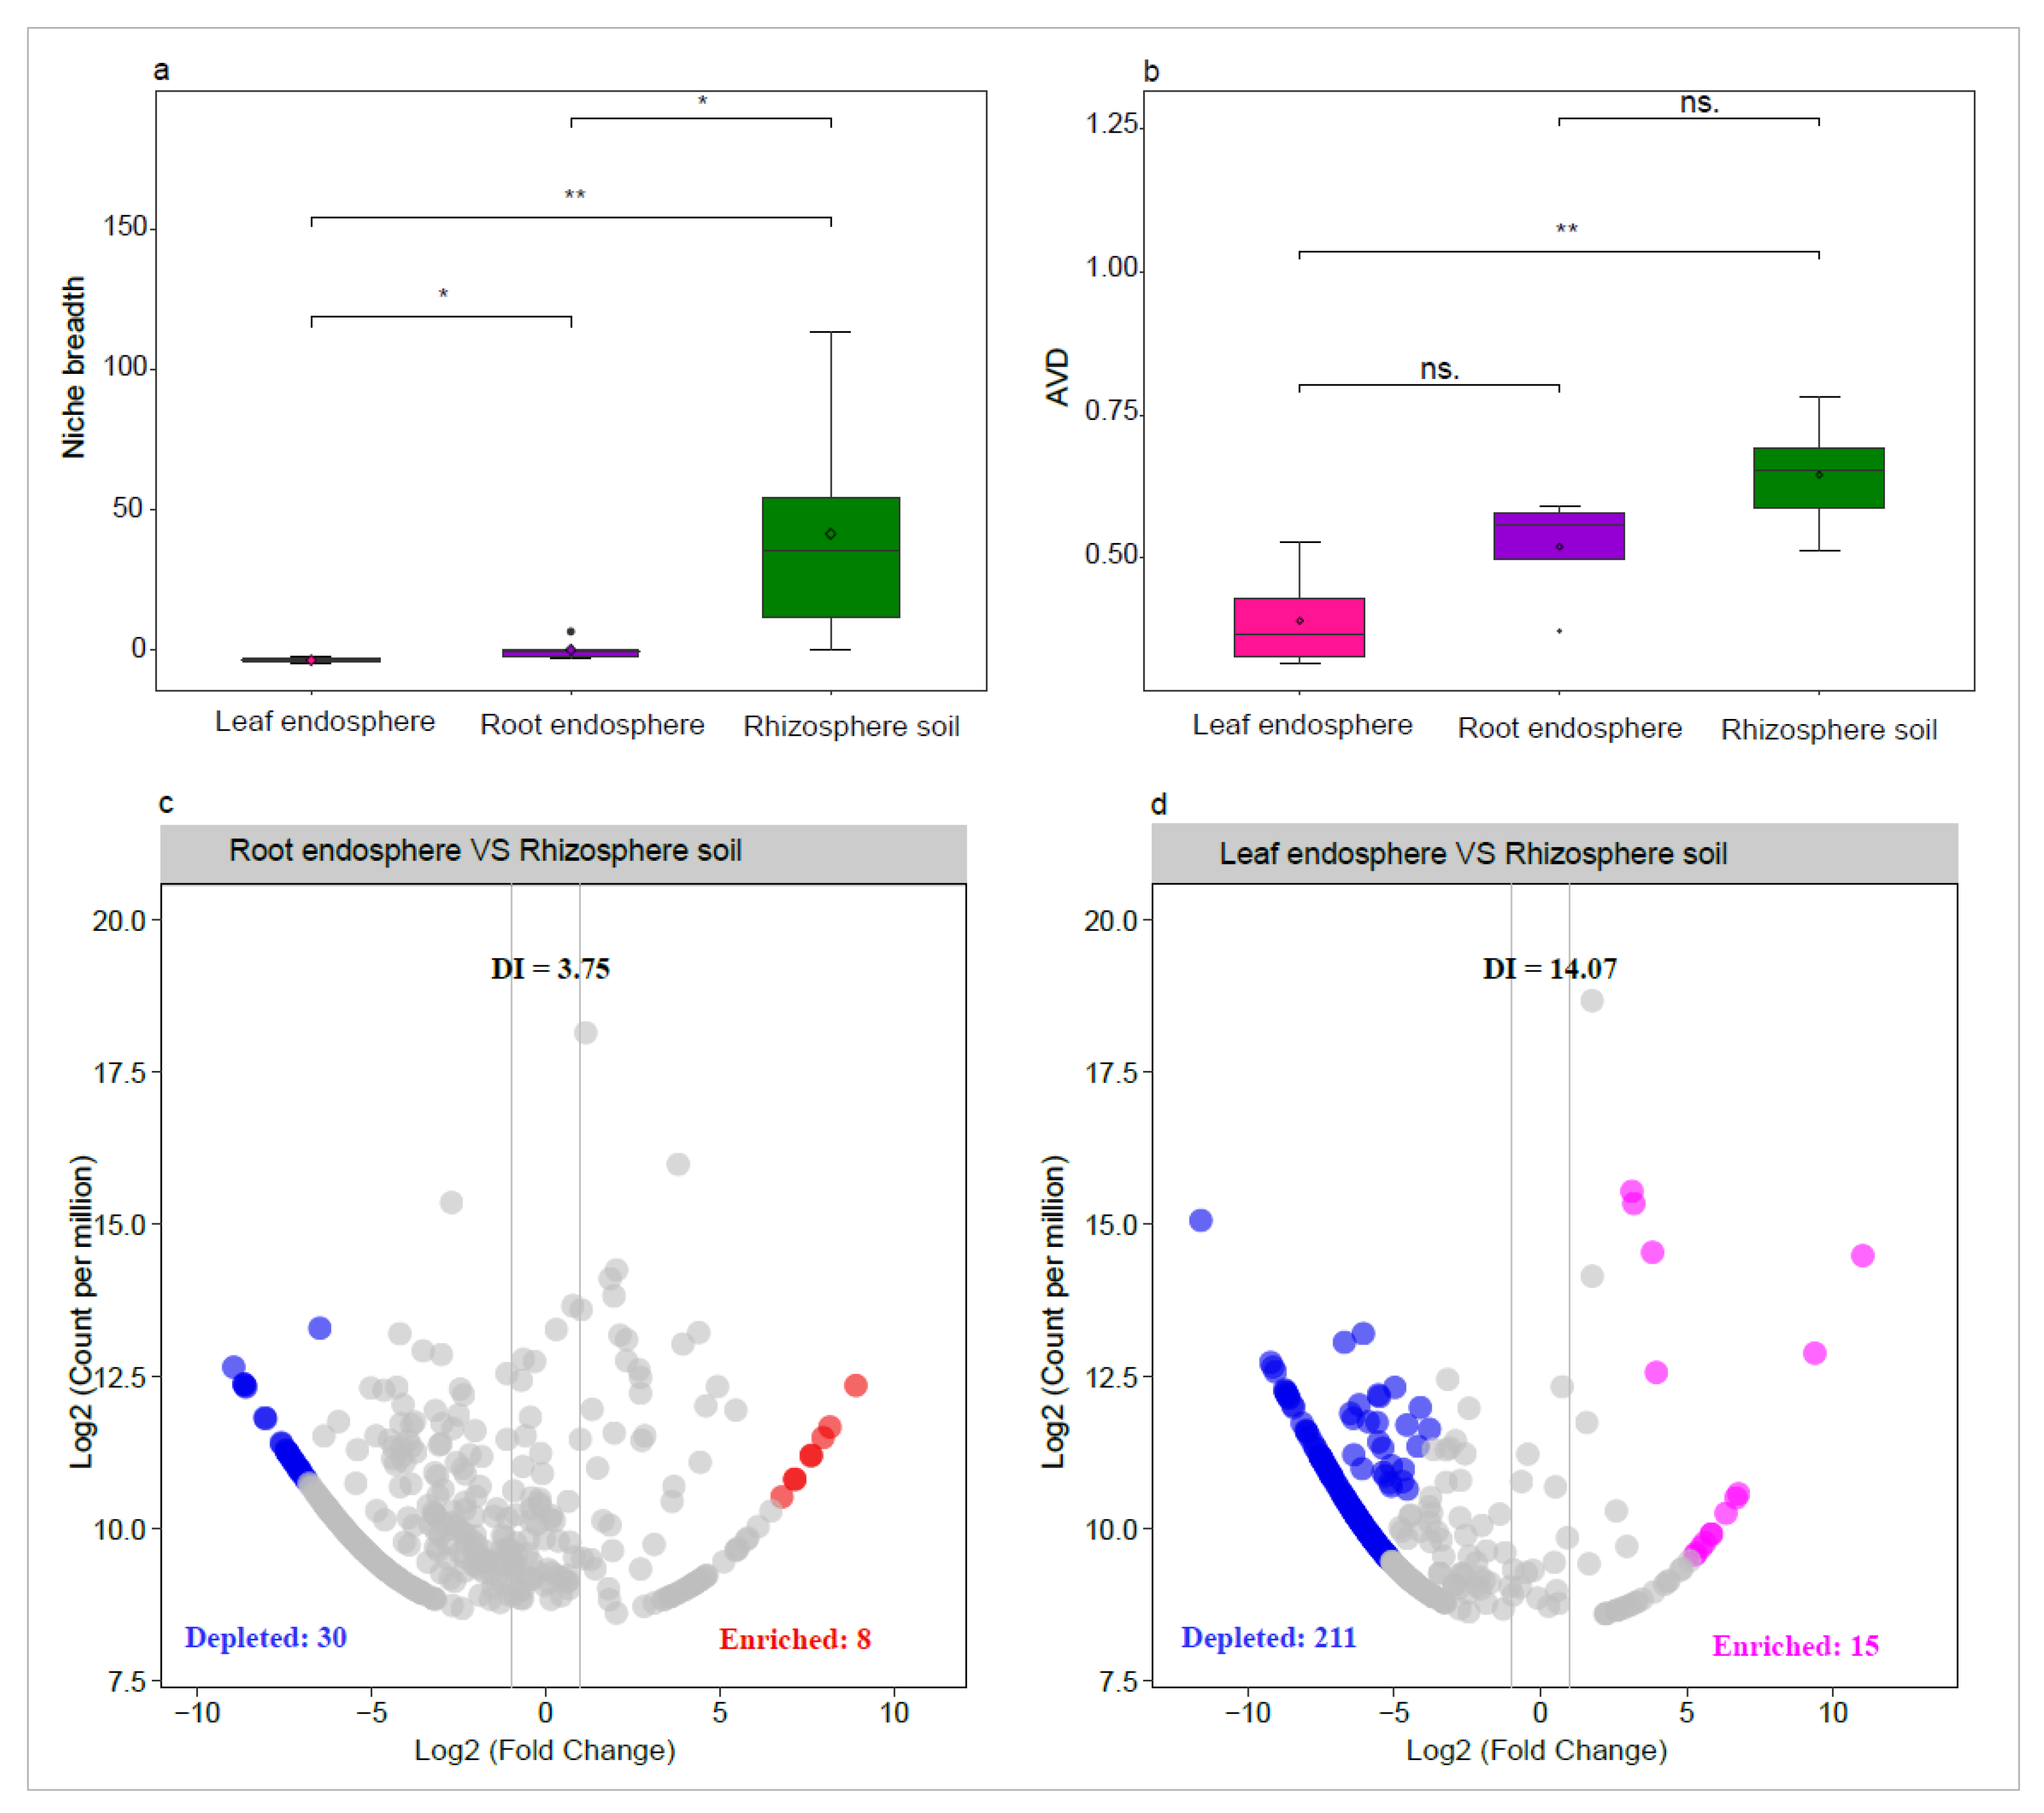
Figure 7.
Venn diagrams show the shared and unique amplicon sequence variants (ASVs) among the rhizosphere soil, root endosphere, and leaf endosphere (a). Source model show the potential sources of bacterial communities within the rhizosphere soil, root endosphere, and leaf endosphere, and direction of the arrows represents the source-sink relationships, and percentages represent the contribution that each source provides (b). Venn diagrams illustrate the shared and unique bacterial ASVs between the root and leaf endospheres, highlighting both significantly enriched and depleted ASVs (c, d). Correlation-based networks of bacterial communities, including all taxa in the rhizosphere soil, leaf endosphere, and root endosphere (e). The ZiPi plot illustrates the distribution of ASVs, encompassing all taxa present in rhizosphere soil, root endosphere, and leaf endosphere, according to their topological roles (f).
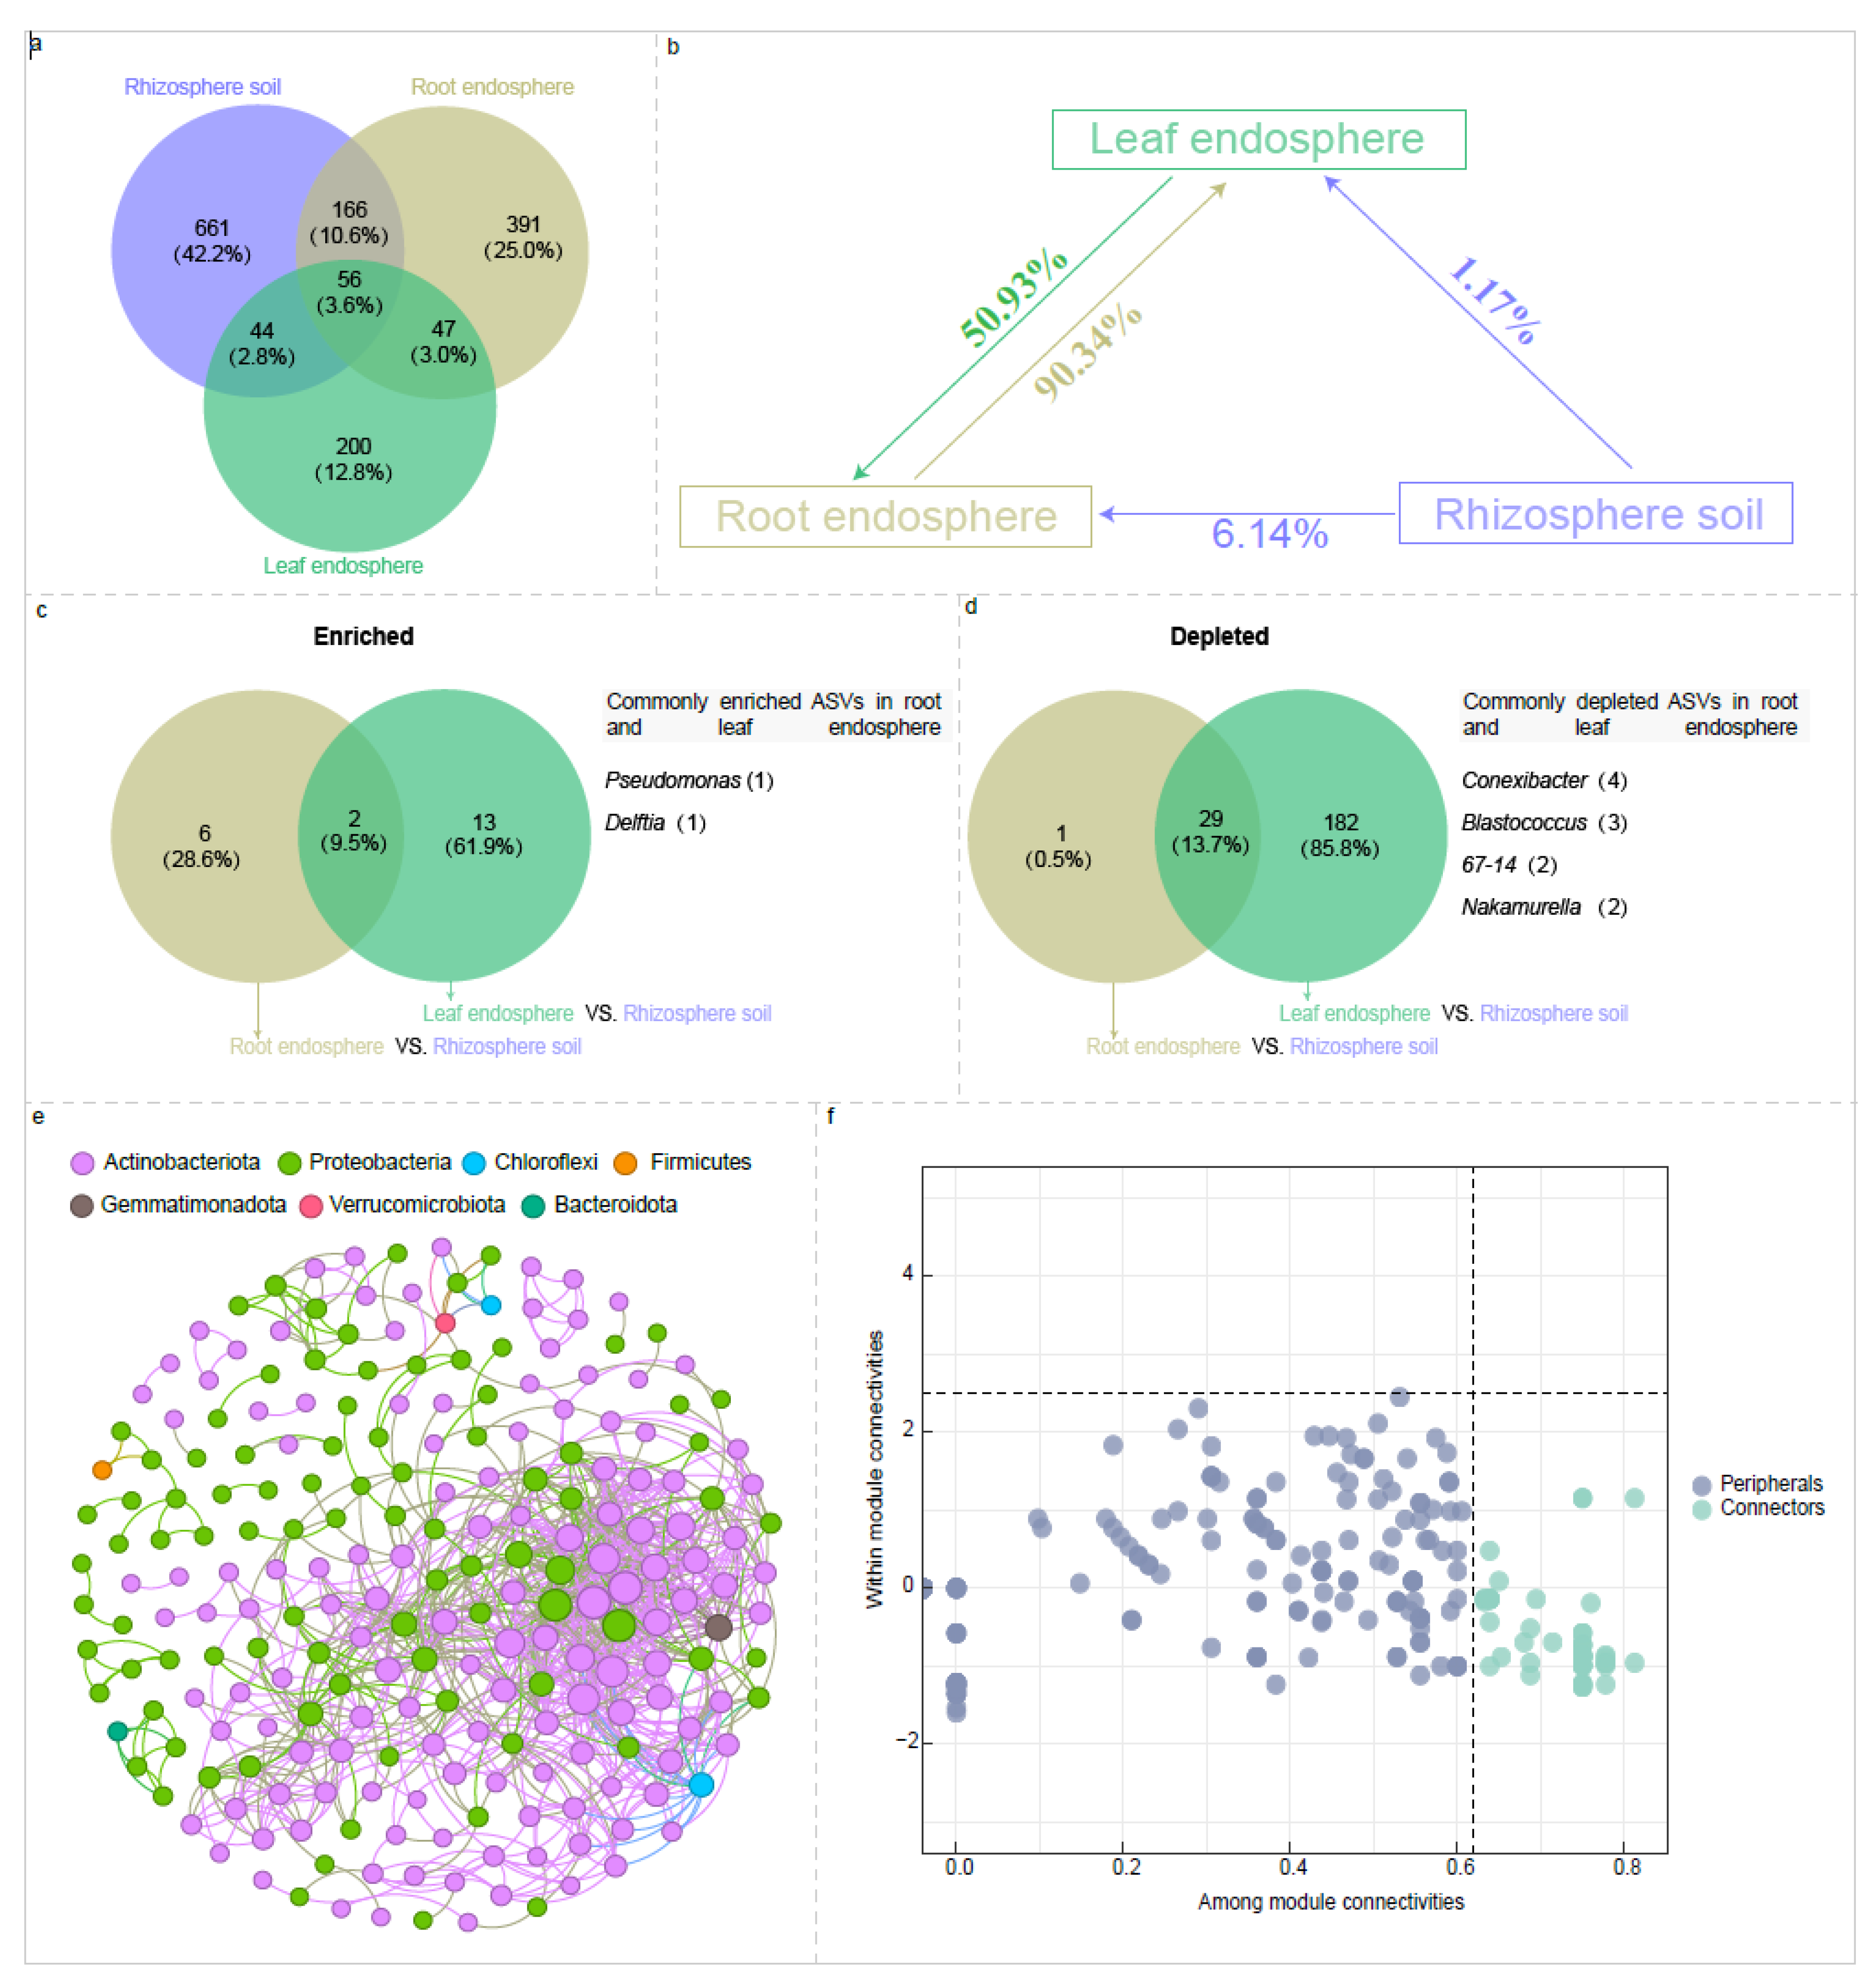

Table 1.
Comparison of bacterial community composition dissimilarity among the rhizosphere soil (Rs), root endosphere (Re), and leaf endosphere (Le) using three non-parametric statistical methods.
Table 1.
Comparison of bacterial community composition dissimilarity among the rhizosphere soil (Rs), root endosphere (Re), and leaf endosphere (Le) using three non-parametric statistical methods.
| Multiple comparison | ADONIS | ANOSIM | MRPP | ||||
|---|---|---|---|---|---|---|---|
| R2 | P | R | P | δ | P | ||
| Bray–Curtis dissimilarity | Le vs. Re vs. Rs | 0.453 | 0.001 | 0.661 | 0.011 | 0.502 | 0.001 |
| Le vs. Re | 0.307 | 0.001 | 0.475 | 0.004 | 0.416 | 0.006 | |
| Le vs. Rs | 0.509 | 0.004 | 0.850 | 0.002 | 0.462 | 0.005 | |
| Re vs. Rs | 0.282 | 0.004 | 0.661 | 0.011 | 0.631 | 0.008 | |
| Unifrac dissimilarity | Le vs. Re vs. Rs | 0.236 | 0.001 | 0.532 | 0.001 | 0.803 | 0.001 |
| Le vs. Re | 0.143 | 0.028 | 0.245 | 0.034 | 0.839 | 0.021 | |
| Le vs. Rs | 0.218 | 0.001 | 0.702 | 0.002 | 0.804 | 0.004 | |
| Re vs. Rs | 0.195 | 0.003 | 0.651 | 0.003 | 0.766 | 0.005 | |
Table 2.
Indicator amplicon sequence variants (ASVs) for leaf endosphere, root endosphere, and rhizosphere soil.
Table 2.
Indicator amplicon sequence variants (ASVs) for leaf endosphere, root endosphere, and rhizosphere soil.
| ASV | Taxonomy | Plant compartment niche | Indval value (>0.7) |
p.value (< 0.05) |
|---|---|---|---|---|
| ASV1 | Pseudomonas | Leaf endosphere | 0.736 | 0.003 |
| ASV2 | Pseudomonas | Leaf endosphere | 0.886 | 0.005 |
| ASV5 | Pseudomonas | Leaf endosphere | 0.850 | 0.009 |
| ASV7 | Pseudomonas | Leaf endosphere | 0.939 | 0.003 |
| ASV12 | Carnobacterium | Leaf endosphere | 1.000 | 0.001 |
| ASV4 | Conyzicola | Root endosphere | 0.965 | 0.047 |
| ASV19 | Polaromonas | Root endosphere | 0.834 | 0.023 |
| ASV20 | Brevundimonas | Root endosphere | 0.775 | 0.02 |
| ASV32 | Delftia | Root endosphere | 0.805 | 0.041 |
| ASV22 | Frankiales | Rhizosphere soil | 0.987 | 0.001 |
| ASV23 | Gaiella | Rhizosphere soil | 0.968 | 0.001 |
| ASV27 | Blastococcus | Rhizosphere soil | 0.873 | 0.003 |
| ASV33 | Allorhizobium-Neorhizobium-Pararhizobium-Rhizobium | Rhizosphere soil | 0.820 | 0.007 |
| ASV38 | MB-A2-108 | Rhizosphere soil | 0.983 | 0.001 |
| ASV40 | Nocardioides | Rhizosphere soil | 0.964 | 0.001 |
| ASV42 | Microbacteriaceae | Rhizosphere soil | 0.811 | 0.024 |
| ASV47 | Nocardioides | Rhizosphere soil | 0.970 | 0.001 |
| ASV48 | Blastococcus | Rhizosphere soil | 1.000 | 0.001 |
| ASV50 | Blastococcus | Rhizosphere soil | 0.899 | 0.003 |
| ASV51 | Beijerinckiaceae | Rhizosphere soil | 1.000 | 0.001 |
| ASV53 | Blastococcus | Rhizosphere soil | 0.816 | 0.014 |
| ASV54 | Sporichthyaceae | Rhizosphere soil | 0.967 | 0.001 |
| ASV57 | Gemmatimonadaceae | Rhizosphere soil | 0.939 | 0.001 |
| ASV64 | Allorhizobium-Neorhizobium-Pararhizobium-Rhizobium | Rhizosphere soil | 0.839 | 0.013 |
Table 3.
Key topological properties of bacterial community co-occurrence networks in the rhizosphere soil, root endosphere, and leaf endosphere.
Table 3.
Key topological properties of bacterial community co-occurrence networks in the rhizosphere soil, root endosphere, and leaf endosphere.
| Network properties | Leaf endosphere | Root endosphere | Rhizosphere soil |
|---|---|---|---|
| Observed networks | |||
| Edges | 66.00 | 932.00 | 3424.00 |
| Nodes | 35.00 | 152.00 | 359.00 |
| clustering coefficient | 1.00 | 0.99 | 1.00 |
| Average path length | 1.00 | 1.01 | 1.00 |
| Modularity | 0.71 | 0.80 | 0.86 |
| graph.density | 0.11 | 0.08 | 0.05 |
| Diameter | 1.00 | 1.97 | 1.00 |
| Average degree | 3.77 | 12.26 | 19.08 |
| Random networks | |||
| Average path length | 0.69 ± 0.09 | 0.29 ± 0.004 | 0.29 ± 0.002 |
| Clustering coefficient | 0.91 ± 0.03 | 0.08 ± 0.004 | 0.05 ± 0.002 |
| Modularity | 0.397 ± 0.03 | 0.23 ± 0.007 | 0.19 ± 0.004 |
Disclaimer/Publisher’s Note: The statements, opinions and data contained in all publications are solely those of the individual author(s) and contributor(s) and not of MDPI and/or the editor(s). MDPI and/or the editor(s) disclaim responsibility for any injury to people or property resulting from any ideas, methods, instructions or products referred to in the content. |
© 2025 by the authors. Licensee MDPI, Basel, Switzerland. This article is an open access article distributed under the terms and conditions of the Creative Commons Attribution (CC BY) license (http://creativecommons.org/licenses/by/4.0/).
Copyright: This open access article is published under a Creative Commons CC BY 4.0 license, which permit the free download, distribution, and reuse, provided that the author and preprint are cited in any reuse.


