Submitted:
18 February 2025
Posted:
19 February 2025
You are already at the latest version
Abstract
Hypertrophic cardiomyopathy (HCM) is the most common inherited cardiovascular condition in the world affecting around 1:500 people. HCM is characterized by ventricular wall thickening, decreased ventricular chamber volume and diastolic dysfunction. Inherited HCM is most commonly caused by sarcomere gene mutations, however approximately 50% of patients do not present with a known mutation highlighting the need for further research into additional pathologic mutations. CRYABR123W was previously identified as a novel sarcomere-independent mutation causing HCM associated with pathologic NFAT signaling in the setting of pressure overload. We generated stable H9C2 cell lines expressing FLAG tagged wild type and mutant CRYAB, which demonstrated that CRYABR123W has increased calcineurin activity. Using Alphafold to predict structural and interaction changes we generated a model where CRYABR123W uniquely binds to the autoinhibitory domain of calcineurin. Co-immunoprecipitation using the CRYAB FLAG tag followed by mass spectrometry showed novel and distinct changes in the protein interaction patterns of CRYABR123W. Finally, mouse hearts extracted from our wild type and CRYABR123W model with and without pressure overload caused by transverse aortic constriction (TAC) were used in global proteomic and phosphoproteomic mass spectrometry analysis which showed dysregulation in cytoskeletal, metabolomic, cardiac and immune function. Our data illustrates how CRYABR123W drives calcineurin activation and exhibits distinct changes in protein interaction and cellular pathways during the development of HCM and pathological cardiac hypertrophy.
Keywords:
Hypertrophic cardiomyopathy
; cardiac hypertrophy
; cryab
; alpha-B-crystallin
; molecular chaperone
; calcineurin
; transverse aortic constriction
; mass spectrometry
; alphafold
1. Introduction
Hypertrophic cardiomyopathy (HCM) is a pathologic condition defined by thickening of the ventricular wall, decreased ventricular chamber volume and diastolic dysfunction in the absence of predisposing factors, and remains the most common inherited cardiovascular condition affecting around 1:500 individuals world-wide [1]. It is inherited in an autosomal dominant pattern with a penetrance around 50-60% [2,3]. Linkage analyses of large families with HCM have identified mutations in multiple cardiac sarcomere genes, including β-myosin heavy chain (MYH7), myosin binding protein C3 (MYBPC3) and cardiac troponin T (TNNT2) [4,5,6,7,8,9]. Although the most common mutations involved in HCM are in the cardiac sarcomere genes, they only account for around 30% of mutations found in patients while a staggering 40% of patients do not carry any known HCM mutation [10,11]. Therefore, identifying and studying additional elusive causative genes outside of the sarcomere is essential to fully understand the pathogenic mechanisms behind hypertrophic cardiomyopathy [12].
Mutant alpha-crystallin B (CRYAB) was first implicated in cardiomyopathy decades ago from a genetic linkage study of a French family [13]. CRYAB is a member of the small heat shock protein family, which are molecular chaperones that are involved in a wide range of cellular functions including regulation of calcium signaling [14], protein folding and aggregation [15,16,17], autophagy [18,19] and apoptosis [20,21]. Under normal physiologic conditions CRYAB forms dimers and oligomers which mask the N- and C-terminal unstructured regions of CRYAB and thereby inhibit its function [22,23]. Following cellular stress, CRYAB de-oligomerizes exposing its N- and C-terminal domains leading to phosphorylation at different serine residues and its activation as a molecular chaperone [24,25]. CRYAB oligomers are stabilized by ionic bridges at aspartic acid residue 109 (D109) and arginine residue 120 (R120) between interacting CRYAB proteins [22,23]. Proper maintenance of CRYAB oligomers is vital to normal functioning of the protein and prevention of aberrant protein interactions, as such mutations at D109 and R120 have been implicated in various familial cardiomyopathies [26]. Several mutations have been noted at D109, but the most well studied is CRYABD109G which causes restrictive cardiomyopathy secondary to abnormal desmin aggregation [27]. Similarly disruptive mutations at R120 have been implicated in desmin-related cardiomyopathy with the most common mutation being CRYABR120G [28]. CRYABR120G acts in a dominant negative manner disrupting the normal functioning of wild type CRYAB and promotes protein aggregation as was noted in cryoelectron microscopy of CRYABR120G mutant cells with quaternary CRYABR120G structures double in size compared to wild type CRYAB cells [29,30]. A recently discovered novel mutation CRYABR123W was found to cause concordant development of HCM in monozygotic twins suggesting its pathogenic nature [31]. Mouse studies of CryabR123W have demonstrated a spontaneous development of diastolic dysfunction with aging and pathological hypertrophy with systolic dysfunction secondary to TAC-induced pressure overload [32]. CRYAB has also been shown to bind to calcineurin in co-immunoprecipitation experiments and CRYABR123W is implicated in pathologic calcium signaling [32]. Abnormal CRYAB structure secondary to the R123W mutation has been shown to have an increased B-sheet content and large structural changes adjacent to its mini-chaperone peptide sequence implicated in reduced chaperone activity while at the same time also increasing the propensity of the mutant protein to form aggregates [33].
In this study we demonstrate that CRYABR123W leads to increased calcineurin activity in H9C2 cells and impaired calcium uptake in mutant mouse cardiomyocytes. Structural analysis of CRYAB interaction with calcineurin using Alphafold suggests that CRYABR123W binds to the auto-inhibitory domain of calcineurin, supporting a possible mechanism of autoinhibition release for the increased calcineurin activity. Co-immunoprecipitation and global proteomic and phosphoproteomic mass spectrometry analysis revealed differential protein binding and regulation secondary to CRYABR123W indicating distinct cellular changes compared to other studied CRYAB mutations.
2. Results
CRYABR123W Increases Calcineurin Activity
To investigate the impact that CRYAB protein mutations have on calcineurin activity, we generated stable H9C2 cell lines overexpressing FLAG-tagged wild type, CRYABD109G, CRYABR120G, and CRYABR123W via lentivirus transduction. We measured calcineurin activity directly in cell lysates generated from these cell lines and an H9C2 negative control expressing normal levels of wild type CRYAB using a colorimetric calcineurin activity assay. We found a significant increase in calcineurin activity in cells overexpressing CRYABR123W compared to those expressing the other two mutant proteins or wild type protein (Figure 1). Overexpression of CRYAB, CRYABD109G or CRYABR120G did not promote an increase in calcineurin activity when compared to the negative control. These results indicate that the R123W variant of CRYAB is uniquely able to increase in Calcineurin activity when compared to wild type or the D109G or R120G variants.
CRYABR123W Causes Impaired Calcium Reuptake and Myocyte Relaxation
To examine changes in cardiomyocyte contraction and calcium handling, we isolated wild type CRYAB and CRYABR123W myocyte cells from mouse hearts and then performed IonOptix based assessment and analysis. No significant differences were seen in fractional shortening. We found that as compared to wild type myocytes, CRYABR123W myocytes had significantly impaired calcium reuptake and myocyte relaxation compared to wild type CRYAB as measured by the elevation in single exponential tau (Figure 2a). Interestingly, we also saw that CRYABR123W myocytes overall have a small but significant increase in sarcomere length compared to their wild type counterparts (Figure 2b). This provides evidence that the CRYAB R123W promotes dysregulation of calcium handling in mouse myocytes and is consistent with activation of calcineurin activity, NFAT reporter activity and diastolic dysfunction as shown in this study and reported previously [32].
Alphafold Predicts CRYABR123W Binds to the Autoinhibitory Domain of Calcineurin
To attempt to gain a better understanding of the protein structure of the CRYAB variants and their possible interaction with calcineurin, we used the Alphafold structural prediction software [34,35]. The sequences for calcineurin and wild type CRYAB were collected from the Alphafold Protein database and altered with the selected mutations [36,37]. First, we wanted to ensure that the addition of a triple FLAG tag to the structure was not predicted to have significant alterations in protein structure. A triple FLAG tag sequence was added at the N and C terminal of the wild type and CRYABR123W mutant sequences in Alphafold which was then visualized and compared in ChimeraX [38], with minimal alterations in protein structure following FLAG tag addition (Figure 3a-d). Second, we modeled the interaction of wild type CRYAB, CRYABD109G, CRYABR120G and CRYABR123W with calcineurin (Figure 4a-d). As has been previously published, wild type CRYAB binds at the NFAT binding site of calcineurin, blocking NFAT from binding to calcineurin [39] (Figure 4a). Both CRYABD109G and CRYABR120G are predicted to interact with the NFAT binding site but to a lesser extent compared to the wild type (Figure 4b,c), consistent with a loss of competition for NFAT binding model for promoting NFAT activation and cardiac hypertrophy. CRYABR123W, unlike the other proteins, was not predicted to bind at the NFAT binding site and thus would have complete loss of competition for NFAT binding and also was uniquely predicted to bind at the auto-inhibitory domain of calcineurin (Figure 4d). This suggests that unlike the other variants, CRYABR123W might have both a loss of competition for NFAT binding to calcineurin and an additional activating function by relieving the intrinsic autoinhibitory function of calcineurin to promote NFAT activation and cardiac hypertrophy. This offers a likely explanation for the significant increase in calcineurin activity seen in CRYABR123W compared to the other mutants.
The CRYABR123W Protein Interactome Diverges from CRYAB and CRYABR120G
To examine the impact that CRYAB mutations have on cellular protein interactions we analyzed FLAG antibody-based co-immunoprecipitation data from H9C2 cellular extract of FLAG tagged wild type CRYAB compared to FLAG tagged CRYABR120G and CRYABR123W with unbiased LC-MS proteomics. We found that despite their relative closeness in structure and mutation location CRYABR120G and CRYABR123W mutations have distinct patterns of changes in protein binding. When compared to wild type CRYAB, CRYABR120G seems to mostly have increased binding to proteins consistent with its documented propensity to form protein aggregates (Figure 5.1a) [29,30]. While CRYABR123W has both increased and decreased binding to proteins consistent with a documented loss of chaperone activity but also increase in aggregation (Figure 5.1b) [33]. When comparing CRYABR120G and CRYABR123W, we saw that the changes in protein binding between the two CRYAB mutants were distinct (Figure 5.2). CRYABR123W seems to have higher binding with cytoskeletal proteins, particularly proteins involved in actin binding such as Svil [40] and Lima1/EPLIN [41] (Figure 5.2). While CRYABR123W seems to have decreased binding to proteins involved in transcription including Brd9 [42] and Gcn1 [43], protein degradation such as Trim21 [44] and Nqo1[45] and the calcium binding ion channel Anxa2 [46] (Figure 5.2). Differential protein binding seen with CRYABR123W could be a driving force behind cellular pathway changes involved in the development of the HCM in contrast to the DCM phenotype seen with CRYABR120G or the restrictive CM phenotype seen with CRYABD109G.
Global Proteomics and Phosphoproteomics Reveal Cytoskeletal, Metabolic, Immune and Cardiac Dysfunction in CRYABR123W Mouse Hearts
To investigate the changes in cellular protein composition and pathways we compared wild type CRYAB and CRYABR123W global mouse heart extracts with and without pressure overload in the form of TAC. For the mice without TAC we found 6971 unique proteins, 983 unique phosphorylated proteins and 1726 proteins common to both (Figure 6a) For mice with TAC we found 4432 unique proteins, 422 unique phosphorylated proteins and 1620 proteins common to both (Figure 6d). Without additional pressure overload the CryabR123W mutation does not induce an HCM phenotype in our mouse model [32], a common condition of HCM mouse models [47] as few develop spontaneous HCM [48,49,50,51]. Unsurprisingly, without TAC we observed few significant changes in protein expression or phosphorylation (Figure 6b,c). However, following TAC and the emergence of a pathological hypertrophic phenotype, we observed a significant change in expression of proteins and phosphorylated proteins (Figure 6e,f), notably down regulation of Grp39, Lgals3 and Sytl3(P) while Anax6, Ppp1r1b, Slc25a15, Hrc(P) and Atxn2l(P) were upregulated (Figure 6e,f). Given that the HCM phenotype does not develop unless there is additional stress on the heart, we designated the pathology of mouse hearts that have not undergone TAC as being a model of early-stage disease (Figure 6a-c) and those with TAC as models of late-stage disease (Figure 6d-f). As previously described in our lab, the CRYABR123W mouse model developed systolic dysfunction following TAC [32], a poor prognostic factor of patients with HCM [52,53] illustrating how our mouse model mimics late and severe stage of HCM pathology.
Pathway analysis of the mass spectrometry proteins using GO term analysis in R [54] showed significant associations with cytoskeletal structure and actin filament pathways (Figure 7).
However, to gain a better understanding if there are other possible pathways involved, we analyzed the mass spectrometry data using QIAGEN Ingenuity Pathway Analysis (QIAGEN Inc., https://digitalinsights.qiagen.com/IPA) (IPA) [55] software comparing the early to late mouse hearts via heat maps. IPA analysis revealed significant changes in pathways involved in metabolism, cardiovascular function and immune regulation with more congruent clustering using heatmap analysis of the global mass spectrometry data. The most significant pathways that showed increased clustering comparing early to late stages of the condition included oxidative phosphorylation (Figure 8.1a,b), mitochondrial dysfunction (Figure 8.2a,b) and mTOR signaling (Figure 8.3a,b) for metabolic pathways, NFAT involvement in HCM (Figure 8.4a,b) and cardiac conduction (Figure 8.5a,b) for cardiovascular pathways and Granzyme (Figure 8.6a,b) and neutrophil trapping (Figure 8.7a,b) for immune pathways. Finally, we used IPA to analyze upstream regulators predicted to be involved in the changes seen in the protein expression of the late disease mass spectrometry data which showed significant involvement of enzymes, kinases, G-protein coupled receptors (GPCR), phosphatases and ion channels (Table 1). Our analysis demonstrates how the stress of pressure overload reveals pathological hypertrophy pathways secondary to CRYABR123W mutation. Specifically, there are distinct changes secondary to CRYABR123W induced pathological hypertrophy in the cytoskeletal, metabolic, cardiac and immune pathways. Finally distinct upstream regulators are predicted to be involved in the changes seen with pathological hypertrophy secondary to CRYABR123W following pressure overload by TAC could be targets for future therapeutic intervention.
3. Discussion
In this study, we used both cell lines and mouse models to examine the cellular effects of mutations in the CRYAB protein. Previous studies have demonstrated that wild type CRYAB is a protein interactor of calcineurin and suppresses the activity of calcineurin in the setting of pressure overload, but did not explain how heterozygosity for CRYABR123W conferred susceptibility to pathological hypertrophy [32]. In a simple competition for NFAT binding model, wild type CRYAB present in CRYABR123W heterozygotes would still inhibit the interaction of NFAT with calcineurin and therefore limit calcineurin dephosphorylation of NFAT and activation of hypertrophic signaling. Our results show that calcineurin activity was significantly elevated in cells overexpressing mutant CRYABR123W, despite the continued presence of wild type CRYAB, indicating a unique link between the mutation and aberrant calcineurin activity that is not observed with CRYABD109G or CRYABR120G. Our structural prediction using Alphafold indicates a possible interaction between CRYABR123W and the autoinhibitory domain of calcineurin, a key intrinsic regulatory motif [56]. This predicted interaction likely provides the mechanism behind the observed significant and unique increase in calcineurin activity.
Hypertrophic cardiomyopathy has been characterized by dysregulated fibrosis, immune regulation, inflammation and metabolism [57]. Our global proteomics analysis demonstrates that HCM, secondary to the expression of mutant CRYABR123W leads to dysregulated oxidative phosphorylation and mitochondrial function pathways. Additionally, hearts from mice carrying the CRYABR123W mutation exhibit a significant dysregulation of immune function and cytoskeletal pathways likely secondary to the impaired chaperone activity of CRYABR123W [33]. Wild type CRYAB is significantly expressed in cardiac tissue [58] and has been shown to readily bind to various protein interactors [59,60] including proinflammatory proteins [61] acting in an anti-inflammatory manner [62,63,64]. Therefore, it is not surprising that mutant CRYAB proteins are involved in dysregulated inflammatory and immune responses. The role of immune and inflammatory dysregulation on the pathogenesis of HCM secondary to CRYABR123W raises the interesting question of whether there is a role for anti-inflammatory therapeutics in the treatment of HCM.
HCM pathology has been characterized by enhanced calcium signaling regardless of underlying pathologic mutation or cause [65,66]. Wild type CRYAB plays a crucial role in the regulation of pathologic calcium signaling in the setting of pressure overload through modulation of NFAT and calcineurin activity [32,67]. We observed a significantly impaired calcium reuptake in CRYABR123W mutant myocytes indicating that the mutant has a role in the dysregulation of cellular calcium handling and an altered calcineurin interaction. Further investigation into the role calcineurin and calcium play in the development of HCM in general and in the setting of CRYABR123W is required as is the viability of calcineurin inhibitors as a therapeutic intervention for HCM patients. Our work supports the notion that precision intracellular targeting could serve as a crucial future development for the treatment of HCM patients.
CRYAB has been well documented as a molecular chaperone in a variety of different tissues across the body. Previously documented mutations in CRYAB have been linked to the development of various cardiomyopathies via the disruption of ionic bridges critically involved in the molecular chaperone function of CRYAB [22,23]. CRYABR123W, however, is unique in its development of HCM [31,32]. Our comparative analysis of CRYABR120G and CRYABR123W co-immunoprecipitation data suggests a distinct mechanism behind the cellular changes seen with CRYABR123W of which further study could illuminate novel mechanism for the development of HCM. Recent structural studies of CRYABR123W demonstrated reduced chaperone activity while at the same time increased aggregation to cytoskeletal proteins [33]. Similarly, our co-immunoprecipitation experiments showed significant overall loss of protein binding with CRYABR123W but also showed increased binding to cytoskeletal proteins. Further validation of changes in interaction partners secondary to the CRYABR123W mutation could illuminate possible targets for therapeutic intervention.
4. Materials and Methods
AlphaFold Protein Structure Modeling – Native amino acid sequences for CRYAB and Calcineurin were downloaded from their respective Alphafold Protein Structure Database entries [36,37]. CRYAB sequences were edited into their mutated form by replacing the corresponding amino acids respectively, D109G, R120G and R123W. All sequences, individual and multiple, were run in AlphaFold2 using the multimer setting [34,35]. Highest fidelity predicted structures based on AlphaFold2 ranked analysis were considered. Images of structures were viewed and labeled using ChimeraX developed by UCSF [38].
CRYAB DNA Insert and Plasmid Preparation – Plasmid backbone was based on the pLJM1-Empty plasmid construct (Addgene plasmid #91980 ; http://n2t.net/addgene:91980 ; RRID:Addgene_91980) [68]. CRYAB gene inserts were created using IDT gene block fragment technology(https://www.idtdna.com/page). Gene insert sequences were created with a 40 BP Gibson homology sequence from the pLJM1 plasmid at the 5’ and 3’ ends and then internally flanked by restriction enzyme sites for NheI at the 5’ end and EcoRI at the 3’ end. Between the 5’ and 3’ ends the main sequences consisted of a Kozak site, start codon, triple FLAG sequence and CRYAB sequences or CRYAB sequences and triple FLAG sequence for both N and C terminal labeling and then finally a stop codon. Wild type, CRYAB D109G, R120G and CRYAB R123W DNA sequences were used for the inserts and were retrieved from Uniprot (https://www.uniprot.org/). Linearized pLJM1-Empty plasmid was prepared using FastDigest Green Buffer (ThermoFisher #B72) and the NheI (ThermoFisher #ER0971) and EcoRI (ThermoFisher #ER0271) restriction enzymes. The solution was then incubated at 37C for 30 minutes then at 80 oC for 5 minutes to inactivate the restriction enzymes. CRYAB gene inserts were incorporated into the linearized pLJM1 plasmid using Gibson assembly per protocol (ThermoFisher #A46633) [69].
Bacterial Transformation – Stable competent E. coli cells (NEB #C3040) were transformed using the heat shock method as previously described using 100ng of the Gibson reaction solution [70]. Transformed E. coli cells were then grown on LB plates with ampicillin selection for 12 hours before individual colonies were selected and cultured in LB media with ampicillin selection prior to plasmid isolation.
Plasmid Isolation and Sequencing – Stable E. coli cultures were pelleted, and plasmids were isolated using Qiagen miniprep (Qiagen #27104) or Takarabio Midiprep (Takara # 740422.50) per protocol. Prior to further usage plasmids were sequenced using Sanger sequencing to confirm proper insert sequence at the Tufts University Sequencing Core.
Cell Lines - H9C2 cells purchased from ATCC (CRL-1446) were maintained on DMEM media supplemented with 10% fetal bovine serum. H9C2 cell lines expressing triple FLAG tagged wild-type human CRYAB, D109G, R120G or R123W variants were generated using DNA sequences encoding the variants that were inserted to pLenti-puro vector (#39481, Addgene). H9c2 cells were transduced with 3rd generation CRYAB-expressing lentivirus, packaged as previously described [71]. Transduced cells were selected and maintained on 10 µg/ml puromycin.
Stable CRYAB H9C2 Cell Line Preparation – Using autoclaved forceps and sterile filter paper dipped in Trypsin individual colonies of transfected H9C2 cells were selected and grown in DMEM media supplemented with 10% fetal bovine serum and puromycin to make stable cell lines. Stable H9C2 CRYAB cell lines were checked for CRYAB expression using Western blotting with a primary monoclonal mouse anti-FLAG antibody (SigmaAldrich #F1804) and secondary immunofluorescent AlexaFluor488 goat anti-mouse light chain specific antibody (Jackson ImmunoResearch #115-545-174). Wild type and mutant CRYAB cell lines with approximately equal expression were selected for use in future experiments and maintained in DMEM media supplemented with 10% fetal bovine serum and puromycin.
Calcineurin Activity Assay – CRYAB wild type and mutant H9C2 stable cells were grown to 75% confluence on 10 cm plates before being harvested and lysed with 1 mL of ice-cold lysis buffer (50 mM HEPES buffer, 150 mM NaCl, 0.1% NP-40, Halt protease and phosphatase inhibitors (ThermoFisher # 78442)). Plates with lysis buffer were left on ice for 5 minutes before cells were detached with a cell scraper and collected in an Eppendorf tube. Cells were centrifuged at 12000g for 10 minutes at 4 oC and then the lysate supernatant was collected. Protein concentration was determined by BCA assay and equal protein amounts were used between samples, approximately 1 mg/mL concentration. Calcineurin activity was measured using a colorimetric calcineurin assay kit (SigmaAldrich #207007) with each sample being prepared in triplicate and as specified by the manufacturer. Samples were read at 620 nm absorbance and calcineurin activity was calculated based on the following equation: (Total – Background) – (EGTA – Background).
Coimmunoprecipitation (Co-IP) – CRYAB wild type and mutant H9C2 stable cells were grown to 75% confluence on 10 cm plates before being harvested and lysed with 1 mL of ice-cold lysis buffer (50 mM HEPES buffer, 150 mM NaCl, 0.1% NP-40, Halt protease and phosphatase inhibitors (ThermoFisher # 78442)). Plates with lysis buffer were left on ice for 5 minutes before cells were detached with a cell scraper and collected in an Eppendorf tube. Cells were centrifuged at 12000g for 10 minutes at 4 oC and then the lysate supernatant was collected. Bradford assays were performed on all lysate samples and 1 mg of each lysate was incubated with 2 ug monoclonal mouse anti-FLAG antibody (SigmaAldrich #F1804) and incubated on a rotator at 4 oC for 2 hours. Then 30 µL of 50% Protein G Sepharose 4 Fast Flow beads (SigmaAldrich #GE17-0618) were added to the lysate and rotated at 4 oC for an additional 45 minutes. After incubation, tubes were centrifuged at 10000g for 30 seconds at 4 oC and the supernatant was removed. The remaining beads were washed with 200 µL cold PBS and centrifuged at 10000g for 30 seconds 3 times. Co-immunoprecipitation samples were eluted off the beads using a 5% Formic acid solution and then centrifuged at 12000g for 30 seconds. The supernatant was collected and stored in Eppendorf tubes. Co-immunoprecipitation samples were lyophilized prior to shipment to the Harvard mass spectrometry core for preparation as per their protocols below.
CRYAB Mouse Model Procedures and Global Proteomics Sample Preparation – CRYAB mouse models for both wild type and CRYABR123W were based on the model previously established in our lab [32]. All mice underwent echocardiography once between 10-12 weeks of age and then 5 weeks later as per protocol previously described [32]. 10–12-week-old wild type and CRYABR123W mice were respectively split into two groups, one without intervention and one to undergo severe (27G needle) transverse aortic constriction to induce pressure overload as previously described [72]. Following the procedure mice were allowed to recover for 5 weeks. After the second echocardiography all mice were anesthetized with isoflurane before being euthanized with cervical dislocation. The chest was cleaned with alcohol before being cut open and the heart was harvested by transecting the great vessels just above their exit from the heart. Hearts were washed and chambers emptied using ice cold PBS before being placed in an Eppendorf tube and flash frozen in liquid nitrogen. Hearts were stored at -80 oC until all the requisite hearts were ready for mass spectrometry preparation. Prior to mass spectrometry analysis hearts were homogenized in a lysis buffer (50 mM HEPES buffer, 150 mM NaCl, 0.1% NP-40, Halt protease and phosphatase inhibitors (ThermoFisher # 78442)) using an ultrasonic cell disrupter then centrifuged and the lysate supernatant was collected. Heart lysate samples were lyophilized prior to shipment to the Harvard mass spectrometry core for preparation as per their protocols below. All mice were handled in accordance with US National Institutes of Health standards, and all procedures were approved by the Tufts University Institutional Animal Care and Use Committee.
Co-IP Mass Spectrometry Sample Preparation - Dried IP elutions were solubilized in a buffer 200 mM EPPS pH 8.5, 8M urea, and protease inhibitors. A buffer exchange was carried out using a modified SP3 protocol [73]. Briefly, ~250 µg of Cytiva SpeedBead Magnetic Carboxylate Modified Particles (65152105050250 and 4515210505250), mixed at a 1:1 ratio, were added to each sample. 100% ethanol was added to each sample to achieve a final ethanol concentration of at least 50%. Samples were incubated with gentle shaking for 15 minutes. Samples were washed three times with 80% ethanol. Protein was eluted from SP3 beads using 200 mM EPPS pH 8.5 containing Lys-C (Wako, 129-02541). Samples were digested overnight at room temperature with vigorous shaking. The next morning trypsin was added to each sample and further incubated for 6 hours at 37º C. Acetonitrile was added to each sample to achieve a final concentration of ~33%. Each sample was labelled, in the presence of SP3 beads, with ~62.5 µg of TMTPro reagents (ThermoFisher Scientific). Following confirmation of satisfactory labelling (>97%), excess TMT was quenched by addition of hydroxylamine to a final concentration of 0.3%. The full volume from each sample was pooled and acetonitrile was removed by vacuum centrifugation. The samples were acidified with formic acid and desalted by StageTip eluted into autosampler inserts (Thermo Scientific), dried in a speedvac and reconstituted with 5% Acetonitrile, 5% formic acid for LC-MS/MS analysis.
Co-IP Liquid Chromatography and Tandem Mass Spectrometry - Mass spectrometric data were collected on an Orbitrap Eclipse mass spectrometer coupled to a Proxeon NanoLC-1000 UHPLC (Thermo Fisher Scientific). The 100 µm capillary column was packed in-house with 35 cm of Accucore 150 resin (2.6 μm, 150Å; ThermoFisher Scientific). Data were acquired for 180 min per run. A FAIMS device was enabled during data collection and compensation voltages were set at -40V, -60V, and -80V [74]. MS1 scans were collected in the Orbitrap (resolution – 60,000; scan range – 400-1600 Th; automatic gain control (AGC) – standard; maximum ion injection time – automatic). MS2 scans were collected in the Orbitrap following higher-energy collision dissociation (HCD; resolution – 50,000; AGC – 250%; normalized collision energy – 36; isolation window – 0.5 Th; maximum ion injection time – 100 ms.
Co-IP Mass Spectrometry Data Analysis - Database searching included all entries from the rat UniProt Database (downloaded in June 2022). The database was concatenated with one composed of all protein sequences for that database in the reversed order [75]. Raw files were converted to mzXML, and monoisotopic peaks were re-assigned using Monocle [76]. Searches were performed with Comet [77] using a 50-ppm precursor ion tolerance and fragment bin tolerance of 0.02. TMTPro labels on lysine residues and peptide N-termini (+304.207 Da), as well as carbamidomethylation of cysteine residues (+57.021 Da) were set as static modifications, while oxidation of methionine residues (+15.995 Da) was set as a variable modification. Peptide-spectrum matches (PSMs) were adjusted to a 1% false discovery rate (FDR) using a linear discriminant after which proteins were assembled further to a final protein-level FDR of 1% analysis [78]. TMT reporter ion intensities were measured using a 0.003 Da window around the theoretical m/z for each reporter ion. Proteins were quantified by summing reporter ion counts across all matching PSMs. More specifically, reporter ion intensities were adjusted to correct for the isotopic impurities of the different TMTPro reagents according to manufacturer specifications. Peptides were filtered to exclude those with a summed signal-to-noise (SN) < 180 across all TMT channels and < 0.5 precursor isolation specificity. The signal-to-noise (S/N) measurements of peptides assigned to each protein were summed (for a given protein). Data analysis based on the CRYAB CoIP raw spectrum file found in the MassIVE databased accession number MSV000097115.
Global Sample Preparation for Mass Spectrometry – CRYAB mouse heart samples for protein analysis were prepared essentially as previously described [79,80]. Proteomes were extracted using a buffer containing 200 mM EPPS pH 8.5, 8M urea, 0.1% SDS and protease inhibitors. Following lysis, 150 µg of each proteome was reduced with 5 mM TCEP. Cysteine residues were alkylated using 10 mM iodoacetamide for 20 minutes at RT in the dark. Excess iodoacetamide was quenched with 10 mM DTT. A buffer exchange was carried out using a modified SP3 protocol [73]. Briefly, ~1500 µg of Cytiva SpeedBead Magnetic Carboxylate Modified Particles (65152105050250 and 4515210505250), mixed at a 1:1 ratio, were added to each sample. 100% ethanol was added to each sample to achieve a final ethanol concentration of at least 50%. Samples were incubated with gentle shaking for 15 minutes. Samples were washed three times with 80% ethanol. Protein was eluted from SP3 beads using 200 mM EPPS pH 8.5 containing Lys-C (Wako, 129-02541). Samples were digested overnight at room temperature with vigorous shaking. The next morning trypsin (ThermoFisher Scientific) was added to each sample and further incubated for 6 hours at 37º C. Following digestion, an equal volume of each sample was pooled to generate a pooled sample to be used as a bridge between two TMTPro 16-plex experiments. Acetonitrile was added to each sample to achieve a final concentration of ~33%. Each sample was labelled, in the presence of SP3 beads, with ~300 µg of TMTPro reagents (ThermoFisher Scientific). Following confirmation of satisfactory labelling (>97%), excess TMT was quenched by addition of hydroxylamine to a final concentration of 0.3%. The full volume from each sample was pooled and acetonitrile was removed by vacuum centrifugation for 1 hour. The pooled sample was acidified, and peptides were de-salted using a Sep-Pak 50mg tC18 cartridge (Waters). Peptides were eluted in 70% acetonitrile, 1% formic acid and dried by vacuum centrifugation.
Global Sample Phosphopeptide Enrichment - A phosphopeptide enrichment was performed using a High-Select Fe-NTA Phosphopeptide Enrichment Kit (ThermoFisher Scientific). Dried phosphopeptides were de-salted by Stage-Tip and re-dissolved in 5% formic acid/5% acetonitrile for LC-MS/MS. The flow through from the phosphopeptide enrichment was used for total proteome profiling.
Global Sample Basic pH Reversed-phase Separation (BPRP) - TMT labeled peptides were solubilized in 5% acetonitrile/10 mM ammonium bicarbonate, pH 8.0 and ~300 µg of TMT labeled peptides were separated by an Agilent 300 Extend C18 column (3.5 μm particles, 4.6 mm ID and 250 mm in length). An Agilent 1260 binary pump coupled with a photodiode array (PDA) detector (Thermo Scientific) was used to separate the peptides. A 45-minute linear gradient from 10% to 40% acetonitrile in 10 mM ammonium bicarbonate pH 8.0 (flow rate of 0.6 mL/min) separated the peptide mixtures into a total of 96 fractions (36 seconds). A total of 96 Fractions were consolidated into 24 samples in a checkerboard fashion and vacuum dried to completion. Each sample was desalted via Stage Tips and re-dissolved in 5% formic acid/ 5% acetonitrile for LC-MS3 analysis.
Global Sample Liquid Chromatography Separation and Tandem Mass Spectrometry (LC-MS2) for Proteomics - Proteome data were collected on an Orbitrap Fusion Lumos or Orbitrap Eclipse mass spectrometer (ThermoFisher Scientific) coupled to a Proxeon EASY-nLC 1000 LC pump (ThermoFisher Scientific). Fractionated peptides were separated using a 120 min gradient at 525-650 nL/min on a 35 cm column (i.d. 100 μm, Accucore, 2.6 μm, 150 Å) packed in-house. MS1 data were collected in the Orbitrap (Fusion Lumos - 120,000 resolution; maximum injection time 50 ms; AGC 6 × 10⁵; Eclipse - 60,000 resolution; maximum injection time 50 ms; AGC 4 × 10⁵). Charge states between 2 and 6 (Fusion Lumos) or 2 and 5 (Eclipse) were required for MS2 analysis, and a 120 s dynamic exclusion window was used. Top 10 MS2 scans were performed in the ion trap with CID fragmentation (Fusion Lumos - isolation window 0.5 Da; Rapid; NCE 35%; maximum injection time 50 ms; AGC 1.5 × 10⁴; Eclipse - isolation window 0.5 Da; Turbo; NCE 35%; maximum injection time 50 ms; AGC 1 × 10⁴). For data collected on the Fusion Lumos, an on-line real-time search algorithm (Orbiter) was used to trigger MS3 scans for quantification [81]. MS3 scans were collected in the Orbitrap using a resolution of 50,000, NCE of 55%, maximum injection time of 200 ms, and AGC of 3.0 × 10⁵. The close out was set at two peptides per protein per fraction [81]. For data collected on the Eclipse, real-time search was used to trigger MS3 scans for quantification [81]. MS3 scans were collected in the Orbitrap using a resolution of 50,000, NCE of 55%, maximum injection time of 250 ms, and AGC of 1.25 × 10⁵. The close out was set at two peptides per protein per fraction [81].
Global Sample Liquid Chromatography Separation and Tandem Mass Spectrometry (LC-MS2) for Phosphoproteomics - Phosphorylation data were collected on an Orbitrap Eclipse mass spectrometer (ThermoFisher Scientific) coupled to a Proxeon EASY-nLC 1000 LC pump (ThermoFisher Scientific). Fractionated peptides were separated using a 120 min gradient at 525 nL/min on a 35 cm column (i.d. 100 μm, Accucore, 2.6 μm, 150 Å) packed in-house. A FAIMS device enabled during data acquisition with compensation voltages set as −40, −60, and −80 V for the first shot and −45 and −65 V for the second shot [74]. MS1 data were collected in the Orbitrap (120,000 resolution; maximum injection time set to auto; AGC 4 × 10⁵). Charge states between 2 and 5 were required for MS2 analysis, and a 120 second dynamic exclusion window was used. The cycle time was set at 1 second. MS2 scans were performed in the Orbitrap with HCD fragmentation (isolation window 0.5 Da; 50,000 resolution; NCE 36%; maximum injection time 300 ms; AGC 2 × 10⁵).
Global Sample Data Analysis - Raw files were converted to mzXML, and monoisotopic peaks were re-assigned using Monocle [76]. Searches were performed using the Comet search algorithm against a mouse database downloaded from Uniprot in May 2021. We used a 50-ppm precursor ion tolerance, 1.0005 fragment ion tolerance, and 0.4 fragment bin offset for MS2 scans collected in the ion trap, and 0.02 fragment ion tolerance; 0.00 fragment bin offset for MS2 scans collected in the Orbitrap. TMTPro on lysine residues and peptide N-termini (+304.2071 Da) and carbamidomethylation of cysteine residues (+57.0215 Da) were set as static modifications, while oxidation of methionine residues (+15.9949 Da) was set as a variable modification. For phosphorylated peptide analysis, +79.9663 Da was set as a variable modification on serine, threonine, and tyrosine residues. Each run was filtered separately to 1% False Discovery Rate (FDR) on the peptide-spectrum match (PSM) level. Then proteins were filtered to the target 1% FDR level across the entire combined data set. Phosphorylation site localization was determined using the AScorePro algorithm [82]. For reporter ion quantification, a 0.003 Da window around the theoretical m/z of each reporter ion was scanned, and the most intense m/z was used. Reporter ion intensities were adjusted to correct for isotopic impurities of the different TMTPro reagents according to manufacturer specifications. Peptides were filtered to include only those with a summed signal-to-noise (SN) ≥ 170 or 180 across all TMT channels. An extra filter of an isolation specificity (“isolation purity”) of at least 0.5 in the MS1 isolation window was applied for the phosphorylated peptide analysis. For each protein or phosphorylation site, the filtered peptide TMTPro SN values were summed to generate protein or phosphorylation site quantification values. The signal-to-noise (S/N) measurements of peptides assigned to each protein were summed (for a given protein). These values were normalized so that the sum of the signal for all proteins in each channel was equivalent thereby accounting for equal protein loading. The resulting normalization factors were used to normalize the phosphorylation sites, again accounting for equal protein loading. Data analysis based on the CRYAB NonTAC Proteome 1-12 and Phospho 1-2 raw spectrum files and the CRYAB TAC Proteome 1-12 and Phospho 1-3 raw spectrum files found in the MassIVE database accession number MSV000097115.
Cardiomyocyte Isolation and IonOptix – Wild type Cryab and CryabR123W mouse hearts were extracted, and single ventricular cardiomyocytes were isolated using the O’Connell and Simpson modification method and apparatus as previously described [83,84,85,86]. Single cardiomyocyte calcium transient and contraction dynamics were captured and analyzed using IonOptix equipment and software as previously described [85].
Data and Statistical Analysis – All bar plots, volcano plots, GO term plots and heat maps were prepared in R [54] using the following packages: ggplot2, dplyr, reshape2, ggpubr, tidyverse, RColorBrewer, ggrepel, clusterProfiler, DOSE, org.Mm.eg.db, enrichplot, ggupset, and pheatmap [87,88,89,90,91,92,93,94,95,96,97,98,99]. Global proteomic and phosphoproteomic data was analyzed using QIAGEN Ingenuity Pathway Analysis software (IPA) [55]. All statistical measurements are shown as mean +/- standard deviation. All p-values were calculated using Student T Test for 2 group comparisons and by two-way ANOVA for multi-group comparisons.
Author Contributions
Conceptualization, M.C., A.Th. and C.C.; methodology, A.Th., C.C. and A.Tr.; software, A.Th. and A.Tr.; validation, A.Th.; formal analysis, A.T. and A.Tr.; investigation, A.Th., S.A., A.Tr. and C.C.; resources, M.C.; data curation, A.Th..; writing—original draft preparation, A.Th.; writing—review and editing, A.Th. and M.C..; visualization, A.Th.; supervision, M.C. and J.G.; project administration, M.C.; funding acquisition, M.C. All authors have read and agreed to the published version of the manuscript.
Funding
This research received no external funding.
Institutional Review Board Statement
The animal study protocol was approved by the Institutional Animal Care and Use Committee of Tufts University (protocol code B2023-10, approval date March 9, 2023).
Informed Consent Statement
Not applicable.
Data Availability Statement
All proteomic data has been deposited in MassIVE under accession number MSV000097115.
Acknowledgments
We would like to acknowledge the Harvard Thermo Fisher Scientific Center for Multiplexed Proteomics role in our mass spectrometry experiments.
Conflicts of Interest
The authors declare no conflict of interest. The funders had no role in the design of the study; in the collection, analyses, or interpretation of data; in the writing of the manuscript; or in the decision to publish the results.
References
- Maron BJ. Hypertrophic cardiomyopathy: a systematic review. JAMA. 2002 Mar 13;287(10):1308-20. [CrossRef] [PubMed]
- Marian AJ, Roberts R. The molecular genetic basis for hypertrophic cardiomyopathy. J Mol Cell Cardiol. 2001 Apr;33(4):655-70. [CrossRef] [PubMed] [PubMed Central]
- Marian AJ. Modifier genes for hypertrophic cardiomyopathy. Curr Opin Cardiol. 2002 May;17(3):242-52. [CrossRef] [PubMed] [PubMed Central]
- Geisterfer-Lowrance AA, Kass S, Tanigawa G, Vosberg HP, McKenna W, Seidman CE, Seidman JG. A molecular basis for familial hypertrophic cardiomyopathy: a beta cardiac myosin heavy chain gene missense mutation. Cell. 1990 Sep 7;62(5):999-1006. [CrossRef] [PubMed]
- Watkins H, MacRae C, Thierfelder L, Chou YH, Frenneaux M, McKenna W, Seidman JG, Seidman CE. A disease locus for familial hypertrophic cardiomyopathy maps to chromosome 1q3. Nat Genet. 1993 Apr;3(4):333-7. [CrossRef] [PubMed]
- Thierfelder L, Watkins H, MacRae C, Lamas R, McKenna W, Vosberg HP, Seidman JG, Seidman CE. Alpha-tropomyosin and cardiac troponin T mutations cause familial hypertrophic cardiomyopathy: a disease of the sarcomere. Cell. 1994 Jun 3;77(5):701-12. [CrossRef] [PubMed]
- Seidman CE, Seidman JG. Identifying sarcomere gene mutations in hypertrophic cardiomyopathy: a personal history. Circ Res. 2011 Mar 18;108(6):743-50. [CrossRef] [PubMed] [PubMed Central]
- Watkins H, Ashrafian H, Redwood C. Inherited cardiomyopathies. N Engl J Med. 2011 Apr 28;364(17):1643-56. [CrossRef] [PubMed]
- Maron BJ, Maron MS. Hypertrophic cardiomyopathy. Lancet. 2013 Jan 19;381(9862):242-55. Epub 2012 Aug 6. [CrossRef] [PubMed]
- Maron BJ, Maron MS, Maron BA, Loscalzo J. Moving Beyond the Sarcomere to Explain Heterogeneity in Hypertrophic Cardiomyopathy: JACC Review Topic of the Week. J Am Coll Cardiol. 2019 Apr 23;73(15):1978-1986. [CrossRef] [PubMed] [PubMed Central]
- Ingles J, Burns C, Bagnall RD, Lam L, Yeates L, Sarina T, Puranik R, Briffa T, Atherton JJ, Driscoll T, Semsarian C. Nonfamilial Hypertrophic Cardiomyopathy: Prevalence, Natural History, and Clinical Implications. Circ Cardiovasc Genet. 2017 Apr;10(2):e001620. [CrossRef] [PubMed]
- Gerull B, Klaassen S, Brodehl A. The genetic landscape of cardiomyopathies. Genetic Causes of Cardiac Disease. (2019):45–91. [CrossRef]
- Vicart P, Caron A, Guicheney P, Li Z, Prévost MC, Faure A, Chateau D, Chapon F, Tomé F, Dupret JM, Paulin D, Fardeau M. A missense mutation in the alphaB-crystallin chaperone gene causes a desmin-related myopathy. Nat Genet. 1998 Sep;20(1):92-5. [CrossRef] [PubMed]
- Kumarapeli AR, Su H, Huang W, Tang M, Zheng H, Horak KM, Li M, Wang X. Alpha B-crystallin suppresses pressure overload cardiac hypertrophy. Circ Res. 2008 Dec 5;103(12):1473-82. Epub 2008 Oct 30. [CrossRef] [PubMed] [PubMed Central]
- Bennardini F, Wrzosek A, Chiesi M. Alpha B-crystallin in cardiac tissue. Association with actin and desmin filaments. Circ Res. 1992 Aug;71(2):288-94. [CrossRef] [PubMed]
- Nicholl ID, Quinlan RA. Chaperone activity of alpha-crystallins modulates intermediate filament assembly. EMBO J. 1994 Feb 15;13(4):945-53. [CrossRef] [PubMed] [PubMed Central]
- Wang K, Spector A. alpha-crystallin stabilizes actin filaments and prevents cytochalasin-induced depolymerization in a phosphorylation-dependent manner. Eur J Biochem. 1996 Nov 15;242(1):56-66. [CrossRef] [PubMed]
- Tannous P, Zhu H, Johnstone JL, Shelton JM, Rajasekaran NS, Benjamin IJ, Nguyen L, Gerard RD, Levine B, Rothermel BA, Hill JA. Autophagy is an adaptive response in desmin-related cardiomyopathy. Proc Natl Acad Sci U S A. 2008 Jul 15;105(28):9745-50. Epub 2008 Jul 9. [CrossRef] [PubMed] [PubMed Central]
- Bhuiyan MS, Pattison JS, Osinska H, James J, Gulick J, McLendon PM, Hill JA, Sadoshima J, Robbins J. Enhanced autophagy ameliorates cardiac proteinopathy. J Clin Invest. 2013 Dec;123(12):5284-97. Epub 2013 Nov 1. [CrossRef] [PubMed] [PubMed Central]
- Mitra A, Basak T, Datta K, Naskar S, Sengupta S, Sarkar S. Role of α-crystallin B as a regulatory switch in modulating cardiomyocyte apoptosis by mitochondria or endoplasmic reticulum during cardiac hypertrophy and myocardial infarction. Cell Death Dis. 2013 Apr 4;4(4):e582. [CrossRef] [PubMed] [PubMed Central]
- Chis R, Sharma P, Bousette N, Miyake T, Wilson A, Backx PH, Gramolini AO. α-Crystallin B prevents apoptosis after H2O2 exposure in mouse neonatal cardiomyocytes. Am J Physiol Heart Circ Physiol. 2012 Oct 15;303(8):H967-78. Epub 2012 Aug 17. [CrossRef] [PubMed] [PubMed Central]
- Bagnéris C, Bateman OA, Naylor CE, Cronin N, Boelens WC, Keep NH, Slingsby C. Crystal structures of alpha-crystallin domain dimers of alphaB-crystallin and Hsp20. J Mol Biol. 2009 Oct 9;392(5):1242-52. Epub 2009 Jul 30. Erratum in: J Mol Biol. 2009 Dec 4;394(3):588. [CrossRef] [PubMed]
- Laganowsky A, Benesch JL, Landau M, Ding L, Sawaya MR, Cascio D, Huang Q, Robinson CV, Horwitz J, Eisenberg D. Crystal structures of truncated alphaA and alphaB crystallins reveal structural mechanisms of polydispersity important for eye lens function. Protein Sci. 2010 May;19(5):1031-43. [CrossRef] [PubMed] [PubMed Central]
- Mchaourab HS, Godar JA, Stewart PL. Structure and mechanism of protein stability sensors: chaperone activity of small heat shock proteins. Biochemistry. (2009) 48:3828–37. [CrossRef]
- Ito H, Okamoto K, Nakayama H, Isobe T, Kato K. Phosphorylation of alphaB-crystallin in response to various types of stress. J Biol Chem. 1997 Nov 21;272(47):29934-41. [CrossRef] [PubMed]
- Sacconi S, Féasson L, Antoine JC, Pécheux C, Bernard R, Cobo AM, Casarin A, Salviati L, Desnuelle C, Urtizberea A. A novel CRYAB mutation resulting in multisystemic disease. Neuromuscul Disord. 2012 Jan;22(1):66-72. Epub 2011 Sep 14. [CrossRef] [PubMed]
- Brodehl A, Gaertner-Rommel A, Klauke B, Grewe SA, Schirmer I, Peterschröder A, Faber L, Vorgerd M, Gummert J, Anselmetti D, Schulz U, Paluszkiewicz L, Milting H. The novel αB-crystallin (CRYAB) mutation p.D109G causes restrictive cardiomyopathy. Hum Mutat. 2017 Aug;38(8):947-952. Epub 2017 Jun 21. [CrossRef] [PubMed]
- van Spaendonck-Zwarts KY, van Hessem L, Jongbloed JD, de Walle HE, Capetanaki Y, van der Kooi AJ, van Langen IM, van den Berg MP, van Tintelen JP. Desmin-related myopathy. Clin Genet. 2011 Oct;80(4):354-66. Epub 2010 Jul 21. [CrossRef] [PubMed]
- Wang X, Osinska H, Klevitsky R, Gerdes AM, Nieman M, Lorenz J, Hewett T, Robbins J. Expression of R120G-alphaB-crystallin causes aberrant desmin and alphaB-crystallin aggregation and cardiomyopathy in mice. Circ Res. 2001 Jul 6;89(1):84-91. [CrossRef] [PubMed]
- Bova MP, Yaron O, Huang Q, Ding L, Haley DA, Stewart PL, Horwitz J. Mutation R120G in alphaB-crystallin, which is linked to a desmin-related myopathy, results in an irregular structure and defective chaperone-like function. Proc Natl Acad Sci U S A. 1999 May 25;96(11):6137-42. [CrossRef] [PubMed] [PubMed Central]
- Maron BJ, Rowin EJ, Arkun K, Rastegar H, Larson AM, Maron MS, Chin MT. Adult Monozygotic Twins With Hypertrophic Cardiomyopathy and Identical Disease Expression and Clinical Course. Am J Cardiol. 2020 Jul 15;127:135-138. Epub 2020 Apr 23. [CrossRef] [PubMed]
- Chou C, Martin GL, Perera G, Awata J, Larson A, Blanton R, Chin MT. A novel αB-crystallin R123W variant drives hypertrophic cardiomyopathy by promoting maladaptive calcium-dependent signal transduction. Front Cardiovasc Med. 2023 Jun 26;10:1223244. Erratum in: Front Cardiovasc Med. 2024 Aug 16;11:1455263. 10.3389/fcvm.2024.1455263. [CrossRef] [PubMed] [PubMed Central]
- Somee LR, Barati A, Shahsavani MB, Hoshino M, Hong J, Kumar A, Moosavi-Movahedi AA, Amanlou M, Yousefi R. Understanding the structural and functional changes and biochemical pathomechanism of the cardiomyopathy-associated p.R123W mutation in human αB-crystallin. Biochim Biophys Acta Gen Subj. 2024 Apr;1868(4):130579. Epub 2024 Feb 1. [CrossRef] [PubMed]
- Jumper J, Evans R, Pritzel A, Green T, Figurnov M, Ronneberger O, Tunyasuvunakool K, Bates R, Žídek A, Potapenko A, Bridgland A, Meyer C, Kohl SAA, Ballard AJ, Cowie A, Romera-Paredes B, Nikolov S, Jain R, Adler J, Back T, Petersen S, Reiman D, Clancy E, Zielinski M, Steinegger M, Pacholska M, Berghammer T, Bodenstein S, Silver D, Vinyals O, Senior AW, Kavukcuoglu K, Kohli P, Hassabis D. Highly accurate protein structure prediction with AlphaFold. Nature. 2021 Aug;596(7873):583-589. Epub 2021 Jul 15. [CrossRef] [PubMed] [PubMed Central]
- Evans R, O’Neill M, Pritzel A, Antropova N, Senior A, Green T, Žídek A, Bates R, Blackwell S, Yim J, Ronneberger O, Bodenstein S, Zielinski M, Bridgland A, Potapenko A, Cowie A, Tunyasuvunakool K, Jain R, Clancy E, Kohli P, Jumper J, Hassabis D. Protein complex prediction with AlphaFold-Multimer. bioRxiv. (2021) doi:2021.10.04.463034.
- Varadi M, Bertoni D, Magana P, Paramval U, Pidruchna I, Radhakrishnan M, Tsenkov M, Nair S, Mirdita M, Yeo J, Kovalevskiy O, Tunyasuvunakool K, Laydon A, Žídek A, Tomlinson H, Hariharan D, Abrahamson J, Green T, Jumper J, Birney E, Steinegger M, Hassabis D, Velankar S. AlphaFold Protein Structure Database in 2024: providing structure coverage for over 214 million protein sequences. Nucleic Acids Res. 2024 Jan 5;52(D1):D368-D375. [CrossRef] [PubMed] [PubMed Central]
- Varadi M, Anyango S, Deshpande M, Nair S, Natassia C, Yordanova G, Yuan D, Stroe O, Wood G, Laydon A, Žídek A, Green T, Tunyasuvunakool K, Petersen S, Jumper J, Clancy E, Green R, Vora A, Lutfi M, Figurnov M, Cowie A, Hobbs N, Kohli P, Kleywegt G, Birney E, Hassabis D, Velankar S. AlphaFold Protein Structure Database: massively expanding the structural coverage of protein-sequence space with high-accuracy models. Nucleic Acids Res. 2022 Jan 7;50(D1):D439-D444. [CrossRef] [PubMed] [PubMed Central]
- Meng EC, Goddard TD, Pettersen EF, Couch GS, Pearson ZJ, Morris JH, Ferrin TE. UCSF ChimeraX: Tools for structure building and analysis. Protein Sci. 2023 Nov;32(11):e4792. [CrossRef] [PubMed] [PubMed Central]
- Thorkelsson A, Chin MT. Role of the Alpha-B-Crystallin Protein in Cardiomyopathic Disease. Int J Mol Sci. 2024 Feb 29;25(5):2826. [CrossRef] [PubMed] [PubMed Central]
- Pope RK, Pestonjamasp KN, Smith KP, Wulfkuhle JD, Strassel CP, Lawrence JB, Luna EJ. Cloning, characterization, and chromosomal localization of human superillin (SVIL). Genomics. 1998 Sep 15;52(3):342-51. [CrossRef] [PubMed]
- Maul RS, Song Y, Amann KJ, Gerbin SC, Pollard TD, Chang DD. EPLIN regulates actin dynamics by cross-linking and stabilizing filaments. J Cell Biol. 2003 Feb 3;160(3):399-407. [CrossRef] [PubMed] [PubMed Central]
- Filippakopoulos P, Picaud S, Mangos M, Keates T, Lambert JP, Barsyte-Lovejoy D, Felletar I, Volkmer R, Müller S, Pawson T, Gingras AC, Arrowsmith CH, Knapp S. Histone recognition and large-scale structural analysis of the human bromodomain family. Cell. 2012 Mar 30;149(1):214-31. [CrossRef] [PubMed] [PubMed Central]
- Oltion K, Carelli JD, Yang T, See SK, Wang HY, Kampmann M, Taunton J. An E3 ligase network engages GCN1 to promote the degradation of translation factors on stalled ribosomes. Cell. 2023 Jan 19;186(2):346-362.e17. Epub 2023 Jan 12. [CrossRef] [PubMed] [PubMed Central]
- Li X, Yang L, Chen S, Zheng J, Zhang H, Ren L. Multiple Roles of TRIM21 in Virus Infection. Int J Mol Sci. 2023 Jan 14;24(2):1683. [CrossRef] [PubMed] [PubMed Central]
- Asher G, Tsvetkov P, Kahana C, Shaul Y. A mechanism of ubiquitin-independent proteasomal degradation of the tumor suppressors p53 and p73. Genes Dev. 2005 Feb 1;19(3):316-21. [CrossRef] [PubMed] [PubMed Central]
- Burger A, Berendes R, Liemann S, Benz J, Hofmann A, Göttig P, Huber R, Gerke V, Thiel C, Römisch J, Weber K. The crystal structure and ion channel activity of human annexin II, a peripheral membrane protein. J Mol Biol. 1996 Apr 12;257(4):839-47. [CrossRef] [PubMed]
- Barefield D, Kumar M, Gorham J, Seidman JG, Seidman CE, de Tombe PP, Sadayappan S. Haploinsufficiency of MYBPC3 exacerbates the development of hypertrophic cardiomyopathy in heterozygous mice. J Mol Cell Cardiol. 2015 Feb;79:234-43. Epub 2014 Nov 25. [CrossRef] [PubMed] [PubMed Central]
- Vikstrom KL, Factor SM, Leinwand LA. Mice expressing mutant myosin heavy chains are a model for familial hypertrophic cardiomyopathy. Mol Med. 1996 Sep;2(5):556-67. [PubMed] [PubMed Central]
- Ertz-Berger BR, He H, Dowell C, Factor SM, Haim TE, Nunez S, Schwartz SD, Ingwall JS, Tardiff JC. Changes in the chemical and dynamic properties of cardiac troponin T cause discrete cardiomyopathies in transgenic mice. Proc Natl Acad Sci U S A. 2005 Dec 13;102(50):18219-24. Epub 2005 Dec 2. [CrossRef] [PubMed] [PubMed Central]
- Lowey S, Lesko LM, Rovner AS, Hodges AR, White SL, Low RB, Rincon M, Gulick J, Robbins J. Functional effects of the hypertrophic cardiomyopathy R403Q mutation are different in an alpha- or beta-myosin heavy chain backbone. J Biol Chem. 2008 Jul 18;283(29):20579-89. Epub 2008 May 13. [CrossRef] [PubMed] [PubMed Central]
- Vakrou S, Fukunaga R, Foster DB, Sorensen L, Liu Y, Guan Y, Woldemichael K, Pineda-Reyes R, Liu T, Tardiff JC, Leinwand LA, Tocchetti CG, Abraham TP, O'Rourke B, Aon MA, Abraham MR. Allele-specific differences in transcriptome, miRNome, and mitochondrial function in two hypertrophic cardiomyopathy mouse models. JCI Insight. 2018 Mar 22;3(6):e94493. [CrossRef] [PubMed] [PubMed Central]
- Marstrand P, Han L, Day SM, Olivotto I, Ashley EA, Michels M, Pereira AC, Wittekind SG, Helms A, Saberi S, Jacoby D, Ware JS, Colan SD, Semsarian C, Ingles J, Lakdawala NK, Ho CY; SHaRe Investigators. Hypertrophic Cardiomyopathy With Left Ventricular Systolic Dysfunction: Insights From the SHaRe Registry. Circulation. 2020 Apr 28;141(17):1371-1383. Epub 2020 Mar 31. [CrossRef] [PubMed] [PubMed Central]
- Beltrami M, Bartolini S, Pastore MC, Milli M, Cameli M. Relationship between measures of left ventricular systolic and diastolic dysfunction and clinical and biomarker status in patients with hypertrophic cardiomyopathy. Arch Cardiovasc Dis. 2022 Nov;115(11):598-609. Epub 2022 Sep 29. [CrossRef] [PubMed]
- R Core Team (2024). _R: A Language and Environment for Statistical Computing_. R Foundation for Statistical Computing, Vienna, Austria. <https://www.R-project.org/>.
- Krämer A, Green J, Pollard J Jr, Tugendreich S. Causal analysis approaches in Ingenuity Pathway Analysis. Bioinformatics. 2014 Feb 15;30(4):523-30. Epub 2013 Dec 13. [CrossRef] [PubMed]
- Perrino BA. Regulation of calcineurin phosphatase activity by its autoinhibitory domain. Arch Biochem Biophys. 1999 Dec 1;372(1):159-65. [CrossRef] [PubMed]
- Chou C, Chin MT. Pathogenic Mechanisms of Hypertrophic Cardiomyopathy beyond Sarcomere Dysfunction. Int J Mol Sci. 2021 Aug 19;22(16):8933. [CrossRef] [PubMed] [PubMed Central]
- Golenhofen N, Ness W, Koob R, Htun P, Schaper W, Drenckhahn D. Ischemia-induced phosphorylation and translocation of stress protein alpha B-crystallin to Z lines of myocardium. Am J Physiol. 1998 May;274(5):H1457-64. [CrossRef] [PubMed]
- Maksimiuk M, Sobiborowicz A, Tuzimek A, Deptała A, Czerw A, Badowska-Kozakiewicz AM. αB-crystallin as a promising target in pathological conditions - A review. Ann Agric Environ Med. 2020 Sep 11;27(3):326-334. Epub 2019 Sep 6. [CrossRef] [PubMed]
- Head MW, Hurwitz L, Kegel K, Goldman JE. AlphaB-crystallin regulates intermediate filament organization in situ. Neuroreport. 2000 Feb 7;11(2):361-5. [CrossRef] [PubMed]
- Rothbard JB, Kurnellas MP, Brownell S, Adams CM, Su L, Axtell RC, Chen R, Fathman CG, Robinson WH, Steinman L. Therapeutic effects of systemic administration of chaperone αB-crystallin associated with binding proinflammatory plasma proteins. J Biol Chem. 2012 Mar 23;287(13):9708-9721. Epub 2012 Feb 3. [CrossRef] [PubMed] [PubMed Central]
- Xu W, Guo Y, Huang Z, Zhao H, Zhou M, Huang Y, Wen D, Song J, Zhu Z, Sun M, Liu CY, Chen Y, Cui L, Wang X, Liu Z, Yang Y, Du P. Small heat shock protein CRYAB inhibits intestinal mucosal inflammatory responses and protects barrier integrity through suppressing IKKβ activity. Mucosal Immunol. 2019 Nov;12(6):1291-1303. Epub 2019 Sep 3. [CrossRef] [PubMed]
- Arac A, Brownell SE, Rothbard JB, Chen C, Ko RM, Pereira MP, Albers GW, Steinman L, Steinberg GK. Systemic augmentation of alphaB-crystallin provides therapeutic benefit twelve hours post-stroke onset via immune modulation. Proc Natl Acad Sci U S A. 2011 Aug 9;108(32):13287-92. Epub 2011 Jul 26. [CrossRef] [PubMed] [PubMed Central]
- Velotta JB, Kimura N, Chang SH, Chung J, Itoh S, Rothbard J, Yang PC, Steinman L, Robbins RC, Fischbein MP. αB-crystallin improves murine cardiac function and attenuates apoptosis in human endothelial cells exposed to ischemia-reperfusion. Ann Thorac Surg. 2011 Jun;91(6):1907-13. [CrossRef] [PubMed]
- Helms AS, Alvarado FJ, Yob J, Tang VT, Pagani F, Russell MW, Valdivia HH, Day SM. Genotype-Dependent and -Independent Calcium Signaling Dysregulation in Human Hypertrophic Cardiomyopathy. Circulation. 2016 Nov 29;134(22):1738-1748. Epub 2016 Sep 29. [CrossRef] [PubMed] [PubMed Central]
- Coppini R, Ferrantini C, Mugelli A, Poggesi C, Cerbai E. Altered Ca2+ and Na+ Homeostasis in Human Hypertrophic Cardiomyopathy: Implications for Arrhythmogenesis. Front Physiol. 2018 Oct 16;9:1391. [CrossRef] [PubMed] [PubMed Central]
- Wilkins BJ, Dai YS, Bueno OF, Parsons SA, Xu J, Plank DM, Jones F, Kimball TR, Molkentin JD. Calcineurin/NFAT coupling participates in pathological, but not physiological, cardiac hypertrophy. Circ Res. 2004 Jan 9;94(1):110-8. Epub 2003 Dec 1. [CrossRef] [PubMed]
- Golden RJ, Chen B, Li T, Braun J, Manjunath H, Chen X, Wu J, Schmid V, Chang TC, Kopp F, Ramirez-Martinez A, Tagliabracci VS, Chen ZJ, Xie Y, Mendell JT. An Argonaute phosphorylation cycle promotes microRNA-mediated silencing. Nature. 2017 Feb 9;542(7640):197-202. Epub 2017 Jan 23. [CrossRef] [PubMed] [PubMed Central]
- Gibson DG, Young L, Chuang RY, Venter JC, Hutchison CA 3rd, Smith HO. Enzymatic assembly of DNA molecules up to several hundred kilobases. Nat Methods. 2009 May;6(5):343-5. Epub 2009 Apr 12. [CrossRef] [PubMed]
- Froger A, Hall JE. Transformation of plasmid DNA into E. coli using the heat shock method. J Vis Exp. 2007;(6):253. doi: 10.3791/253. Epub 2007 Aug 1. [PubMed] [PubMed Central]
- Dull T, Zufferey R, Kelly M, Mandel RJ, Nguyen M, Trono D, et al. A third-generation lentivirus vector with a conditional packaging system. J Virol. (1998) 72:8463–71. [CrossRef]
- Richards DA, Aronovitz MJ, Calamaras TD, Tam K, Martin GL, Liu P, Bowditch HK, Zhang P, Huggins GS, Blanton RM. Distinct Phenotypes Induced by Three Degrees of Transverse Aortic Constriction in Mice. Sci Rep. 2019 Apr 10;9(1):5844. [CrossRef] [PubMed] [PubMed Central]
- Hughes CS, Moggridge S, Müller T, Sorensen PH, Morin GB, Krijgsveld J. Single-pot, solid-phase-enhanced sample preparation for proteomics experiments. Nat Protoc. 2019 Jan;14(1):68-85. [CrossRef] [PubMed]
- Schweppe DK, Prasad S, Belford MW, Navarrete-Perea J, Bailey DJ, Huguet R, Jedrychowski MP, Rad R, McAlister G, Abbatiello SE, Woulters ER, Zabrouskov V, Dunyach JJ, Paulo JA, Gygi SP. Characterization and Optimization of Multiplexed Quantitative Analyses Using High-Field Asymmetric-Waveform Ion Mobility Mass Spectrometry. Anal Chem. 2019 Mar 19;91(6):4010-4016. Epub 2019 Feb 26. Erratum in: Anal Chem. 2020 Mar 17;92(6):4690. 10.1021/acs.analchem.0c00888. [CrossRef] [PubMed] [PubMed Central]
- Elias JE, Gygi SP. Target-decoy search strategy for increased confidence in large-scale protein identifications by mass spectrometry. Nat Methods. 2007 Mar;4(3):207-14. [CrossRef] [PubMed]
- Rad R, Li J, Mintseris J, O'Connell J, Gygi SP, Schweppe DK. Improved Monoisotopic Mass Estimation for Deeper Proteome Coverage. J Proteome Res. 2021 Jan 1;20(1):591-598. Epub 2020 Nov 16. [CrossRef] [PubMed]
- Eng JK, Jahan TA, Hoopmann MR. Comet: an open-source MS/MS sequence database search tool. Proteomics. 2013 Jan;13(1):22-4. Epub 2012 Dec 4. [CrossRef] [PubMed]
- Huttlin EL, Jedrychowski MP, Elias JE, Goswami T, Rad R, Beausoleil SA, Villén J, Haas W, Sowa ME, Gygi SP. A tissue-specific atlas of mouse protein phosphorylation and expression. Cell. 2010 Dec 23;143(7):1174-89. [CrossRef] [PubMed] [PubMed Central]
- Navarrete-Perea J, Yu Q, Gygi SP, Paulo JA. Streamlined Tandem Mass Tag (SL-TMT) Protocol: An Efficient Strategy for Quantitative (Phospho)proteome Profiling Using Tandem Mass Tag-Synchronous Precursor Selection-MS3. J Proteome Res. 2018 Jun 1;17(6):2226-2236. Epub 2018 May 16. [CrossRef] [PubMed] [PubMed Central]
- Li J, Cai Z, Bomgarden RD, Pike I, Kuhn K, Rogers JC, Roberts TM, Gygi SP, Paulo JA. TMTpro-18plex: The Expanded and Complete Set of TMTpro Reagents for Sample Multiplexing. J Proteome Res. 2021 May 7;20(5):2964-2972. Epub 2021 Apr 26. [CrossRef] [PubMed] [PubMed Central]
- Schweppe DK, Eng JK, Yu Q, Bailey D, Rad R, Navarrete-Perea J, Huttlin EL, Erickson BK, Paulo JA, Gygi SP. Full-Featured, Real-Time Database Searching Platform Enables Fast and Accurate Multiplexed Quantitative Proteomics. J Proteome Res. 2020 May 1;19(5):2026-2034. [CrossRef] [PubMed] [PubMed Central]
- Gassaway BM, Li J, Rad R, Mintseris J, Mohler K, Levy T, Aguiar M, Beausoleil SA, Paulo JA, Rinehart J, Huttlin EL, Gygi SP. A multi-purpose, regenerable, proteome-scale, human phosphoserine resource for phosphoproteomics. Nat Methods. 2022 Nov;19(11):1371-1375. Epub 2022 Oct 24. [CrossRef] [PubMed] [PubMed Central]
- Sambrano, G. R.; Fraser, I.; Han, H.; Ni, Y.; O'Connell, T.; Yan, Z.; Stull, J. T. , Navigating the signalling network in mouse cardiac myocytes. Nature 2002, 420, (6916), 712–4. [Google Scholar] [CrossRef]
- Xiang, F.; Sakata, Y.; Cui, L.; Youngblood, J. M.; Nakagami, H.; Liao, J. K.; Liao, R.; Chin, M. T. , Transcription factor CHF1/Hey2 suppresses cardiac hypertrophy through an inhibitory interaction with GATA4. Am J Physiol Heart Circ Physiol 2006, 290, (5), H1997–H2006. [Google Scholar] [CrossRef]
- Liu, Y.; Korte, F. S.; Moussavi-Harami, F.; Yu, M.; Razumova, M.; Regnier, M.; Chin, M. T. , Transcription factor CHF1/Hey2 regulates EC coupling and heart failure in mice through regulation of FKBP12. 6. Am J Physiol Heart Circ Physiol 2012, 302, (9), H1860–70. [Google Scholar] [CrossRef]
- O'Connell TD, Rodrigo MC, Simpson PC. Isolation and culture of adult mouse cardiac myocytes. Methods Mol Biol. 2007;357:271-96. [CrossRef] [PubMed]
- H. Wickham. ggplot2: Elegant Graphics for Data Analysis. Springer-Verlag New York, 2016.
- Wickham H, François R, Henry L, Müller K, Vaughan D (2023). _dplyr: A Grammar of Data Manipulation_. R package version 1.1.4, <https://CRAN.R-project.org/package=dplyr>.
- Hadley Wickham (2007). Reshaping Data with the reshape Package. Journal of Statistical Software, 21(12), 1-20. URL http://www.jstatsoft.org/v21/i12/.
- Kassambara A (2023). _ggpubr: 'ggplot2' Based Publication Ready Plots_. R package version 0.6.0, <https://CRAN.R-project.org/package=ggpubr>.
- Wickham H, Averick M, Bryan J, Chang W, McGowan LD, François R, Grolemund G, Hayes A, Henry L, Hester J, Kuhn M, Pedersen TL, Miller E, Bache SM, Müller K, Ooms J, Robinson D, Seidel DP, Spinu V, Takahashi K, Vaughan D, Wilke C, Woo K, Yutani H (2019). “Welcome to the tidyverse.” _Journal of Open Source Software_, *4*(43), 1686. [CrossRef]
- Neuwirth E (2022). _RColorBrewer: ColorBrewer Palettes_. R package version 1.1-3, <https://CRAN.R-project.org/package=RColorBrewer>.
- Slowikowski K (2024). _ggrepel: Automatically Position Non-Overlapping Text Labels with 'ggplot2'_. R package version 0.9.6, <https://CRAN.R-project.org/package=ggrepel>.
- Xu S, Hu E, Cai Y, Xie Z, Luo X, Zhan L, Tang W, Wang Q, Liu B, Wang R, Xie W, Wu T, Xie L, Yu G. Using clusterProfiler to characterize multiomics data. Nat Protoc. 2024 Nov;19(11):3292-3320. Epub 2024 Jul 17. [CrossRef] [PubMed]
- Yu G, Wang LG, Yan GR, He QY. DOSE: an R/Bioconductor package for disease ontology semantic and enrichment analysis. Bioinformatics. 2015 Feb 15;31(4):608-9. Epub 2014 Oct 17. [CrossRef] [PubMed]
- Carlson M (2024). _org.Mm.eg.db: Genome wide annotation for Mouse_. R package version 3.19.1.
- Yu G (2024). _enrichplot: Visualization of Functional Enrichment Result_. R package version 1.24.4, <https://yulab-smu.top/biomedical-knowledge-mining-book/>.
- Ahlmann-Eltze C (2024). _ggupset: Combination Matrix Axis for 'ggplot2' to Create 'UpSet' Plots_. R package version 0.4.0, <https://CRAN.R-project.org/package=ggupset>.
- Kolde R (2019). _pheatmap: Pretty Heatmaps_. R package version 1.0.12, <https://CRAN.R-project.org/package=pheatmap>.
Figure 1.
Calcineurin activity for negative control(Blue) H9C2 cells and H9C2 cells expressing FLAG tagged wild type(Pink), D109G(Red), R120G(Yellow) and R123W CRYAB(Green). CRYABR123W shows a significant increase in calcineurin activity compared to the other CRYAB variants.
Figure 1.
Calcineurin activity for negative control(Blue) H9C2 cells and H9C2 cells expressing FLAG tagged wild type(Pink), D109G(Red), R120G(Yellow) and R123W CRYAB(Green). CRYABR123W shows a significant increase in calcineurin activity compared to the other CRYAB variants.
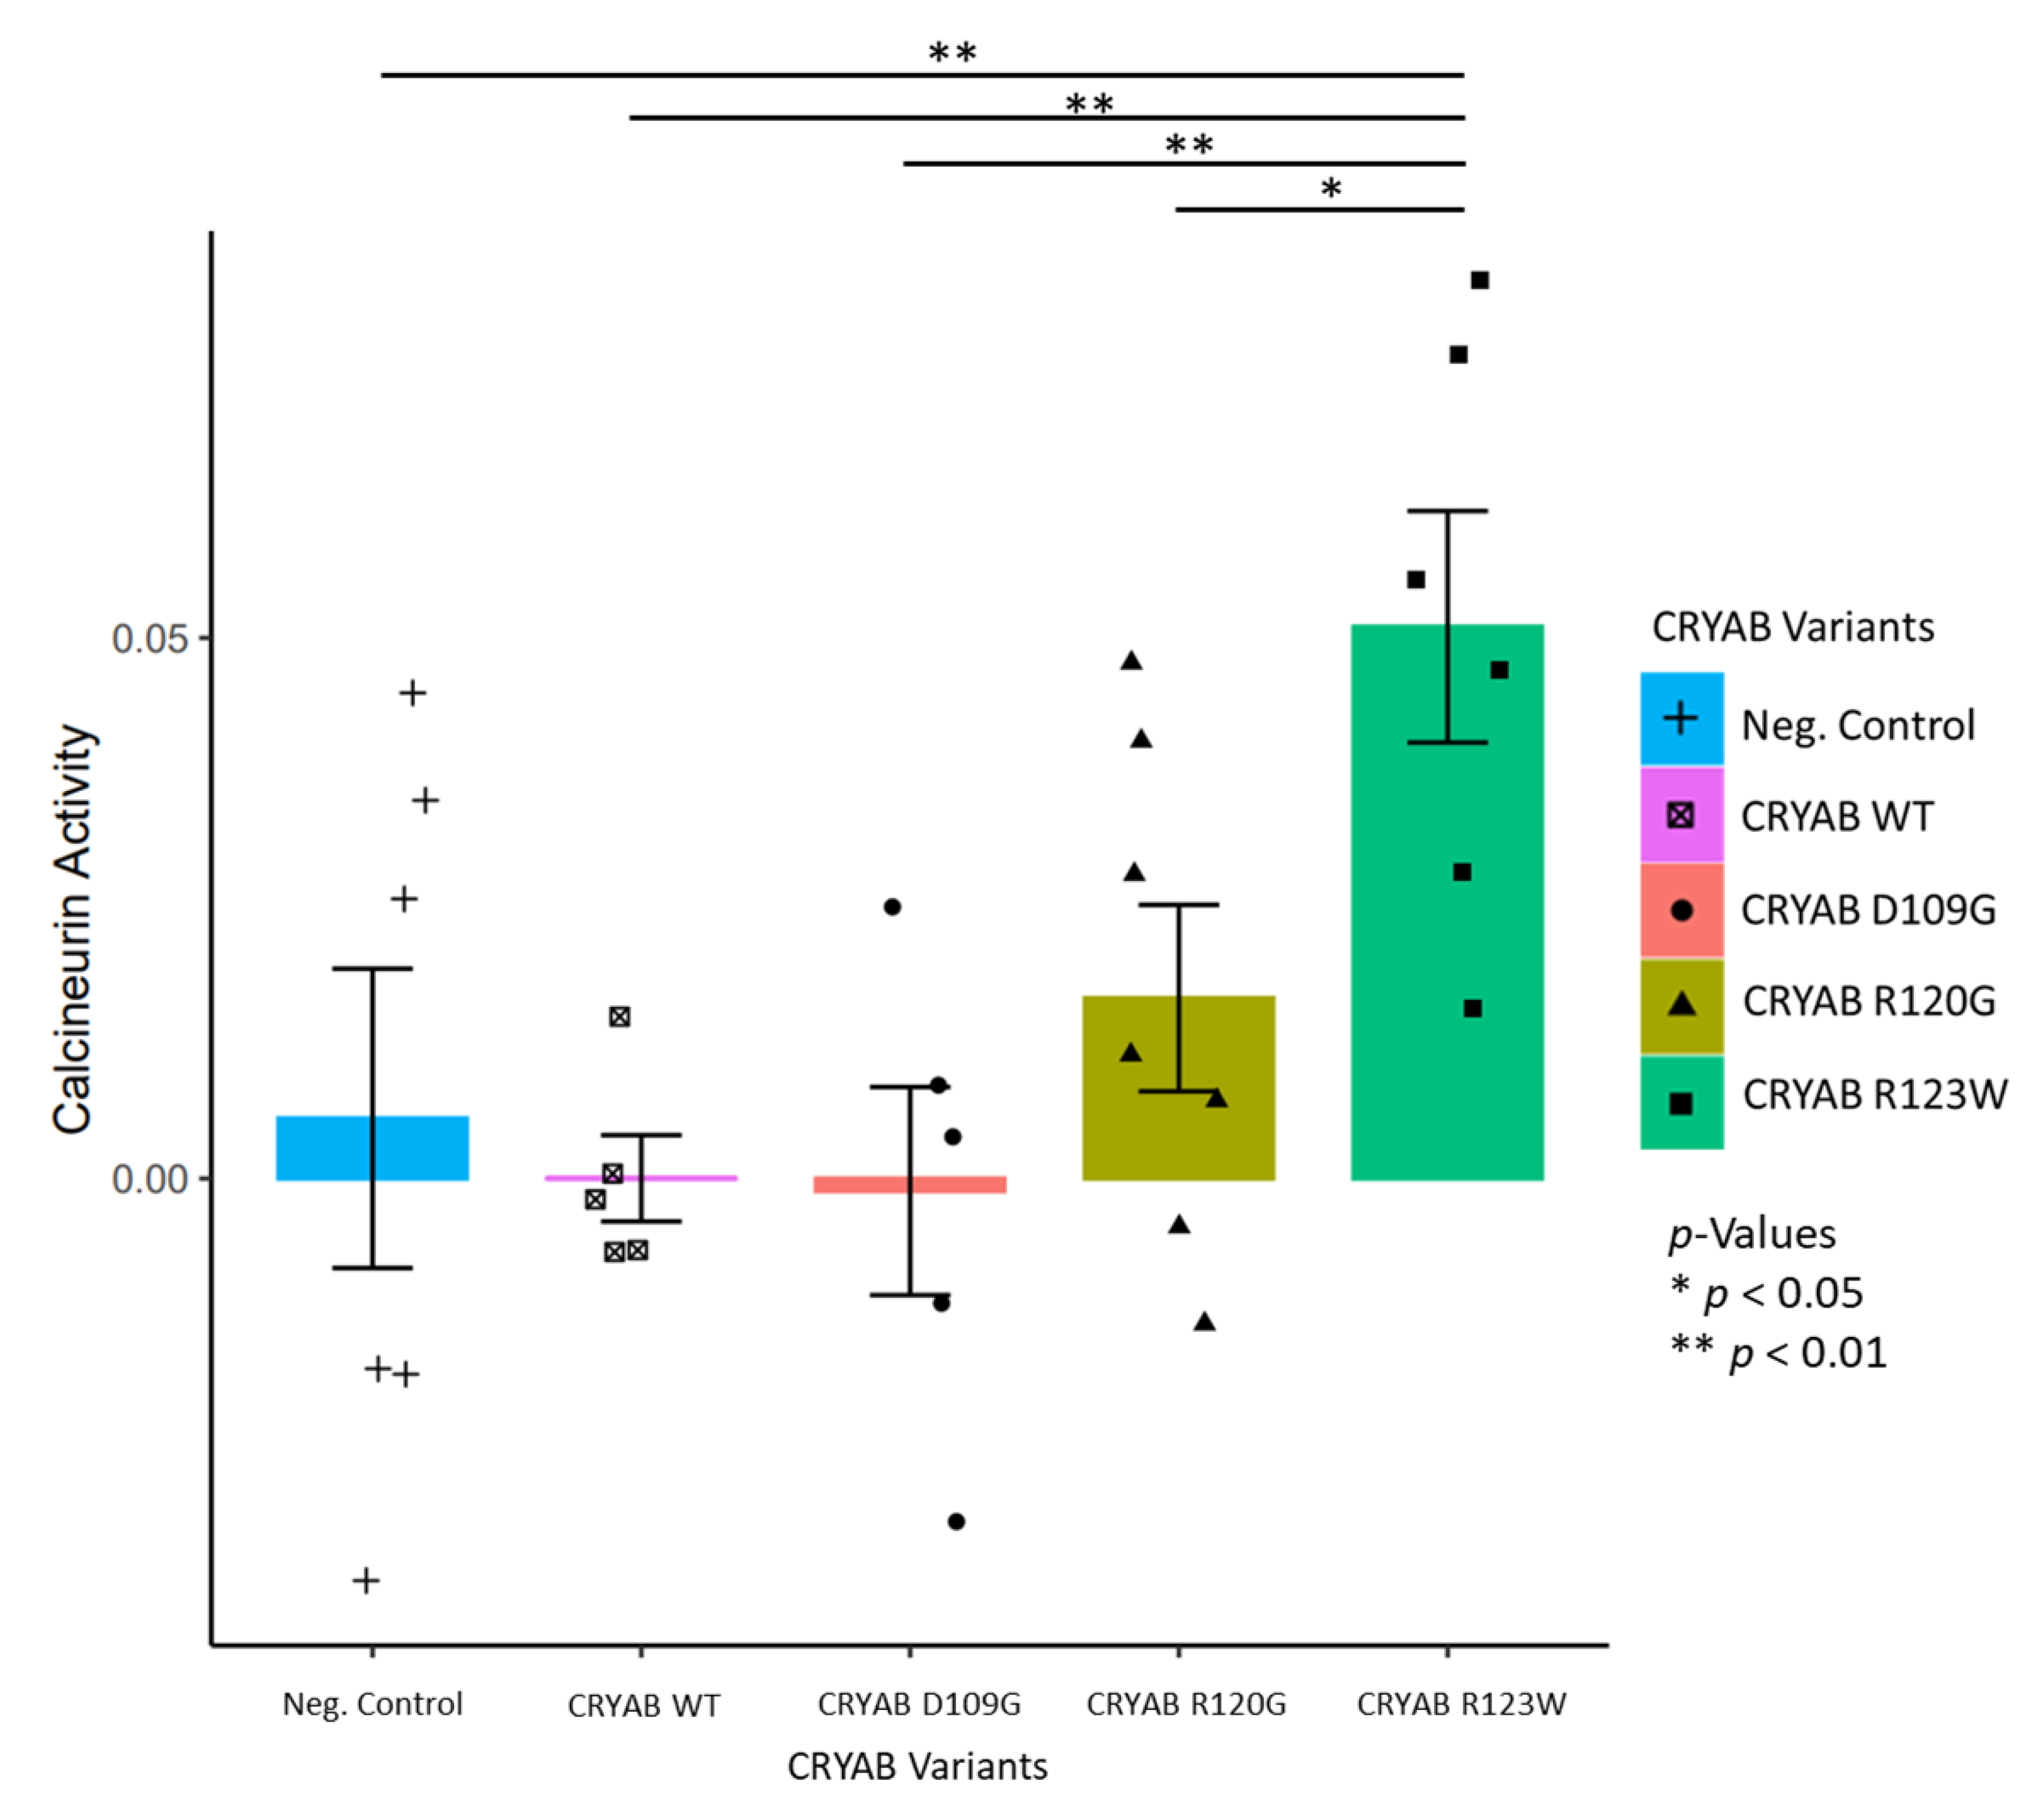
Figure 2.
Bar Plots of IonOptix analysis of isolated cardiomyocytes from our wild type CRYAB(Blue) and CRYABR123W(Red) mouse models. (a) IonOptix Sin Exp Tau, a measure of calcium reuptake, for wild type CRYAB and CRYABR123W, with a significantly increased value in CRYABR123W suggestive of impaired calcium reuptake and myocyte relaxation. (b) IonOptix baseline sarcomere length demonstrating that CRYABR123W myocytes have significantly increased baseline sarcomere length compared to wild type.
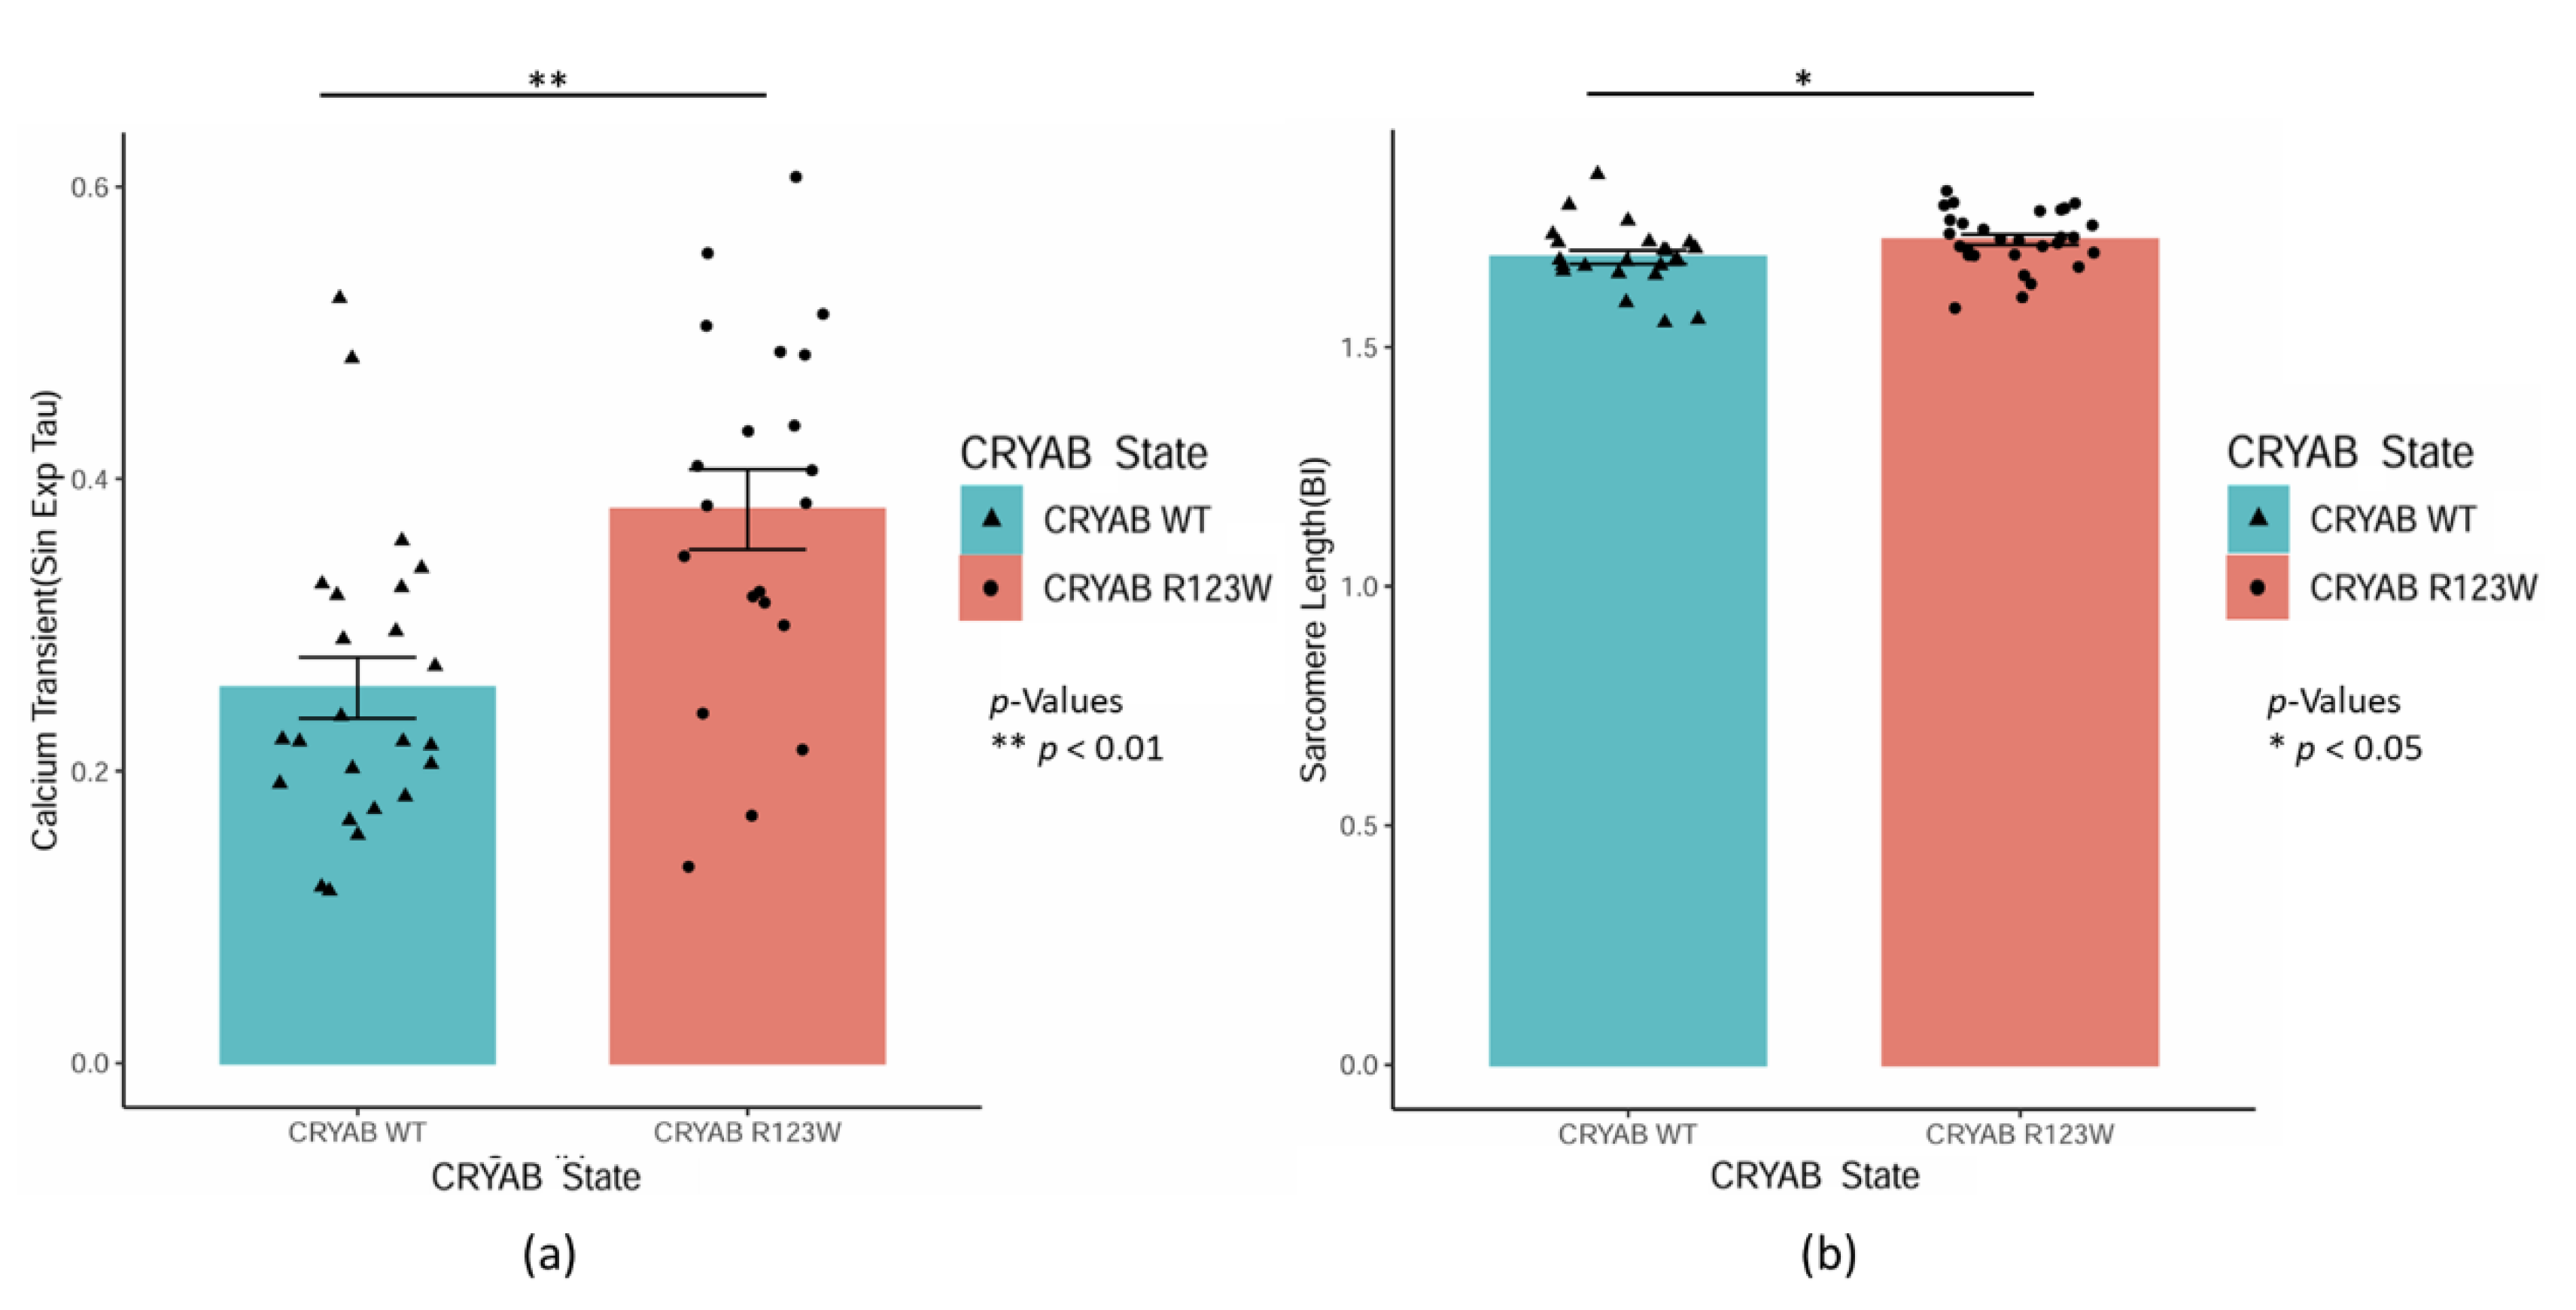
Figure 3.
Alphafold structures visualized in ChimeraX of CRYAB proteins (Red) tagged with a triple FLAG tag (Green). (a) Wild type CRYAB with N-terminal FLAG tag; (b) CRYABR123W with N-terminal FLAG tag; (c) Wild type CRYAB with C-terminal FLAG tag; (d) CRYABR123W with C-terminal FLAG tag.
Figure 3.
Alphafold structures visualized in ChimeraX of CRYAB proteins (Red) tagged with a triple FLAG tag (Green). (a) Wild type CRYAB with N-terminal FLAG tag; (b) CRYABR123W with N-terminal FLAG tag; (c) Wild type CRYAB with C-terminal FLAG tag; (d) CRYABR123W with C-terminal FLAG tag.
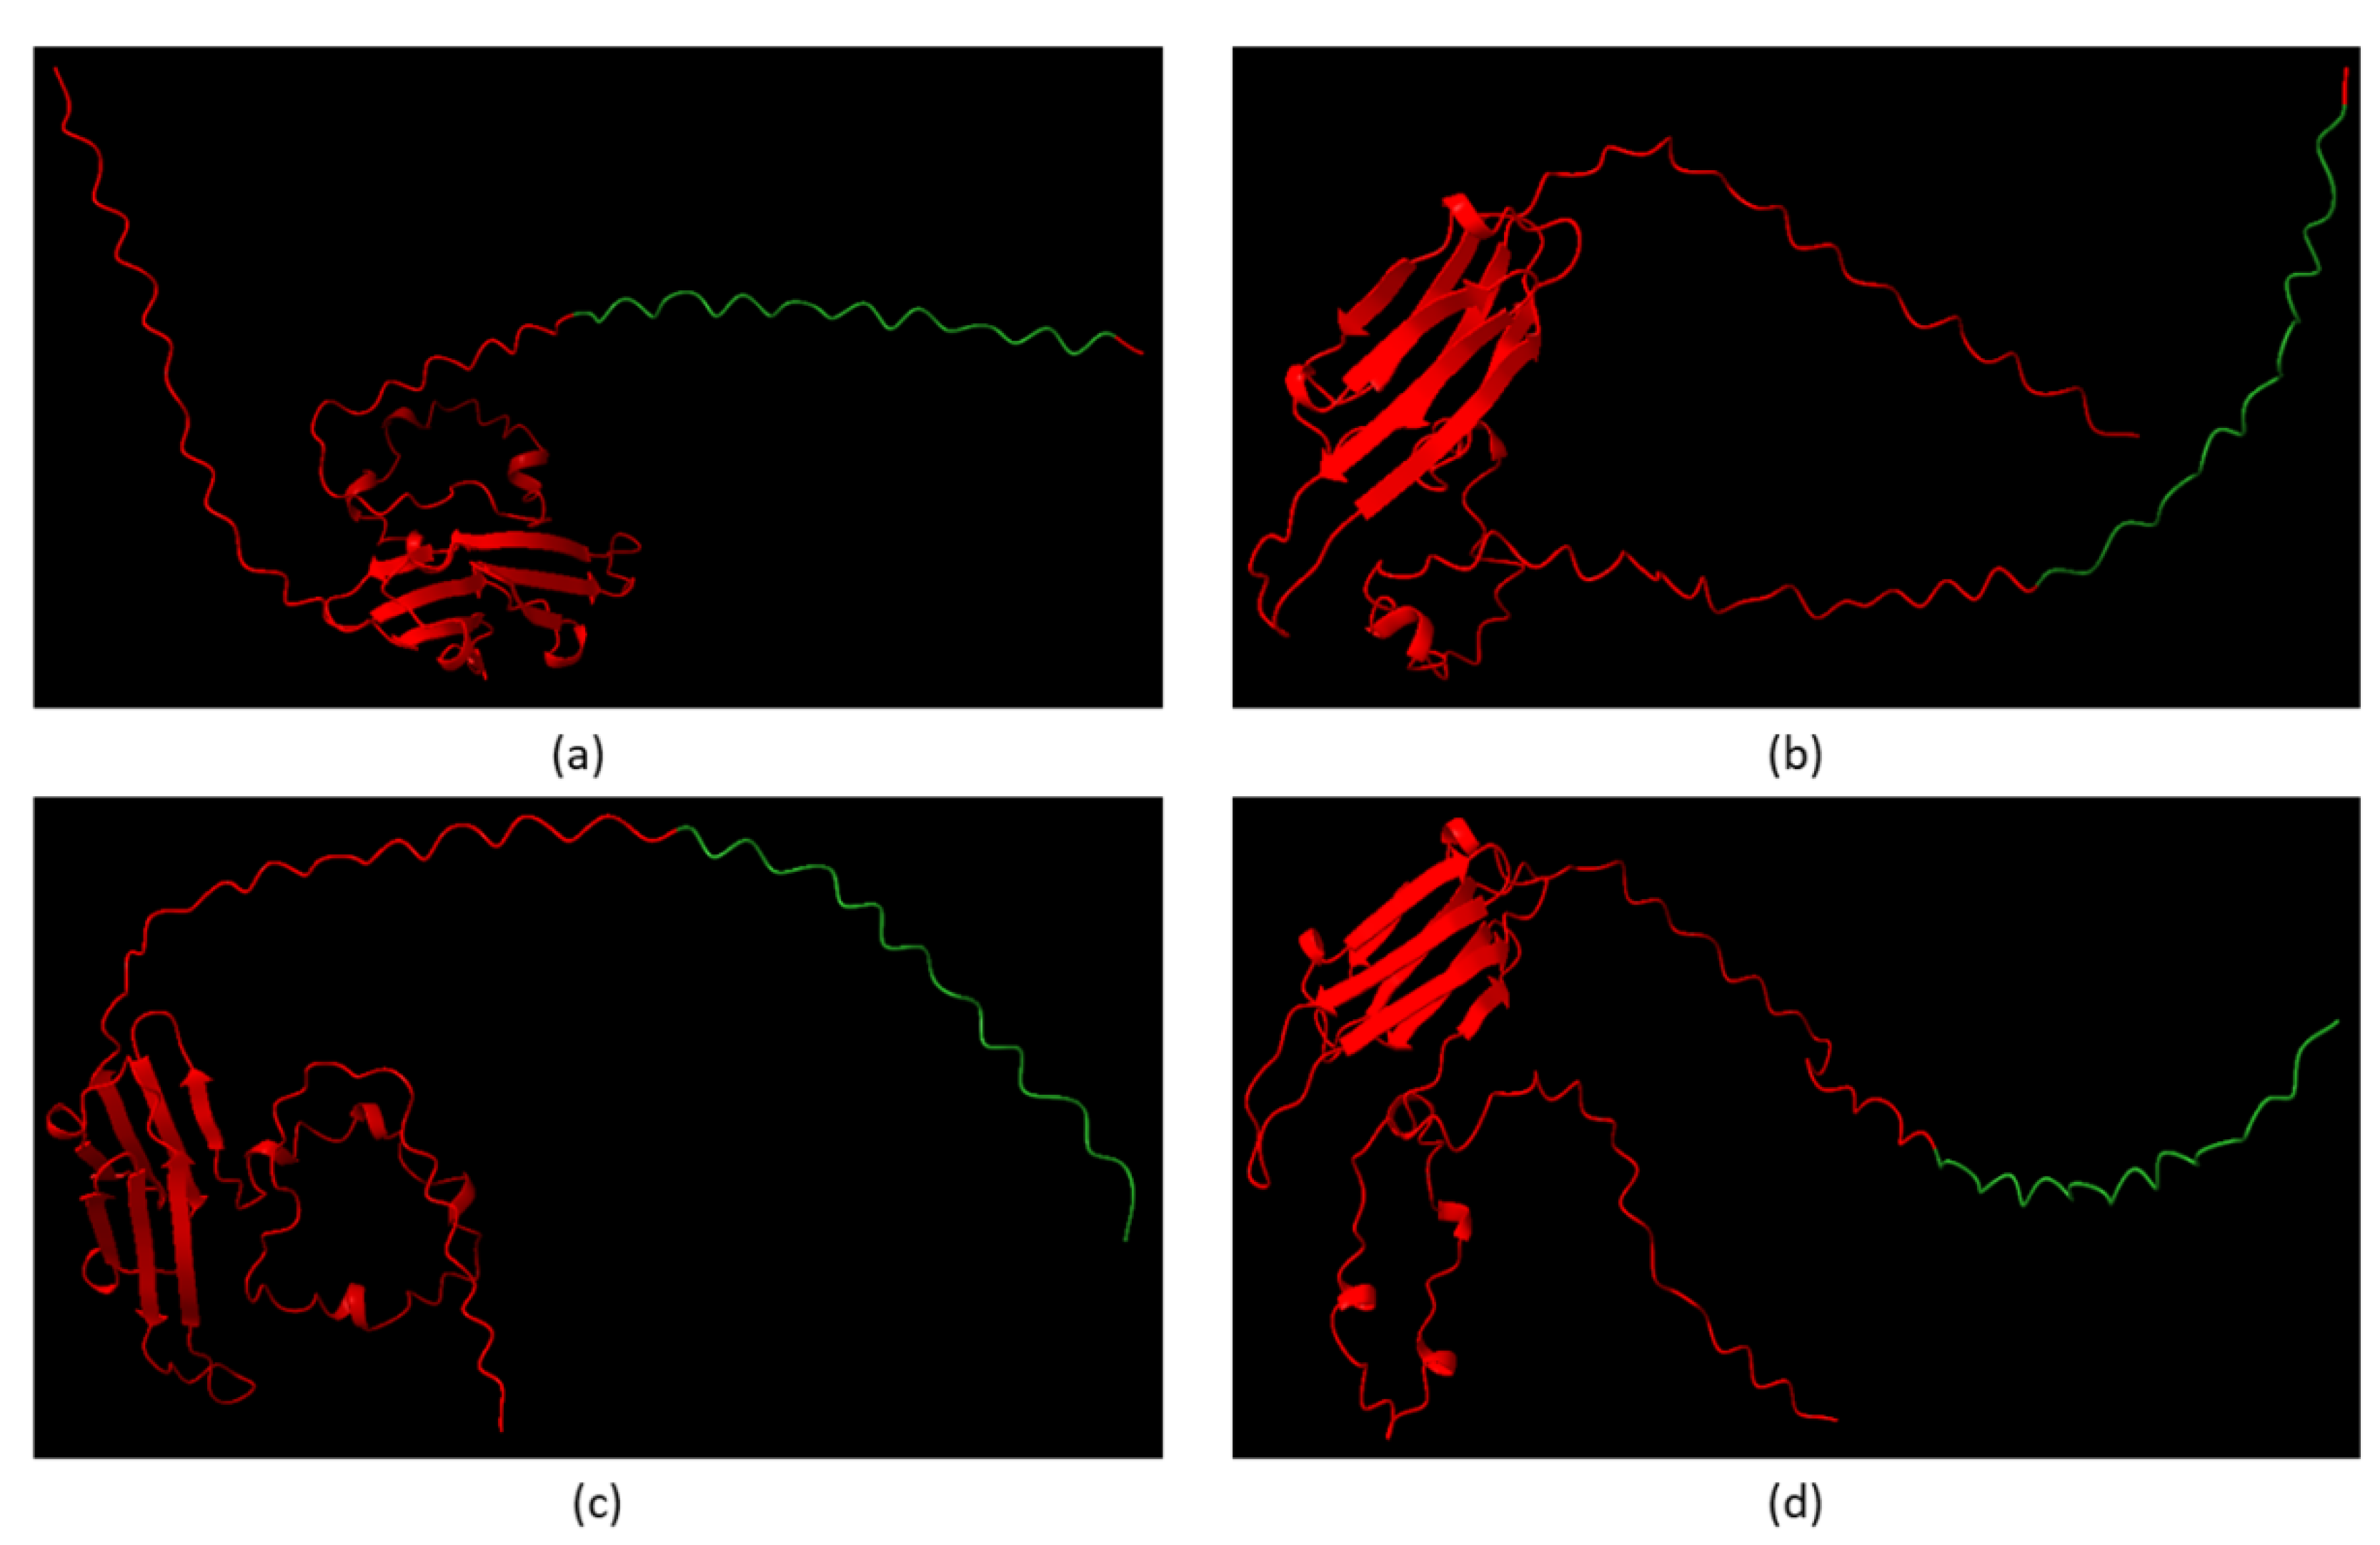
Figure 4.
Alphafold structures visualized in ChimeraX of CRYAB proteins (Red) interacting with calcineurin (Blue) with labeling of the interacting amino acids of CRYAB (purple). (a) Wild type CRYAB binding well at the NFAT binding site of calcineurin; (b) CRYABD109G binding poorly at the NFAT binding site of calcineurin; (c) CRYABR120G binding poorly at the NFAT binding site of calcineurin; (d) CRYABR123W binding well at the autoinhibitory domain of calcineurin.
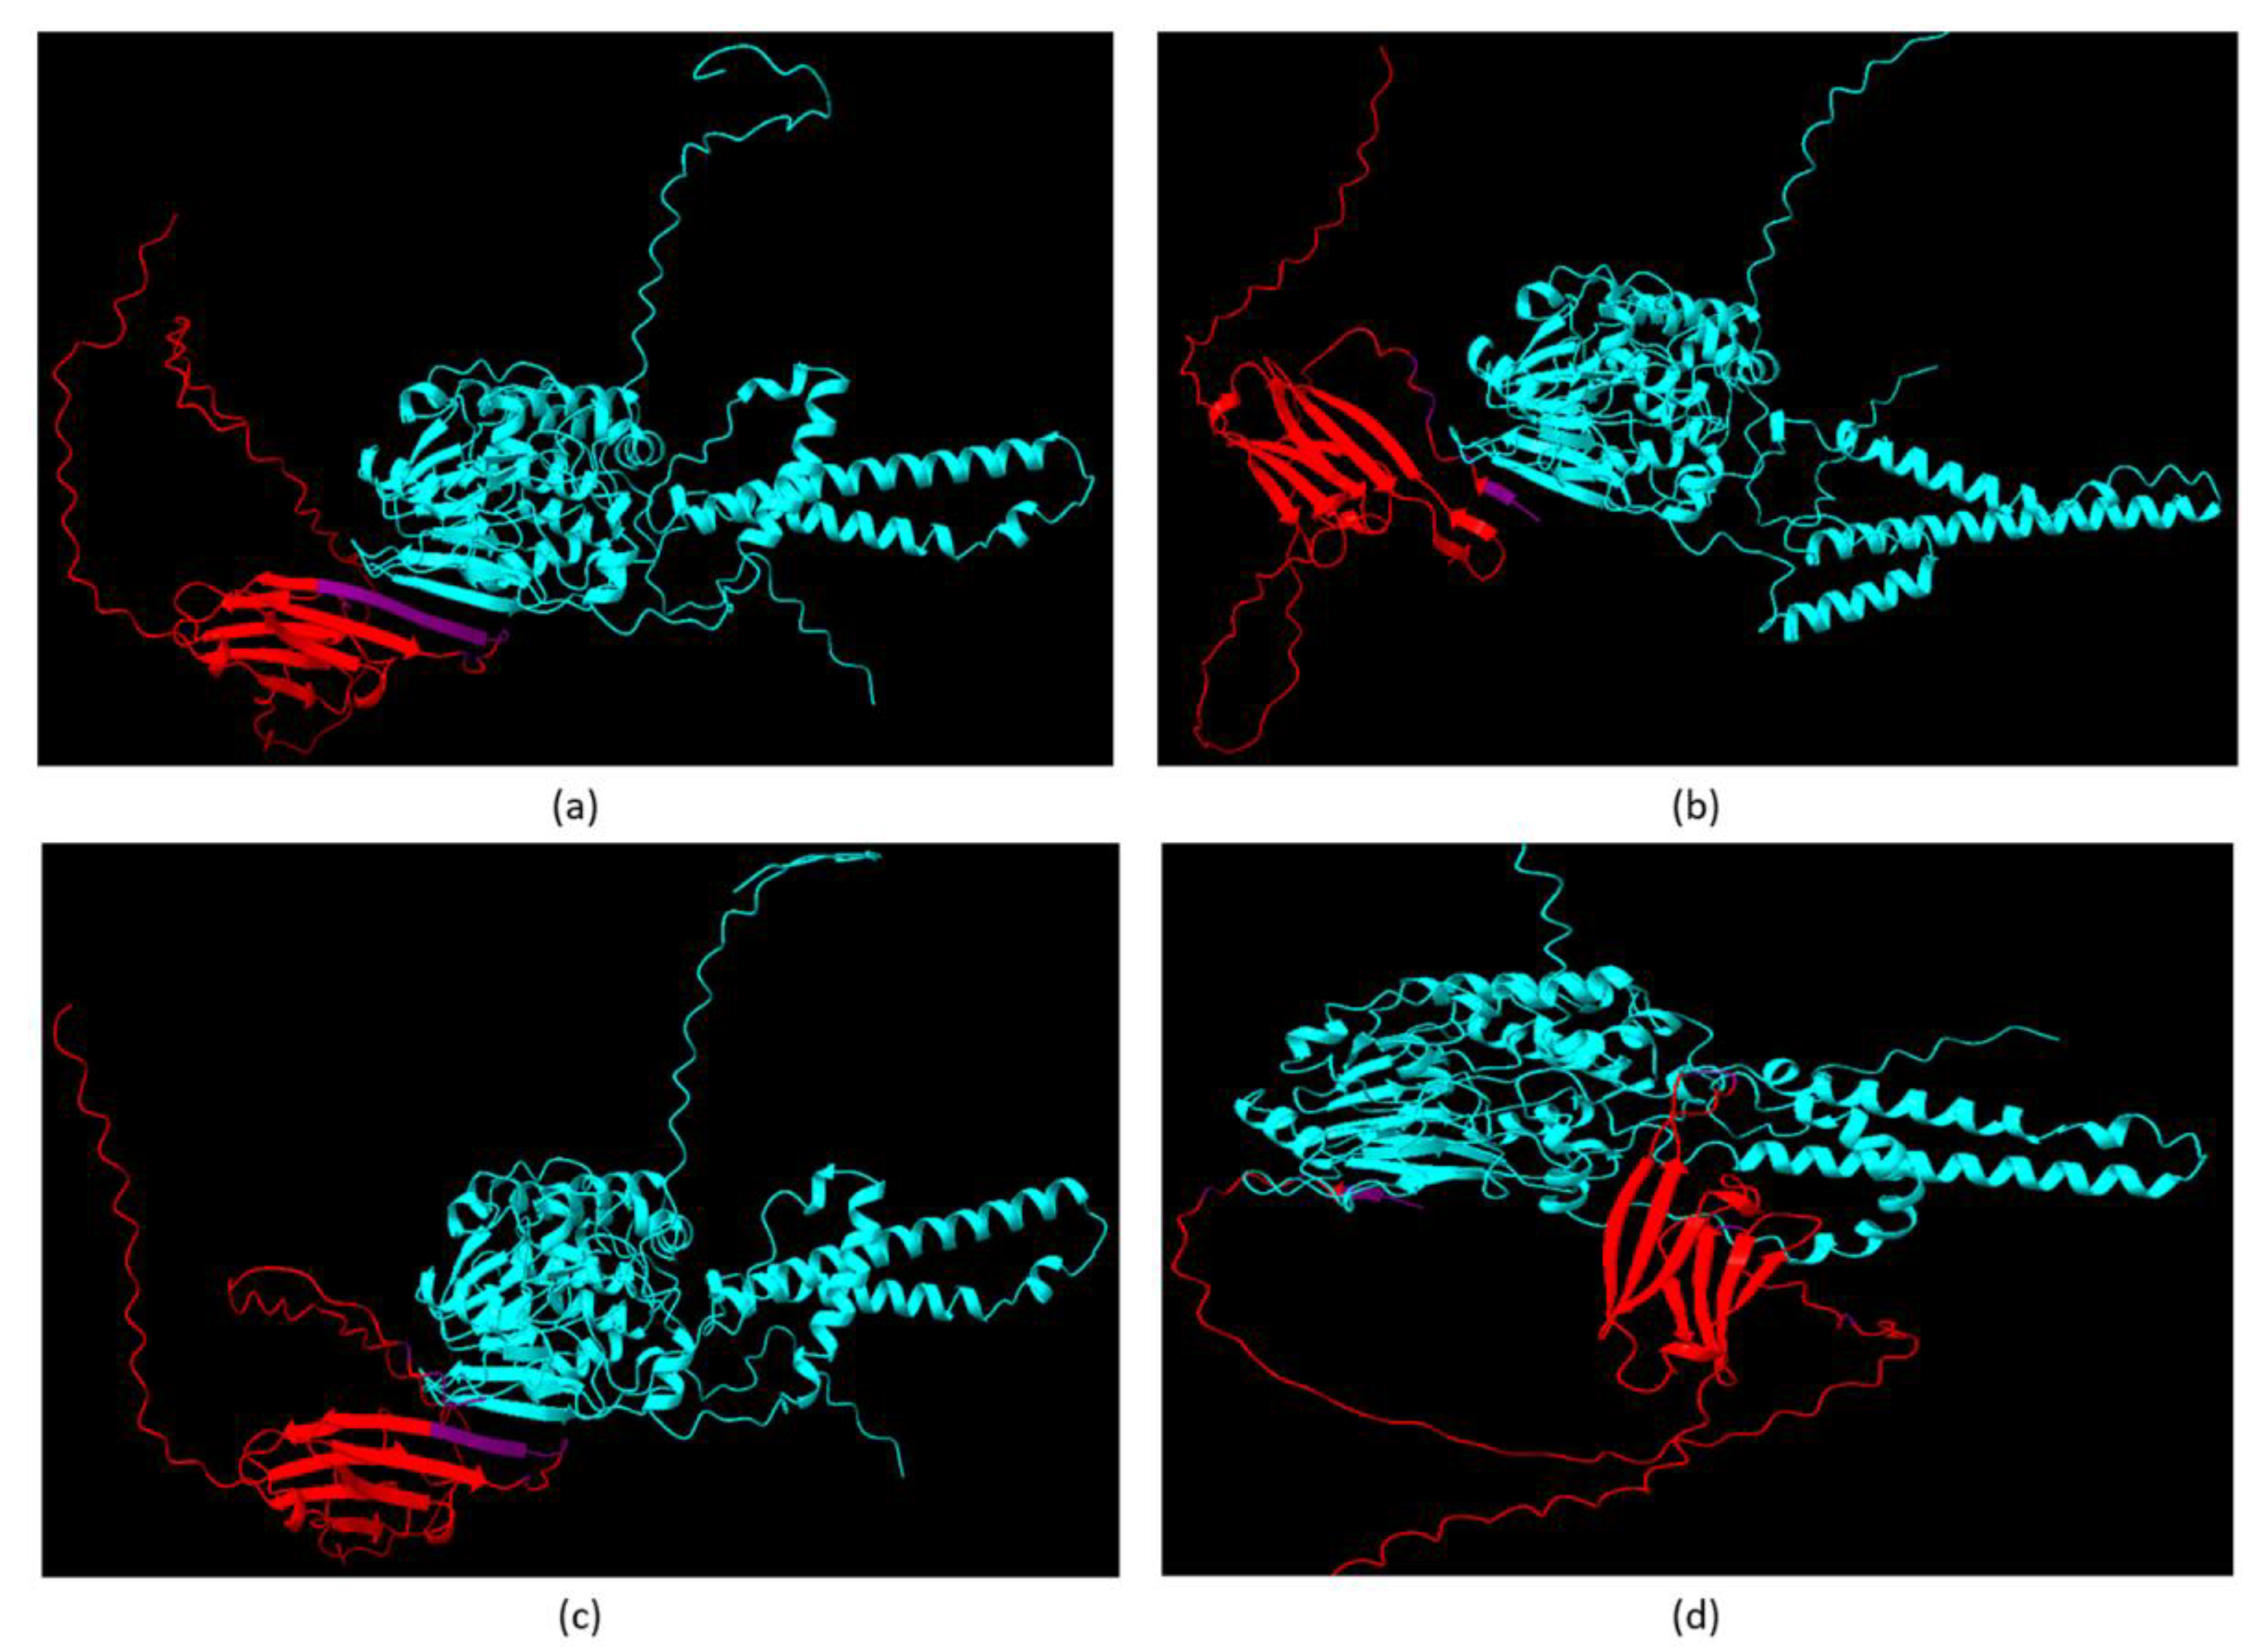
Figure 5.1.
Volcano plots depicting mass spectrometry data from co-immunoprecipitation of lysate from H9C2 cells expressing FLAG tagged wild type CRYAB, CRYABR120G and CRYABR123W. Data are labeled with the corresponding protein and as having decreased binding (Blue), no significant change (Grey) or increased binding (Red). (a) Volcano plot comparing wild type CRYAB to CRYABR120G showing significant increase in binding with minimal decrease; (b) Volcano plot comparing wild type CRYAB to CRYABR123W showing significant decrease and increase in protein binding.
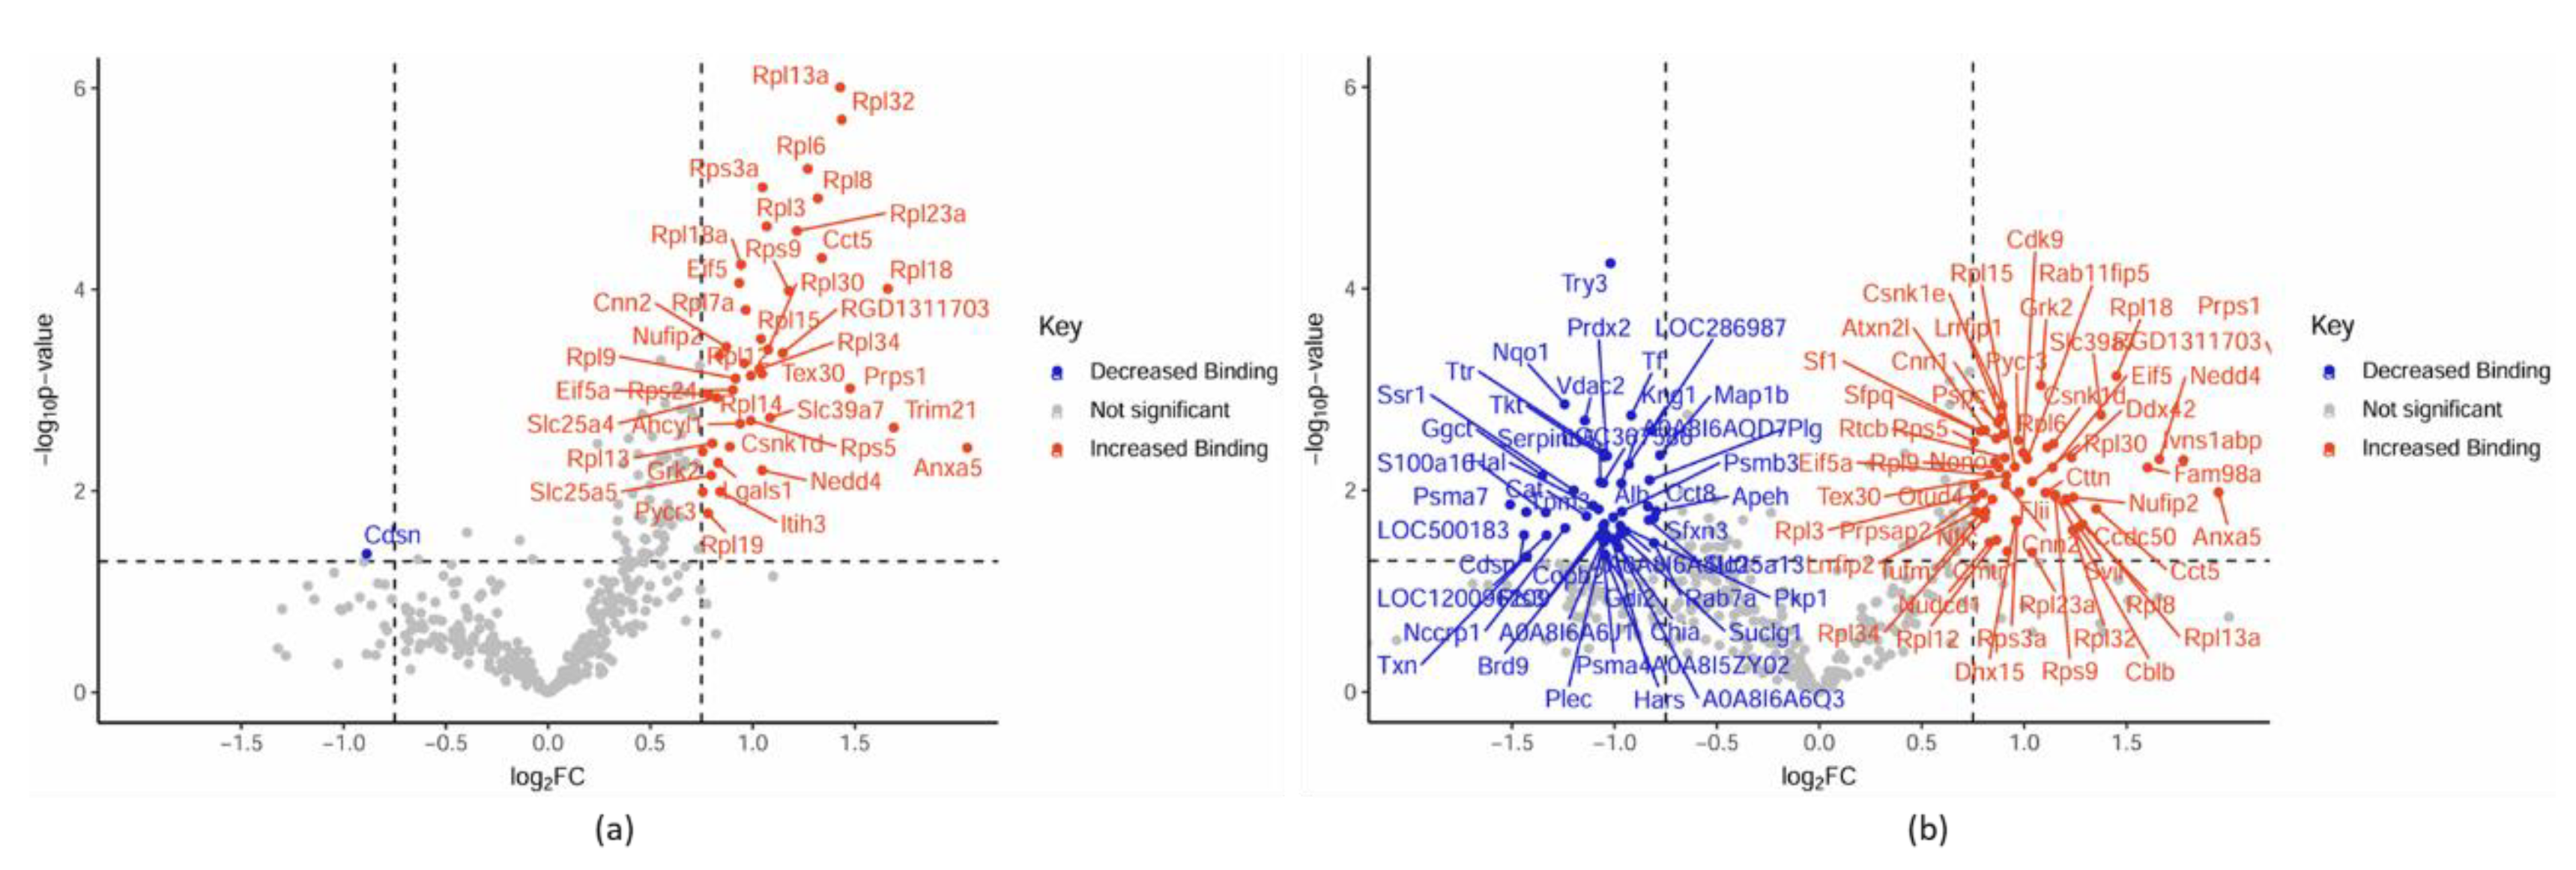
Figure 5.2.
Volcano plot depicting mass spectrometry data from co-immunoprecipitation of lysate from H9C2 cells expressing FLAG tagged CRYABR120G and CRYABR123W. Data are labeled with the corresponding protein and as having decreased binding (Blue), no significant change(Grey) or increased binding (Red). Comparison of CRYABR120G and CRYABR123W shows that CRYABR123W has distinct changes in protein-protein interactions.
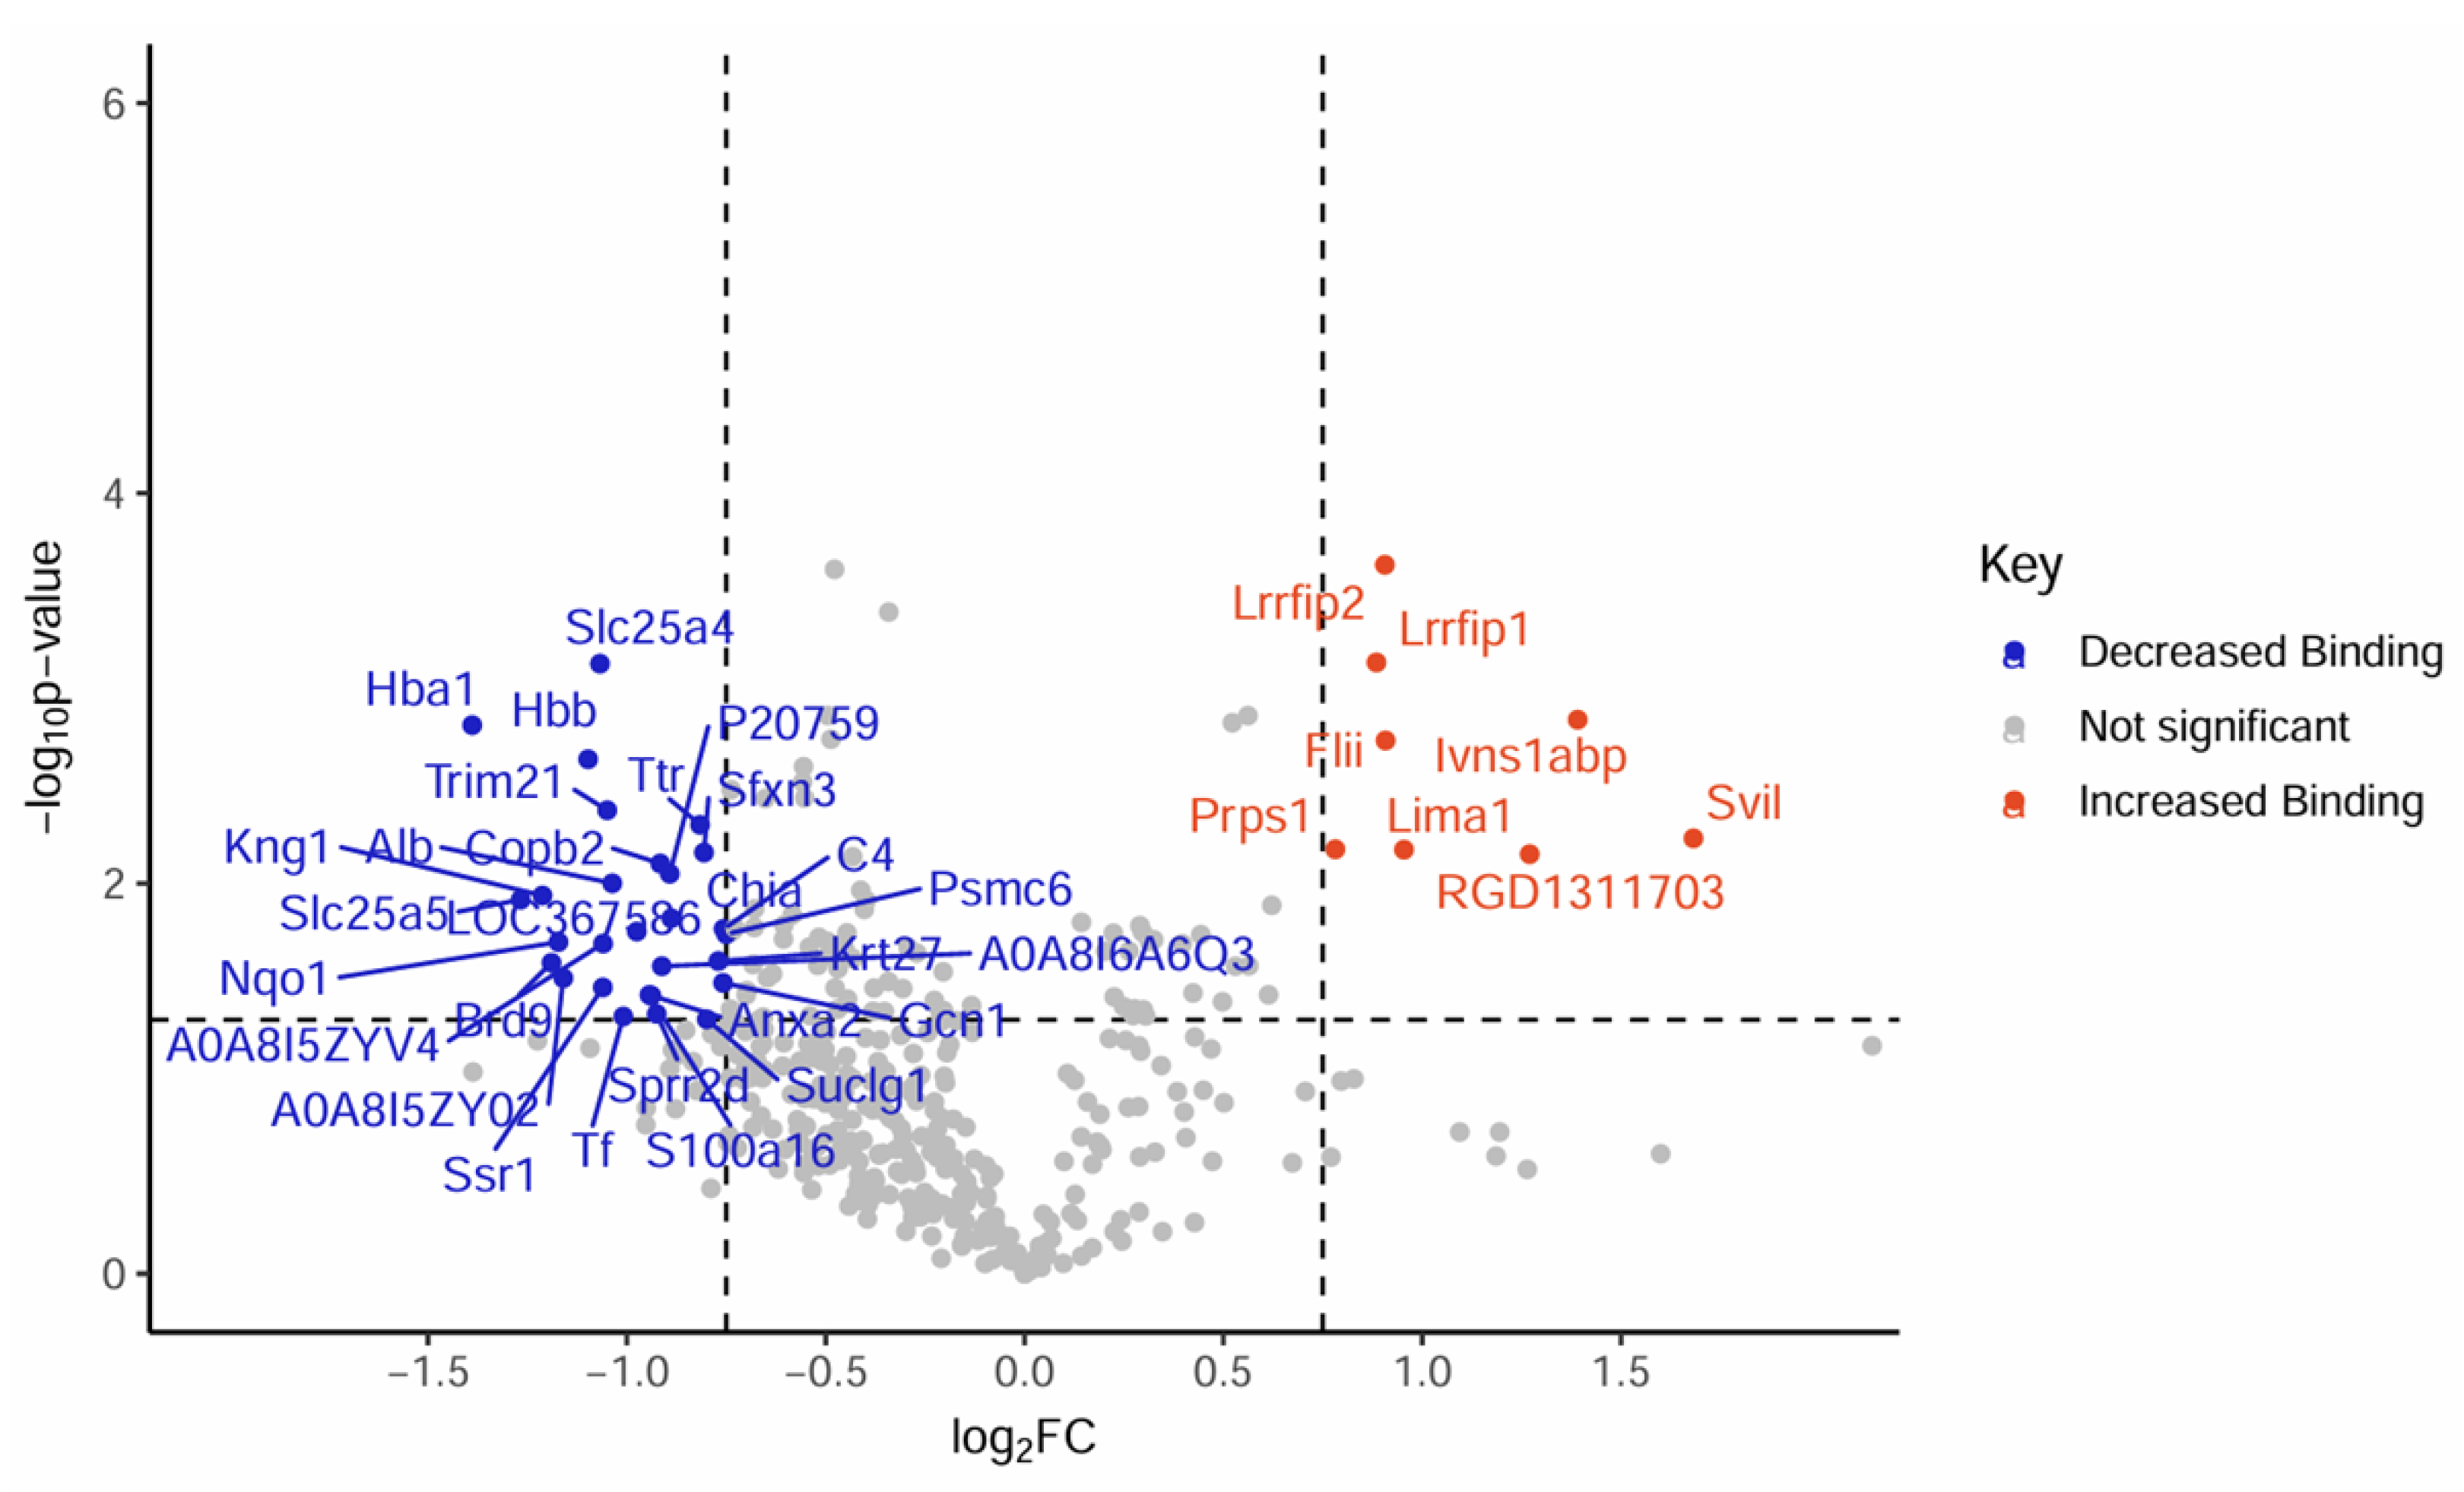
Figure 6.
Mass spectrometry data from wild type CRYAB and CRYABR123W mouse hearts extracts without (Early Non-TAC) or with (Late TAC) transverse aortic constriction. (a) Venn diagram depicting the protein (Blue) and phosphoprotein (Green) breakdown from mice without transaortic constriction; (b) Volcano plot showing lack of significant changes in protein expression in mice without transverse aortic constriction; (c) Volcano plot showing only two significant changes in phosphoprotein expression in mice without transverse aortic constriction; (d) Venn diagram depicting the protein (Blue) and phosphoprotein (Green) breakdown from mice with transaortic constriction; (e) Volcano plot showing significant changes in protein expression in mice with transverse aortic constriction; (f) Volcano plot showing significant changes in phosphoprotein expression in mice with transverse aortic constriction.
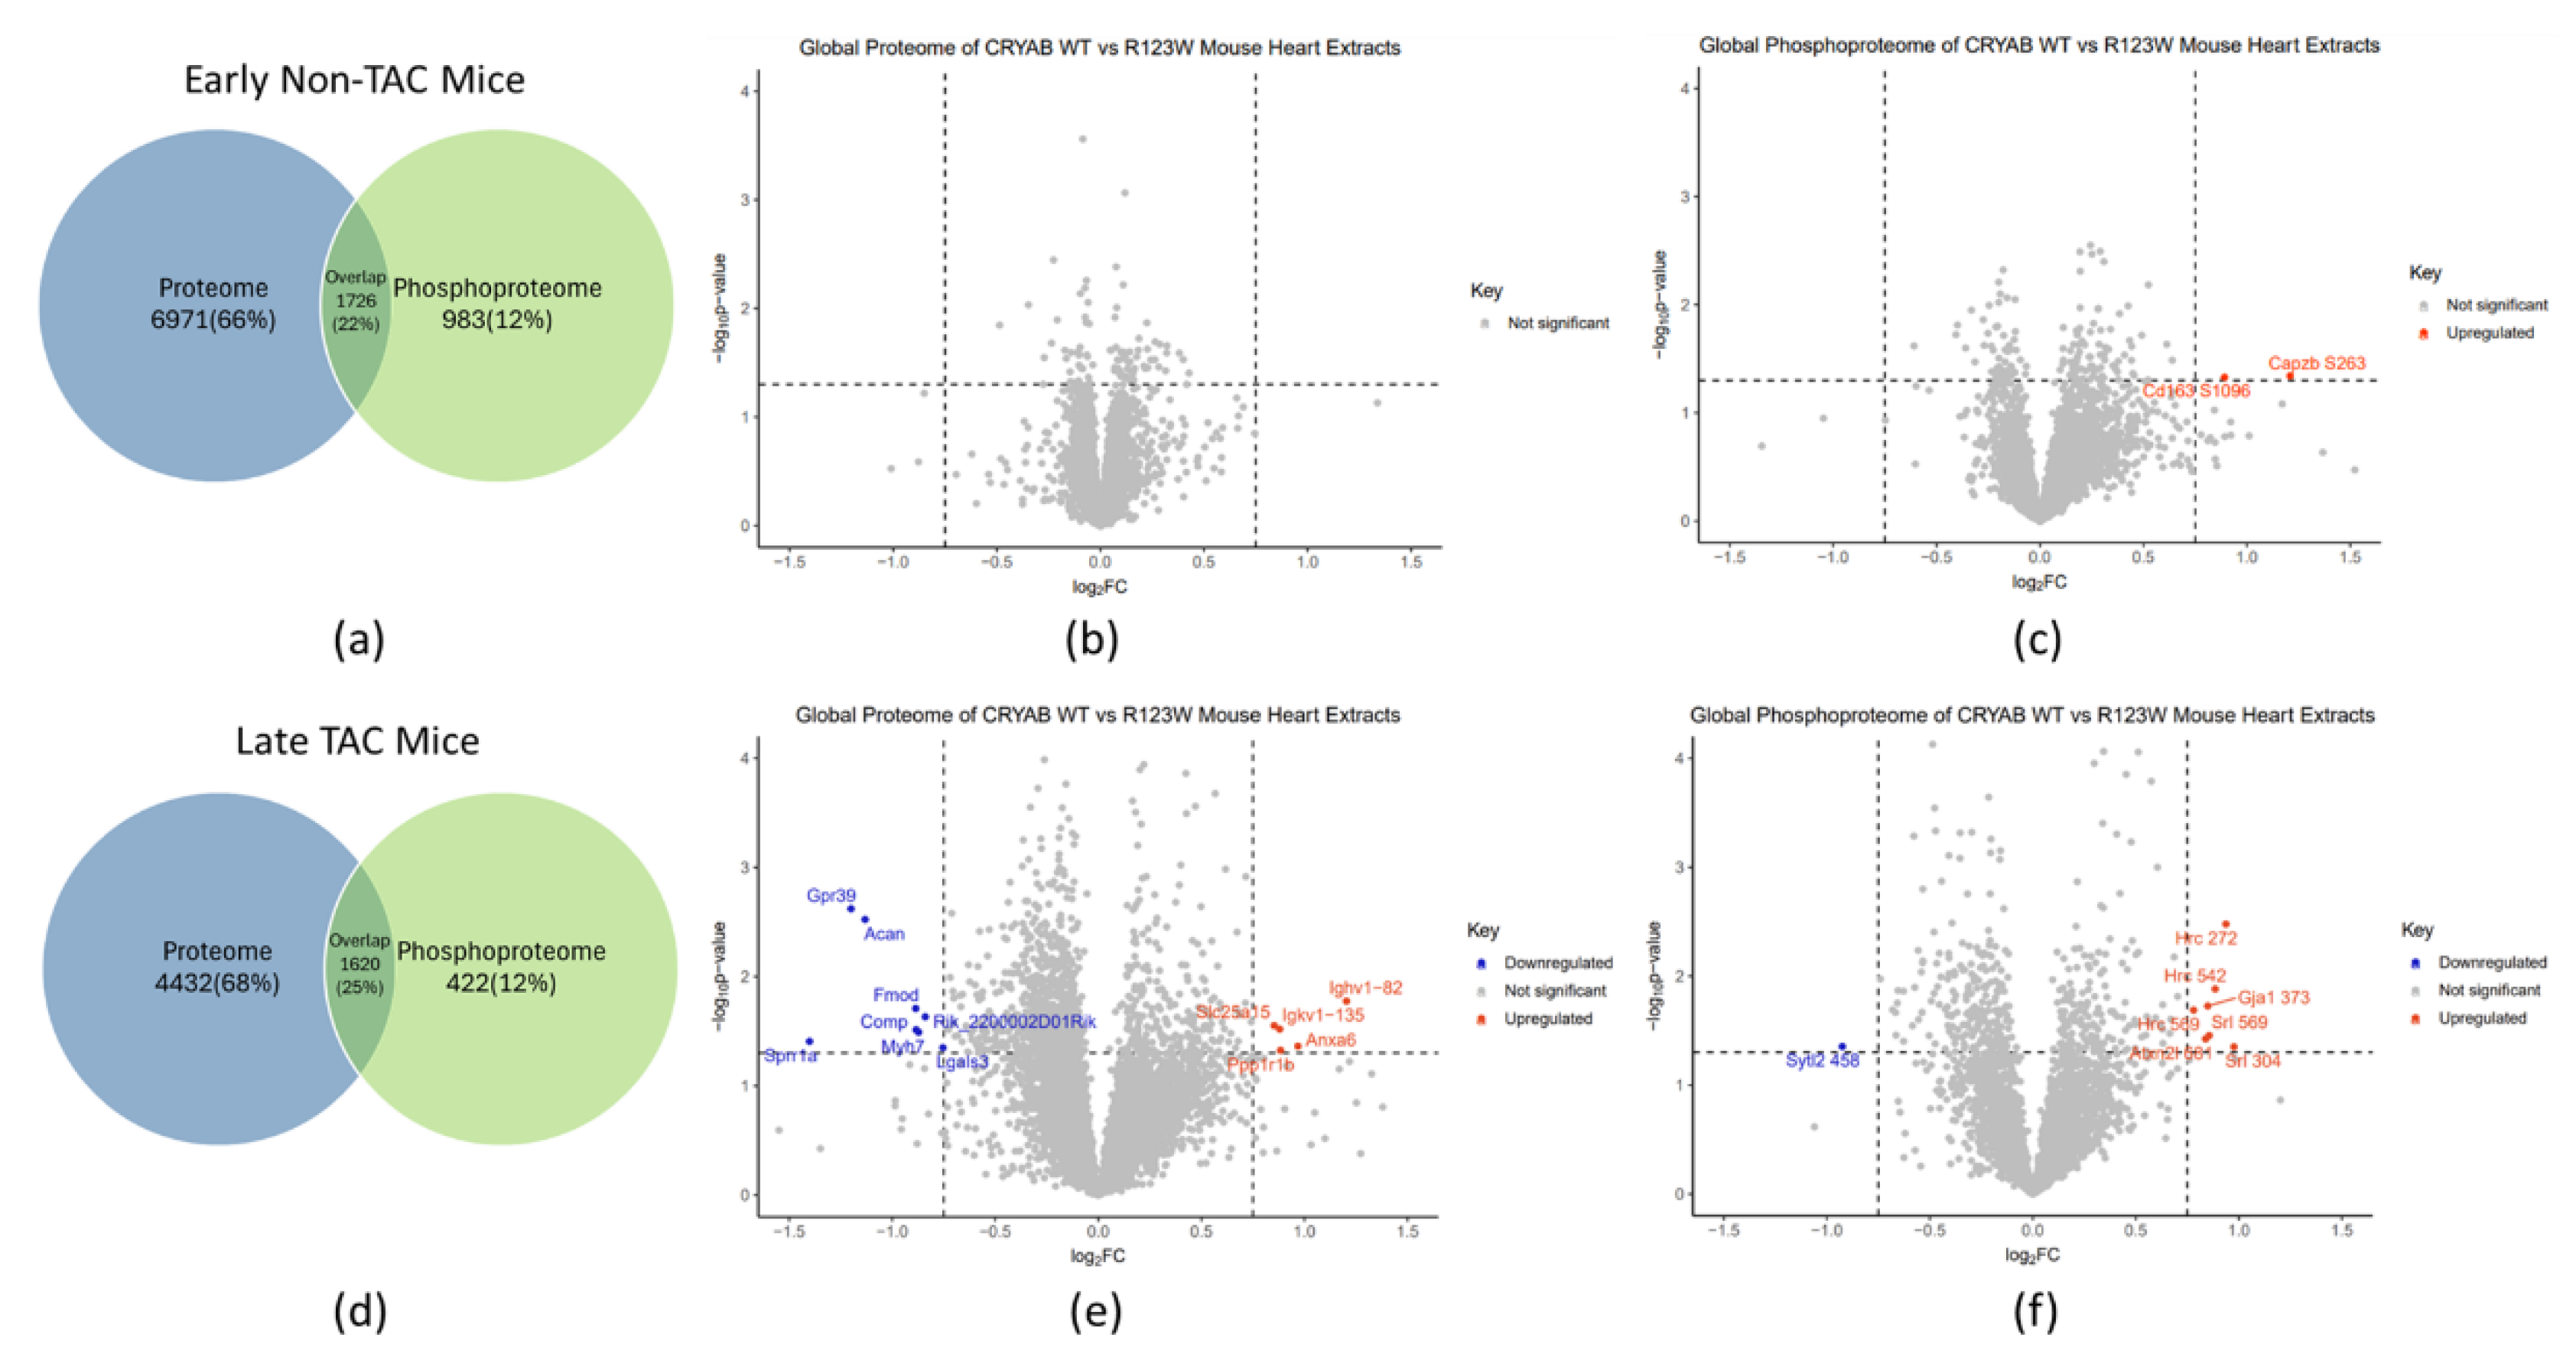
Figure 7.
GO term analysis comparing mass spectrometry data from wild type CRYAB and CRYABR123W mouse heart extracts following transverse aortic constriction. GO term analysis showed significant association with cytoskeletal pathways.
Figure 7.
GO term analysis comparing mass spectrometry data from wild type CRYAB and CRYABR123W mouse heart extracts following transverse aortic constriction. GO term analysis showed significant association with cytoskeletal pathways.
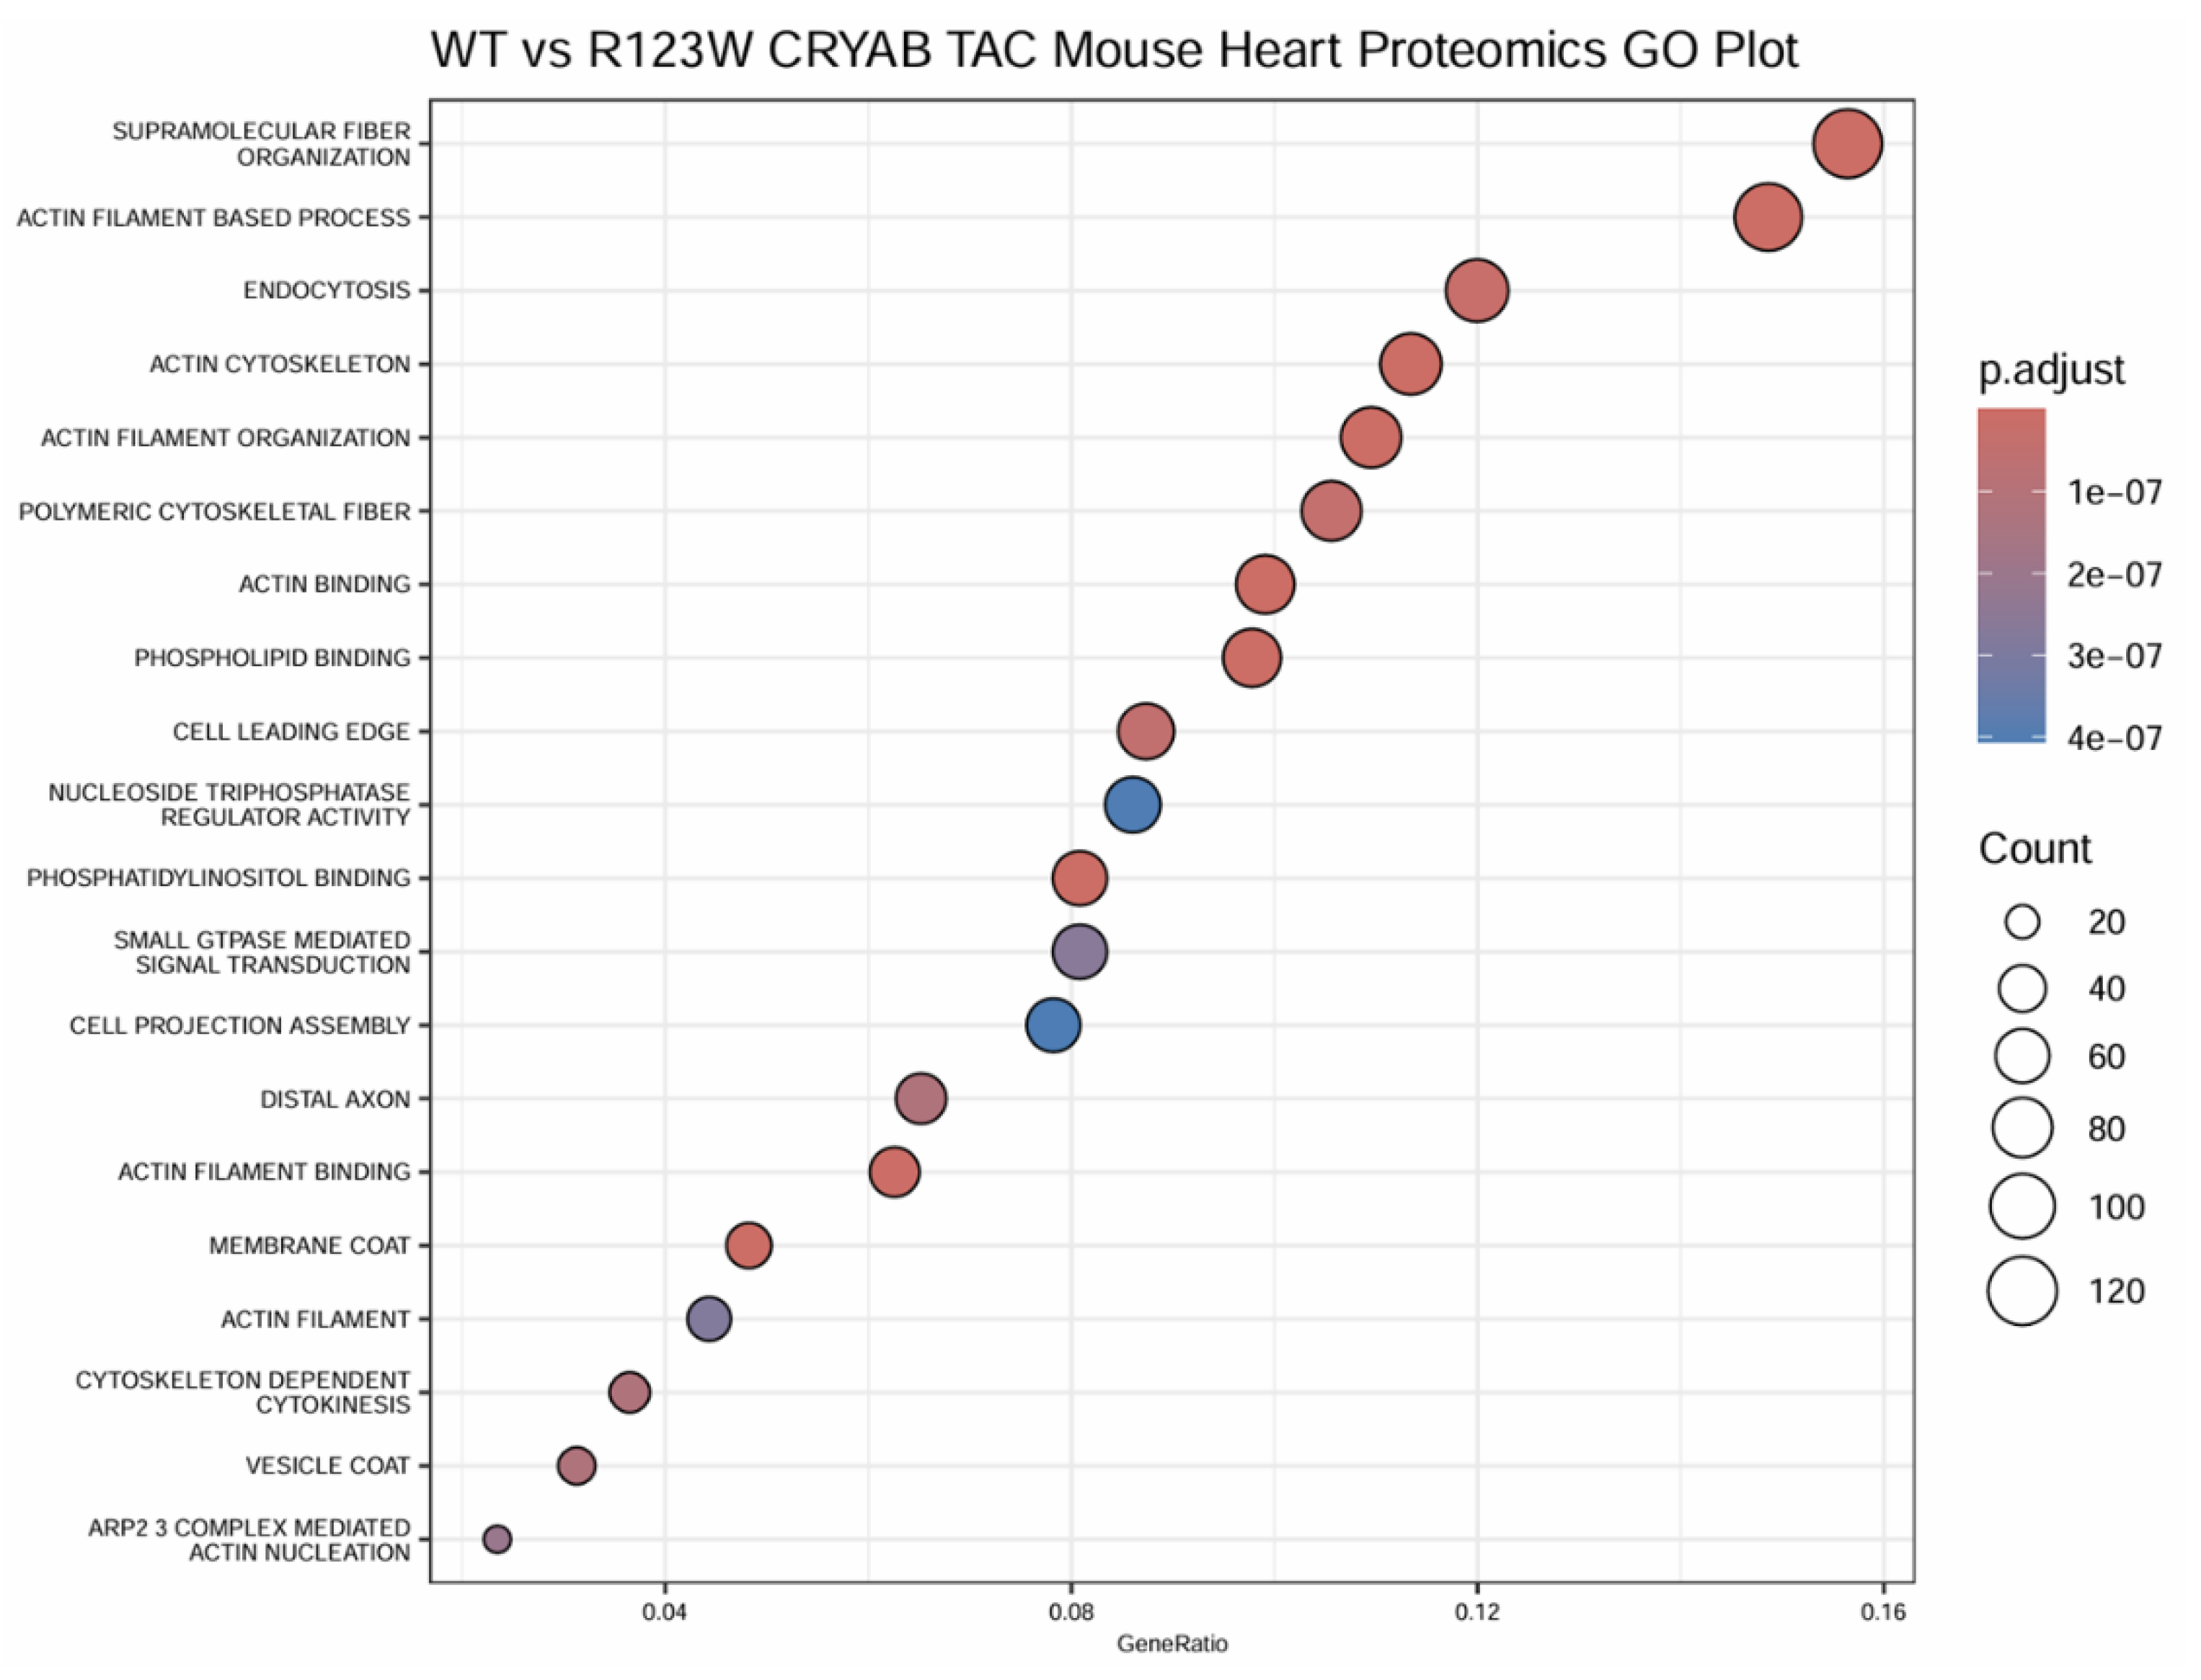
Figure 8.1.
Heatmap based on genes from the oxidative phosphorylation pathway identified by IPA analysis using mass spectrometry data from wild type CRYAB (Purple) and CRYABR123W (Green) mouse heart extracts with or without transverse aortic constriction. (a) Heatmap showing results from early-stage disease in mice without transverse aortic constriction with poor clustering and gene expression differentiation; (b) Heatmap showing results from late-stage disease in mice with transverse aortic constriction with improved clustering and gene expression differentiation.
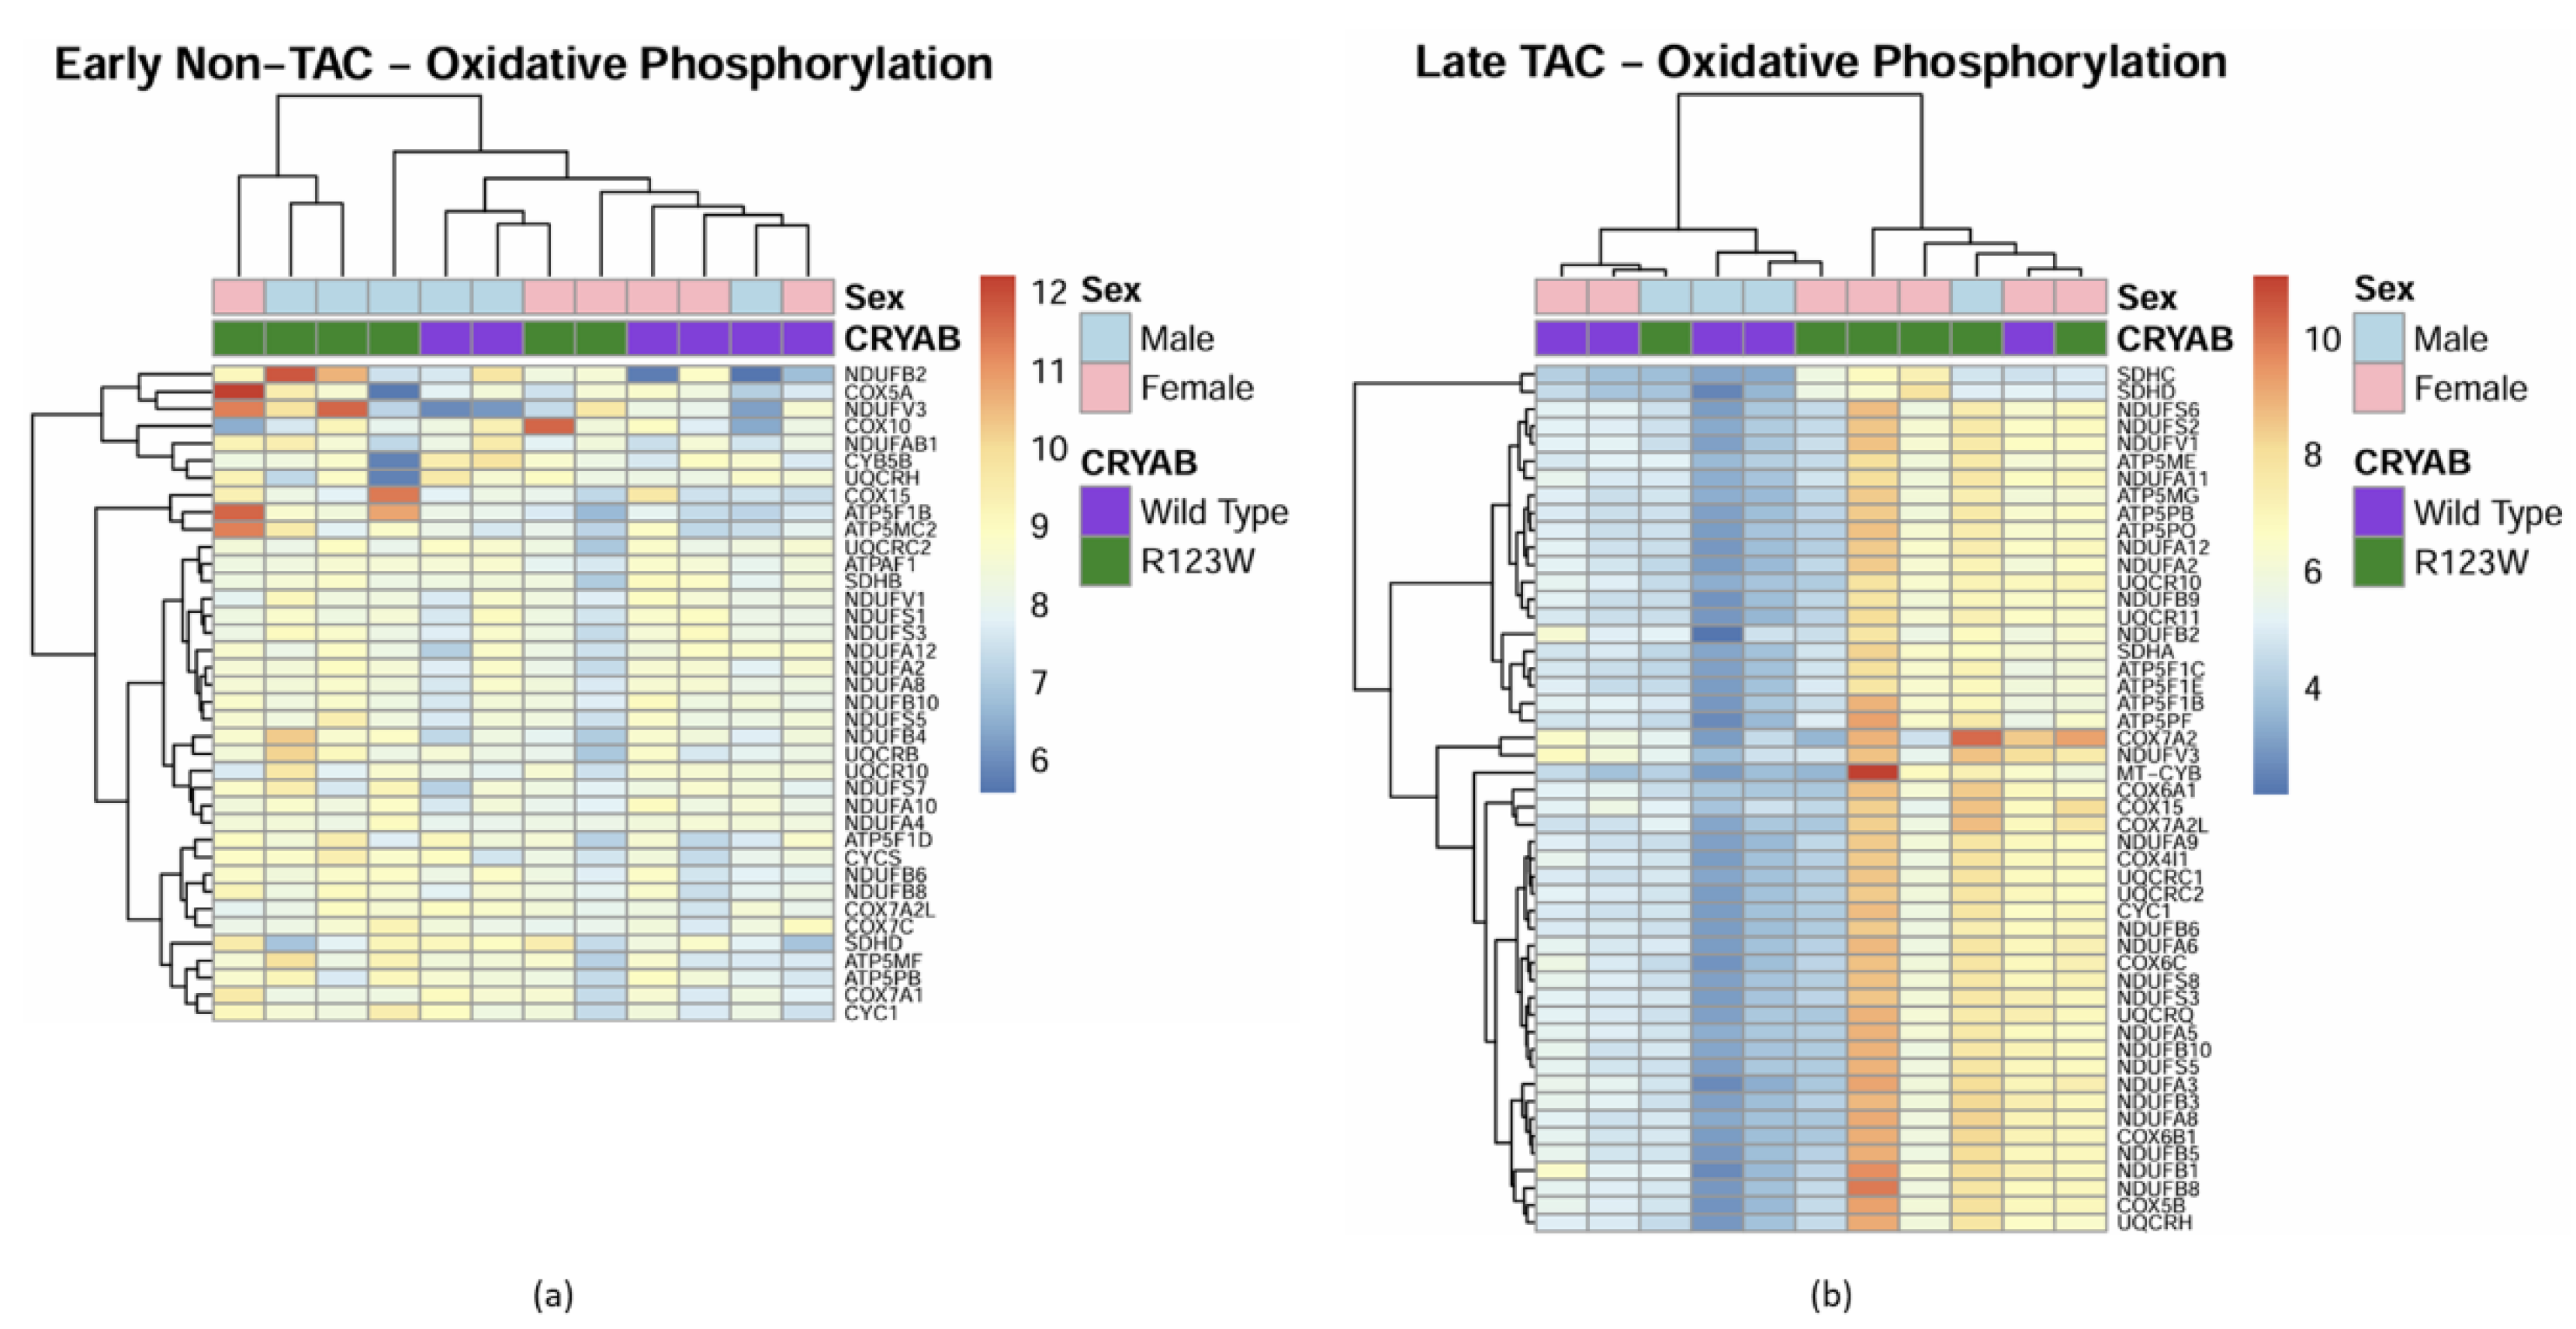
Figure 8.2.
Heatmap based on genes from the mitochondrial dysfunction pathway identified by IPA analysis using mass spectrometry data from wild type CRYAB (Purple) and CRYABR123W (Green) mouse heart extracts with or without transverse aortic constriction. (a) Heatmap showing results from early-stage disease in mice without transverse aortic constriction with poor clustering and gene expression differentiation; (b) Heatmap showing results from late-stage disease in mice with transverse aortic constriction with improved clustering and gene expression differentiation.

Figure 8.3.
Heatmap based on genes from the mTOR signaling pathway identified by IPA analysis using mass spectrometry data from wild type CRYAB (Purple) and CRYABR123W (Green) mouse heart extracts with or without transverse aortic constriction. (a) Heatmap showing results from early-stage disease in mice without transverse aortic constriction with poor clustering and gene expression differentiation; (b) Heatmap showing results from late-stage disease in mice with transverse aortic constriction with improved clustering and gene expression differentiation.
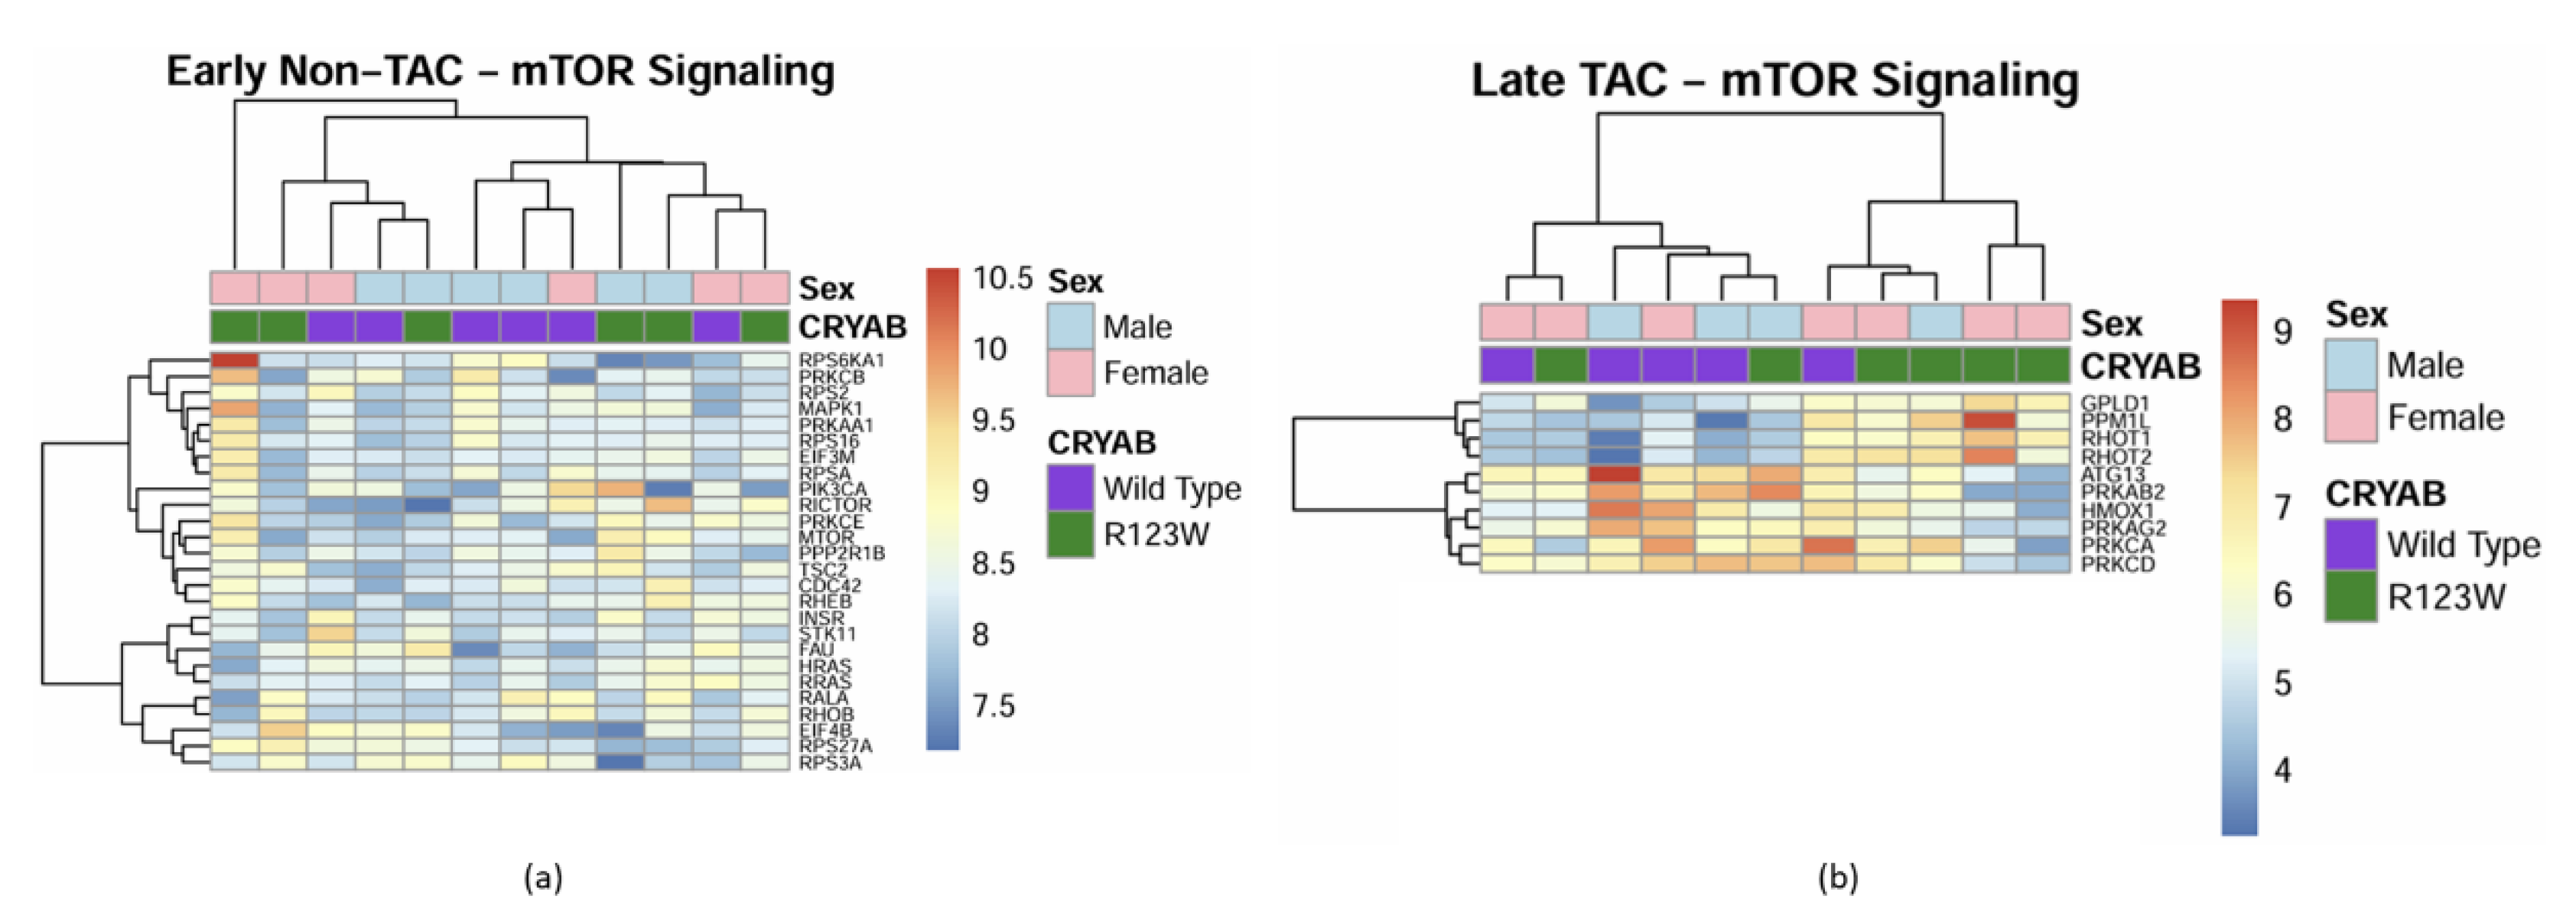
Figure 8.4.
Heatmap based on genes from the role of NFAT in hypertrophic cardiomyopathy pathway identified by IPA analysis using mass spectrometry data from wild type CRYAB (Purple) and CRYABR123W(Green) mouse heart extracts with or without transverse aortic constriction. (a) Heatmap showing results from early-stage disease in mice without transverse aortic constriction with poor clustering and gene expression differentiation; (b) Heatmap showing results from late-stage disease in mice with transverse aortic constriction with improved clustering and gene expression differentiation.
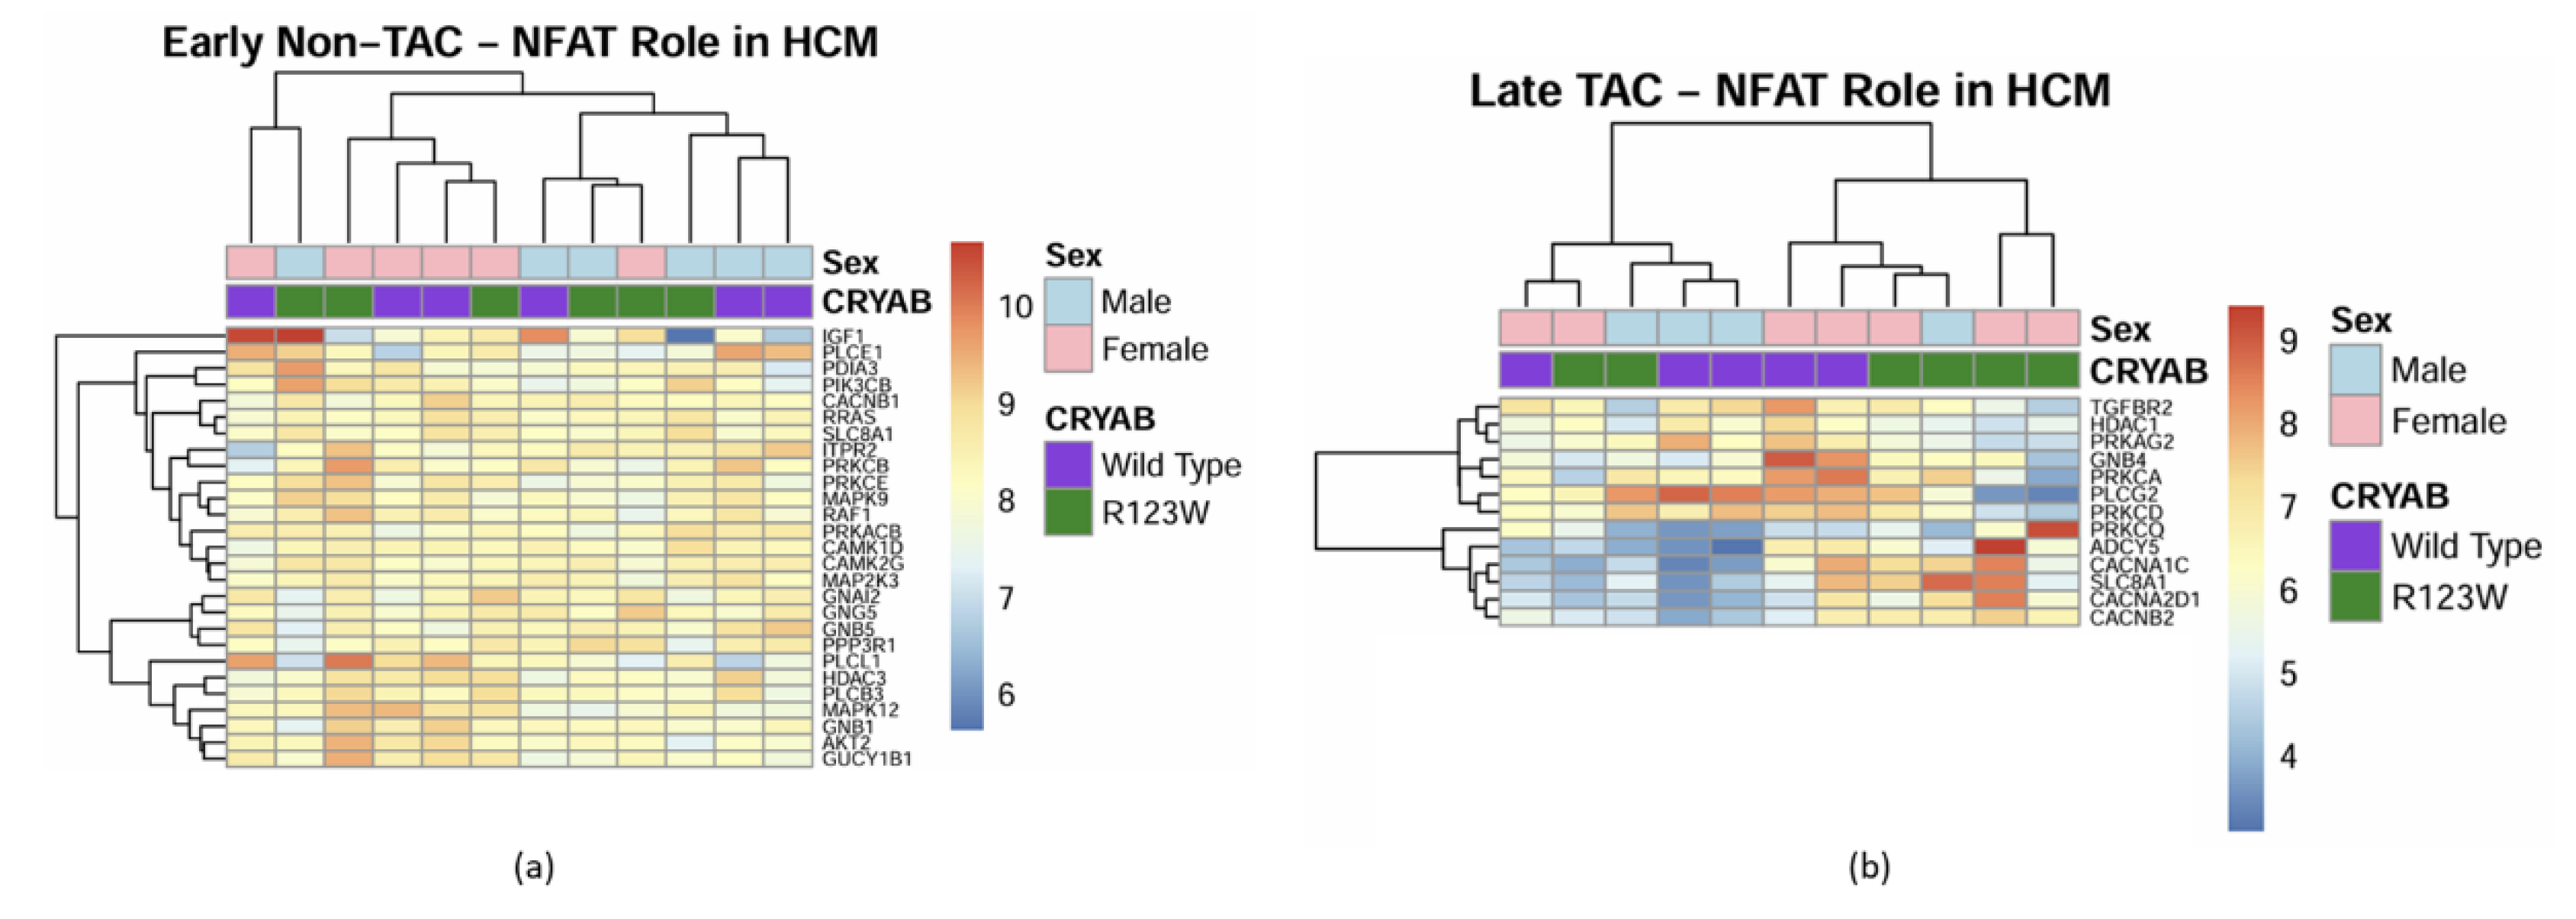
Figure 8.5.
Heatmap based on genes from the cardiac conduction pathway identified by IPA analysis using mass spectrometry data from wild type CRYAB(Purple) and CRYABR123W(Green) mouse heart extracts with or without transaortic constriction. (a) Heatmap showing results from early-stage disease in mice without transaortic constriction with poor clustering and gene expression differentiation; (b) Heatmap showing results from late-stage disease in mice with transvers aortic constriction with improved clustering and gene expression differentiation.
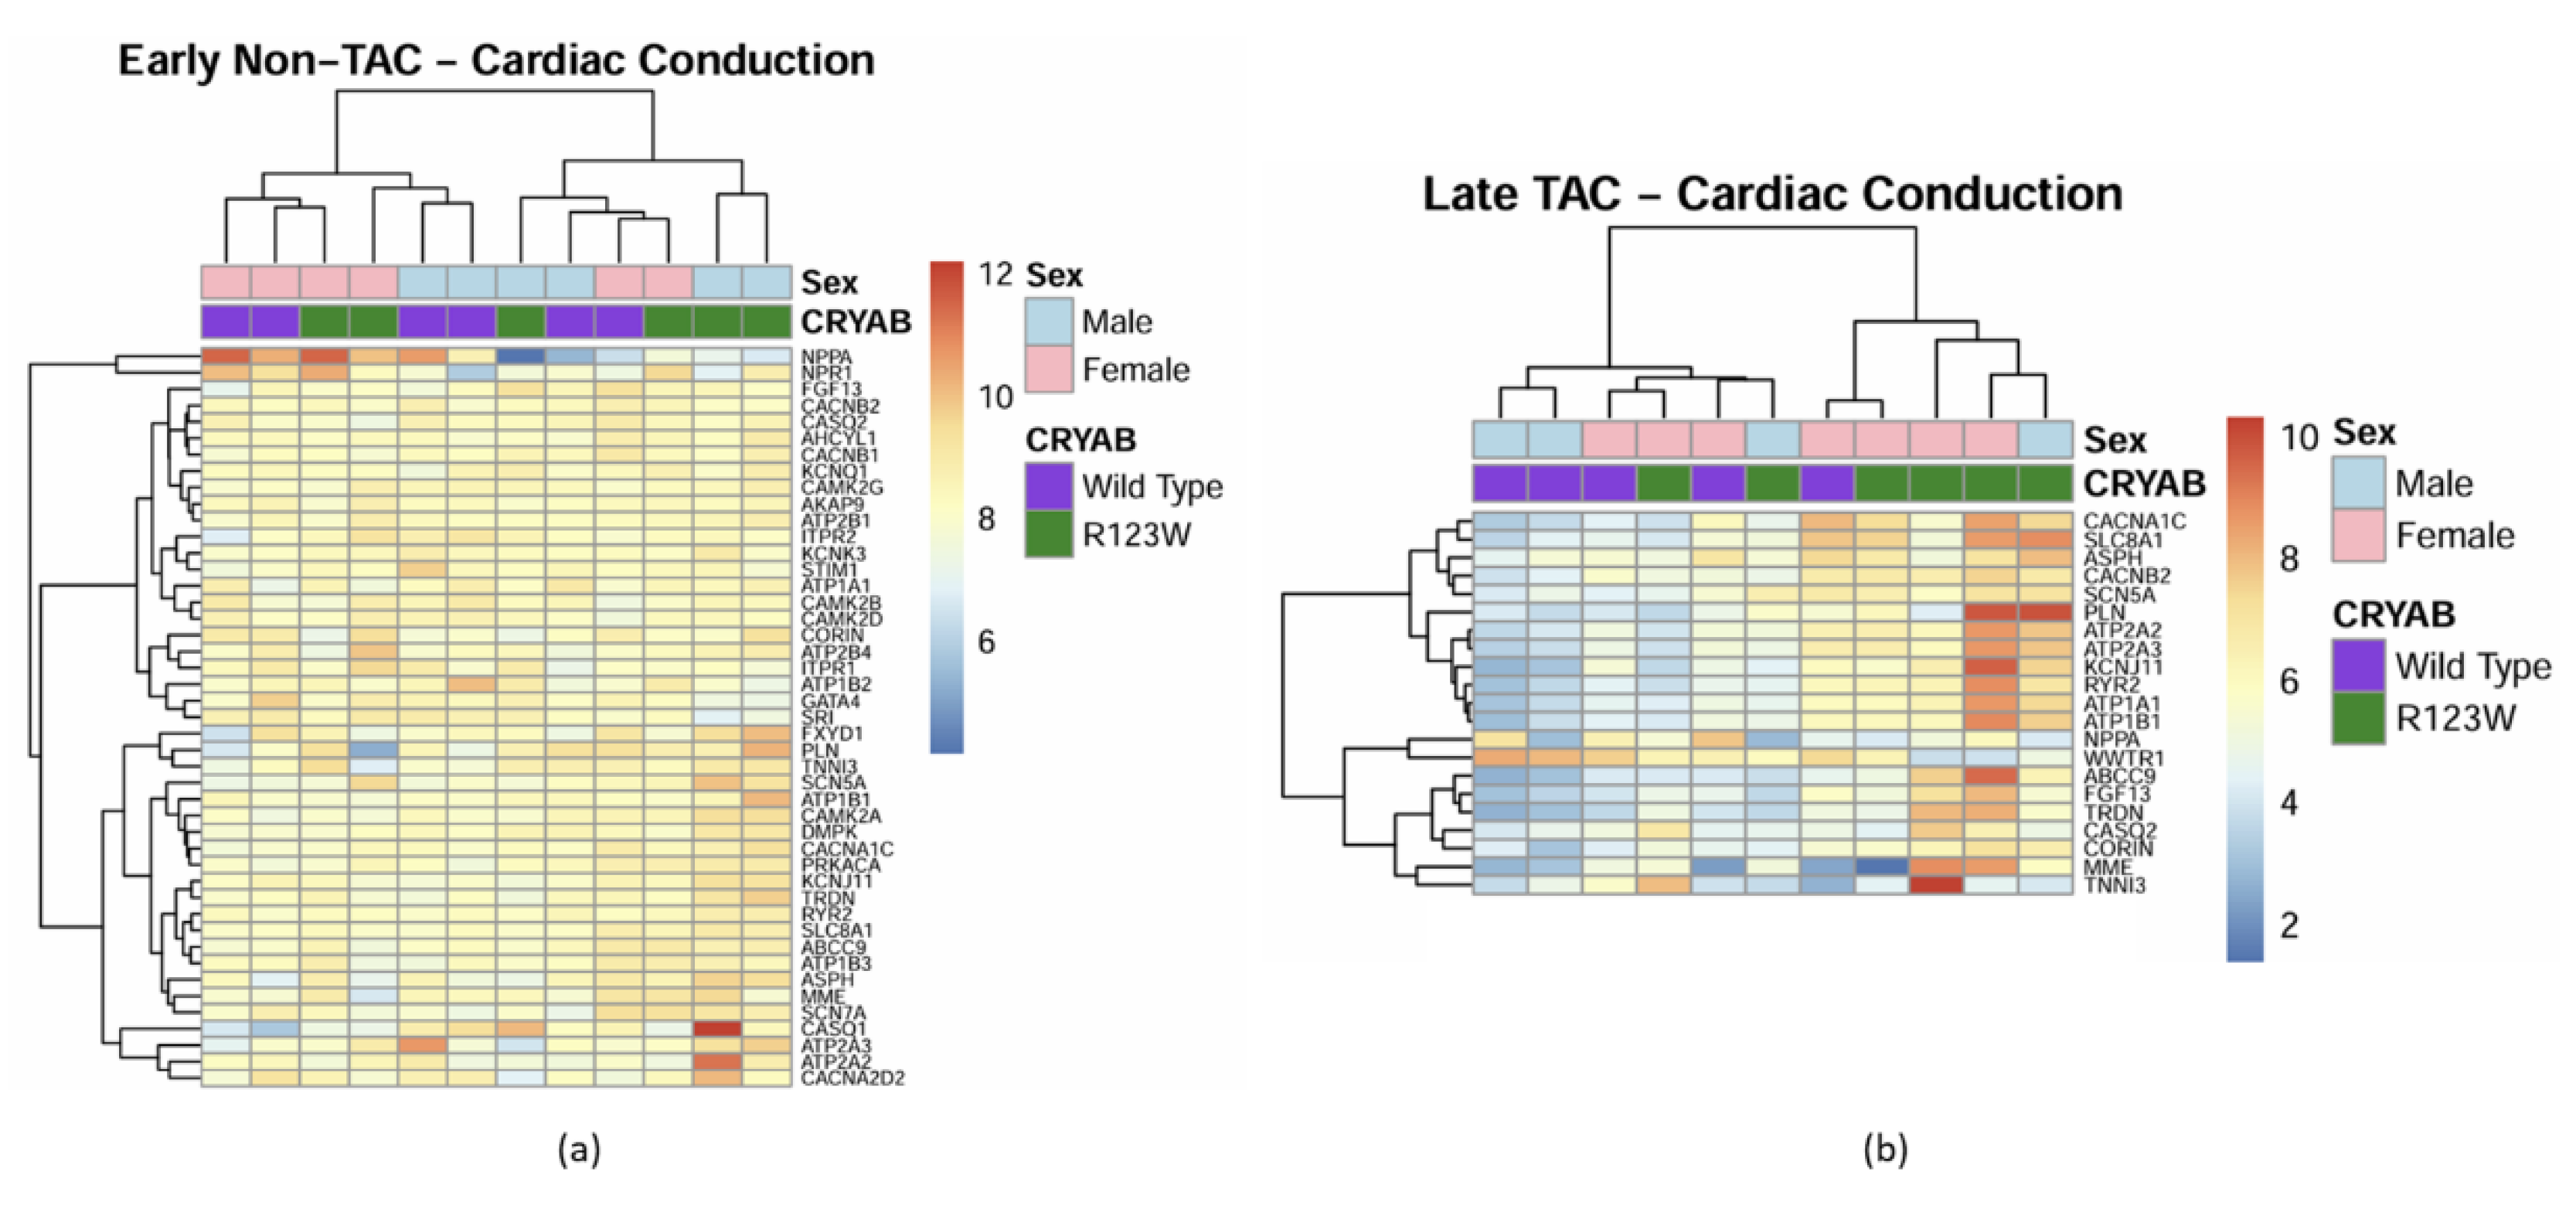
Figure 8.6.
Heatmap based on genes from the granzyme signaling pathway identified by IPA analysis using mass spectrometry data from wild type CRYAB (Purple) and CRYABR123W (Green) mouse heart extracts with or without transaortic constriction. (a) Heatmap showing results from early-stage disease in mice without transverse aortic constriction with poor clustering and gene expression differentiation; (b) Heatmap showing results from late-stage disease in mice with transverse aortic constriction with improved clustering and gene expression differentiation.
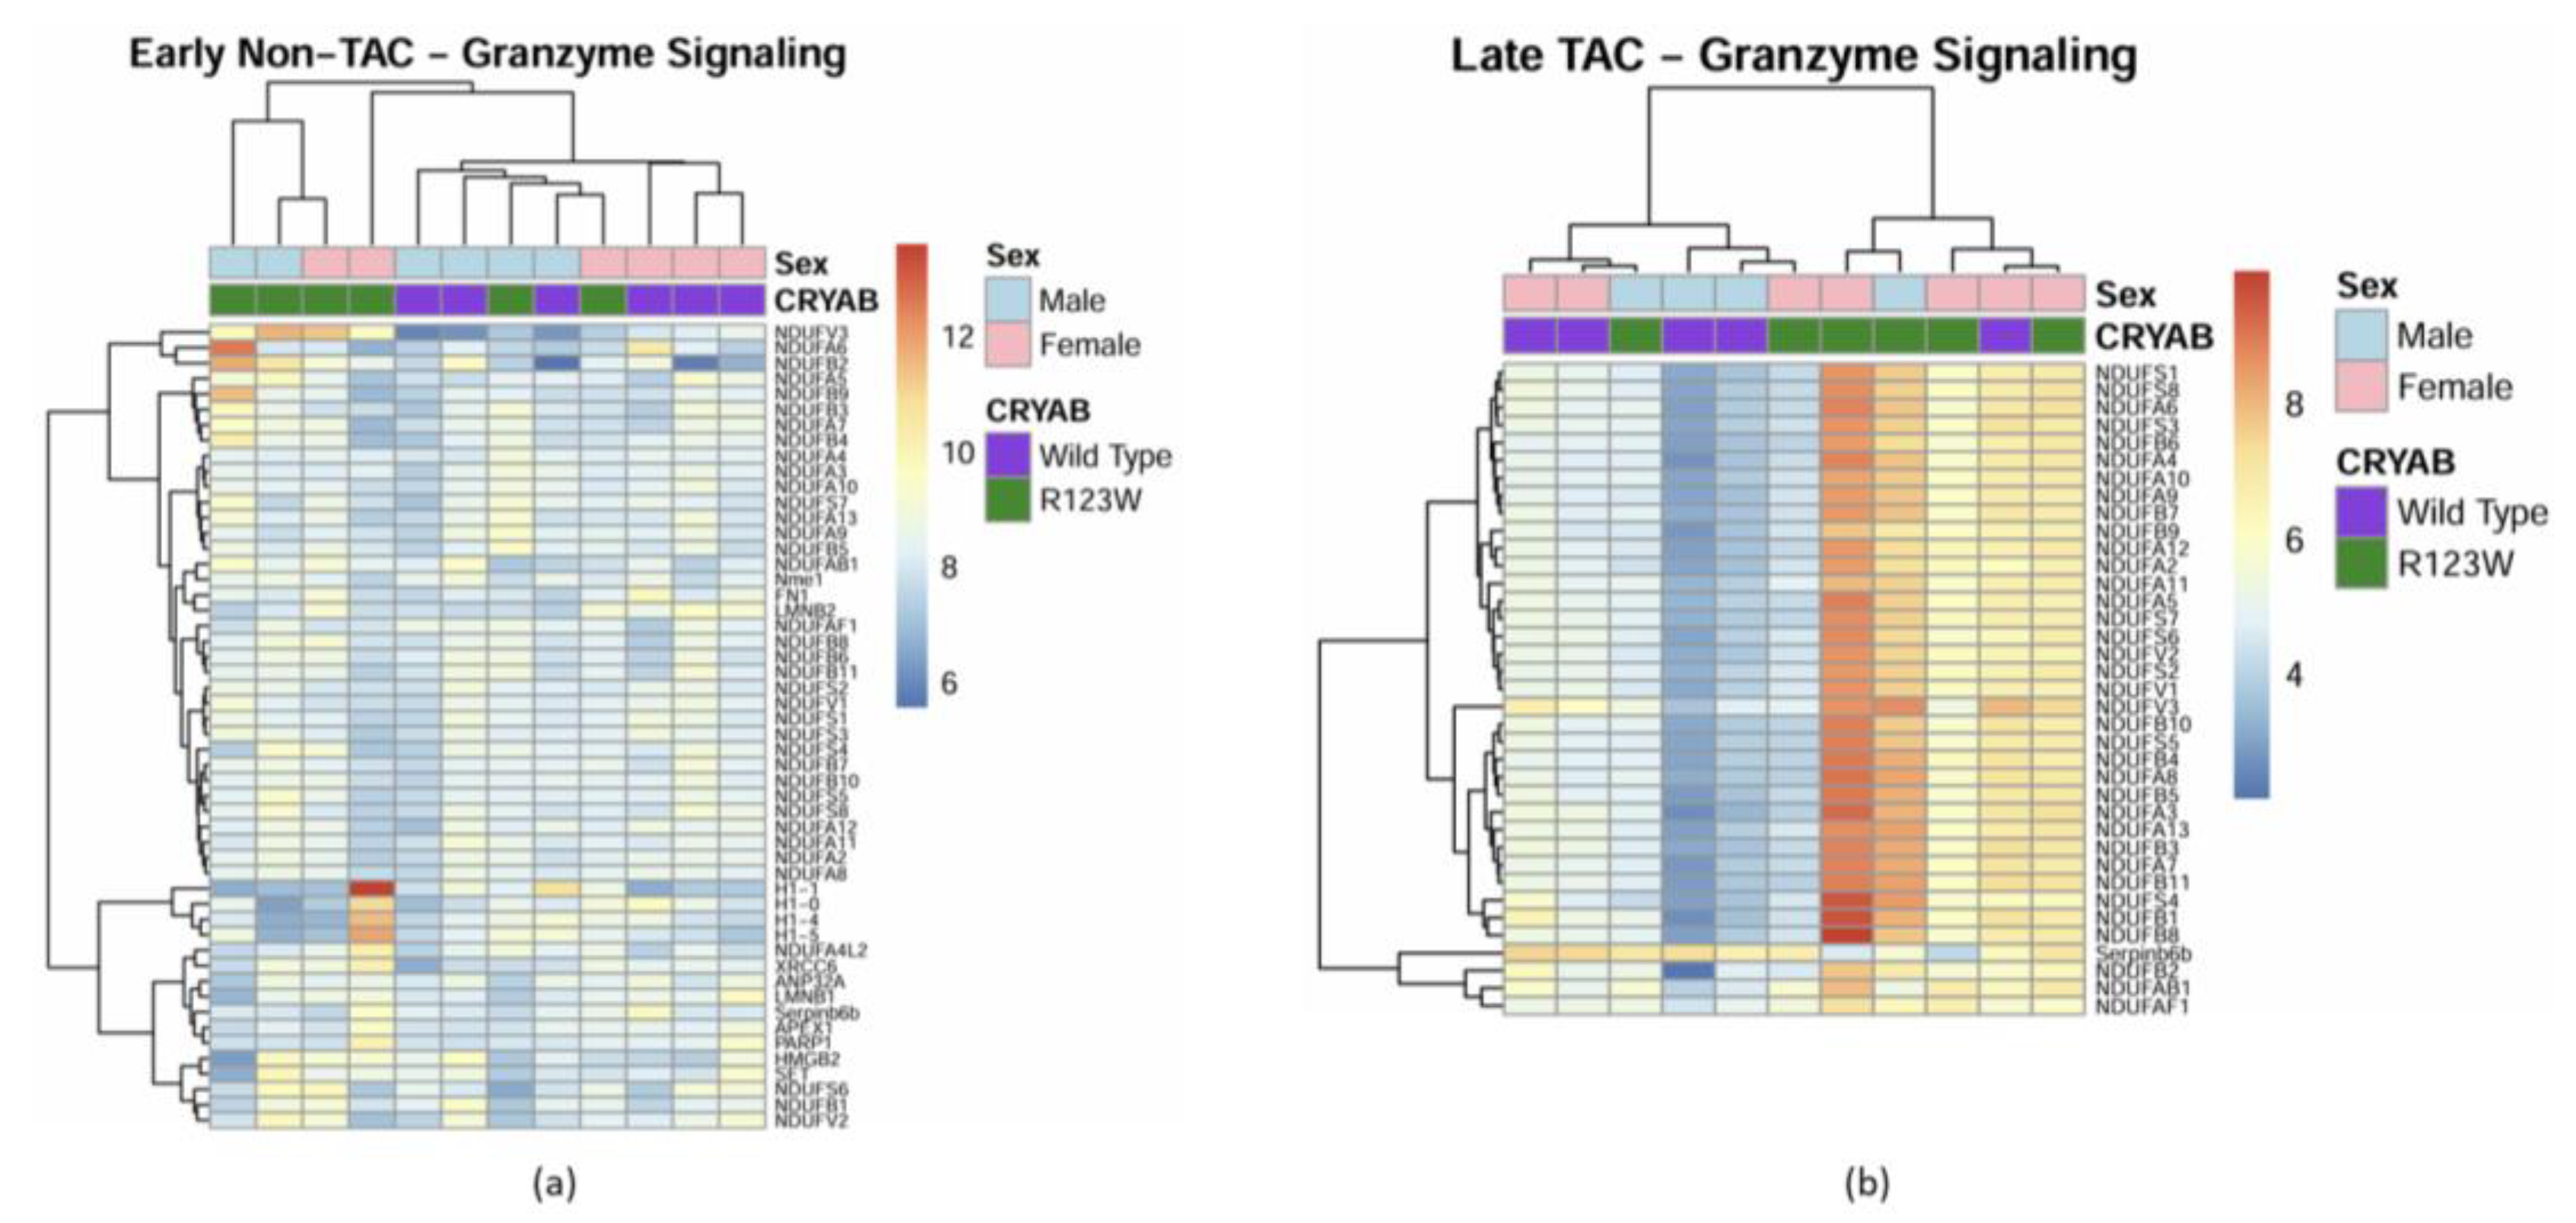
Figure 8.7.
Heatmap based on genes from the neutrophil trapping pathway identified by IPA analysis using mass spectrometry data from wild type CRYAB(Purple) and CRYABR123W(Green) mouse heart extracts with or without transaortic constriction. (a) Heatmap showing results from early-stage disease in mice without transverse aortic constriction with poor clustering and gene expression differentiation; (b) Heatmap showing results from late-stage disease in mice with transverse aortic constriction with improved clustering and gene expression differentiation.
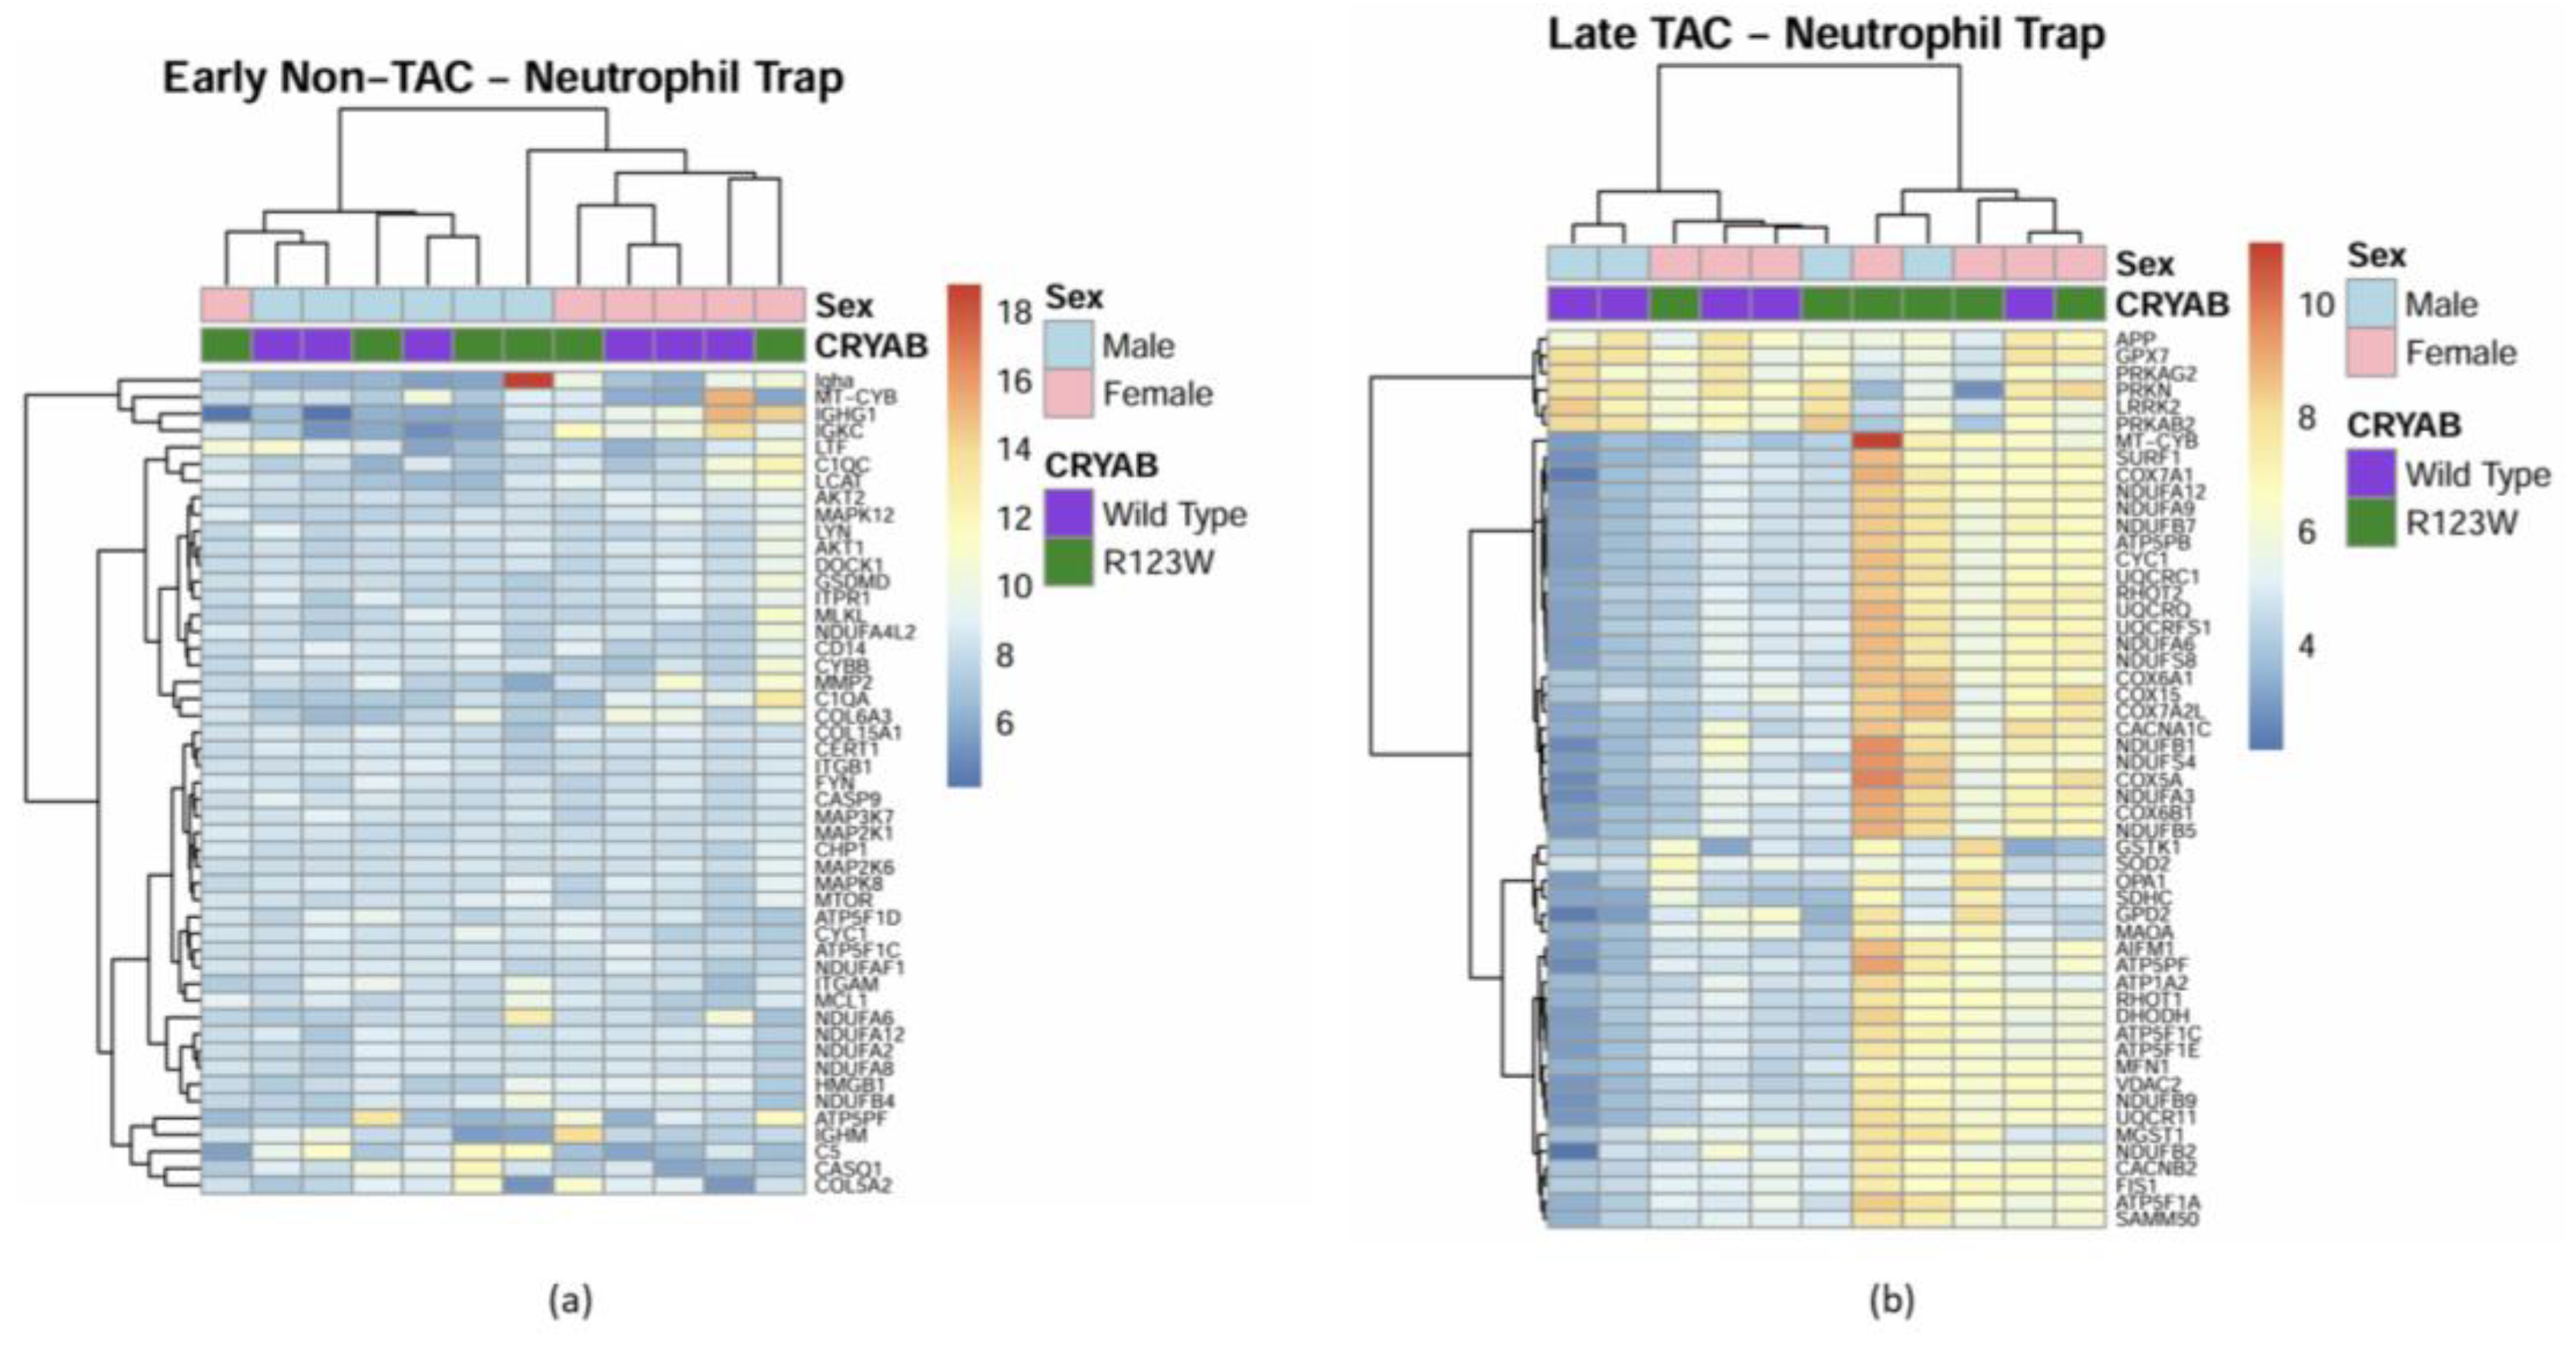

Table 1.
Common upstream regulators between our co-immunoprecipitation and global proteomics predicted to be involved in the changes in protein expression seen in our mass spectrometry data comparing wild type CRYAB to CRYABR123W with and without transaortic constriction.
Table 1.
Common upstream regulators between our co-immunoprecipitation and global proteomics predicted to be involved in the changes in protein expression seen in our mass spectrometry data comparing wild type CRYAB to CRYABR123W with and without transaortic constriction.
| Enzymes | Kinases | G Protein Coupled Receptors | Phosphatases | Ion Channels |
|---|---|---|---|---|
| DDX3X DHX36 |
EEF2K EGFR |
ADORA2A ADRB1 |
PPP3CA PTP4A1 |
KCNJ2 MCOLN1 |
| FAAH | EIF2AK4 | AGTR2 | SCN1B | |
| HRAS | FLT1 | CX3CR1 | ||
| KRAS | INSR | GPR174 | ||
| POLG | IPMK | MC5R | ||
| MAP2K6 | ||||
| MAP3K12 | ||||
| MAPK14 | ||||
| MKNK1 | ||||
| MOS | ||||
| PRKAG3 | ||||
| PRKCZ | ||||
| PTK2 | ||||
| RAF1 | ||||
| RET | ||||
| ROCK1 | ||||
| ROCK2 TGFBR2 TK1 TTN |
Disclaimer/Publisher’s Note: The statements, opinions and data contained in all publications are solely those of the individual author(s) and contributor(s) and not of MDPI and/or the editor(s). MDPI and/or the editor(s) disclaim responsibility for any injury to people or property resulting from any ideas, methods, instructions or products referred to in the content. |
© 2025 by the authors. Licensee MDPI, Basel, Switzerland. This article is an open access article distributed under the terms and conditions of the Creative Commons Attribution (CC BY) license (http://creativecommons.org/licenses/by/4.0/).
Copyright: This open access article is published under a Creative Commons CC BY 4.0 license, which permit the free download, distribution, and reuse, provided that the author and preprint are cited in any reuse.


