Submitted:
19 February 2025
Posted:
19 February 2025
You are already at the latest version
Abstract
Single-family residential buildings represent the highest share of building sector in Romania. Their operation emits the most CO2 into Earth’s atmosphere, as most of them are not energy efficient. A life cycle assessment is performed for a case study building, built in 2019 in Romania, establishing its carbon footprint. The study compares the results and extrapolate them to all single-family residential buildings in Romania, regarding CO2 emissions with an emphasis on the operational stage. The results illustrate a considerable reduction in CO2 emissions from old, high energy consumption buildings to new, low energy consumption buildings. Moreover, using a heat pump in the detriment of firewood or gas boilers decreases the CO2 emissions for the operational stage up to 34% and 26% respectively. Due to the higher cost of electrical energy compared to natural gas in Romania, gas boilers are more cost-effective than heat pumps. Because of this, and the higher implementation costs, the tendency is towards natural gas. This in turn will result in an increase of CO2 emission for the entire life cycle of the building by approximate 32% for new buildings and 86% for old, high energy consumption buildings.
Keywords:
carbon footprint
; life cycle assessment
; CO2 emissions
; construction stage
; operational stage
; demolition stage
1. Introduction
Climate Change phenomena are on the rise and their impact on the environment and society is also increasingly growing [1]. This is mainly related to global warming, which has intensified considerably in recent decades. The increase in mean annual temperature is mainly driven by rising greenhouse gas emissions (GHG), particularly carbon dioxide (CO2).
The building sector plays a significant role in global energy consumption and GHG emissions. According to a recent report by the International Energy Agency (IEA), buildings account for 37% of global energy consumption [2], taking the embodied cradle-to-grave emissions into account [3]. Of these, 27% are attributed to the operating activities of buildings, and 10% come from the production of building materials [4].
In order to limit the effects of global warming, future ambitious targets have been set globally to reduce mean annual temperatures and reduce GHG emissions. A key milestone in this respect is the Paris Agreement, signed by 195 countries at the COP21 Conference in 2015, which aims to keep the global temperature rise below 1.5 °C. The main objective of this agreement is to prevent the effects of climate change from getting worse and, to achieve it, an 7.6% annual reduction of GHG emissions by 2030 should be done [5]. Moreover, the Paris Agreement specifies climate neutrality by 2050, committing the signatory states to achieve a balance between greenhouse gas emissions and their absorption by natural or technological methods by the middle of the century.
In addition to the Paris Agreement, several complementary measures have been globally adopted to support the achievement of the targets set and to reduce GHG emissions. In the European Union, the European Climate Law, part of the European Green Deal (Green Deal), sets climate neutrality targets by 2050 and GHG emissions reductions by 55% by 2030 compared to 1990 levels. In addition, the European Union adopted the „Fit for 55”, which includes policies to increase energy efficiency and expand the share of renewable energy, by 2030, renewable energy sources constitute at least 40% of the EU's total energy consumption. These include solar, wind, biomass and hydropower.
In Romania, in 2023, the long-term strategy, named "Implementing the national energy and climate plan and developing the long-term strategy of Romania", was adopted - a key strategic document to achieve the national climate neutrality target by 2050. This strategy is part of Romania's commitments to the European Green Pact (Green Deal) and is perfectly consistent with the goals of the Paris Agreement.
In the United States of America, in 2021, the Infrastructure Investment and Jobs Act [6] was adopted. It includes important measures to reduce greenhouse gas (GHG) emissions. These include incentives to promote electric vehicles, support renewable energies and develop clean energy infrastructure. The act also provides for significant research and development investments for innovative carbon capture technologies and advanced energy solutions. In the same year, another key step happened, the US returned to the Paris Agreement, reaffirming the country's commitment to fighting climate change.
China, the world's largest CO2 emitter, has adopted strict regulations to reduce GHG emissions. Key objectives include:
- Commitment to becoming carbon neutral by 2060;
- Commitment to reduce CO2 emissions per unit of GDP by 65% by 2030 compared to 2005 levels.
Other Asian economies, such as Japan and South Korea, have introduced regulations and commitments to achieving carbon neutrality by 2050, setting clear targets for GHG emissions reductions by 2030.
In conclusion, both in the European Union, the United States and Asia, key legislative measures have been implemented to reduce GHG emissions. These regulations play a crucial role in fighting climate change and in achieving international goals. Although the approaches vary according to the specific economic and political context of each region, all these measures reflect global commitments to reduce greenhouse gas emissions and promote a sustainable future.
Figure 1 [7] presents global collected data from Global Building Emissions [8], representing the total global energy related CO2 emissions. According to it, globally in 2022, the building sector was one of the three major carbon emitting sectors (along with transportation [9] and industry [10]), adding up to around 14 Gt (Figure 1A) of the total energy-associated global CO2 emissions that were 36 Gt. These carbon emissions from the operation of buildings, called operational carbon, reached a record level of almost 10 Gt (Figure 1B) [7]. Between 2000 and 2022, carbon emissions per usable area gradually decreased, reducing carbon intensity in global building operations by more than 1.5% per year. Although decarbonization efforts in emerging economies are progressing, they have proven to be less effective than those in developed economies (Figure 1C).
During the lifespan of the building several stages can be identified such as preconstruction, construction, operation, maintenance and demolition [11]. In all these stages buildings emit GHG in different quantities [12,13,14]. The operational GHG emissions of a building are considered to be higher than its incorporated emissions [15], so an important role in reducing them is decreasing energy consumption and the use of renewable energy sources such as heat pumps systems [16], solar assisted heat pump systems [17], photovoltaics [18], multi-purpose envelope like a Trombe Wall [19], etc.
The challenge to decrease GHG emissions according to targets set within the Paris Agreement is two-fold: (i) reducing emissions associated with the energy demands during the operational phase of buildings, for which several different technologies already exist and are increasingly applied [20,21,22,23,24] and (ii) lowering so-called embodied GHG emissions, associated with the manufacturing, maintenance and end-of-life of building materials, which are found to be a hidden major issue for effective decarbonisation of the built environment [4], [25].
The aim of this study is to analyse the life cycle of single-family residential buildings, with an emphasis on the operational stage. The assessment is based on the data registered on a case study building and extrapolated for typical single-family residential buildings in Romania, encompassing new buildings as well as older existing buildings.
2. Residential Buildings Sector in Romania
The building sector consists of approximately 5.6 million buildings, covering a total heated useful area [26]. The largest share is represented by residential buildings, which account for approximately 90% of the entire building sector, adding up to 582 million m², as seen in Figure 2.
Nationwide, the total energy consumption for buildings is approximately 9.52 Mtoe, with over 81% consumed by residential buildings and the remaining 19% by other types of buildings. Because of this, it can be considered that the building sector is the one with the highest potential to make significant reductions in energy consumption and GHG emissions reduction through thermal rehabilitation and using renewable energy sources.
At the end of 2023, the housing stock in Romania included 9,722,223 homes, with a total liveable area of 474,517,092 m². Of these, 58% were in urban areas, representing 55% of the country's habitable area, while the rest were in rural areas.
In recent years, there has been a slow growth in housing stock in Romania. New-build houses annually have a small share, approximately 0.7%, of the total existing ones, data presented in Table 1. Replacing old buildings is done at a very slow pace, the percentage of demolished houses annually being only 0.06% of the total existing ones.
A defining aspect of the housing stock is that about 98% of existing houses are privately owned. This makes it difficult to rehabilitate them on a large scale without adequate awareness of the owners regarding the advantages brought by modernization. Also, about 47% of houses were built before 1970, and over 83% of them date back to 1989, as presented in Figure 4.
The residential buildings built before 1989 are distinguished by a low level of energy performance, having an energy consumption between 150 and 400 [kWh/m²year]. Thermal energy is the dominant component of total energy consumption in the residential sector, reaching values of up to 55% for collective residential buildings and up to 80% for single-family residential buildings [28].
A real improvement in the energy performance of residential buildings was achieved after 2000, when the energy consumption decreased below 200 [kWh/m²year]. Energy-efficient buildings are those constructed after the implementation of the Methodology for calculating the energy performance of buildings, indicative Mc 001-2022 [29] and have an energy consumption of less than 80 [kWh/m²year], presented in Table 2.
This housing stock structure underlines the importance of modernizing and energy efficiency of existing buildings to reduce energy consumption and increase sustainability in the Romanian construction sector. Due to the fact that 58% of the building sector in Romania represents single-family houses and that 50% of the primary energy consumption is used for the operation of residential single-family buildings, this study undergoes a Life Cycle Assessment (LCA), for single-family building. For this, a case study building was analysed, and multiple solutions for decreasing CO2 emissions are investigated.
3. Materials and Methods
3.1. Case Study Building
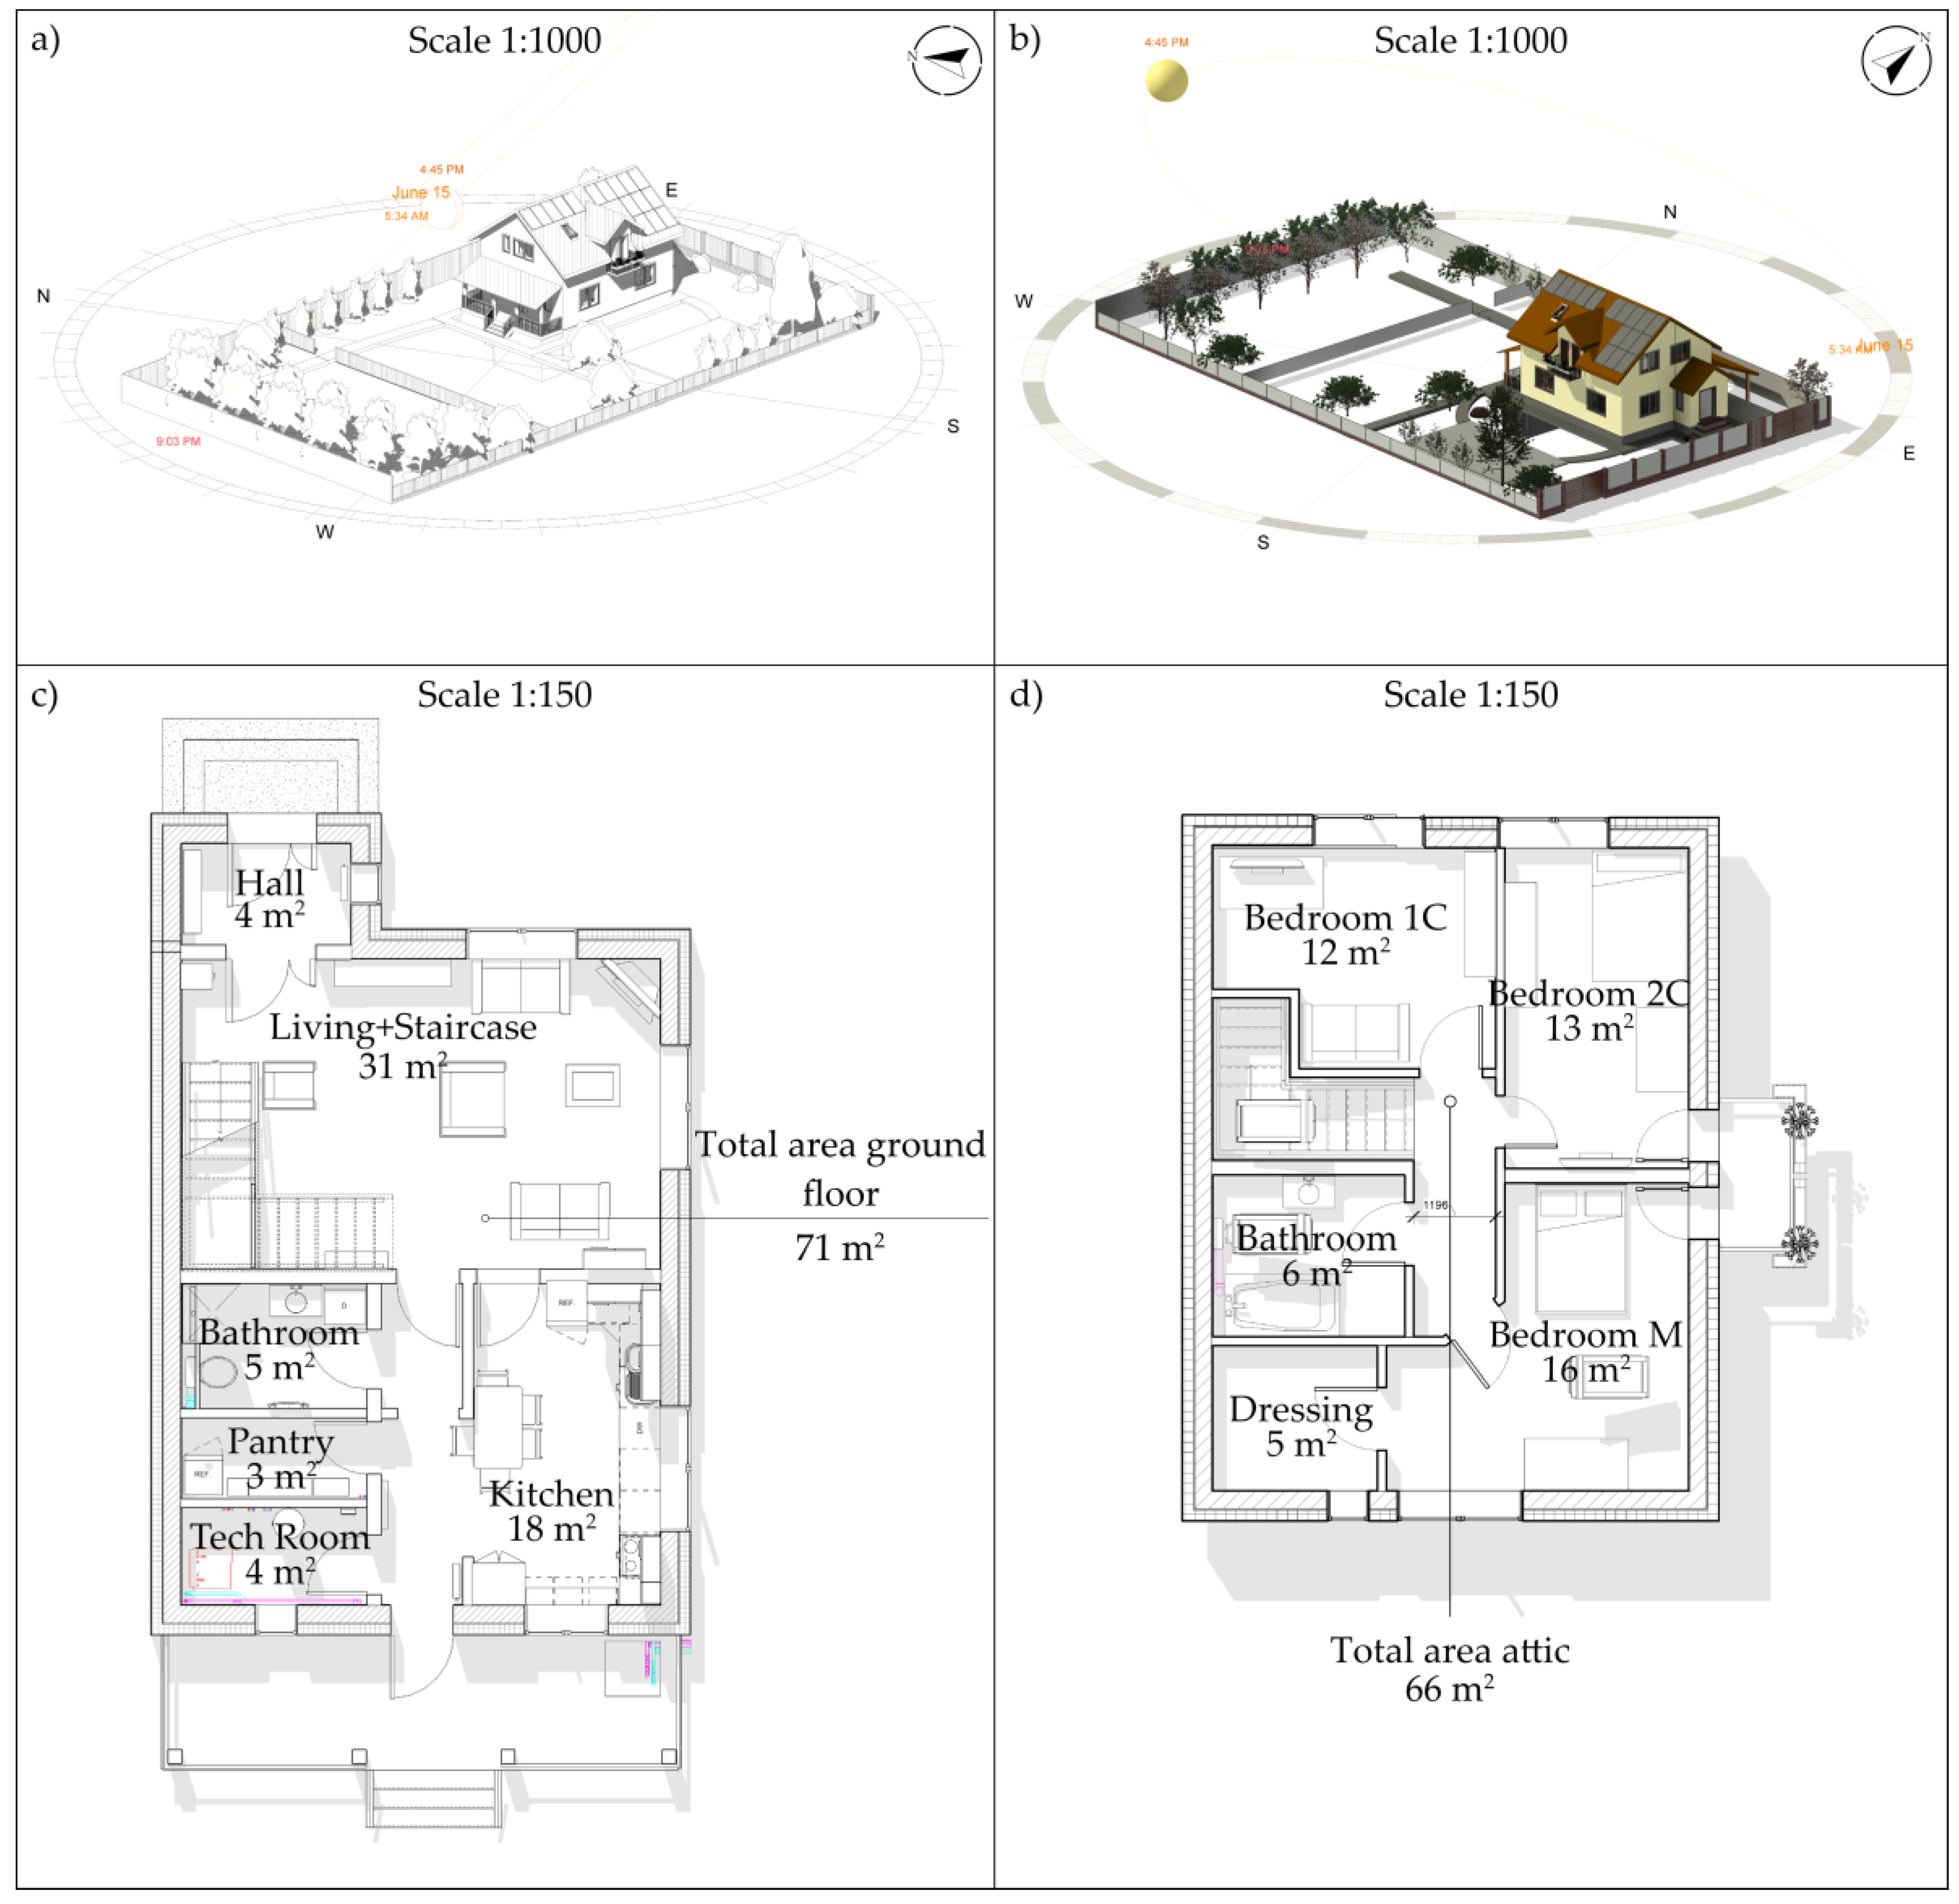
The case study building considered in this paper represents an existing single family residential building with the gross floor area of approximate 160m2, on two levels, ground floor and attic. This building is representative for a common building type in the region of Brașov, and it is also equipped with renewable energy sources systems. The building is located in a typical suburban residential area near Brasov, in Romania, at approximatively 45° 37’N and 25° 28’E. Orientation is S-E 25°. Figure 6 presents the ground floor and attic plans and the aerial 3D view extracted from the design stage of the building.
The case study building was constructed in 2019, before the nZEB methodology for calculation of energy performance of a building was approved in Romania (Mc001/2022) [29], but measures to ensure a lower energy requirement were implemented. The structure of concrete and bricks is insulated with mineral rockwool of 15cm (Figure 5), ground slab was insulated with 8cm of extruded polystyrene. The sling roof was covered with tiles and is insulated with 30cm of mineral rockwool as well. In addition, three-layer glass windows with solar protection and inert gas were used to reduce the heat transfer and maintain a comfortable indoor climate throughout the year. In Table 3, the U-value is presented. The building plinth, foundation walls, terrace and exterior stairs were thermally insulated with 10cm and 5cm of extruded polystyrene respectively, for eliminating the thermal bridges with the surrounding ground.
Figure 5.
Photographs of the mineral wool insulation of the case study building during the construction stage, in 2019
Figure 5.
Photographs of the mineral wool insulation of the case study building during the construction stage, in 2019
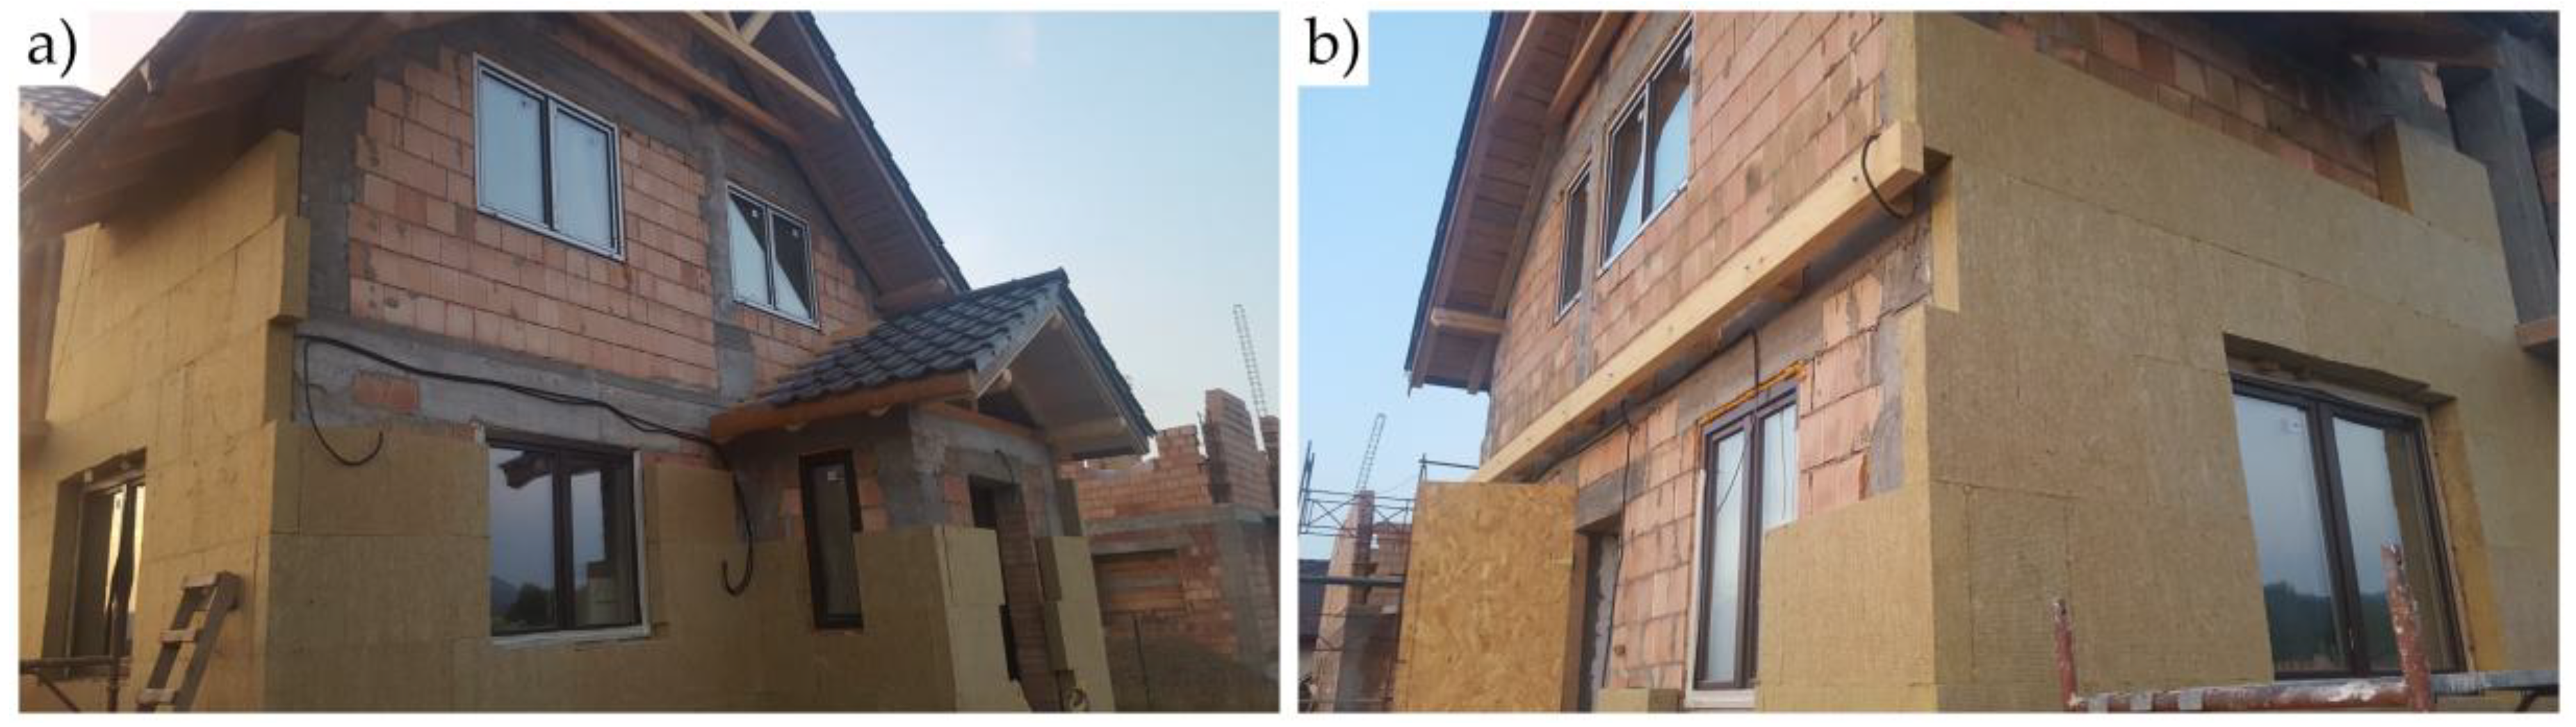
Figure 6.
The Case Study Building: a) south-west 3D view; b) south-east 3D view; c) ground floor 2D layout; d) attic 2D layout
Figure 6.
The Case Study Building: a) south-west 3D view; b) south-east 3D view; c) ground floor 2D layout; d) attic 2D layout
The heating load is covered with a ground source heat pump, NIBE F1255-6R, which covers also the domestic hot water with a built-in boiler of 180l. The heat pump collects a proportion of the ground's stored solar energy by means of a horizontal collector that is buried in the ground at approximatively 2m deep. There are 4 circuits of PE Ø40mm PN10, presented in Figure 7 with a total length of approximatively 360m, each one arranged in a non-uniform closed single loop. The pipes are connected to a manifold in the basement, under the terrace, and from there to the technical room.
The F1255-6R heat pump is equipped with an inverter-controlled compressor and variable speed circulation pumps and it offers a thermal output of max 6 kW. This model is designed to ensure high efficiency in heating, with a coefficient of performance (COP) between 4.5 and 5.0 at 35°C for water heating. The NIBE F1255-6R (Figure 8) can also provide passive cooling, depending on system configuration. Using refrigerant R-407C, which is efficient and has a low environmental impact, this heat pump helps to reduce carbon emissions and energy costs. Its advanced features include quiet operation, precise temperature control and the ability to integrate renewable energy solutions. As back-up it has integrated an electrical heater of 0.5-6.5kW that automatically starts as necessary.
Underfloor heating is presented in Figure 9. It was selected as an efficient and comfortable heating solution that ensures even heat distribution throughout the building. This system uses hot water heat pipes (Rehau PE-Xa Ø16mm) mounted under the floor to radiate heat directly into the living space, eliminating cold areas and creating a uniform indoor environment. The underfloor heating system installed in combination with the NIBE F1255 heat pump optimizes performance and energy efficiency as it operates at lower operating temperatures, which contributes to substantial energy savings. Its installation not only improves thermal comfort, but also maximizes the useful space of the dwelling, eliminating the need for traditional radiators and contributing to significant energy savings. Distribution is made through 2 manifolds, one for each floor, and 5 circuits on each floor. The 2 bathrooms and 2 entrances are equipped with radiators on each of the rooms, connected on separate circuits but on the same thermal agent temperature range.
The use of renewable energy sources in the building for various applications such as water heating, heating/cooling and electricity generation is a defining feature for nZEB aspiring buildings. The main objectives of the deployment of renewable energy technologies are to reduce the use of fossil fuels and reduce CO2 emissions. Thus, a photovoltaic system of 6 kWh (Figure 10) was mounted composed of 16 panels Canadian Solar of 380 Wp and 1 inventor of 6 kW triphasic which made that overall electricity intake from the national grid to be reduced by almost 50%, from the total energy consumption of the building.
A 3D and energy model were developed in Revit in the early design phase of the construction for quantities assessment and energy performance calculations, presented in Figure 11. This ensured an exact quantities assessment for the construction phase, reducing the costs and increasing the construction efficiency.
Table 4 presents the construction quantities extracted from the Revit model. These quantities were used in the construction stage and the difference between the Revit obtained quantities and the real quantities used in construction was insignificant. The energy consumption (Table 5) and energy production (Table 6) have been registered since the building had been constructed, in 2019, but the first year-round data is 2020. The PV panels have been installed in 15 August 2022 and the electrical energy production has been registered since then. PV panels are used to supply electrical energy for HVAC, lighting and electrical equipment. However, the heat pump is only used for heating purposes, as presented in Table 5 and 6, the months May to August the heat pump is mostly off, only heating domestic hot water. This overlaps with the period in which the PV panels produce the most energy. The surplus is sold back to the national electrical grid.
Figure 12 presents the registered data from Table 5 and Table 6, in yearly amounts. The negative values represent the energy consumption for and the positive values represent the energy production for the Case Study Building. The thermal energy produced by the heat pump varies strictly depending on the mildness of each winter season, as it is only used for heating and not for cooling.
3.2. Life cycle CO2 emissions mathematical model
The mathematical model used for the calculation of the CO2 emissions has been described in the “2006 IPCC national greenhouse gas inventory categories” in [31], used in earlier research as well [32]. The life cycle CO2 emissions are separated into three categories, representing the building construction stage, the building operational stage and the building demolition stage. Each category can be divided into multiple operations that contribute to the total CO2 emissions in the atmosphere, as presented in Figure 13.
Therefore, the equation used for the calculation of the CO2 emissions during the building life cycle is:
where C, represents the total emissions during the building life cycle; Ccs, represents the total emissions during the building construction stage; Cos, represents the total emissions during the building’s operation stage; Cds, represents the total emissions during the building demolition stage and Csv, represents the total carbon sequestration from the vegetation surrounding the building inside its own property.
During its entire construction stage, building materials are produced from raw materials, transported and used during the actual building construction. The equation used to calculate the construction stage CO2 emissions is:
where Cmp, represents the total emissions from the building materials production; Cmt, represents the total emissions from the building materials transportation and Cc, represents the total emissions from the building construction.
The CO2 emissions from the building materials production, Cmp, is calculated for each of the materials used for the building construction with the following equation:
where Qmp,i, represents the quantity of each “i-th” material used for the construction, in [t] and CEFmp,i, represents the carbon emissions factor for each “i-th” material in [t CO2/t]. The carbon emissions factors in Table 7, are collected from the existing literature [33].
The CO2 emissions from the building materials transport, Cmt, is calculated for each of the materials used for the building construction that are being transported by any means of transport. In Romania the main transportation type represents diesel or gasoline trucks with the following equation:
where Qmt,i, represents the quantity of each “i-th” material transported, in [t] and CEFmt,i, represents the carbon emissions factor for each “i-th” material, which has the value of 1.68×10⁴ [t CO2/km] for land transportation [34] and di, the transportation distance in [km].
The CO2 emissions from the actual construction itself, Cc, is calculated summing the emissions from all the processes happening during construction, with the equation:
where Ccee, represents the total CO2 emissions generated from the electrical energy usage; Ccle, represents the emissions generated from excavation and landscape on building site and Ccit, represents the transportation from the building site, horizontal or vertical, from the equipment needed for the construction itself. The following equations are used:
where the detailed information for the parameters in equations (6), (7) and (8) are presented in Table 8.
The operation stage of the building represents the longest period in which CO2 is emitted into the atmosphere, which is considered 50 years according to existing literature [32]. The equation used to calculate the operation stage CO2 emissions is:
where CHVAC and EEHVAC, represents the total emissions or the total electrical energy consumption for heating, cooling, ventilation and air conditioning; CLIGHT and EELIGHT, represents the total emissions or the total electrical energy consumption for artificial lighting; CEQUIP and EEEQUIP, represents the total emissions or the total electrical energy consumption for everything else that use electricity and it is not lighting and n, represents the building lifespan duration.
The demolition stage of the building represents the amount of CO2 emissions during the building’s life cycle end. The equation used to calculate the demolition stage CO2 emissions is:
where Cbd, represents the total emissions from the building demolition process, generated from the machinery used to take down the building in [t] and Cdw, represents the total emissions from the demolition waste transportation in [t].
The emissions from the demolition process itself are calculated with the equation:
where CEFde, represents the emission factor for the required energy for demolition machinery in [kWh/m2], Agf and CEFee, representing the gross floor area and electrical energy emission factor that were previously described.
The emissions from the demolition waste transportation are calculated with the equation:
where Qmt,i, represents the quantity of the transported materials, that were used same as the quantity of the construction materials, in [t], CEFdt, represent the emissions from the demolition waste transportation in [t/t×km] and di the transportation distance.
The landscape around the building has an important role in the CO2 emissions for the building life cycle, due to the carbon sequestration from the surrounding vegetation, Csv. The equation used for its calculation is:
where CRb, represents the carbon ration of the ground biomass, with the value of 0.47 [tcarbon/tdry biomass], AIb, represent the annual increase in the ground biomass, with the value of 8 [tdry biomass /acres × years], Ap, represents the total green area of the building property, n represents the lifespan period of the building.
4. Results
4.1. Life Cycle Analysis for the Case Study Single Family Residential Building
Carbon Footprint represents the mark that the GHG emissions leave on Earth’s atmosphere. To assess the impact, a Life Cycle Analysis (LCA) is performed, obtaining an overall perspective for the three main stages a building can be: construction, operation and demolition [36]. The LCA of this study is based on the mathematical model presented in chapter 3.2, used for the case study building presented in chapter 3.1. Table 9 presents the results obtaining from the mathematical model, according to which the materials production sub-stage has the highest calculated value of CO2 emissions. This is mainly because the building situates in A+ Romanian energy class (that requires under 67 [W/m2×year] energy consumption).
Figure 14 presents the results with better visualization. The CO2 emissions for HVAC represent approximately a quarter of the total amount, just below the construction materials production percentage. From the total 7,26% that encompass all the other sub-stages, the highest generation of CO2 emissions over the full life cycle, is represented by the building electrical equipment usage.
Although the results show that most of the improvements should be done in the materials production sub-stage, this case study building is not a perfect representation of the single-family residential buildings that are being built today in Romania. Most of them even if they do have as good of a thermal insulation degree as the case study building are not using heat pumps or photovoltaic panels to help mitigate the negative impact the building will have in its entire lifespan for Earth’s atmosphere. Due to the high investment cost for such systems the average Romanian family will choose a gas boiler over a heat pump and no photovoltaics. The photovoltaic panels have been changing in the past years although due to the government policies to subsidy approximate 4000 € for each individual system that is installed. Even so, a lot more government policies should be set into motion for reaching the goals set by the Romanian Energy Strategy [37].
The electrical energy conversion factor for the GHG emissions in Romania is 0.278 [kg CO2/kWh] [38], according to the latest data published by the Romanian Government. This value represents the average of the individual values based on the fuel used for electrical energy production. In 2024, electrical energy production is almost evenly split between hydro (28%), natural gas (20%), nuclear (21%), coal (14%), wind (12%), solar (4%), biomass (1%), according to Romanian electrical energy transport entity “C.N.T.E.E. Transelectrica S.A.” data [39].
4.1.1. Construction Stage
This stage is the highest CO2 emissions generator for the case study building. Almost all the emissions are solely generated by the materials production sub-stage as materials transport and building construction generated less than 2% each from the total of 177.55 [t CO2], as presented in Figure 15.
The CO2 emissions factors used for the materials production are presented in Table 7, from existing literature. The average distance used for materials transportation resulted close to 50 km therefore this value was chosen as the distance of materials transportation to the construction site. For the building construction sub-stage, a total of 10,069 kWh/m2 of buildings GFA was consumed and registered with the construction site energy meter. Also, a total of 742 cubic meters of soil was excavated and landscaped by the end of the building construction. A total of 167.08 tons of material have been maneuvered on the building site with an estimated accumulated distance of 5 km.
4.1.2. Operation Stage
Second highest CO2 emissions generator was the operational stage. The total emissions from the operational stage were 76.19 t CO2, with HVAC representing 86% of the total, as presented in Figure 16. The period for the operational stage was considered 50 years. From the registered energies the yearly average value for HVAC is 5 [MWh/year], for Lighting is 0.25 [MWh/year] and for Electrical Equipment is 0.5 [MWh/year].
The energy consumption for HVAC for the case study building with a total GFA of 160 [m2], is 31.25 [kWh/m2year], which places the building between A+ and passive house energy consumption, the latter requiring less than 15 [kWh/m2year].
4.1.3. Demolition Stage
The demolition stage is the least CO2 emissions generator by far. Out of the total emissions for the entire lifespan of the building is only 1.38%, with actual building demolition generating more than double than the waste transportation as presented in Figure 17. The total quantity of transported materials was considered the total quantity of the construction materials. Moreover, the distance between the demolition site to the waste disposal area was considered 15 km representing the distance from where the construction is now for the case study building.
The carbon sequestration from the vegetation was also calculated for the case study building for the 50 years lifespan considered. The approximate vegetation area belonging to the case study building on its property is 750 [m2]. Benefitting from this generous outdoor area, the resulting CO2 sequestrated by the vegetation is 127.52 [t CO2]. Considering that the total CO2 emissions, representing the carbon footprint of the case study building is 257.29 [t CO2], the carbon sequestration can absorb 49.5% of it. This result marks the importance of a green outdoor area for the single-family residential building, and how a well-planned neighbourhood can improve the carbon footprint of the buildings. Figure 18, illustrates how the carbon sequestration will reduce the total Carbon Footprint of the case study building to 129.76 [t CO2], representing only 50.5% of the total.
4.2. The Evolution of Carbon Footprint Over Time for Single-Family Residential Buildings in Romania
Historically, in Romania building with energy efficiency in mind is quite a recent phenomenon. Even if since its EU adherence in 2007, Romania pledged to fulfil the Energy Performance Building Directive (EPBD)[37], the general mindset of the people was unhinged for many years. Since 1990, residential buildings in Romania started to improve, firstly by increasing the thermal insulation degree of the building envelope and afterwards by using renewable sources technologies such as heat pumps and photovoltaic panels. Moreover, the CO2 emissions factor for the electricity production has improved over time. Today its value is less than half of the 2007 value of 0.566 [kgCO2/kWh] [40]. The emissions factors from electrical energy generation in Romania and other representative countries in the world are presented in Table 10 for the past 5 years.
Energy consumption for heating for single-family residential buildings has decreased considerably, according to data from the Ministry of Development in Romania that was presented in Table 2 in Chapter 2. Without the use of a heat pump, the residential buildings in Romania are either heated by either gas or firewood boilers. Therefore, the carbon footprint can be calculated for the operational stage for an earlier period of time, varying the energy consumption for heating and using the CO2 emissions factors for natural gas, 0.205 kg CO2/kWh and for firewood, 0.39 kg CO2/kWh [38].
This study aim is to also analyse the CO2 emissions from the operational stage of the building and its evolution over time in Romania for single-family residential buildings. Therefore, the base of the analyse represents the case study building. Figure 19, presents the results for the HVAC operational sub-stage over the years in Romania, with the average heating consumption for a typical single-family residential building (Table 2). The impact of the implementation of European Union measures is visible as in less than 20 years the carbon footprint dropped 4 to 5 times for HVAC operational sub-stage, mainly from increasing the thermal insulation degree.
The highest decrease has been for the single-family residential buildings that are heated with natural gas. Since 1989 to 2023 the CO2 emissions dropped from 574 t CO2 to 114 t CO2., meaning 5 times less. For the firewood, the decrease was only 4.4 times less but the overall amount was higher, the emissions decreasing from 963 t CO2 to 218 t CO2.
With the resulted data for the case study building, the life cycle CO2 emissions can be analysed by using the operational stage emissions form the past years averages presented in Figure 19. The resulted data is presented in Figure 20. For the case study building, the CO2 emissions share for the operational stage is only 29.61%. For passive house energy consumption for HVAC requirements this share decreases to 18.73%.
However, when compared with the shares for firewood and natural gas for a typical building in 1989, it is clear that energy consumption for the operational stage has improved. Up until 2000 the operational stage share for firewood was above 80% and for natural gas above 70%. For the entire period of 2000-2023 the decrease was negligible, with only 3-6% decrease. The highest decrease is recorded for buildings built since 2023, where the operational stage share is less than the construction stage shares for natural gas and close to it for firewood. With the decrease of the operational stage share of CO2 emissions for single family residential buildings, the emphasis on the construction stage shares of CO2 emissions becomes more important. For further decrease of the carbon footprint the materials production must be improved.
4.3. Carbon Footprint Potential Reduction Analysis for Operational Stage
4.3.1. Building Insulation Degree
Considering the results presented in Figure 19 and 20, there is potential to decrease the CO2 emissions and as an end goal the carbon footprint for existing single family residential buildings in Romania. The most practical method for this is to decrease the CO2 emissions for the operational stage of the building life cycle. Romanian Energy Classes for Buildings classifies buildings from G to A+ in accordance with the energy used for HVAC [29]. With the data available from the Romanian Calculation Methodology for the energy performance of buildings, the potential for reducing the energy consumption is presented in Table 11. The results indicate that for older existing buildings that resides in class C or more, the building is required to be insulated with a minimum of 15cm of insulation for its energy consumption to decrease to A+ class value. Class B buildings are already insulated with 5cm of thermal insulation and those need an additional 10cm for reaching Class A+ values as well.
Figure 21 illustrates, how increasing the thermal insulation degree of the building envelope will result in energy consumption reduction for HVAC to reach class A+. This in turn will lower the CO2 emissions for the life cycle of the building to values close to the case study building values. For buildings before 2000 an energy reduction for HVAC of approximate 70% is required to reach class A+ and this reduce to a quarter share of the total CO2 emissions for the operational stage (according to the case study results). For buildings after 2000 but before 2023 an energy reduction for HVAC of approximate 60% is required.
Buildings that are built in earlier times before 1960 (Table 2), fit into lower energy classes, from C to G and all of them not only require thermal insulation but an overall renovation as the majority of them have hydro insulation issues, time wear issues or structural issues from previous earthquakes or other calamities. As far as reducing the energy consumption for the operational stage for those buildings go, thermal insulating with at least 15cm of insulation will decrease their consumption according to Figure 21.
4.3.2. Heat Pumps
The use of renewable energy sources is an important factor in reducing the CO2 emissions for the entire life cycle of the building. Figure 22 presents the results using the energy consumption from energetic classes B, A, A+, the case study building and a fictitious passive house.
Consequently, for each one of the classes the CO2 emissions in the entire operational stage of 50 years have been calculated for three different energy sources: firewood, natural gas and a heat pump. The CO2 emissions for a class B building even using a heat pump has almost 200 t CO2 for the operational stage, highlighting the thermal insulation importance. Moreover, due to the close values of the emissions factor for heat pump and natural gas in Romania, the difference between the natural gas and heat pump narrows down as the building tends towards passive house thermal insulation level.
The CO2 emissions reduction from using a heat pump in the detriment of a firewood boiler is approximately 65% and in the detriment of a natural gas boiler is 26%. Of course, this will vary depending on the real Coefficient of Performance of the heat pump which is lower if the renewable energy source is air than if it is the ground source, as in this case study analysed building.
4.3.3. Photovoltaics Panels
Heating and cooling with a heat pump provides another possibility for the CO2 emissions reduction from using electrical energy produced by photovoltaic panels instead of grid electricity. For the case study building, the total electrical energy produced in 2023 was 7.37 MWh and for 2024 was 7.83 MWh. This electrical energy can be used for the heat pump, for the lighting and for the electrical equipment. As the case study building only uses the heat pump for heating, the electrical energy that the Photovoltaic (PV) panels produce in the months of May to August has no use for the HVAC operational sub-stage. Considering that when the heat pump is turned on, the PV panels only supply the heat pump, the period for which the PV panels supply the lighting and electrical equipment is limited. This covers approximately a third of their yearly consumption (for when the heat pump is off). Figure 23, presents the results for the case study building operational stage, when considering the photovoltaic panels electricity production also. As the HVAC consumption in operation is the highest for the life cycle of the building, the highest reduction in CO2 emissions is also for that sub-stage, with a reduction of approximately 80%. The entire operational stage CO2 emissions for the case study building resulted to 76.18 t CO2 as presented in chapter 4.1. The operational stage CO2 emissions when using electrical energy from the photovoltaic panels for the entire lifespan of the building, decreases to 19.90 t CO2, by 73.87%.
The CO2 emissions from the PV panels manufacture have been calculated in the construction stage. For the total installed power of 7kW, the manufacture produces 0.563 t CO2. Considering their life expectancy of 20-25 years [35], for the 50 years lifespan of the building will need to be replaced 3 times. This will sum the CO2 emissions to 1.689 t CO2. Moreover, for the recycling of the solar panels 230 kgCO2 are emitted for each 1m2 of solar panel [42]. In this case, for one recycling a total of 6.256 t CO2 are emitted and for all three systems a total of 18.76. In the end, this equals to 20.457 t CO2 for the solar panels manufacture and recycling for the entire lifespan of the building. Subtracting this from the total reduction of the operational stage, the reduction of CO2 emissions will decrease from 76.18 to 40.35 t CO2, by approximately 47%.
4.4. Economic Analysis
A life cycle assessment regarding CO2 emissions and discussing potential reduction methods needs to also take into consideration the economic aspect impact. Therefore, for the main three stages of the building lifespan the cost can be calculated for the case study building. The total construction cost, including the land acquisition for the case study building added up to 137,630 €, the individual components cost being detailed in Table 12. The highest cost share is represented by the building structure and architecture, 61%, followed by the building services share of 24%, while the remaining percent represents the land, utility and design for the construction to be possible.
Today in Romania the electrical energy cost has different values based on the amount of electrical energy that the customer absorbs [37]:
- 0.68 RON/kWh for maximum 100 kWh/month;
- 0.80 RON/kWh for maximum 255 kWh/month;
- 1.30 RON/kWh for more than 255 kWh/month.
For the case study building, the cost for the electrical energy is 0.8 RON/kWh (Romanian Leu Currency), which is approximately 0.16 €/kWh. Although the heat pump consumption was more than 255 kWh/month for the case study building, the amount absorbed from the national grid was less due to electrical energy produced by the PV panels. The natural gas energy cost is 0.31 RON/kWh, which is approximately 0.06 €/kWh, meaning 2.6 times less than the medium electrical energy cost. Compared with the 1.3 RON/kWh, which is approximately 0.26 €/kWh, the natural gas cost is 4.19 times less. This is a common practical barrier in Romania regarding the use of heat pumps, because if the COP of the heat pump is less than 4.19 (if there are no PV panels), or less than 2.6 times (if there are PV panels installed) it will be cheaper to heat with natural gas instead.
Considering the above, an analysis was performed, using the minimum energy requirement from energetic class B, class A and class A+, together with the case study building and a passive house, results being illustrated in Figure 24. The compared cases also included heating with a gas boiler versus a heat pump for the energetic classes B, A and A+. For this, the construction cost differed by up to 13%, the class B with natural gas having the highest construction cost from removing the heat pump system and insulation. The highest construction cost resulted for the passive house, requiring the highest thermal insulation degree. Furthermore, the demolition cost of the building was calculated with an average cost in Romania today of 150€/m2 of GFA. Finally, the operational stage cost was calculated for a 50 years lifespan, using the costs for electrical energy and natural gas that are available today in Romania, not taking into consideration the changes that will happened in 50 years period.
The highest operational stage share of cost is represented by the class B heated with a heat pump, due to low thermal insulation degree and high electricity cost. As the building energetic class increases the operational stage shares start to decrease. Although, a better thermal insulation degree will translate to less energy needed for a heat pump to function, for the A+ class is still better to use a gas boiler instead. The heat pump is efficient over natural gas for a 50 years operational stage when the building insulation degree closes up to a passive house standard. For these calculations, the average COP of 4 was used, representing the case study building average COP.
5. Discussion and Conclusions
This study aims to establish a direct link between operational stage of a building life cycle and the CO2 emissions that the building will emit for the entire lifespan, for the single-family residential buildings in Romania. Consequently, the construction and demolition stages were considered while analysing a case study building built in 2019, in Romania. The case study building is energy efficient, residing between a Romanian energetic class A+ and a passive house standard.
Furthermore, the case study building was used to create plausible other cases for single-family residential buildings in Romania, focusing on a wide array:
- from older than 1989 buildings to new after 2023 buildings;
- from high energy consumption buildings (class B: 257 kWh/m2year) to low energy consumption buildings (passive house: <15 kWh/m2year), including the case study building;
- for not using renewable energy sources with equipment such as heat pump or photovoltaic panels and for the cases of renewable energy usage.
This provided a meaningful insight over the current situation of single-family residential buildings in Romania, regarding the energy consumption and carbon footprint for the entire lifespan of a building, with an emphasis on the operational stage. The most important observation being that as buildings in Romania started to be more energy efficient, their construction cost increased but their CO2 emissions over the entire lifespan will decrease considerably.
Moreover, after analysing the economical aspect of building with energy efficiency in mind, the results showed that because of the high electrical energy cost compared with the natural gas cost in Romania, if the building is not reaching a thermal insulation degree higher than what is required for a energetic class A+, the operational stage cost in time will be less using a gas boiler instead of a heat pump, that in return will emit a lot more CO2 into the atmosphere in the long run.
Therefore, the main conclusions of this case study with an extrapolated building life cycle analysis are:
- for the case study building, the total CO2 emissions for the entire life cycle resulted 257.29 t CO2;
- for the case study building, the highest CO2 emissions represent the construction stage with 66.99% while the HVAC share is 25.75%;
- for the case study building, the carbon sequestration from vegetation absorbs 127.53 t CO2, lowering the total carbon footprint to 129.76 t CO2, meaning 50% less;
- compared with the case study building, a building constructed before 1989 will mostly reside in energetic classes C to G and will emit 12.67 times more CO2 when heated with firewood and 7.55 times more when heated with natural gas, for the operational HVAC sub-stage;
- compared with the case study building a passive house will emit 1.8 times less CO2, for the operational HVAC sub-stage;
- for the total life cycle of the building, the operational stage share for the case study building is 29.61%, while for a building heated with firewood, built before 1989 the share is 84.17% and for natural gas is 76.01%;
- in order to achieve class A+ of energy consumption, the buildings need to be insulated with at least 15cm of thermal insulation;
- using a heat pump in the detriment of a firewood boiler will decrease the HVAC sub-stage CO2 emissions by 34% while using it in the detriment of a natural gas boiler will decrease the CO2 emissions by 26%;
- using photovoltaic panels to produce electrical energy for the heat pump will reduce the CO2 emissions by 80% for HVAC sub stage and 73.8% for the entire operational stage for the current electricity cost in Romania;
- the operational stage cost share for the case study building is 20%, with 68% representing the construction stage and 12% the demolition stage;
- for a class B building, heated with natural gas the operational stage cost share is 38% while for heating with a heat pump the cost share is 41%;
- for a passive house the cost share for the operational stage is 10% and the construction stage share is 77%, rest representing demolition.
This study results are important to be taken seriously when designing single-family residential buildings. The fine line between implementation cost and CO2 emissions in the entire building life cycle needs careful and thoughtful assessment for each individual building, including creating green vegetation areas to combat the building carbon footprint.
Future research should focus on improving the embodied carbon footprint, due to the fact that after decreasing the operational carbon footprint the construction share increases to approximately 65%, according to the case study building results. Furthermore, research for other buildings sub-sectors should be the focus in order to analyse potential measures to be taken for decreasing their operational carbon footprint as well.
Author Contributions
Conceptualization, G.D., A.M.B. and S.I.B.; methodology, G.D. and R.C.; software, A.I.B., S.I.B. and N.F.I.; validation, G.D. and R.C.; formal analysis, A.M.B and G.D.; investigation, N.G and N.F.I.; resources, S.I.B.; data curation, A.M.B. and G.D.; writing—original draft preparation, A.M.B.; writing—review and editing, R.C.; visualization, A.M.B. and S.I.B.; supervision, G.D. and M.F.; project administration, A.M.B. and G.D. All authors have read and agreed to the published version of the manuscript.
Funding
This research received no external funding.
Data Availability Statement
The data presented in this study are available on request from the corresponding author. The data are not publicly available due to privacy issues.
Conflicts of Interest
The authors declare no conflict of interest.
References
- B. G. Vuțoiu, M. B. Tăbăcaru, G. A. Beșchea, Ștefan I. Câmpean, A. M. Bulmez, and G. Năstase, ‘Seven continents. One sky’, 2024. [CrossRef]
- UN Environment programme, ‘2021 GLOBAL STATUS REPORT FOR BUILDINGS AND CONSTRUCTION Towards a zero-emissions, efficient and resilient buildings and construction sector’, 2021. [Online]. Available: www.globalabc.org.
- Efficient Buildings Europe, ‘Energy Performance of Buildings Directive (EPBD)’, 2024.
- D. Maierhofer, M. Röck, M. Ruschi Mendes Saade, E. Hoxha, and A. Passer, ‘Critical life cycle assessment of the innovative passive nZEB building concept “be 2226” in view of net-zero carbon targets’, Build Environ, vol. 223, Sep. 2022. [CrossRef]
- G. Dragomir and I. Boian, ‘Specific conditions for an optimal operation of air-water heat pumps’, Revista Romana de Inginerie Civila/Romanian Journal of Civil Engineering, vol. 13, no. 2, pp. 126–137, Mar. 2022. [CrossRef]
- USA Government, ‘Infrastructure Investment and Jobs Act’. https://www.congress.gov/bill/117th-congress/house-bill/3684.
- M. Ma, N. Zhou, W. Feng, and J. Yan, ‘Challenges and opportunities in the global net-zero building sector’, Cell Reports Sustainability, vol. 1, no. 8, p. 100154, 2024. [CrossRef]
- GLOBE, ‘Global Building Emissions Database’. https://globe2060.org/.
- H. Yuan et al., ‘Battery electric vehicle charging in China: Energy demand and emissions trends in the 2020s’, Appl Energy, vol. 365, Jul. 2024. [CrossRef]
- S. Pauliuk et al., ‘Global scenarios of resource and emission savings from material efficiency in residential buildings and cars’, Nat Commun, vol. 12, no. 1, Dec. 2021. [CrossRef]
- P. Bhyan, B. Shrivastava, and N. Kumar, ‘Allocating weightage to sustainability criteria’s for performance assessment of group housing developments: Using fuzzy analytic hierarchy process’, Journal of Building Engineering, vol. 65, p. 105684, 2023. [CrossRef]
- T. Häkkinen, M. Kuittinen, A. Ruuska, and N. Jung, ‘Reducing embodied carbon during the design process of buildings’, Journal of Building Engineering, vol. 4, pp. 1–13, 2015. [CrossRef]
- Y. Wuni, G. Q. P. Shen, and R. Osei-Kyei, ‘Scientometric review of global research trends on green buildings in construction journals from 1992 to 2018’, Energy Build, vol. 190, pp. 69–85, 2019. [CrossRef]
- J. Falana, R. Osei-Kyei, and V. W. Tam, ‘Towards achieving a net zero carbon building: A review of key stakeholders and their roles in net zero carbon building whole life cycle’, Apr. 01, 2024, Elsevier Ltd. [CrossRef]
- T. Ibn-Mohammed, R. Greenough, S. Taylor, L. Ozawa-Meida, and A. Acquaye, ‘Operational vs. embodied emissions in buildings - A review of current trends’, 2013. [CrossRef]
- M. Bulmez, V. Ciofoaia, G. Năstase, G. Dragomir, A. I. Brezeanu, and A. Şerban, ‘An experimental work on the performance of a solar-assisted ground-coupled heat pump using a horizontal ground heat exchanger’, Renew Energy, vol. 183, pp. 849–865, Jan. 2022. [CrossRef]
- M. Bulmez et al., ‘Numerical Investigation on Auxiliary Heat Sources for Horizontal Ground Heat Exchangers’, Buildings, vol. 12, no. 8, Aug. 2022. [CrossRef]
- G. Năstase, A. Șerban, G. Dragomir, A. I. Brezeanu, and I. Bucur, ‘Photovoltaic development in Romania. Reviewing what has been done’, Oct. 01, 2018, Elsevier Ltd. [CrossRef]
- M. Bulmez et al., ‘CFD Analysis for a New Trombe Wall Concept’, Buildings, vol. 14, no. 3, Mar. 2024. [CrossRef]
- Y. Gao et al., ‘Modeling and analyses of energy performances of photovoltaic greenhouses with sun-tracking functionality’, Appl Energy, vol. 233–234, pp. 424–442, Jan. 2019. [CrossRef]
- E. Hoxha and T. Jusselme, ‘On the necessity of improving the environmental impacts of furniture and appliances in net-zero energy buildings’, Science of the Total Environment, vol. 596–597, pp. 405–416, Oct. 2017. [CrossRef]
- H. Monteiro, J. E. Fernández, and F. Freire, ‘Comparative life-cycle energy analysis of a new and an existing house: The significance of occupant’s habits, building systems and embodied energy’, Sustain Cities Soc, vol. 26, pp. 507–518, Oct. 2016. [CrossRef]
- P. Shen, W. Braham, and Y. Yi, ‘The feasibility and importance of considering climate change impacts in building retrofit analysis’, Appl Energy, vol. 233–234, pp. 254–270, Jan. 2019. [CrossRef]
- M. V. Shoubi, M. V. Shoubi, A. Bagchi, and A. S. Barough, ‘Reducing the operational energy demand in buildings using building information modeling tools and sustainability approaches’, Ain Shams Engineering Journal, vol. 6, no. 1, pp. 41–55, Mar. 2015. [CrossRef]
- M. Röck et al., ‘Embodied GHG emissions of buildings – The hidden challenge for effective climate change mitigation’, Appl Energy, vol. 258, Jan. 2020. [CrossRef]
- P. W. and A. MDLPA - Romanian Ministry of Development, ‘STRATEGIA NAŢIONALĂ DE RENOVARE PE TERMEN LUNG PENTRU SPRIJINIREA RENOVĂRII PARCULUI NAȚIONAL DE CLĂDIRI REZIDENȚIALE ȘI NEREZIDENȚIALE, ATÂT PUBLICE CÂT ȘI PRIVATE ȘI TRANSFORMAREA SA TREPTATĂ ÎNTR-UN PARC IMOBILIAR CU UN NIVEL RIDICAT DE EFICIENȚĂ ENERGETICĂ ȘI DECARBONAT PÂNĂ ÎN 2050’, 2020.
- Institutul Național de Statistică / Romanian National Statistics Institute, ‘Romanian Housing Stock’. https://insse.ro/cms/ro/tags/fondul-de-locuinte.
- G. Dragomir, A. I. Brezeanu, N. Iordan, D. Ferenc, and I. Boian, ‘The way from gas boilers to heat pumps’, Revista Romana de Inginerie Civila/Romanian Journal of Civil Engineering, vol. 15, no. 1, pp. 7–16, Jan. 2024. [CrossRef]
- P. W. and A. MDLPA - Romanian Ministry of Development, ‘Metodologie de calcul al performanței energetice a clădirilor, indicativ Mc 001-2022 / Calculation methodology of the energy performance of buildings, indicator Mc 001-2022’, 2022.
- P. W. and administration MDLPA - Romanian Ministry of Development, ‘ANALIZA DIAGNOSTIC PRIVIND STADIUL ACTUAL EXISTENT ÎN ROMÂNIA PENTRU ATINGEREA NIVELURILOR NZEB ÎN RENOVAREA FONDULUI CONSTRUIT EXISTENT ȘI ÎN CONSTRUIREA CLĂDIRILOR NOI’, 2024.
- Eggelston Simon, Buendia Leandro, Kyoko Miwa, Todd Ngara, and Kiyoto Tanabe, ‘2006 IPCC Guidelines for National Greenhouse Gas Inventories’, 2006.
- Peng, ‘Calculation of a building’s life cycle carbon emissions based on Ecotect and building information modeling’, J Clean Prod, vol. 112, pp. 453–465, Jan. 2016. [CrossRef]
- Y. Yan, ‘Research of energy consumption and co2 emission of buildings in Zhejiang Province based on life cycle assessment’, Zhejiang University: Hangzhou, China, 2011.
- X. Zhang, L. Shen, and L. Zhang, ‘Life cycle assessment of the air emissions during building construction process: A case study in Hong Kong’, Jan. 2013. [CrossRef]
- M. R. Nagaraja, W. K. Biswas, and C. P. Selvan, ‘Advancements and challenges in solar photovoltaic technologies: enhancing technical performance for sustainable clean energy – A review’, Jan. 01, 2025, Elsevier Ltd. [CrossRef]
- M. Norouzi, A. N. Haddad, L. Jiménez, S. Hoseinzadeh, and D. Boer, ‘Carbon footprint of low-energy buildings in the United Kingdom: Effects of mitigating technological pathways and decarbonization strategies’, Science of the Total Environment, vol. 882, Jul. 2023. [CrossRef]
- M. Bulmez, A. I. Brezeanu, G. Dragomir, O. M. Talabă, and G. Năstase, ‘An Analysis of Romania’s Energy Strategy: Perspectives and Developments since 2020’, Jul. 01, 2024, Multidisciplinary Digital Publishing Institute (MDPI). [CrossRef]
- Romanian Government, ‘Factorii de conversie în emisii de gaze cu efect de seră (CO 2 echivalent) / Conversion factors for GHG emissions (CO 2 equivalent)’. https://lege5.ro/Gratuit/ha4demjwgu3q/factorii-de-conversie-in-emisii-de-gaze-cu-efect-de-sera-co-2-echivalent-ghid-anexa-nr-4-la-ghid-factori-de-conversie?dp=gqytcnztga3dimi.
- C.N.T.E.E. Transelectrica S.A., ‘Productia si consumul de energie electrica in Romania, pe tipuri de producatori / Electricity production and consumption in Romania, by types of producers’. https://www.sistemulenergetic.ro.
- ANRE - Romanian National Energy Agency, ‘DATE STATISTICE AFERENTE ENERGIEI ELECTRICE PRODUSE ÎN ANUL 2007 / STATISTICAL DATA RELATING TO ELECTRICAL ENERGY PRODUCED IN 2007’, 2007.
- Carbon Database Initiative, ‘International Electricity Factors’. https://www.carbondi.com/#electricity-factors/.
- Domínguez and R. Geyer, ‘Photovoltaic waste assessment in Mexico’, Resour Conserv Recycl, vol. 127, pp. 29–41, Dec. 2017. [CrossRef]
Figure 1.
Global carbon distribution and trends for the Buildings Sector: (A) Share of the overall energy consumption of the buildings sector and corresponding CO2 emissions in 2022; (B) Potential changes in operational CO2 emissions from the buildings sector, 2010–2070; (C) The contribution of leading economies (for example, the US, China and Europe) to global CO2 emissions in the buildings sector in 2010 and 2020) [7].
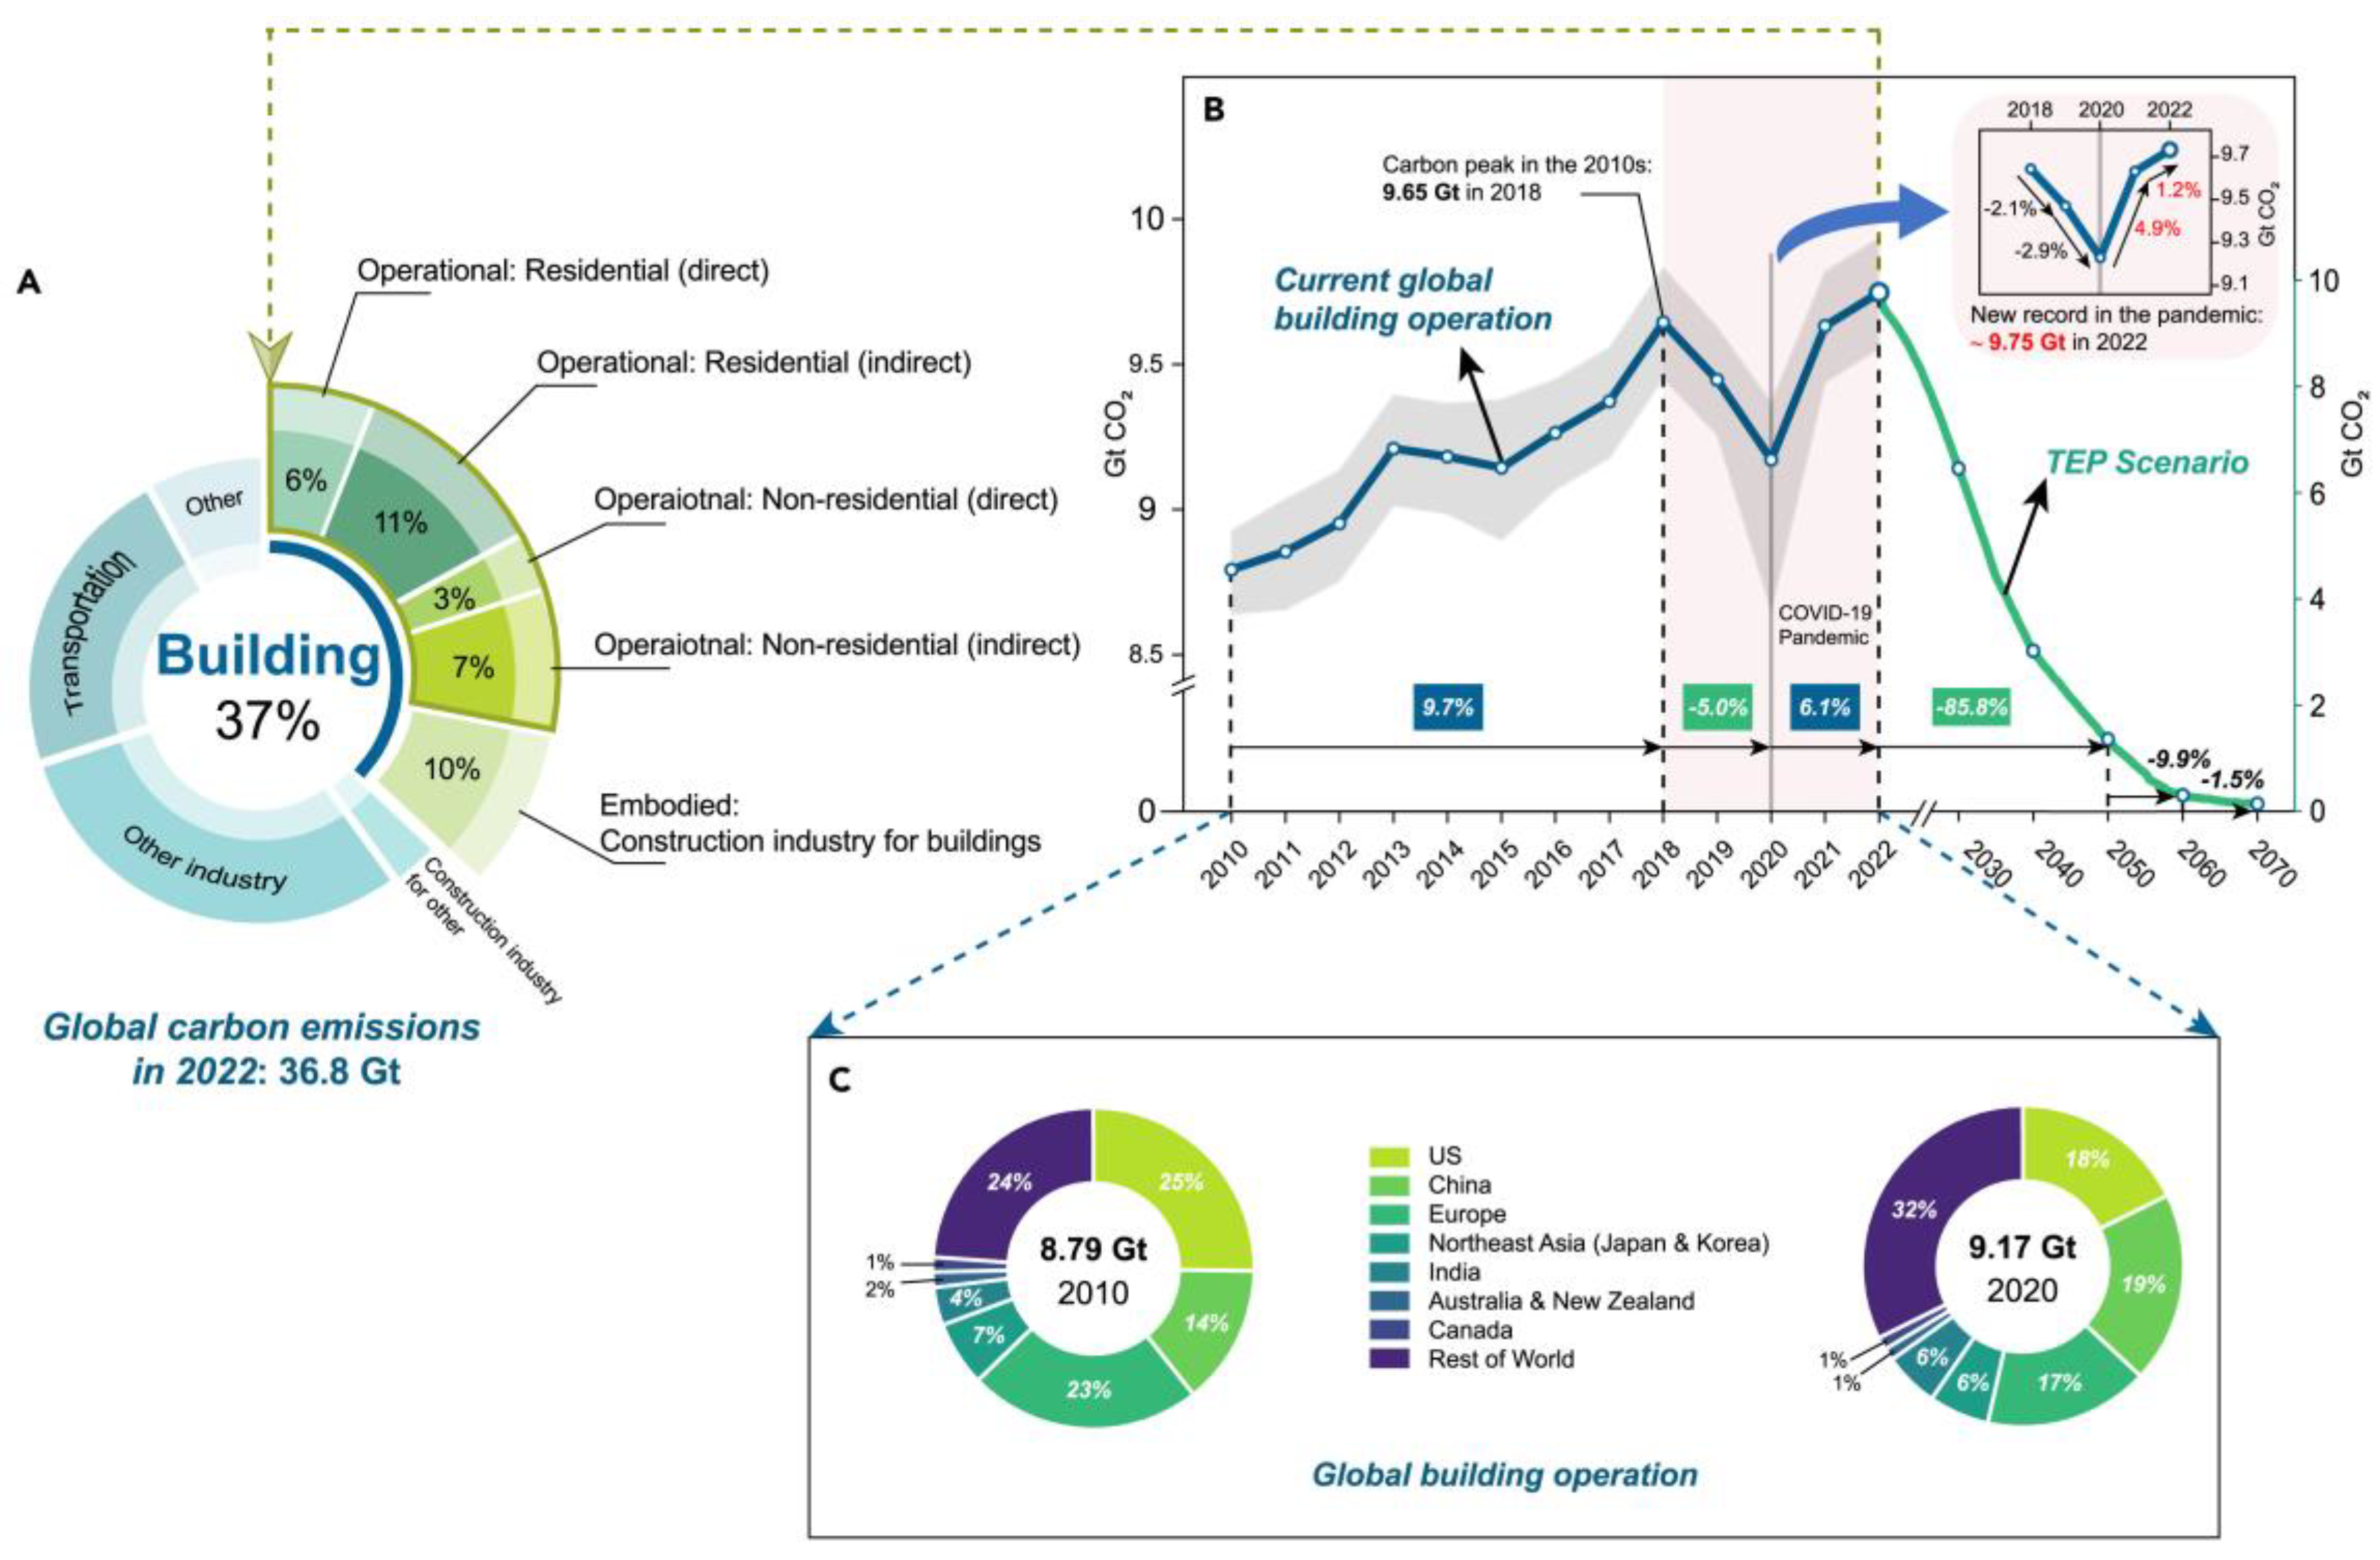
Figure 2.
Buildings sector in Romania and its sub-sectors share [26]
Figure 2.
Buildings sector in Romania and its sub-sectors share [26]
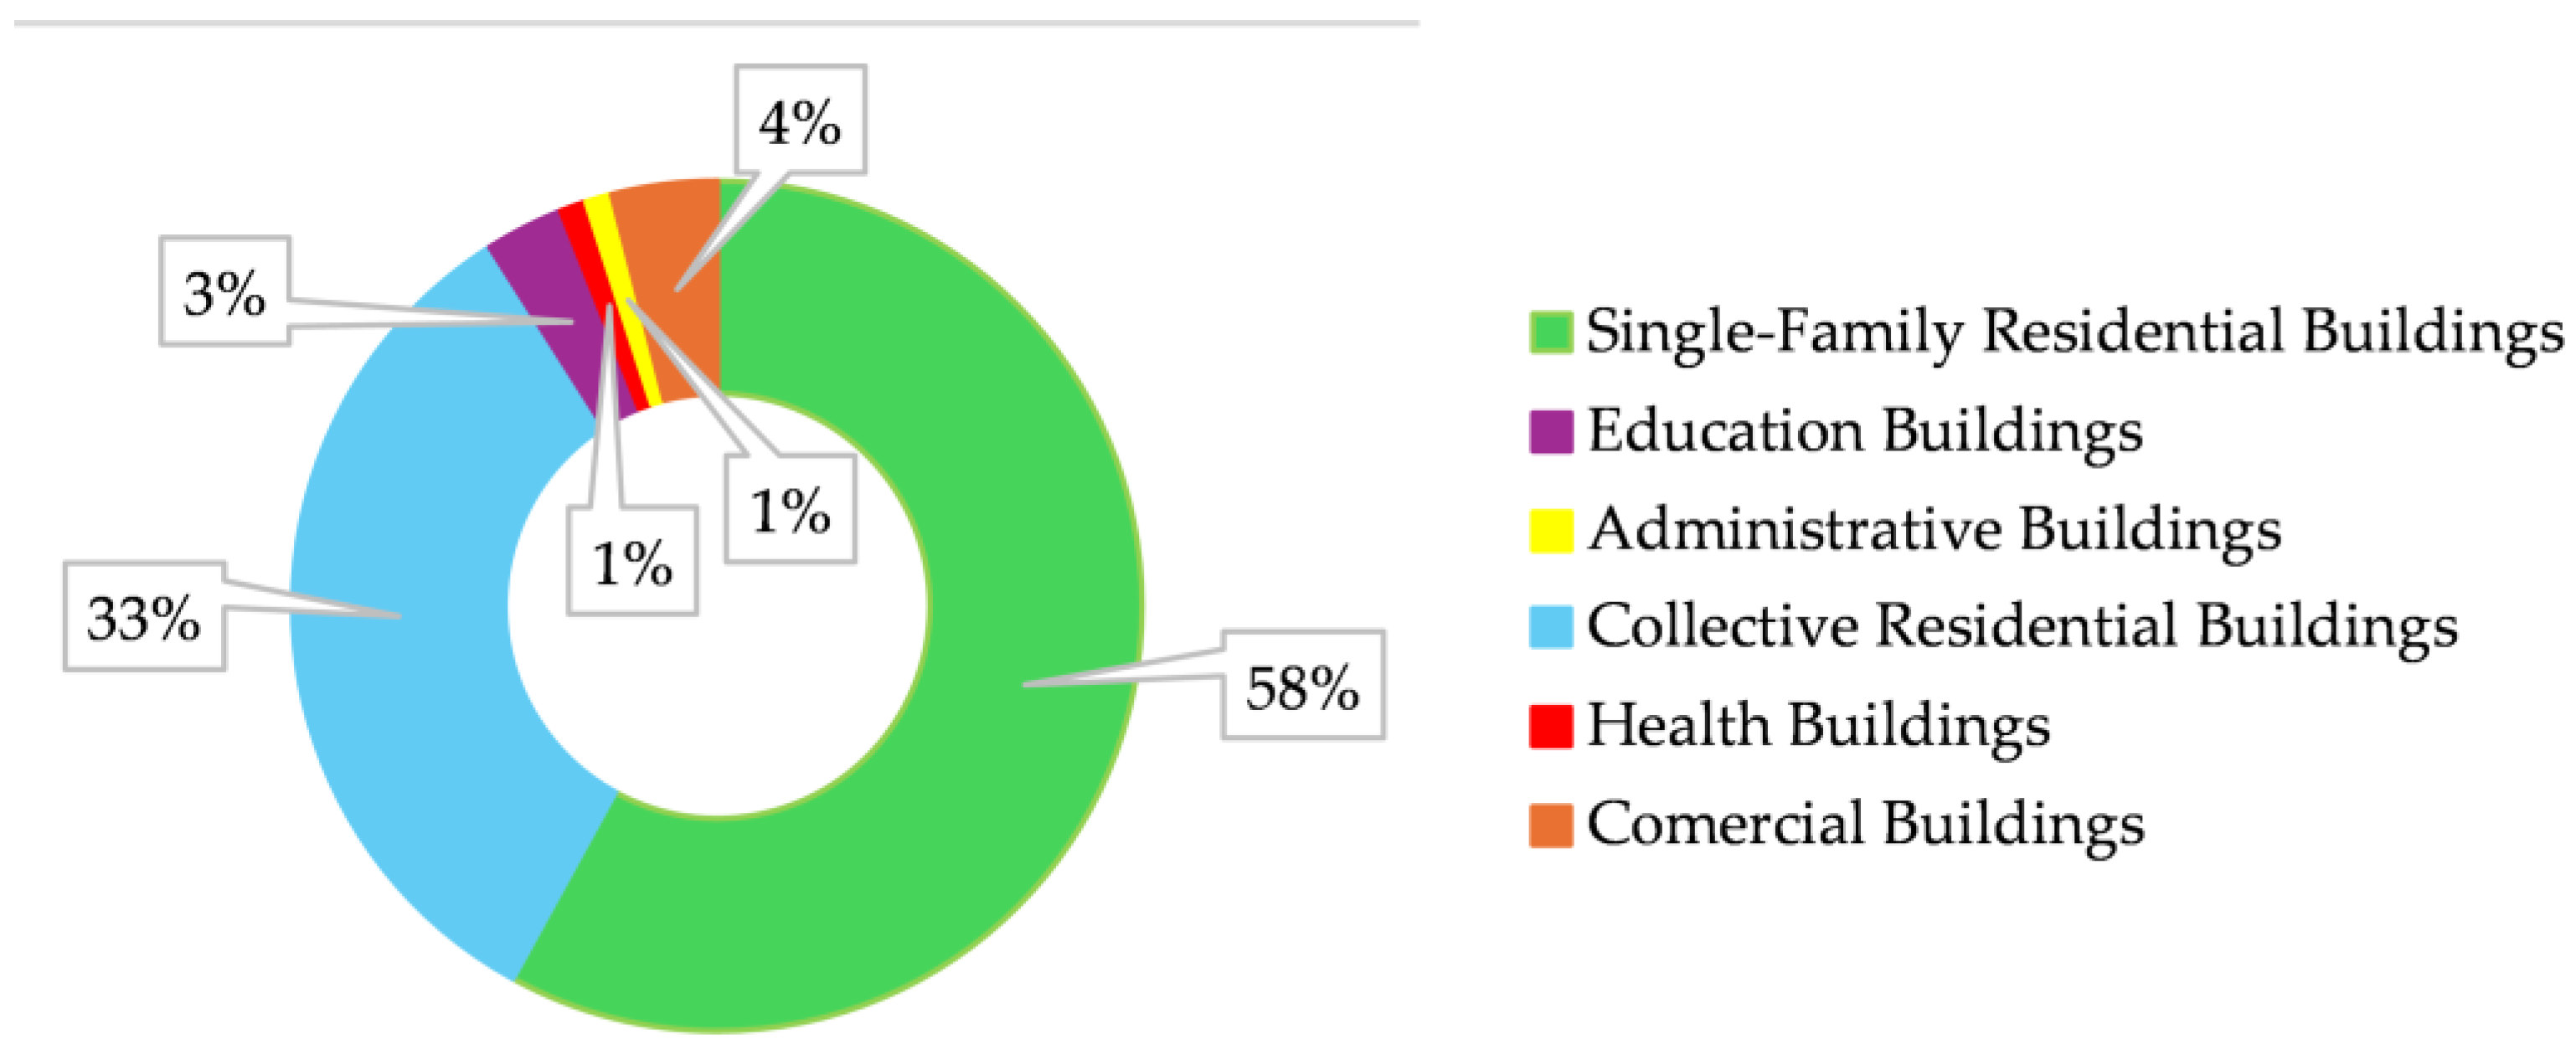
Figure 3.
Final energy consumption by buildings sub-sectors [26]
Figure 3.
Final energy consumption by buildings sub-sectors [26]
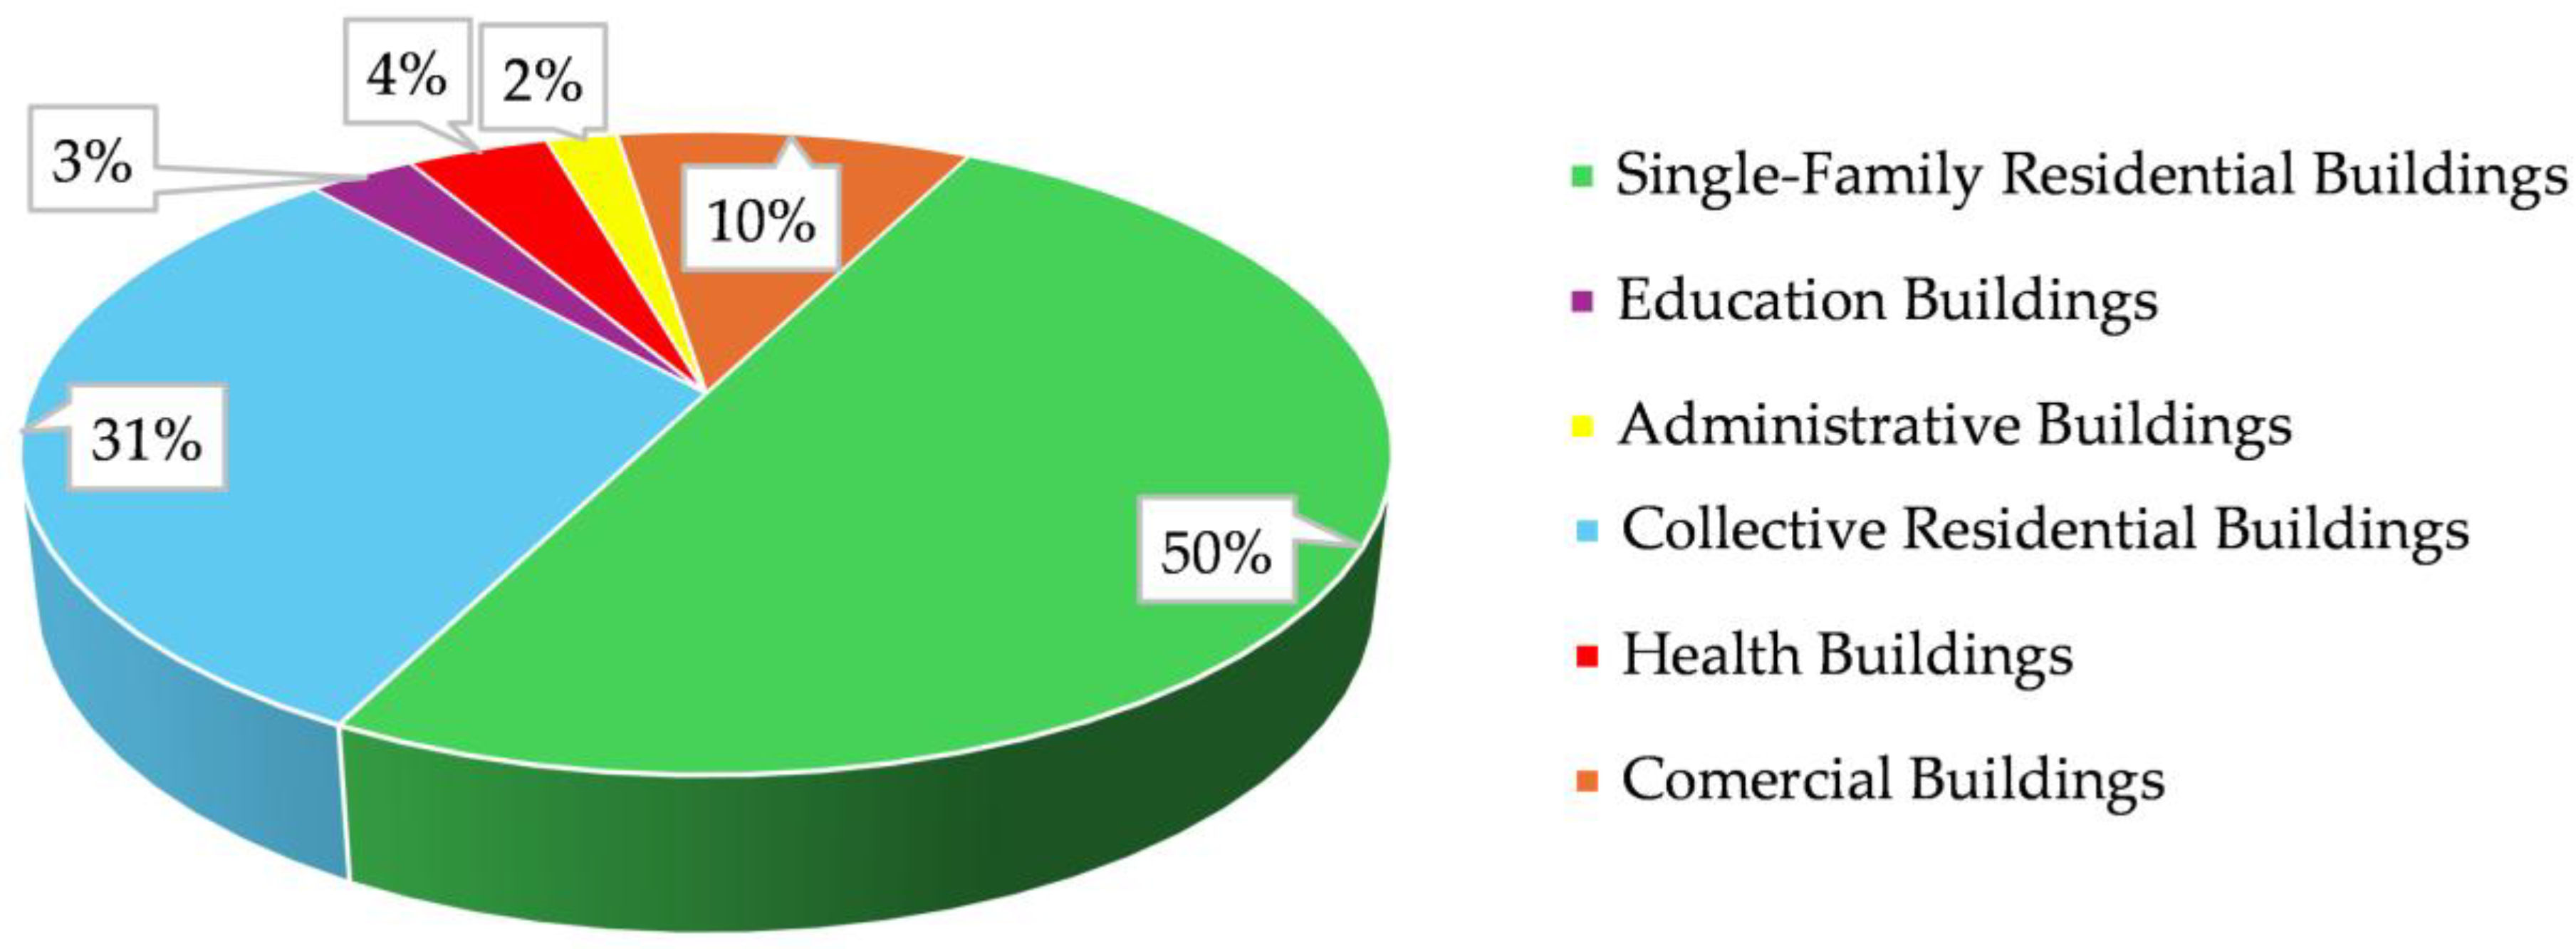
Figure 4.
The residential building stock shares according to the construction period [26]
Figure 4.
The residential building stock shares according to the construction period [26]
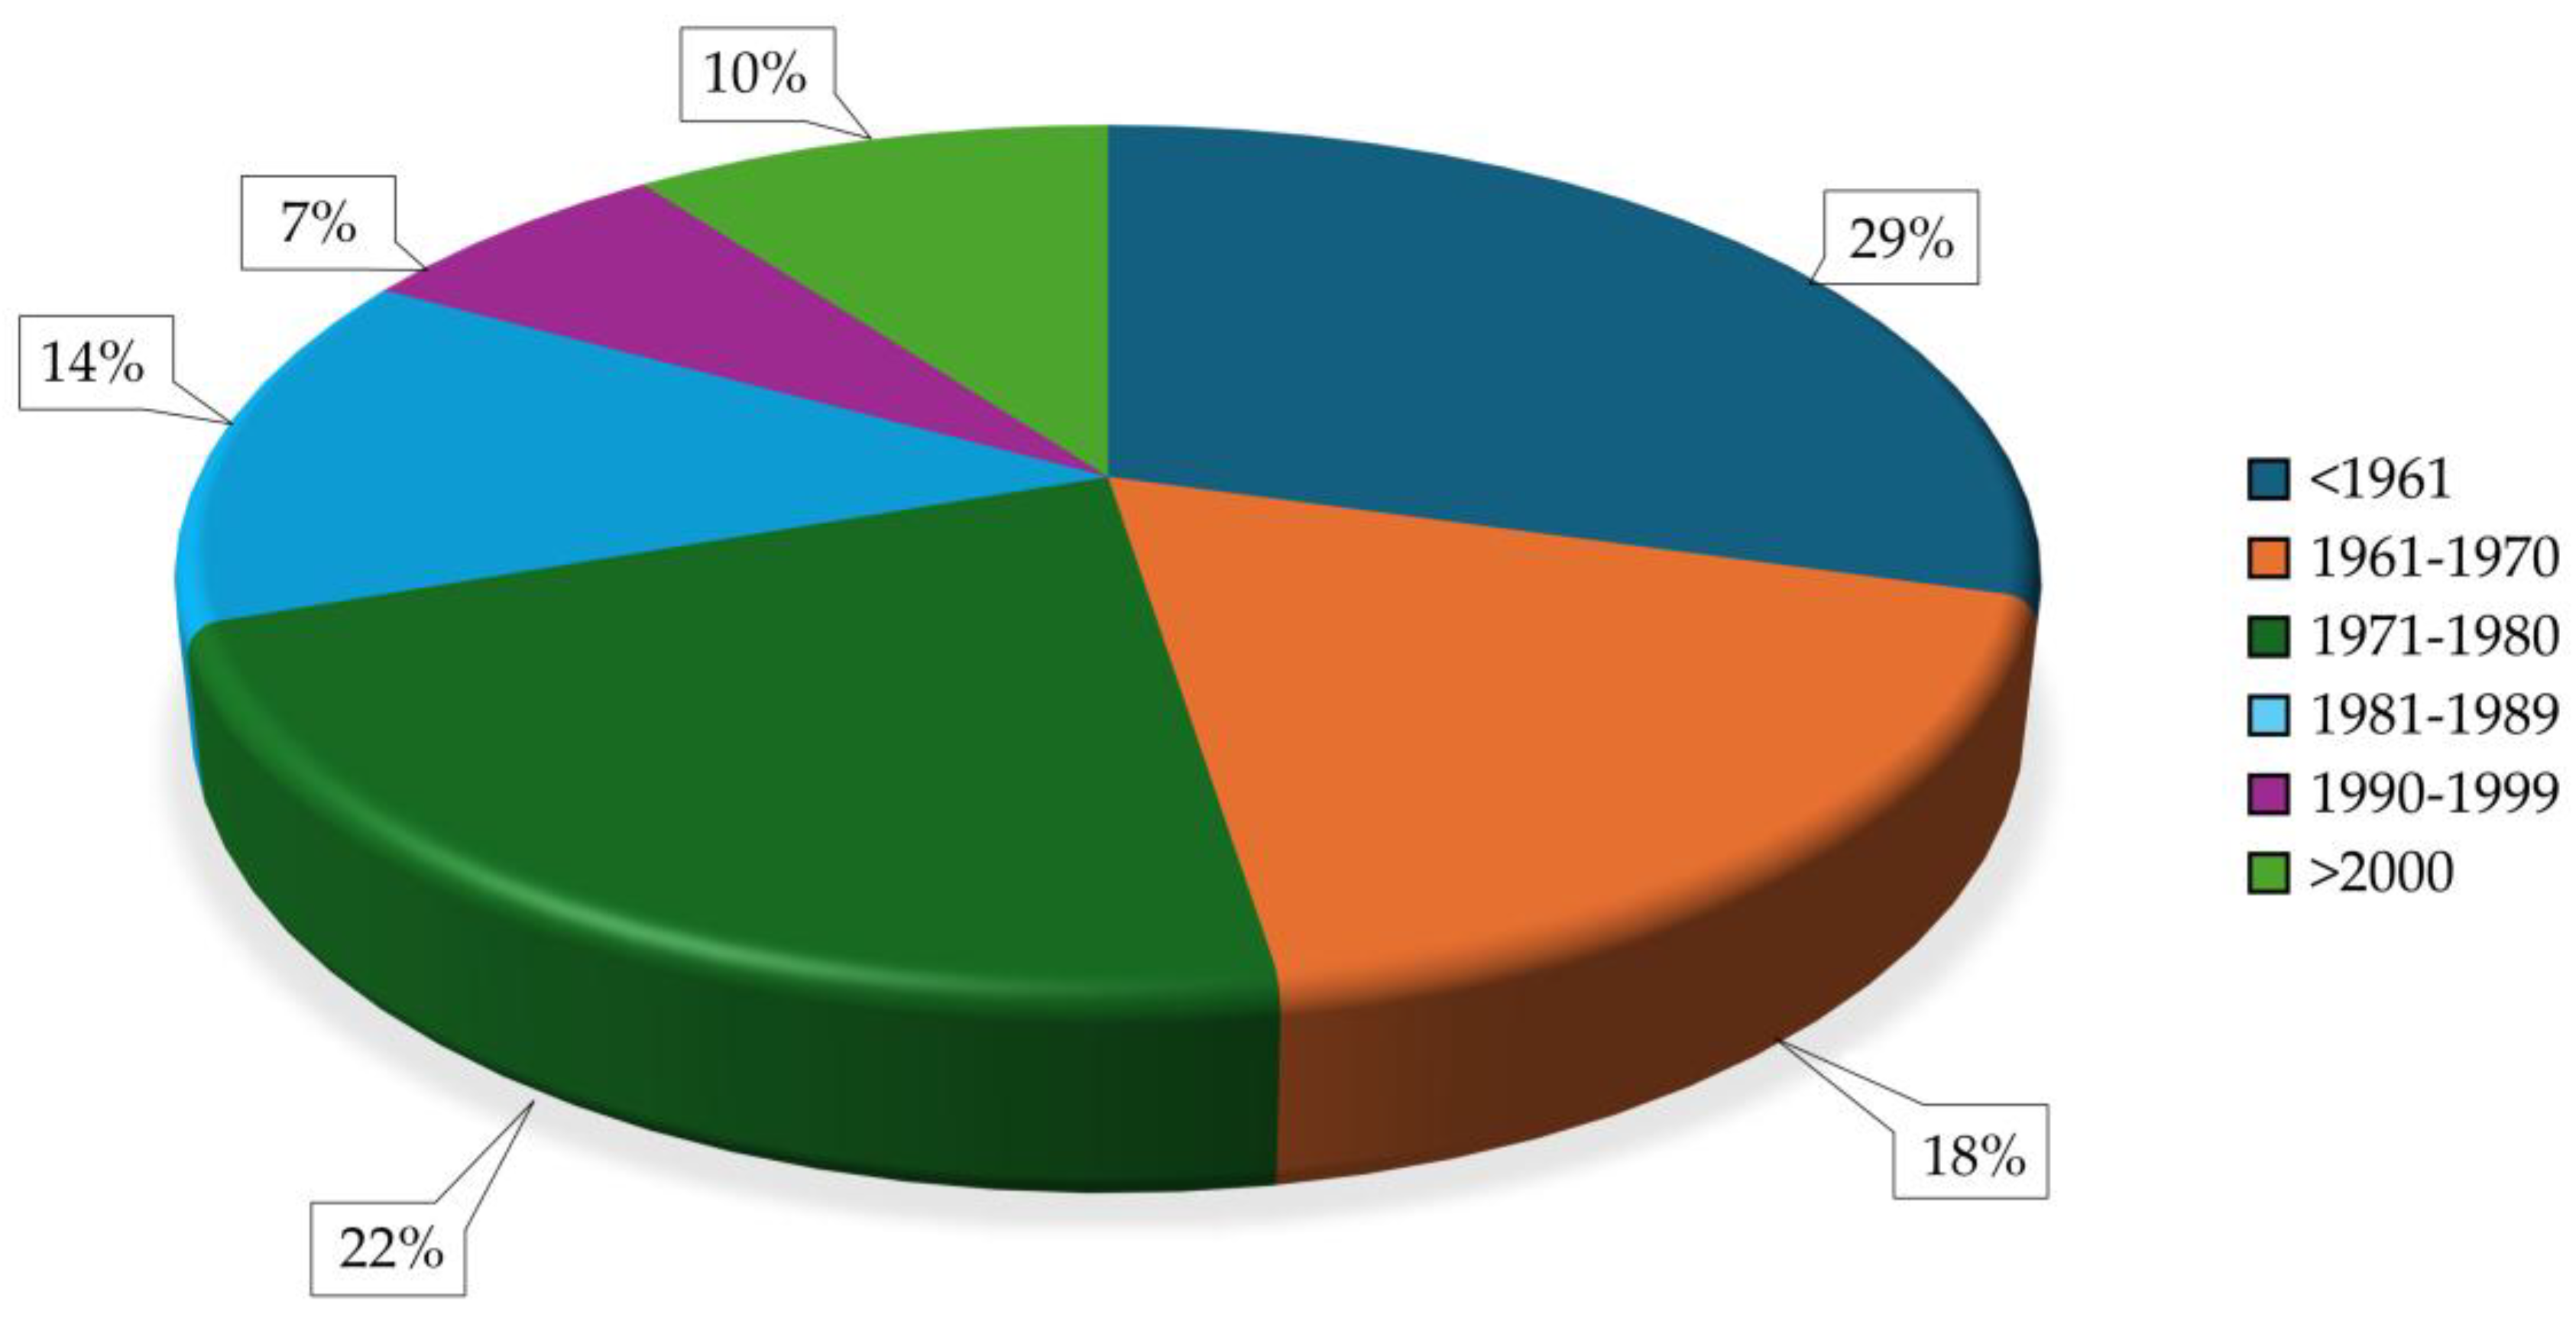
Figure 7.
The horizontal ground heat exchanger distribution from the basement of the case study building: a) the site plan representing the 4 ground closed loop piles and the distance between them and the building; b) a photograph from the building construction stage, in 2019, with the trenches dug for the closed loop pipes placement and the entrance towards the technical room in the basement for heat pump connection.
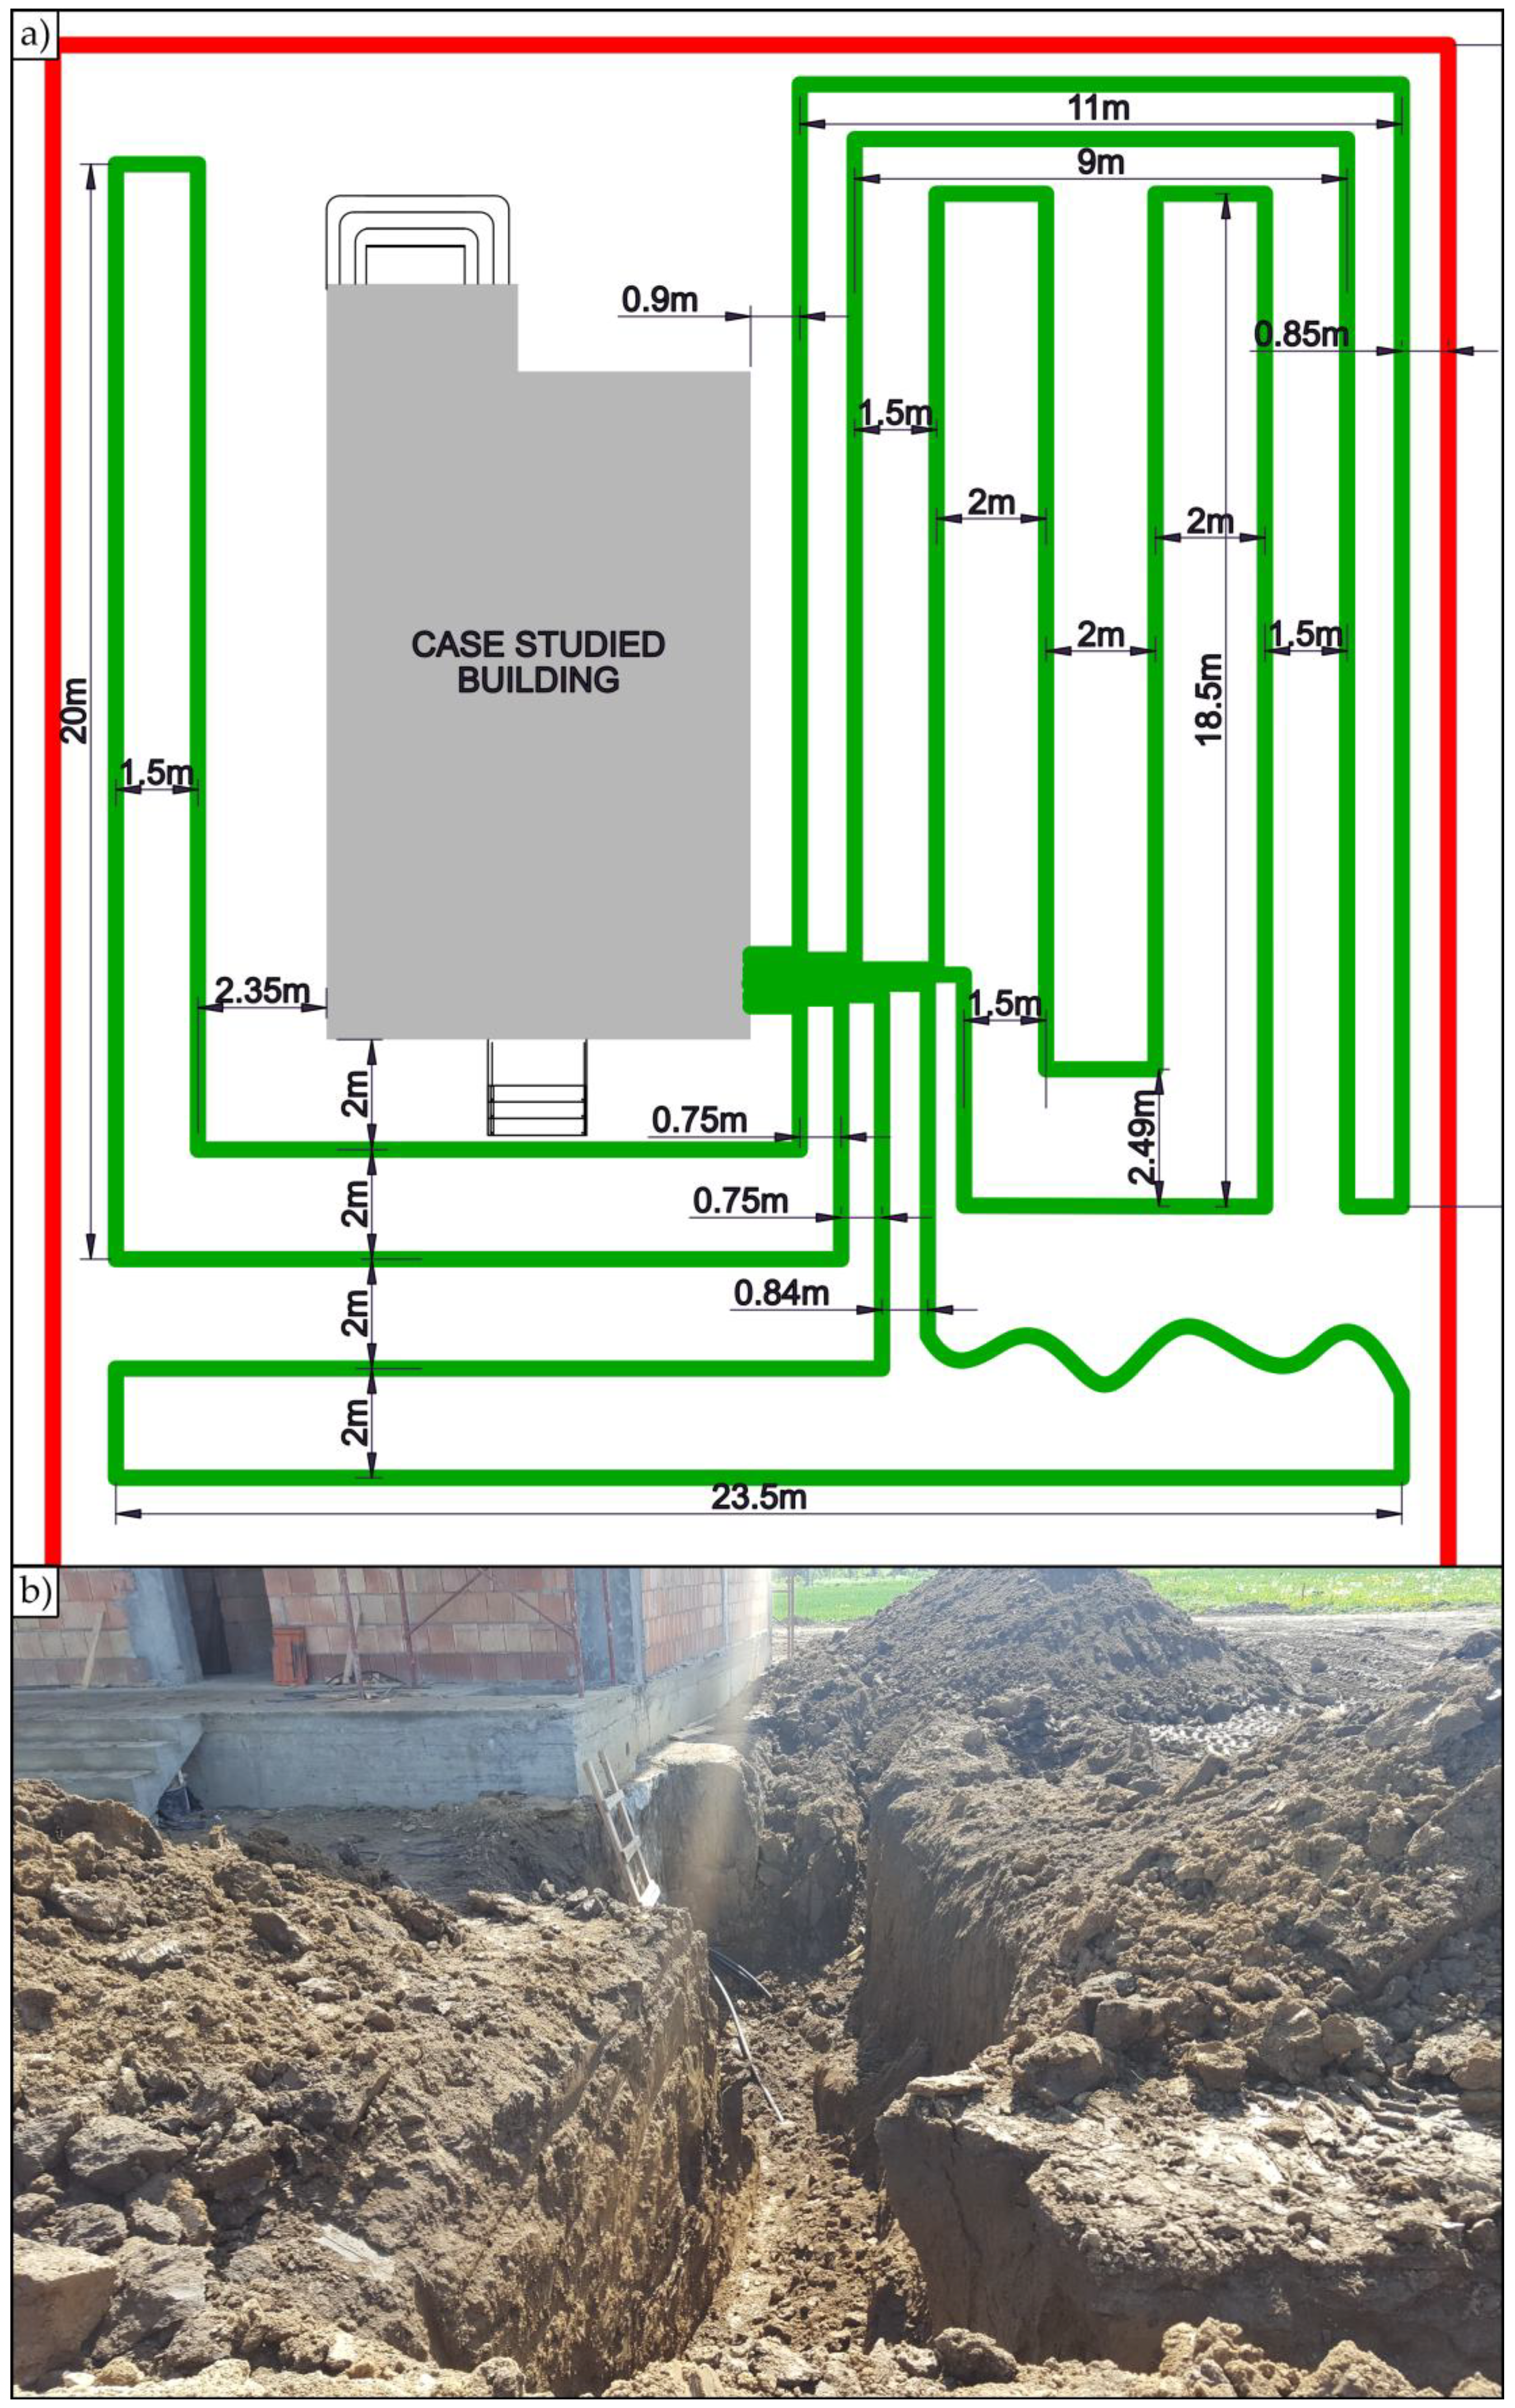
Figure 8.
NIBE F1255: a) heat pump: b) automation panel; c) domestic hot water boiler
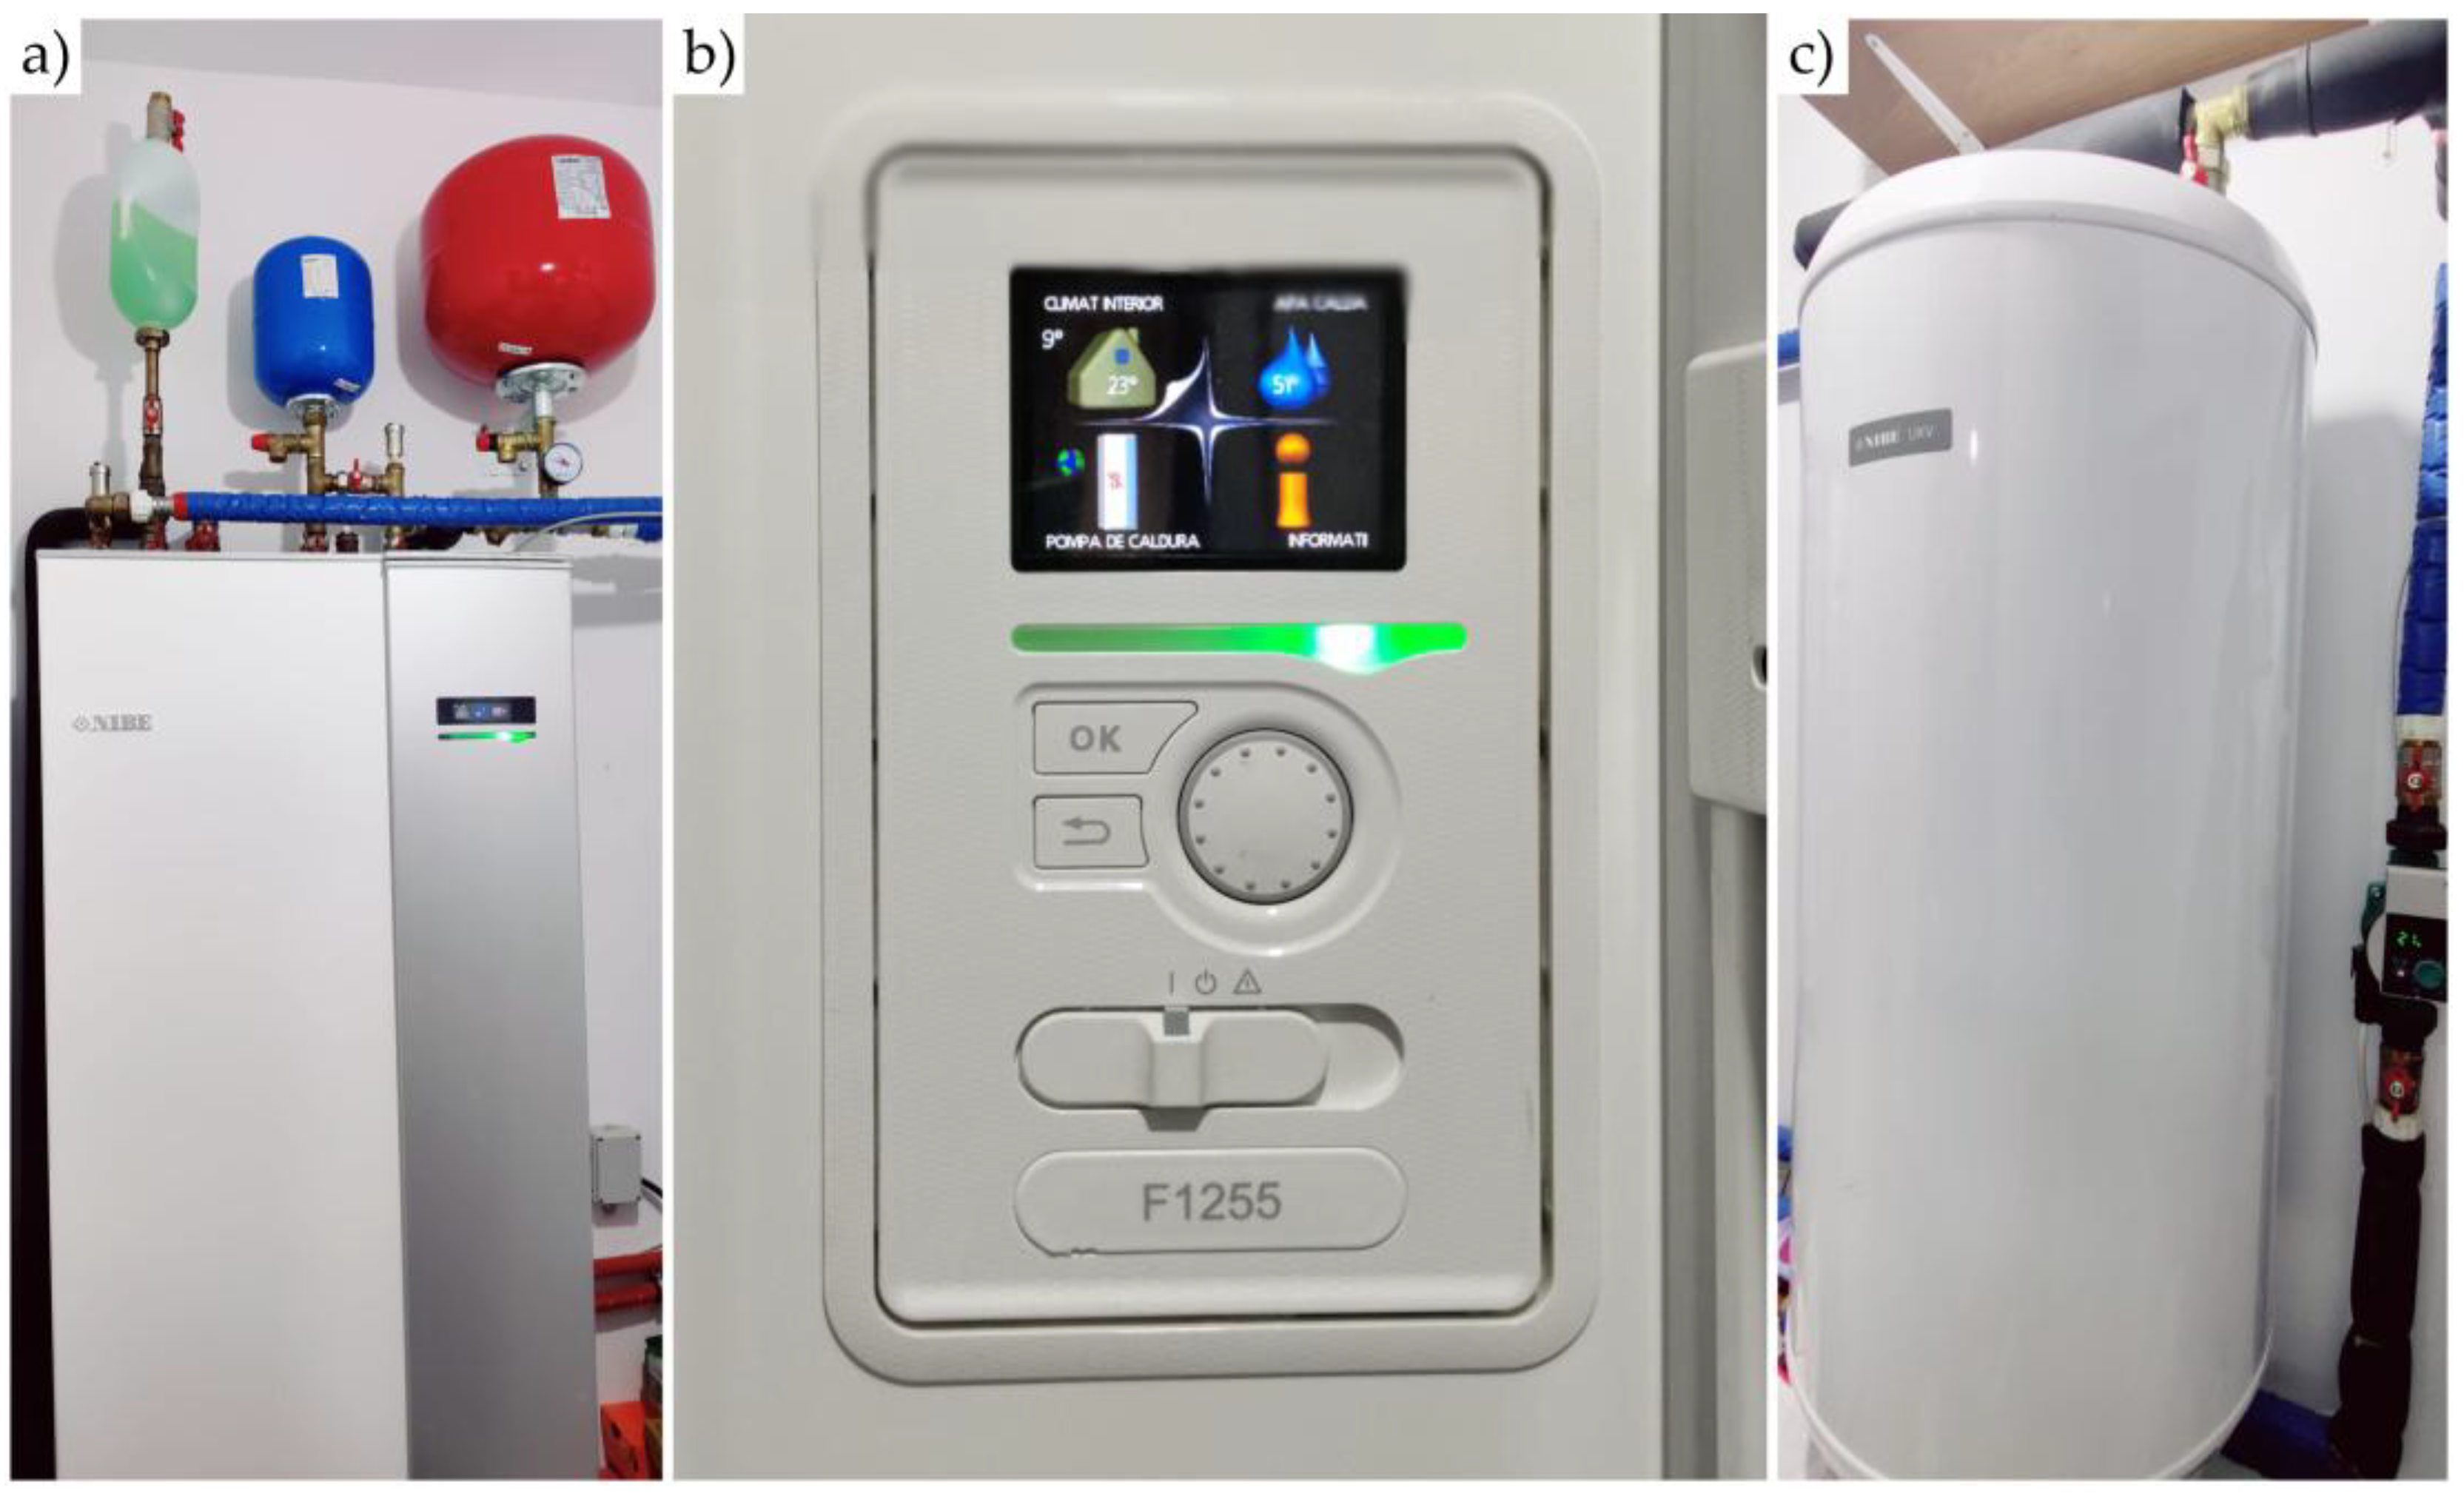
Figure 9.
Underfloor heating placement during the construction stage for the case study building
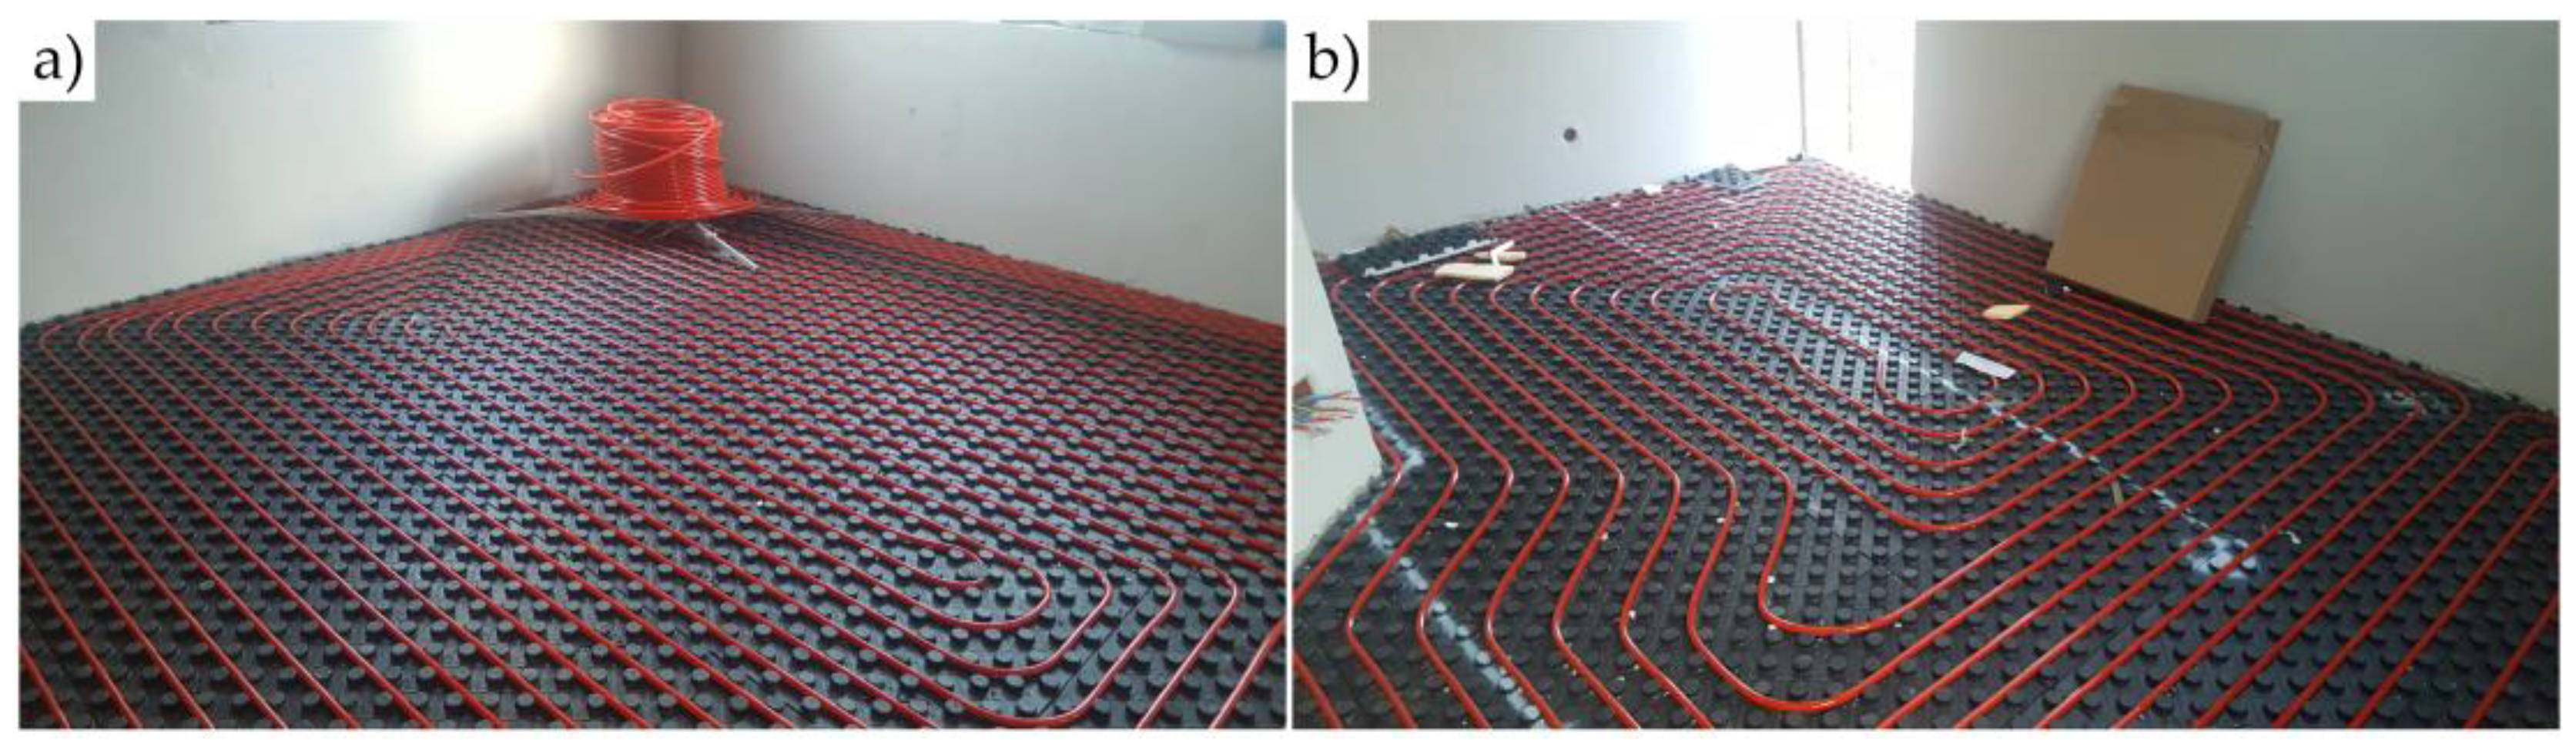
Figure 10.
Photovoltaic panels for the case study building: a) roof close-up after instalment; b) building view during instalment.
Figure 10.
Photovoltaic panels for the case study building: a) roof close-up after instalment; b) building view during instalment.
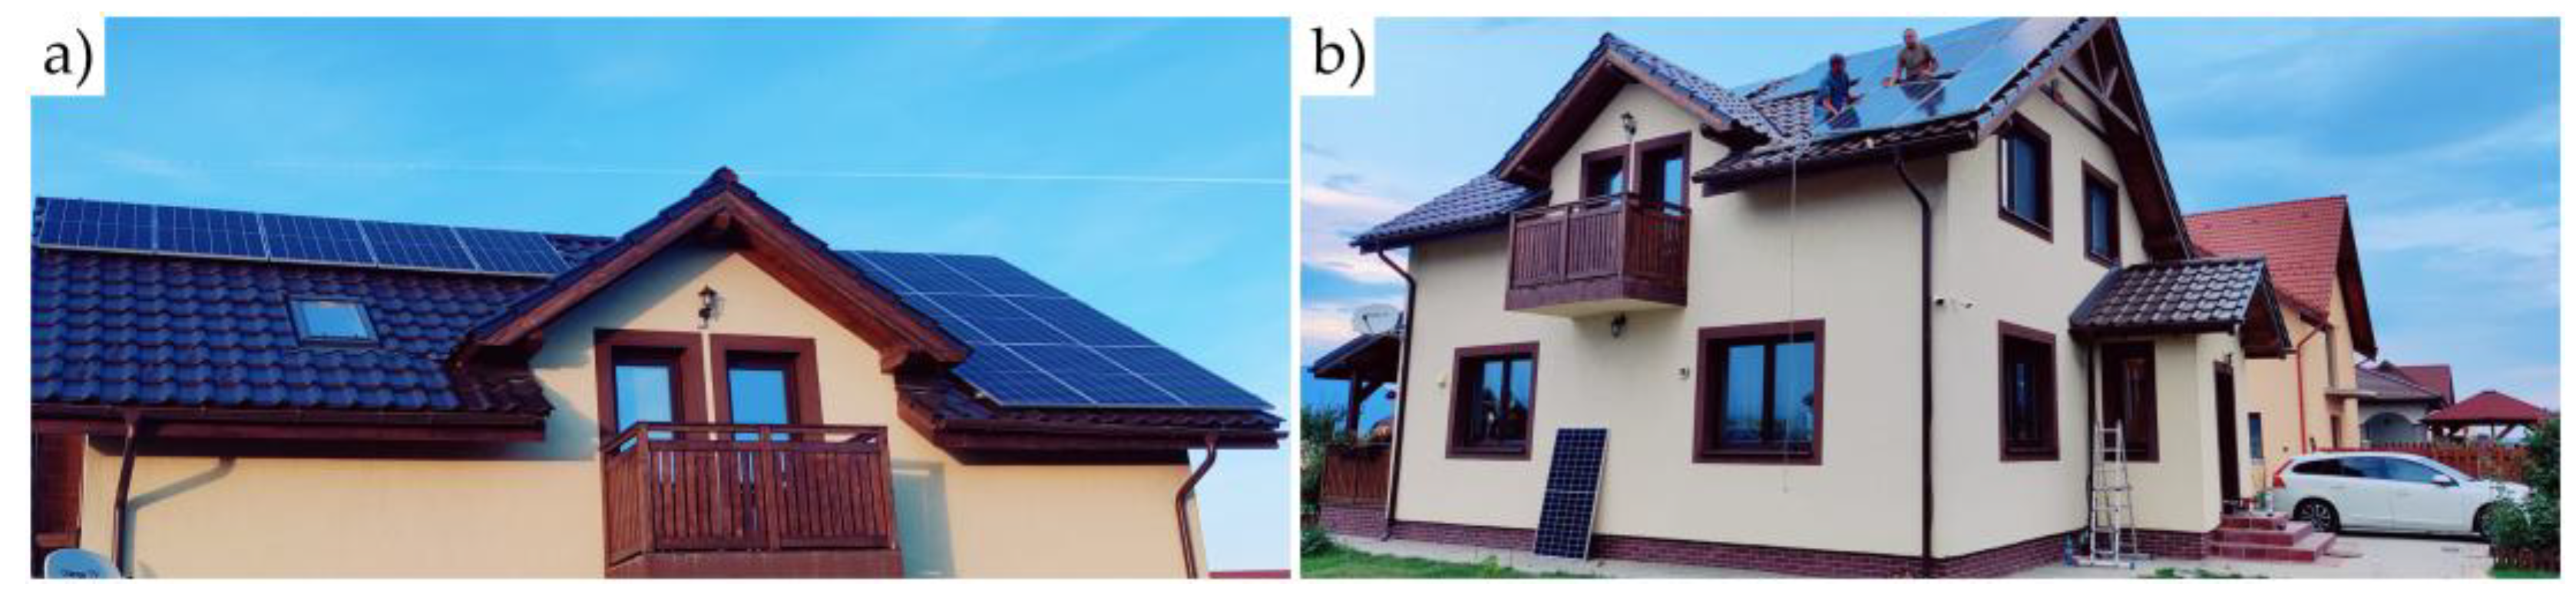
Figure 11.
The Case Study Building Revit Model used for quantities assessment and thermal loads pre-calculations
Figure 11.
The Case Study Building Revit Model used for quantities assessment and thermal loads pre-calculations
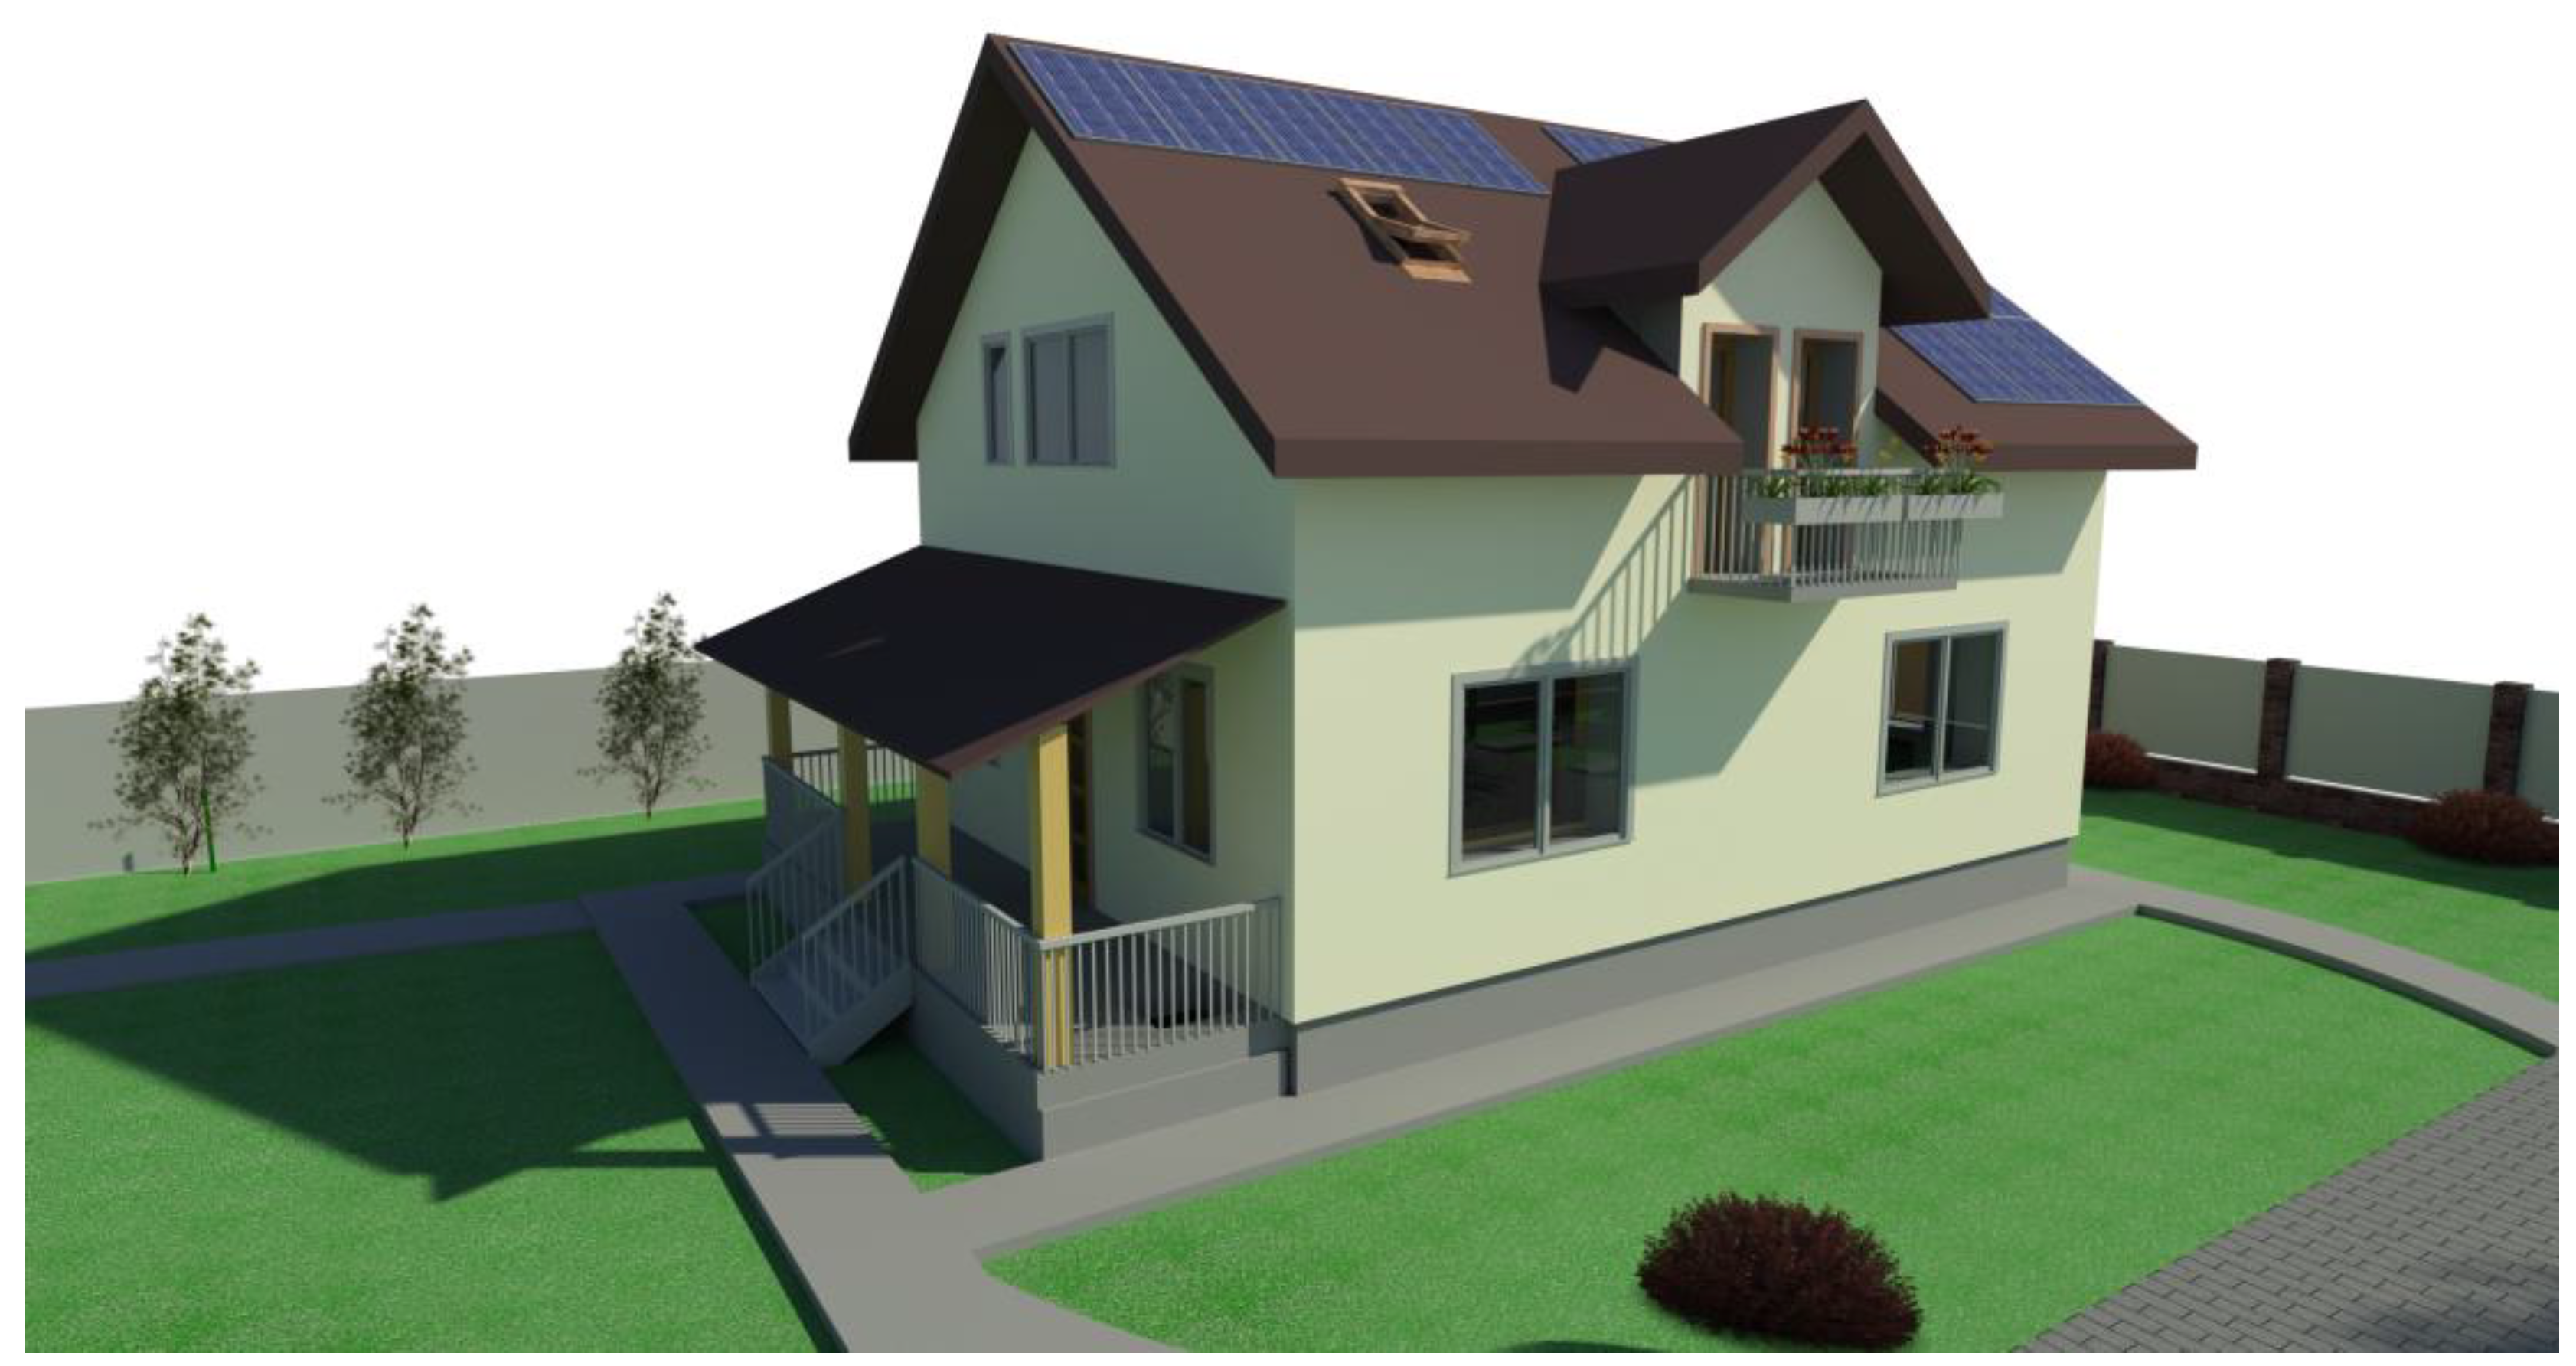
Figure 12.
Yearly energy consumption and production for the Case Study Building: A, total electrical energy consumption; B, electrical energy used by the heat pump for heating; C, thermal energy output from the heat pump; D, electrical energy output from the photovoltaic panels.
Figure 12.
Yearly energy consumption and production for the Case Study Building: A, total electrical energy consumption; B, electrical energy used by the heat pump for heating; C, thermal energy output from the heat pump; D, electrical energy output from the photovoltaic panels.
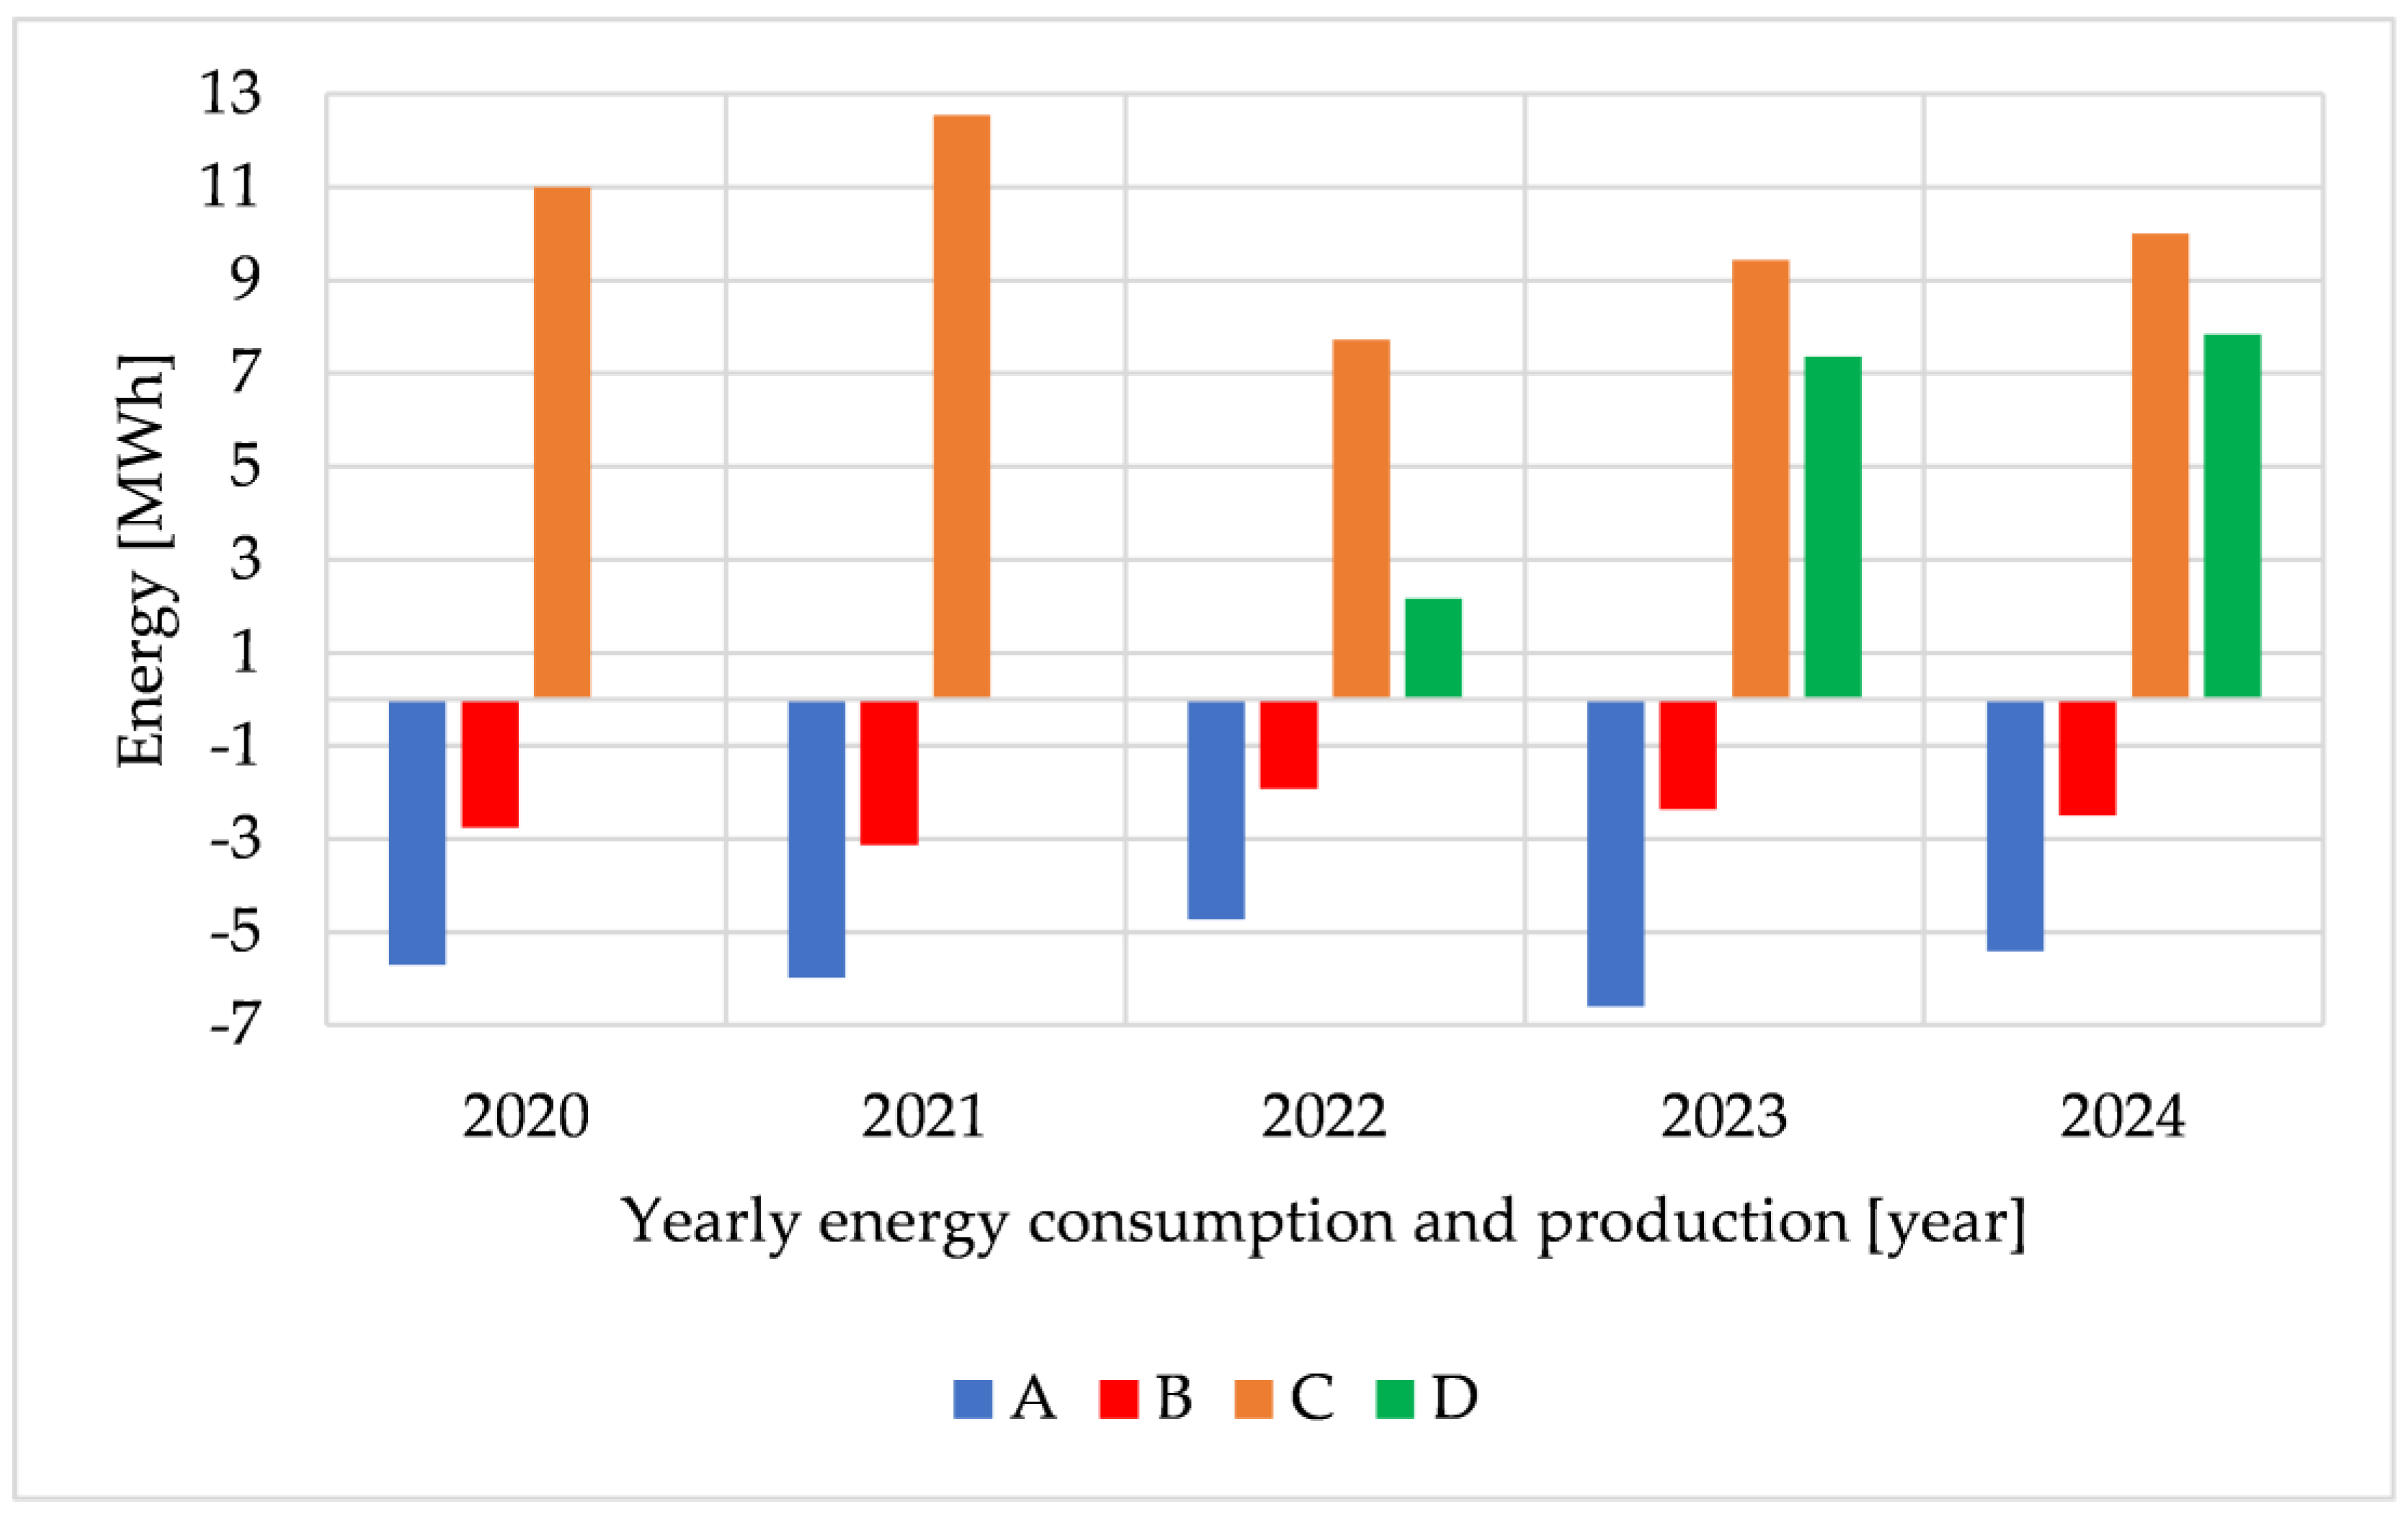
Figure 13.
The CO2 emissions block diagram for the building life cycle.
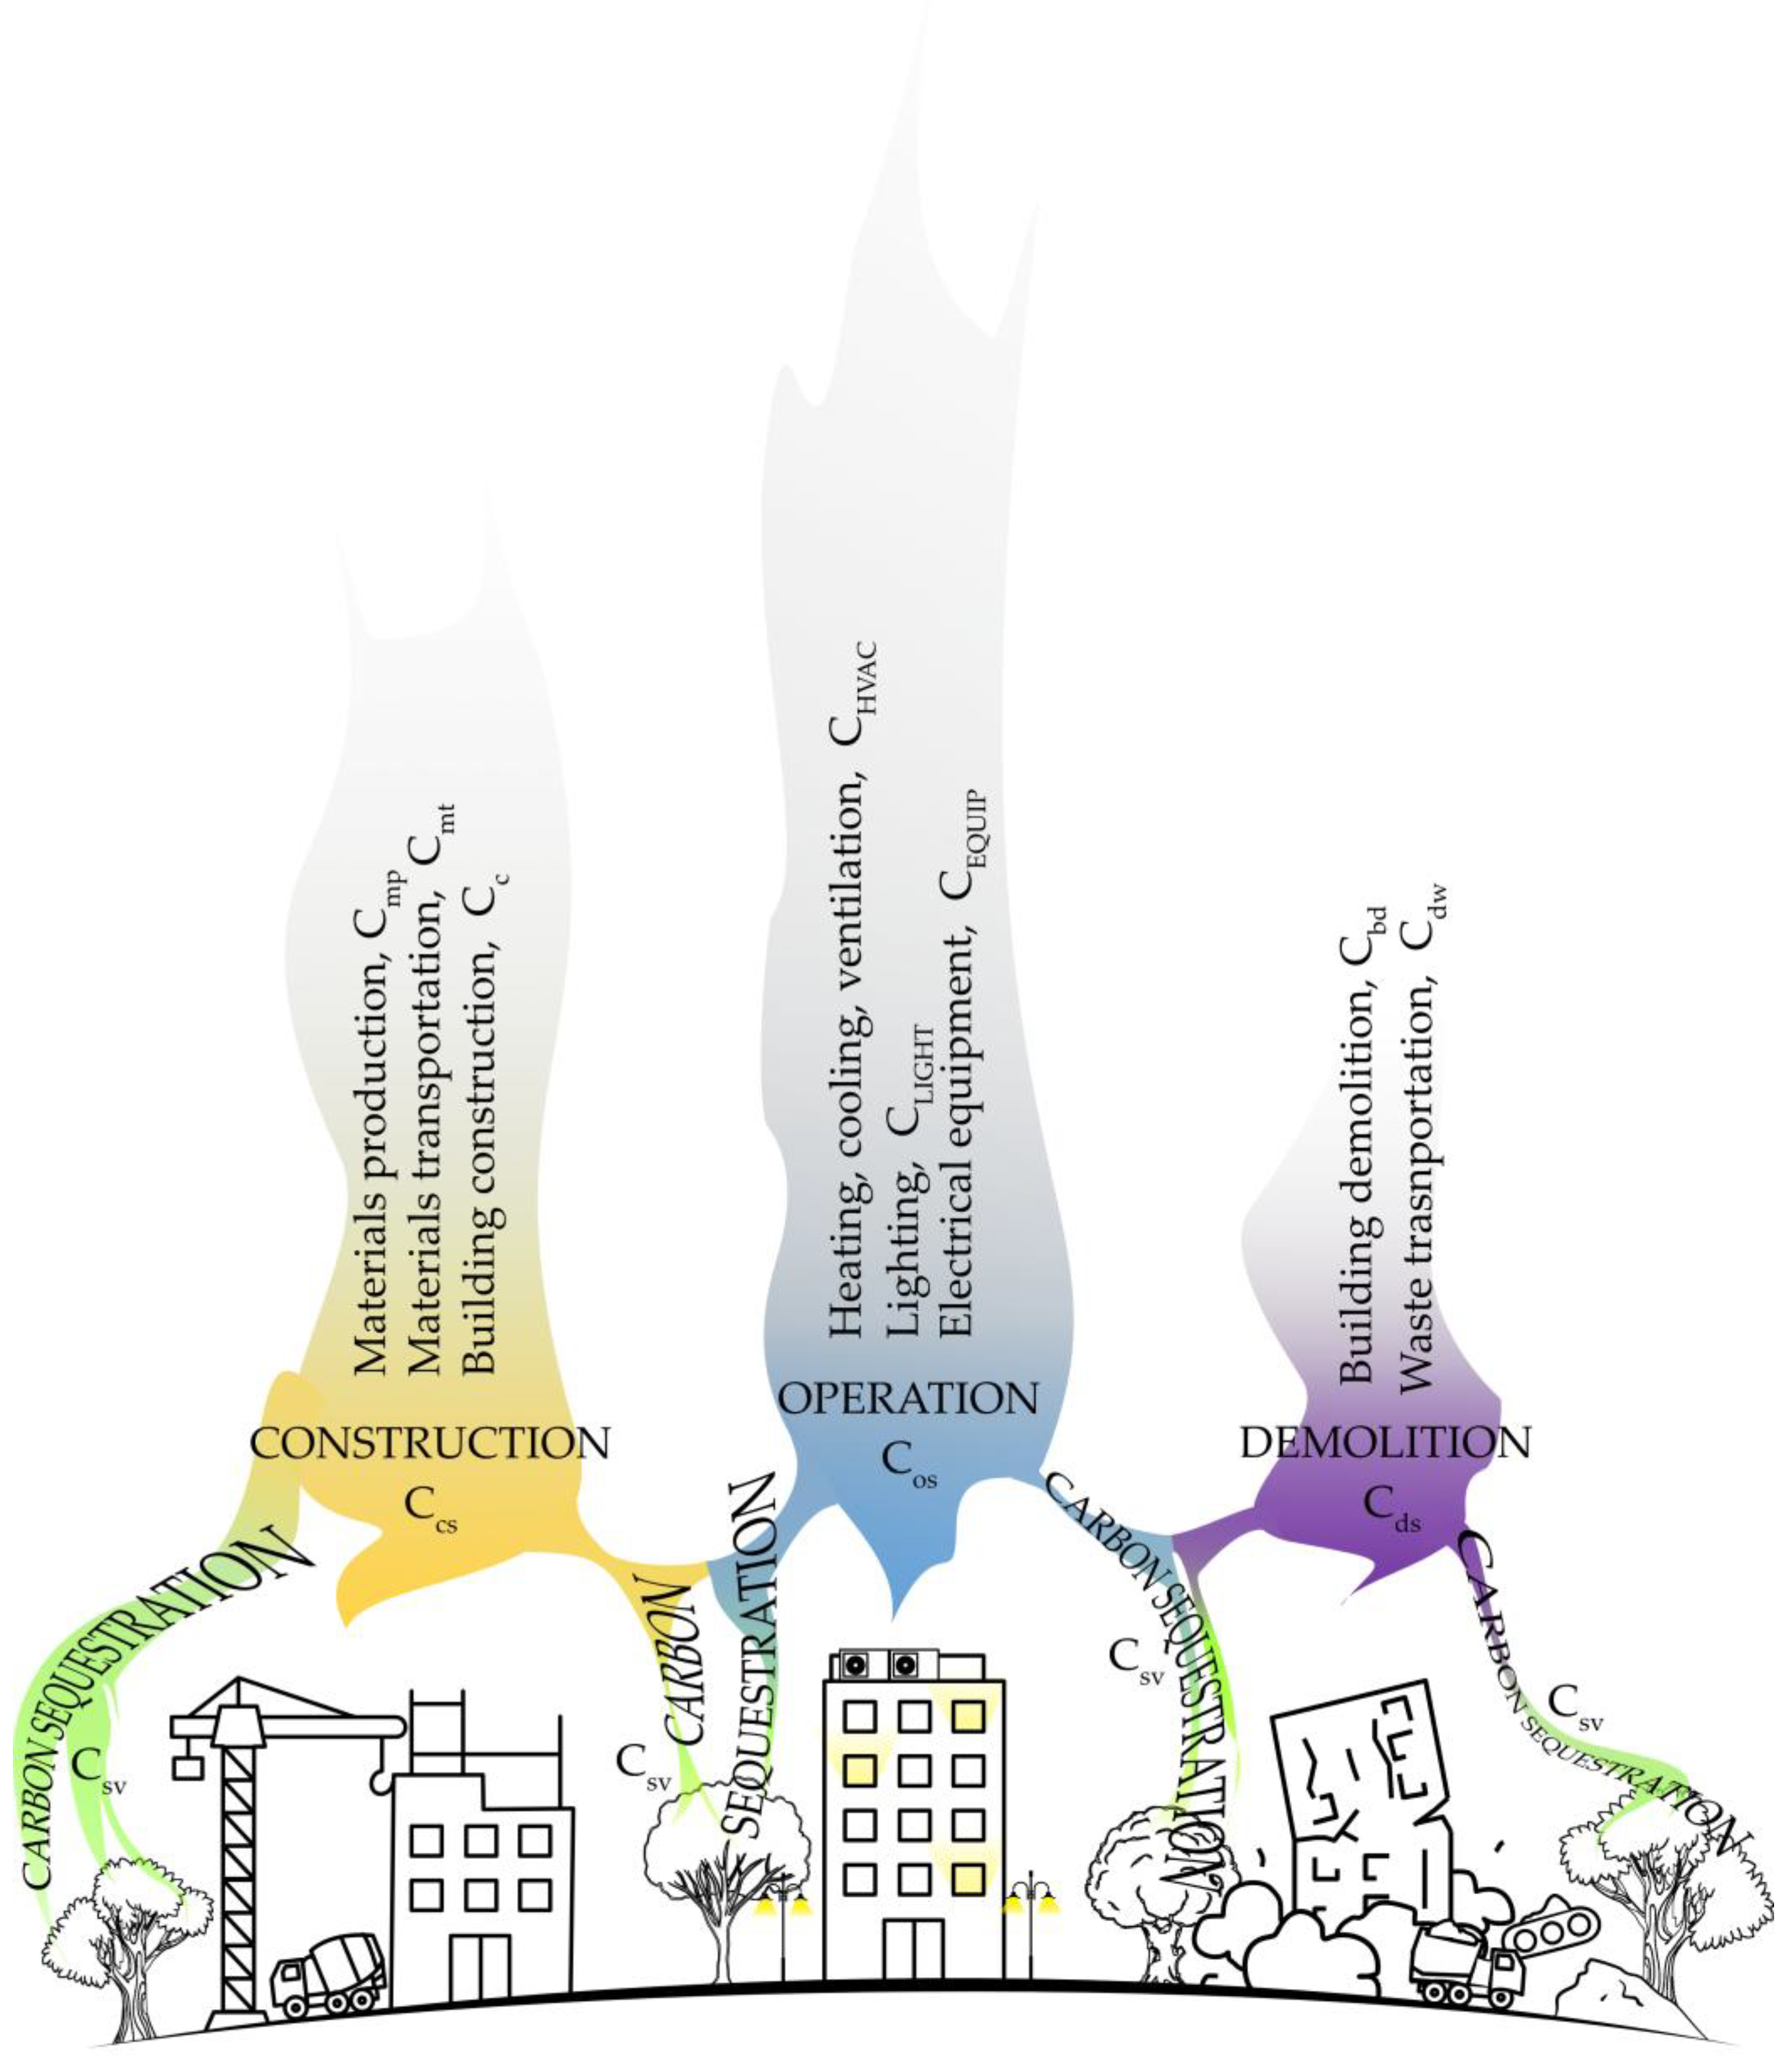
Figure 14.
The CO2 emissions for each life cycle sub-stage for the case study building in percentages
Figure 14.
The CO2 emissions for each life cycle sub-stage for the case study building in percentages
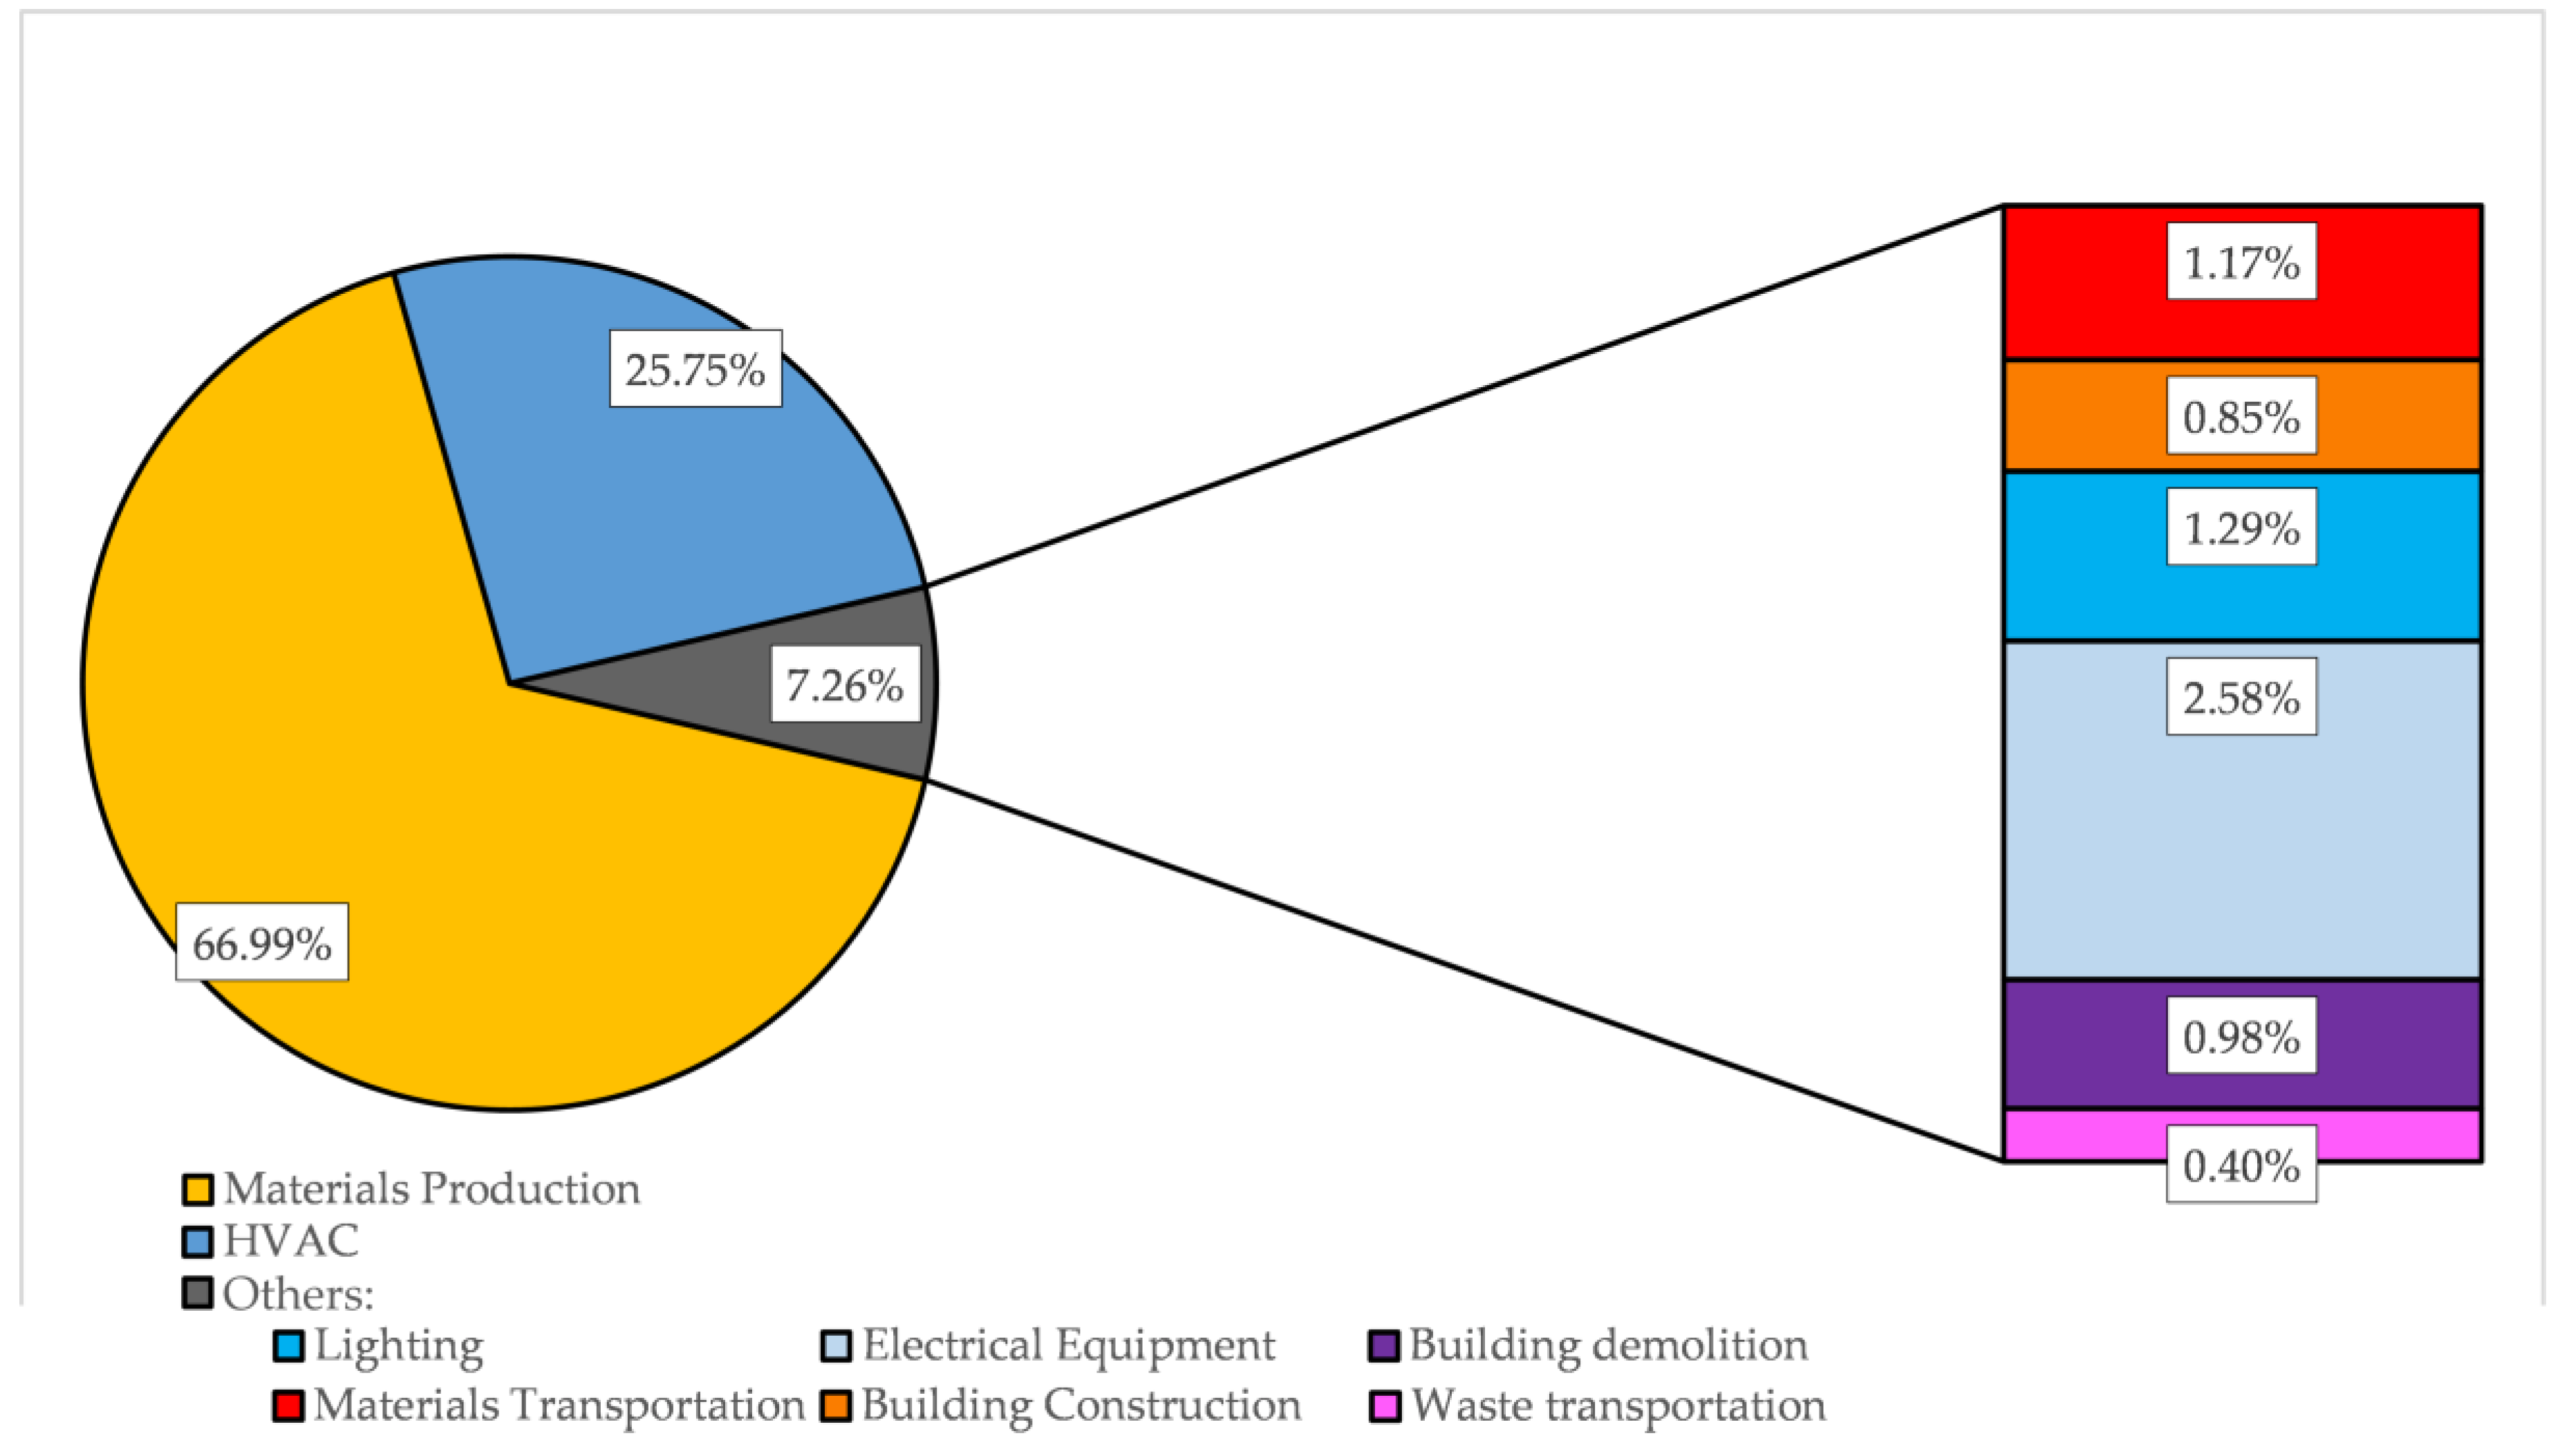
Figure 15.
The CO2 emissions for the construction stage split into sub-stages
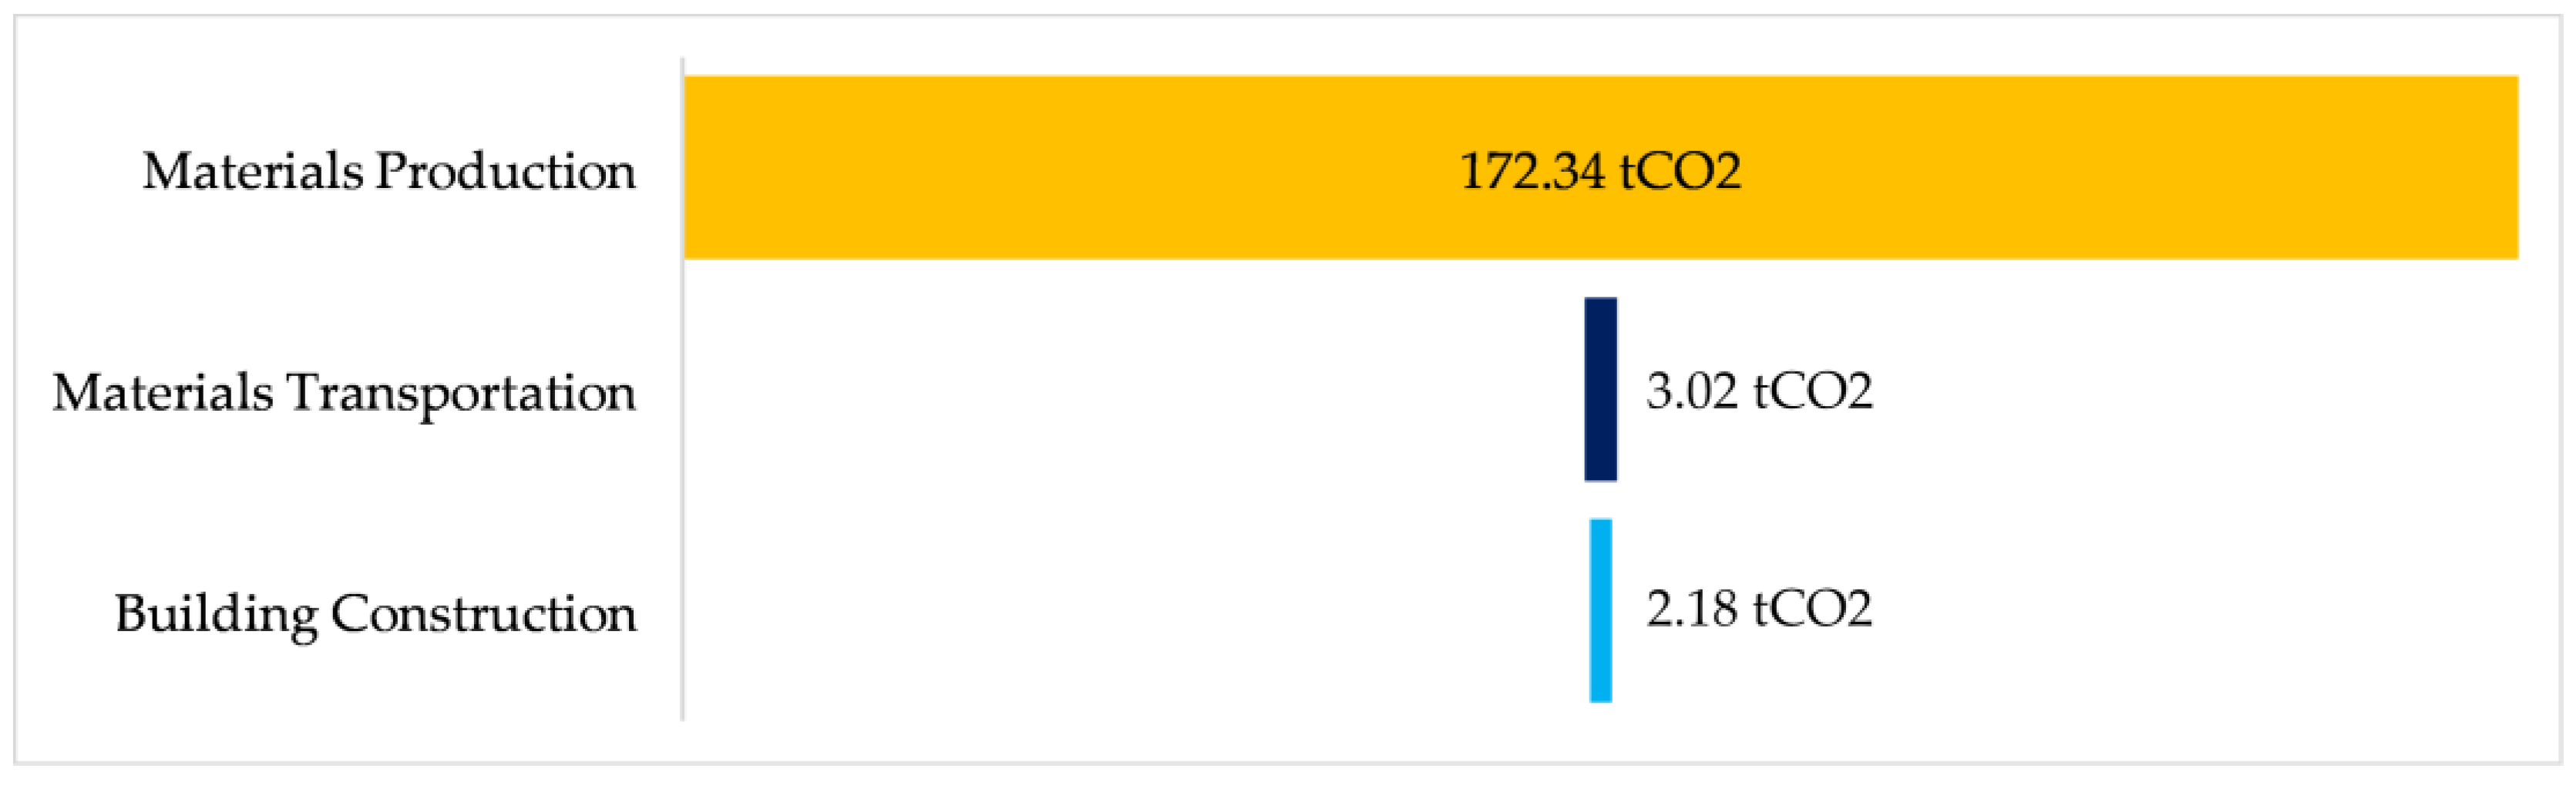
Figure 16.
The CO2 emissions for the operation stage split into sub-stages
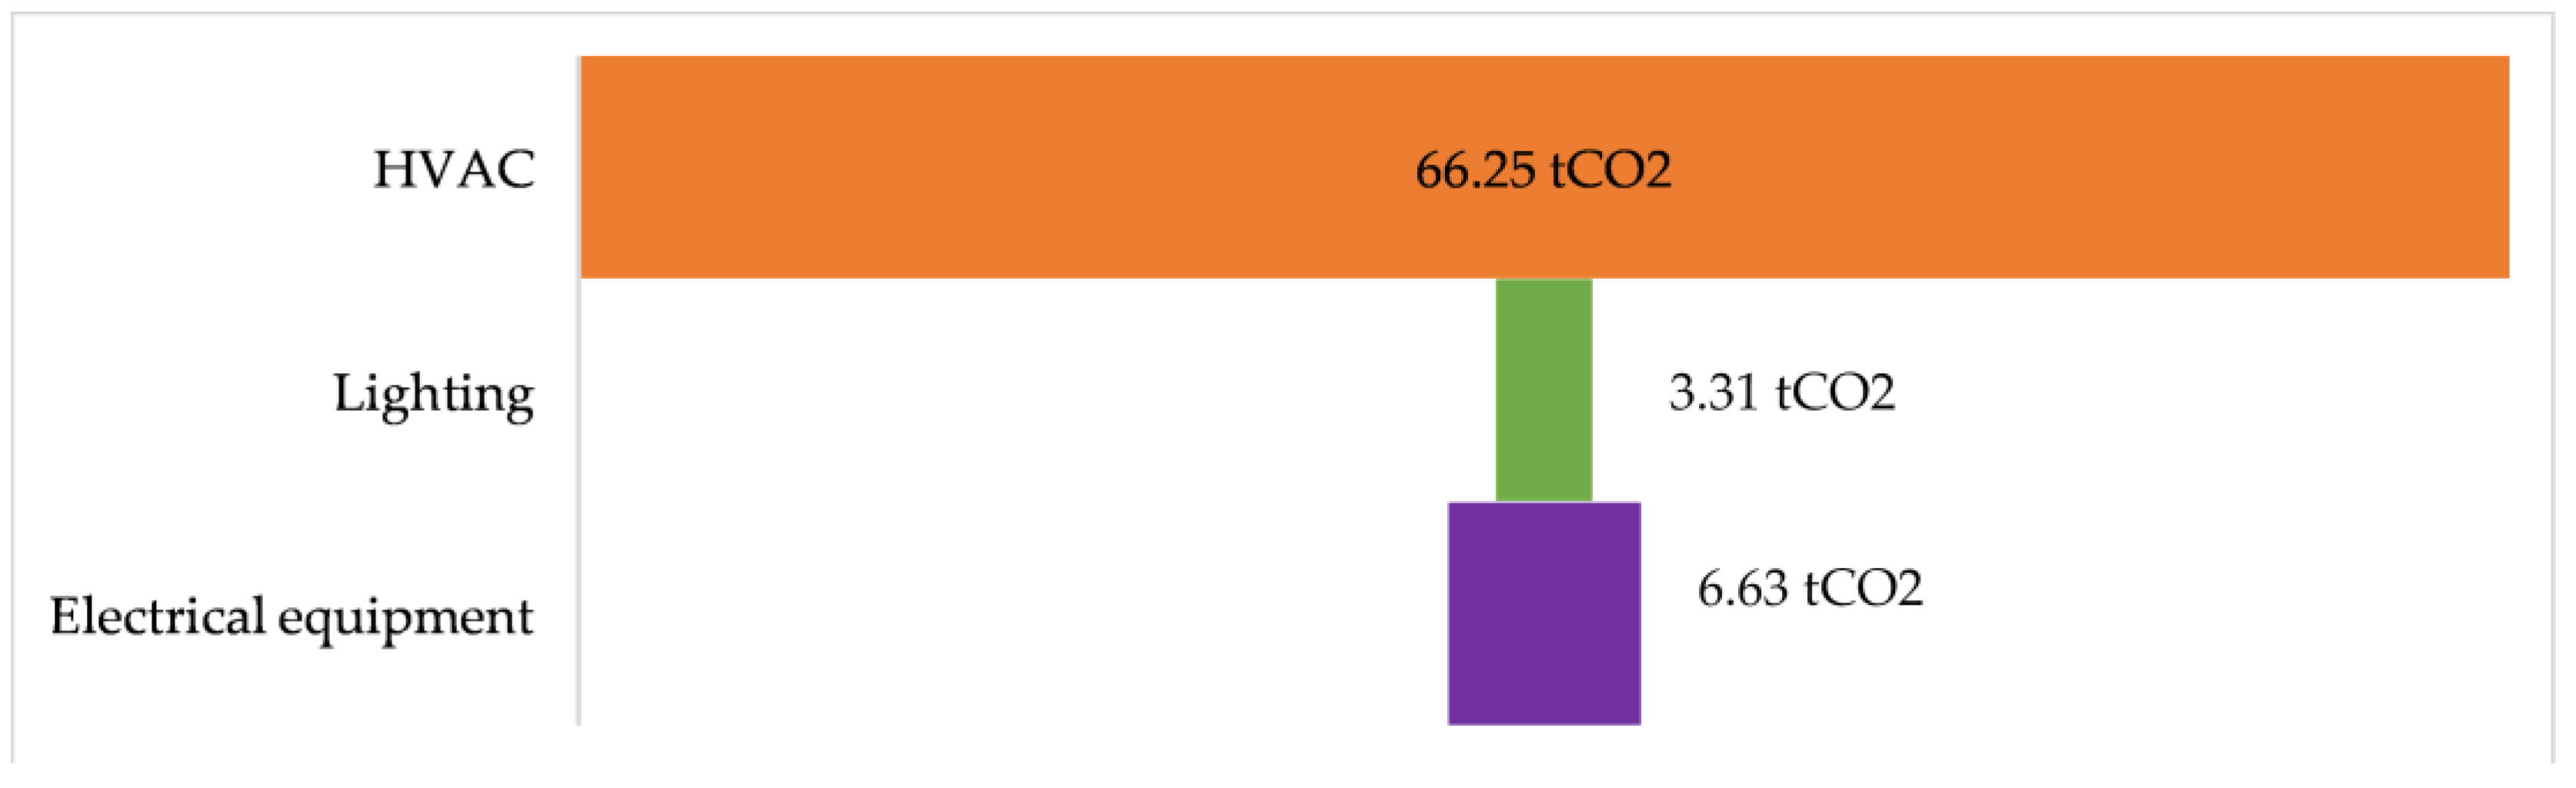
Figure 17.
The CO2 emissions for the demolition stage split into sub-stages
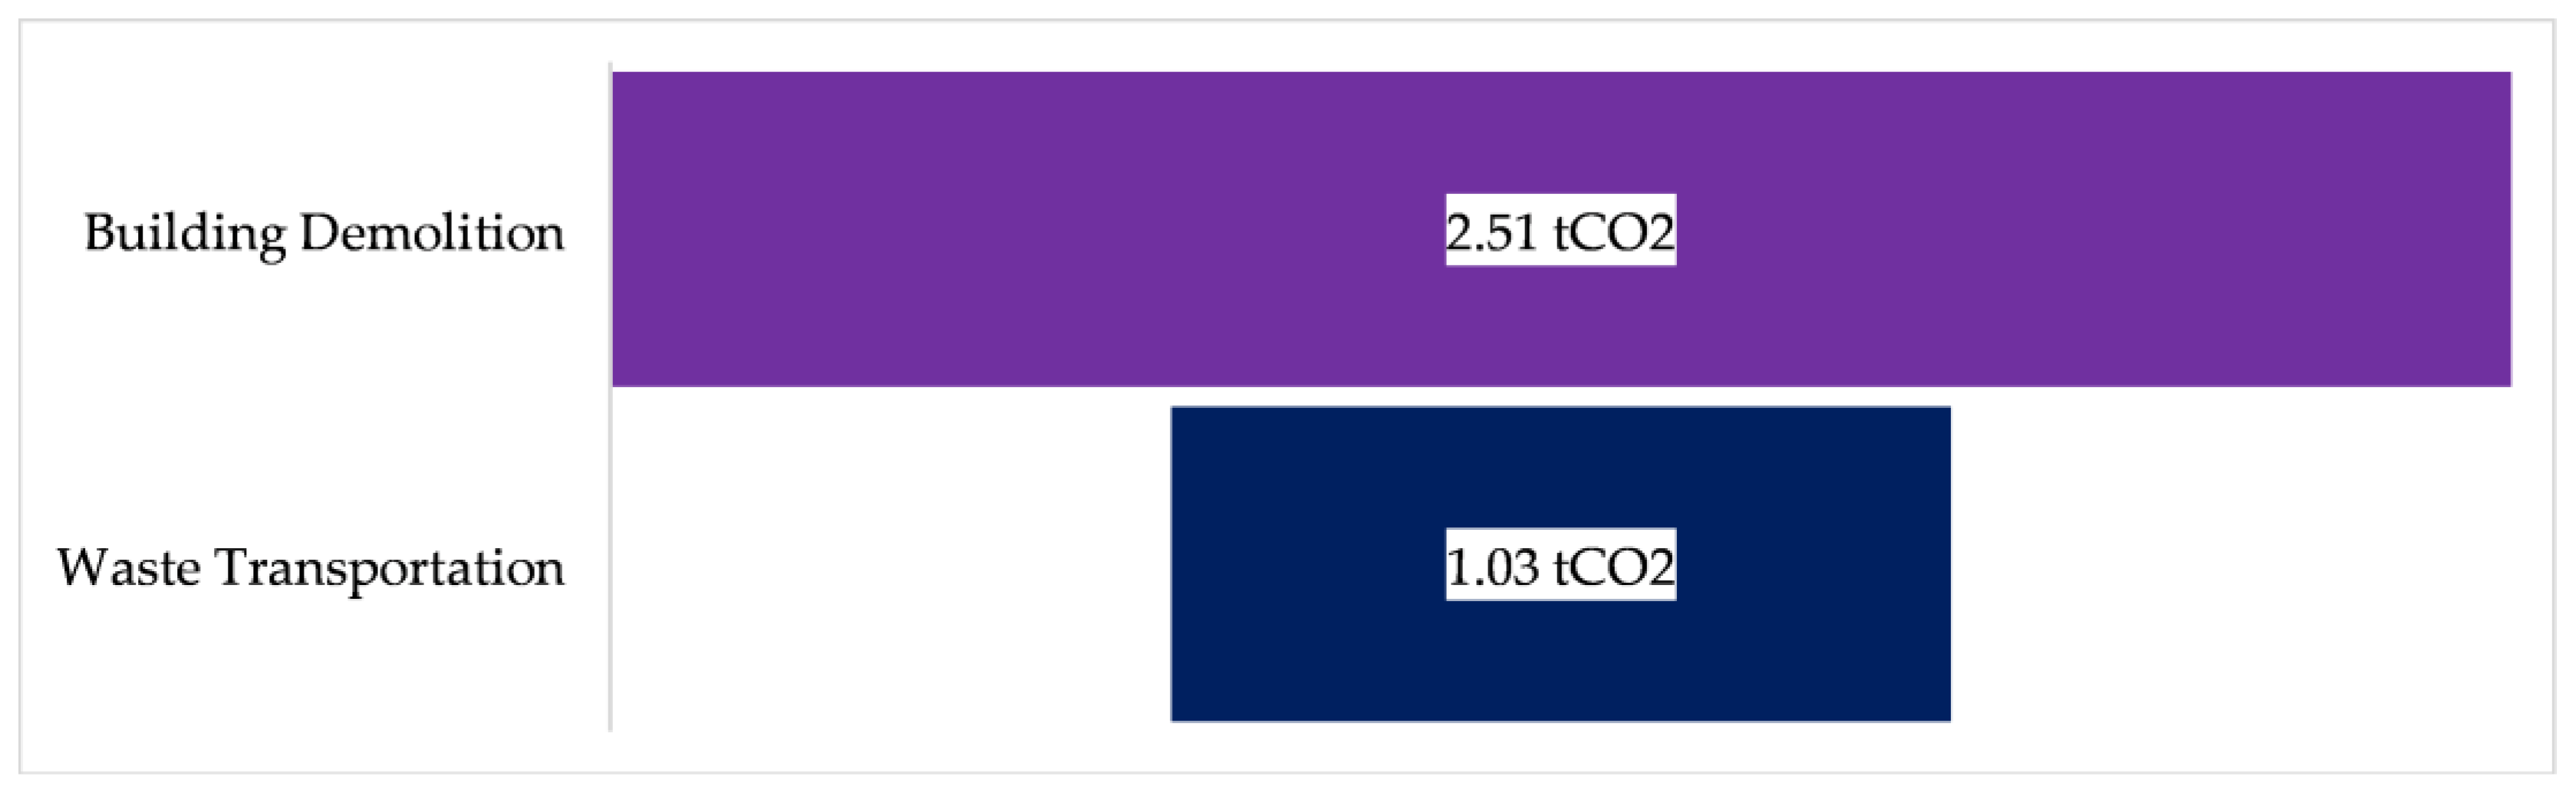
Figure 18.
The CO2 emissions for each of the building stages with the carbon sequestration from the vegetation outdoor area and the total carbon footprint of the case study building
Figure 18.
The CO2 emissions for each of the building stages with the carbon sequestration from the vegetation outdoor area and the total carbon footprint of the case study building
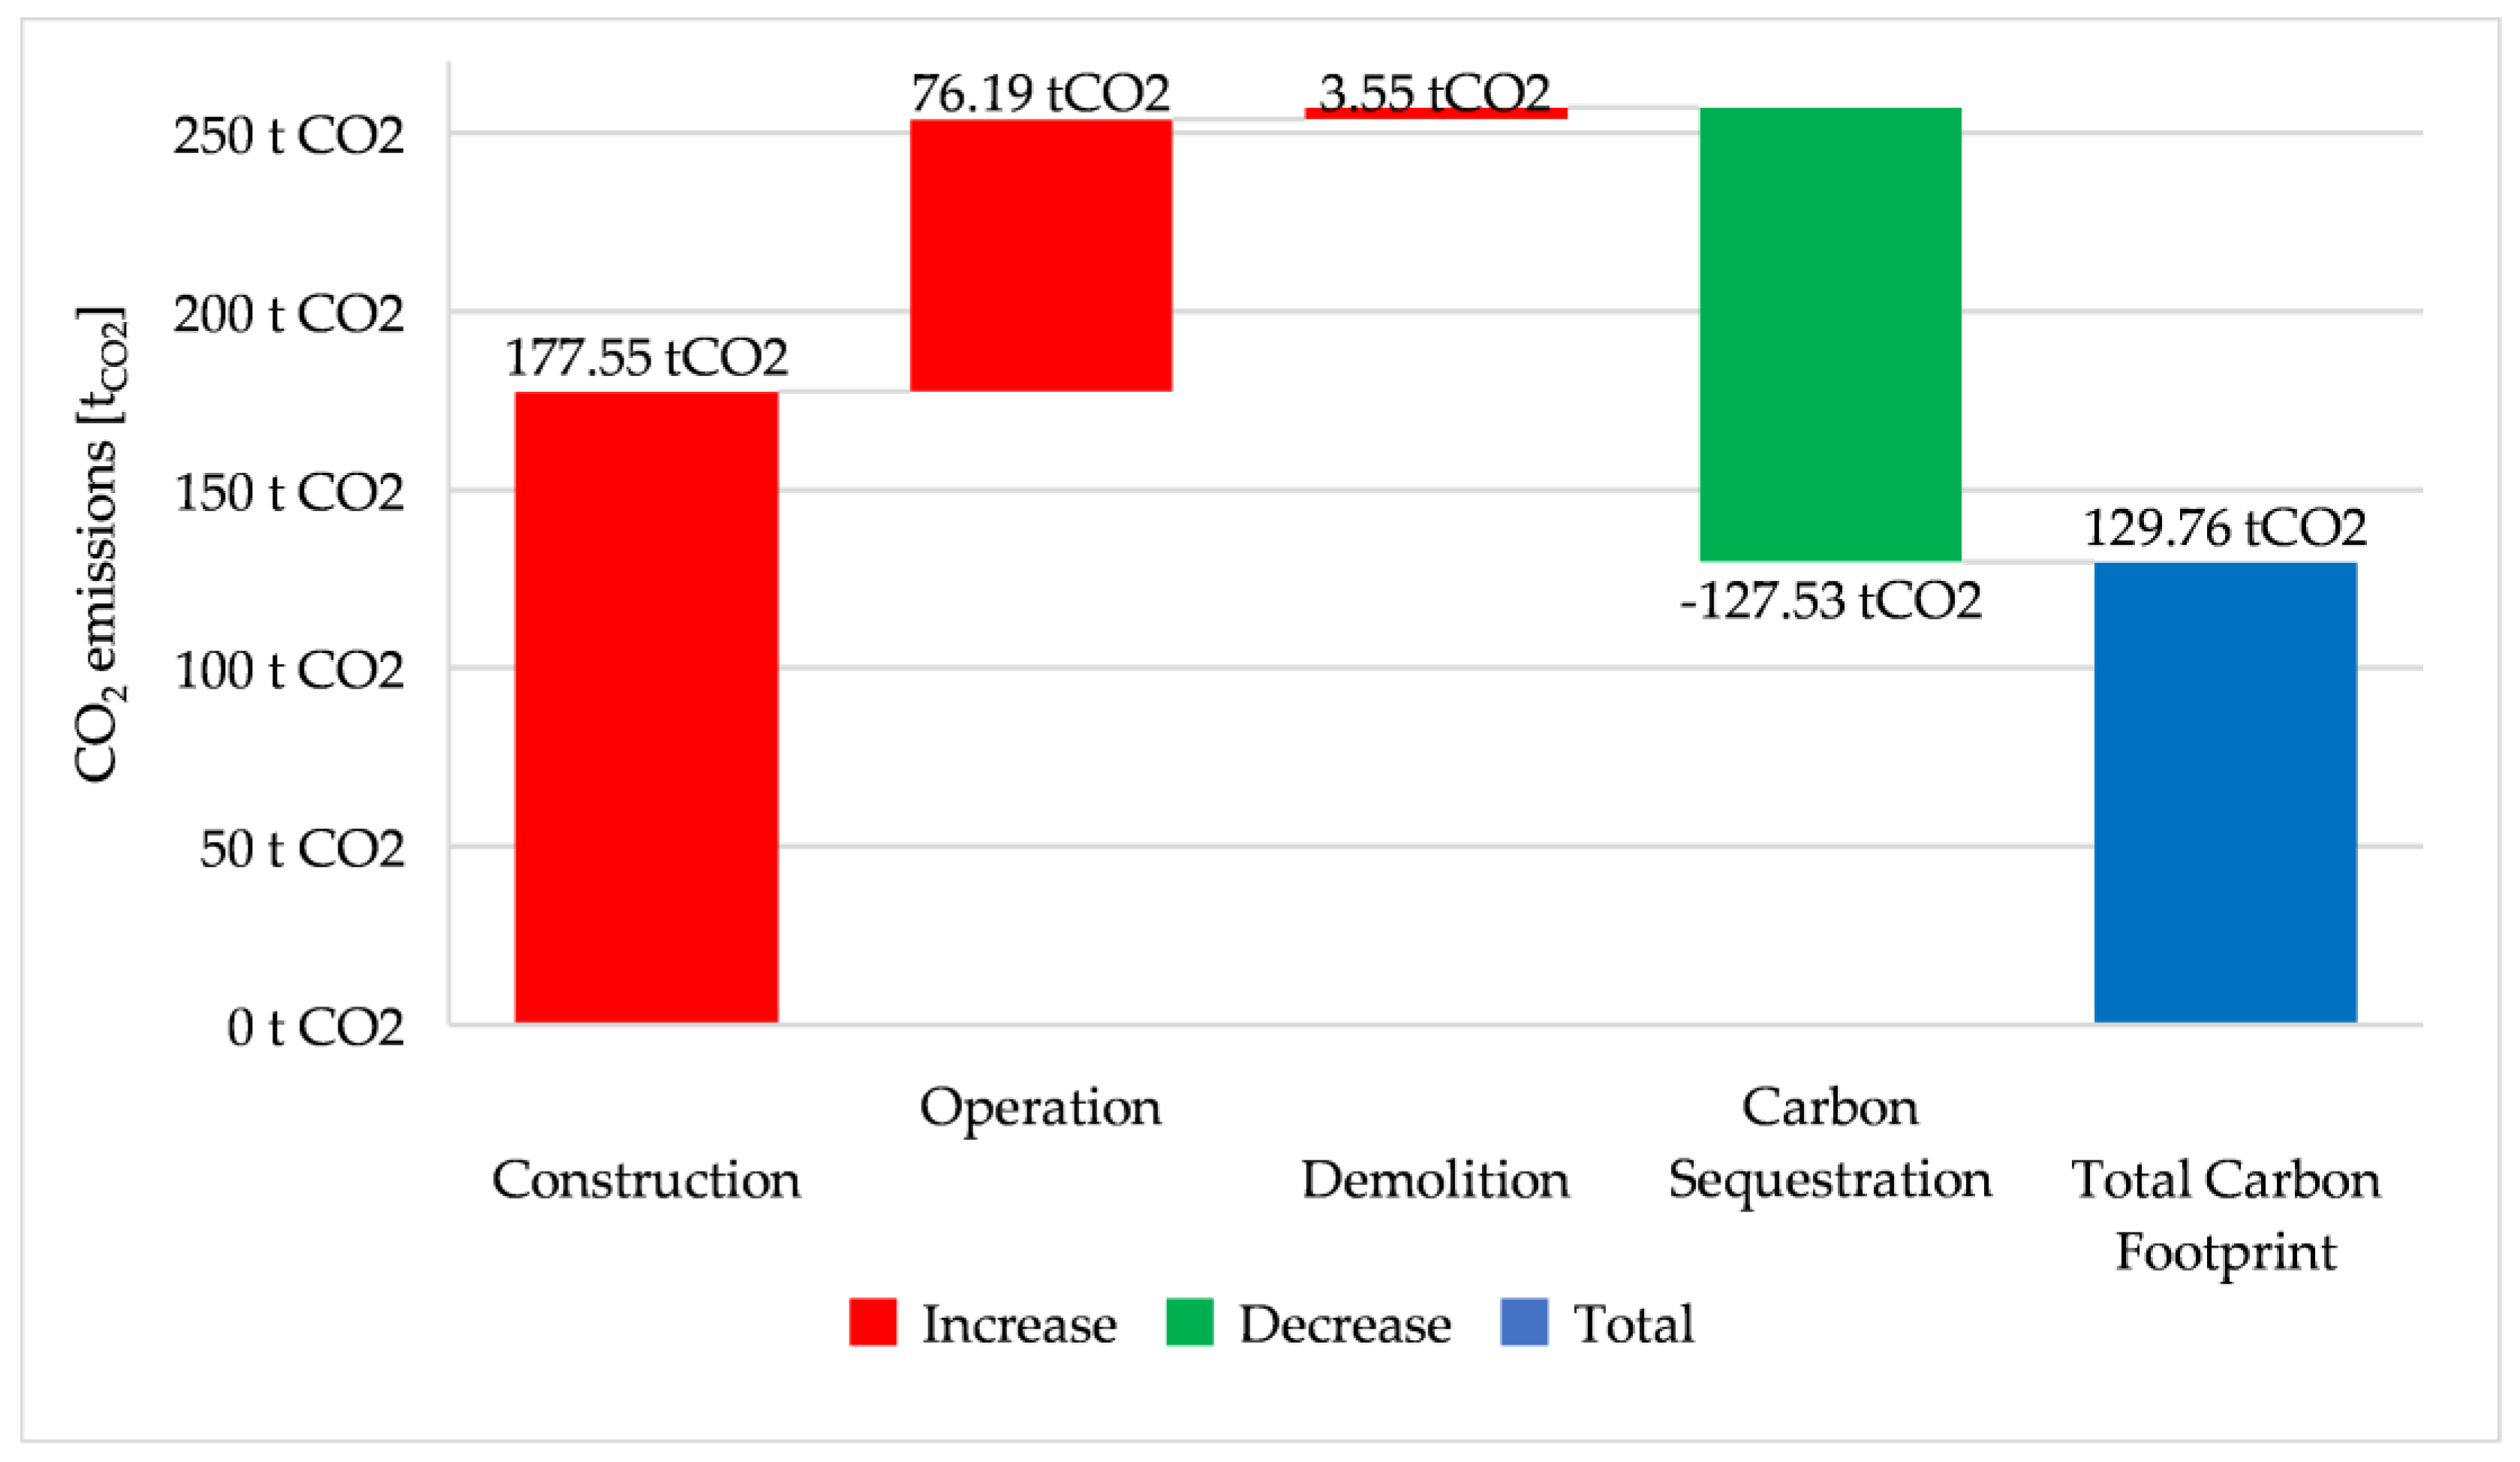
Figure 19.
The CO2 emissions for the HVAC operational sub-stage, from 1989 onwards, for heating with firewood (F) or natural gas (G) and for the Case Study Building (CSB) and Passive House (PH)
Figure 19.
The CO2 emissions for the HVAC operational sub-stage, from 1989 onwards, for heating with firewood (F) or natural gas (G) and for the Case Study Building (CSB) and Passive House (PH)
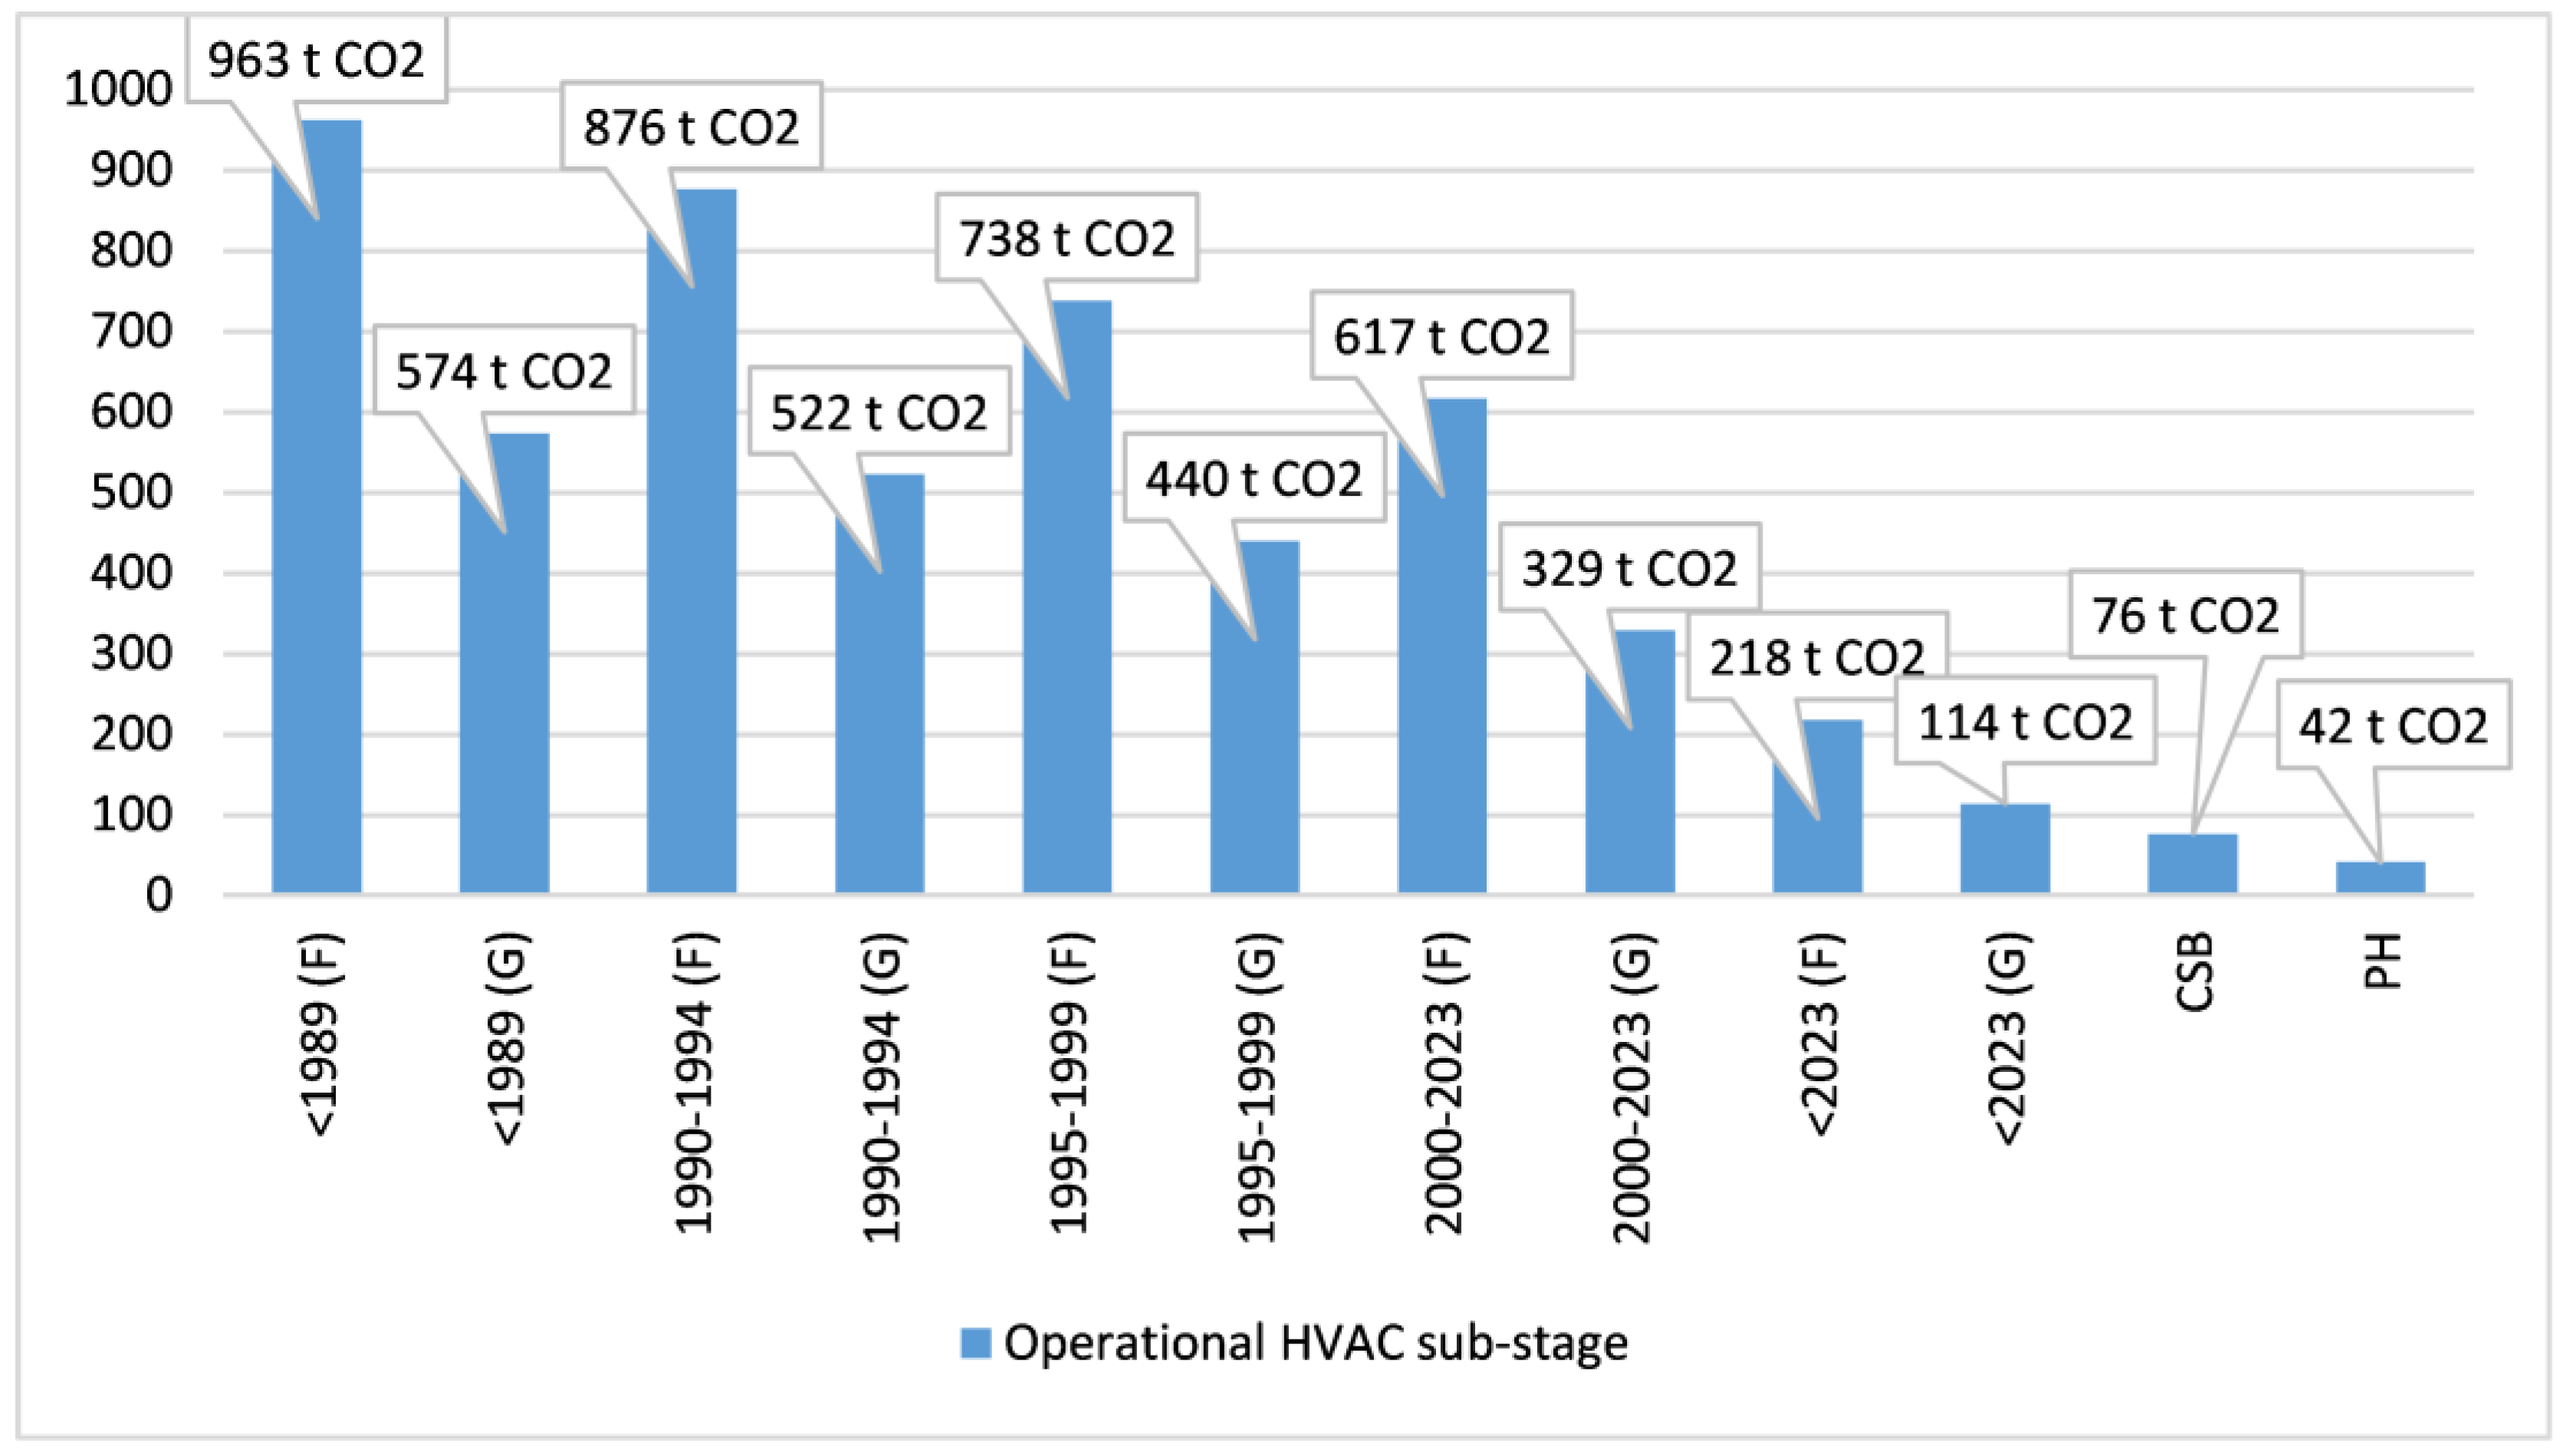
Figure 20.
The CO2 emissions shares for construction, operation and demolition stages, from 1989 onwards, for heating with firewood (F) or natural gas (G) and for the Case Study Building (CSB) and Passive House (PH)
Figure 20.
The CO2 emissions shares for construction, operation and demolition stages, from 1989 onwards, for heating with firewood (F) or natural gas (G) and for the Case Study Building (CSB) and Passive House (PH)
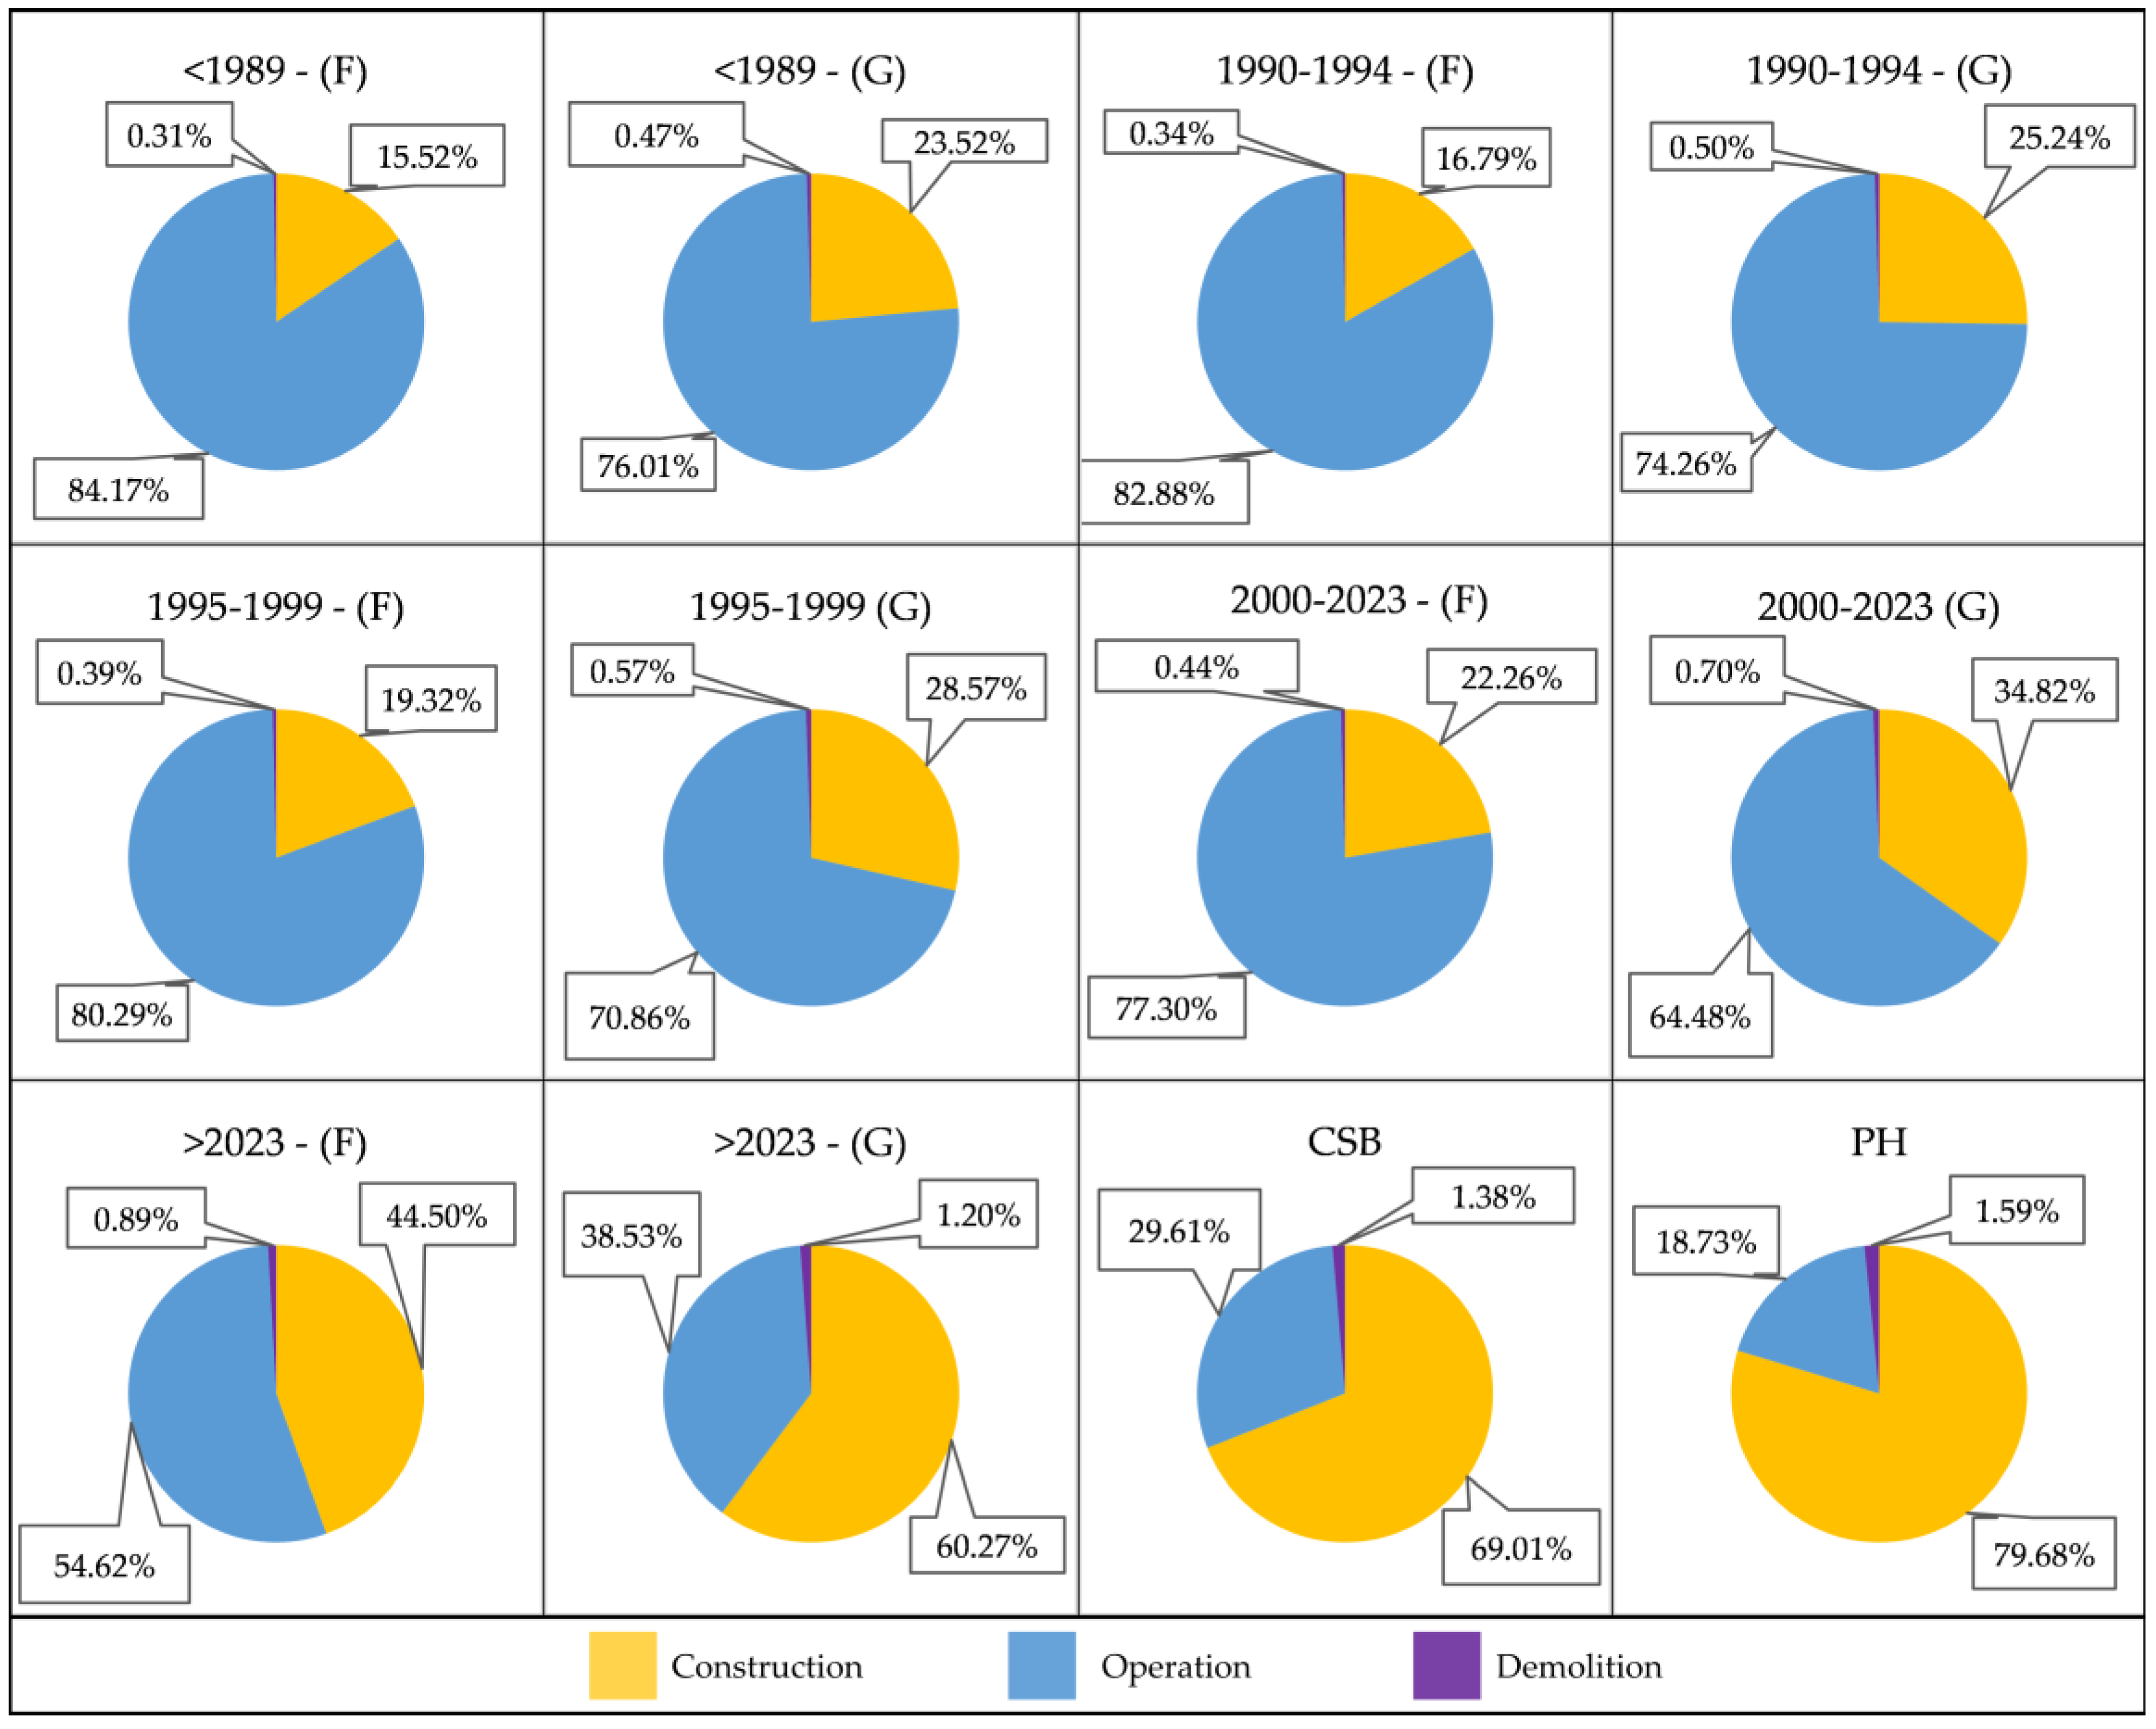
Figure 21.
The insulation thickness required in concordance with the energy reduction required to reach class A+ of energy performance for older existing buildings
Figure 21.
The insulation thickness required in concordance with the energy reduction required to reach class A+ of energy performance for older existing buildings
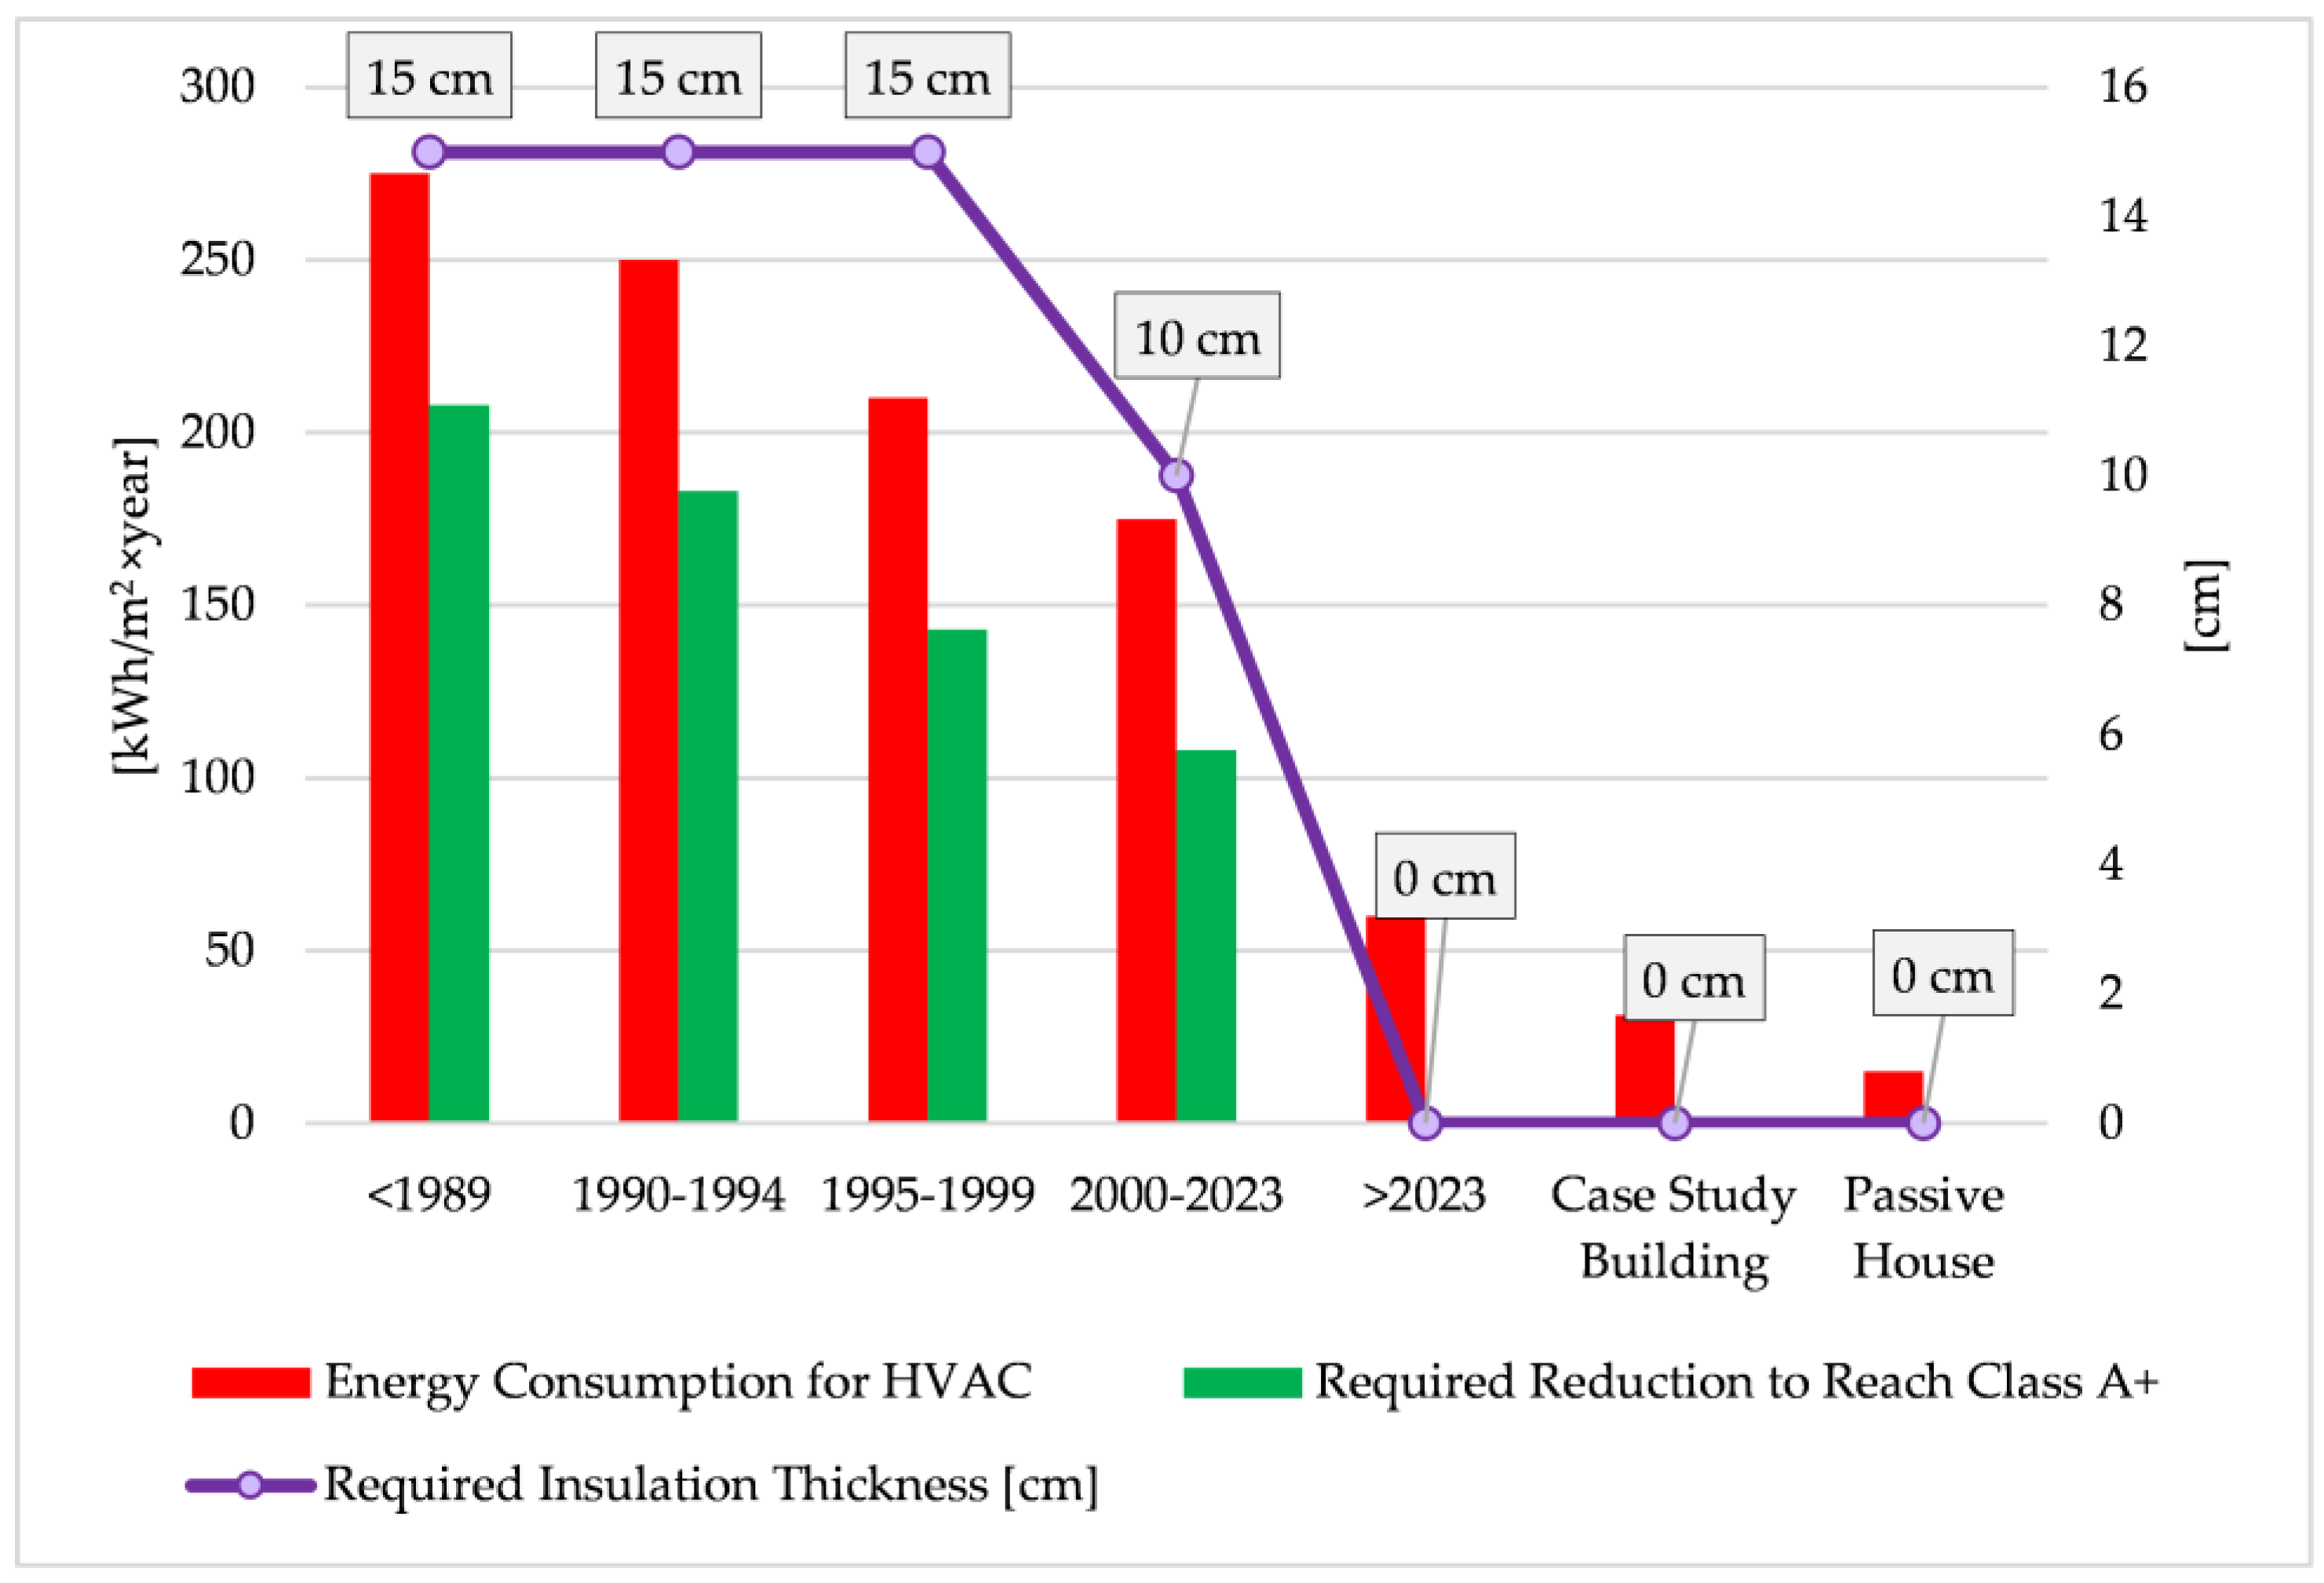
Figure 22.
The CO2 emissions reduction for the HVAC operational sub-stage by using a heat pump to the detriment of gas or firewood boilers, for different Energy Performance Classes for single-family residential buildings in Romania
Figure 22.
The CO2 emissions reduction for the HVAC operational sub-stage by using a heat pump to the detriment of gas or firewood boilers, for different Energy Performance Classes for single-family residential buildings in Romania
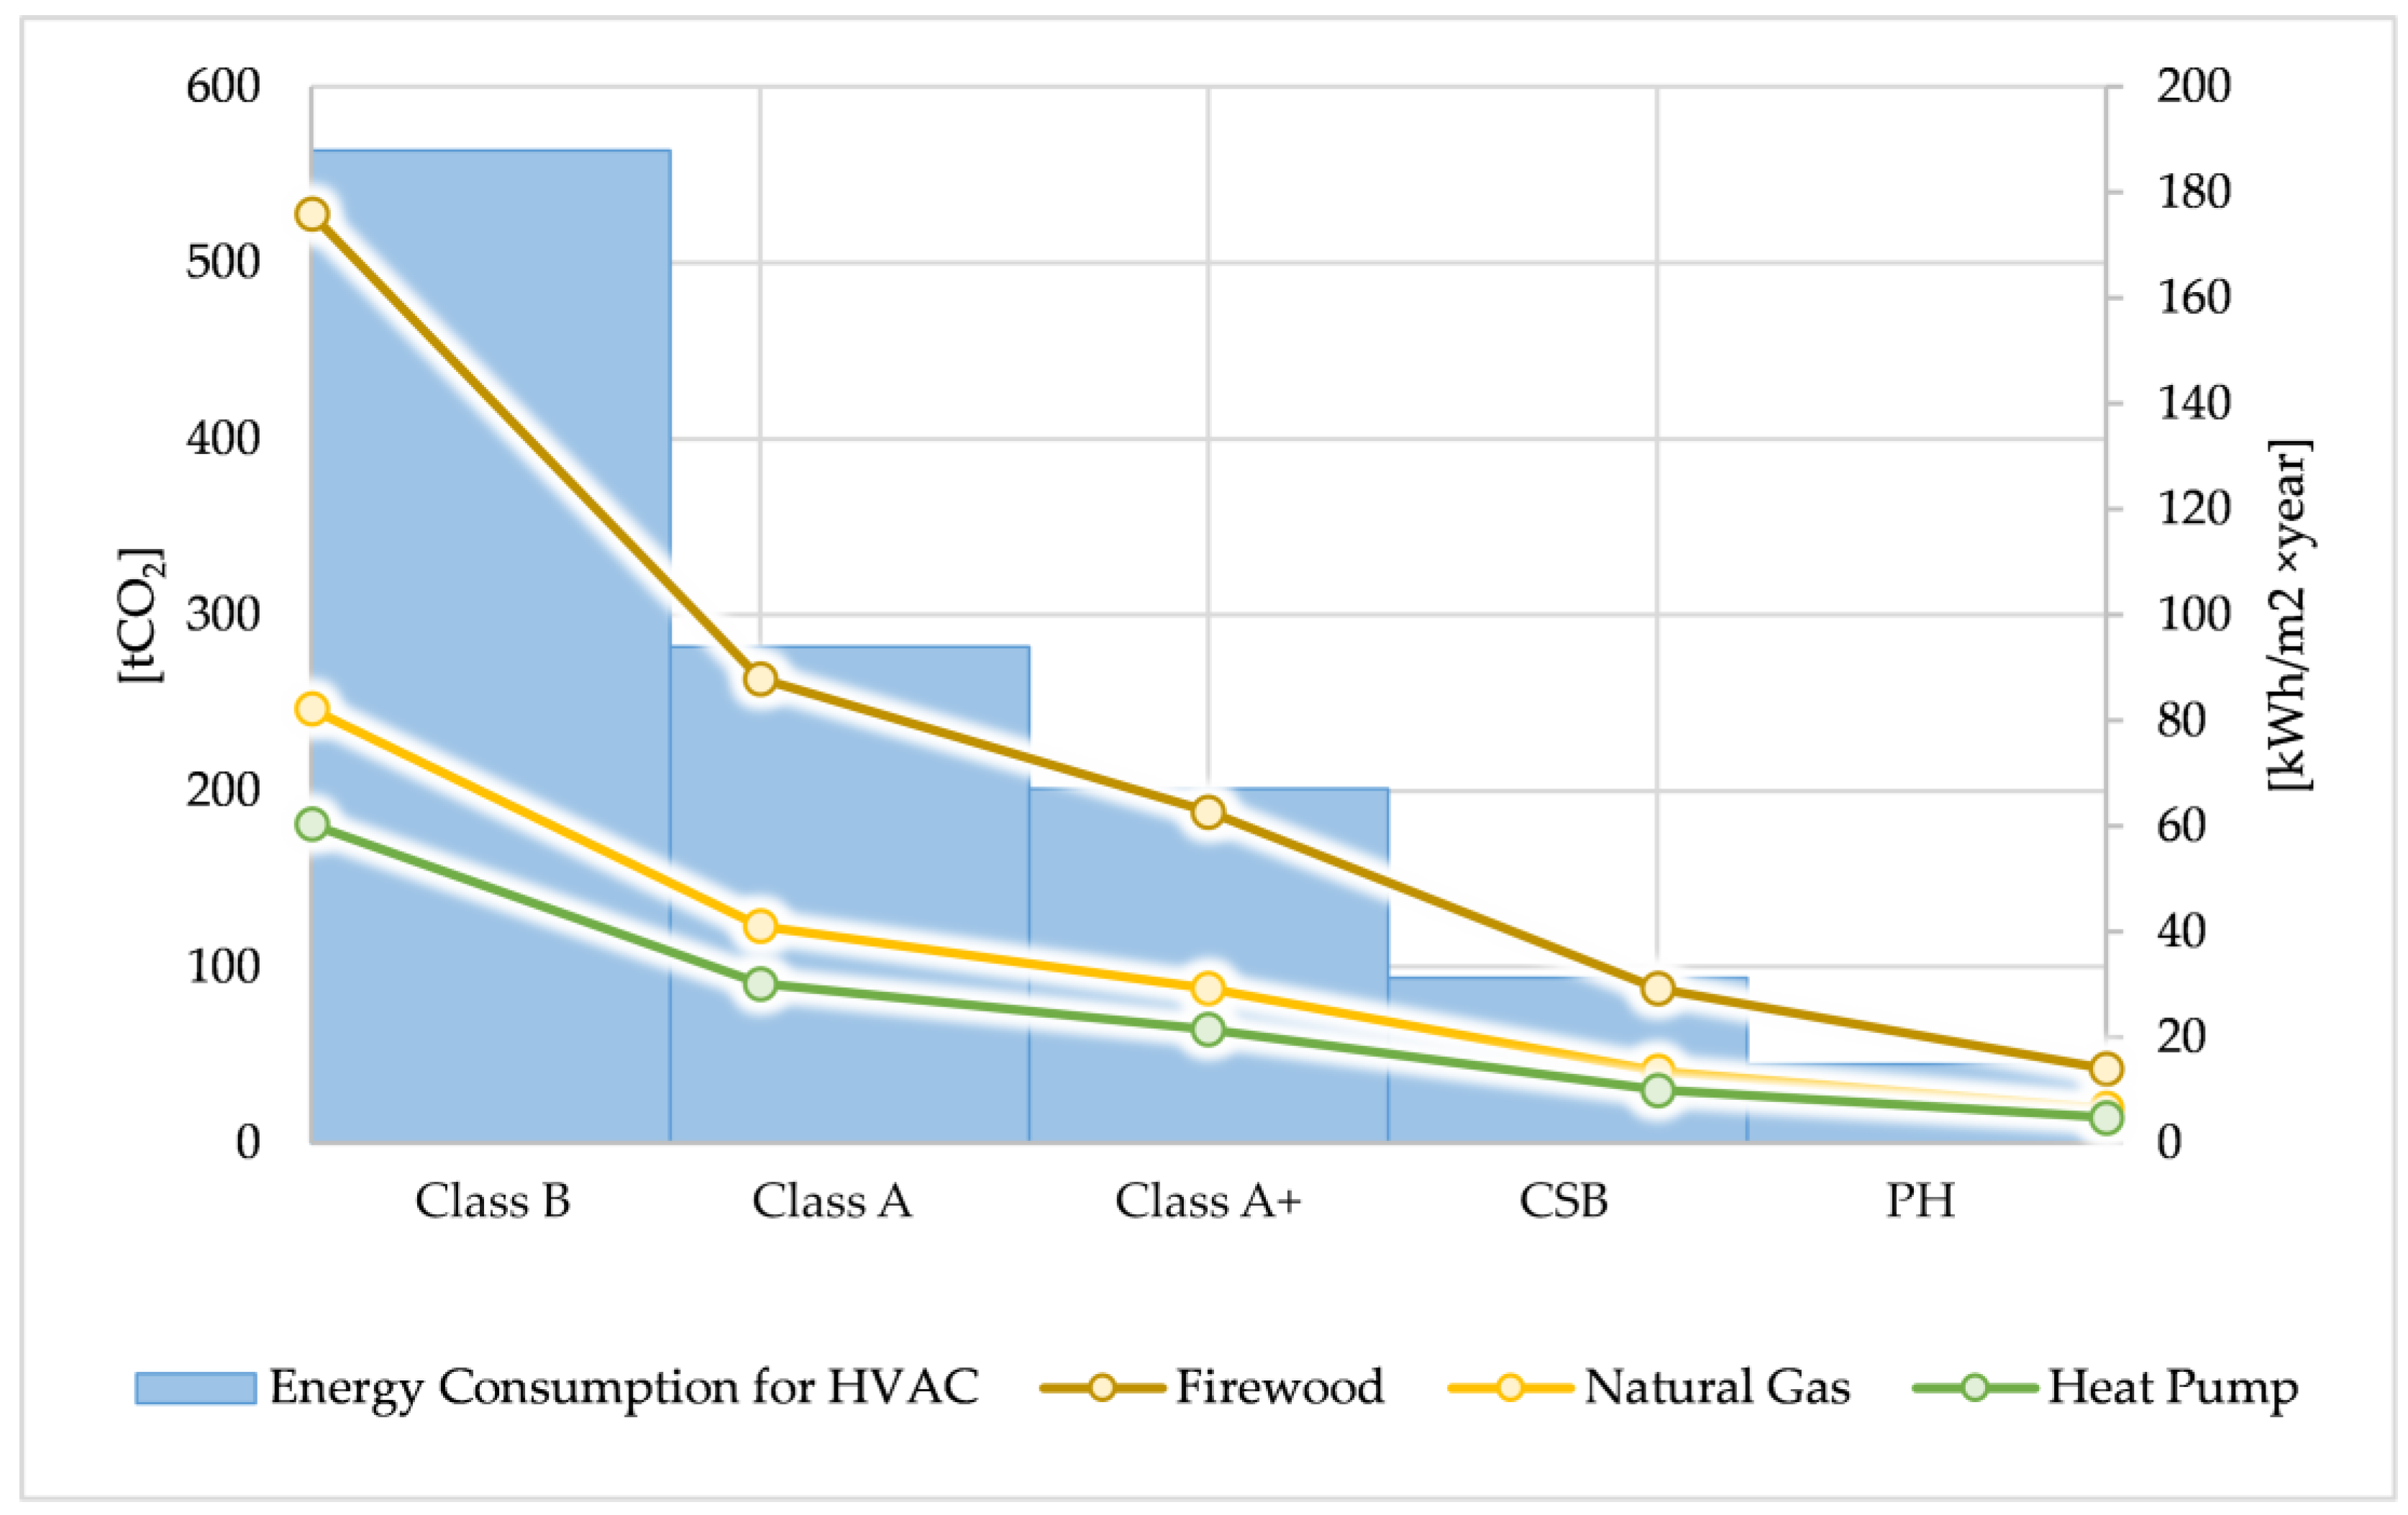
Figure 23.
The CO2 emissions reduction for the operational stage by using a heat pump and photovoltaic panels for the case study building
Figure 23.
The CO2 emissions reduction for the operational stage by using a heat pump and photovoltaic panels for the case study building
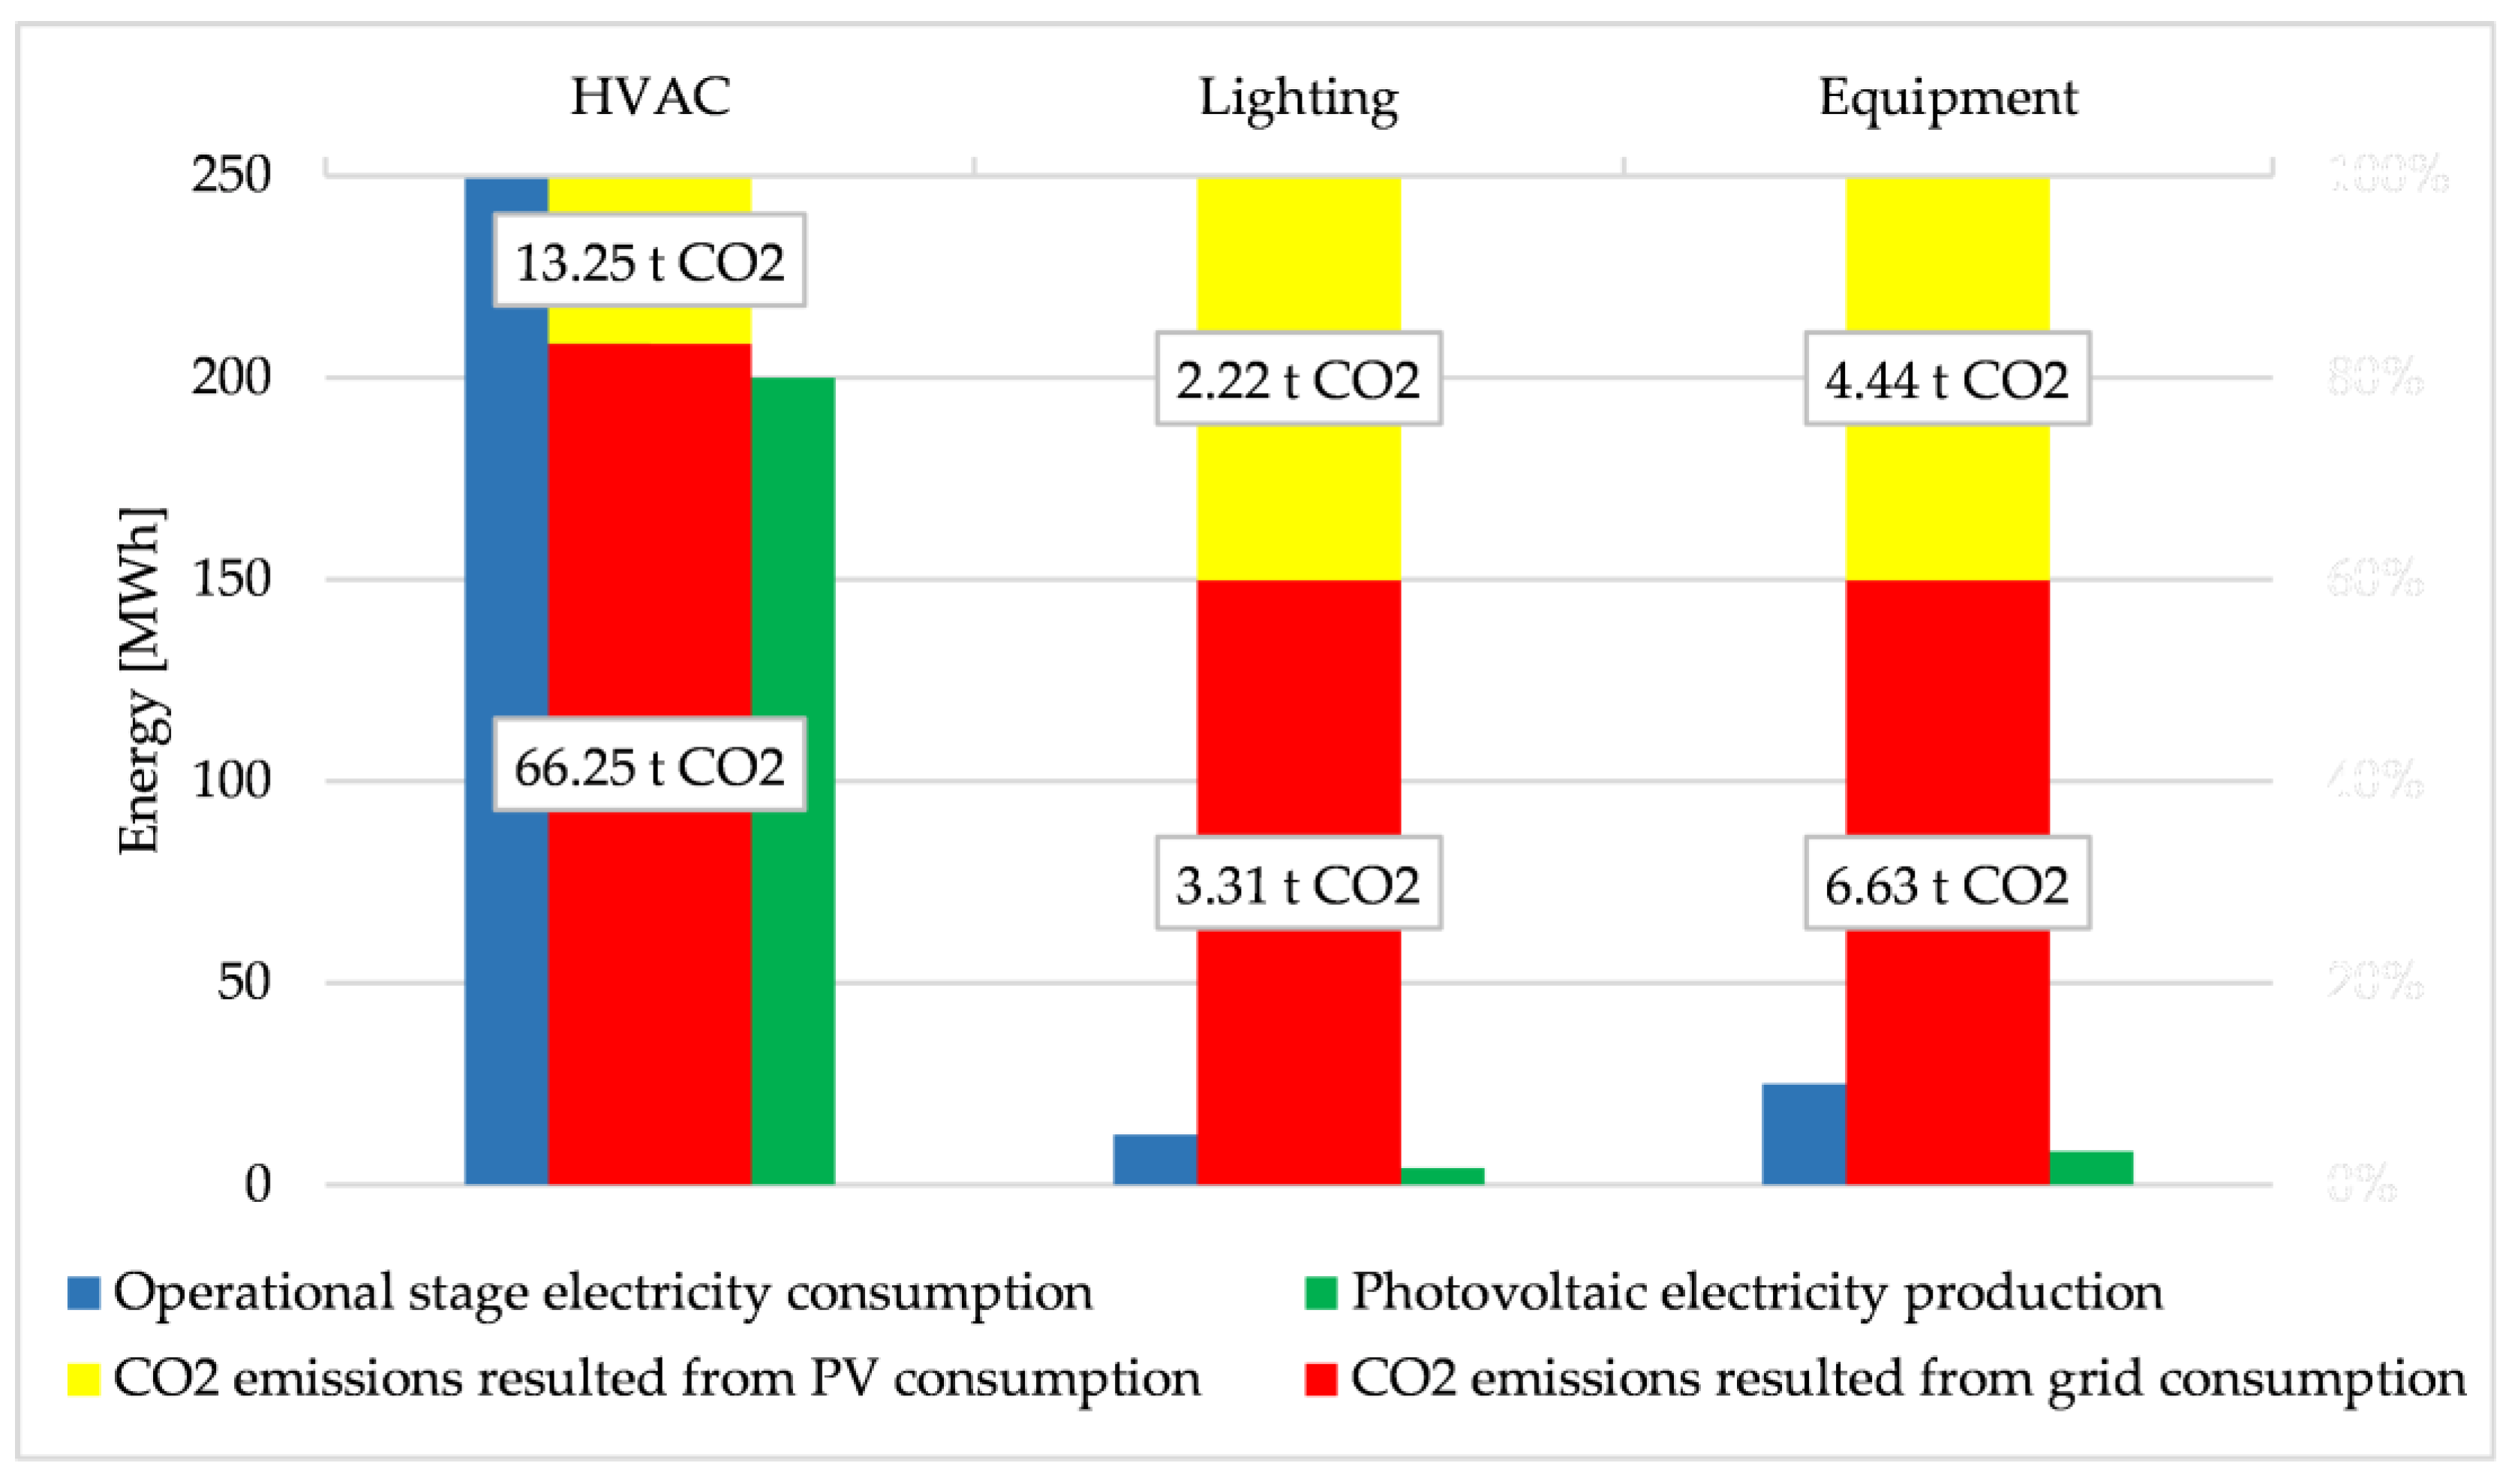
Figure 24.
The cost shares for construction, operation and demolition stages, for energetic classes B, A and A+, for heating with electricity (E) or natural gas (G) and for the Case Study Building (CSB) and Passive House (PH)
Figure 24.
The cost shares for construction, operation and demolition stages, for energetic classes B, A and A+, for heating with electricity (E) or natural gas (G) and for the Case Study Building (CSB) and Passive House (PH)
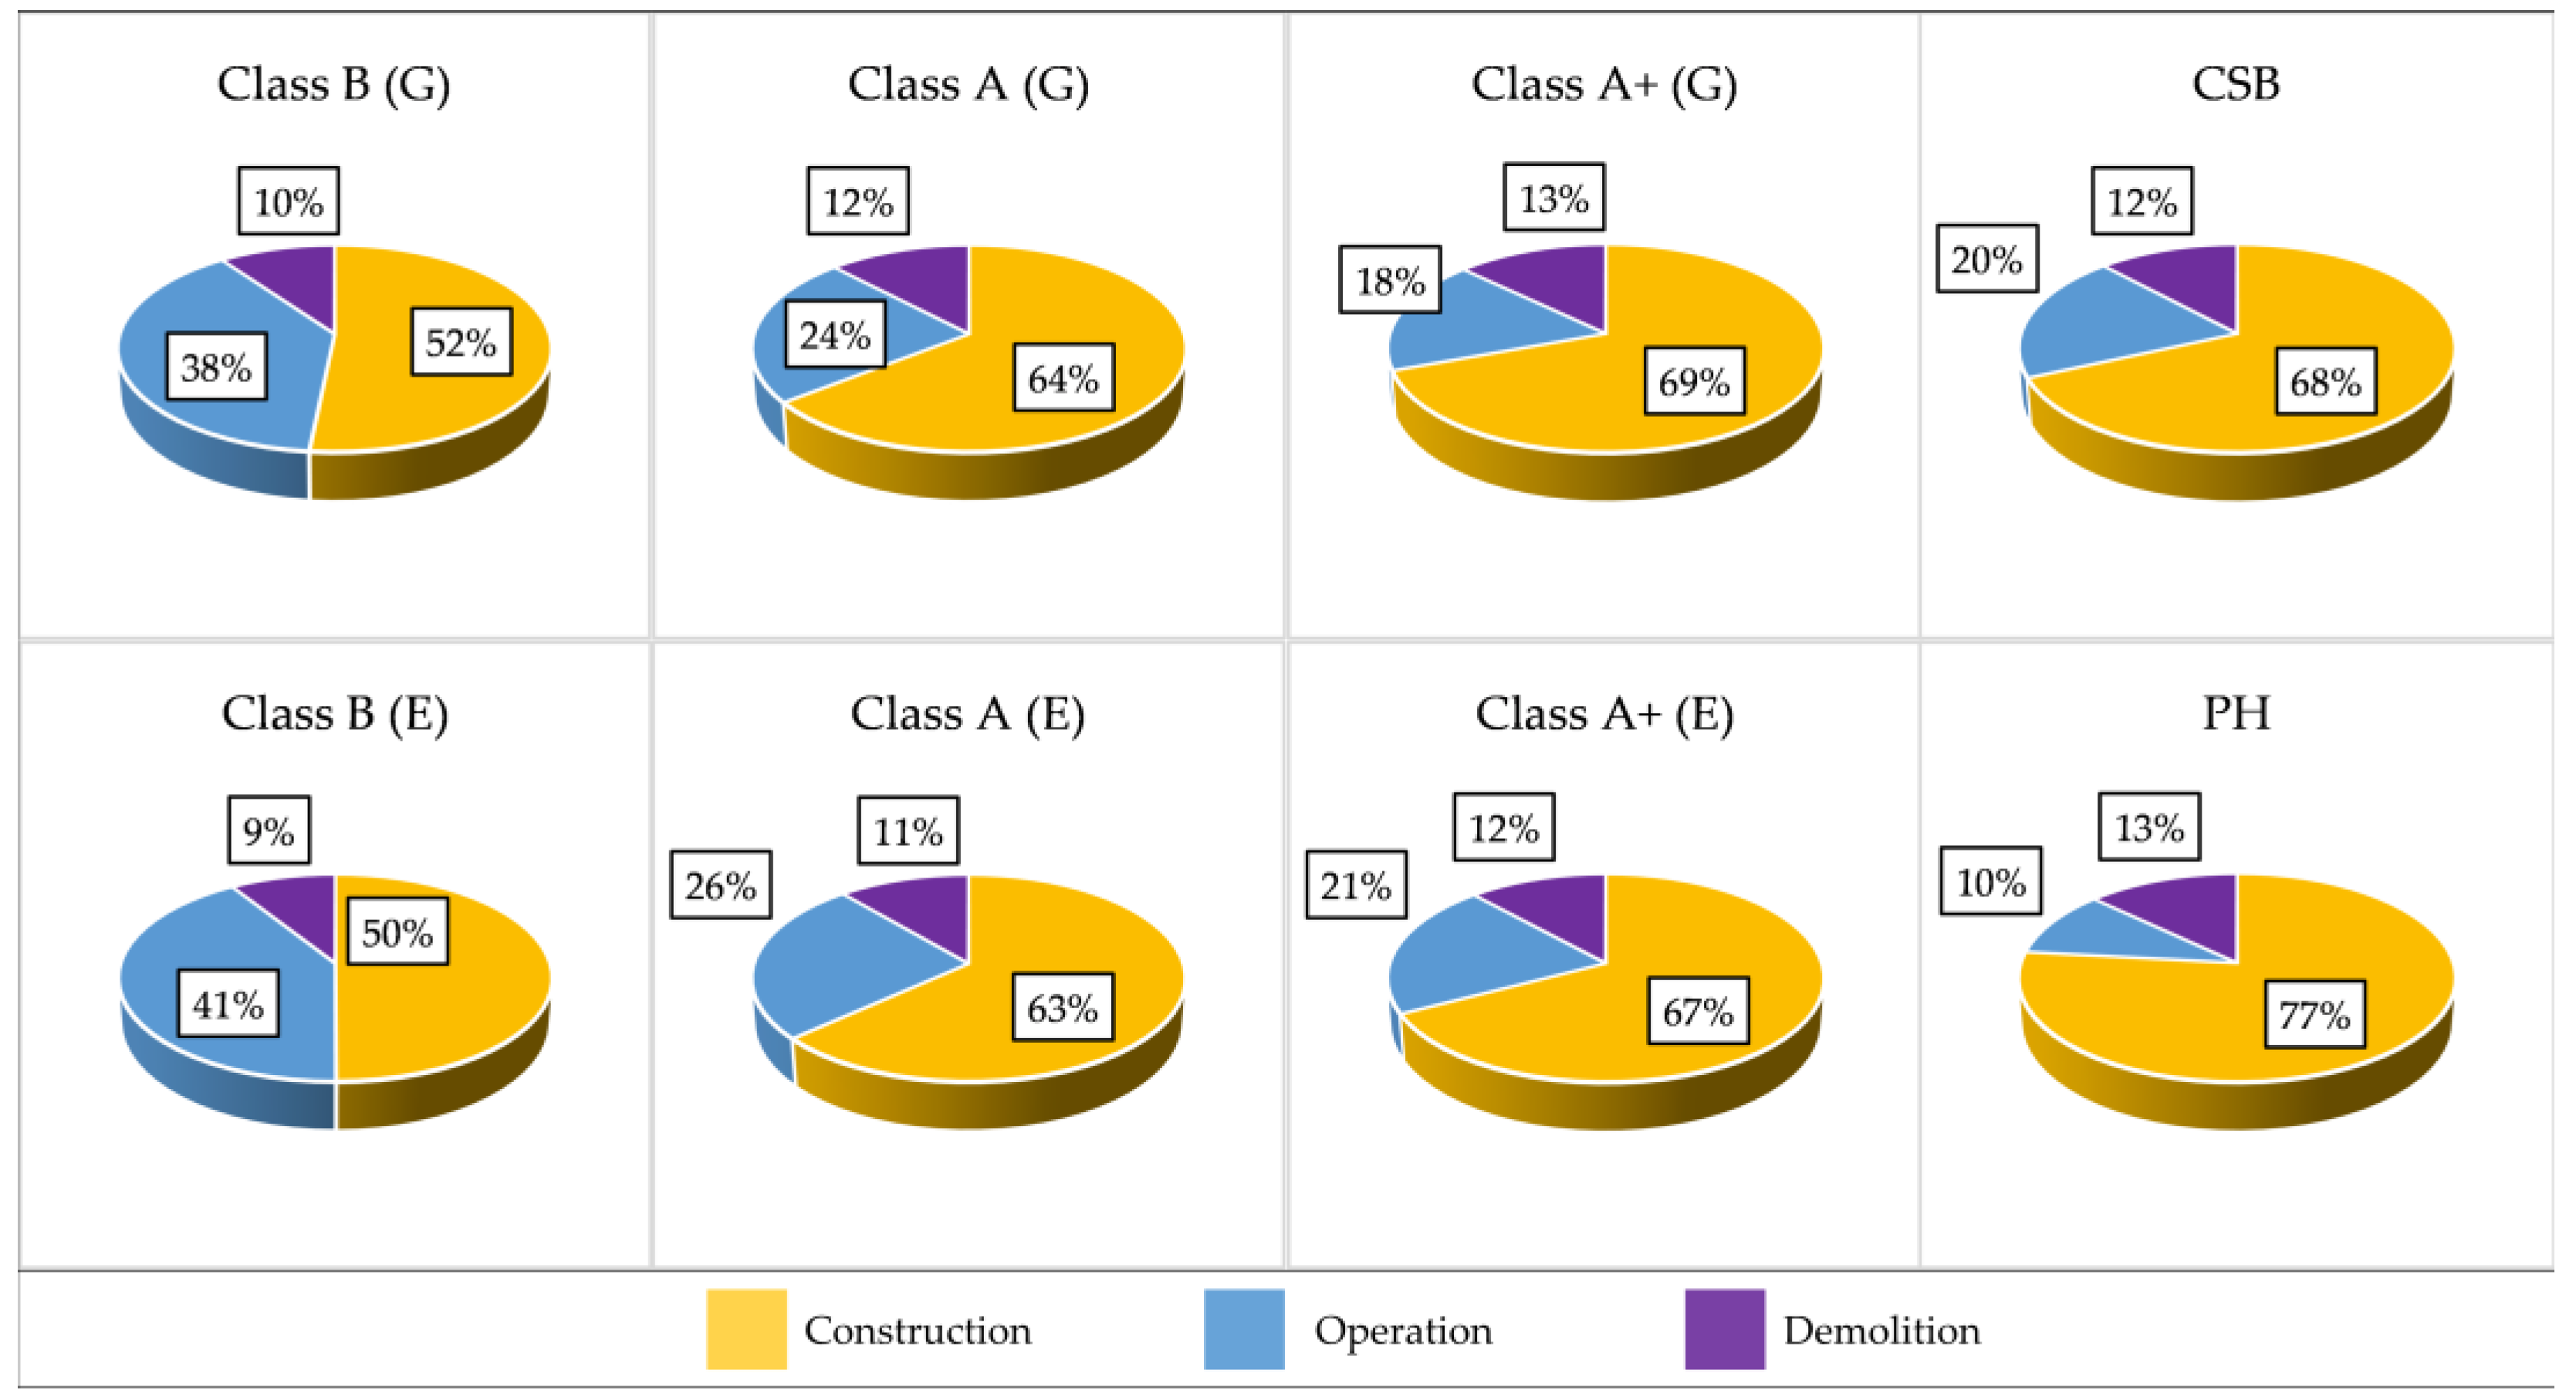

Table 1.
Housing stock in Romania for 2019-2023 [27].
Table 1.
Housing stock in Romania for 2019-2023 [27].
| Year | New Built Houses | Repurposed Houses | Redesignated Houses | Demolished Houses | Existing Houses |
| 2023 | 70957 | 575 | 573 | 4421 | 9722223 |
| 2022 | 73338 | 849 | 875 | 5655 | 9655685 |
| 2021 | 71405 | 659 | 688 | 5304 | 9587153 |
| 2020 | 67816 | 1007 | 931 | 4544 | 9587153 |
| 2019 | 67488 | 1027 | 1069 | 5800 | 9587153 |
Table 2.
Energy performance characteristic of residential buildings [30]
Table 2.
Energy performance characteristic of residential buildings [30]
| Year | Vertical Transmittance | Horizontal Transmittance | Energy Consumption |
| U [W/m2K] | U [W/m2K] | [kWh/m2year] | |
| <1960 | 1.40-2.00 | 0.90-1.80 | 150-400 |
| 1961-1980 | 1.35-1.90 | 0.90-1.80 | 150-400 |
| 1981-1989 | 1.25-1.60 | 0.90-1.80 | 150-400 |
| 1990-1994 | 1.10-1.50 | 0.90-1.80 | 150-350 |
| 1995-1999 | 0.80-1.50 | 0.90-1.80 | 140-280 |
| 2000-2023 | 0.70-1.50 | 0.90-1.80 | 120-230 |
| >2023 | 0.25 | 0.20 | 40-80 |
Table 3.
Case study building envelope thermal characteristics
| No. | Building Component | Thermal Transmittance U | Unit |
| 1 | Exterior wall | 0.17* | W/m2K |
| 2 | Roof | 0.13* | W/m2K |
| 3 | Ground slab | 0.27* | W/m2K |
| 4 | Windows and exterior doors | 0.99** | W/m2K |
* thermal transmittance calculated according to [29]. ** thermal transmittance from product data sheets.
Table 4.
Building materials quantities for the case study residential building
| No. | Material | Quantity | Unit |
| 1 | Concrete | 192.960 | t |
| 2 | Brick | 95.745 | t |
| 3 | Cement | 1.600 | t |
| 4 | Limestone | 4.500 | t |
| 5 | Mortar | 14.400 | t |
| 6 | Gravel | 18.600 | t |
| 7 | Stone | 14.500 | t |
| 8 | Steel | 4.980 | t |
| 9 | Ceramic tiles | 1.121 | t |
| 10 | Paint | 300 | kg |
| 11 | Glass | 2.025 | t |
| 12 | Wood | 7.000 | t |
| 13 | Organic materials | 2.180 | t |
| 14 | Aluminium | 100 | kg |
| 15 | Copper | 25 | kg |
| 16 | Photovoltaic panels | 16 | pieces |
Table 5.
Monthly Electrical Energy Consumption for 2020-2024 for the Case Study Residential Building
Table 5.
Monthly Electrical Energy Consumption for 2020-2024 for the Case Study Residential Building
| Month | 2020 | 2021 | 2022 | 2023 | 2024 | |||||
| A* | B** | A* | B** | A* | B** | A* | B** | A* | B** | |
| January | 850 | 600 | 1188 | 938 | 800 | 550 | 590 | 360 | 828 | 568 |
| February | 550 | 300 | 550 | 300 | 433 | 183 | 644 | 404 | 520 | 265 |
| March | 400 | 150 | 450 | 200 | 500 | 250 | 541 | 321 | 525 | 285 |
| April | 300 | 50 | 300 | 150 | 320 | 170 | 454 | 314 | 340 | 190 |
| May | 250 | 0 | 180 | 0 | 279 | 0 | 332 | 0 | 332 | 0 |
| June | 200 | 0 | 253 | 0 | 222 | 0 | 249 | 0 | 307 | 0 |
| July | 150 | 0 | 148 | 0 | 151 | 0 | 243 | 0 | 263 | 0 |
| August | 360 | 0 | 369 | 0 | 240 | 0 | 249 | 0 | 211 | 0 |
| September | 400 | 150 | 351 | 101 | 290 | 40 | 280 | 40 | 340 | 140 |
| October | 450 | 200 | 450 | 200 | 364 | 114 | 335 | 90 | 430 | 200 |
| November | 800 | 550 | 850 | 600 | 485 | 235 | 635 | 370 | 589 | 349 |
| December | 1000 | 750 | 900 | 650 | 640 | 390 | 799 | 459 | 735 | 505 |
* total electrical energy consumption in [kWh]; ** electrical energy used by the heat pump for heating in [kWh]
Table 6.
Monthly Energy Production from the HP and PV panels for 2020-2024 for the Case Study Residential Building
Table 6.
Monthly Energy Production from the HP and PV panels for 2020-2024 for the Case Study Residential Building
| Month | 2020 | 2021 | 2022 | 2023 | 2024 | |||||
| C* | D** | C* | D** | C* | D** | C* | D** | C* | D** | |
| January | 2400 | - | 3752 | - | 2200 | - | 1440 | 278 | 2272 | 301 |
| February | 1200 | - | 1200 | - | 732 | - | 1616 | 255 | 1060 | 470 |
| March | 600 | - | 800 | - | 1000 | - | 1284 | 671 | 1140 | 655 |
| April | 200 | - | 600 | - | 680 | - | 1256 | 586 | 760 | 855 |
| May | 0 | - | 0 | - | 0 | - | 0 | 851 | 0 | 895 |
| June | 0 | - | 0 | - | 0 | - | 0 | 792 | 0 | 971 |
| July | 0 | - | 0 | - | 0 | - | 0 | 921 | 0 | 933 |
| August | 0 | - | 0 | - | 0 | 253 | 0 | 925 | 0 | 871 |
| September | 600 | - | 404 | - | 160 | 609 | 160 | 855 | 560 | 723 |
| October | 800 | - | 800 | - | 456 | 669 | 360 | 694 | 800 | 658 |
| November | 2200 | - | 2400 | - | 940 | 334 | 1480 | 284 | 1396 | 357 |
| December | 3000 | - | 2600 | - | 1560 | 306 | 1836 | 259 | 2020 | 143 |
* thermal energy output from the heat pump in [kWh]; ** electrical energy output from the photovoltaic panels in [kWh]
| No. | Material | Emission Factor | Unit |
| 1 | Concrete | 0.242 | t CO2/t |
| 2 | Brick | 0.200 | t CO2/t |
| 3 | Cement | 0.894 | t CO2/t |
| 4 | Limestone | 1.200 | t CO2/t |
| 5 | Mortar | 0.792 | t CO2/t |
| 6 | Gravel | 0.002 | t CO2/t |
| 7 | Stone | 2.330 | t CO2/t |
| 8 | Steel | 2.208 | t CO2/t |
| 9 | Ceramic tiles | 1.400 | t CO2/t |
| 10 | Paint | 0.890 | t CO2/t |
| 11 | Glass | 1.400 | t CO2/t |
| 12 | Wood | 0.200 | t CO2/t |
| 13 | Organic materials | 17.070 | t CO2/t |
| 14 | Aluminium | 1.407 | t CO2/t |
| 15 | Copper | 1.010 | t CO2/t |
| 16 | Photovoltaic panels | 80.113 [35] | kg CO2/kW |
Table 8.
Parameters for the construction itself, Cc, from the existing literature [34]
Table 8.
Parameters for the construction itself, Cc, from the existing literature [34]
| Eq. | Parameter | Description | Value | Unit |
| (6) | Agf | Gross Floor Area | - | m2 |
| Ee | Electrical energy consumption for construction | - | kWh/ m2 | |
| CEFee | Emission factor for electrical energy in Romania | 0.265 | t CO2/MWh | |
| (7) | Vle | Volume of excavated and landscaped earth | - | m3 |
| CEFle | Emission factor for excavation and landscape | 2.15 | kg CO2/m3 | |
| (8) | Qcit | Quantity of transported material in site | - | t |
| CEFcit | Emission factor for in site transportation | 0.190 | t CO2/km | |
| d | Horizontally or vertically transported distance | - | km |
Table 9.
CO2 emissions for each life cycle sub-stage for the case study building
| No. | Life Cycle Stage | Life Cycle Sub-Stage | Value | Percent | Unit |
| 1 | Construction | Materials Production | 172.34 | 66.99% | t CO2 |
| 2 | Materials Transportation | 3.02 | 1.17% | t CO2 | |
| 3 | Building Construction | 2.18 | 0.85% | t CO2 | |
| 4 | Operation | HVAC | 66.25 | 25.75% | t CO2 |
| 5 | Lighting | 3.31 | 1.29% | t CO2 | |
| 6 | Electrical Equipment | 6.63 | 2.58% | t CO2 | |
| 7 | Demolition | Building Demolition | 2.51 | 0.98% | t CO2 |
| 8 | Waste Transportation | 1.03 | 0.40% | t CO2 |
Table 10.
CO2 emissions factors from electrical energy generation in Romania and other countries world-wide for the last 5 years (2019-2024), according to Carbon Database Initiative [41]
Table 10.
CO2 emissions factors from electrical energy generation in Romania and other countries world-wide for the last 5 years (2019-2024), according to Carbon Database Initiative [41]
| Year | Grid Electricity Emissions Factors | Unit | ||||
| Romania | Germany | UK | USA | China | ||
| 2024 | 0.278 | 0.379 | 0.207 | 0.374 | 0.660 | kgCO2/kWh |
| 2023 | 0.270 | 0.358 | 0.207 | 0.388 | 0.676 | kgCO2/kWh |
| 2022 | 0.260 | 0.325 | 0.193 | 0.377 | 0.692 | kgCO2/kWh |
| 2021 | 0.309 | 0.357 | 0.212 | 0.401 | 0.703 | kgCO2/kWh |
| 2020 | 0.325 | 0.411 | 0.233 | 0.424 | 0.715 | kgCO2/kWh |
| 2019 | 0.337 | 0.415 | 0.255 | 0.422 | 0.697 | kgCO2/kWh |
Table 11.
Insulation required for reducing the Energy Consumption of existing buildings in lower energetic classes
Table 11.
Insulation required for reducing the Energy Consumption of existing buildings in lower energetic classes
| Year | Energy Consumption for HVAC | Energy Performance Class | Energy Consumption Reduction Required to Reach: |
Existing Insulation Thickness |
Required Insulation Thickness | |||
| Class B | Class A | Class A+ | ||||||
| [kWh/m2×Year] | [MWh/Year] | [Class] | [kWh/m2×Year] | [cm] | [cm] | |||
| <1989 | 275 | 44 | C | 87 | 181 | 208 | 1 | 15 |
| 1990-1994 | 250 | 40 | C | 62 | 156 | 183 | 2 | 15 |
| 1995-1999 | 210 | 33.6 | C | 22 | 116 | 143 | 3 | 15 |
| 2000-2023 | 175 | 28 | B | - | 81 | 108 | 5 | 10 |
| >2023 | 60 | 9.6 | A+ | - | - | - | 15 | 0 |
| CSB* | 31.25 | 5 | A+ | - | - | - | 15 | 0 |
| PH** | 15 | 2.4 | A+ | - | - | - | 20 | 0 |
* Case Study Building; ** Passive House
Table 12.
Cost detailed for the construction stage of the building, from 2019
| No. | Chapter | Description | Value | Unit |
| 1 | Land | Land acquisition | 14,000 | € |
| 2 | Utility | Services connections | 700 | € |
| 3 | Design | Required studies | 600 | € |
| 4 | Authority approvals | 1800 | € | |
| 5 | Project | 2200 | € | |
| 6 | Structure and Architecture | Excavation* | 5800 | € |
| 7 | Structure and envelope | 20,500 | € | |
| 8 | Roof, porch, garage | 7800 | € | |
| 9 | Plastering | 6700 | € | |
| 10 | Walls finish | 3400 | € | |
| 11 | Envelope insulation | 8500 | € | |
| 12 | Windows and doors | 7800 | € | |
| 13 | Bathroom tiles and furniture | 8230 | € | |
| 14 | Kitchen tiles and furniture | 4500 | € | |
| 15 | Landscape vegetation | 2500 | € | |
| 16 | Landscape pavements | 3200 | € | |
| 17 | Property Fence | 5500 | € | |
| 18 | Building Services | Sanitary and plumbing | 4000 | € |
| 19 | Electrical | 6900 | € | |
| 20 | HVAC | 13,500 | € | |
| 21 | Photovoltaic panels | 9500 | € |
* including trenches for heat pump horizontal ground heat exchanger.
Disclaimer/Publisher’s Note: The statements, opinions and data contained in all publications are solely those of the individual author(s) and contributor(s) and not of MDPI and/or the editor(s). MDPI and/or the editor(s) disclaim responsibility for any injury to people or property resulting from any ideas, methods, instructions or products referred to in the content. |
© 2025 by the authors. Licensee MDPI, Basel, Switzerland. This article is an open access article distributed under the terms and conditions of the Creative Commons Attribution (CC BY) license (http://creativecommons.org/licenses/by/4.0/).
Copyright: This open access article is published under a Creative Commons CC BY 4.0 license, which permit the free download, distribution, and reuse, provided that the author and preprint are cited in any reuse.


