
Submitted:
16 February 2025
Posted:
17 February 2025
You are already at the latest version
Abstract
Background: In recent years, microphysiological systems (MPS) using microfluidic technology as a new in vitro experimental system have shown promise as an alternative to animal experiments in the development of drugs, especially in the field of drug discovery, and reports have been published that MPS experiments have replaced animal experiments. We have commercialized the Fluid3D-X®, a double-layer microfluidic chip made of polyethylene terephthalate (PET), under the Japan Agency for Medical Research and Development (AMED) MPS development research project and have applied it to various organ models. When Caco-2 cells were cultured using Fluid3D-X® and a peristaltic pump, villi-like structures were formed in the microchannels, but the degree of formation differed between the upstream and downstream sides. To examine consideration points regarding the effects of the nutrient and oxygen supply by the chip material and medium flow on cells in the widely used double-layer microfluidic chip, and demonstrate the usefulness of a new imaging evaluation method using artificial intelligence technology for the morphological evaluation of cells.
Methods: The following studies were conducted.
1. Perfusion direction: The medium was perfused at a normal flow rate (20 µL/min) using Fluid3D-X® and a peristaltic pump in opposite directions within the top and bottom channels and in the same direction initially, then reversed in both layers.
2. Perfusion speed: Incubated at normal and doubled (40 µL/min) flow rates using Fluid3D-X® and a peristaltic pump.
3. Materials: Incubated at the normal flow rate with Fluid3D-X® and polydimethylsiloxane (PDMS) chip, which has the same microchannel design as Fluid3D-X® but is made of PDMS.
Results: Cell morphology in the channels was quantified and evaluated using Nikon NIS.ai in addition to microscopic observation. Villi-like structures were predominant upstream of the top channel, independent of perfusion on the bottom channel, and those structures downstream increased with doubled speed. Additionally, compared to the Fluid3D-X, the chip made of PDMS showed almost uniform villi-like sterilization in the channel.
Conclusion: As the amount of oxygen and nutrients required by different cell types differs, it is necessary to study the optimization of culture conditions according to the characteristics of the cells handled.
Keywords:
microphysiological system
; microfluidic chip
; Caco-2
; Fluid3D-X®
1. Introduction
In recent years, microphysiological systems (MPS) utilizing microfluidic technology have been proposed as an alternative to animal experiments, and extensive research has been conducted in the fields of pharmacology and medicine for their practical application [1]. In particular, MPS, such as Organ-on-a-chip (OoC), is an in vitro experimental system in which various cells are cultured using microfluidics to construct physiological organ models, and is expected to be an alternative method for animal experiments in drug development, especially in the field of drug discovery [2]. Lately, in Europe, animal testing in cosmetics development has already been prohibited [3], and the US Food and Drug Administration promulgation of the Modernization Act 2.0, which will not require animal testing before clinical trials by the end of 2022, has also accelerated the consideration of the practical application of MPS for research use [4,5]. MPS has been proposed and widely used for various organs and tissues, including the liver, intestine, kidney, and blood-brain barrier [6].
Based on this background, various MPS devices and chips have been developed nowadays, some of which have been launched commercially and are being put into practical use. There have been reports that MPS has replaced animal testing [7,8,9,10]. In particular, similar products have been marketed since the double-layer channel-type device marketed by Emulate can be adaptable to various membranous organs [11]. Although each product has an application note for practical use, they are not all related to the cells that the user wants to use. Therefore, it is necessary to consider the culture conditions for each cell to be cultured in the chip.
One of the most typical fields in which MPS is used is Gut-on-a-chip (GoC), which simulates the intestinal tract. GoC can imitate the environment in the intestinal tract, such as the interaction between various cells and the intestinal microbiota, especially dynamic aspects of the intestine like peristalsis and the transfer of food from the mouth to the anus, which could not be achieved with cell culture inserts previously [6]. This process has made it possible to evaluate the absorption and permeability of food components and drugs, as well as the effects of therapeutic targets and drugs in an in vitro model of inflammatory bowel disease using inflammatory cytokines under conditions more similar to biological conditions. Cell culture with GoC has been reported to extend the cell culture period [12,13]. In addition, it has been reported that applying shear stress, such as by perfusion of the medium, promotes the formation of villus-like structures [14]. In fact, when intestinal epithelial cell line Caco-2 cells were cultured under a medium perfusion system using Fluid3D-X®, a double-layer channel-type device that we commercialized in the Japan Agency for Medical Research and Development (AMED) MPS development research project [15], villi-like structures that do not develop in static culture were formed. In contrast, differences in the degree of formation of villi-like structures were observed between the upstream and downstream sides of the microchannel. However, we have not been able to establish a quantification method for the differences in cell morphology within the flow channels that can be recognized microscopically, nor have we been able to examine whether these differences affect the subsequent assay system.
In this study, we investigated the optimal conditions for culturing intestinal epithelial cells in Fluid3D-X®, aiming to examine the consideration points concerning the effects on cells of nutrient and oxygen supply by the material and medium flow in the widely used double-layer channel-type chips and to demonstrate the usability of a new imaging evaluation method using artificial intelligence (AI) technology for morphological evaluation of cells in the channel.
2. Materials and Methods
2.1. Microfluidic Chip and Perfusion Setup
Fluid3D-X®, a product of Tokyo Ohka Kogyo (Kanagawa, JAPAN), was used as a MPS microfluidic chip for perfusion cell culture. Fluid3D-X® has a typical double-layer microchannel structure separated by a polyethylene terephthalate (PET) porous membrane whose pore size of 0.45 µm and medium reservoirs in each port (Figure 1a). Although Fluid3D-X® is made of PET, we also fabricated a double-layer microfluidic chip which has the same configuration as Fluid3D-X®, made of poly-dimethylpolysiloxane (PDMS) by conventional photolithography and softlithography methods [16] (Figure 1b). Hereafter, we term “Fluid3D-X®” as the original microfluidic chip made of PET, and “PDMS chip” as the chip with the same configuration as Fluid3D-X® made of PDMS.
To perfuse the culture medium, medium chambers on three microfluidic chips in an ANSI/SLAS-compliant rectangular plate were connected to a peristaltic pump (AQ-RP6R-001, Takasago Fluidic Systems, Nagoya, JAPAN) with silicone tubes (Figure 1c and 1d). A controller of the peristaltic pump arbitrarily controlled the flow rate of medium perfusion. This system could perfuse medium at the same rate as all chambers. On the other hand, another pump system (Microtube pump system, Icomes Lab, Iwate, Japan)could perfuse medium at the different speeds and directions of each microchannel (image not shown). We used these two systems for the different cell culture system setups.
2.2. Cell Culture Method Using Microfluidic Chips
Caco-2 cells were obtained from the American Type Culture Collection (HTB-37, ATCC, VA, USA) and cultured in Dulbecco's Modified Eagle Medium (DMEM) (12320-032, Thermo Fisher Scientific, MA, USA) containing 10% Fetal Bovine Serum (FBS) (10270106, Gibco, Thermo Fisher Scientific), MEM Non-Essential Amino Acids solution (11140-050, Thermo Fisher Scientific) and Penicillin-Streptomycin-Amphotericin B Suspension (161-23181, FUJIFILM Wako Pure Chemical Corporation, Osaka, Japan).
We cooled microfluidic chips to 4°C before the extracellular matrix coat. Then 110 μL of Matrigel® Matrix Basement Membrane (356237, Corning, USA) diluted 30× in FBS-free DMEM was applied to the top and bottom channel of the chip, and microfluidic chips were incubated at 4°C until the next day. Caco-2 cells cultured on the petri dish covered around 90% were washed twice with PBS and then treated with Trypsin (T4049, Sigma-Aldrich). Cells were suspended to 2×10⁶ cells/mL (2×10⁵ cells/cm2), and 110 μL of cell suspension was seeded onto the top channel with a micropipette fitted with a wide-pore tip. Subsequently, 120 µL of DMEM was injected into the bottom channel, and the microfluidic chips in the plate were placed in a CO2 incubator (37°C, 5% CO2) to allow the cells to attach to the membrane. After 4 to 5 hours, when cell attachment was confirmed, the peristaltic pump was equipped to the perfusion system, and 650 μL of DMEM was added to the medium reservoirs of both inlet and outlet simultaneously with multipipette from top to bottom channel. After filling the medium on the reservoirs, medium perfusion, whose speed was about 4 µL/ min, was performed (pre-perfusion). On day 2, the medium was changed, the perfusion speed was increased, and directions were modified for each condition. The medium was changed every 2 or 3 days (Figure 2a).
2.3. Lucifer Yellow Permeability Assay
Before the permeability assay, the medium in the channels and inlet and outlet reservoirs were replaced with transport buffer (TP buffer, HBSS with Ca2+, Mg2+, containing 10 mM HEPES, pH 7.4, phenol-red-free). First, we removed the medium in both inlet and outlet reservoirs with a multipipette and added 600 µL of TP buffer onto the inlet reservoir. This process was repeated twice, and then chips were incubated under 37°C 5% CO2 for 30-60 minutes. After acclimation, TP buffer in both inlet and outlet reservoirs was removed with multipipette, and 500 µL of 100 µM lucifer yellow (LY, 128-06271, FUJIFILM Wako) in TP buffer was applied onto the inlet reservoir on the top channel. To ensure uniform distribution of LY in the channel, 200 µL of LY solution was collected from the reservoir on the outlet side and returned twice to the inlet. The same procedure was performed with 500 µL of TP buffer for the bottom channel. Then, 100 µL of the solution was collected from the top and bottom outlets and served as samples at 0 hours. Chips were incubated under 37°C 5% CO2. 30 minutes later, the same procedure as 0 hours was performed, and 100 µL of the solution collected from the top and bottom outlets were served as samples at 0.5 hours.
Samples collected at each time point were measured with a microplate reader (SH-9500Lab, CORONA ELECTRIC, Ibaraki, Japan) at Ex / Em: 485 nm / 538 nm. The transmission coefficient was calculated using the following formula.
Here, Papp (cm/sec) is the transmission coefficient, dQ/dt (nmol/sec) is the transmission velocity, C0 is the initial concentration of LY on the apical side, and S is the surface area (0.64 cm2) of the porous membrane.
2.4. Imaging and Analysis
Z-stack bright-field imaging was performed using an inverted microscope (ECLIPSE Ti-E, Nikon) equipped with a 10× objective lens (PLAN APO λD, Nikon), a halogen lamp house (D-LH/LC, Nikon) for bright-field transillumination, and a camera (ORCA-Flash4.0, Hamamatsu Photonics). The Z-stack imaging covered a range of 300 μm with a step size of 5 μm. Subsequently, these Z-stack images were processed using the volume contrast (VC) function of the NIS-Elements software (Nikon) to generate VC images. VC imaging, based on quantitative phase imaging (QPI) principles— a non-invasive and label-free method that measures the phase shift of light passing through transparent samples—has emerged as a powerful method for investigating the morphology and thickness of cells and tissues [17,18]. This approach is particularly advantageous for real-time observing dynamic cellular processes without altering their physiology. Additionally, the built-in Extended Depth of Focus (EDF) function of the NIS-Elements software was used to project these Z-stack images into a single focused image by selecting the focused regions. In the next step, the concert.ai learning feature of the NIS.ai module in NIS-Elements, an AI-powered function designed to enhance image analysis, was utilized to train the AI model. The AI model was trained using six sets of cropped EDF and VC images from the flow channel regions of microfluidic chips. Finally, the AI-VC images were generated by the trained convert.ai model from the EDF image of the stitched whole image of microfluidic chips. The generated AI-VC images were then cropped into three regions and analyzed using the General Analysis 3 (GA3) function of the NIS-Elements software.
3. Results
3.1. Alteration of Cell Morphology Depending on the Direction of Medium Perfusion
In the control group, in which the flow rate was approximately 20 μL/min after gentle pre-perfusion (4 μL/min) until day 2, it was observed that the chorionic villi-like structures were highly advanced in the upstream (Inlet side) of the flow channel and those structures became sparser toward downstream (Outlet side) (Figure 2a and b; Control). In the investigation in which the direction of medium perfusion in the top and bottom channels was reversed (top channel: from the inlet to the outlet; bottom channel: the outlet to the inlet, Figure 2a; Inverse), regardless of the direction of medium perfusion in the bottom channel, villi-like structures were observed in the upstream side of the top channel in the brightfield image. Villi-like structures slightly decreased toward the downstream side; however, more villi-like structures were observed than in the control group through the top channel (Figure 2b, Inverse).
Next, after perfusing the medium in the same direction (both top and bottom channels: perfuse from the inlet to the outlet) until day 11, the medium was perfused in the opposite direction in both the top and bottom channels (both top and bottom channels: perfuse from the outlet to the inlet, Figure 2a; Switch). The inlet side, which had been the upstream side until day 11, lost its villi-like structures over time, and the formation of villi-like structures progressed on the inlet side, which had newly become the upstream side (Figure 2b, Switch).
In the LY permeability assay of these three investigations (Control, Inverse, Switch), the Papp of each condition was less than 2.0 × 10⁻⁶ cm/sec, and there was no difference among the three conditions (Figure 2c).
3.2. Alteration of Cell Morphology Depending on the Flow Rate of Medium Perfusion
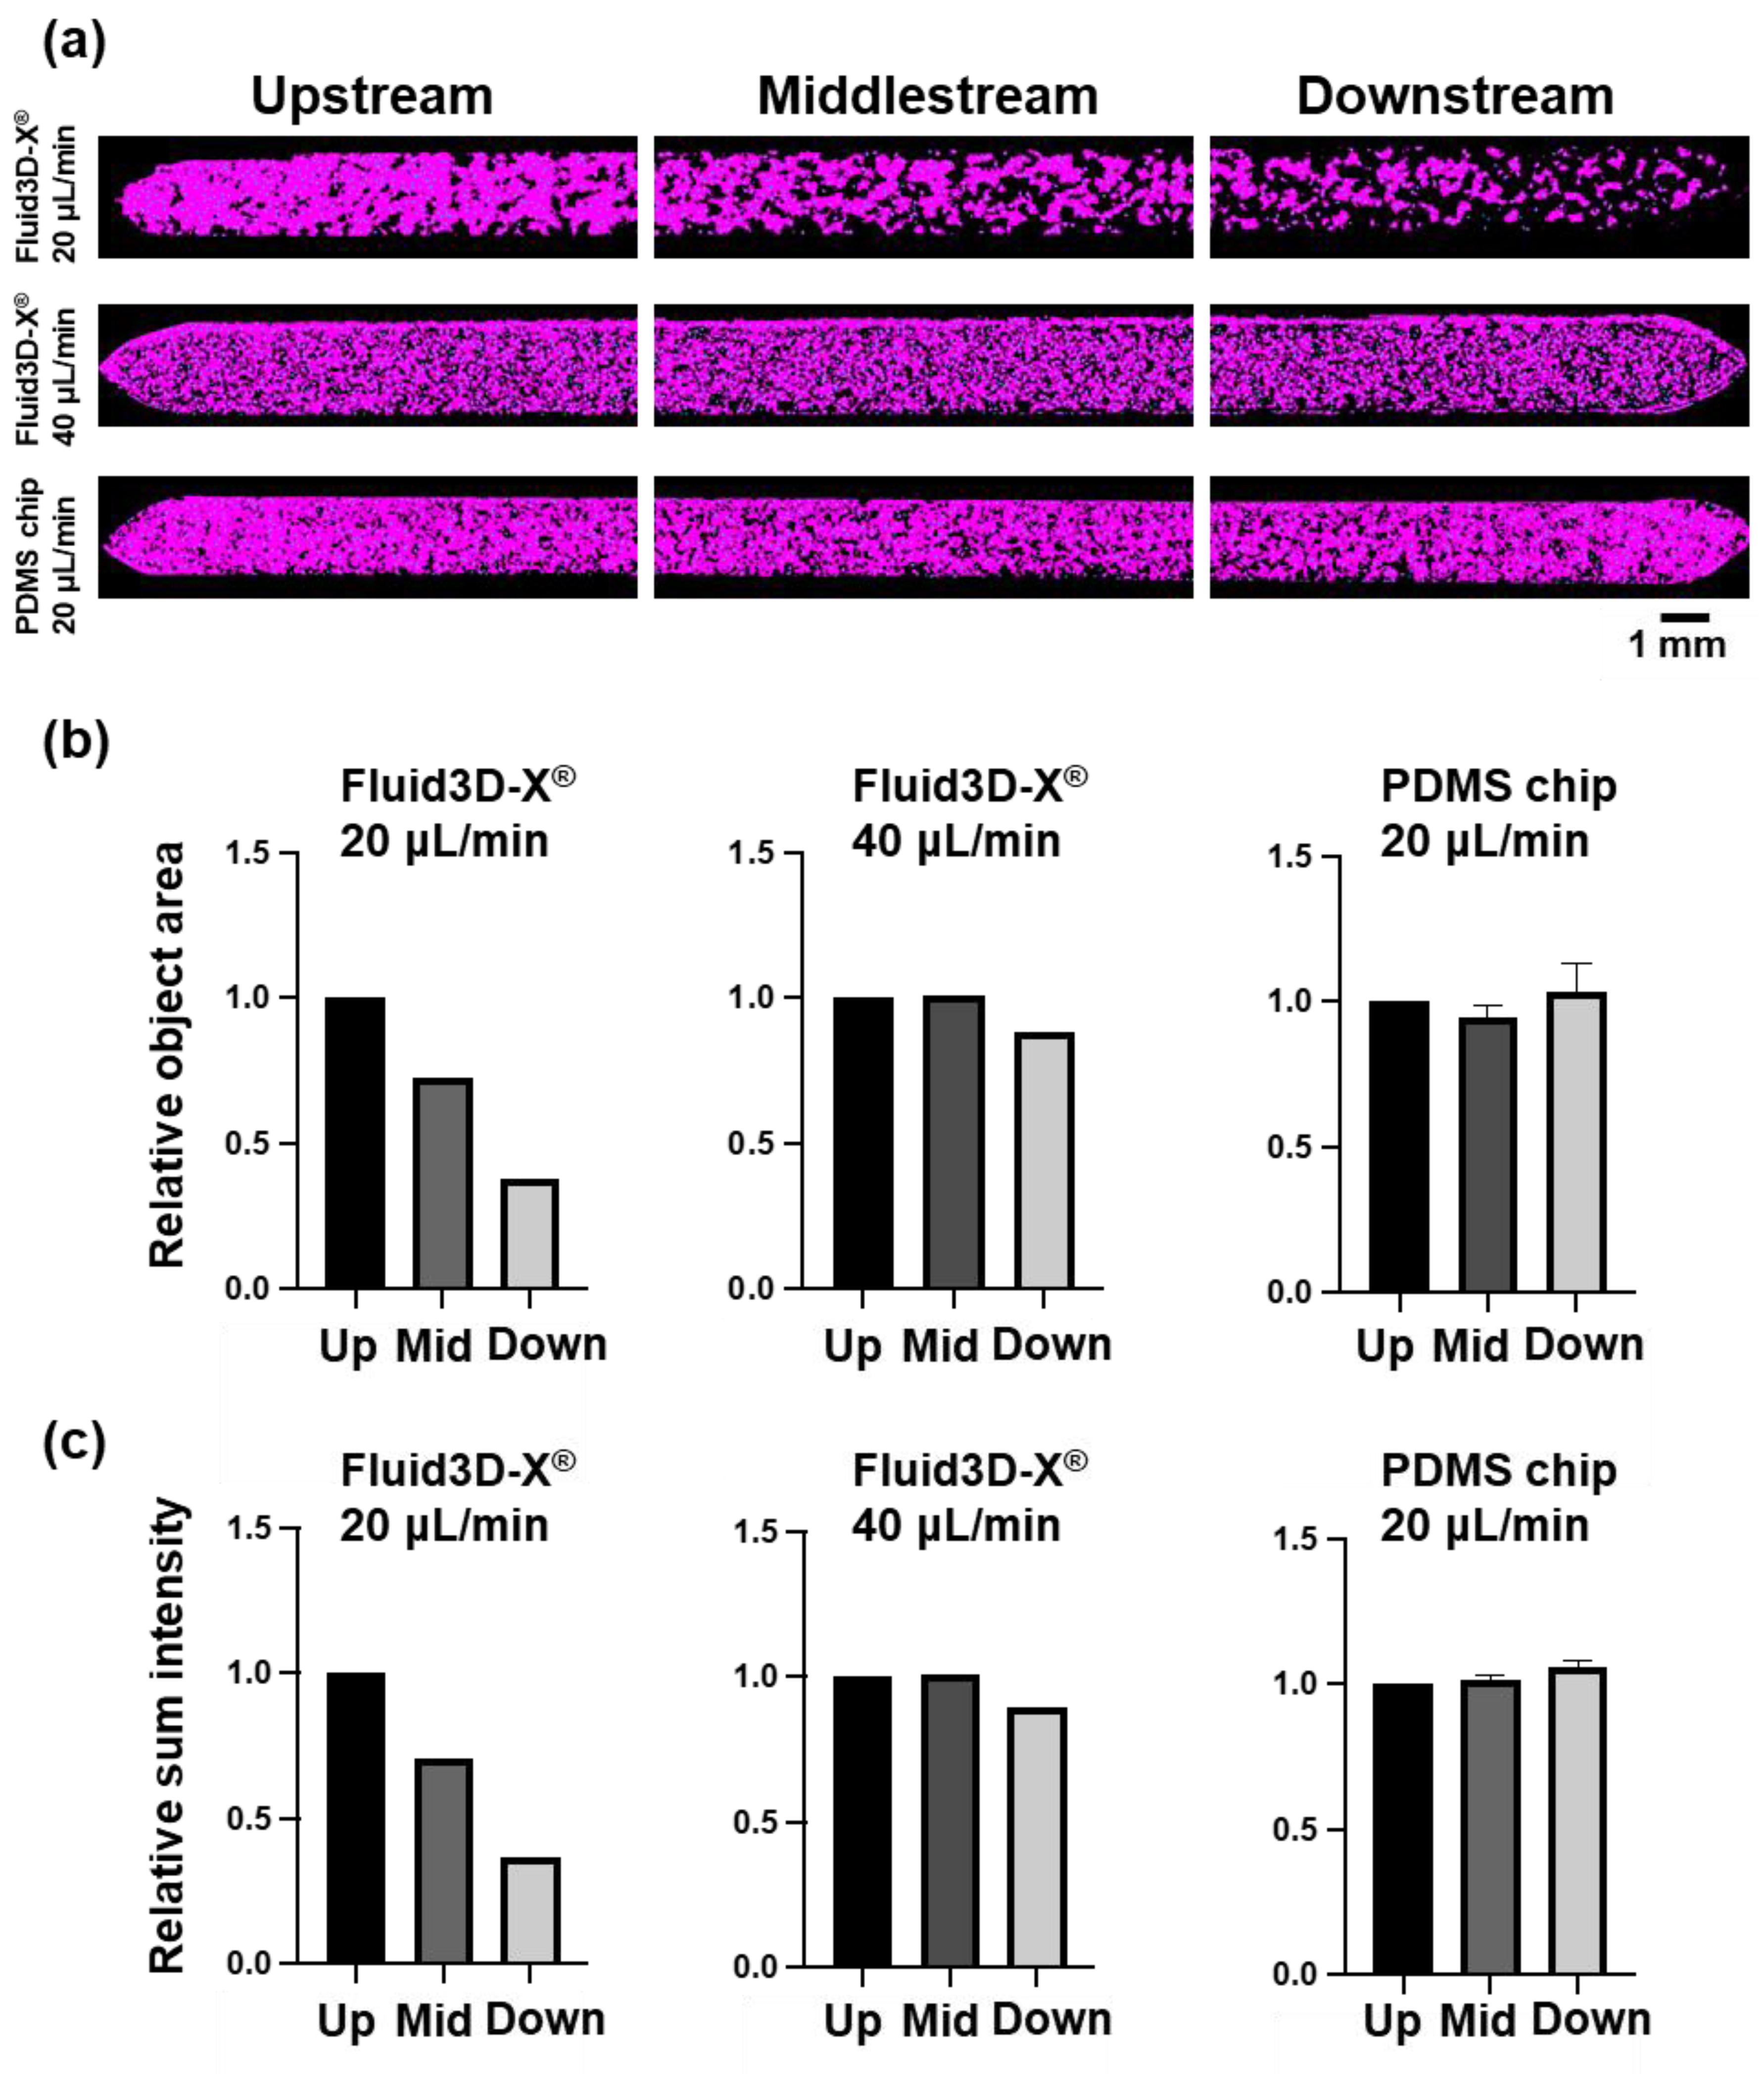
In control (Fluid3D-X®, flow rate; 20 μL/min), as mentioned above, the formation of villi-like structures was more advanced upstream of the top channel and less advanced downstream in the brightfield images (Figure 3a and 3b). In contrast, in the group in which the flow rate was increased to 40 μL/min, more villi-like structures were observed in upstream of the top channel in the bright-field image as in the control group. However, compared to the control group, more villi-like structures were observed in the midstream and downstream of the channel, although each was thinner than that of the upstream side (Figure 3c). We attempted to quantify the morphological changes seen in these brightfield images using NIS.ai. We evaluated the area ratio of villi-like structures to flow channel area and the thickness of cells by VC intensity, i.e., the development of villi-like structures, with NIS.ai. The results showed a decrease in total object area and Sum Intensity from upstream to downstream in the control group, and quantitative analysis showed similar changes to those observed in the brightfield images (Figure 4a upper row and 4b-4d left). In contrast, the total object area and Sum Intensity of AI-VC were almost the same in the group in which the flow rate was increased to 40 μL/min, with a very slight decrease downstream (Figure 4c and 4d center).
The results of the LY permeability assay showed no difference, with Papp less than 2.0×10⁻⁶ cm/sec under different flow rates (Figure 3e).
3.3. Alteration of Cell Morphology Depending on the Material of Chips
Caco-2 cell cultures in Fluid 3D-X® showed higher levels of villi-like structure formation in the upstream of the top channel in brightfield images and lower levels in downstream, as described above, and the results quantified by NIS.ai were similar. In contrast, Caco-2 cells cultured on the PDMS chip showed a uniform villi-like structure from upstream to downstream in brightfield images (Figure 3d). We evaluated the thickness of cells in the channels, the development of villi-like structures by the area ratio of spatially developed structures to channel area and VC intensity using NIS.ai, using the same method as for the medium perfusion rate study. The results showed that the total object area and Sum Intensity of AI-VC did not decrease from upstream to downstream (Figure 4c right and 4d right), indicating that the villi-like structures were formed almost uniformly from upstream to downstream.
The results of the LY permeability assay showed that Papp was less than 2.0×10⁻⁶ cm/sec under different material conditions, showing no difference compared to the control group (Figure 3e).
4. Discussion
In this study, we used the Fluid3D-X® [15], a double-layer MPS chip, to investigate the effects of the chip's materials and the medium's flow rate on the supply of nutrients and oxygen to cells.
Caco-2 cells are widely used in an in vitro model of the intestinal tract to study nutrient and pharmaceutical permeability, physiological processes, and pathological mechanisms [19]. It has been reported that it takes about three weeks for Caco-2 cells to function as intestinal epithelium when cultured on cell culture inserts [20]. In contrast, it has also been reported that Caco-2 cells form villi-like structures and provide a barrier function against small molecules when cultured in a microfluidic device with medium perfusion, which is a favorable condition compared to static cell culture inserts [21,22]. The epithelial barrier robustness was guaranteed regardless of cell morphology in the LY permeability assay under the various conditions in this study.
We consider three factors regarding the morphological characteristics of the Caco-2 cells focused on in this study. The first point is the effect of morphogen secreted by the cells. In a study using a double-layer chip by Valiei et al. in which Caco-2 cells were cultured with medium perfusion, there was a high degree of villi-like structures upstream of the channel but less downstream. They reported that Caco-2 cells secrete Dickkopf-1 (DKK-1), an antagonist of Wnt, to the basolateral side, and that the perfusion of medium in the bottom channel inhibited the formation of villi-like structures on the downstream side, where the DKK-1 concentration was increased [23]. It has been also reported by Shin et al. that the perfusion of the basal medium is important for morphogenesis of intestinal epithelial cells through the use of a microfluidic device that can perfuse the medium on the basal side of the cell culture insert [24].
The second point is the change in nutrient and oxygen supply depending on the chip material and the amount of media perfusion. In this study, microfluidic chips made of PDMS that have a high oxygen permeability formed villi-like structures almost uniformly from upstream to downstream. We cannot find the study which report the formation of villi-like structures in intestinal epithelial cell cultures on microfluidic chips, which vary the distribution of villi-like structures in microfluidic channel. This may be because the microfluidic chip material is PDMS [25,26], which has higher oxygen permeability, and thus did not cause a hypoxic environment, especially in the flow channel, or may have caused non-uniformity in oxygen concentration. Fluid3D-X®, on the other hand, was made of PET which has less drug adsorption and sorption [15]. The gas permeability of PET is extremely low compared to PDMS. Comparison of Fluid3D-X® and PDMS chip used in this study also showed apparent differences in cell morphology in the channels at the same amount of media perfusion, suggesting that the difference in oxygen supply had an effect. In addition, the more developed villi-like structures downstream with increased medium perfusion in the flow rate study using Fluid3D-X® may be attributed to the fact that oxygen and nutrients were supplied to cells further downstream in the flow channel.
The third point is the imposition of shear stress by perfusion of the medium. Pocock et al. cultured Caco-2 cells using gut-on-a-chip made of PDMS with or without medium perfusion and reported that villi-like structures developed when medium was perfused [27]. In the report, the expression of F-actin was upregulated in the villi-like structures, and F-actin was formed from the apical to basal side. Since this study was performed on PDMS chips which has high oxygen permeability, it is suggested that the changes may be due to shear stress caused by perfusion of the medium. The perfusion rate of the medium was also examined in the study by Valiei et al. and showed that at flow rates in the appropriate range, higher flow rates resulted in rapid and higher formation of villi-like structures, but at flow rates outside of that appropriate range, the formation of villi-like structures was delayed [23]. On the other hand, we cannot rule out the possibility that these differences in outcomes due to medium perfusion are attributed to the supply of nutrients and oxygen by the medium perfusion. For instance, in the aforementioned morphological changes induced by the Wnt signaling pathway, it has been reported that DKK-1 expression is enhanced in glioma cells [28] and bone [29] when the partial pressure of oxygen is decreased, and it is possible that differences in oxygen conditions caused by the difference of the materials of chips or perfusion rate of the medium affected DKK-1 secretion.
While there are cells such as Caco-2 that show morphological differences in response to differences in the cell culture environment, it is reported that iPS cell-derived intestinal epithelial cells, F-hiSIECTM, cultured in Fluid3D-X® showed the uniform cell morphology throughout the microchannel, without differences [15]. It is a fact that some kinds of cells show no morphological changes while others have a non-uniform cell morphology in the microchannel due to changes in oxygen permeability and nutrient distribution caused by the perfusion rate of the medium and the materials of the chip. Consequently, optimization of the culture environment may or may not be necessary depending on the type and material of the MPS chip and the cells. Therefore, it will be necessary to consider these factors depending on the cell type and culture method. Conversely, it is also possible to actively use a culture environment that changes gradually from upstream to downstream. For instance, Matsumoto et al. successfully reproduced liver zonation in liver-on-a-chip by taking advantage of oxygen concentration distribution [30]. Elsewhere, Shah et al. achieved co-culture of Caco-2 cells and enterobacteria utilize a gradient of oxygen concentration in the HuMix device, a double-layer channel device [31].
In recent years, the application of AI technology for cell morphological evaluation has been promoted in research using MPS. In airway-on-a-chip studies using human bronchial epithelial cells, the culture period until the cells can be used for assays is approximately 30 days, which is a long time, and there is a possibility of culture failure during the culture process, as well as time and cost losses if the cells are not in a suitable condition for the assay. Accordingly, it has been reported that a culture success prediction system using AI technology is useful to ensure the subsequent culture and cell condition in the early stages of culture [32]. In this study, we used NIS.ai to quantify the villi-like structures of Caco-2 cells in the microchannel using several indices, including the area ratio of villus-like structures to the channel area and the intensity of VC. Using this methodology, we have shown that it is possible to quantify the sparsening of the villi-like structures from upstream to downstream in the channel, as observed microscopically. It is expected to be a new technique for evaluating cell morphology in cell culture using MPS in the future.
The limitation of this study is focused on morphological characteristics, and the molecular mechanism has not been examined, which is an issue for further study.
5. Conclusion
In this study, we discussed the morphological heterogeneity observed in Caco-2 cells cultured using Fluid3D-X®, a double-layer type organ-on-a-chip, focusing on the perfusion conditions of the medium and the oxygen permeability of the chip material. This study shows that the cell culture environment is not uniform in the channel under certain conditions and reveals the importance of its optimization. On the other hand, when human iPS cell-derived intestinal cells (F-hiSIECTM, Fujifilm) were cultured using Fluid3D-X®, no morphological heterogeneity was observed under the culture conditions conducted in this study [15]. Since the oxygen and nutrient requirements differ depending on the cell type, it is necessary to consider optimizing the culture conditions according to the characteristics of the cells cultured in the MPS chips. It is expected that by optimizing culture conditions and constructing organ models, MPS will be able to accurately predict pharmacokinetics and safety in humans, which have been difficult to predict with conventional in vitro experimental systems, and will serve as an alternative method for animal experiments.
Author Contributions
Conceptualization: H. K. Methodology: H. N., T. G., J. S., and H. K. Software: M. M., and M. K. Validation: N. K., T. G., M.M., and M. K. Formal analysis: N. K, J. S., and H. K. Investigation: N. K., M. K., J. S., and H. K. Writing – original draft: N. K., T. G., M. K., and H. K. Visualization: N. K. T. G., and H. N. Supervision: H. K. Project administration: H. K. Funding acquisition: H. K. All authors reviewed the manuscript.
Acknowledgments
Fluid3D-X® was kindly supplied by Tokyo Ohka Kogyo. This work was partially supported by JSPS KAKENHI (Grant number JP24K01321), and the Japanese Agency for Medical Research and Development (Grant number JP22be1004101). This work was also supported by the Tokai University Imaging Center for Advanced Research (TICAR).
Conflicts of interest
M. M., M. K., and J. S. are employees of Nikon Corporation.
References
- Marx, U.; Akabane, T.; Andersson, T.B.; Baker, E.; Beilmann, M.; Beken, S.; Brendler-Schwaab, S.; Cirit, M.; David, R.; Dehne, E.M.; et al. Biology-inspired microphysiological systems to advance patient benefit and animal welfare in drug development. Altex 2020, 37, 365–394. [Google Scholar] [CrossRef] [PubMed]
- Kimura, H.; Sakai, Y.; Fujii, T. Organ/body-on-a-chip based on microfluidic technology for drug discovery. Drug Metab Pharmacokinet 2018, 33, 43–48. [Google Scholar] [CrossRef] [PubMed]
- Pistollato, F.; Madia, F.; Corvi, R.; Munn, S.; Grignard, E.; Paini, A.; Worth, A.; Bal-Price, A.; Prieto, P.; Casati, S.; et al. Current EU regulatory requirements for the assessment of chemicals and cosmetic products: challenges and opportunities for introducing new approach methodologies. Arch Toxicol 2021, 95, 1867–1897. [Google Scholar] [CrossRef]
- Han, J.J. FDA Modernization Act 2.0 allows for alternatives to animal testing. Artif Organs 2023, 47, 449–450. [Google Scholar] [CrossRef]
- Lehman-McKeeman, L.; Davis, M. Toxicology Modernization: Misnomer or Momentum. Medicinal Chemistry Research 2023, 32, 1235–1238. [Google Scholar] [CrossRef]
- Kimura, H.; Nishikawa, M.; Kutsuzawa, N.; Tokito, F.; Kobayashi, T.; Kurniawan, D.A.; Shioda, H.; Cao, W.; Shinha, K.; Nakamura, H.; et al. Advancements in Microphysiological systems: Exploring organoids and organ-on-a-chip technologies in drug development -focus on pharmacokinetics related organs. Drug Metabolism and Pharmacokinetics 2025, 60, 101046. [Google Scholar] [CrossRef]
- Ebrahimkhani, M.R.; Neiman, J.A.; Raredon, M.S.; Hughes, D.J.; Griffith, L.G. Bioreactor technologies to support liver function in vitro. Adv Drug Deliv Rev 2014, 69-70, 132–157. [Google Scholar] [CrossRef]
- Gallagher, E.M.; Rizzo, G.M.; Dorsey, R.; Dhummakupt, E.S.; Moran, T.S.; Mach, P.M.; Jenkins, C.C. Normalization of organ-on-a-Chip samples for mass spectrometry based proteomics and metabolomics via Dansylation-based assay. Toxicol In Vitro 2023, 88, 105540. [Google Scholar] [CrossRef]
- Kopp, B.; Khawam, A.; Di Perna, K.; Lenart, D.; Vinette, M.; Silva, R.; Zanoni, T.B.; Rore, C.; Guenigault, G.; Richardson, E.; et al. Liver-on-chip model and application in predictive genotoxicity and mutagenicity of drugs. Mutat Res Genet Toxicol Environ Mutagen 2024, 896, 503762. [Google Scholar] [CrossRef]
- Pediaditakis, I.; Kodella, K.R.; Manatakis, D.V.; Le, C.Y.; Barthakur, S.; Sorets, A.; Gravanis, A.; Ewart, L.; Rubin, L.L.; Manolakos, E.S.; et al. A microengineered Brain-Chip to model neuroinflammation in humans. iScience 2022, 25, 104813. [Google Scholar] [CrossRef]
- Ma, C.; Peng, Y.; Li, H.; Chen, W. Organ-on-a-Chip: A New Paradigm for Drug Development. Trends Pharmacol Sci 2021, 42, 119–133. [Google Scholar] [CrossRef] [PubMed]
- Shim, K.Y.; Lee, D.; Han, J.; Nguyen, N.T.; Park, S.; Sung, J.H. Microfluidic gut-on-a-chip with three-dimensional villi structure. Biomed Microdevices 2017, 19, 37. [Google Scholar] [CrossRef]
- Shin, Y.C.; Shin, W.; Koh, D.; Wu, A.; Ambrosini, Y.M.; Min, S.; Eckhardt, S.G.; Fleming, R.Y.D.; Kim, S.; Park, S.; et al. Three-Dimensional Regeneration of Patient-Derived Intestinal Organoid Epithelium in a Physiodynamic Mucosal Interface-on-a-Chip. Micromachines (Basel) 2020, 11. [Google Scholar] [CrossRef] [PubMed]
- Sasaki, Y.; Tatsuoka, H.; Tsuda, M.; Sumi, T.; Eguchi, Y.; So, K.; Higuchi, Y.; Takayama, K.; Torisawa, Y.; Yamashita, F. Intestinal Permeability of Drugs in Caco-2 Cells Cultured in Microfluidic Devices. Biol Pharm Bull 2022, 45, 1246–1253. [Google Scholar] [CrossRef]
- Imaoka, T.; Onuki-Nagasaki, R.; Kimura, H.; Tai, K.; Ishii, M.; Nozue, A.; Kaisaki, I.; Hoshi, M.; Watanabe, K.; Maeda, K.; et al. Development of a novel gut microphysiological system that facilitates assessment of drug absorption kinetics in gut. Sci Rep 2024, 14, 29921. [Google Scholar] [CrossRef] [PubMed]
- Kimura, H.; Yamamoto, T.; Sakai, H.; Sakai, Y.; Fujii, T. An integrated microfluidic system for long-term perfusion culture and on-line monitoring of intestinal tissue models. Lab Chip 2008, 8, 741–746. [Google Scholar] [CrossRef]
- Park, Y.; Depeursinge, C.; Popescu, G. Quantitative phase imaging in biomedicine. Nature Photonics 2018, 12, 578–589. [Google Scholar] [CrossRef]
- Popescu, G. Quantitative Phase Imaging of Cells and Tissues, 1st Edition ed.; McGraw-Hill Education: New York, 2011. [Google Scholar]
- Lopez-Escalera, S.; Wellejus, A. Evaluation of Caco-2 and human intestinal epithelial cells as in vitro models of colonic and small intestinal integrity. Biochem Biophys Rep 2022, 31, 101314. [Google Scholar] [CrossRef]
- Cai, Y.; Xu, C.; Chen, P.; Hu, J.; Hu, R.; Huang, M.; Bi, H. Development, validation, and application of a novel 7-day Caco-2 cell culture system. J Pharmacol Toxicol Methods 2014, 70, 175–181. [Google Scholar] [CrossRef]
- Kim, H.J.; Huh, D.; Hamilton, G.; Ingber, D.E. Human gut-on-a-chip inhabited by microbial flora that experiences intestinal peristalsis-like motions and flow. Lab Chip 2012, 12, 2165–2174. [Google Scholar] [CrossRef]
- Chi, M.; Yi, B.; Oh, S.; Park, D.J.; Sung, J.H.; Park, S. A microfluidic cell culture device (μFCCD) to culture epithelial cells with physiological and morphological properties that mimic those of the human intestine. Biomed Microdevices 2015, 17, 9966. [Google Scholar] [CrossRef] [PubMed]
- Valiei, A.; Aminian-Dehkordi, J.; Mofrad, M.R.K. Gut-on-a-chip models for dissecting the gut microbiology and physiology. APL Bioeng 2023, 7, 011502. [Google Scholar] [CrossRef] [PubMed]
- Shin, W.; Kim, H.J. 3D in vitro morphogenesis of human intestinal epithelium in a gut-on-a-chip or a hybrid chip with a cell culture insert. Nat Protoc 2022, 17, 910–939. [Google Scholar] [CrossRef]
- Jalili-Firoozinezhad, S.; Prantil-Baun, R.; Jiang, A.; Potla, R.; Mammoto, T.; Weaver, J.C.; Ferrante, T.C.; Kim, H.J.; Cabral, J.M.S.; Levy, O.; et al. Modeling radiation injury-induced cell death and countermeasure drug responses in a human Gut-on-a-Chip. Cell Death Dis 2018, 9, 223. [Google Scholar] [CrossRef] [PubMed]
- Kim, H.J.; Li, H.; Collins, J.J.; Ingber, D.E. Contributions of microbiome and mechanical deformation to intestinal bacterial overgrowth and inflammation in a human gut-on-a-chip. Proc Natl Acad Sci U S A 2016, 113, E7–15. [Google Scholar] [CrossRef]
- Pocock, K.; Delon, L.; Bala, V.; Rao, S.; Priest, C.; Prestidge, C.; Thierry, B. Intestine-on-a-Chip Microfluidic Model for Efficient in Vitro Screening of Oral Chemotherapeutic Uptake. ACS Biomaterials Science & Engineering 2017, 3, 951–959. [Google Scholar] [CrossRef]
- Guo, K.T.; Fu, P.; Juerchott, K.; Motaln, H.; Selbig, J.; Lah, T.; Tonn, J.C.; Schichor, C. The expression of Wnt-inhibitor DKK1 (Dickkopf 1) is determined by intercellular crosstalk and hypoxia in human malignant gliomas. J Cancer Res Clin Oncol 2014, 140, 1261–1270. [Google Scholar] [CrossRef]
- Leijten, J.C.; Moreira Teixeira, L.S.; Landman, E.B.; van Blitterswijk, C.A.; Karperien, M. Hypoxia inhibits hypertrophic differentiation and endochondral ossification in explanted tibiae. PLoS One 2012, 7, e49896. [Google Scholar] [CrossRef]
- Matsumoto, S.; Safitri, A.R.; Danoy, M.; Maekawa, T.; Kinoshita, H.; Shinohara, M.; Sakai, Y.; Fujii, T.; Leclerc, E. Investigation of the hepatic respiration and liver zonation on rat hepatocytes using an integrated oxygen biosensor in a microscale device. Biotechnol Prog 2019, 35, e2854. [Google Scholar] [CrossRef]
- Shah, P.; Fritz, J.V.; Glaab, E.; Desai, M.S.; Greenhalgh, K.; Frachet, A.; Niegowska, M.; Estes, M.; Jäger, C.; Seguin-Devaux, C.; et al. A microfluidics-based in vitro model of the gastrointestinal human-microbe interface. Nat Commun 2016, 7, 11535. [Google Scholar] [CrossRef]
- Chen, S.L.; Xie, R.H.; Chen, C.Y.; Yang, J.W.; Hsieh, K.Y.; Liu, X.Y.; Xin, J.Y.; Kung, C.K.; Chung, J.H.Y.; Chen, G.Y. Revolutionizing Epithelial Differentiability Analysis in Small Airway-on-a-Chip Models Using Label-Free Imaging and Computational Techniques. Biosensors (Basel) 2024, 14. [Google Scholar] [CrossRef] [PubMed]
Figure 1.
Experimental setup. Microfluidic chip and perfusion system by Takasago Denki. (a) Configuration of microfluidic chips, including Fluid3D-X® and PDMS chip. (b) Photographs of microfluidic chips: Fluid3D-X® made of PET (left) and PDMS chip made of PDMS (right), scale bars are 10 mm. (c) Schematic diagram of the perfusion culture system using microfluidic chips. (d) Actual setup of the perfusion culture system with Fluid3D-X®.
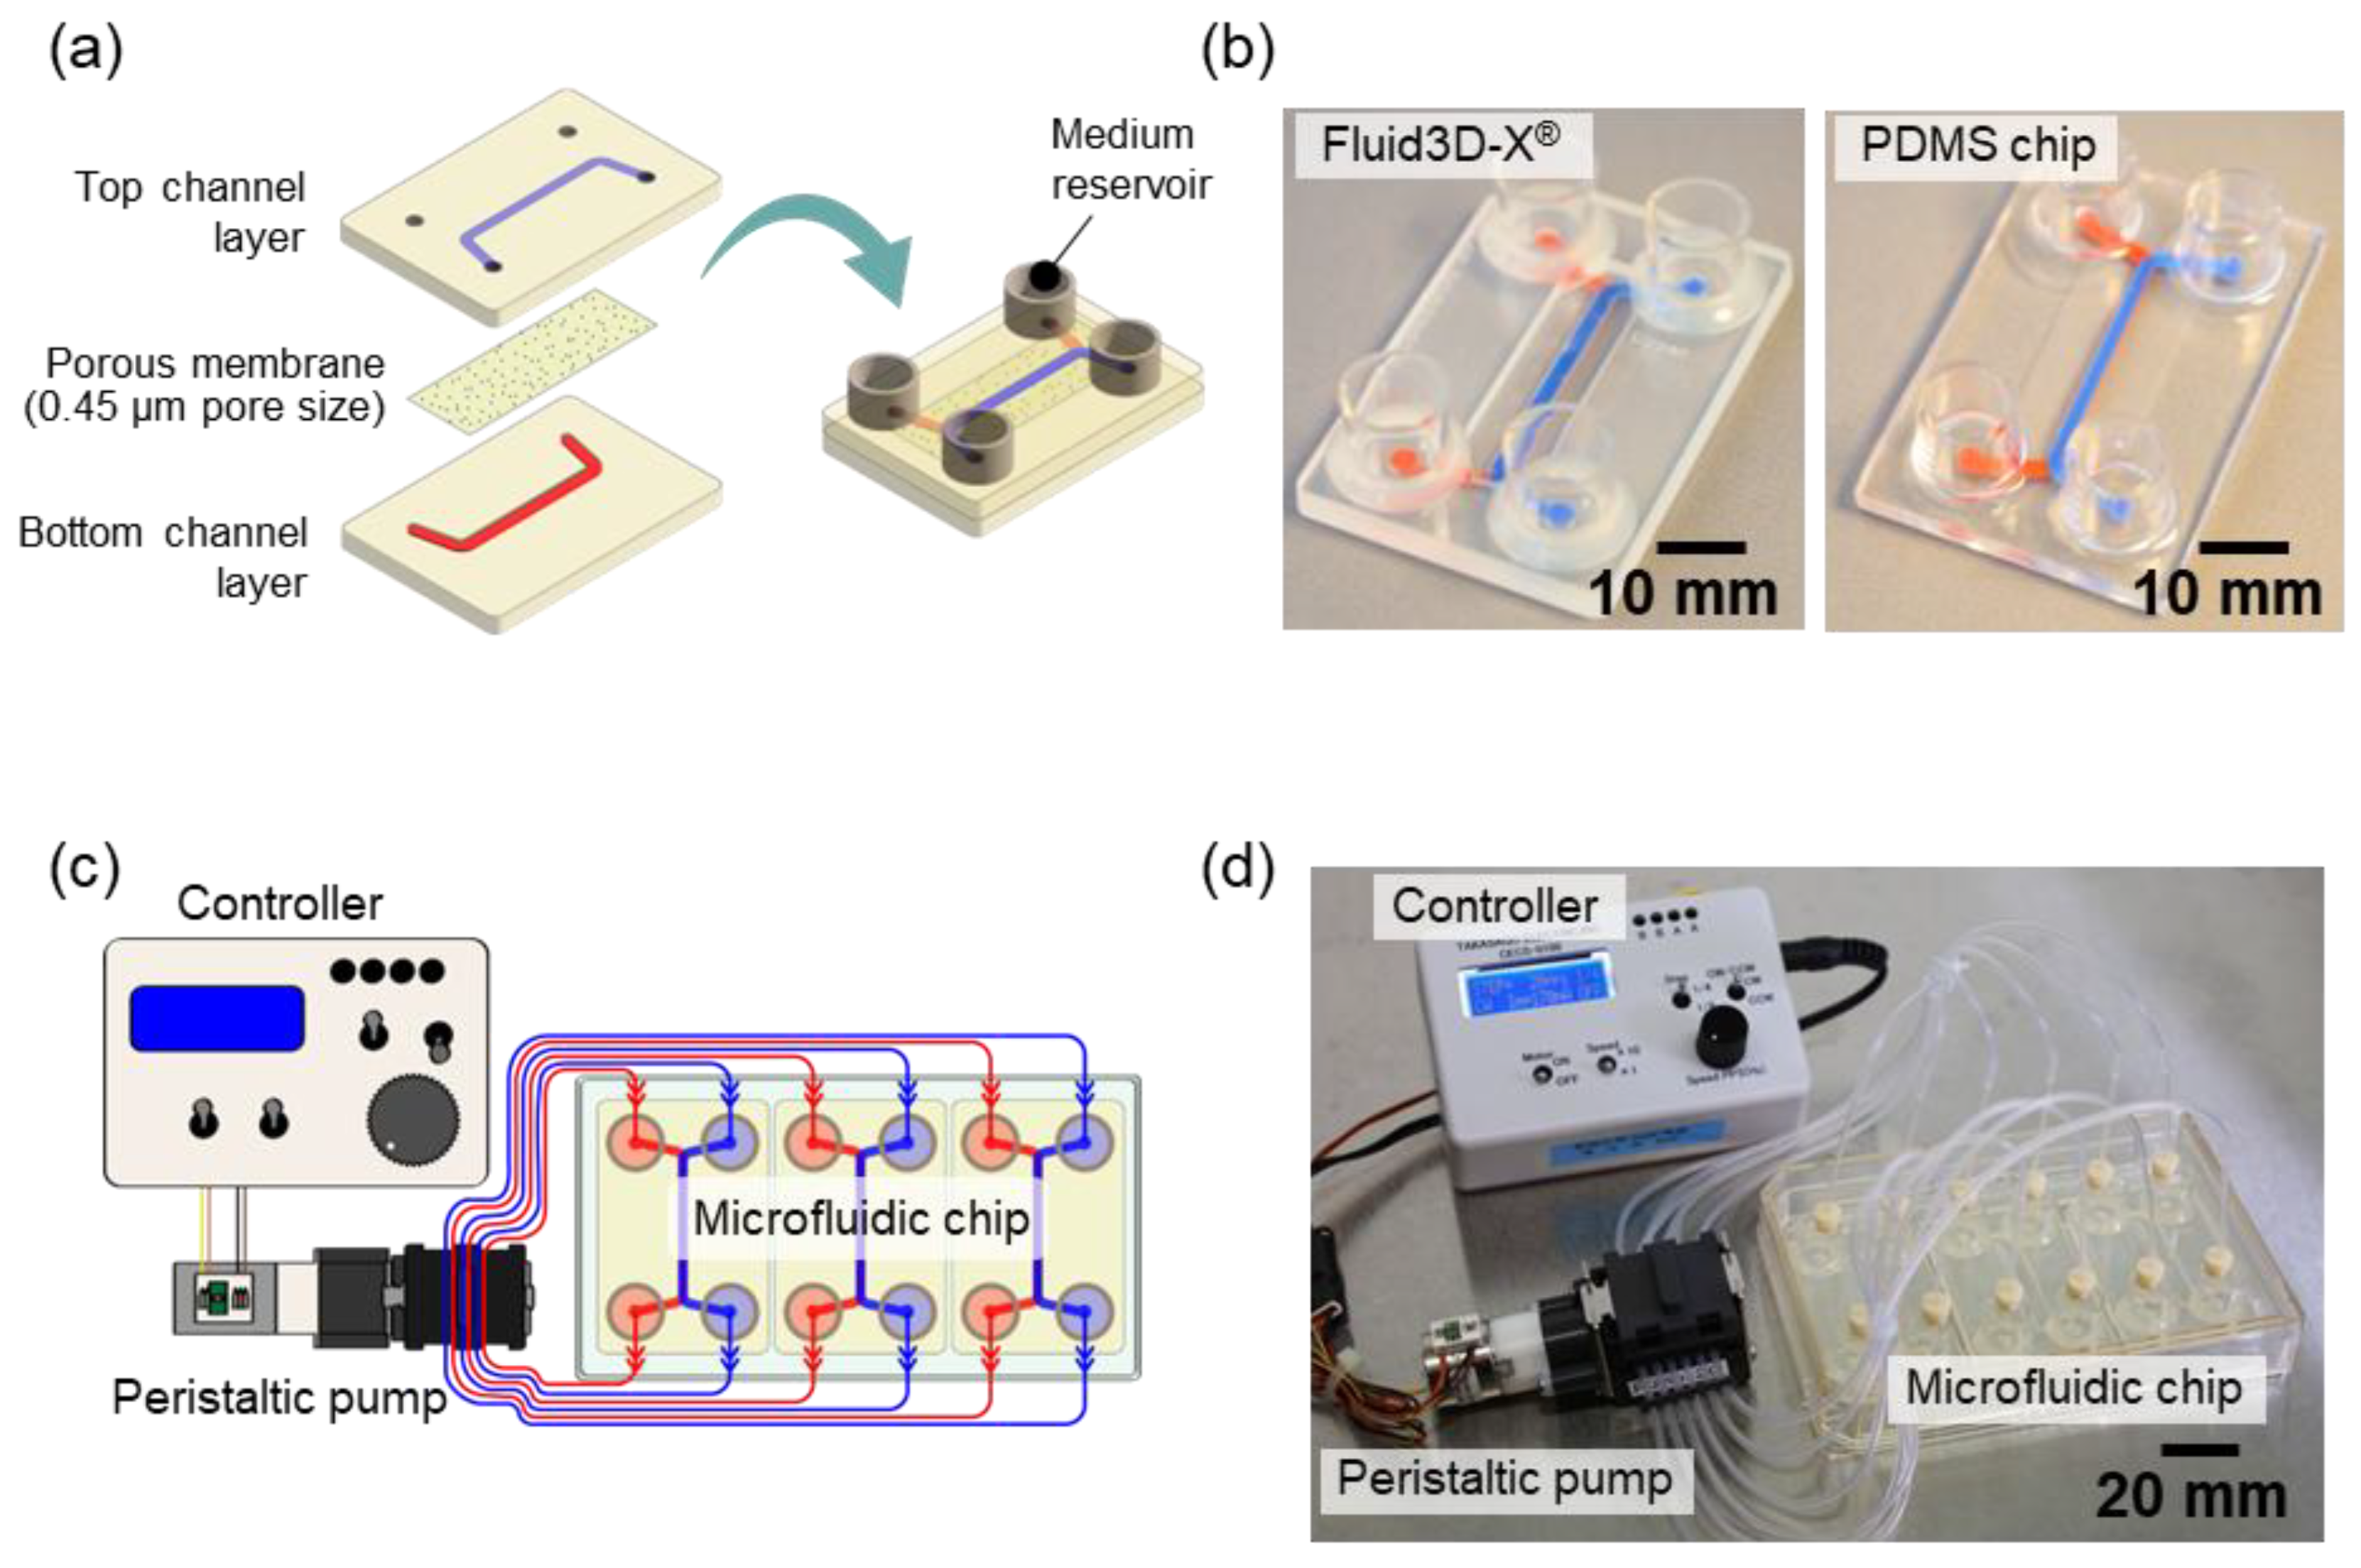
Figure 2.
Representative data of cell morphology in the Fluid3D-X® microchannel under several conditions of perfusion directions. (a) Schematic diagram of the experimental schedule. 1) Control; after pre-perfusion (4 μL/min for 2 days), the culture medium of the top and bottom channels was perfused toward the same direction at the 20 μL/min rate. 2) Inverse; after pre-perfusion, the culture medium of the top and the bottom channels was perfused in opposite directions at the rate of 20 μL/min. 3) Switch; after pre-perfusion, the culture medium of the top and the bottom channels was perfused toward the same direction at the rate of 20 μL/min until day 11, then switched perfusion direction at the rate of 20 μL/min. Cell culture was conducted for 2 weeks (14±1 days) after seeding. (b) Images of representative bright field at 1 week (7±1 days) and 2 weeks (14±1 days). Top; Control, middle; Inverse, bottom; Switch. Magnification ×100, scale bar 400μm. (c) The result of the Lucifer Yellow permeability test. Values were the means of the Papp of each chip, and each dot indicates 1 chip.
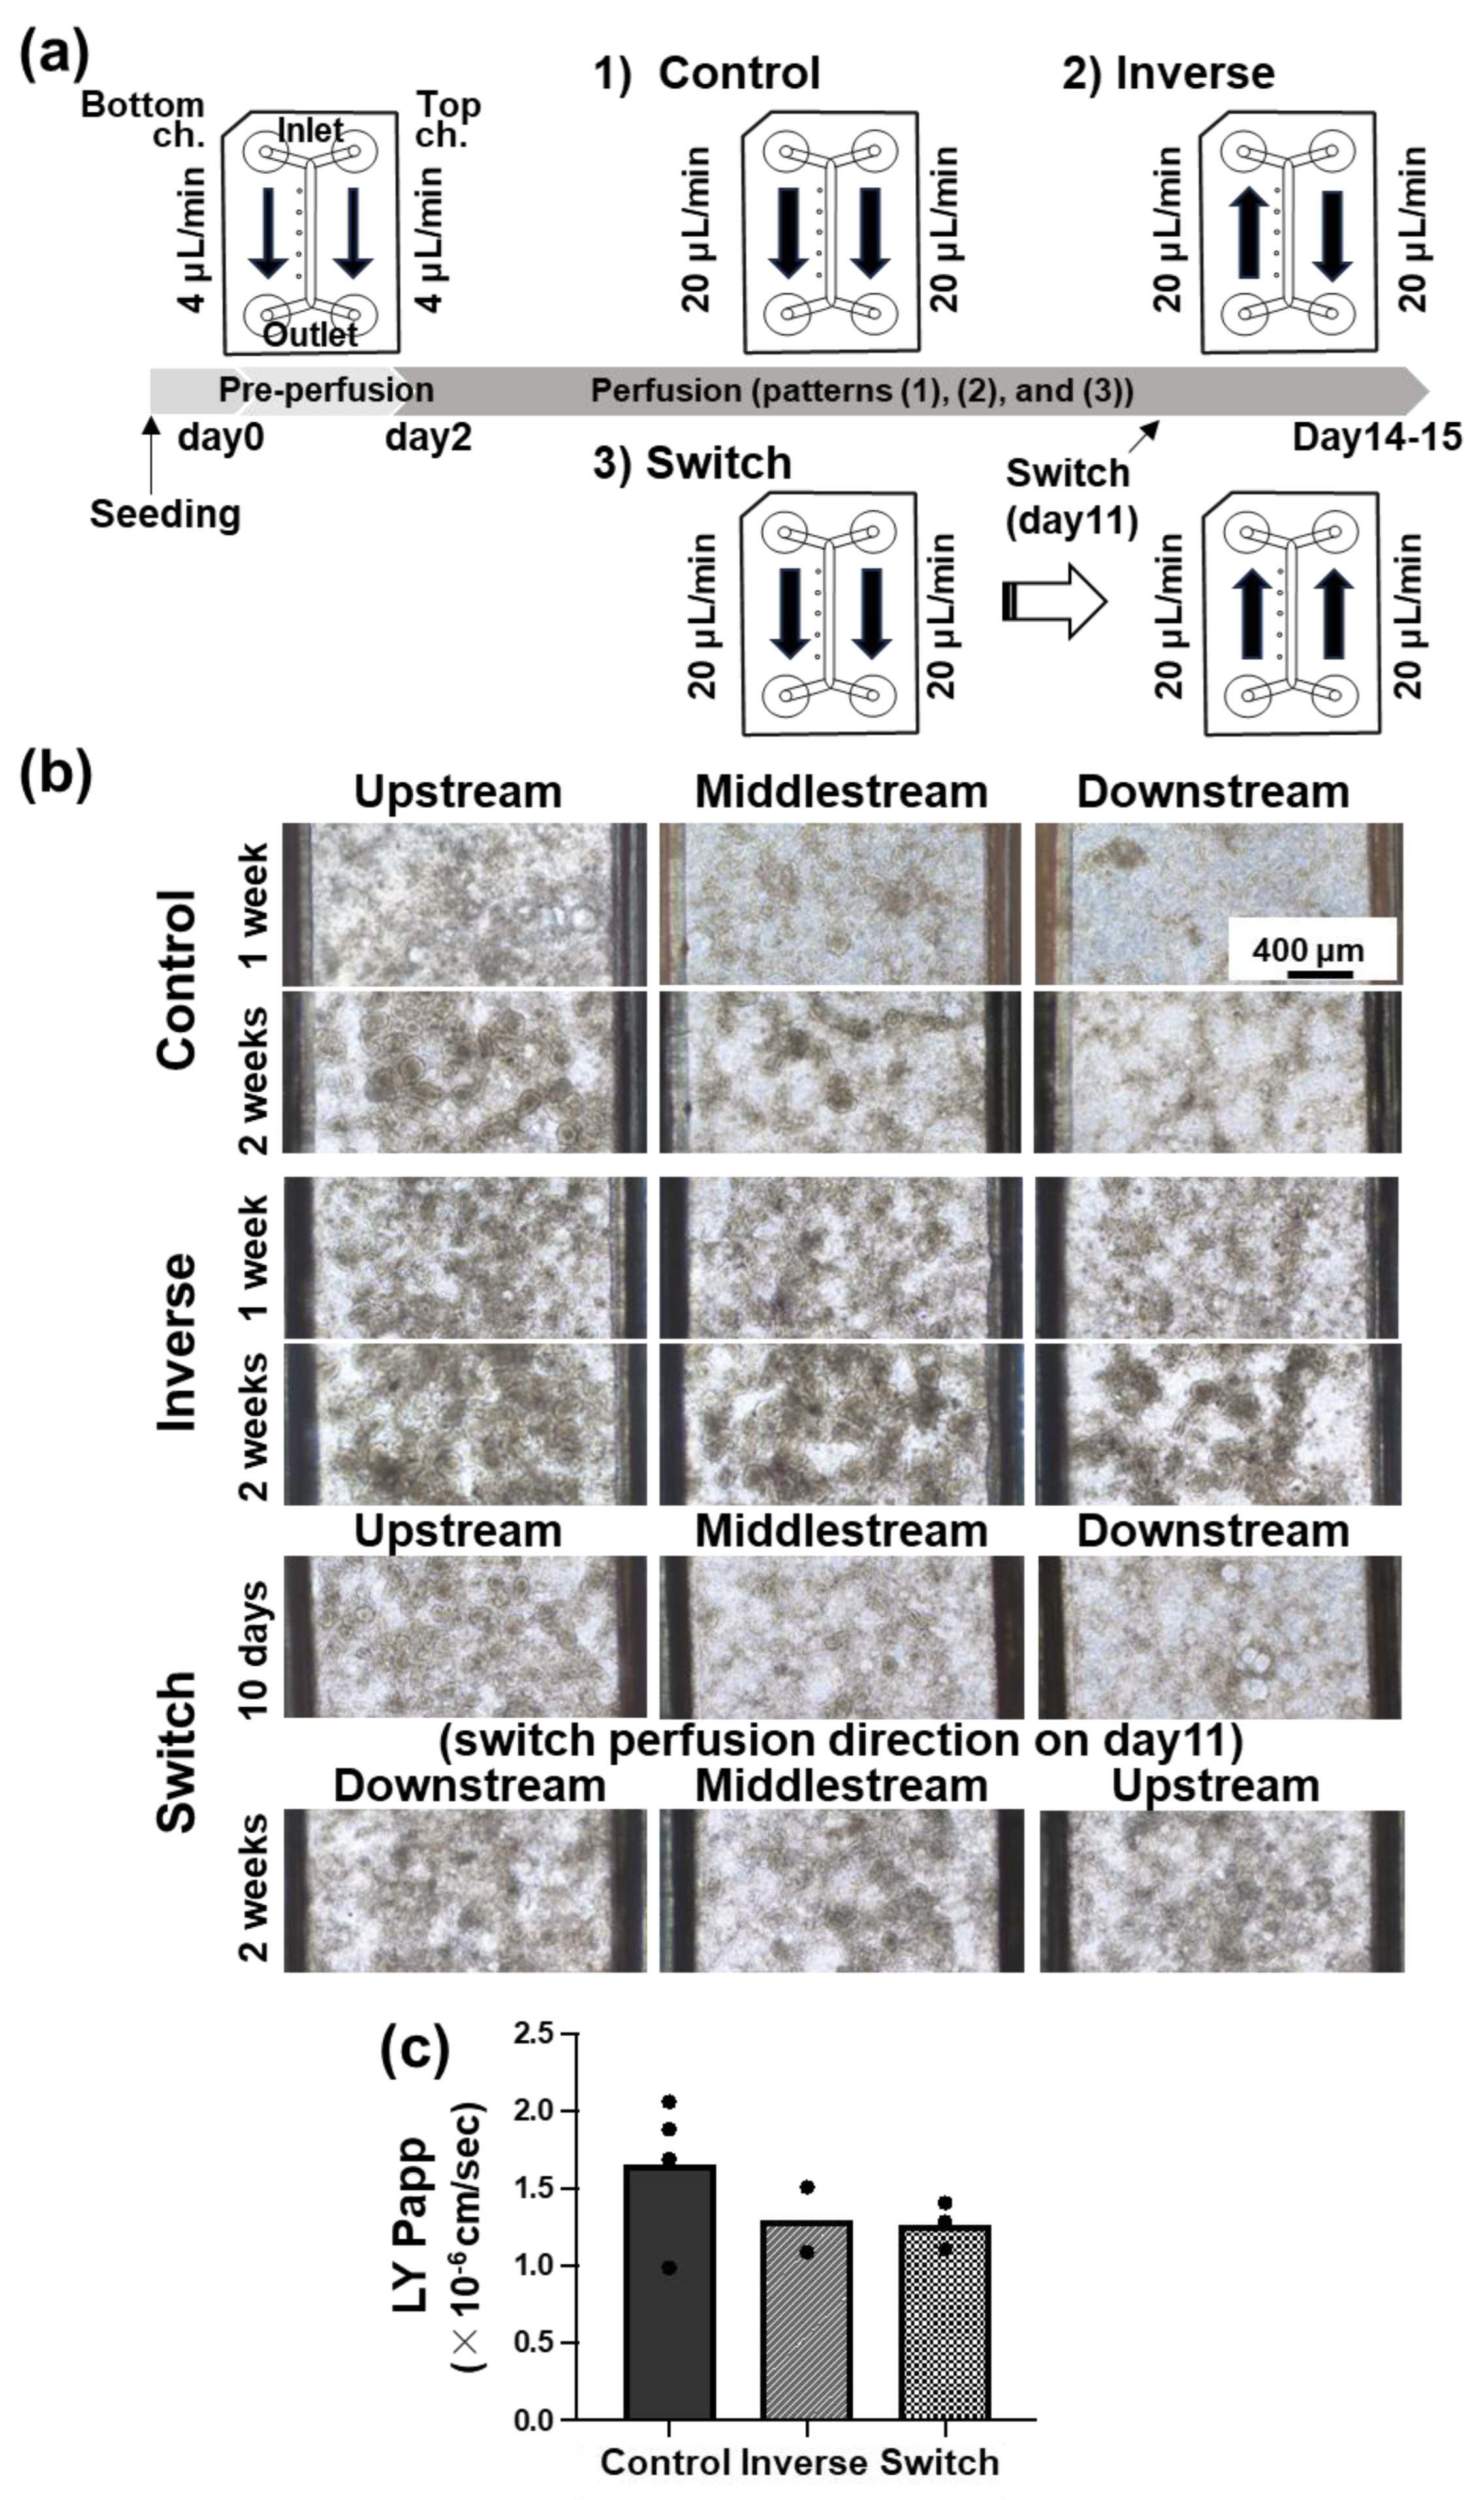
Figure 3.
Representative data of cell morphology in the microchannel under several culture conditions. (a) Representative Extended Depth of Focus (EDF) image of whole microchannel based on a Z-stack bright-field imaging, scale bar 2mm. (b) Images of the representative bright field of control (chip: Fluid3D-X®, perfusion rate: 20 μL/min after pre-perfusion) at 1 week (7±1 days) and 2 weeks (14±1 days). (c) Images of the representative bright field of doubled speed (chip: Fluid3D-X®, perfusion rate: 40 μL/min after pre-perfusion) at 1 week (7±1 days) and 2 weeks (14±1 days). (d) Images of the representative bright field of control (chip: PDMS chip, perfusion rate: 20 μL/min after pre-perfusion) at 1 week (7±1 days) and 2 weeks (14±1 days). left; upstream, middle; middle, right; downstream of chip. Magnification ×100, scale bar 400 μm. (e) The result of the Lucifer yellow permeability test. Values were the means of the Papp of each chip, and each dot indicates 1 chip.
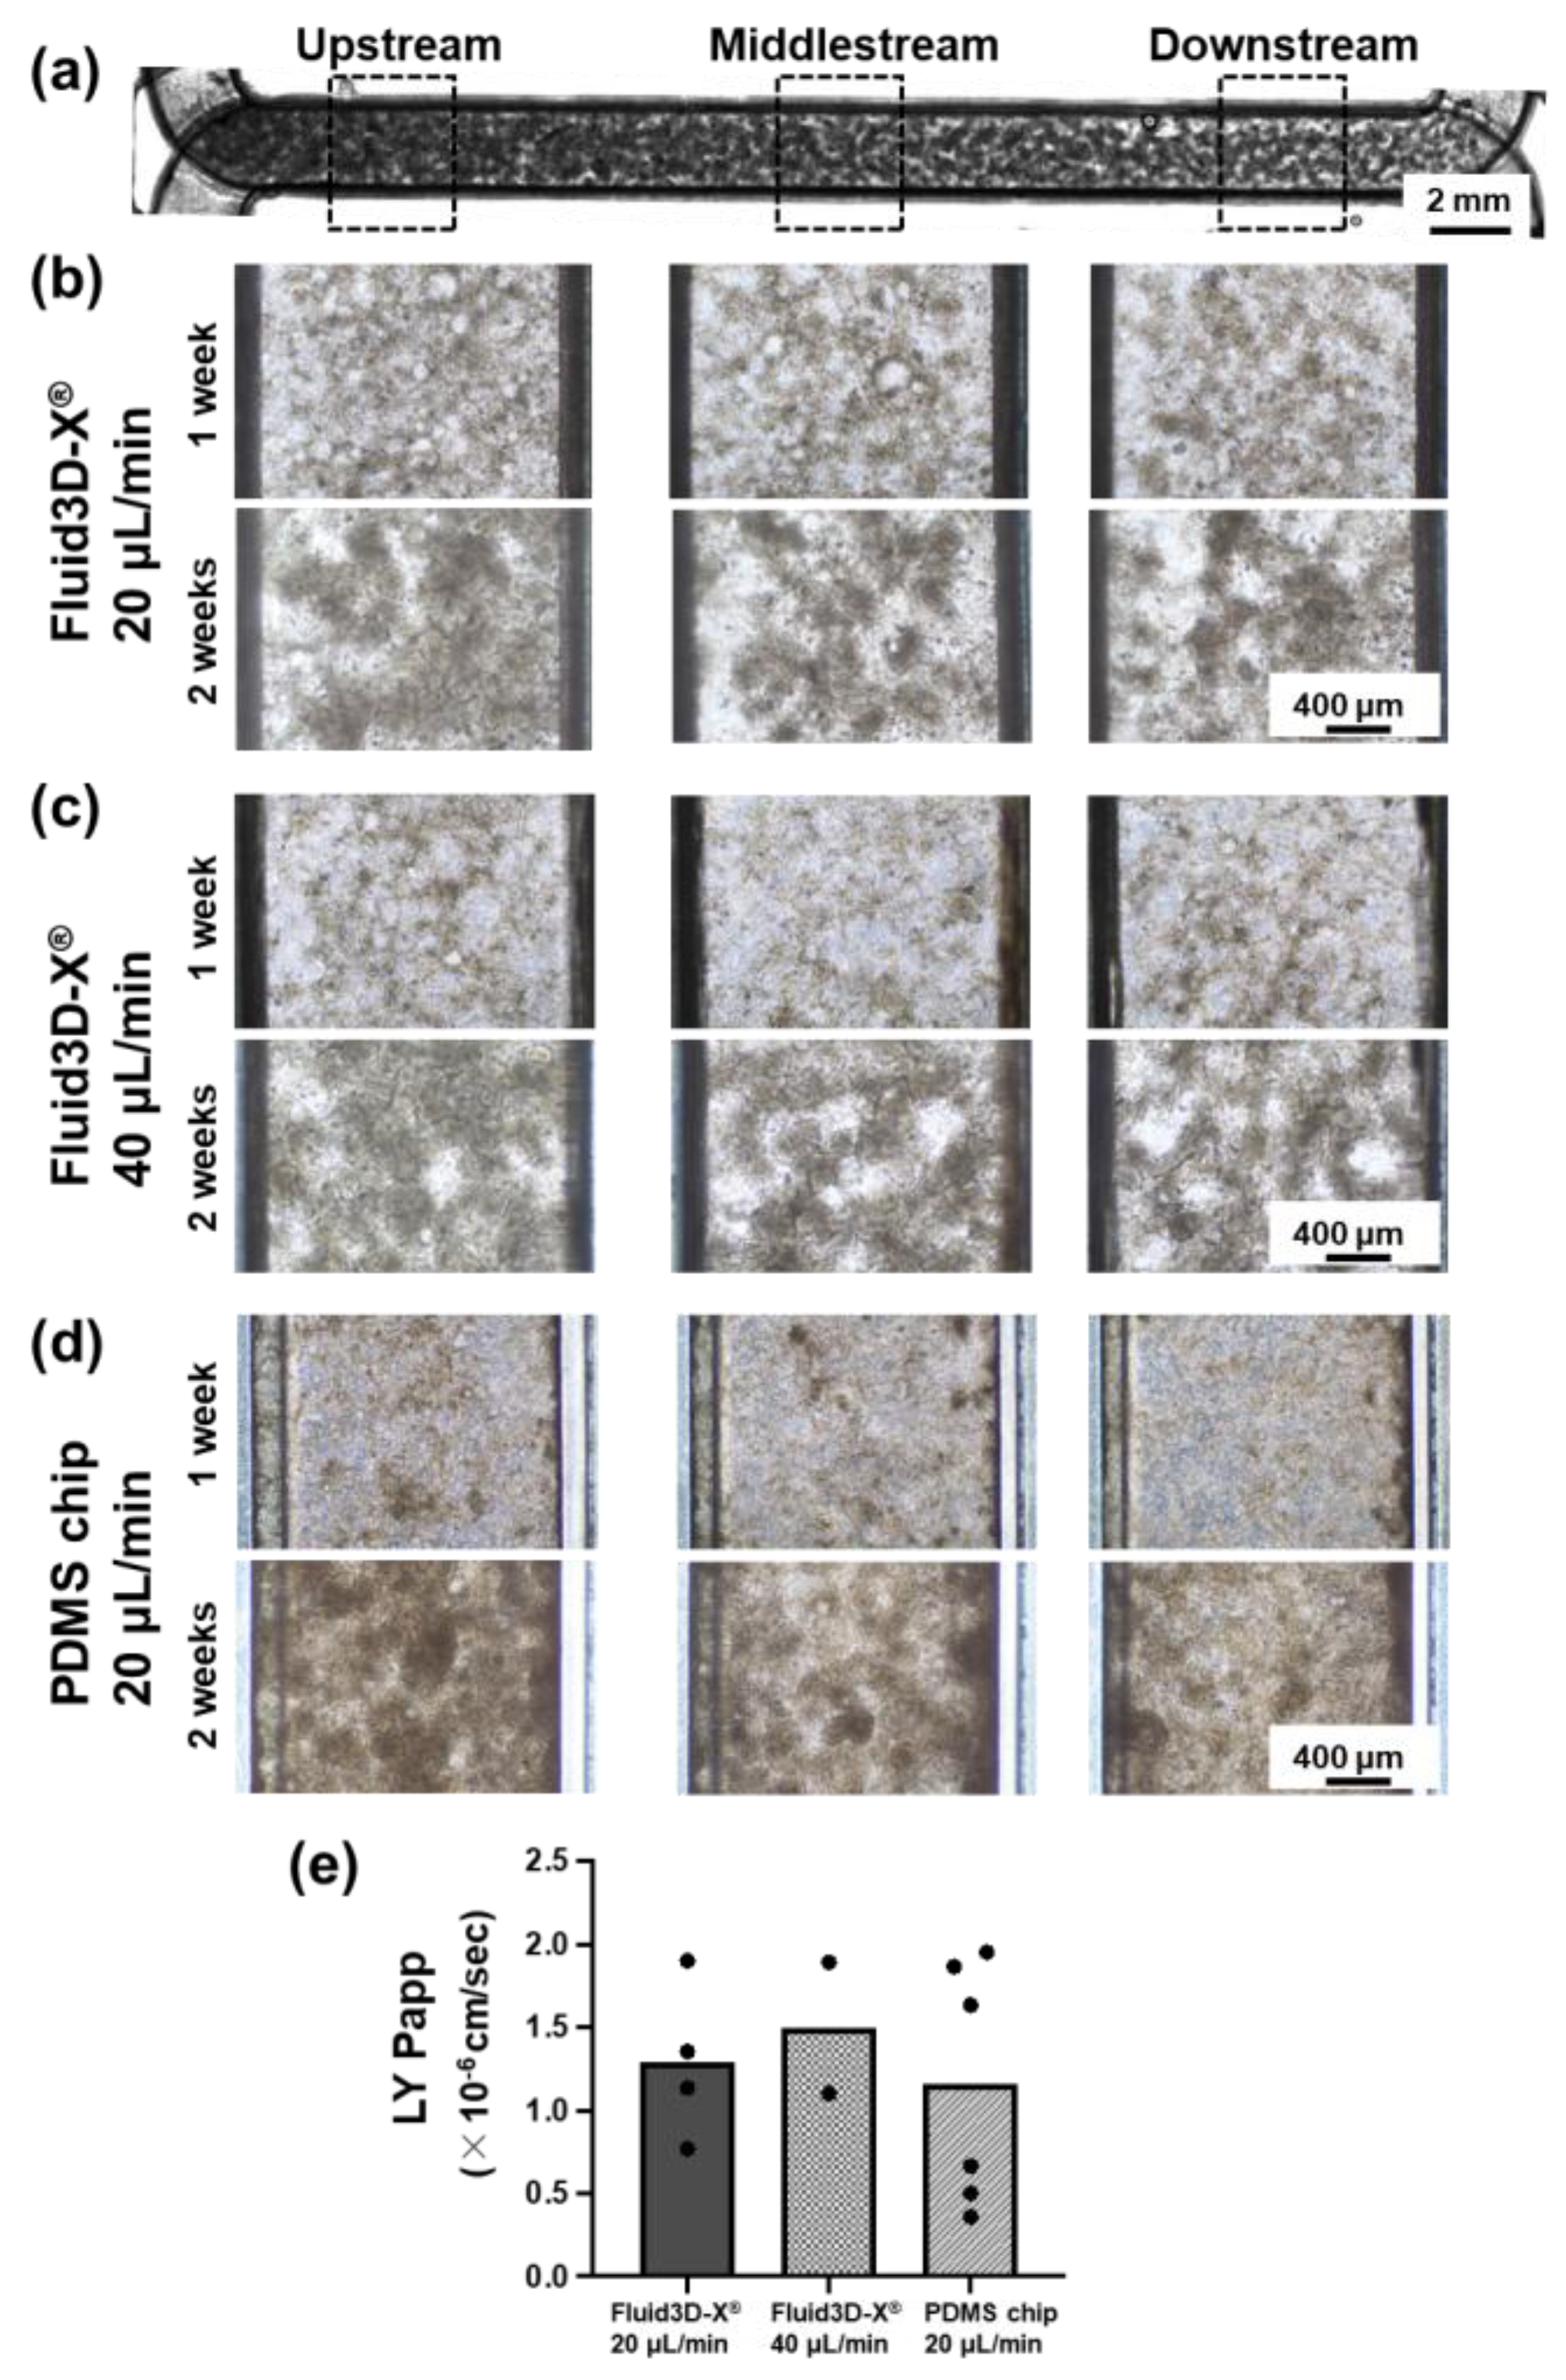
Figure 4.
3D structure distribution in microfluidic channel quantified by NIS.ai. (a) Images of microchannels with three different conditions by AI-VC. Whole microchannel was divided into three regions, upstream (left), middlestream (center) and downstream (right). Top; Fluid3D-X®, perfusion rate of 20 μL/min, middle; Fluid3D-X®, perfusion rate of 40 μL/min, bottom; PDMS chip, perfusion speed of 20 μL/min. Scale bar 1mm. (b) Relative total object area of AI-VC. (c) Relative Sum Intensity of AI-VC. Each parameter was standardized by its ‘upstream’ value. Left; Fluid3D-X®, perfusion rate of 20 μL/min, center; Fluid3D-X®, perfusion rate of 40 μL/min, right; PDMS chip, perfusion rate of 20 μL/min. Up: upstream, Mid: middlestream, Down: downstream.
Disclaimer/Publisher’s Note: The statements, opinions and data contained in all publications are solely those of the individual author(s) and contributor(s) and not of MDPI and/or the editor(s). MDPI and/or the editor(s) disclaim responsibility for any injury to people or property resulting from any ideas, methods, instructions or products referred to in the content. |
© 2025 by the authors. Licensee MDPI, Basel, Switzerland. This article is an open access article distributed under the terms and conditions of the Creative Commons Attribution (CC BY) license (http://creativecommons.org/licenses/by/4.0/).
Copyright: This open access article is published under a Creative Commons CC BY 4.0 license, which permit the free download, distribution, and reuse, provided that the author and preprint are cited in any reuse.


