Submitted:
31 January 2025
Posted:
03 February 2025
You are already at the latest version
Abstract
Creating sustainable cities requires effective traffic noise reduction strategies that use urban green spaces as nature-based solutions. Regional studies highlight the role of GSA in coping with noise annoyance, leaving knowledge gaps using day/night records of compliance rates to detect spatiotemporal mitigations across cities with varied socioeconomic states on the national scale. It was initially agreed that the COVID pandemic led to noise reduction, but this was learnt as a lesson using data from 31 Chinese cities (2018–2021). The relationships between GSA, socioeconomic factors, and daytime/nighttime compliance were examined using multivariate linear regression and maximum likelihood estimation. Novel GAI integrated with GSA and socioeconomic data. The results showed a counterintuitive negative correlation between total GSA and compliance but a positive correlation between GPC and daytime compliance. The pandemic initially boosted compliance, but this effect was not sustained. The compliance rate increased in national cities from 2018 to 2021, predominantly during the day. The positive pandemic-induced compliance increased the importance of considering human behavioral changes in urban greening in a socioeconomic background. We recommend incorporating socioeconomic factors, such as GPC, in the preparation for policymaking to reduce traffic noise when suffering unforeseen events. It is time to move beyond the sole focus on the role of green space areas in a sustainable city with quiet traffic.
Keywords:
Acoustic landscape
; soundscape
; quiet habitat
; compliant standard
; urban forest management
; urban green belt
; roadside tree function
1. Introduction
The pursuit of sustainable cities necessitates concerted efforts to mitigate the detrimental effects of traffic noise on residents' health and well-being [1,2]. High levels of road traffic noise have been consistently identified as a source of mental stressors [3,4,5]. This leads to negative health outcomes including cardiovascular diseases, sleep disturbances, and cognitive impairment [6,7]. It is important to design urban environments with readily available green areas for noise reduction and stress relief [3,8,9]. Failing to address this crucial aspect of urban planning not only compromises the quality of life of residents but also undermines the essence of creating sustainable urban environments. Traffic noise plays a critical role in building a sustainable acoustic landscape, emphasizing the urgent need to implement effective noise-mitigation strategies [8,10,11]. Scientific evidence is needed to support policymaking for reducing traffic noise in urban green spaces.
Urban green spaces refer to ecosystems dominated by urban forest vegetation, which play a vital role in mitigating traffic noise pollution [12,13]. Studies have consistently demonstrated that the presence of nearby green spaces reduces noise annoyance and stress-related symptoms [3,4]. Visual access to outdoor vegetation is a significant factor in reducing noise annoyance [4,9], independent of the actual sound insulation provided by the vegetation [14]. These pieces of knowledge result from documentations on the restorative benefits of green spaces in noisy environments [15,16,17]. Parameters describing the urban forest structure mainly account for the reduction in traffic noise [9,18]. However, the interaction between acoustic landscapes and social interplay reveals that the combined effects of socioeconomic factors are more effective than the sole impact of urban green spaces in reducing noise within urban areas [7,19,20]. The effectiveness of urban green spaces in reducing noise pollution is a multifaceted issue with potential for further research on the impact of various factors, such as access to socioeconomic status and density [6]. Further research is essential to fully elucidate the complex interplay between environmental factors, socioeconomic dimensions, and the resulting impact on residents' perceptions and experiences of noise reduction within urban green spaces.
The COVID-19 pandemic inadvertently provided a unique opportunity to study the impact of reduced human activity on urban noise [21,22]. It was found that both social lockdown and activity restriction lowered traffic volumes, resulting in substantial decreases in noise pollution in many cities [21,22,23,24]. Current studies have mainly focused on noise reduction in specific urban areas during the pandemic [23,24], but evidence from large-scale, even national-level effects remains scarce. These pandemic-induced changes offer valuable insights into potential noise mitigation strategies; however, it is not certain whether all remain when the geographical scale is enlarged due to highly varied conditions among cities. Large-scale mitigation strategies do not rely on drastic societal disruptions [21,24]. Further research is necessary to ascertain the current evidence in large-scale observational studies.
Government recommendations and policies are continuously being published to mitigate noise pollution and raise the actual compliance rate [21,22,25,26]. The compliance rate is often measured through observed reductions in traffic noise at locational points by comparing standard levels following specific measures [27,28]. Monitoring compliance is a powerful tool for evaluating the traffic noise mitigation efforts implemented in urban green spaces [5,22,27]. The compliance rates of traffic noise can also fluctuate, highlighting the need for sustained monitoring and adaptive strategies; however, the mechanism is unclear [21,29]. Future research should focus on incorporating this crucial variable into the observations of specific urban planning initiatives in large-scale studies across typical courses. The final objective is to promote sustainable noise-reduction strategies that account for the dynamics of societal responsiveness to policy interventions.
In this study, we propose a research objective focused on using total point compliance as a metric to assess the impact of urban green space areas on traffic noise at points in cities on a national scale in China. Based on the reviewed literature, we hypothesize that: (1) an increased urban green space area will benefit high compliance rates, (2) this effect will be strengthened in regions with crowded populations and flourished economies, and (3) lowered by the pandemic. We aim to contribute to a deeper understanding of the complex interactions between urbanization, greenspace provision, and noise pollution, offering valuable data for informing future national-level strategies for noise control. This would require detailed data on urban greenspace coverage, traffic noise levels, and a range of socioeconomic indicators for many cities.
2. Literature Review
2.1. Traffic Noise Risks and Impairment on Local Residents
Studies have confirmed the negative impact of traffic noise on urban residents' well-being and health [1,3,30]. Noisy road traffic is perceived as a major source of mental stress, leading to various negative health outcomes including cardiovascular disease, sleep disturbance, and cognitive impairment [3,6,8]. This underscores the critical need for effective noise mitigation strategies in urban planning to improve public health and well-being. Several studies have investigated the role of green spaces in reducing noise annoyance. Access to quiet areas within dwellings, combined with nearby green spaces, acts as a buffer against the adverse effects of noise exposure [3]. Visible access to green spaces correlates with reduced noise annoyance, fewer stress-related symptoms, and an increased use of outdoor spaces [4]. Visual access to outdoors can also remarkably reduce noise annoyance, independent of sound insulation [31,32,33]. This effect is particularly relevant in traffic landscapes with high noise frequencies [12]. Furthermore, the presence of green spaces improves life satisfaction through psychological effects, even when direct noise reduction is limited [6]. This is because least partly that green vegetation walls can significantly reduce ambient noise levels in urban areas [34]. Together, these findings suggest the importance of incorporating visual aspects into urban planning to improve the perceived well-being of residents.
However, the effectiveness of noise reduction strategies varies owing to diverse green space structures that are dominant in density, species, and spatial arrangement [18,35]. Similarly, the impact of green spaces on noise perception is mediated by several human-related factors, including objective noise levels, education level, and the presence of noisy neighbors [6]. Between these two sides of mitigation, the composition and spatial arrangement of greenery played a crucial role across the effects on the perceptions of noise annoyance [21,36]. However, the COVID-19 pandemic provided an unexpected opportunity to assess the impact of reduced human activity on urban noise levels [21,22]. Significant reductions in noise were observed during periods of restricted movement, emphasizing the link between urbanization and noise pollution [21,22,23,24]. These findings reinforce the importance of adopting sustainable urban planning strategies that consider both the ecological and social aspects of noise pollution mitigation [29,34]. However, little is known about the effects of being relevant to social activities.
Big data and machine learning have been used as practical instruments for analyzing data to integrate greenspace design with noise reduction aims [35,37]. These cutting-edge approaches are attracting more attention because they have been found to help detect quieter and healthier urban environments more efficiently than any older approach. Therefore, a comprehensive approach that integrates multiple methodologies and considers both direct and indirect pathways has been suggested [10,12,38]. Such an approach would accurately reflect the impact of traffic noise in life-cycle assessments and consistently integrate this information into urban planning for more sustainable and livable cities. More studies are required to provide more opportunities to achieve state-of-the-art methods using novel approaches.
2.2. Measuring Traffic Noise: The Crucial Role of Compliance
Accurate measurement and analysis of traffic noise are crucial to understanding its impact on human health and the environment. The use of various parameters and methods to measure and analyze traffic noise differs across countries [11]. Common parameters and methodologies used worldwide include the sound pressure level, frequency spectrum, and impact assessment [25,27]. Numerous studies have employed different methods for measuring traffic noise, utilizing sound level meters, vibration meters, and noise-mapping techniques [26,34]. Recent studies have focused on the relationship between urban green spaces and noise perception. Residential green has been associated with reduced annoyance to road traffic and railway noise but increased annoyance to aircraft noise [29]. The presence of vegetation can act as a visual and auditory shield, potentially impacting the restorative potential of urban soundscapes [13,39].
Sound level meters are commonly used but have limitations in the frequency range and susceptibility to environmental factors [14,26]. The major restriction is that commonly used instruments cannot monitor noise simultaneously at different locations, especially when the objective area is large. Noise mapping can provide a comprehensive overview; however, it requires heavy investment in monitoring devices and sophisticated software that may not accurately capture localized noise events [8,40]. Furthermore, it has recently been recommended that the development of 3D noise-mapping techniques offers opportunities to more accurately visualize and understand the spatial distribution of traffic noise [41,42]. These visualizations can be valuable in urban planning, enabling informed decision-making and improved mitigation strategies [28,43,44]. Again, simultaneous monitoring is difficult to achieve, and building 3D models cannot solve this issue.
Scholars have started to focus on the importance of compliance rate as a meter for noise regulation and its effect on noise levels [25,28]. Compliance has emerged as a flexible factor influencing noise levels in built environments [22,28]. This is practical because it employs a variable metric in related changes of noise in comparison with the standard baseline, instead of absolute changes. During the COVID-19 pandemic, researchers monitored urban noise levels to evaluate the impact of recommendations and restrictions on noise reduction [21,22,24]. This highlights the role of compliance rate in monitoring regulations for lowering noise levels [23].
Additionally, researchers have explored people’s emotional responses to urban environments, including the impact of green spaces on perceived tranquility and well-being [15,30]. Studies have used facial expression analysis to assess the real-time emotions of visitors in urban forest environments [19,20,45]. By incorporating these advanced technologies, the analysis of compliance rates becomes more flexible in detecting acoustic responses to urban green spaces at any geographical scale [5,6,8,46]. Future research could further enhance the accuracy and effectiveness of traffic noise mitigation strategies in urban planning for more sustainable and livable cities.
2.3. The Role of Urban Forest Vegetation in Traffic Noise Reduction
Urban green spaces have emerged as a promising solution for mitigating traffic noise pollution, highlighting their effectiveness in reducing noise and improving urban wellbeing [2,3,6,25]. Research has shown that urban vegetation, particularly dense tree canopies and hedges, can significantly attenuate traffic noise through physical barriers and psychological restoration mechanisms [15,38,47]. For instance, Van Renterghem and Botteldooren (2016) demonstrated that visual access to outdoor vegetation from living spaces reduces noise annoyance, with residents reporting significantly lower annoyance levels when they had unobstructed views of greenery [4]. This effect was independent of actual sound insulation, suggesting that visual interactions with nature play a crucial role in noise perception. Similarly, Klingberg et al. (2017) found that urban vegetation, especially green leaves, reduced both air pollution and noise levels near busy roads [12]. Their study showed that leaf emergence significantly lowered noise frequencies relevant to traffic, highlighting the importance of green spaces in improving urban acoustic environments. Another study by Wickramathilaka et al. (2024) used LiDAR-based 3D tree canopy analysis to develop a new noise reduction equation, and found that tree belts were more effective than isolated trees in reducing traffic noise by up to 3 dB(A) [47]. This study underscores the importance of canopy density and tree configuration in noise-mitigation strategies.
The psychological benefits of urban green spaces have been attributed to noise reduction [3,6,20]. These findings suggest that urban planning should prioritize the integration of green spaces to enhance psychological well-being and reduce noise annoyance. For example, Watts (2017) introduced the Tranquility Rating Prediction Tool, which demonstrated that natural noise barriers and greened urban areas significantly enhance perceived tranquility [15]. The study found that city squares with grass cover and visual screening achieved high tranquility ratings, whereas parks adjacent to roads showed improved tranquility with increased distance and vegetation density. Furthermore, a review by Van Renterghem (2019) emphasized that visible vegetation can mitigate noise annoyance through restorative properties, where natural settings sounded like bird songs, enhancing the positive effects [13]. This highlights the need for comprehensive urban planning, which considers both visual and auditory interactions with nature. Additionally, a study by Yang and Yu (2024) showed that different vegetation communities have varying noise reduction capabilities, with denser canopies providing more significant benefits [48]. Despite these positive findings, there is a need for further research to quantify the impact of urban green space areas on noise reduction using a new meter, such as the compliance rate. The effectiveness of vegetation varies with species, density, and spatial arrangement, suggesting that a one-size-fits-all approach may be insufficient. Urban forest vegetation offers a multifaceted solution to reduce traffic noise, with both physical and psychological benefits. The employment of compliance rate can benefit the detection of the relationship between greenspace area and noise reduction effectiveness.
2.4. Socioeconomic Dimensions for Traffic Noise Reduction in Urban Forests
Urban green spaces have emerged as a promising solution for mitigating traffic noise pollution, with numerous studies highlighting their effectiveness in reducing noise levels and improving urban wellbeing [12,34,38,42]. Research has shown that urban vegetation, particularly dense tree canopies and hedges, can significantly attenuate traffic noise through physical barriers and psychological restoration mechanisms [4,13,18,40,47]. Traffic noise and its reduction are both observed in urban green spaces subjected to the intensive interplay of anthropogenic activities. Mitigating policies are unlikely to be implemented without concerns about evidence from socioeconomic dimensions.
The socioeconomic factors of population, GDP, and industrial proportions in GDP collectively generate effects on traffic noise reduction in urban green spaces. Studies have shown that cities with a higher GDP per capita, larger populations, and a higher proportion of non-production electricity consumption and road transport infrastructure tend to induce more frequent positive emotional expressions from visitors in urban green spaces [35,37,45]. Conversely, cities where the local economy is heavily reliant on heavy industries tend to elicit more negative sentiments from greenspace visitors [45,49]. These were attributed to the availability of nearby green spaces and their characteristics [3,15,46]. Vegetation with denser canopies has been found to provide more effective noise reduction [38,48]. Hence, the placement of roadside trees and their canopy sizes may generate potential reductions in noise for retail shops in the neighborhood. For example, Liu et al. (2024) found that more retail shops should be placed along roads with larger tree canopies to optimize the balance between visibility and noise reduction [37]. Alongside the broader socioeconomic context of a city, urban green spaces can play a crucial role in shaping the perceived tranquility and noise levels of urban residents [5,6,8,44]. More deserves to be unraveled regarding socioeconomic involvement in the effects of urban green space on noise reduction.
2.5. Geographical Scales in Studies on Traffic Noise Reduction in Urban Green Spaces
Existing literature on the role of urban green spaces in reducing traffic noise exposure has primarily focused on regional-scale studies, such as sampling across one or several streets [4,14,48]. While most current studies provide valuable insights into the localized effects of vegetation on noise levels, they also lack the broader perspective needed to understand the impact of urban greening strategies at the city or national scales. This gap was addressed by examining the relationship between urban green spaces and noise annoyance across multiple cities [29]. Investigations have indicated that the availability of residential green spaces, as measured by metrics such as the NDVI and the presence of public green spaces, can significantly reduce perceived noise annoyance from road traffic and railway noise. These results generally agree with other findings across streets or lanes in single cities [4,14,38]. However, there is still a need for more large-scale studies, such as cross-city or nationwide studies [50]. This is because highly diverse population densities and urbanization levels among cities can largely shape the relationship between green space placement and environmental noise quality [35,51,52,53]. Several scholars have called for the development of comprehensive nationwide datasets that can be used to model the impacts of urban green spaces on noise exposure and annoyance [5,8]. They demonstrated the potential for data-driven, across-city assessments of the health burden associated with noncompliance exposure to noise. By expanding the geographical scope of research in this field, future studies could provide policymakers and urban planners with a more robust evidence base to support the integration of nature-based solutions into urban design and transportation planning.
3. Materials and Methods
3.1. Variable Establishment and Data Source
Traffic noise reduction was evaluated using municipal-level compliance rates from the total monitoring points in the host cities. A total of 31 cities or municipalities from mainland China were targeted over four years, from 2018 to 2021. The total point compliance rate was further divided into daytime and night-time monitoring records. Either existence indicates the reduction of noise to a level above the critical standard in half of a lunar day. Their increase in decline suggests a reduction or rise in traffic noise in spatiotemporal trends in the chosen cities. These two rates were taken as the dependent variables and were obtained from the panel records of annual reports on the prevention and control of noise pollution in China published by the Ministry of Ecology and Environment of the People’s Republic of China [54].
Independent variables were adapted using GSA in administrative zones of a host city, socioeconomic dimensions of the resident population at the end of a year, and GDP. GDP was further divided into three sectors and calculated as the proportional rates of the three industries. All data were obtained from the National Bureau of Statistics of the People’s Republic of China [55,56].
3.2. Calculation, Statistics and Mapping
Statistical analyses were performed using the SAS software 9.4 version (SAS Institute Inc., SAS Campus Drive, Cary, NC, USA). Raw data were analyzed as histograms using yearly records to detect their natural distribution patterns and make decisions for statistical models depending on the distribution. Analysis of variance (ANOVA) was used in mixed models to analyze data with repeated measures for specific cities over the years. Because most of the data failed to follow normal distribution patterns, mixed-model ANOVA was performed using ranked data and transformed back to calculating means and standard errors [19,20,57]. Co-efficient chronological variables were derived from either pandemic disparity (couples: 2018-2019 vs 2020-2021) or yearly dynamics (2018, 2019, 2020, 2021). When significant effects were detected, data were compared using their means in Duncan’s test at a significance level of 0.05. Whisker-box plots were used to reveal the comprehensive distribution of the raw data with marked key quantiles.
Regarding the necessity of creating a new metric synthesizing GSA and socioeconomic dimensions, a new parameter, namely the GAI, was regressed using MLR against variables of population, GDP, and third proportional GDPs in three industries. Spearman’s correlation was used to detect relationships between pairs of variables among green space features, socioeconomic dimensions, and traffic noise compliance rate. A Sankey correlation roadmap was used to visualize the correlations between the original independent variables and any of the GSA, GPC, and GAI, and their further correlations with compliance rates at day or night. The MLE was used to estimate the driving forces of all independent variables on compliance rates. Wald Chi-square (WCS) values were recorded to compare with Pr > Chi-square critical values to determine the estimated parameters.
The spatial distribution was mapped using ArcGIS software in Pro 10.8 edition (Esri Inc., Redlands, California, USA). Raw digital data on the map of China were obtained from Mapswire (Mapswire Project Office, Stefan Fischerländer, Osterhofen, Germany) under a Creative Commons (CC-BY 4.0) license. Provinces or municipalities are colored with the magnitudes of municipal-level data using records from the chosen city.
4. Results
4.1. Calculation of GAI Using Multivariate Linear Regression
The GSA was regressed using MLR against multiple independent variables of population, GDP, and the first, second, and third industrial proportions in GDP. The results are expressed in the following equations:
where GAI_T is the one-thousand-fold index of GAI and GDP_1 and GDP_3 are the 1st and 3rd industrial proportions of GDP, respectively.
GAI_T = 2.94×Population + 0.72×GDP – 5.98×GDP_1 – 0.78×GDP_3 – 232.32×Intercept
4.2. Attributes of Data About Urban Green Space and Socioeconomic Dimensions
The COVID pandemic or yearly dynamics had significant effects on population, GDP, GSA, GPC, and GAI (Table A1 and Table A2). Histogram showed a positive skewness in distribution of Population ranging between 80.90 and 3212.40 ×104 individuals with an average of 979.57±689.24 ×10⁴ individuals (mean ± standard error, the same to the following) (Figure 1A). Histogram of GDP also showed a positively skewed distribution pattern that ranged in CNY 0.05–4.32 × 10⁻¹ billion with an average of CNY 1.06±0.94 ×10⁻¹ billion (Figure 1B). Histogram of GSA had breakpoints for counting in 8–13 ha and GSA was averaged to be 3.09±3.47 ha in a range between 0.26 and 17.12 ha (Figure 1C). Histograms of GPC with GAI showed positive-skewness normal distributions, which ranged from 11.57–91.01 ha per capita and 0.24–9.44, respectively (Figure 1D, E).
The 1st industry accounted for decreasing GDP ratios from 2018 to 2020, which increased to 2.85% by 2021 (Figure 2). The 2nd industry proportion decreased from 2018 to 2019, increased in 2020, and decreased in 2021. The 3rd industry proportion also increased from 2018 to 2019, decreased in 2020, and increased in 2021.
4.3. Population Urbanizaiton Effects on Urban Green Space and Socioeconomic Dimensions
Population urbanization resulted in significant effects on urban green spaces and socioeconomic dimensions (Figure 3). GDP increased with the growth of urbanization level from medium and large cities (CNY 0.24±0.09 × 10⁻¹ billion), through metropolises (CNY 0.84±0.31 × 10⁻¹ billion), to megacities (CNY 1.95±0.87 × 10⁻¹ billion) (Figure 3A). Megacities had higher averaged GSA in megacities (5.67±4.93 ha) than in M&L cities (1.22±0.91 ha) and metropolises (2.13±0.65 ha) (Figure 3B). Averaged GPC was higher in medium and large cities (38.63±20.34 ha per capita) than in metropolises (26.66±7.22 ha per capita) (Figure 3C). Again, the average GAI increased with the growth of population from medium and large cities (0.88±0.30) through metropolises (2.34±0.28) to megacities (5.05±1.64) (Figure 3D).
4.4. Spatial Distributions of Urban Green Space and Socioeconomic Dimensions
Provincial regions at the western, central, and southern boundaries showed increasing trends with the growth of the year (Figure 4). Most provincial regions did not show an apparent trend of increase in GSA, except for Hubei and Zhejiang provinces because their GSAs showed increasing trends.
The GDP increased in Sichuan province from CNY ~7000 × 10-1 billion per city to ~30000 × 10-1 billion per city from 2018 to 2021 (Figure 5). During this period, GDP in Shanxi province also showed a tiny increase from CNY ~500 × 10-1 billion per city to over CNY 4000 × 10-1 billion per city from 2018 to 2019. Thereafter, the GDP in Shanxi stood to persist until 2021. From 2018 to 2021, the 1st industrial proportion of GDP increased in Inner Mongolia, Liaoning, Hubei, and Hunan Provinces. The 2nd industrial proportion fluctuated in many provincial regions of China from 2018 to 2021. For example, the 2nd industrial GDP proportion decreased in Sichuan Province from 2018 to 2019 and increased since 2020. Simultaneously, 2nd industrial GDP increased in Qinghai from 2018 to 2019 and decreased from 2020 to 2021. The 3rd industrial GDP increased, mainly in Hebei and Fujian provinces, from 2018 to 2021.
4.5. Effects of Pandemic and Yearly Dynamic on Compliance Rate
The experience of COVID pandemic increased the total point compliance rate in daytime (prior, 87.24±9.50%; experiencing, 93.80±4.53%) and night (prior, 55.78±13.43%; experiencing, 73.87±10.84%) records (Figure 6A, B). The total point compliance rate was not different between 2020 and 2021 for daytime (2020, 92.78±5.46%; 2021, 94.82±3.67%) and night (2020, 71.21±11.61%; 2021, 76.52±10.53%) records (Figure 6C, D). However, compliance rate in 2021 was higher than that in 2018 and 2019 for daytime (2018, 86.11±11.41%; 2019, 88.37±8.05%) and night (2018, 54.41±14.28%; 2019, 57.15±13.65%) records (Figure 6C, D).
4.6. Spatial Distributions of Daytime and Night Compliance Rates
Most provincial regions showed increases in daytime compliance rates from 2018 to 2021, such as changes in the provinces of the western, central, and southern parts of China (Figure 7). Night records of compliance rates increased in nearly all regions of China, except for Henan, Shannxi, and Jilin provinces.
4.7. Spatial Distributions of Daytime and Night Compliance Rates
All socioeconomic dimensions and GSA generated positive Spearman correlations with GAI (Figure 8A), which had a further negative correlation with compliance rate during the daytime (Figure 8B). In addition, GSA also showed a positive Spearman correlation with GPC, while the 1st industrial proportional GDP and population were negatively correlated. GPC had a positive correlation with the compliance rate during the daytime.
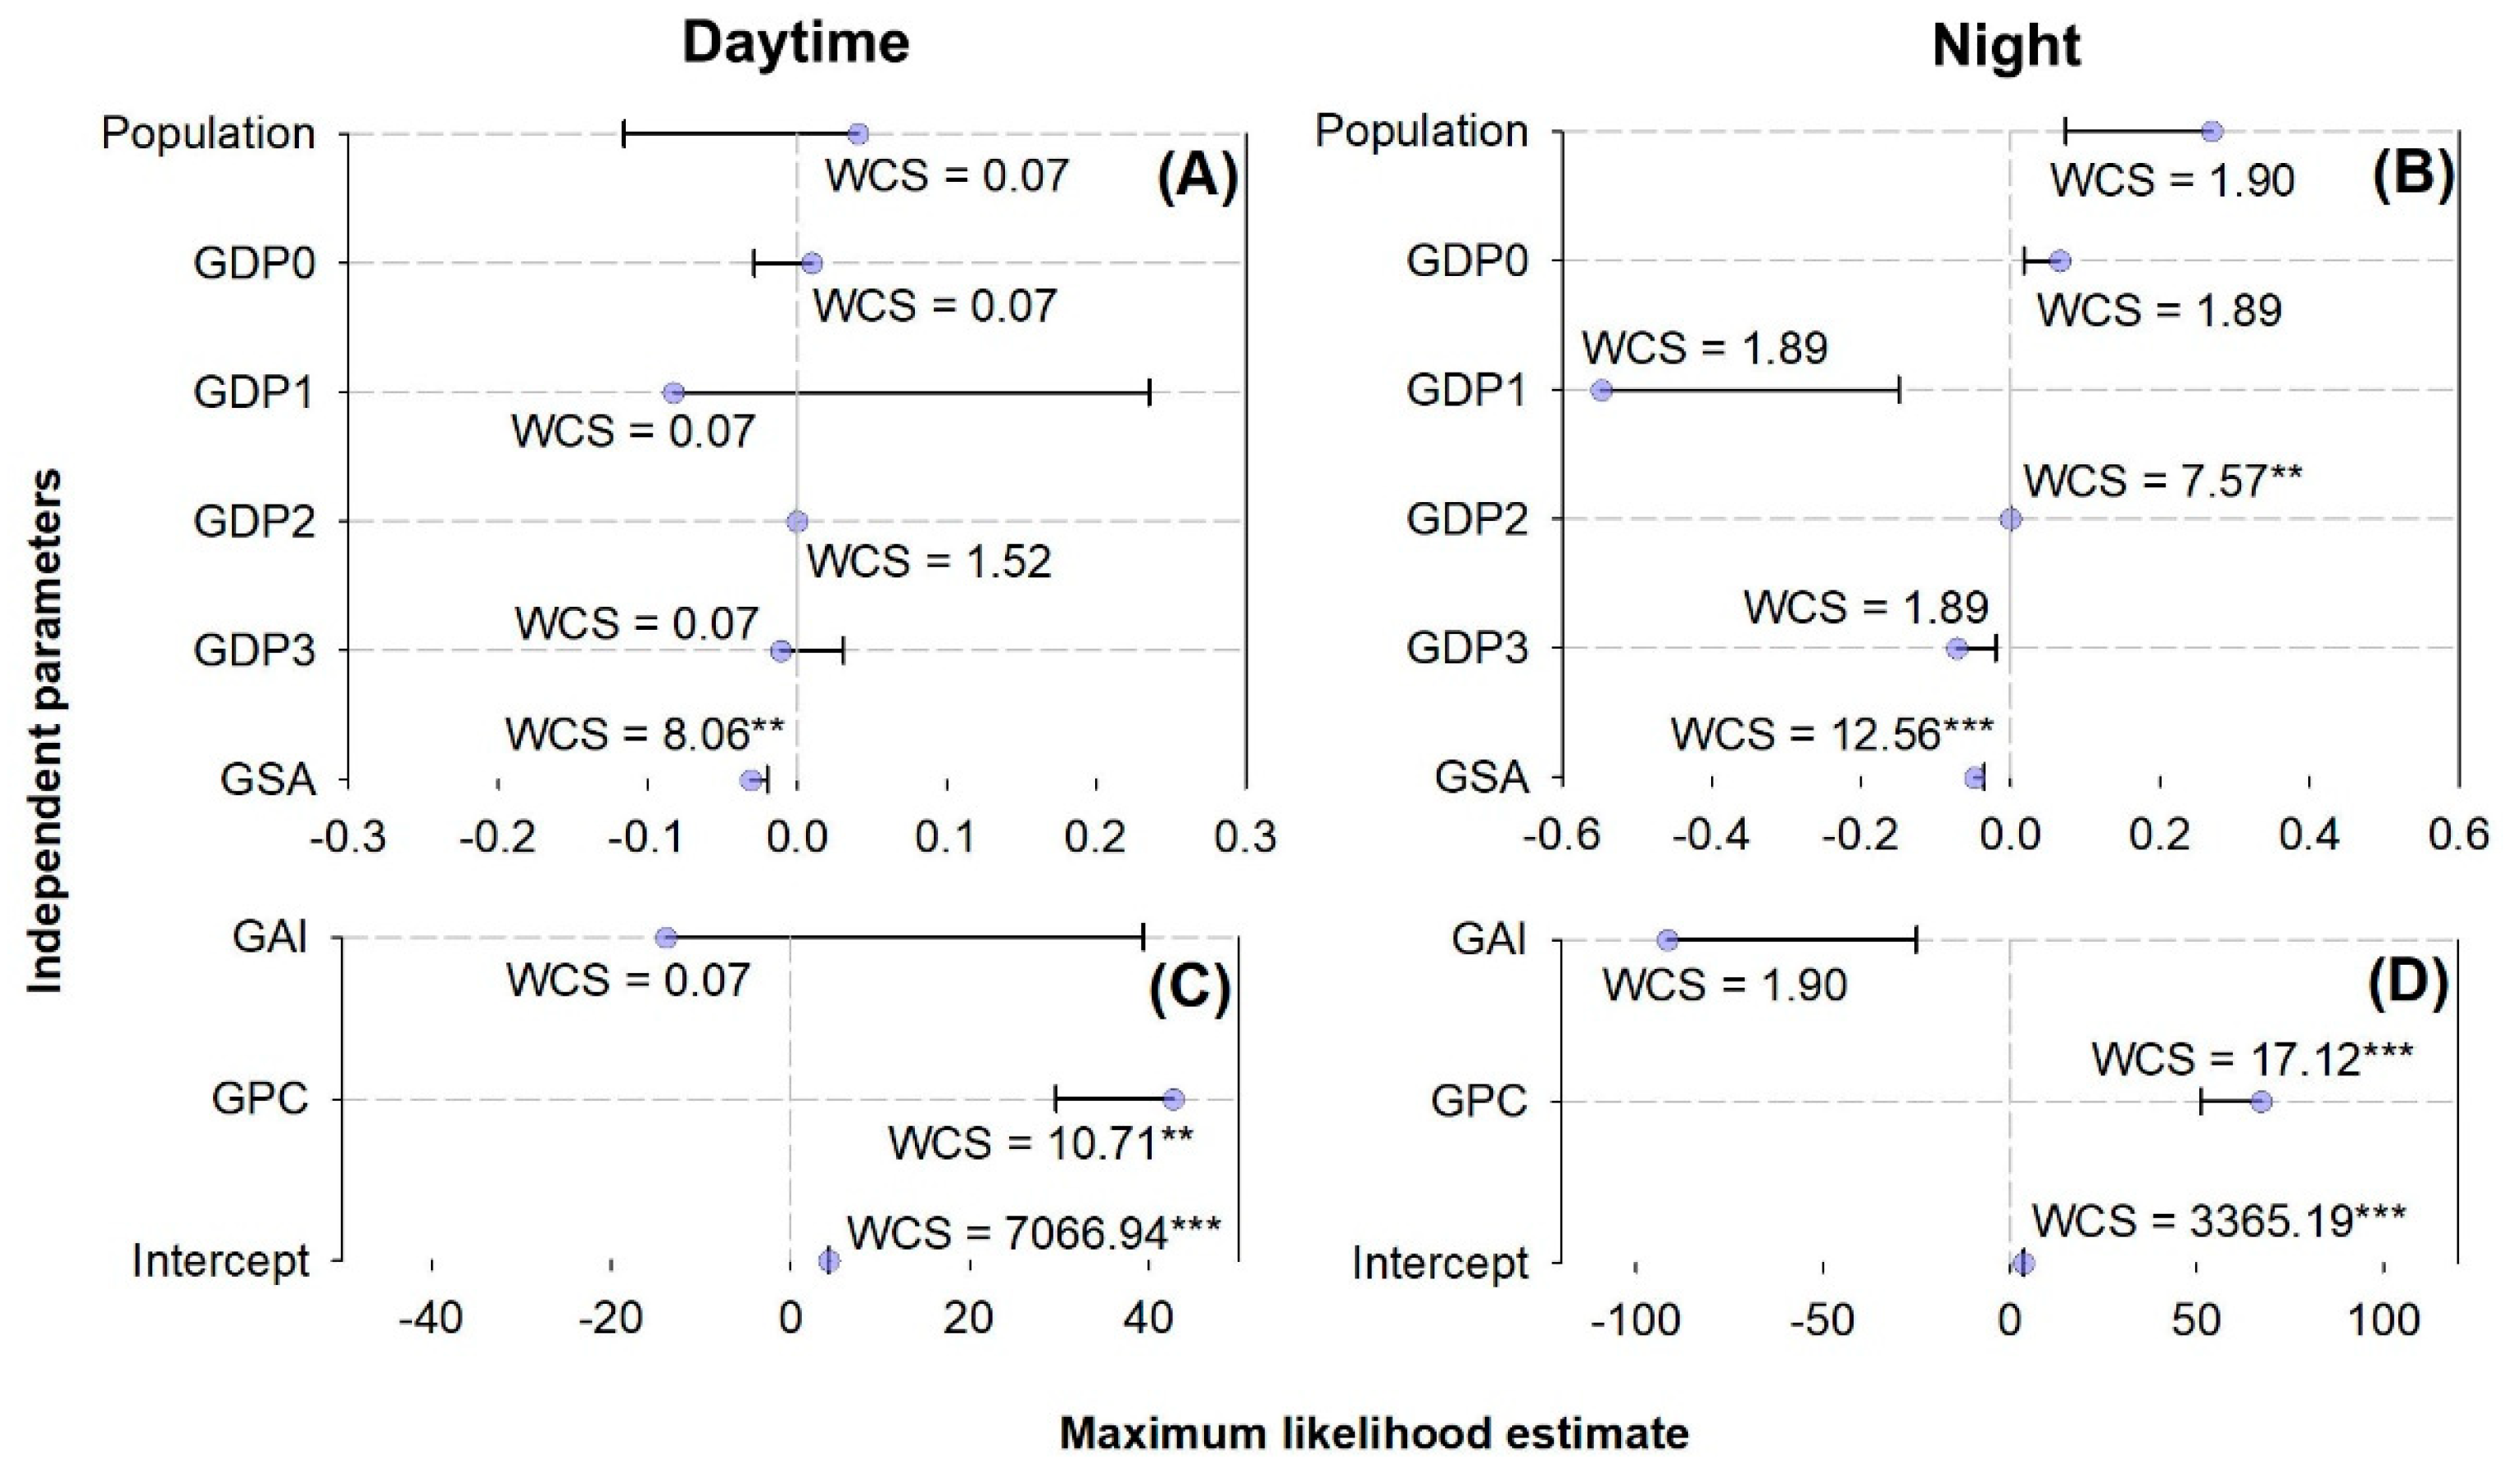
4.8. Maximum Likelihood Estimate of Compliance Rate
The maximum likelihood estimate indicated that GSA had negative contributions to daytime and nighttime compliance rates (Figure 9A), whereas GPC generated stronger positive contributions (Figure 9C and D). The 2nd industrial proportional GDP also made a small positive contribution to the night compliance rate (Figure 9B).
5. Discussion
5.1. Urban Green Space Area and Compliance Rate in Traffic noise
Our findings present a nuanced relationship between the GSA and traffic noise compliance rates. The negative contributions of the GSA to both daytime and nighttime compliance rates were revealed by the MLE modeling. This is in contrast with the generally accepted recognition that their relationship should be positive because of the essential function of green spaces and noise reduction [3,4,9,12,13]. Previous studies that have contributed to shaping this common recognition have mostly gauged the visual impact of greenery in reducing noise annoyance, regardless of whether sound insulation is used [4,13]. The attenuation of traffic noise is monitored by the spread of noise waves through physical barriers created by vegetation [38,47]. These results can be repeated by confirmative findings only when the points of data collection are highly controlled for the specific locations of host cities. For example, noise vibrations can be attenuated by the spread of sound waves at points immediately close to green hedges [38]. Noise barriers are located mostly along streets with large canopies connected among roadside trees that have functions to improve the comprehensive urban environment [35,37,45,58]. As the green space feature was adapted as the projected greening area of canopies, the sheer size of green spaces is unlikely to be the sole determinant of compliance. The spatial distribution and strategic placement of green spaces are likely to be more important factors influencing noise levels and compliance with mitigation strategies, considering proximity to traffic noise sources. The uneven distribution of urban green spaces across cities might leave many locational points of compliance monitoring away from big canopy roadside trees. This explains the absence of a consistent positive correlation, particularly in cities where a large total GSA still has areas with high noise exposure. Therefore, our findings suggest more complex location-specific green space planning rather than simply maximizing the total area, while previous research mainly supports a general recognition of the beneficial effect of green spaces on noise reduction. Overall, we cannot accept our initial hypothesis, which asserts that an increased GSA leads to higher compliance.
5.2. Socioeconomic Dimensions’ Effects on Compliance Rate in Urban Green Spaces
The interplay between the socioeconomic dimensions and compliance rates is multifaceted. The strong positive correlation between GPC and daytime compliance aligns with the expectation that wealthier cities are more likely to successfully implement and maintain noise reduction measures [35,37,52]. Our findings suggest that this was because wealthier cities obtained more enriched resources to support a more robust ability to build infrastructure to reduce traffic noise. This is supported by research showing a link between higher GDPs per capita and improved environmental quality [25,45]. In our study, GPC increased along with the urbanization gradient in the order of increasing population in medium and large cities, Metropolises, and Megacities. This further supports the trend of high urban environment quality in wealthier cities, suggesting efficient resource allocation to the urban forest sector for traffic noise reduction [45,53]. Conversely, the negative correlation between GAI and daytime compliance suggests that simply increasing the GSA without considering population density and regional economic status might be ineffective for noise reduction. This underscores the importance of spatial distribution of green spaces and strategic design [4,21,36]. The positive contribution of GPC to both daytime and night compliance rates in MLE modeling reinforces the importance of involving socioeconomic dimensions in evaluating driving factors beyond GSA. The modest positive contribution of the secondary industrial sector's GDP proportion to the night compliance rate merits further investigation in municipal zones of a city with night economic activities, consistent with current findings [50,59,60]. This also reflects the influence of specific industrial activities on night noise levels in manufacturing, construction, mining, and utility industries. These results largely support the second hypothesis as they show a positive association between socioeconomic factors and compliance. However, our findings also emphasize the importance of involving socioeconomic dimensions in facet evaluation, such as GPC, over GSA. Effective strategies require a balanced approach that considers both the total area and the per capita distribution of green spaces.
5.3. Dynamic Changes of Compliance Rate and the Effect of COVID-19 Pandemic
It is widely agreed that the COVID-19 pandemic significantly impacted traffic noise [21,22,23,24], which was reinforced by our study using increases in daytime and night compliance rates. Our findings during the pandemic align with previous studies reporting reduced noise pollution due to decreased human activity and traffic volume due to lockdown and quarantine events [21,22,23,24]. This supports the impact of reduced activity on compliance with noise reduction measures [21,22]. This is supported by yearly changes between the couple of years 2018 and 2019 and 2020–2021. The observed lack of difference between 2020 and 2021 suggests a waning effect as societal activities and traffic volume resume [24]. The spatial distribution of compliance rates during the entire period of 2018-2021 shows a generally increasing trend across China, reflecting progress in noise reduction efforts. However, notable regional variations persist, highlighting the influence of diverse economic and demographic conditions [51,52,53,58]. This supports the findings of Mueller et al. (2017a) [5] , Mueller et al. (2017b) [8], and Iungman et al. (2021) [25] about a regional disparity of noise pollution in different cities and regions. Hence, the third hypothesis can be partially accepted in the part asserting that the pandemic initially increased compliance; however, this effect was not sustained. This underscores the crucial role of human activity in determining noise levels.
5.4. Limits in This Study
Several limitations affect the interpretation of our findings. First, reliance on publicly available data may have limited the capture of finer details influencing green space characteristics and noise pollution. Second, the national scale of the analysis restricts the in-depth exploration of localized factors that might influence noise levels and compliance with noise-mitigation measures [5,8]. Third, the focus on daytime and night compliance may not fully represent the intricate temporal dynamics of noise exposure and human activity throughout the day [23]. Fourth, the chosen variables for characterizing urban green spaces may not fully capture the multifaceted nature of green spaces and their influence on noise reduction [14,38,47]. Future research should address these limitations for a more comprehensive understanding of the interactions between urban green spaces, socioeconomic factors, and human behavior in influencing noise compliance.
6. Conclusions
In this study, a nationwide investigation was conducted to detect the responses of traffic noise compliance rates to urban forest areas in cities of mainland China, which revealed a complex interplay between green space, socioeconomic factors, and the impact of the COVID-19 pandemic. Contrary to the general recognition formed by regional studies, the total greenspace area (GSA) showed a negative contribution to both daytime and nighttime compliance rates. Instead, GPC exhibited a strong positive correlation with daytime compliance, suggesting that the equitable distribution of green spaces is more crucial than solely considering sheer size. The COVID pandemic initially increased both daytime (from 87.24% to 93.80%) and nighttime (from 55.78% to 73.87%) compliance rates, likely due to reduced human activity and traffic volume. However, this effect did not persist beyond the initial period of the pandemic. Spatially, daytime compliance rates showed a generally increasing trend across China from 2018 to 2021, when night compliance rates increased in most regions where variations highlighted the influence of diverse socioeconomic and demographic conditions. In conclusion, effective noise mitigation strategies should prioritize equitable green space distribution (GPC) alongside socioeconomic considerations rather than solely focusing on maximizing the GSA. The temporary yet significant pandemic-induced increase in compliance underscores the importance of considering human behavior and adaptability in long-term urban planning to achieve sustainable noise reduction.
Author Contributions
Conceptualization, C.X.; methodology, C.X. and G.S.; software, G.S.; validation, C.X.; formal analysis, G.S.; investigation, G.S.; resources, G.S. and C.X.; data curation, G.S.; writing—original draft preparation, G.S.; writing—review and editing, C.X.; visualization, G.S.; supervision, C.X.; project administration, C.X.; funding acquisition, C.X. All authors have read and agreed to the published version of the manuscript.
Funding
This research was funded by Beijing Forestry University, grant number BLRC2023B06.
Data Availability Statement
Data are derived from the open sources: Ministry of Ecology and Environment of the People's Republic of China https://www.mee.gov.cn/hjzl/sthjzk/hjzywr/, Annual Statistical Bulletin of the National Economy and Social Development in China https://www.stats.gov.cn/sj/tjgb/ndtjgb/, Yeakbook of statistics in China from 1999 to 2024 https://www.stats.gov.cn/english/Statisticaldata/yearbook/.
Acknowledgments
Authors acknowledge referees and editors for their contributions to the improvement of article quality.
Conflicts of Interest
The authors declare no conflicts of interest.
Abbreviations
The following abbreviations are used in this manuscript:
| 3D | three-dimension |
| CNY | Chinese Yuan |
| COVID-19 | corona virus disease in 2019 |
| GDP | gross domestic product |
| GAI | greenspace area index |
| GSA | green space areas |
| GPC | per capita green space |
| LiDAR | light detection and ranging |
| MLE | maximum likelihood estimate |
| MLR | multivariate linear regression |
| NDVI | normalized difference vegetation index |
| WCS | Wald chi-square |
Appendix A
Appendix A.1

Table A1.
F values from analysis of variance (ANOVA) of city size (Size), COVID pandemic (Pandemic), and their interaction (Size × Pandemic) on socioeconomic dimensions of population, GDP, GSA, GPC, and GAI.
Table A1.
F values from analysis of variance (ANOVA) of city size (Size), COVID pandemic (Pandemic), and their interaction (Size × Pandemic) on socioeconomic dimensions of population, GDP, GSA, GPC, and GAI.
| Dimension | Size | Pandemic | Size × Pandemic |
| Population | 119.16*** 1 | 0.44 | 0.03 |
| GDP | 65.17*** | 0.83 | 0.11 |
| GDP_1 2 | 17.51*** | 0.42 | 0.05 |
| GDP_2 2 | 20.98*** | 1.64 | 0.59 |
| GDP_3 2 | 47.10*** | 0.67 | 0.10 |
| GSA | 24.59*** | 0.08 | 0.01 |
| GPC | 4.74** 1 | 0.03 | 0.03 |
| GAI | 119.17*** | 0.45 | 0.03 |
1 Number of asterisks indicate significance of effect: **, P < 0.01; ***, P < 0.001; 2 GDP_1, GDP_2, GDP_3 present proportional GDPs in the 1st, 2nd, 3rd industries, respectively.
Table A2.
F values from analysis of variance (ANOVA) of city size (Size), yearly dynamic (Year), and their interaction (Size × Year) on socioeconomic dimensions of population, GDP, GSA, GPC, and GAI.
Table A2.
F values from analysis of variance (ANOVA) of city size (Size), yearly dynamic (Year), and their interaction (Size × Year) on socioeconomic dimensions of population, GDP, GSA, GPC, and GAI.
| Dimension | Size | Year | Size × Year |
| Population | 113.14*** 1 | 0.15 | 0.01 |
| GDP | 62.47*** | 0.53 | 0.09 |
| GDP_1 2 | 17.51*** | 0.42 | 0.05 |
| GDP_2 2 | 20.40*** | 0.67 | 0.58 |
| GDP_3 2 | 45.09*** | 0.42 | 0.09 |
| GSA | 23.36*** | 0.03 | 0.02 |
| GPC | 4.50* 1 | 0.02 | 0.04 |
| GAI | 119.17*** | 0.45 | 0.03 |
1 Number of asterisks indicate significance of effect: *, P < 0.05; ***, P < 0.001; 2 GDP_1, GDP_2, GDP_3 present proportional GDPs in the 1st, 2nd, 3rd industries, respectively.
References
- Ho, T.P.; Stevenson, M.; Thompson, J.; Nguyen, T.Q. Urban typologies in Hanoi and impacts on street-level urban design, pollution and walking. In Proceedings of the 30th International Seminar on Urban Form Conference (ISUF), Univ Belgrade, Fac Architecture, Belgrade, Serbia, 4-9 September 2023; pp. 1580–1590. [Google Scholar]
- de Morais, M.B.; Mesquita, A.O.; da Silva, B.M.D. Preliminary Study Towards the Integration of Brazil's Linear Parks into Urban Sustainable Mobility System. In Proceedings of the 12th International Conference on Innovation in Urban and Regional Planning (INPUT), Univ LAquila, Italy, 4-9 September 2023; pp. 669–680. [Google Scholar]
- Gidlöf-Gunnarsson, A.; Öhrström, E. Noise and well-being in urban residential environments: The potential role of perceived availability to nearby green areas. Landscape and Urban Planning 2007, 83, 115–126. [Google Scholar] [CrossRef]
- Van Renterghem, T.; Botteldooren, D. View on outdoor vegetation reduces noise annoyance for dwellers near busy roads. Landscape and Urban Planning 2016, 148, 203–215. [Google Scholar] [CrossRef]
- Mueller, N.; Rojas-Rueda, D.; Basagaña, X.; Cirach, M.; Cole-Hunter, T.; Dadvand, P.; Donaire-Gonzalez, D.; et al. Urban and Transport Planning Related Exposures and Mortality: A Health Impact Assessment for Cities. Environmental health perspectives 2017, 125, 89–96. [Google Scholar] [CrossRef] [PubMed]
- Koprowska, K.; Łaszkiewicz, E.; Kronenberg, J.; Marcińczak, S. Subjective perception of noise exposure in relation to urban green space availability. Urban Forestry & Urban Greening 2018, 31, 93–102. [Google Scholar] [CrossRef]
- An, B.-Y.; Wang, D.; Liu, X.-J.; Guan, H.-M.; Wei, H.-X.; Ren, Z.-B. The effect of environmental factors in urban forests on blood pressure and heart rate in university students. Journal of Forest Research 2019, 24, 27–34. [Google Scholar] [CrossRef]
- Mueller, N.; Rojas-Rueda, D.; Basagaña, X.; Cirach, M.; Cole-Hunter, T.; Dadvand, P.; Donaire-Gonzalez, D.; et al. Health impacts related to urban and transport planning: A burden of disease assessment. Environment International 2017, 107, 243–257. [Google Scholar] [CrossRef]
- Dzhambov, A.M.; Markevych, I.; Tilov, B.; Arabadzhiev, Z.; Stoyanov, D.; Gatseva, P.; Dimitrova, D.D. Lower Noise Annoyance Associated with GIS-Derived Greenspace: Pathways through Perceived Greenspace and Residential Noise. International Journal of Environmental Research and Public Health 2018, 15, 1533. [Google Scholar] [CrossRef] [PubMed]
- Althaus, H.-J.; de Haan, P.; Scholz, R.W. Traffic noise in LCA. The International Journal of Life Cycle Assessment 2009, 14, 560–570. [Google Scholar] [CrossRef]
- Khan, D.; Burdzik, R. A review on different regulation for the measurement of transport noise and vibration. Journal of Measurements in Engineering 2023, 11, 196–213. [Google Scholar] [CrossRef]
- Klingberg, J.; Broberg, M.; Strandberg, B.; Thorsson, P.; Pleijel, H. Influence of urban vegetation on air pollution and noise exposure – A case study in Gothenburg, Sweden. Science of The Total Environment 2017, 599-600, 1728–1739. [Google Scholar] [CrossRef]
- Van Renterghem, T. Towards explaining the positive effect of vegetation on the perception of environmental noise. Urban Forestry & Urban Greening 2019, 40, 133–144. [Google Scholar] [CrossRef]
- Van Renterghem, T.; Botteldooren, D.; Verheyen, K. Road traffic noise shielding by vegetation belts of limited depth. Journal of Sound and Vibration 2012, 331, 2404–2425. [Google Scholar] [CrossRef]
- Watts, G. The effects of “greening” urban areas on the perceptions of tranquillity. Urban Forestry & Urban Greening 2017, 26, 11–17. [Google Scholar] [CrossRef]
- Huang, S.Y.; Zhu, J.J.; Zhai, K.B.; Wang, Y.; Wei, H.X.; Xu, Z.H.; Gu, X.R. Do Emotional Perceptions of Visible Greeneries Rely on the Largeness of Green Space? A Verification in Nanchang, China. Forests 2022, 13, 1192. [Google Scholar] [CrossRef]
- Yan, Q.Y.; Sun, Y.X. Mapping perceived sentiments in university campuses with varied landscape metrics and climatic conditions. Frontiers in Psychology 2024, 15, 1467966. [Google Scholar] [CrossRef] [PubMed]
- Kowalska-Koczwara, A.; Pachla, F.; Tatara, T.; Nering, K. Green Areas in the City as an Element of Noise Protection. IOP Conference Series: Materials Science and Engineering 2021, 1203, 032025. [Google Scholar] [CrossRef]
- He, Q.; Wang, Y.; Qiu, Q.; Su, Y.; Wei, H.; Li, J. Posted Sentiments toward Experiences in Degraded Forests Are Shaped Jointly by Landscape Structure and Microclimate. Ecosystem Health and Sustainability 2023, 9, 0004. [Google Scholar] [CrossRef]
- Wei, H.; Ma, B.; Hauer, R.J.; Liu, C.; Chen, X.; He, X. Relationship between environmental factors and facial expressions of visitors during the urban forest experience. Urban Forestry & Urban Greening 2020, 53, 126699. [Google Scholar] [CrossRef]
- Rumpler, R.; Venkataraman, S.; Göransson, P. An observation of the impact of COVID-19 recommendation measures monitored through urban noise levels in central Stockholm, Sweden. Sustainable Cities and Society 2020, 63, 102469. [Google Scholar] [CrossRef]
- Rumpler, R.; Venkataraman, S.; Göransson, P. Noise measurements as a proxy to evaluating the response to recommendations in times of crisis: An update analysis of the transition to the second wave of the CoViD-19 pandemic in Central Stockholm, Swedena). The Journal of the Acoustical Society of America 2021, 149, 1838–1842. [Google Scholar] [CrossRef]
- Amoatey, P.; Al-Harthy, I.; Al-Jabri, K.; Al-Mamun, A.; Baawain, M.S.; Al-Mayahi, A. Impact of COVID-19 pandemic on aircraft noise levels, annoyance, and health effects in an urban area in Oman. Environmental Science and Pollution Research 2022, 29, 23407–23418. [Google Scholar] [CrossRef] [PubMed]
- Antza, C.; Stabouli, S. Reduction in environmental noise during COVID-19 pandemic and cardiovascular disease: A mystery for further investigation. Journal of Clinical Hypertension 2020, 22, 1947–1948. [Google Scholar] [CrossRef] [PubMed]
- Iungman, T.; Khomenko, S.; Nieuwenhuijsen, M.; Barboza, E.P.; Ambros, A.; Padilla, C.; Mueller, N. The impact of urban and transport planning on health: Assessment of the attributable mortality burden in Madrid and Barcelona and its distribution by socioeconomic status. Environmental Research 2021, 196, 110988. [Google Scholar] [CrossRef] [PubMed]
- Khan, D.; Burdzik, R. Measurement and analysis of transport noise and vibration: A review of techniques, case studies, and future directions. Measurement 2023, 220, 113354. [Google Scholar] [CrossRef]
- Chernyaev, I.; Oleshchenko, E.; Danilov, I. Methods for continuous monitoring of compliance of vehicles’ technical condition with safety requirements during operation. Transportation Research Procedia 2020, 50, 77–85. [Google Scholar] [CrossRef]
- Makarova, I.; Gabsalikhova, L.; Gritsenko, A. Improvement of environmental compliance of urban transport system through enlarging fleet of gas-engine municipal machinery. Transportation Research Procedia 2020, 50, 405–413. [Google Scholar] [CrossRef]
- Schäffer, B.; Brink, M.; Schlatter, F.; Vienneau, D.; Wunderli, J.M. Residential green is associated with reduced annoyance to road traffic and railway noise but increased annoyance to aircraft noise exposure. Environment International 2020, 143, 105885. [Google Scholar] [CrossRef]
- Uebel, K.; Marselle, M.; Dean, A.J.; Rhodes, J.R.; Bonn, A. Urban green space soundscapes and their perceived restorativeness. People and Nature 2021, 3, 756–769. [Google Scholar] [CrossRef]
- Jeon, J.Y.; Jo, H.I. Effects of audio-visual interactions on soundscape and landscape perception and their influence on satisfaction with the urban environment. Building and Environment 2020, 169, 106544. [Google Scholar] [CrossRef]
- Mago, J. ; Sunali; Negi, A., Bolton, J.S., Fatima, S. Sound Insulation: Key Concepts and Technologies. In Handbook of Vibroacoustics, Noise and Harshness, Gautam, C., Rab, S., Wan, M., Agarwal, R., Yadav, S., Eds.; Springer Nature Singapore: Singapore, 2024; pp. 1–44. [Google Scholar]
- Habibi, S. Improving building envelope performance with respect to thermal, sound insulation, and lighting: a case study. Building Acoustics 2019, 26, 243–262. [Google Scholar] [CrossRef]
- Paull, N.; Krix, D.; Torpy, F.; Irga, P. Can Green Walls Reduce Outdoor Ambient Particulate Matter, Noise Pollution and Temperature? International Journal of Environmental Research and Public Health 2020, 17, 5084. [Google Scholar] [CrossRef]
- Liu, Y.; Cao, Z.; Wei, H.; Guo, P. Decoding prediction of PM2.5 against jointly street-tree canopy size and running vehicle density using big data in streetscapes. Urban Climate 2025, 59, 102282. [Google Scholar] [CrossRef]
- Chung, W.K.; Leung, T.M.; Chau, C.K.; Tang, S.K. Comparing the effects of visibility of different neighborhood greenery settings on the preference ratings and noise annoyance responses to road traffic noises. Applied Acoustics 2020, 169, 107474. [Google Scholar] [CrossRef]
- Liu, Y.; Cao, Z.; Wei, H.; Guo, P. Optimizing Spatial Distribution of Retail Shops against Neighborhood Tree Canopy Shade Using Big Data Extracted from Streetscape. Land 2024, 13, 1249. [Google Scholar] [CrossRef]
- Biocca, M.; Gallo, P.; Di Loreto, G.; Imperi, G.; Pochi, D.; Fornaciari, L. Noise attenuation provided by hedges. Journal of Agricultural Engineering 2019, 50, 113–119. [Google Scholar] [CrossRef]
- Haapakangas, A.; Hongisto, V.; Oliva, D. Audio-visual interaction in perception of industrial plants – Effects of sound level and the degree of visual masking by vegetation. Applied Acoustics 2020, 160, 107121. [Google Scholar] [CrossRef]
- Wickramathilaka, N.; Ujang, U. 3D Kriging interpolation for traffic noise visualization: designing noise observation points and valuation of spatial interpolation accuracy. IOP Conference Series: Earth and Environmental Science 2023, 1274, 012001. [Google Scholar] [CrossRef]
- Wickramathilaka, N.; Ujang, U.; Azri, S.; Choon, T.L. Calculation of Road Traffic Noise, Development of Data, and Spatial Interpolations for Traffic Noise Visualization in Three-dimensional Space. Geomatics and Environmental Engineering 2023, 17, 61–85. [Google Scholar] [CrossRef]
- Wickramathilaka, N.; Ujang, U.; Azri, S.; Choon, T.L. Performance assessment of spatial interpolations for traffic noise mapping on undulating and level terrain. Geodesy and Cartography 2024, 50, 35–42. [Google Scholar] [CrossRef]
- Makarova, I.; Boyko, A.; Almetova, Z. Decision-making on development of cycling infrastructure through safety assessment at design and operation stages. Transportation Research Procedia 2020, 50, 397–404. [Google Scholar] [CrossRef]
- Buldeo Rai, H.; van Lier, T.; Meers, D.; Macharis, C. Improving urban freight transport sustainability: Policy assessment framework and case study. Research in Transportation Economics 2017, 64, 26–35. [Google Scholar] [CrossRef]
- He, Q.; Wang, Y.; Qiu, Q.; Su, Y.; Wang, Y.; Wei, H.; Li, J. Joint effects of air PM2.5 and socioeconomic dimensions on posted emotions of urban green space visitors in cities experiencing population urbanization: A pilot study on 50 cities of East China. Science of The Total Environment 2023, 861, 160607. [Google Scholar] [CrossRef] [PubMed]
- Rey Gozalo, G.; Barrigón Morillas, J.M.; Montes González, D.; Atanasio Moraga, P. Relationships among satisfaction, noise perception, and use of urban green spaces. Science of The Total Environment 2018, 624, 438–450. [Google Scholar] [CrossRef]
- Wickramathilaka, N.; Ujang, U.; Azri, S. Improving Traffic-noise-mitigation Strategies with LiDAR-based 3D Tree-canopy Analysis. Geomatics and Environmental Engineering 2024, 18, 81–103. [Google Scholar] [CrossRef]
- Yang, Y.; Yu, M. Study on the noise reduction effect of vegetation communities in Northeast China - Taking forest park in Yingkou city as an example. In Proceedings of the UPRE 2024; 2024; p. 02005. [Google Scholar]
- Zhang, J.; Yang, Z.; Sun, Y.X.; Xu, Z.H.; Hui, T.F.; Guo, P. Experiencing urban forests for mitigation of negative emotions of people exposed to seasonal PM2.5 in Northeast China. Journal of Forestry Research 2023, 34, 1245–1261. [Google Scholar] [CrossRef]
- Ren, W.; Lu, P.; Wang, Y.; Hong, X.-C. Understanding the association between urban noise and nighttime light in China. Scientific Reports 2024, 14, 31472. [Google Scholar] [CrossRef] [PubMed]
- Wei, H.X.; Hauer, R.J.; Sun, Y.X.; Meng, L.Q.; Guo, P. Emotional perceptions of people exposed to green and blue spaces in forest parks of cities at rapid urbanization regions of East China. Urban Forestry & Urban Greening 2022, 78, 127772. [Google Scholar] [CrossRef]
- Chen, C.; Wang, X.; Wei, H.; Liu, Y.; Cao, Z.; Guo, P. Health-Related Parameterization Evaluating Thermal Comfort in Urban Green Spaces: Data Sourced from a Global Database and Mapping at National Scale. Forests 2024, 15, 1892. [Google Scholar] [CrossRef]
- Wang, X.P.; Meng, L.Q.; Liu, Y.F.; Wei, H.X. Facial Expressions of Urban Forest Visitors Jointly Exposed to Air Pollution and Regional Climate. Forests 2023, 14, 1571. [Google Scholar] [CrossRef]
- Mnistry of Ecology and Environment of the People's Republic of China. Annual Report on Prevention and Control of Noise Pollution in China. Available online: https://www.mee.gov.cn/hjzl/sthjzk/hjzywr/ (accessed on 22 January 2025).
- National Bureau of Statistics of People's Republic of China. Annual Statistical Bulletin of the National Economy and Social Development in China. Available online: https://www.stats.gov.cn/sj/tjgb/ndtjgb/ (accessed on 22 January 2025).
- National Bureau of Statistics of People's Republic of China. Yeakbook of statistics from 1999 to 2024. Available online: https://www.stats.gov.cn/english/Statisticaldata/yearbook/ (accessed on 22 January 2025).
- Wei, H.X.; Hauer, R.J.; He, X.Y. A forest experience does not always evoke positive emotion: A pilot study on unconscious facial expressions using the face reading technology. Forest Policy and Economics 2021, 123. [Google Scholar] [CrossRef]
- Liu, Y.; Zhang, X.; Wei, H.; Cao, Z.; Guo, P. “Sadness smile” curve: Processing emotional information from social network for evaluating thermal comfort perception. Journal of Thermal Biology 2025, 127, 104025. [Google Scholar] [CrossRef] [PubMed]
- Hong, T.K.; Lee, J.; Lee, G.; Lee, J.; Park, S. Correlation between Ambient Seismic Noises and Economic Growth. Seismological Research Letters 2020, 91, 2343–2354. [Google Scholar] [CrossRef]
- Wang, C.; Meng, W.; Hou, X. The impact of high-speed rails on urban economy: An investigation using night lighting data of Chinese cities. Research in Transportation Economics 2020, 80, 100819. [Google Scholar] [CrossRef]
Figure 1.
Histograms and yearly dynamics of population (A), GDP (B), GSA (C), GPC (D), and GAI (E). Error bars represent standard errors.
Figure 1.
Histograms and yearly dynamics of population (A), GDP (B), GSA (C), GPC (D), and GAI (E). Error bars represent standard errors.
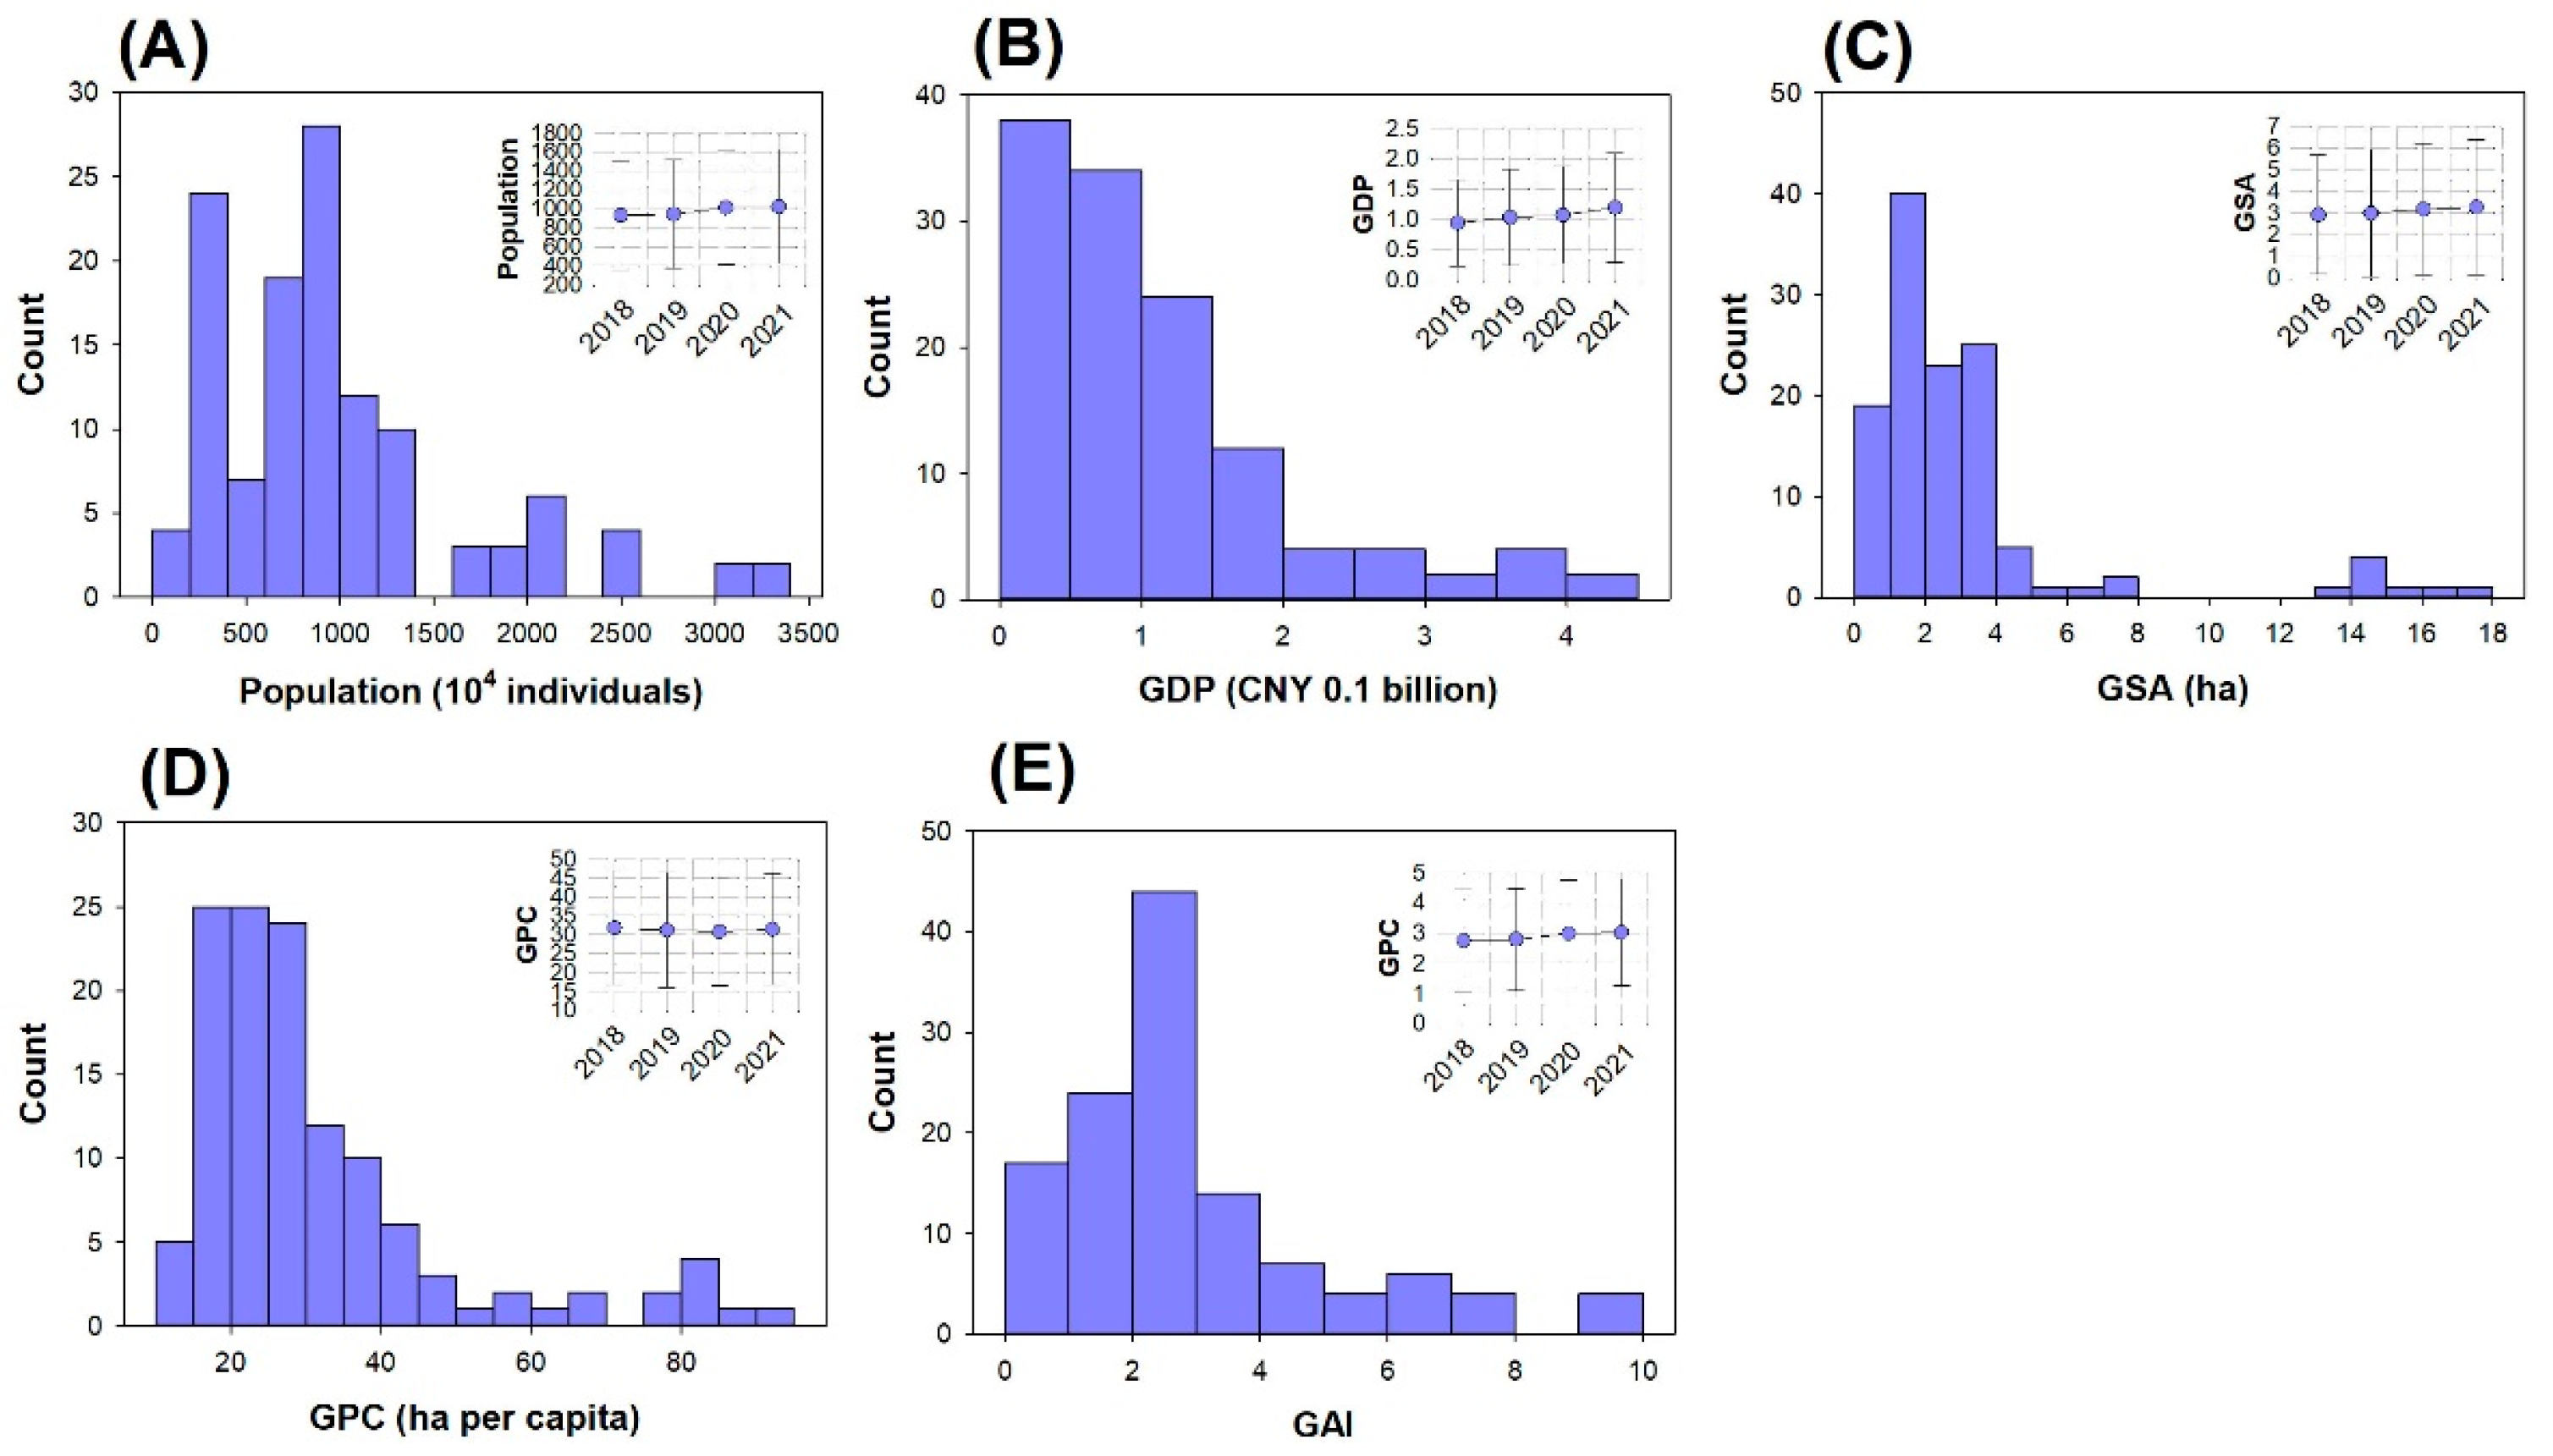
Figure 2.
Proportions of GDP in the first (1st), second (2nd), third (3rd) industries from 2018 to 2021.
Figure 2.
Proportions of GDP in the first (1st), second (2nd), third (3rd) industries from 2018 to 2021.
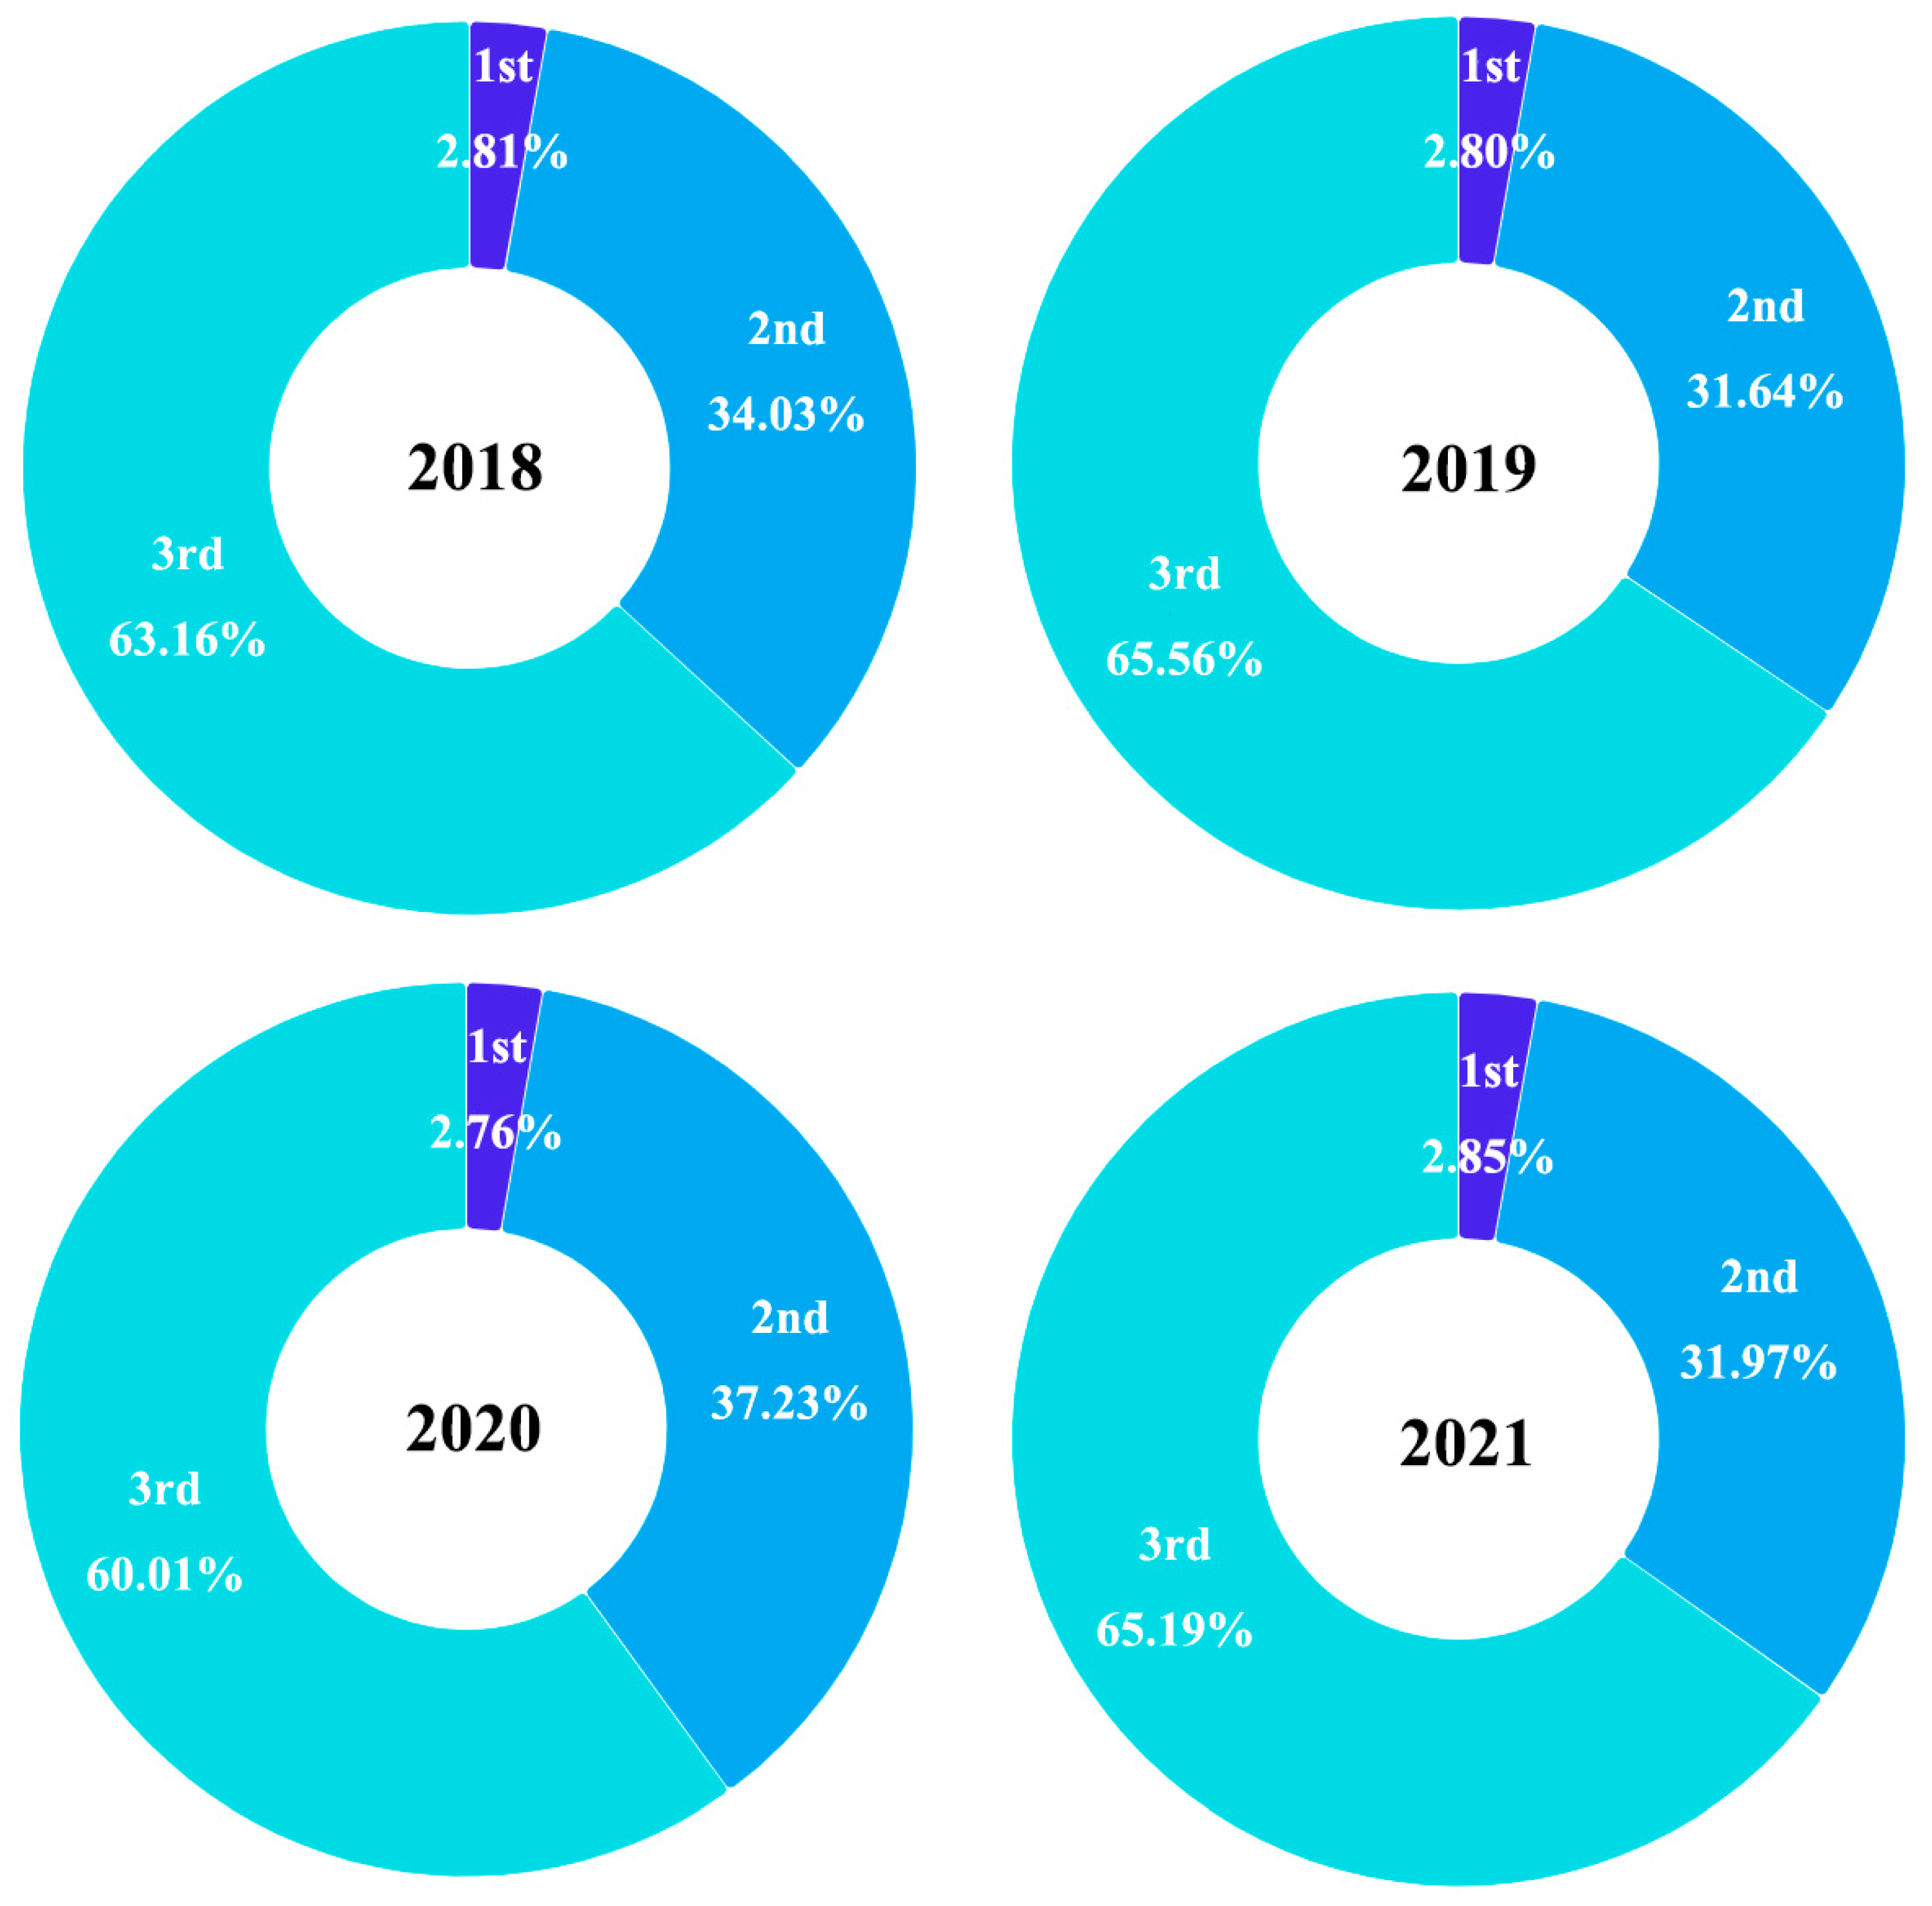
Figure 3.
Whisker box plots of urban green space and socioeconomic dimensions of GDP (A), GSA (B), GPC (C), and GAI (D) in response to population urbanization in cities of medium and large sizes (M and L), metropolises (Metro), and megacities (Mega). Black dots mark the range framed in the upper and lowest limits of the data, within which whiskers present the range of 5% and 95% quantiles. The box presents ranges across the 25% and 75% quantiles, and the full line inside marks the median value. Different letters represent significant differences in the mean values for each urbanization group.
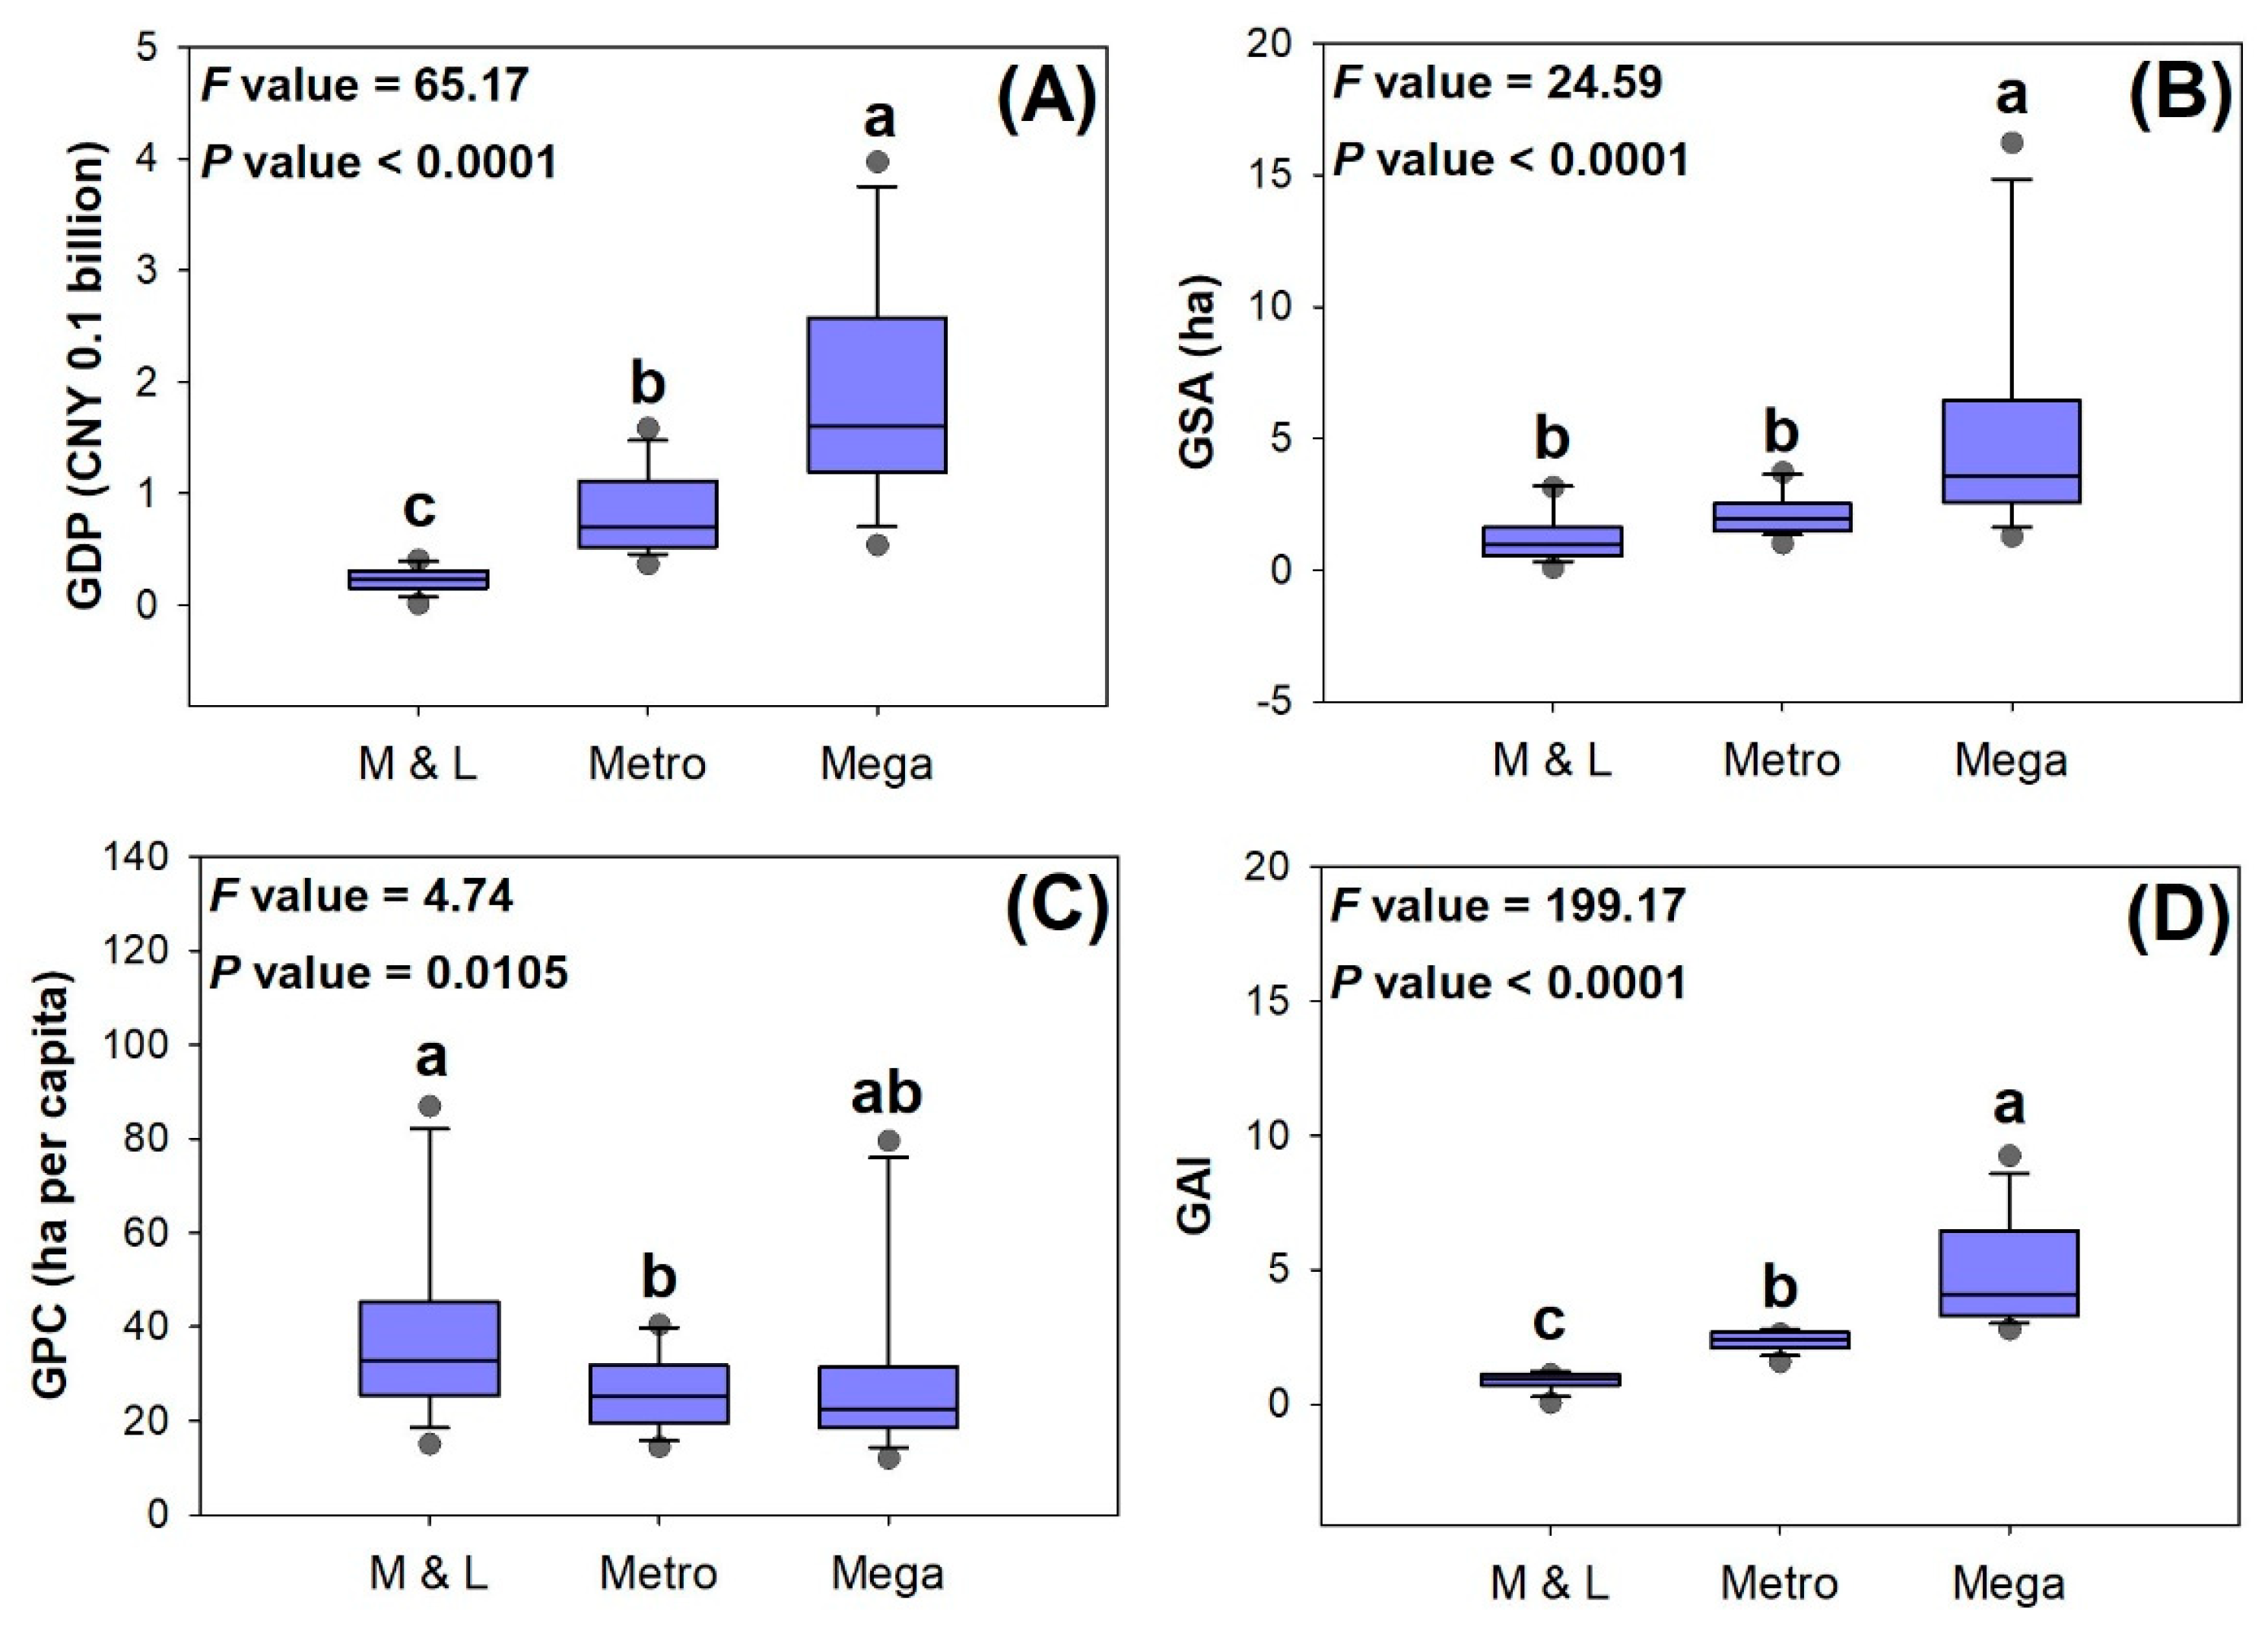
Figure 4.
Spatial distributions of population and GSA in provincial zones of mainland China in 2018, 2019, 2020, and 2021.
Figure 4.
Spatial distributions of population and GSA in provincial zones of mainland China in 2018, 2019, 2020, and 2021.
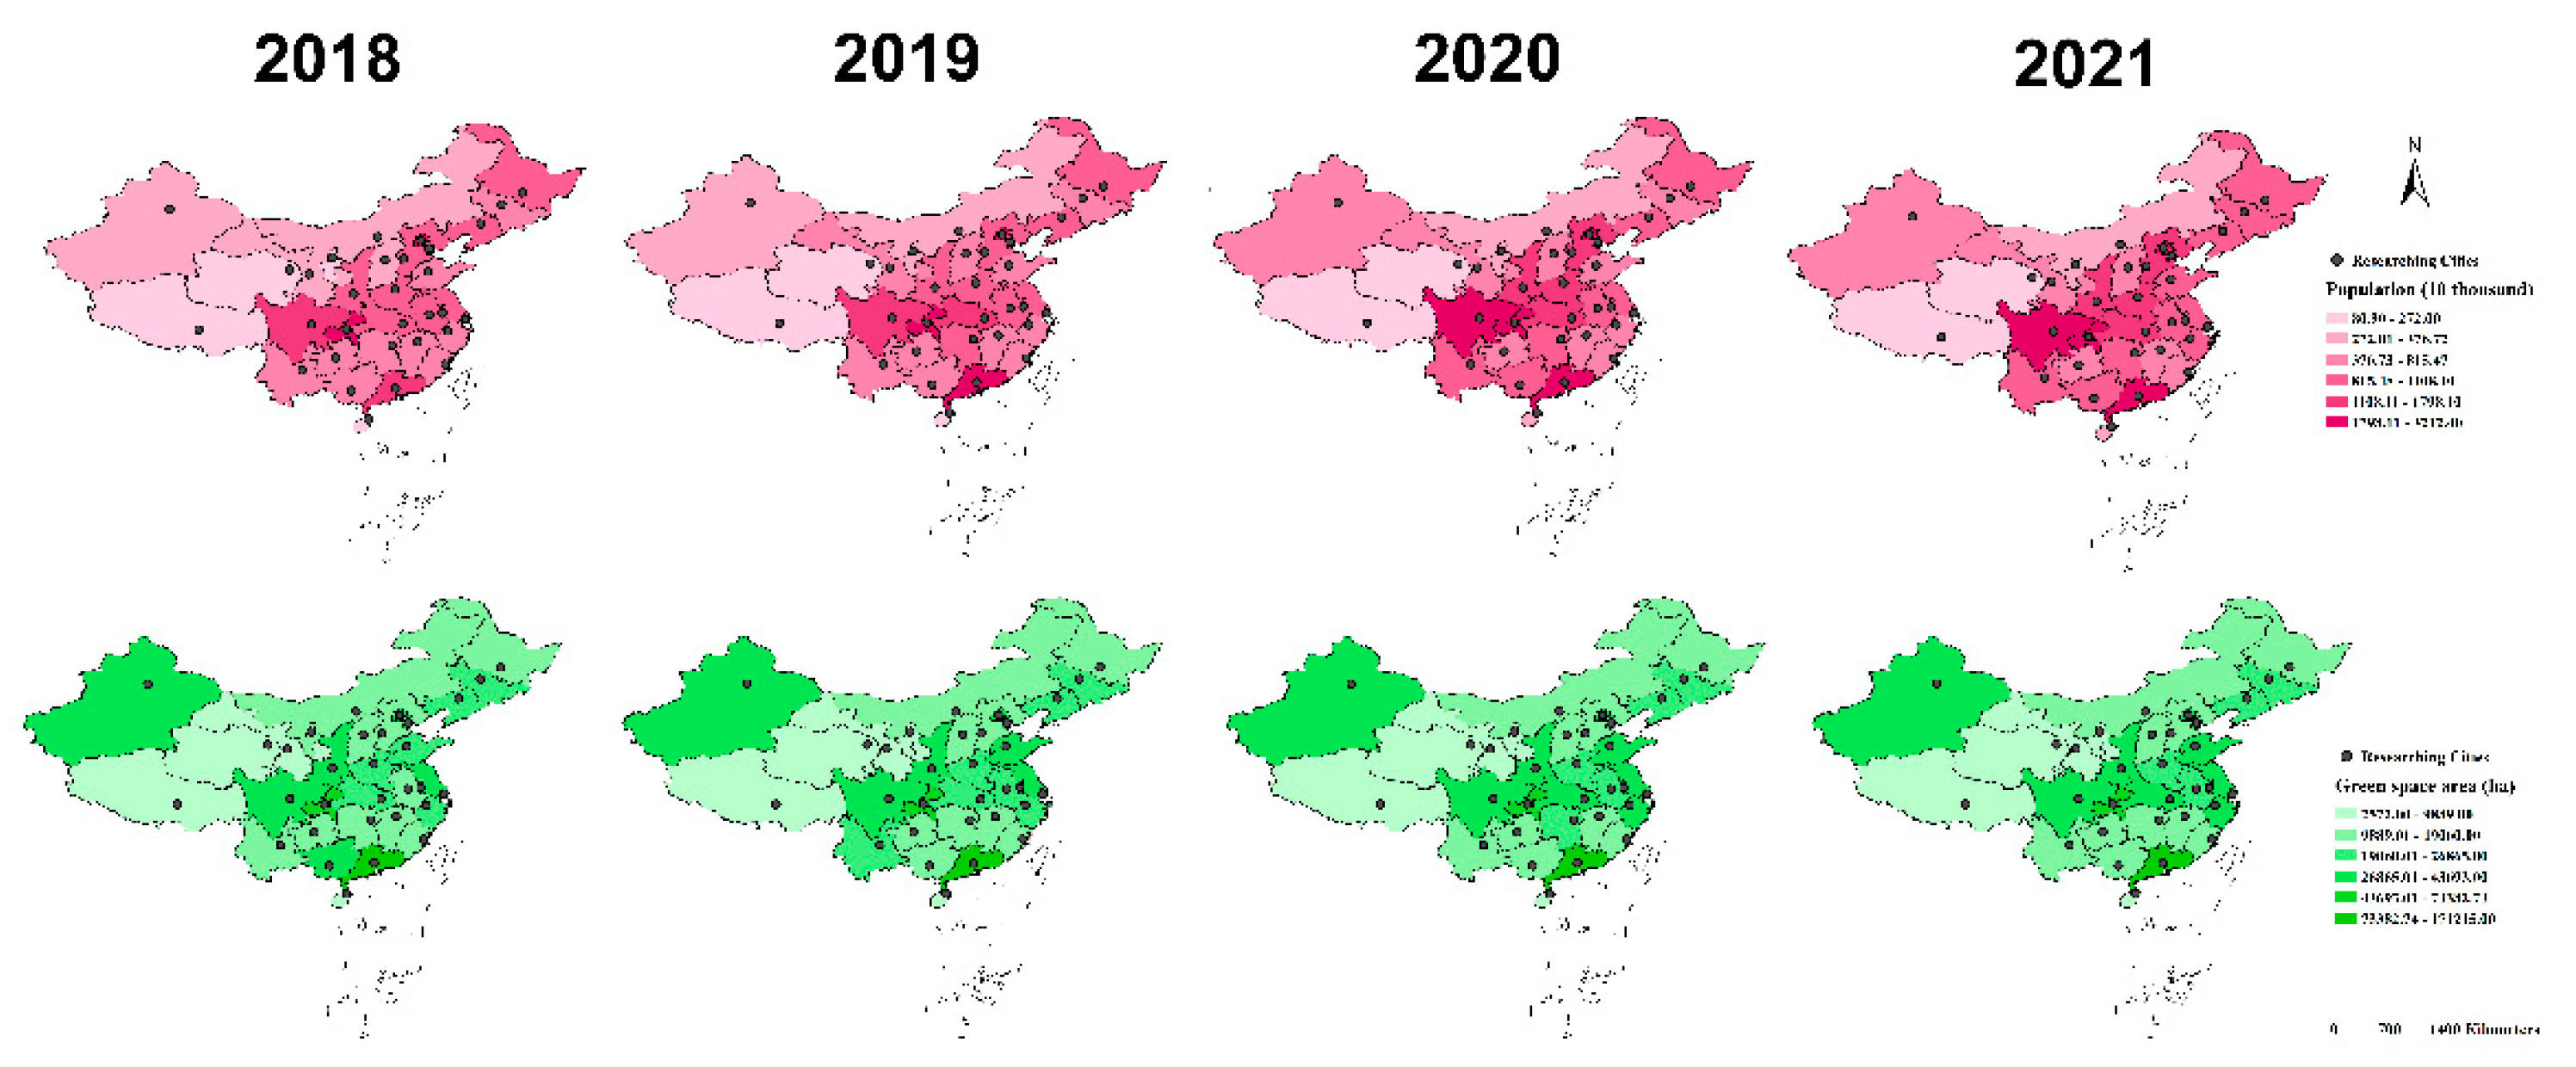
Figure 5.
Spatial distributions of GDP and the three industrial proportions in provincial zones of mainland China in 2018, 2019, 2020, and 2021.
Figure 5.
Spatial distributions of GDP and the three industrial proportions in provincial zones of mainland China in 2018, 2019, 2020, and 2021.
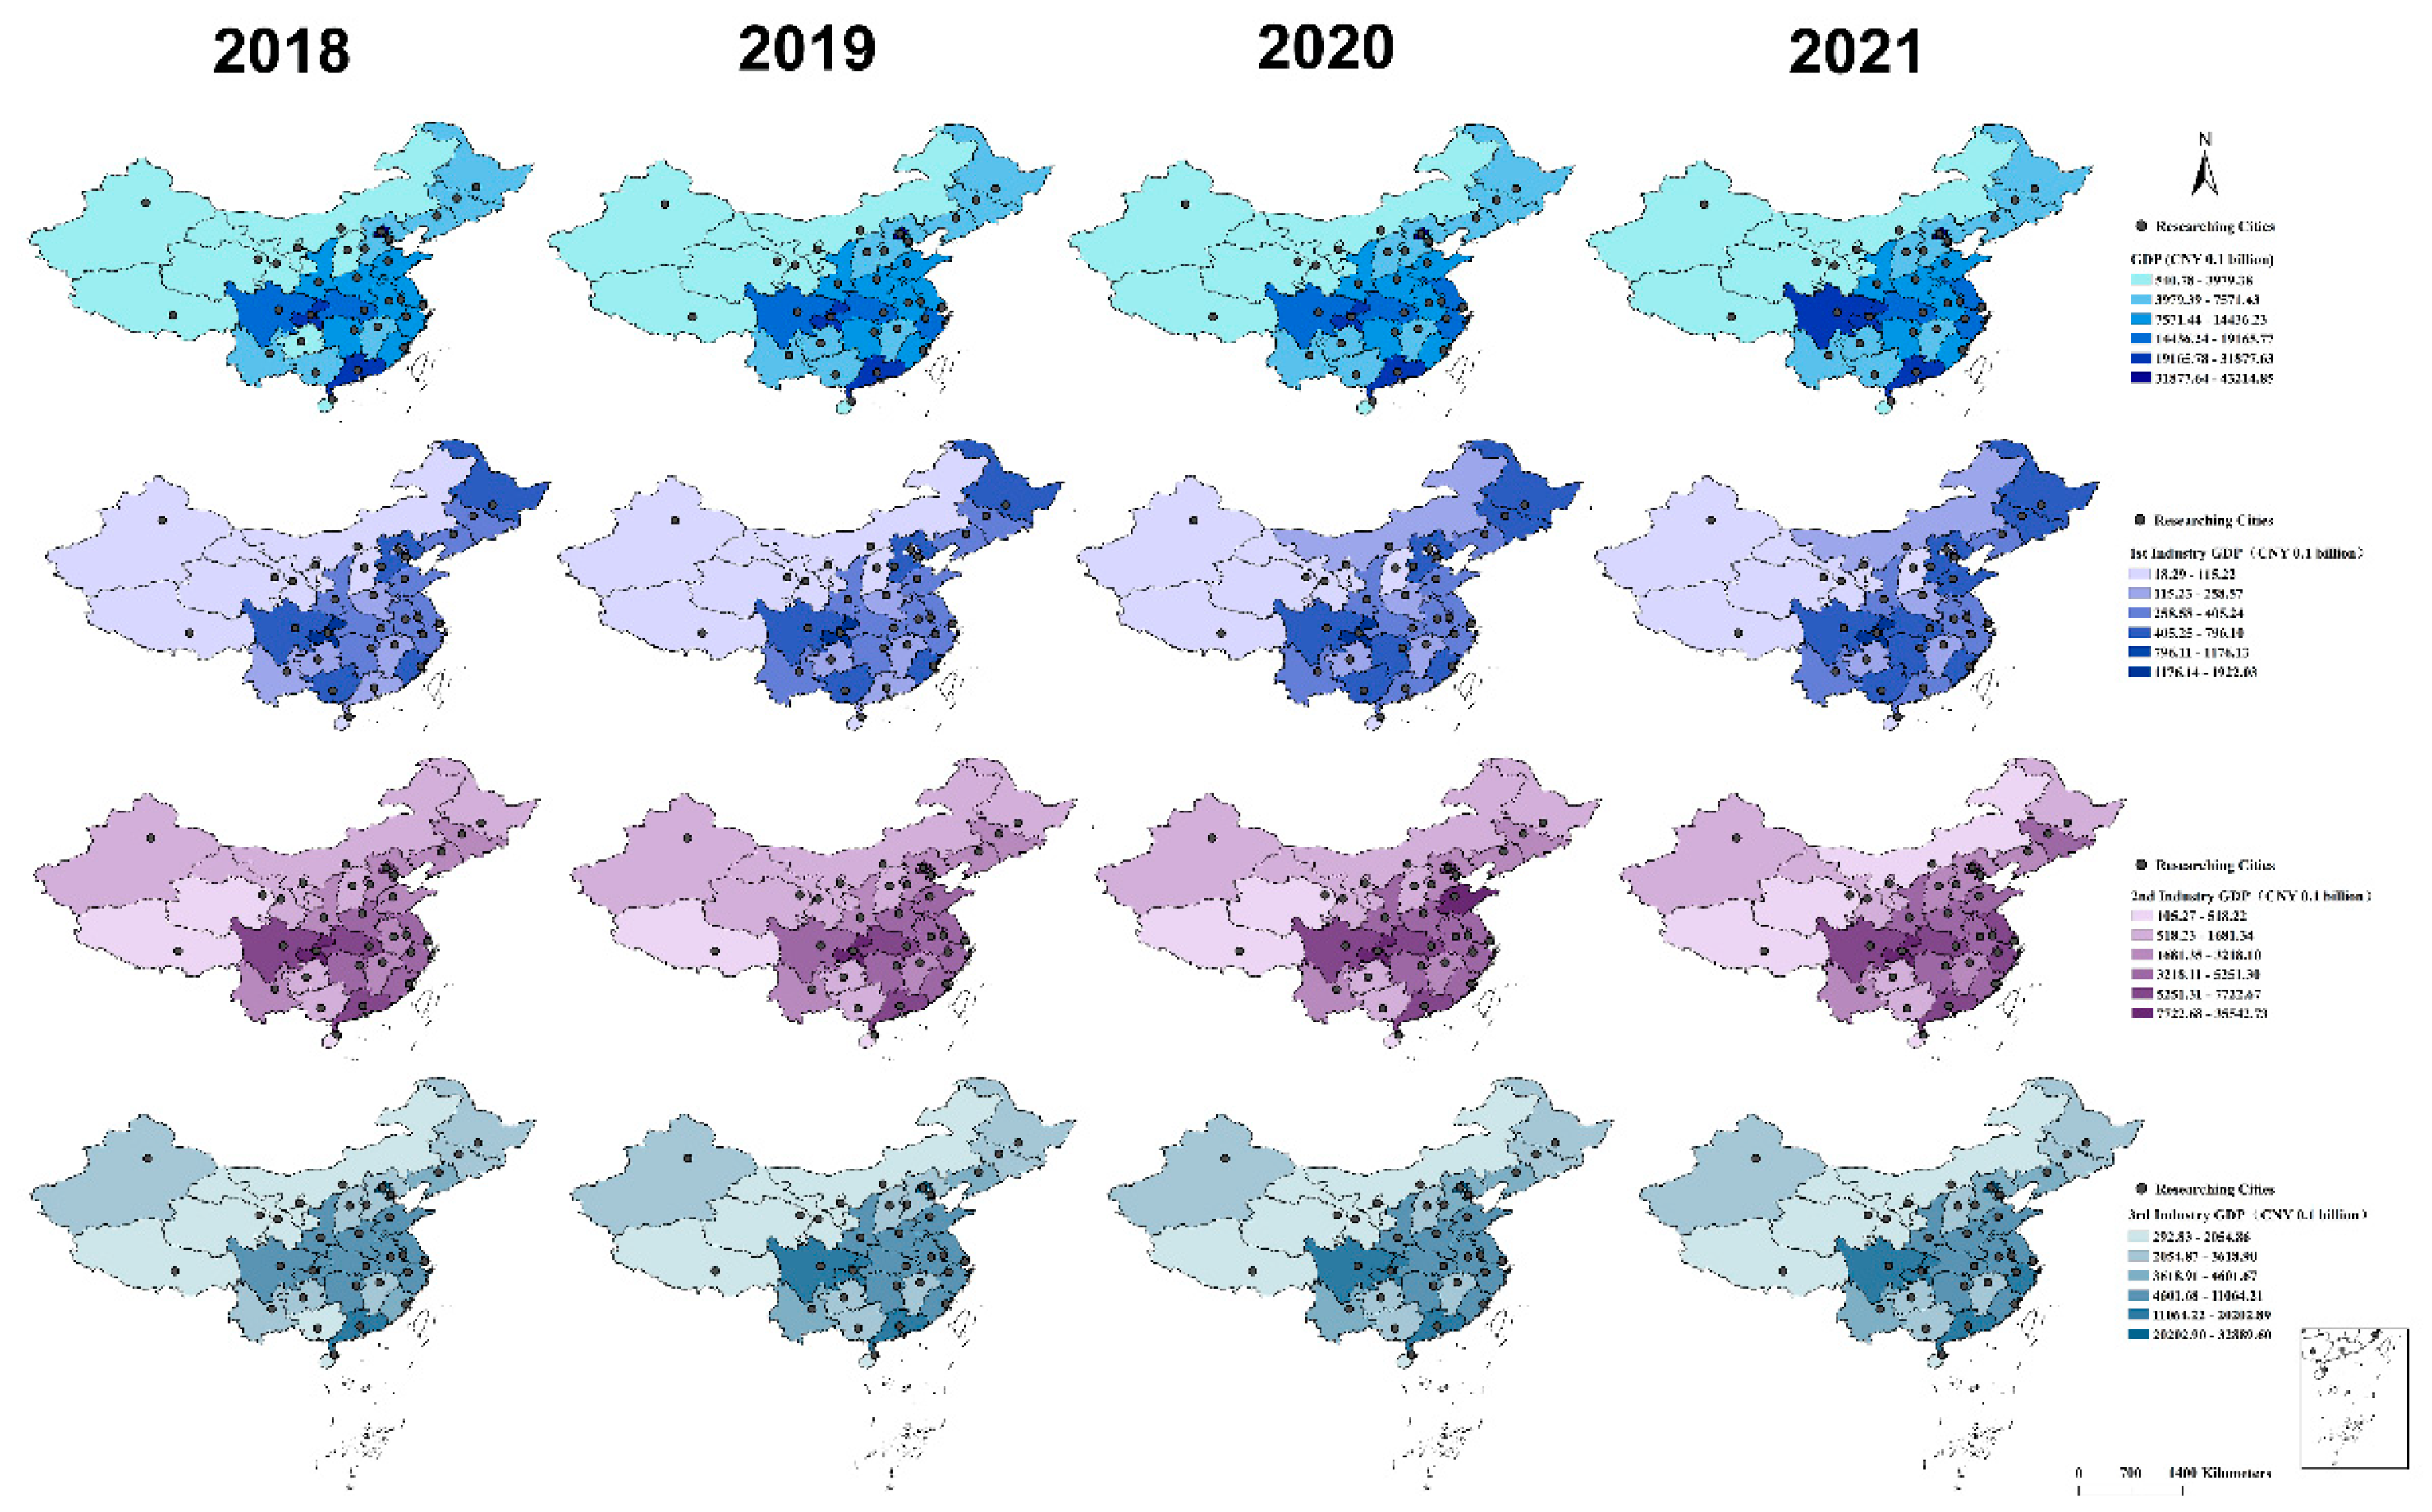
Figure 6.
Whisker box plots of the total compliance rate in response to pandemic disparity (A, B) and yearly dynamics (C, D) for daytime (A, C) and night (B, D) records. Black dots mark the range framed in the upper and lowest limits of the data, within which whiskers present the range of 5% and 95% quantiles. The box presents ranges across the 25% and 75% quantiles, and the full line inside marks the median value. Different letters represent significant differences in the mean values for each urbanization group.
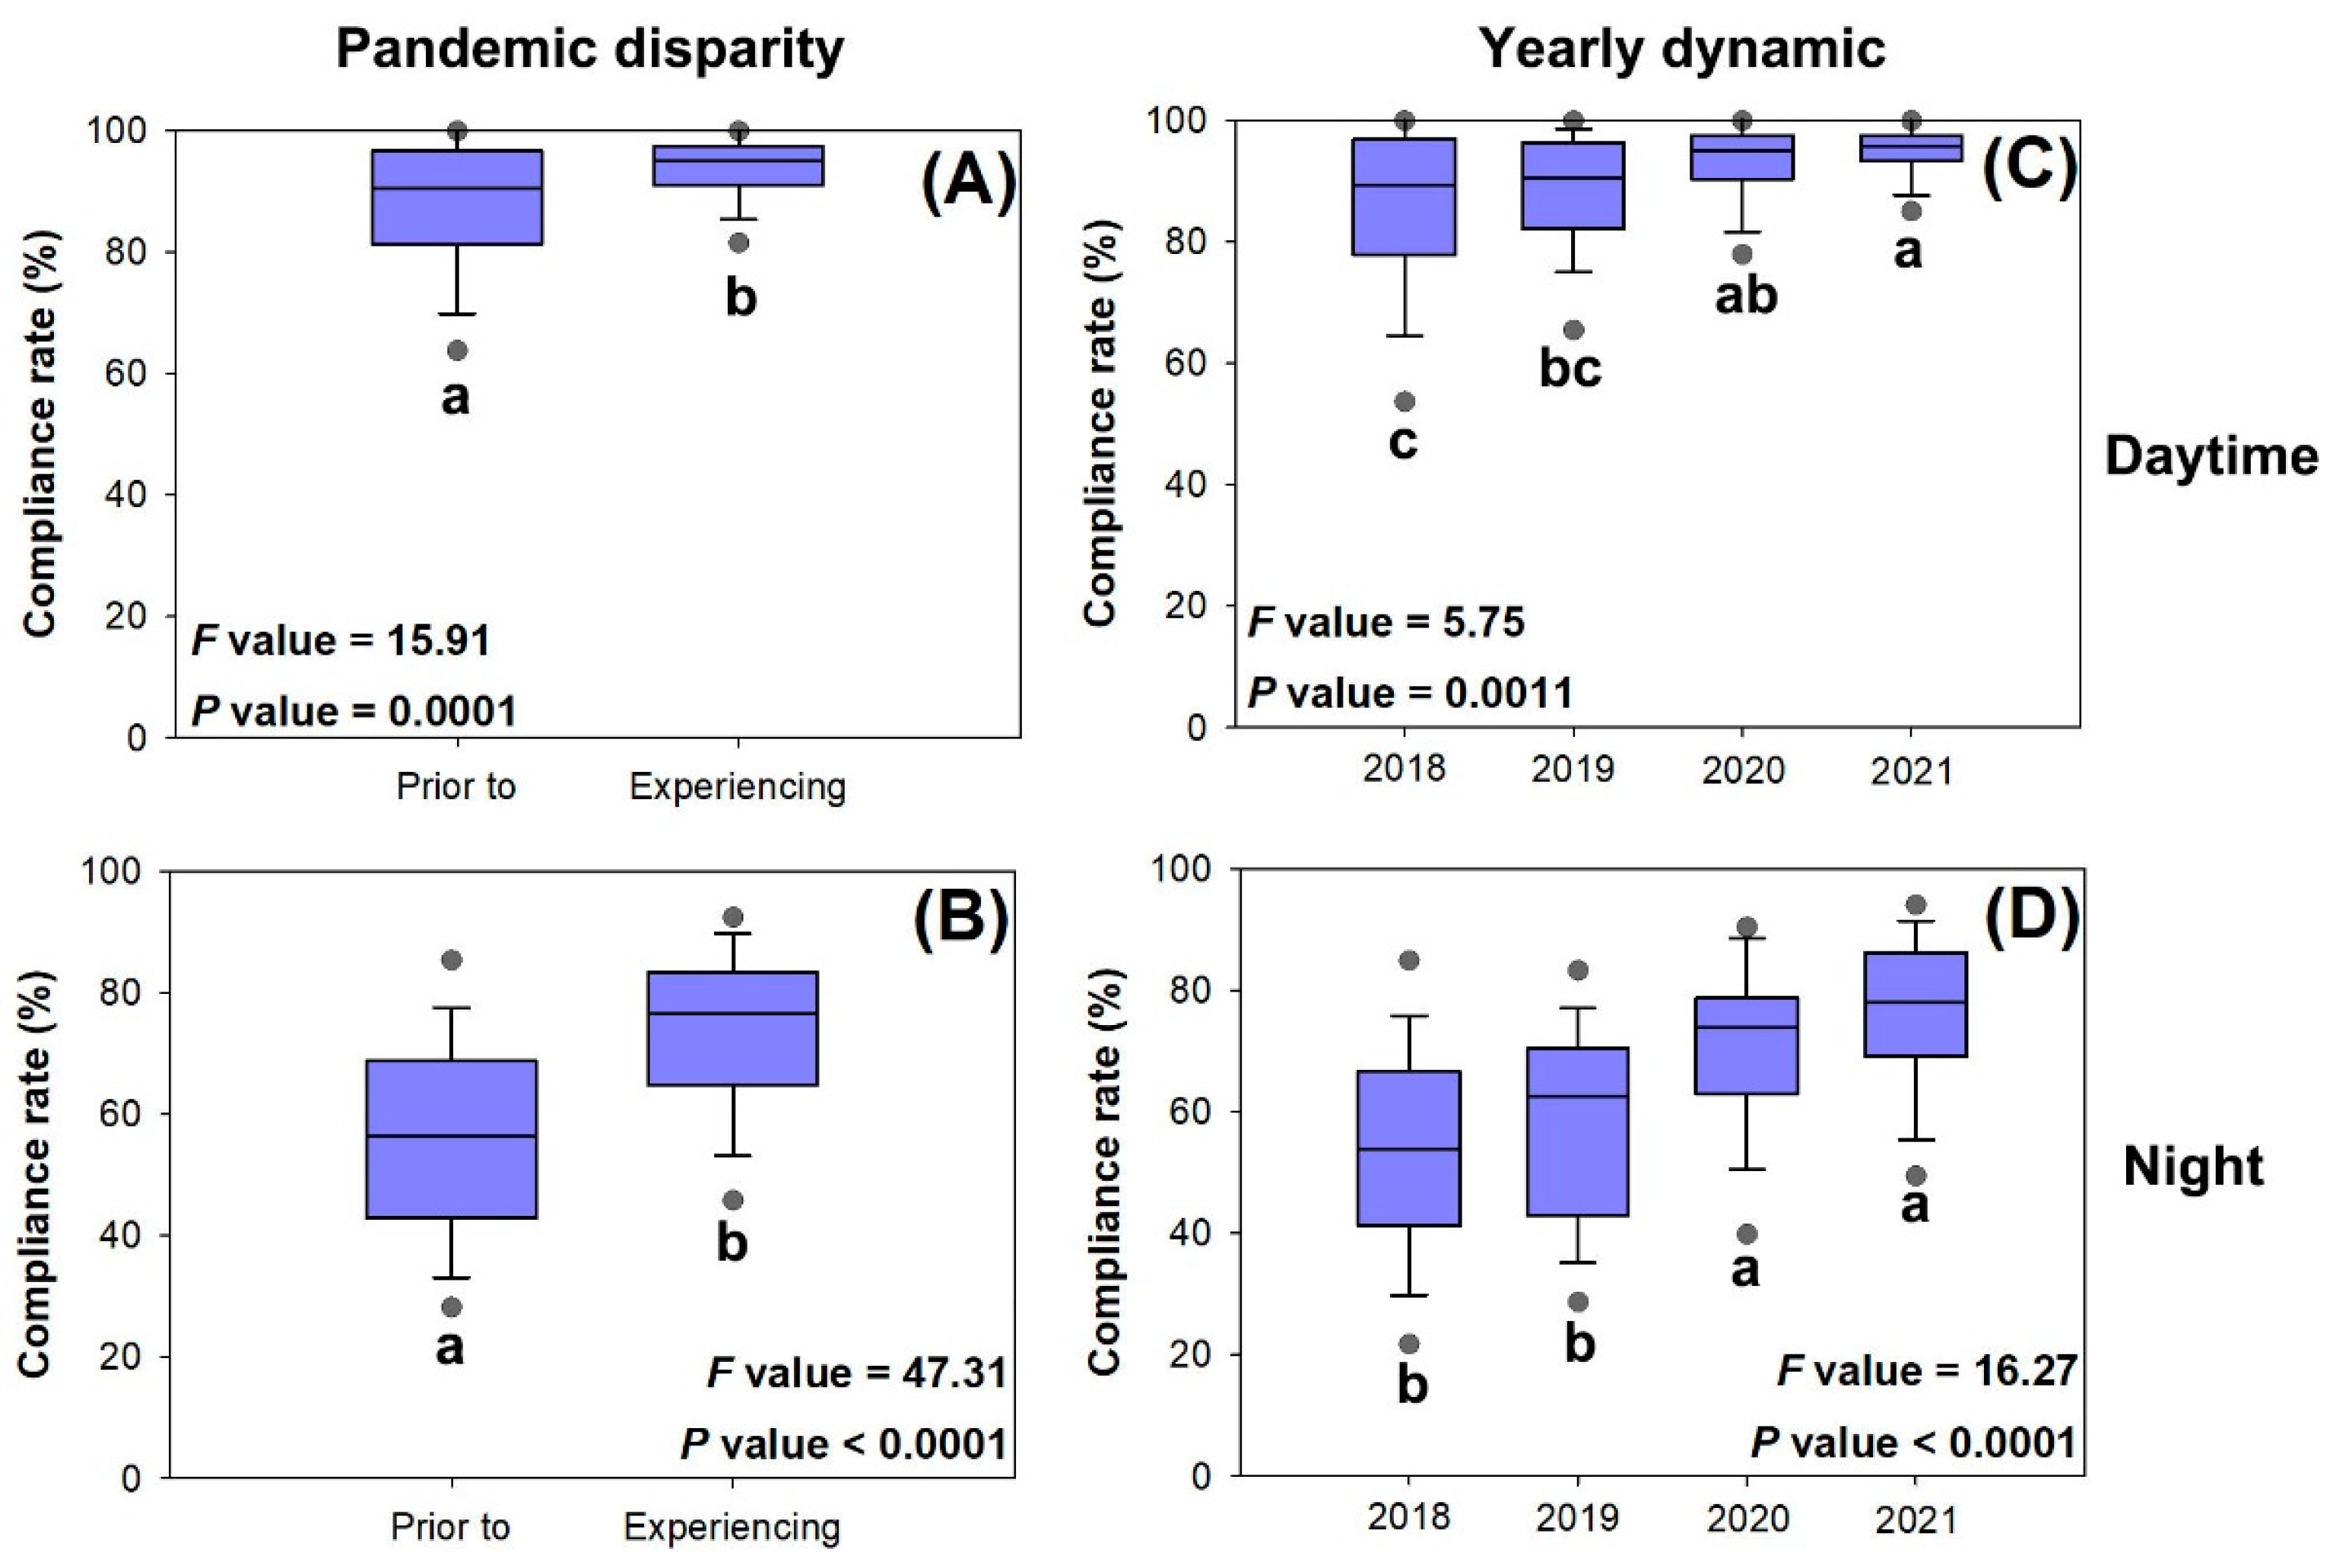
Figure 7.
Spatial distributions of the total point compliance rate in both daytime and nighttime records in provincial zones of mainland China in 2018, 2019, 2020, and 2021.
Figure 7.
Spatial distributions of the total point compliance rate in both daytime and nighttime records in provincial zones of mainland China in 2018, 2019, 2020, and 2021.
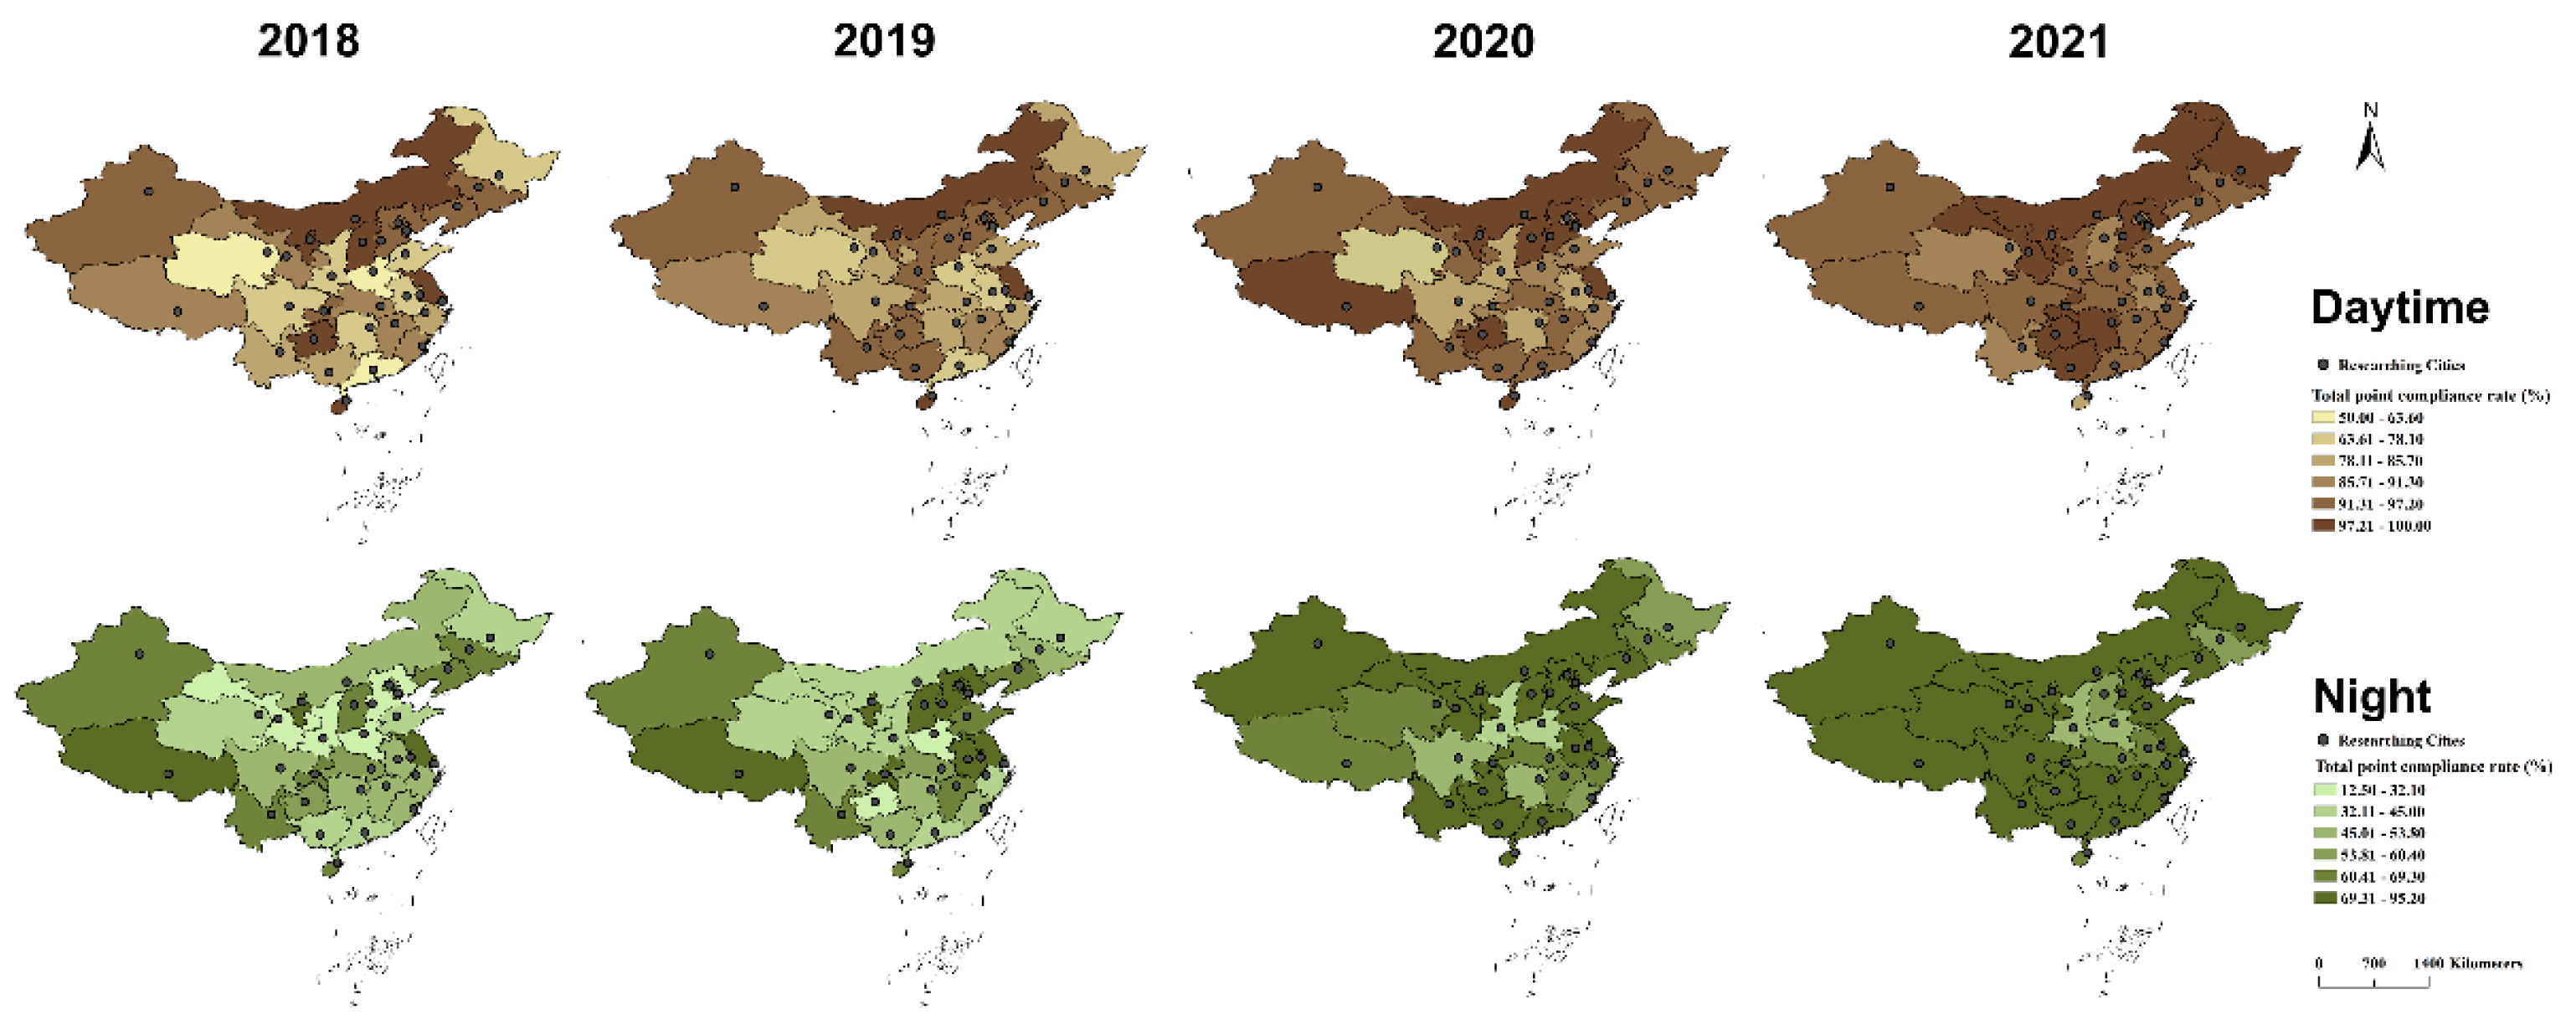
Figure 8.
Spearman correlations between paired variables of socioeconomic dimensions and urban green space features, and between features and daytime compliance rate (compliance rate_Day) in positive (A) and negative (B) correlations. The width of the Sankey bands parallels the absolute values of the R-values in the correlations. .
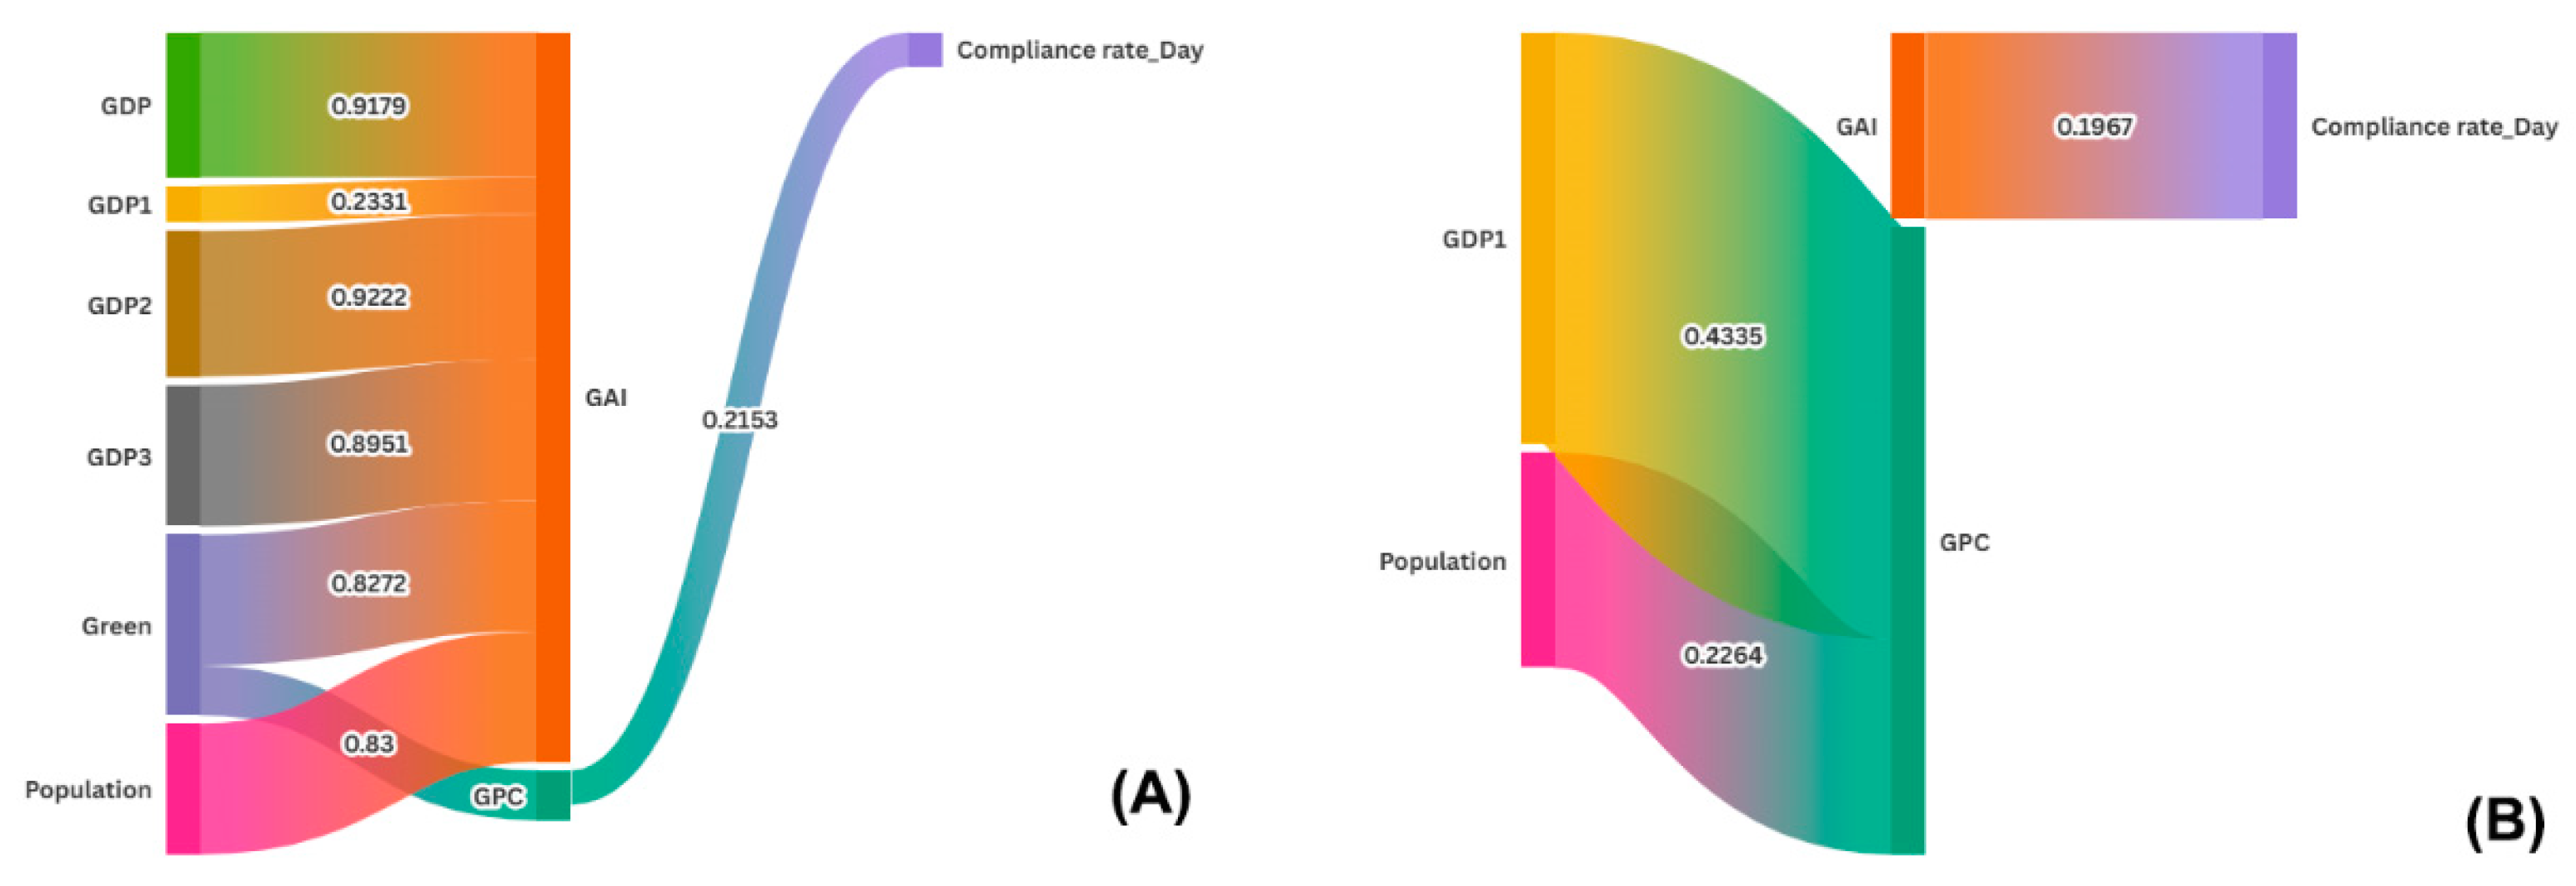
Figure 9.
Maximum Likelihood Estimate (MLE) of compliance rates during daytime (A, C) and night (B, D). Dots are MLE estimated parameters by MLE with error bars (standard errors) towards the zero line. WCS is the Wald chi-square value. The number of asterisks indicates the significance of the MLE estimate: **, P < 0.01; ***, P < 0.001.
Disclaimer/Publisher’s Note: The statements, opinions and data contained in all publications are solely those of the individual author(s) and contributor(s) and not of MDPI and/or the editor(s). MDPI and/or the editor(s) disclaim responsibility for any injury to people or property resulting from any ideas, methods, instructions or products referred to in the content. |
© 2025 by the authors. Licensee MDPI, Basel, Switzerland. This article is an open access article distributed under the terms and conditions of the Creative Commons Attribution (CC BY) license (http://creativecommons.org/licenses/by/4.0/).
Copyright: This open access article is published under a Creative Commons CC BY 4.0 license, which permit the free download, distribution, and reuse, provided that the author and preprint are cited in any reuse.


