
Submitted:
31 January 2025
Posted:
31 January 2025
You are already at the latest version
Abstract
So far, the molecular functions of the angiotensin type-2 receptor (AT2) interacting protein (ATIP1) remained unclear although expression studies revealed high levels of ATIP1 in the heart. To unravel its physiological function, we investigated ATIP1-KO mice. They develop a spontaneous cardiac hypertrophy with significantly increased heart/body weight ratio, enlarged cardiomyocyte diameters, and augmented myocardial fibrosis. Hemodynamic measurements revealed an increased ejection fraction (EF) in untreated ATIP1-KO mice, and reduced end-systolic and end-diastolic volumes (ESV and EDV), which in sum reflects a compensated concentric cardiac hypertrophy. Importantly, no significant differences in blood pressure (BP) were observed. Chronic angiotensin II (AngII) infusion resulted in an increase of BP and EF in ATIP1-KO and WT mice. Reduction of ESV and EDV occurred both in ATIP1-KO and WT, but to a lesser extent in ATIP1-KOs. Isolated cardiomyocytes exhibited a significantly increased contractility in ATIP1-KO and accelerated Ca2+ decay. AngII treatment resulted in increased fractional shortening in WT but decreased shortening in ATIP1-KO, accompanied by accelerated cell relaxation in WT but absent effects on relaxation in ATIP1-KO cells. The AT2-agonist CGP42112A increased shortening in WT cardiomyocytes but again did not affect shortening in ATIP1-KO cells. Relaxation was accelerated by CGP42112A in WT, but unaffected in ATIP1-KO cells. We here show that ATIP1-deficiency results in spontaneous cardiac hypertrophy in vivo and that ATIP1 is a downstream signal in the AT2-pathway regulating cell contractility. We hypothesize that the latter effect is due to a disinhibition of the AT1-pathway by impaired AT2-signaling.
Keywords:
ATIP1
; MTUS1
; knockout mice
; cardiac hypertrophy
; angiotensin type-2 receptor
1. Introduction
The Renin-Angiotensin System (RAS) comprises a well-characterized cascade of proteases and hormones involved in the regulation of various physiological processes, and dysregulation of this cascade plays a critical role in wide-spread diseases like hypertension, cardiac hypertrophy and heart failure [1,2,3]. The cellular effects of the end-product angiotensin II (AngII) are mainly exerted by two subtypes of AngII receptors. AT1 is involved in most of the well-established physiological effects of AngII, and AT2 was shown to counterbalance some of the effects of AT1 activation, although the role of the latter is still uncertain [1,4,5]. Both receptors belong to the superfamily of G-protein-coupled receptors but exert different signals and functions [6]. AT1 activates growth pathways and mediates major AngII effects, such as vasoconstriction, increased cardiac contractility, vascular and cardiac hypertrophy, inflammatory responses, and oxidative stress. Activation of AT2 is believed to counteract AT1 effects, including vasodilation, antigrowth, and anti-hypertrophic effects [1,6,7,8,9,10], and it is involved in blood pressure regulation [11]. In addition to the coupling to G-proteins [12,13], AT2 directly activates SH2 domain-containing phosphatase 1 (SHP-1) by a mechanism distinct from the classic paradigm of heterotrimeric G proteins [14]. Interaction with SHP-1 is supposedly related to the anti-proliferative effects of AT2 [5,15]. On the contrary, it was shown that recruitment of the promyelocytic zinc finger protein PLZF to AT2 is associated with an increased protein synthesis in cardiomyocytes and cardiac hypertrophy [16]. In sum, the AT2-dependent signaling pathway is poorly understood [4,5].
Initially described as a human mitochondrial tumor suppressor gene 1 (MTUS1) [17], MTUS1 has not only been shown to act as a potential tumor suppressor in a variety of cancers but also to operate as an interaction partner of AT2, linking the AT2-pathway to carcinogenesis [18]. Because of that, MTUS1 has also been named AT2 Interacting Protein (ATIP) [19,20] and AT2 Binding Protein (ATBP) [21]. For reasons of clarity, we used the ATIP1 nomenclature throughout this study.
ATIP1 is involved in the transport of AT2 from the Golgi compartment to the plasma membrane and mediates inhibitory effects on MAP kinases and anti-proliferative effects of the AT2 [21]. Since ATIP1 trans-inactivates receptor tyrosine kinases, it was considered as an early component of growth inhibitory signaling cascades [20]. Poly (ADP-ribose) polymerase-1 (PARP-1) activates transcription of the MTUS1 gene and represses AT2 gene transcription [22]. PARP-1 is involved in regulating blood pressure and inflammatory processes but PARP-1-deficient mice do not develop cardiac hypertrophy [23]. Mice ubiquitously over-expressing ATIP1 showed attenuated superoxide anion production, activation of cell proliferative signaling cascades, and elevated expression of tumor necrosis factor α [24]. After femoral artery cuff placement, neointima formation was reduced in these mice, suggesting a role in vascular remodeling [24].
To address cardiac functions of ATIP1 and underlying regulatory mechanisms, we analyzed the in vivo characteristics of ATIP1-deficiency in a newly generated gene trap-based loss-of-function mouse model.
2. Materials and Methods
Generation of ATIP1-KO Mice
ATIP1-KO mice were generated via a gene trap approach [25,26]. In brief, the embryonic stem cell line RRA048 (International Gene Trap Consortium), was used for blastocyst injection and subsequent foster mother implantation to generate germ line chimeras. The RRA048 cells contain the pGT1Lxf gene trap vector, composed of a part of the engrailed 2 intron 1 (en2 intron 1), a splice acceptor (SA), a β-galactosidase/neomycin resistance fusion gene (β-geo), required for selection and X-Gal staining, an SV40 polyadenylation sequence (SV40pA), and a pUC backbone vector sequence. Based on our RACE-PCR results (see below), yielding only the mATIP1 isoform 4, this vector was inserted between the corresponding exons 3 and 4 of the Mtus1 gene). Throughout this study, only ATIP1-KO mice with a total lack of ATIP1 and littermate controls were used. To avoid inbreed effects resulting from the genetic background, we used mice with a mixed 129/Ola×C57Bl/6 genetic background. All experiments and animal care were performed in accordance with the German legislation on protection of animals and the guide for the care and use of laboratory animals and were approved by the local governmental animal care committee at the Regierung von Unterfranken, Bavaria, Germany (approval code: 55.22531.01-62/08). Offspring were genotyped using the following sets of primers: for WT-PCR, amplifying a 900-bp fragment, Primer 1 (located on Intron 9 forward orientation) 5´-CTATGGCAATAAGACAGCCC-3´ and Primer 3 (located on Intron 9 reverse orientation) 5´-GGTTTGATCCCCAACACCAC-3´, for KO-PCR, amplifying a 500-bp fragment, Primer 1 and Primer 2 (located on the gene trap vector, reverse orientation) (5´-CACTCCAACCTCCGCAAACTC-3´).
Cloning of Mouse ATIP1 Heart-Specific Splice Variants by RACE-PCR
ATIP1 splice variants were detected by the rapid amplification of cDNA ends (RACE) method from a mouse heart Marathon-Ready™ double-stranded cDNA library (Clontech) using the Advantage® 2 PCR system (Clontech) and the following gene-specific and adaptor primers: mouse ATIP1 forward (R1), 5′-GGCAGGCAGAAGAATCCCAG-3′, and mouse ATIP1 reverse (R2), 5′-AGGTGCTGGATCACAACGG-3′, adaptor primer (AP), 5’–CCATCCTAATACGACTCACTATAGGGC–3’ (Figure 2A). The resulting PCR fragments were cloned into pCR®-XL-TOPO (Invitrogen) and subsequently sequenced with standard M13 uni (-21) and M13 rev (-29) primers. DNA sequences were analyzed and aligned with DNAMAN 4.0 (Lynnon BioSoft).
RT-PCR and Northern Blot Analyses
Total RNA was extracted from ATIP1-KO and WT mouse hearts using TRIzol reagent (Invitrogen). 1 ml of TRIzol reagent was used for 50 mg of tissue and RNA was isolated according to the manufacturer’s instructions. For RT-PCR analyses, 0.5 µg of total RNA was used with the OneStep RT-PCR Kit (Qiagen). As variant-specific primers were used: Isoform 1:5´-CAGGTACAGACGTCTCCAAGG-3´, Isoform 3: 5´-GCATGAGGGATGCATGAACATG-3´, Isoform 4: 5´-GGCATGCACAGTGTGATGTAAT-3´, in combination with the common reverse primer: 5´-GTACGTAGCTGAAACGGTTGG-3´. To test for RNA integrity, a GAPDH fragment was amplified in parallel using the following primers: GAPDH forward, 5´-ACCACAGTCCATGCCATCAC-3´, and GAPDH reverse, 5´-TCCACCACCCTGTTGCTGTA-3´. For Northern blot analyses we used a standardized MessageMap Northern blot membrane with 2 μg polyA RNA (Stratagene; BALB/c male mouse) per lane. The membrane was hybridized with a Biotin-16-dUTP-labeled (Roche) Mtus1 cDNA probe. Hybridization signals were detected by Streptavidin-Horseradish Peroxidase (Chemiluminescent Nucleic Acid Detection Module; PIERCE) on X-ray films.
Western Blotting
To obtain lysates of mouse organs, 50 mg of tissues were homogenized with an UltraTurrax (IKA) in 1 ml PBS/2% SDS, supplemented with Complete Protease and PhosSTOP Phosphatase Inhibitor Cocktails (Roche). Proteins were separated by 10 or 12% SDS-PAGE under reducing conditions and electro-transferred to nitrocellulose membranes (Schleicher & Schuell), using semi-dry blotters (Biometra). The polyclonal rabbit anti-ATIP1 antibody was established by Eurogentec (Seraing, Belgium). Therefore, the peptide H2N-CPRNSGSFPSPSISPR-COOH (amino acids 422-436 of the human ATIP1 protein sequence) was coupled to hemocyanin. Rabbits were immunized with the modified peptide on days 0, 14, 28 and 56, and the final bleed was carried out at day 80 of the immunization procedure. Subsequently, the rabbit serum was affinity-purified with the antigen peptide coupled to an AF-Amino Toyopearl 650 M matrix (Tosoh Bioscience, Stuttgart, Germany). Blots were probed using anti-ATIP1, rabbit anti-p44/42 MAP kinase (9102, Cell Signaling), rabbit anti-phospho-p44/42 MAP kinase (9101, Cell Signaling), rabbit anti-GAPDH (14C10), rabbit anti-Cav1.2 (ACC-003, alomone labs), monoclonal mouse anti-PLB A1 (A010-14, Badrilla), monoclonal mouse anti-cardiac Actin (A9357, Sigma), polyclonal rabbit anti-SERCA2a (A010-20, Badrilla), and monoclonal mouse anti-CaMKII (MA1-047, Pierce) antibodies, followed by an anti-rabbit or anti-mouse horseradish peroxidase-conjugated secondary antibody (TrueBlot®, eBioscience), all diluted in 5% non-fat milk/PBS, supplemented with 0.05% Tween20. For signal detection, the ECL Plus Reagent (Amersham) was used.
Quantification of ERK Phosphorylation and Protein Expression Levels
Western blot band intensities were quantified using ImageJ (NIH, USA). Data were calculated as the ratio of arbitrary densitometric units either of P-ERK to total ERK or of protein signal intensity in relation to Actin or to GAPDH intensity.
Immunohistochemistry
Dissected hearts were embedded in Tissue-Tek (Sakura) and snap-frozen in N2. 5-10 µm cryosections were cut using a HM500OM microtome (MICROM) and collected on SuperFrost slides (Menzel). The cardiomyocytes were isolated by liberase/trypsin digestion according to the Protocol PP00000125 from The Alliance for Cellular Signaling (AfCS). Tissue slices and isolated cardiomyocytes (described below) were fixed with 4% paraformaldehyde/PBS for 10 minutes, permeabilized with 0.2% TritonX-100/PBS for 20 minutes, and blocked in 5% goat serum/PBS for 1 hour. Over-night incubation with primary rabbit polyclonal anti-ATIP1 (1:500; Eurogentec) and mouse monoclonal anti-plasma membrane Ca2+ ATPase (5F10, Sigma) was followed by incubation with secondary goat-anti-rabbit and goat-anti-mouse antibodies conjugated to Alexa Flour 488 or 594 for 2 hours (Invitrogen) or Phalloidin-TRITC (P1951, Sigma) to stain cardiac Actin. For AT2/ATIP1 co-localization, the direct-coupled rabbit polyclonal anti-AT2-ATTO-488 (AAR-012-AG, alomone labs) antibody was used after labeling the anti-ATIP1 antibody with the secondary Alexa Flour 594 antibody. All antibody incubations were performed in 5% goat serum/PBS in a humidified chamber in the dark. Stained sections were investigated using an Eclipse E600 microscope equipped with a C1 confocal scanning head (Nikon).
Cell Culture and Immunoprecipitations
HEK 293 cells were cultured as previously described [27] and grown to ~80 % confluence and transfected using LipofectamineTM 2000 (Invitrogen) according to the manufacturer’s instructions. After 48 h, cells were rinsed with PBS and lysed in RIPA buffer without SDS. Subsequent to 10 min incubation on ice, cells were scraped from the plates and pelleted at 13,000 g for 10 min at 4 °C. 300 µg of the lysate was used for each immunoprecipitation. 3 µg of affinity-purified anti-ATIP1 antibodies or 3 µg of anti-AT2 antibody (Santa Cruz, SC-9040) were added. After 1 h rocking at 4 °C, 50 µl of protein A/G agarose was added to the mixtures and rotated overnight at 4 °C. Protein A/G agarose was pelleted at 4,000 g for 30 s and washed twice with RIPA buffer containing protease inhibitors. Bound proteins were eluated in 2 x Laemmli buffer and separated on polyacrylamide gels followed by transfer onto nitrocellulose for Western blotting as described above.
X-Gal Staining
X-Gal staining was performed according to the protocol given by the Sanger Institute Gene Trap Resource (www.sanger.ac.uk/PostGenomics/genetrap/protocols.shtml) and as previously described [26,28].
Histology, Morphometrical Analyses, and Cardiac Fibrosis
For histological analysis, hearts were fixed in 4% formaldehyde and embedded in paraffin. 5 μm sections were stained with periodic acid Schiff or 0.1% picrosirius red. Photomicrographs of myocardial sections were photographed with a CCD-FV2T camera (Olympus) and analyzed with the CellD image analysis system (Olympus), with the investigator blinded to the genotypes. The mean cardiomyocyte diameters were calculated by measuring 100 cells with a centrally located nucleus per specimen. Sections were stained with picrosirius red to detect collagen deposition to assess fibrosis. The level of fibrosis was calculated as percentage of myocardial fibrosis by the image analysis system Scion (www.scioncorp.com, NIH) according to [29,30].
Isolation of Cardiomyocytes
Using a Langendorff perfusion apparatus, cardiomyocyte isolation from mouse hearts was performed as described previously [31,32]. In brief, mice were anesthetized in a gas chamber with isoflurane, hearts were excised and mounted on a Langendorff perfusion-system and were perfused with a nominally Ca-free Tyrodes’ solution containing (in mM) NaCl 113, KCl 4.7, KH2PO4 0.6, Na2HPO4x2H2O 0.6, MgSO4x7H2O 1.2, NaHCO3 12, KHCO3 10, HEPES 10, Taurine 30, BDM 10, glucose 5.5, phenol-red 0.032 for 4 min at 37°C and pH 7.4. Then, perfusion solution was switched to the same solution containing 7.5 mg/ml liberase 1 (Roche diagnostics, Mannheim, Germany), trypsin 0.6% and 0.125 mM CaCl2. Perfusion was continued for about 3 min until the heart became flaccid. Ventricular tissue was removed, cut into small pieces and dispersed until no solid cardiac tissue was left. Ca2+ reintroduction was performed carefully via stepwise increasing Ca2+ concentration from 0.1 mM to 0.8 mM. Shortly after, cells were plated onto superfusion chambers, with the glass bottoms treated with Laminin to allow cell adhesion and then used for immediate measurements.
Cardiomyocyte Shortening and Ca2+ Measurements
Cardiomyocyte shortening and Ca2+ measurements were performed as described previously [33,34]. In short, myocytes were loaded with Fluo-3 AM (10 µmol/L; Molecular Probes, Eugene, USA) in darkness for 15 minutes prior to being mounted on an inverted microscope (Nikon Eclipse TE2000-U) connected to a fluorescence-detection system (IonOptix). Emitted fluorescence was recorded using a photomultiplier at ~535±20 nm. Ca2+ transient amplitudes were calculated as peak fluorescence divided by baseline fluorescence after background fluorescence had been subtracted (F/F0). Ca2+ values were calculated by using a semi- quantitative approach as [Ca2+]i=Kd(F/F0)/(Kd/[Ca2+]i-rest+1-F/F0) using Kd 1100 nmol/L and an estimated [Ca2+]i-rest of 100 nmol/L as described before [33]. In a subset of experiments, Angiotensin II (AngII; 0.5 μmol/L; Calbiochem, San Diego, USA) was added to the superfusion solution. Prior starting measurement recordings, myocytes were superfused and stimulated at a basal rate with 0.5 Hz for 10 min to allow a complete wash-in of the superfusion solution and steady-state contractions. Similarly, in another subset, the selective AT2 agonist CGP42112A (10 μmol/L; Sigma-Aldrich, Steinheim, Germany) had been added to the superfusion solution 10 min before measurements were started, again ensuring steady-state conditions.
Chronic Infusion of AngII
Seven-months-old ATIP1-KO and WT control mice received AngII (350 ng/kg BW/minute, Sigma) for a period of 2 weeks. The substance was dissolved in 0.9% NaCl and then infused subcutaneously via osmotic mini pumps (model 2002; Alzet, Colorado City, CO, n=12 mice per group). All mice were analyzed and sacrificed under isoflurane anesthesia.
Transversal Aortic Constriction
Male mice with a body weight of 25-30 g underwent transversal aortic constriction (n = 12). Mice were isoflurane-anesthetized and the transversal aorta was prepared. A 27-gauge needle was tied against the aorta between the carotid arteries using a 6-0 non-absorbable suture. After removal of the 27-gauge needle, the skin was closed, and the mice were kept under buprenorphine analgesia for three days.
Estimation of Renin Activity
Plasma Renin activity was estimated using the SensoLyte 520 Fluorimetric Mouse Renin Assay Kit (AnaSpec) according to the manufacturer`s protocol using a Victor2 fluorometer (Perkin Elmer).
Non-invasive Blood Pressure Estimation, Hemodynamics and Tissue Harvesting
Arterial blood pressure was measured after 7 days of acclimatization in ATIP1-KO and WT mice by tail cuff (Softron, Tokyo, Japan). After 2 weeks of chronic AngII treatment or TAC, respectively, cardiac function was measured compared to basal recordings in untreated mice, using a pressure-volume conductance catheter Ultra-Miniature SPR-839 (Millar Instruments), connected to a MPVS Ultra (Millar Instruments) and a PowerLab 16/30 (ADInstruments) for data acquisition. Values were calculated with PVAN Ultra 1.1 data analysis software (Millar Instruments), the analyses were performed as described elsewhere [35]. All mice were analyzed and sacrificed under isoflurane anesthesia and left ventricles were snap-frozen in liquid N2 for further analyses.
Statistical Analysis
Results are expressed as mean ± SD. Data sets were analyzed by two-sample t-tests, two-way ANOVA or Welch´s tests depending on the homogeneity of variances. P values < 0.05 were considered significant.
3. Results
- Intracellular and Organ-Specific ATIP1 Expression
ATIP1 localization in the heart and in isolated cardiomyocytes was investigated by confocal laser scanning microscopy. Overlay of ATIP1 and AT2 staining demonstrated co-localization of both proteins most likely at the plasma membrane (Figure 1A-C). Confirmation of sarcolemmal localization of ATIP1 was achieved by co-staining of the plasma membrane Ca2+ ATPase (PMCA, Figure 1D-F). Additionally, counterstaining of total Actin revealed no co-localization with cytoplasmic organelles or structures, e.g. actin but suggested again localization of ATIP1 at the plasma membrane (Figure 1G). Furthermore, Northern blot analyses revealed strong expression of ATIP1 not only in the heart but additionally in kidney, liver and testis (Figure 1J). In order to confirm interaction of ATIP1 with AT2, we precipitated either with anti-ATIP1 or anti-AT2 antibodies and detected in both cases interaction of the two proteins (Figure 1K, L).
- Cloning of the Heart-Specific ATIP1 Variant
Appearance of a single band in Northern blots prompted us to elucidate which of the predicted ATIP1 splice variants might be expressed in heart. Therefore, we cloned ATIP1 splice variants from a mouse heart cDNA library by 5´and 3´ RACE. The gene-specific primers R1 and R2 were located in an exon representing all three predicted splice variants (predicted exon 8, Figure 2A). Surprisingly, only the murine ATIP variant 4, equal to ATBP50 and Mtus1 variant 4, Genbank NM_001005865.2, was detected. In addition, further RT-PCR experiments with splice variant-specific primers gave no evidence for the appearance of additional variants and confirmed our findings obtained by RACE-PCR. In our hands, the mATIP1 variant 4 was the only detectable variant in the heart (Figure 2B).
- Atip1 Gene Trapping
To study the physiological functions of ATIP1 in vivo, we generated ATIP1-KO mice by blastocyst injection of the embryonic stem cell clone RRA048 (International Gene Trap Consortium). In these, the gene trap is inserted between the third and the fourth exon of the murine heart-specific ATIP1 splice variant (Figure 2C). Resulting chimeric males were then used to produce ATIP1-null mice. These were viable and fertile and macroscopically indistinguishable from wild-type controls. Genotyping of mice was done by PCR analyses using a common forward primer (Pr. 1) and a reverse primer either in the artificial -geo gene for the KO-PCR (Pr. 2) or a reverse primer in the intron downstream of the gene trap for the WT-PCR (Pr. 3, Figure 2C). The PCR products were about 500 bp for the KO allele and 900 bp for the WT allele, respectively (Figure 2D).
- ATIP1-Deficiency on RNA and Protein Level
Successful disruption of the ATIP1 gene on RNA level was assured by RT-PCR using total RNA of organs obtained from KO and WT littermates. Shown as an example, RT-PCR using knockout heart RNA gave no PCR product for ATIP1, as compared to glyceraldehyde 3-phosphate dehydrogenase (GAPDH, Figure 2E). Subsequent Western blot analyses with polyclonal rabbit anti-ATIP1 antibodies, raised against the shared C-terminus, confirmed ATIP1-deficiency on protein level in all tested organs (examples in Figure 2F).
- ATIP1 Promoter Activity in Cardiac Myocytes
To obtain a more detailed impression of the promoter activity of the Atip1/Mtus1 gene, we analyzed the activity of the artificial β-Geo construct brought under control of the natural Atip1/Mtus1 gene promoter. X-gal staining of hearts from heterozygous mice, of heart cryosections, and of isolated cardiomyocytes revealed a easily detectable promoter activity in practically all areas of the heart, including cardiac vessels as well as in cardiac myocytes of atria, ventricles and the septum wall (Figure 3A,B,D,E,G). Negative controls were prepared from WT hearts (Figure 3 C,F,H).
- Cardiac Hypertrophy in ATIP1-KO Mice
ATIP1-deficient mice developed a spontaneous, non-gender-dependent cardiac hypertrophy, which was reflected by a significantly increased heart to body weight ratio of 6.4 mg/g as compared to 4.7 mg/g in WT animals (n=20; p<0.05, Figure 4A). Non-invasive blood pressure measurement demonstrated no significant change in blood pressure in ATIP1-KO mice (Figure 4B, n=25). Supporting the observed phenotype, morphometrical analyses of cardiac myocytes showed significantly enhanced cardiomyocyte diameters in KO animals vs. WT-controls (14.88 vs. 11.03 µm, n=12; p<0.05, Figure 4C). In line with this, myocardial fibrosis was nearly doubled in KO animals (1.97±0.09-fold relative content vs. wild-type, n=12, p<0.05, Figure 4D). From these data, we concluded that cardiac hypertrophy in ATIP1-KO mice was not caused by pressure overload but that this might reflect the missing mediation of anti-hypertrophic AT2-signaling in ATIP1-deficient mice.
- Increased Shortening and Reduced Response to AngII and CGP42112A in ATIP1-deficient Cardiomyocytes
In a first series of experiments, we investigated cardiomyocyte shortening and Ca2+ transient amplitudes under basal conditions and subsequently after treatment with AngII (Fig 5). In a second series of experiments, we investigated again cardiomyocyte shortening and Ca2+ transients under basal conditions and after treatment with the AT2-agonist CGP42112A (Fig 6). Under basal conditions, cardiomyocytes from ATIP1-KO mice revealed significantly increased cell shortening at low stimulating frequencies compared to controls (e. g. 0.5Hz: 4.1±0.5 vs. 2.4±0.3%, n=14 vs. 11, P<0.05), and a strong trend towards increased contractility at higher frequencies, whereas Ca2+ transient amplitudes did not differ. Treatment with AngII significantly increased cell shortening in cardiomyocytes from WT mice (1Hz: 1.9±0.2 vs. 3.5±0.5%, n=11 and 12, respectively, p<0.05) but reduced it in ATIP1-KO cells (1Hz: 3.1±0.5 vs. 1.8±0.2%, n=13 and 15, respectively, p<0.05) whereas Ca2+ transient amplitudes remained again unchanged. Investigation of cell relaxation properties under basal conditions revealed a slightly faster cell relaxation throughout all stimulation frequencies (with a significantly accelerated relaxation only at 0.5 Hz in ATIP1-KO vs. WT: 222±30 vs. 337±45ms, n=14 vs. 11, P<0.05) and significantly accelerated diastolic Ca2+ transient decline at all stimulation frequencies in cells from ATIP1-KO mice compared to WT. Interestingly, AngII significantly accelerated both cell relaxation and Ca2+ decline in cardiomyocytes from WT mice but it hardly affected relaxation in cells from ATIP1-KO mice (see Figure 5).
Stimulation with the AT2-Agonist CGP42112A (Figure 6) increased cardiomyocyte shortening in WT cells significantly (e. g. at 1Hz in %: 3.0±0.3 vs. 2.0±0.3, n=19 and 25 for WT and WT plus CGP, respectively, p<0.05), but it did not alter shortening in cardiomyocytes for ATIP1-KO mice. Again, no significant differences were detected concerning Ca2+ transient amplitudes between these groups. Regarding relaxation properties, CGP42112A significantly accelerated both cell relaxation and Ca2+ decline in WT cells at all measured frequencies compared to basal conditions (e. g. at 1Hz, Relaxation time of 80% cell length before vs. after CGP42112A: 174±15 vs. 107±15 ms, n=7 vs. 8, p<0.05).
- Altered Left-Ventricular Cardiac Function, Basal and after Chronic AngII Application
Under basal conditions, most estimated left-ventricular volumes were reduced in KO mice, including maximum volume, minimum volume, end-systolic and end-diastolic volume, and volumes at dP/dt max and min (Table 1). Additionally, interpreted as diastolic index, the relaxation constant Tau (W) was significantly smaller in KO mice (Table 1). Taken together, these data pointed towards a compensated concentric cardiac hypertrophy including slower relaxation caused by a more rigid ventricular wall.
Low dose (350 ng/kg/min) chronic AngII treatment further accentuated the cardiac effects of ATIP-deficiency in vivo. Additionally to the parameters which were already altered under basal conditions, like end-systolic and end-diastolic volume, and volumes at dP/dt max (e.g. maximum volume WT 14.49±2.7 vs. KO 11.63±2.5, minimum volume WT 5.33±1.7 vs. KO 3.67±2.2, end-diastolic volume (EDV): WT 13.72±2.7 vs. KO 10.42±2.4 µl, Table 1), the cardiac output (CO: WT 4445.77±1090.7 vs. KO 3519.55±788.9 µl/min; n=12; p<0.05) was further reduced in ATIP1-KO animals (Table 1). This further reduction in left-ventricular performance after chronic AngII treatment obviously reflects the augmented response to AngII in KO mice, most likely mediated by a stimulation of the pro-hypertrophic AT1 signaling and missing counter-acting AT2 downstream signaling.
- In Comparison to Chronic AngII Administration, Pressure Overload by TAC Resulted in an Altered Hypertrophic Response of ATIP1-deficient Mice
To verify if the changes in cardiac performance of ATIP1-mice after chronic AngII administration are AngII-/AT1-dependent or simply reflect a common response to hypertrophic stimuli, we also measured hemodynamics after three weeks of pressure overload by transversal aortic constriction. Despite a similarly elevated ventricular pressure (e.g. end-systolic pressure WT 162.0 mmHg, KO 155.4 mmHg, Table 1) and comparably heightened Renin activity after TAC (Figure 7B), dP/dtmax and -dP/dtmin were significantly reduced and Tau was increased in KO mice (Table 1). A comparable alteration of these parameters was not observed after chronic AngII administration, indicative for an activation of a distinct intracellular signaling pathway for both, hypertrophic stimuli investigated here.
- Decreased ATIP1 Expression after Hypertrophic Stimuli
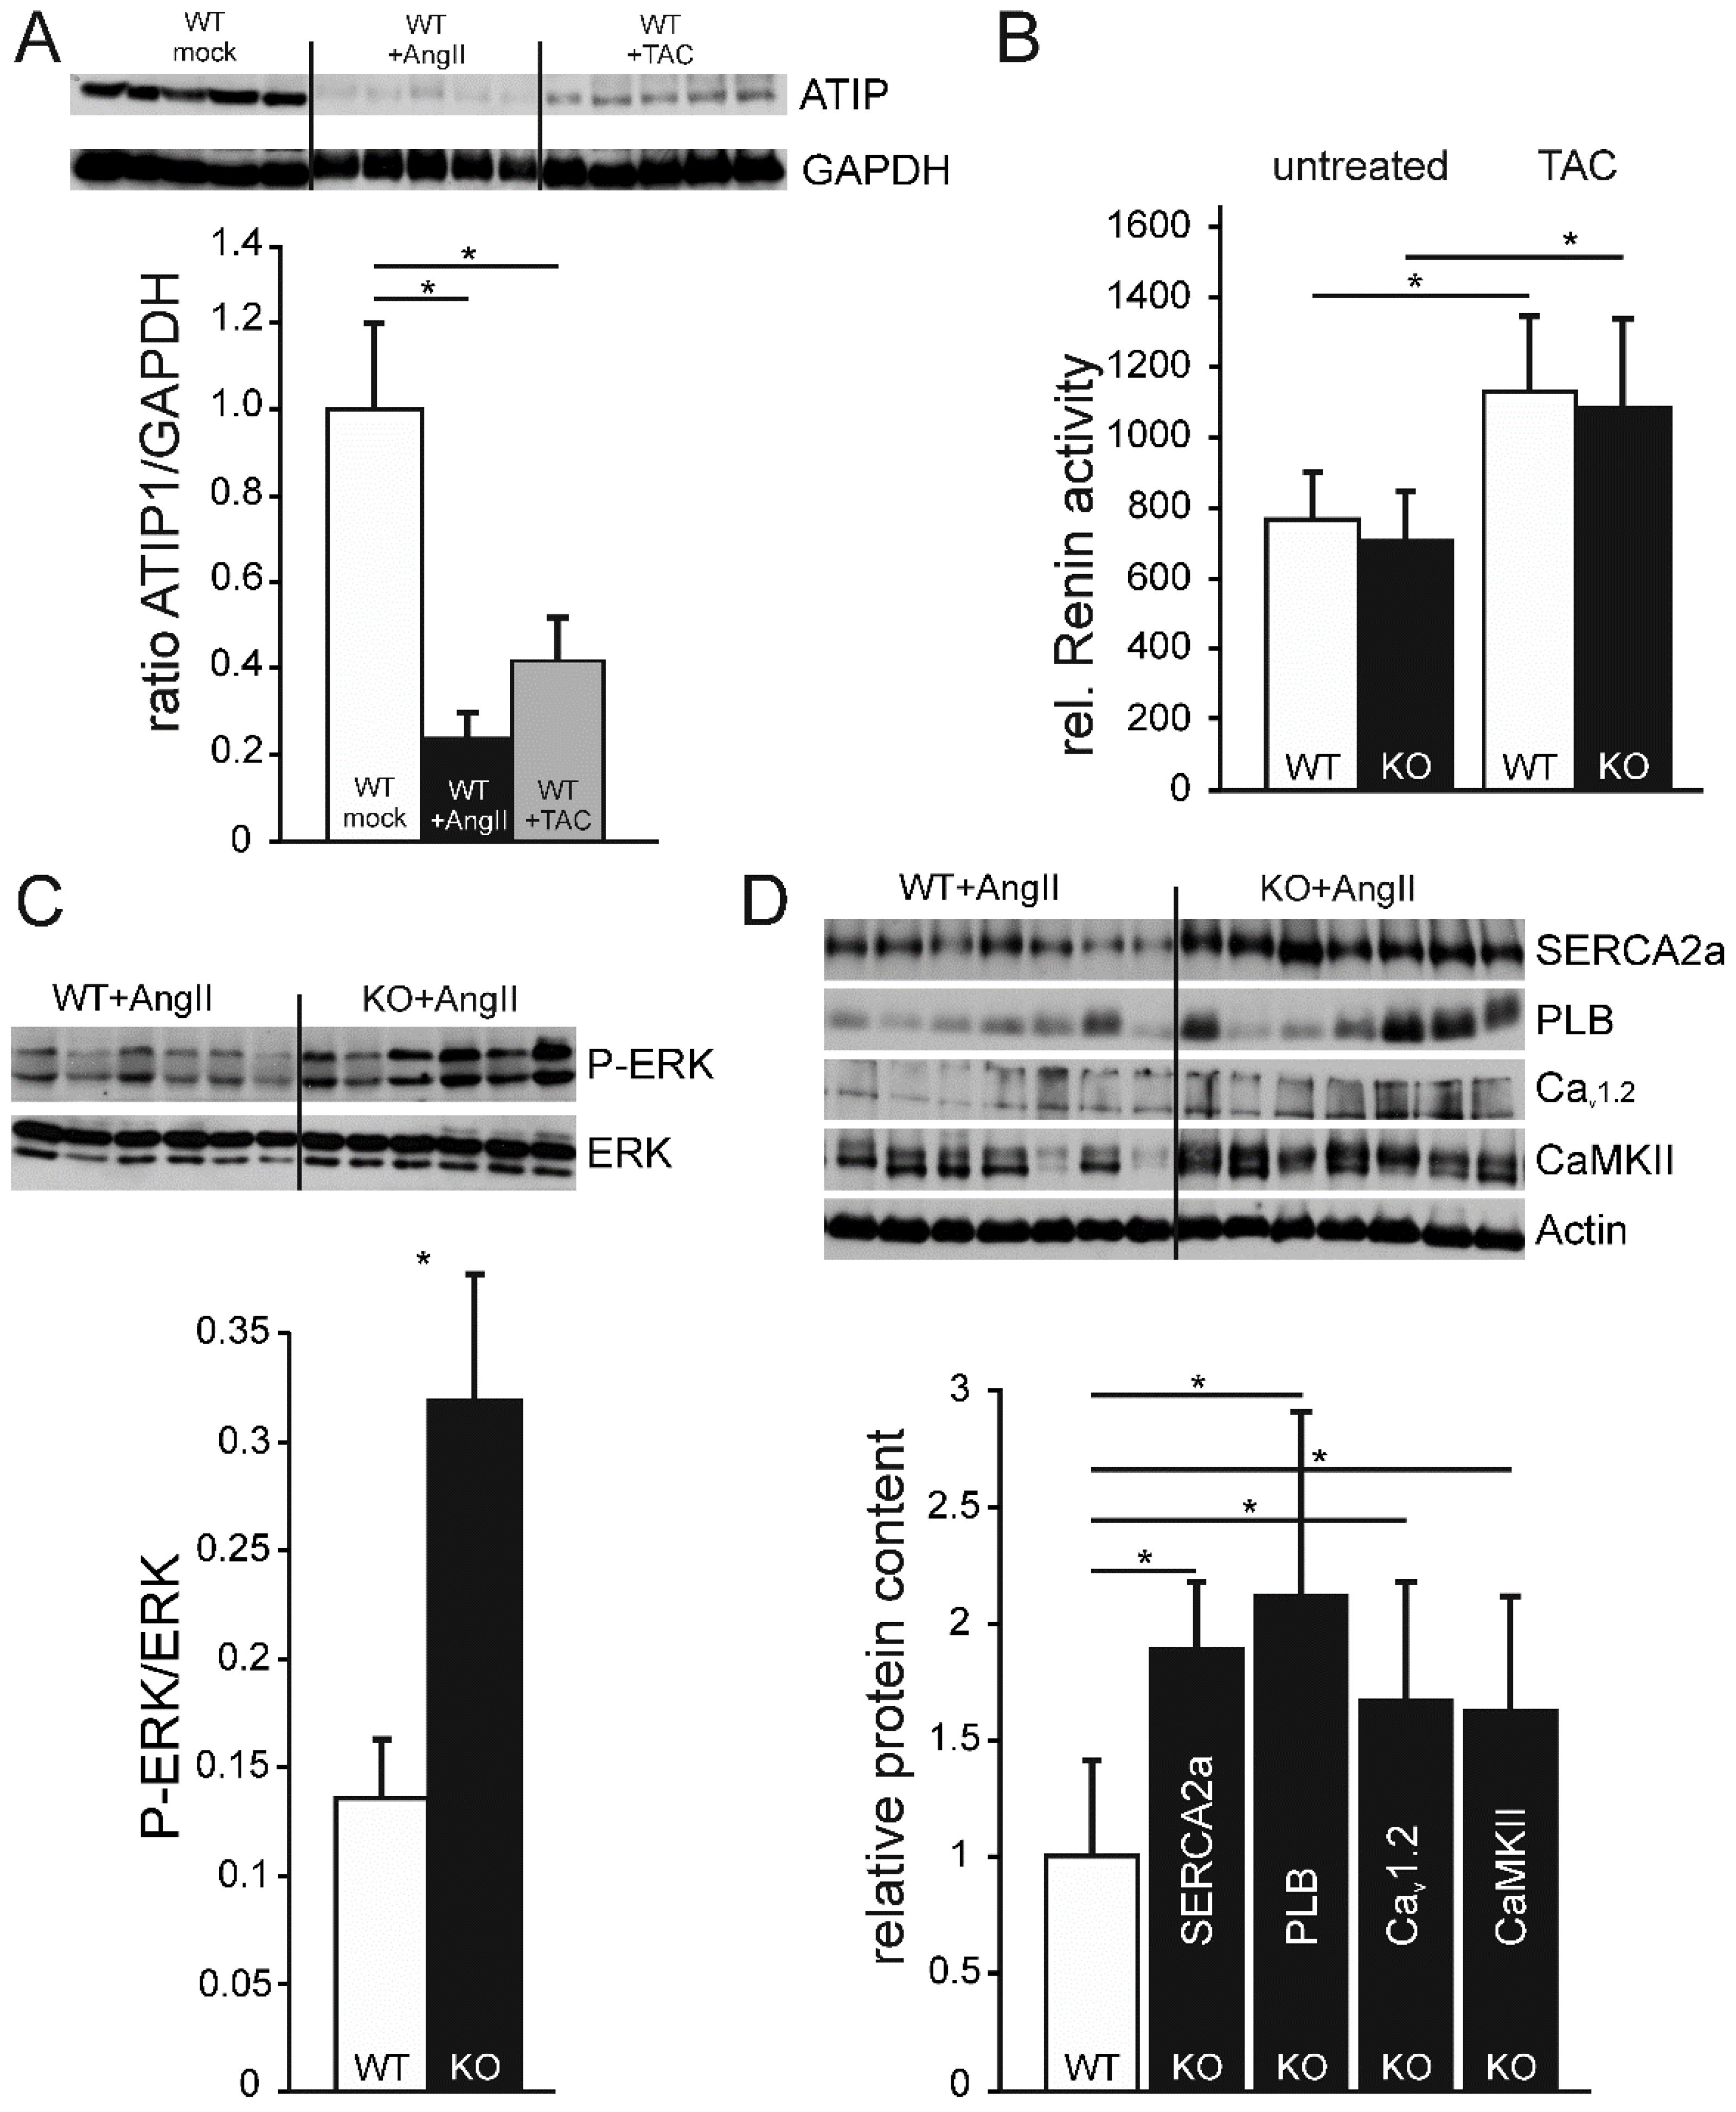
To determine if ATIP1 levels change in response to hypertrophic stimuli, we estimated ATIP1 levels in relation to the housekeeping protein GAPDH. Unexpectedly, both interventions led to a considerable decrease in ATIP1 expression, two weeks of chronic AngII administration to an even more pronounced decline than pressure overload by TAC (Figure 7A).
- Unaltered Renin Activity in ATIP1-deficient Mice
In order to test if the observed ATIP1 expression in kidneys might alter Renin activity under basal conditions or after aortic constriction, we estimated Renin protease activity by a fluorometric assay. Renin activity, neither in the untreated groups nor after aortic constriction differed between WT and KO serum samples. Nevertheless, the post-stenotic decrease in blood pressure induced a comparable increase in Renin activity in both groups, reflecting an appropriate response to reduced renal perfusion (Figure 7B).
- Increased ERK Phosphorylation in ATIP1-KO Hearts after Chronic AngII Treatment
Western blots of ATIP1-KO and WT heart lysates from mice which had been chronically treated with AngII via osmotic mini pumps for two weeks showed a significant genotype-dependent relative increase of ERK phosphorylation in ATIP1-KO mice (Figure 7C, n=12, p<0.05), indicative for a missing anti-hypertrophic inhibition mediated by the new AT2/ATIP signaling pathway [20].
- Relative Increase of Proteins Involved in Ca2+ Cycling and Ca2+-dependent Signaling in ATIP1-KO Hearts after Chronic AngII Treatment
Based on the changes in Ca2+ Cycling and Ca2+-dependent signaling, we asked if the AngII-induced reduction of left-ventricular performance of ATIP-KO hearts might be paralleled by changed expression levels of proteins involved in Ca2+ cycling and Ca2+-dependent signaling. After chronic AngII administration, expression levels of SERCA2a and Phospholamban were approximately two-fold compared to WT controls and expression of the voltage-gated Ca2+ channel Cav1.2 and the Ca2+/Calmodulin-dependent Kinase CaMKII increased about 50% (Figure 7D).
4. Figures, Tables
Figure 1.
Co-localization studies using confocal laser scanning microscopy. Localization of ATIP1 at the plasma membrane of isolated cardiomyocytes (A-F), supported by co-localization with the AT2 (B, C) and the plasma membrane Ca2+ ATPase PMCA (E, F) and not with actin (G). (H, I) Antibody control; bars: 50 μm. (J) Expression of ATIP1 in different tissues detected by Northern blotting. (BALB/c male mouse, mRNA). Additionally to the observed expression in the heart, ATIP1 transcripts were also detected in other tissues, e.g. kidney, liver and testis. (K, L) Lysates of HEK293 cells, which were single- and double-transfected with ATIP1 and AT2 expression constructs were immunoprecipitated (IP) with antibodies against ATIP1 or AT2 and the precipitated material was analyzed by Western blot (WB) with antibodies against ATIP1 and AT2.
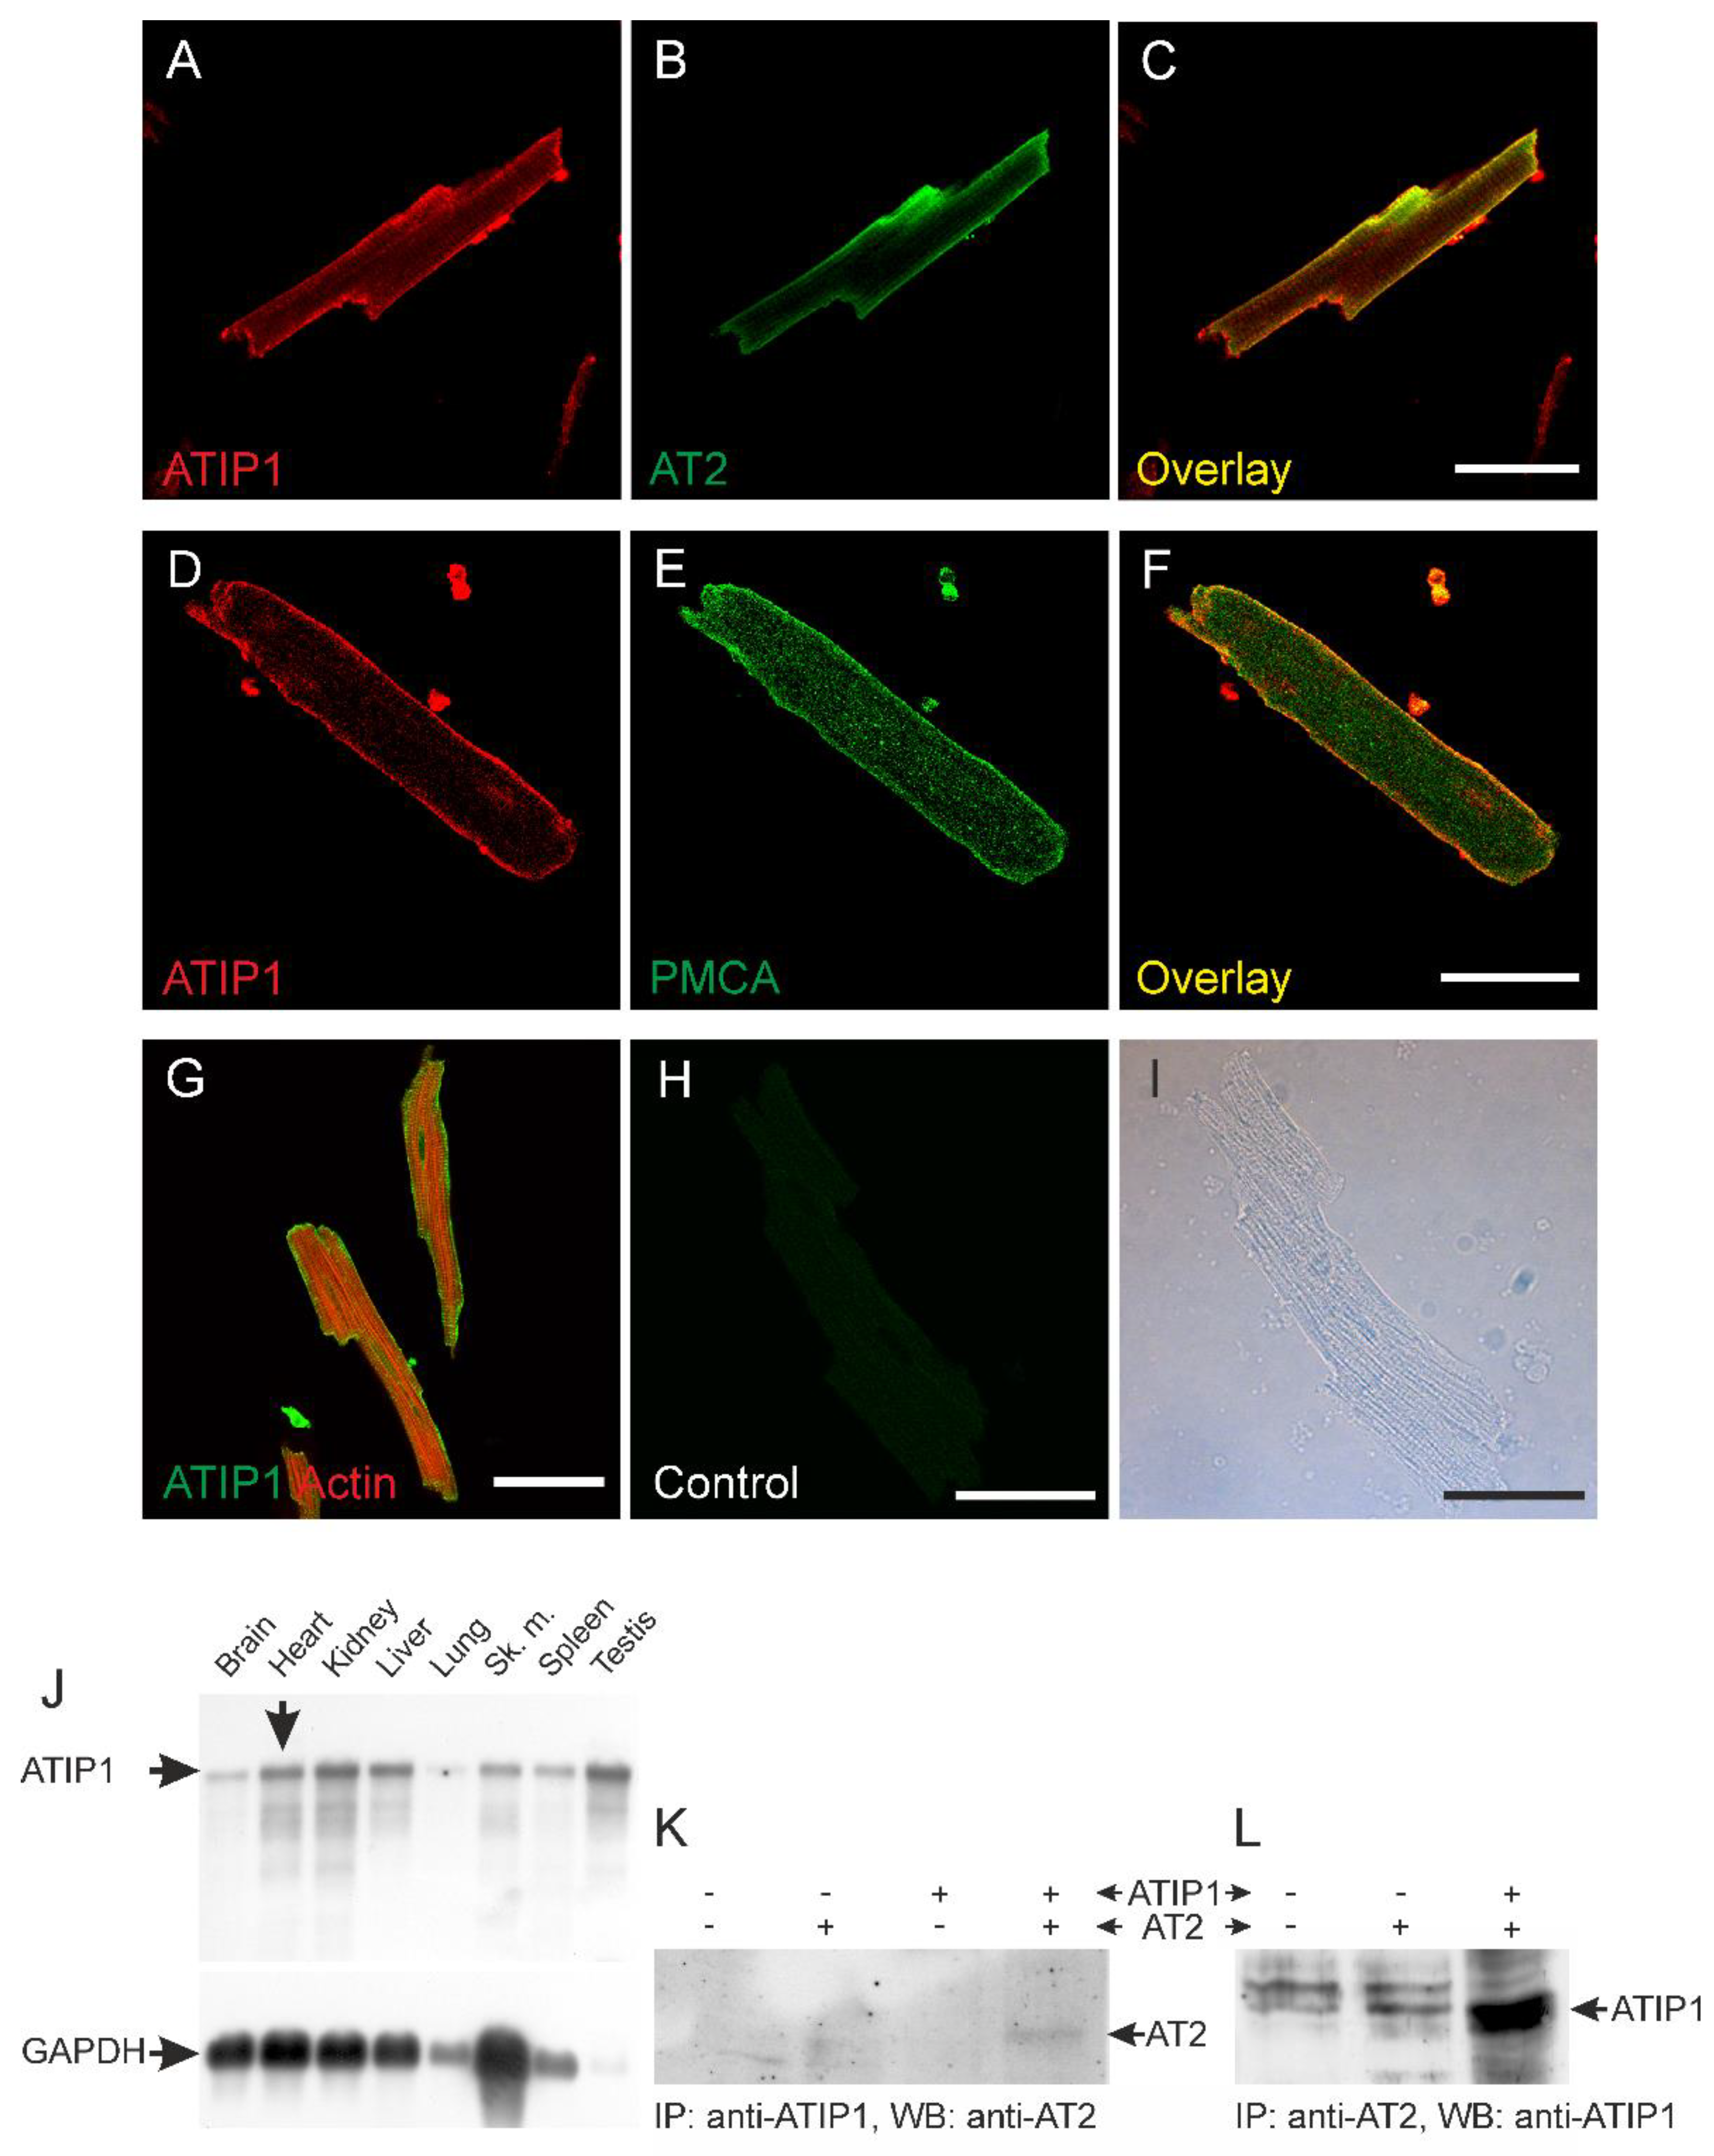
Figure 2.
Gene disruption. (A) Predicted ATIP1 splice variants and cloning of the heart specific murine splice variant 4 by RACE-PCR with gene-specific primers R1 and R2 located within the common exon 8. Additionally, RT-PCRs for full-length splice variants detected only splice variant 4 but neither variant 1 nor variant 3 in heart (B). (C) Insertion of the gene trap vector into the Atip1 gene. The gene trap vector was integrated after the third exon of the heart-specific splice variant 4. It contains a splice acceptor (SA), a reporter gene (β-geo) and an SV40 polyadenylation signal. Insertion of the gene trap vector results in artificially spliced fusion transcripts of upstream exons and the β-geo reporter gene (C). Primers (Pr.1, Pr.2 and Pr.3) used for genotyping are shown in (C). Genotyping by PCR using primers 1 and 2 for the KO PCR and primers 1 and 3 for the WT PCR. PCR products are 500 bp for KO and 900 bp for WT alleles, respectively (D). (E) RT-PCR with heart RNA of KO and WT mice verified the knockout on RNA level. (F) Western blots revealed a complete loss of ATIP1, e.g. in heart, lung, liver, and spleen of ATIP1-KO animals.
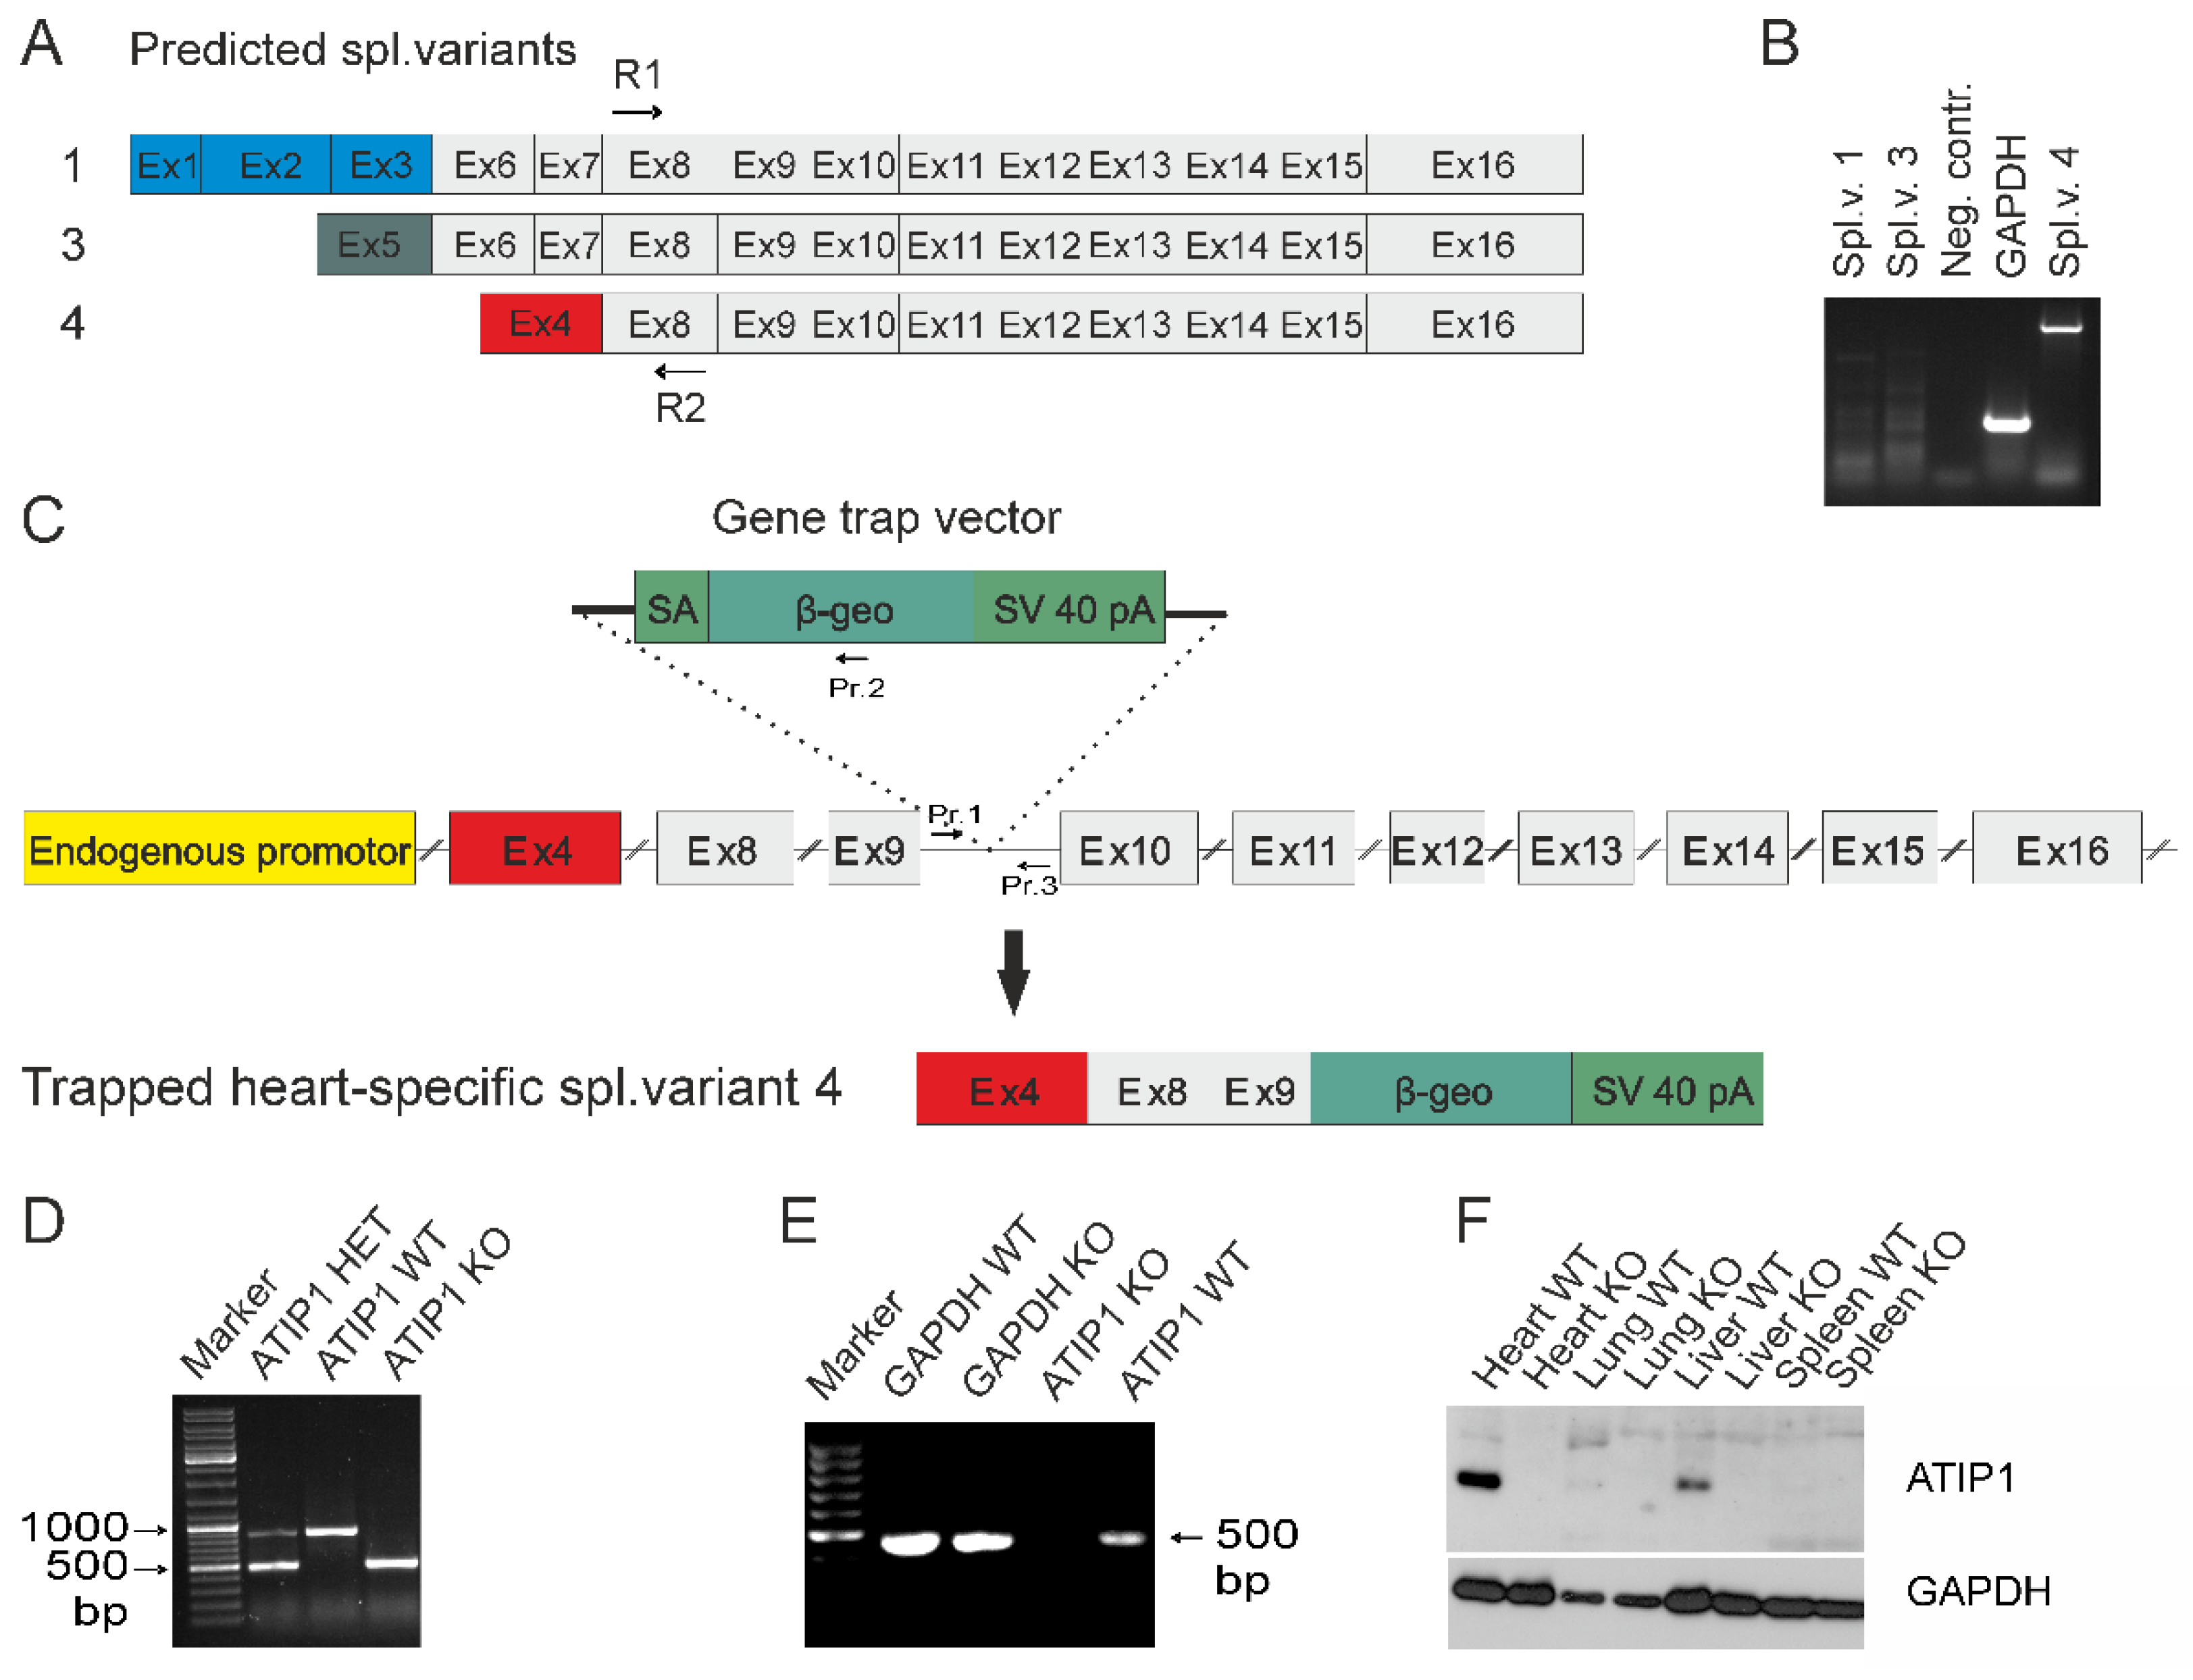
Figure 3.
Atip1 gene promoter activity in the heart and in isolated cardiomyocytes. Intensive X-Gal staining in ATIP1-KO hearts (E), cross (B, D) and longitudinal (A, E) cryosections, and in isolated cardiomyocytes (G) compared to WT (C, F, H) were indicative for a strong Atip1 promoter activity in cardiomyocytes.
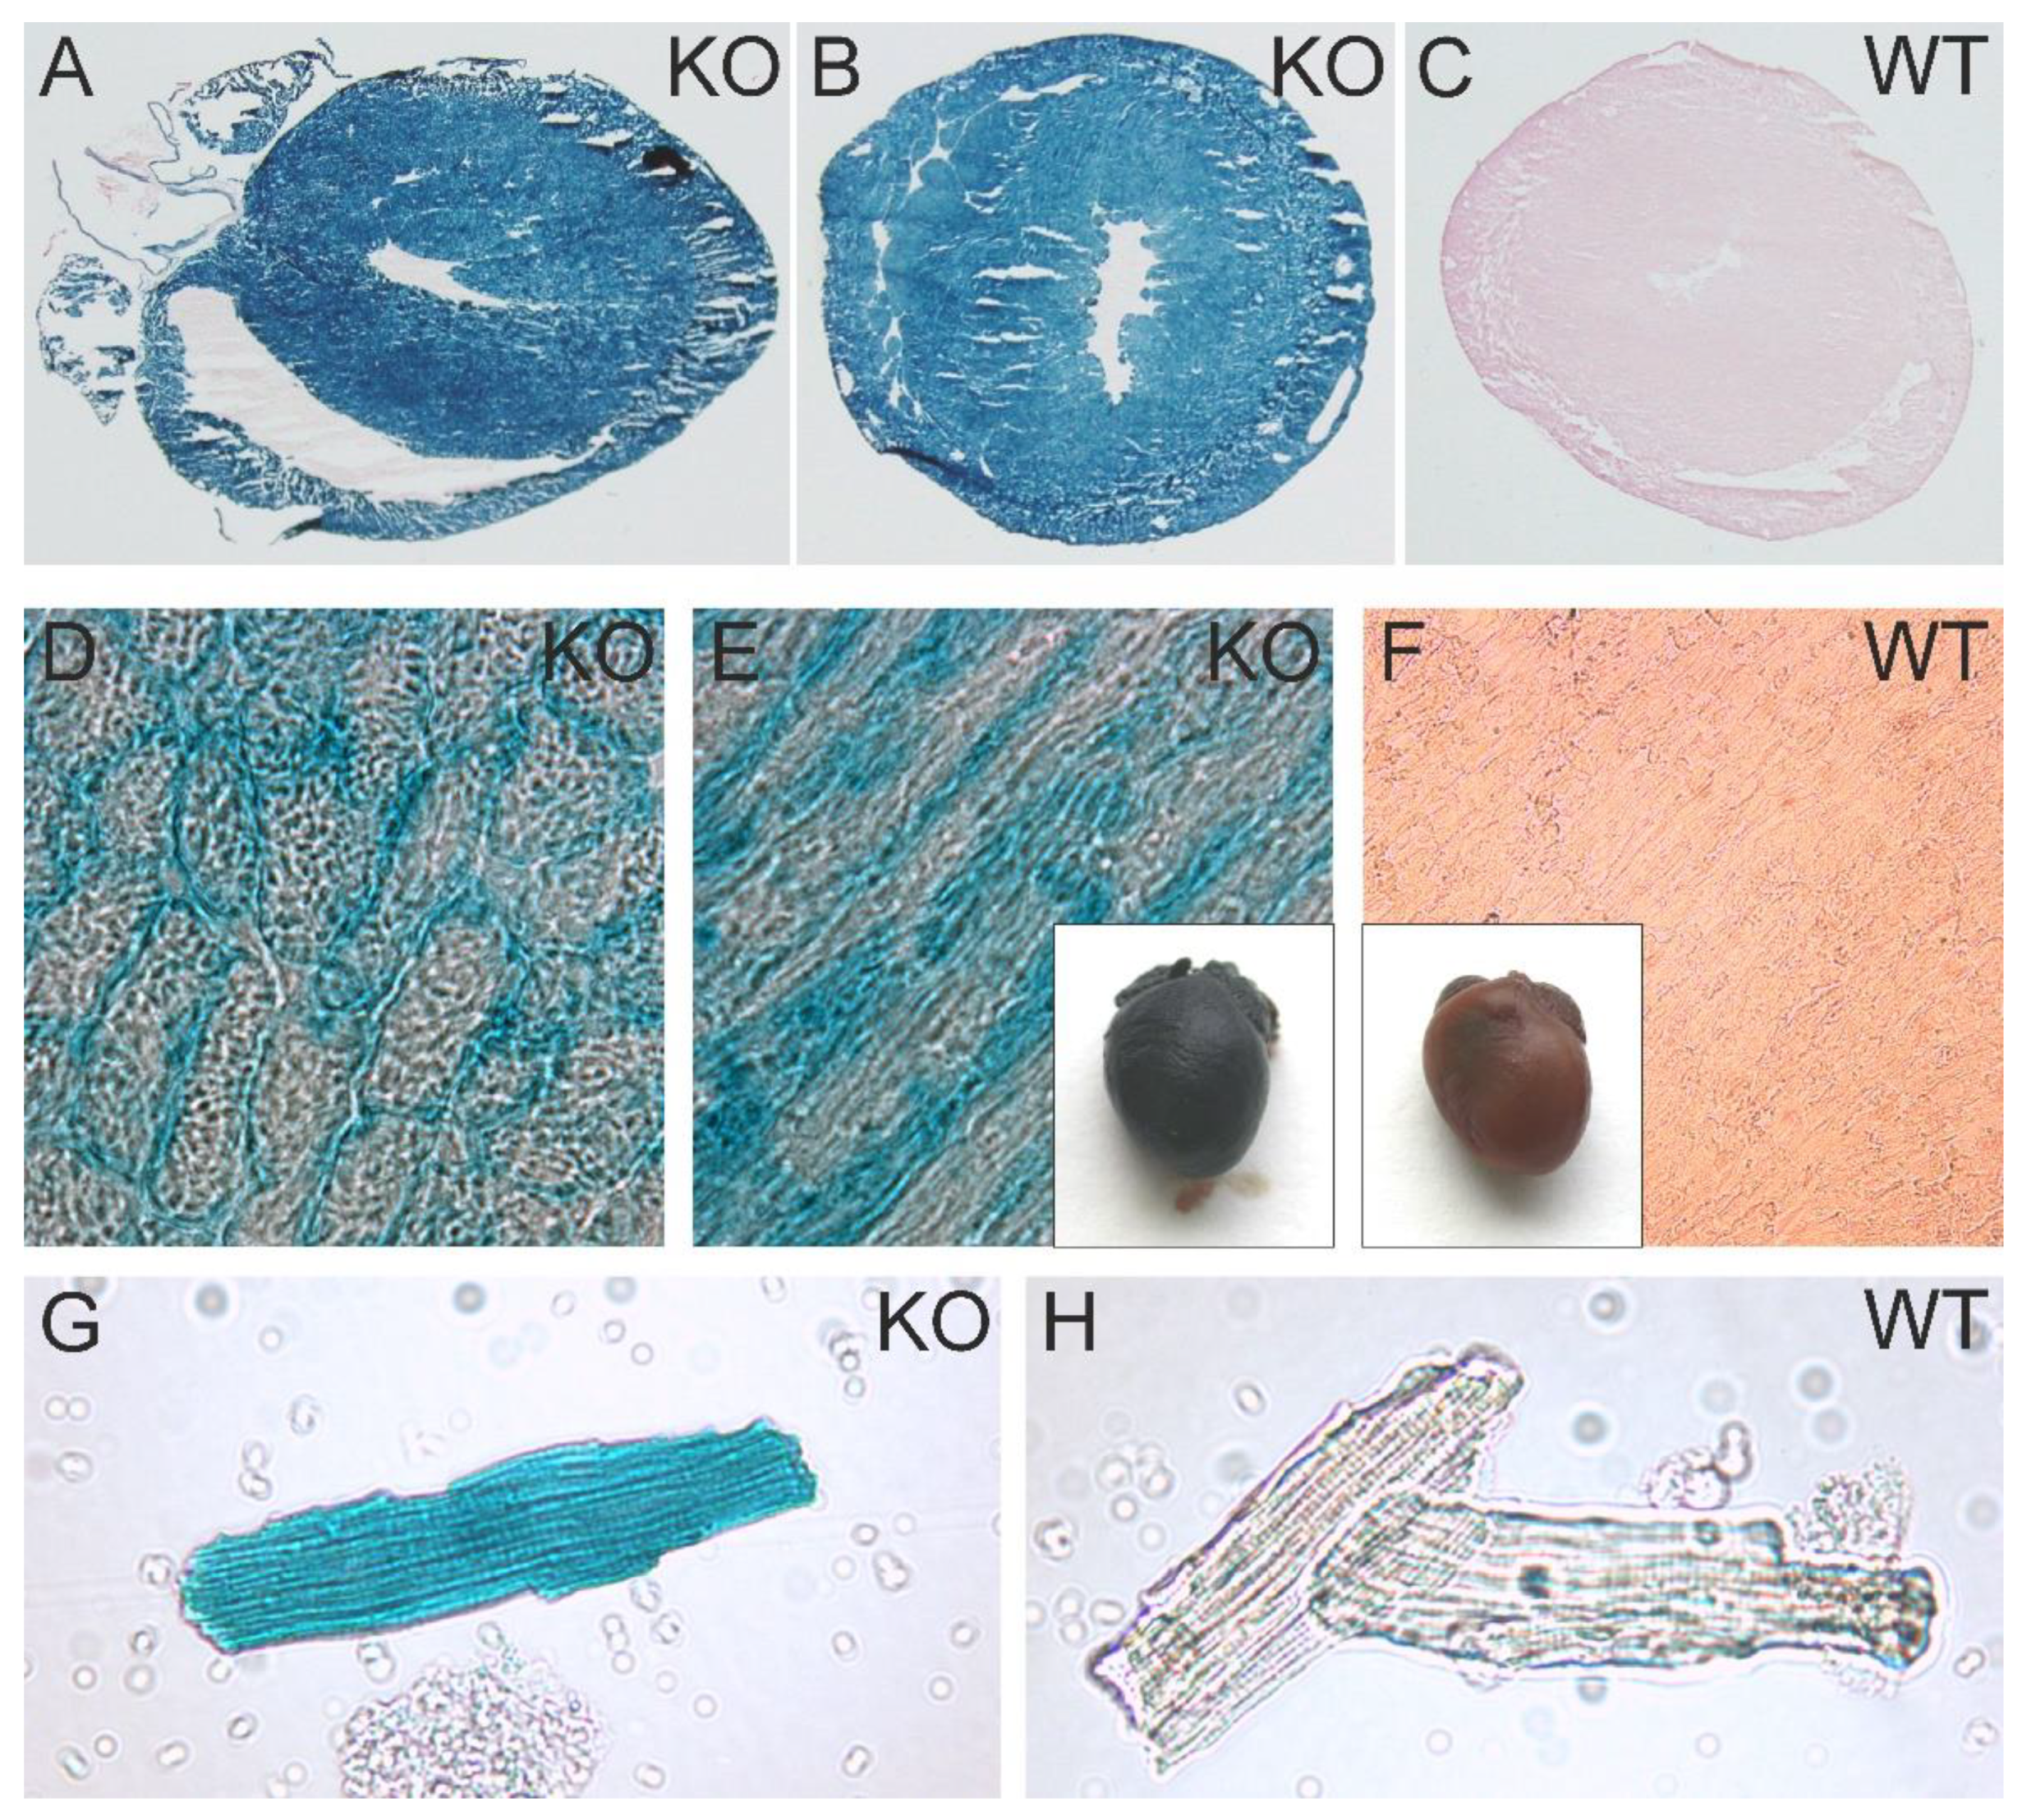
Figure 4.
Cardiac hypertrophy in ATIP1-KO was not caused by hypertension. ATIP1 knockout mice developed spontaneously a cardiac hypertrophy, reflected by a significantly increased heart to body weight ratio from 4.7 mg/g in WT to 6.4 mg/g in KO animals (n=20, p<0.005, A) in the presence of an unchanged systemic blood pressure (n=25, n.s., B). The hypertrophy was characterized by enlarged cardiomyocytes diameters, estimated by quantitative morphometry of PAS-stained left ventricular myocardial sections (n=12, p=2.6*10-5, C). (D) Relative myocardial fibrosis assessed by Sirius red staining for collagen was also significantly increased in KO animals, as compared to WT controls (n=12, p=0.028) (*, p<0.05).
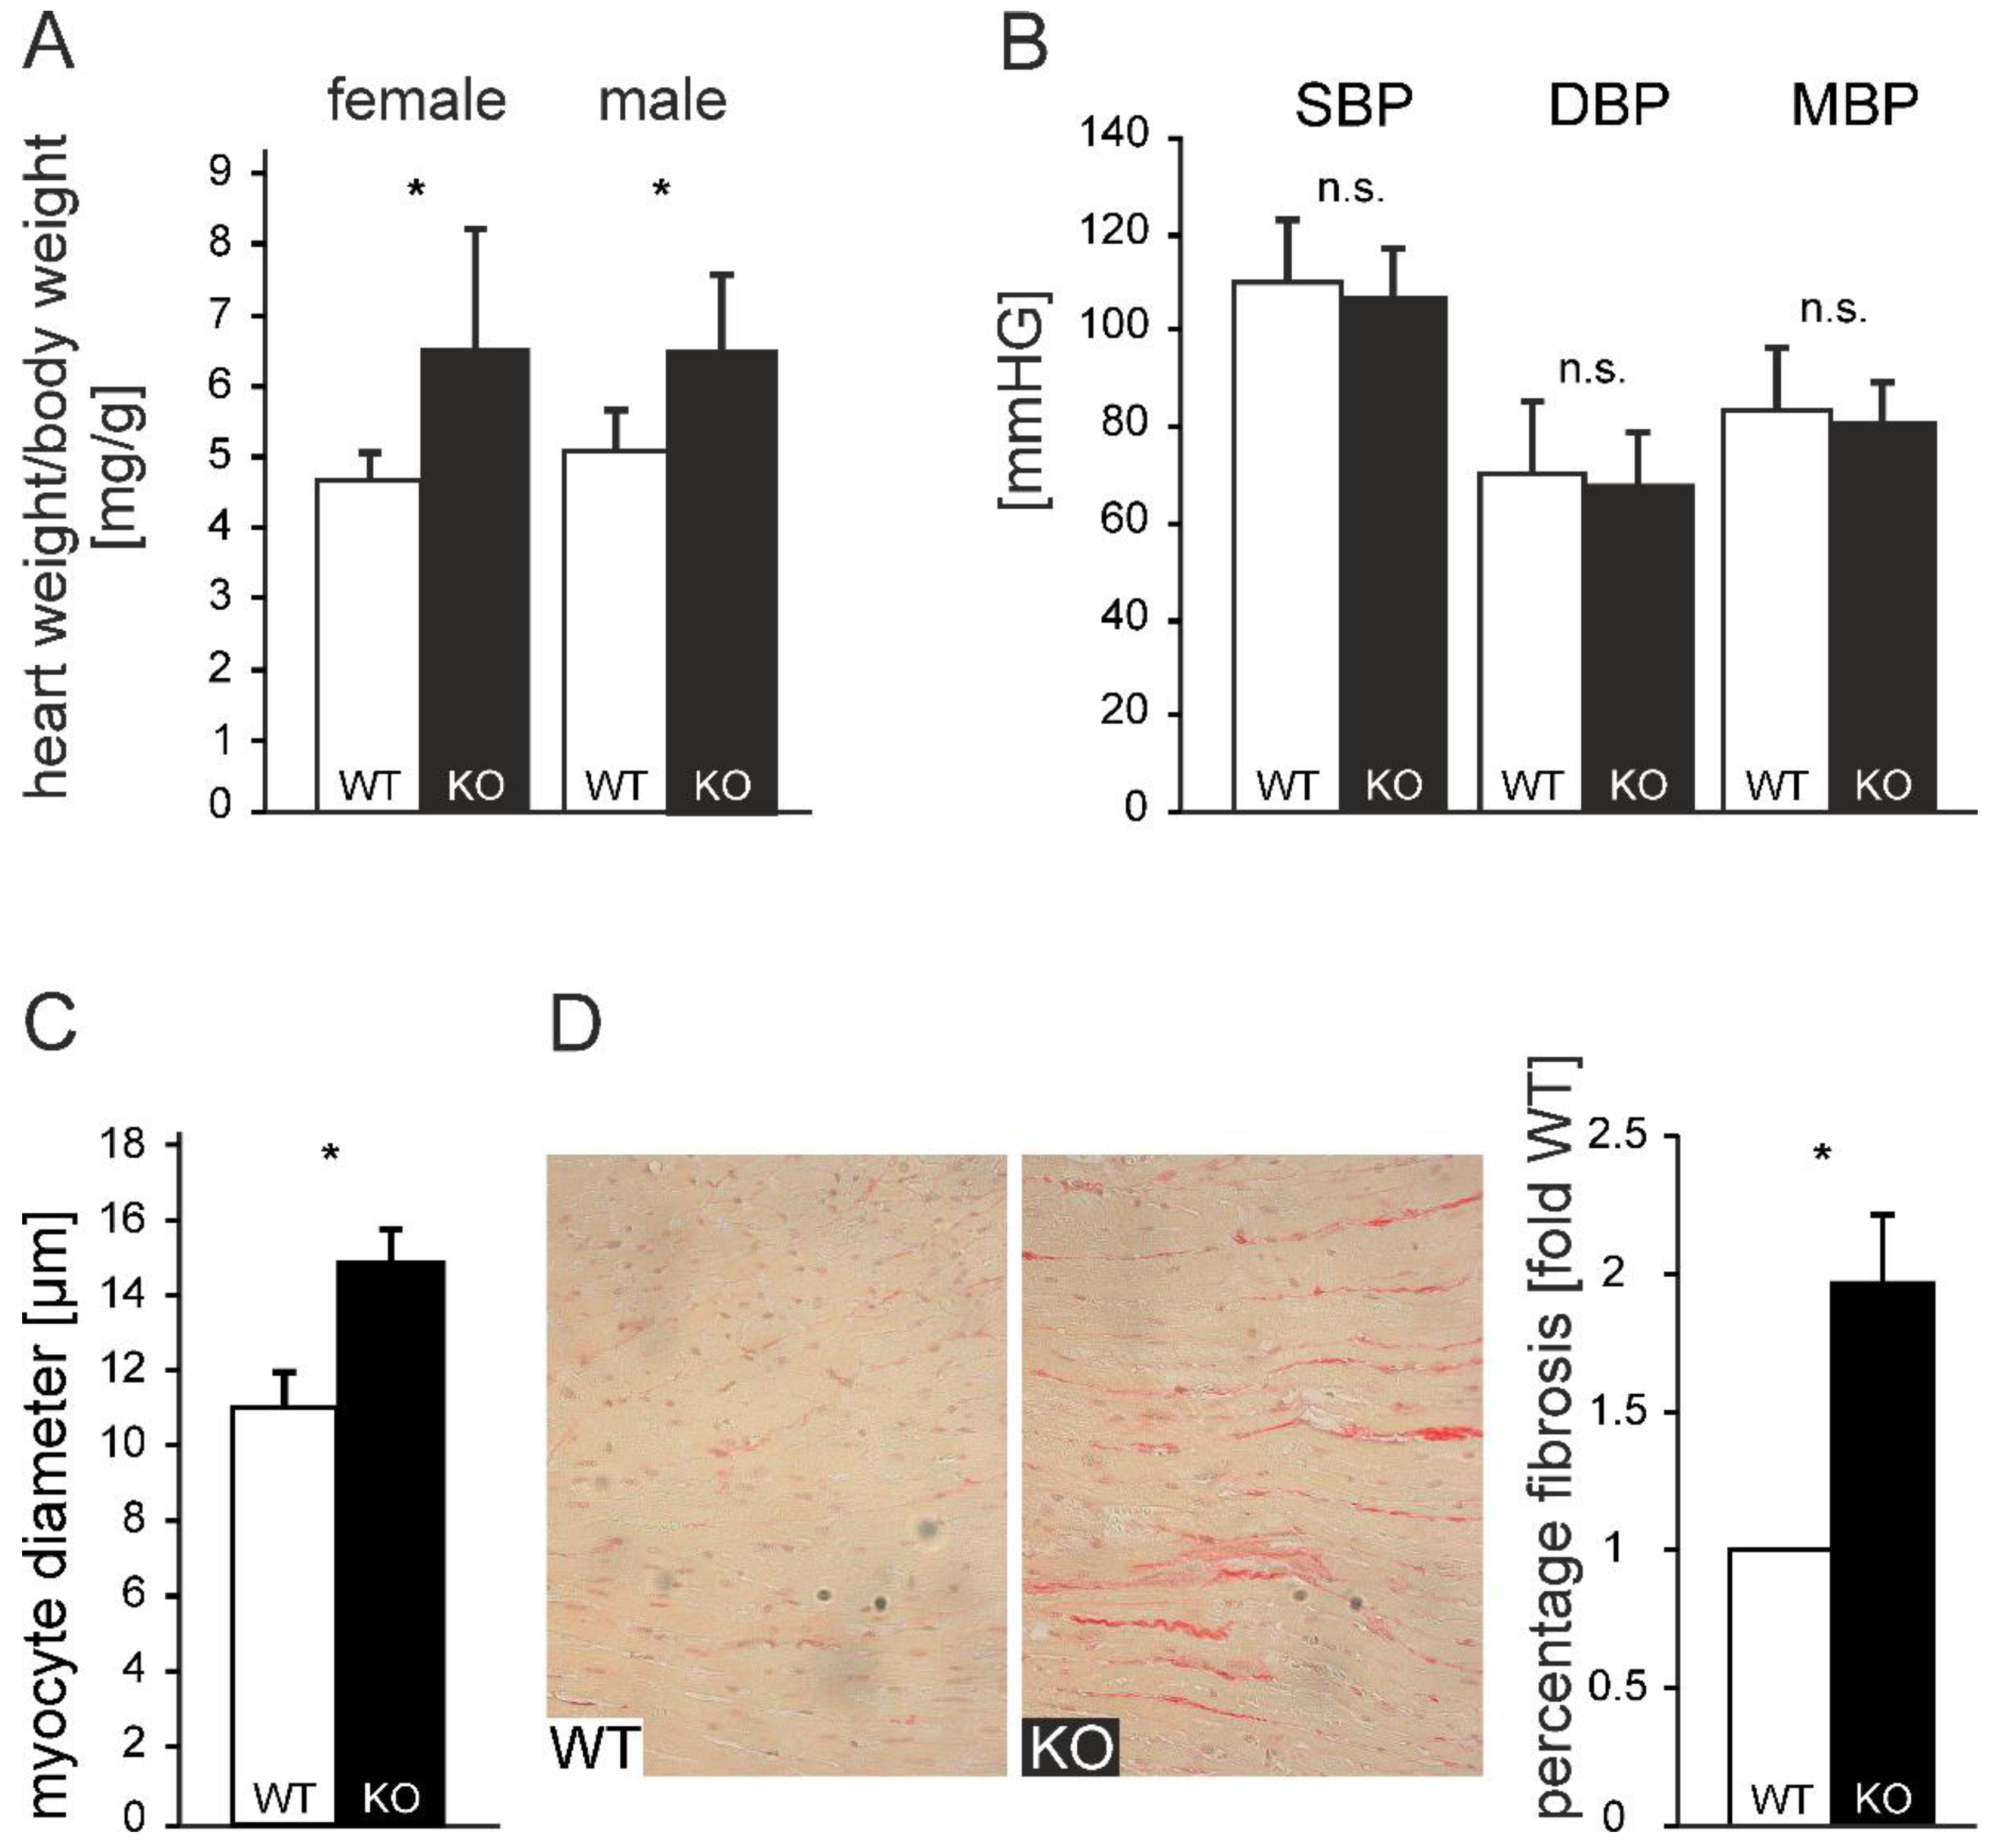
Figure 5.
Functional measurements of isolated ventricular cardiomyocytes. (A) Exemplary original recordings of fractional cell shortening (upper panels) and Ca2+ transients (lower panels) measurements at basal conditions (1Hz) and after treatment with AngII. (B) Force-frequency relationship of fractional shortening. Cells from ATIP1-KO (n=14), WT (n=11), ATIP1-KO treated with AngII (n=13) and WT plus AngII (n=12) §, P<0.05 for WT vs. WT + AngII; $, P<0.05 for ATIP1-KO vs. ATIP1-KO + AngII, and (C) Ca2+ transient amplitude. (D) Relaxation measured as cell length relaxation to 80% of resting cell length and Ca2+ decline. §, p<0.05 for WT vs. WT + AngII.
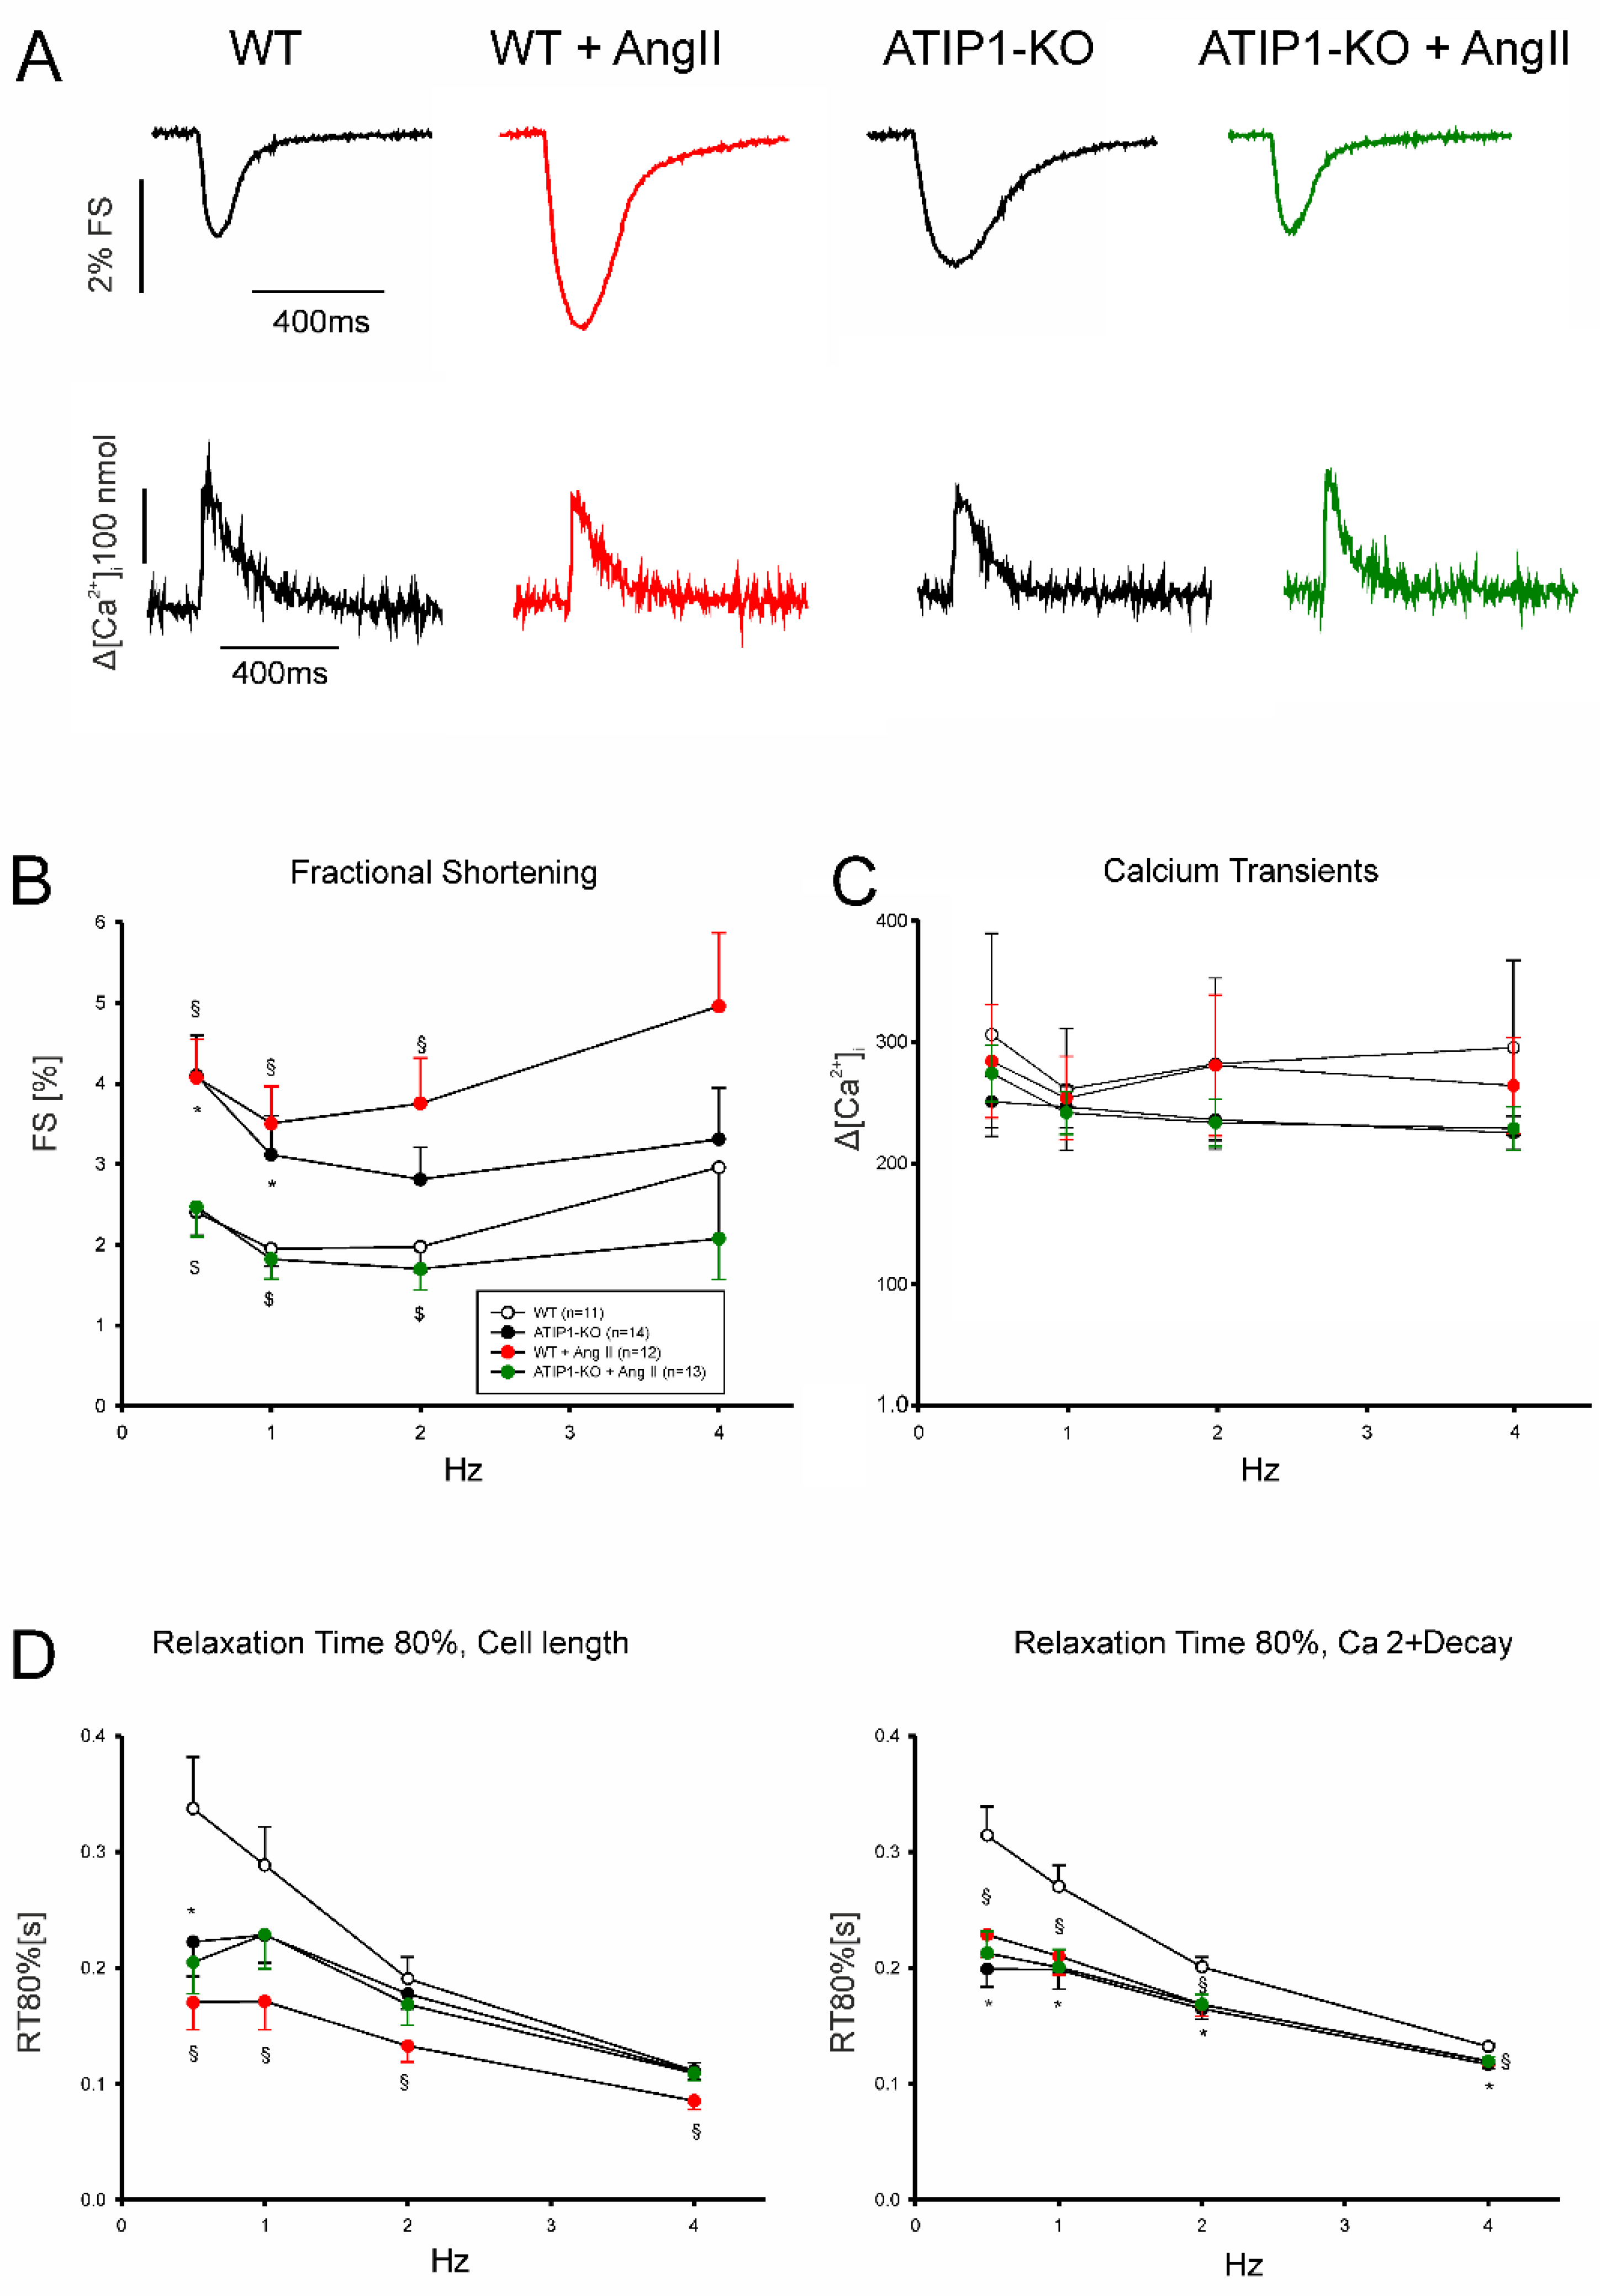
Figure 6.
(A) Original recordings of fractional cell shortening (upper panels) and Ca2+ transients (lower panels) measurements at basal conditions and after treatment with AT2-Agonist CGP. (B) Force-frequency relationship for fractional shortening. Cells from ATIP1-KO (n=9), WT (n=7), ATIP1-KO treated with CGP (n=8) and WT plus CGP (n=7) and (C) Ca2+ transient amplitude. (D) Relaxation measured as cell length relaxation to 80% of resting cell length and Ca2+ decline. *, p<0.05 for WT vs. WT + CGP.
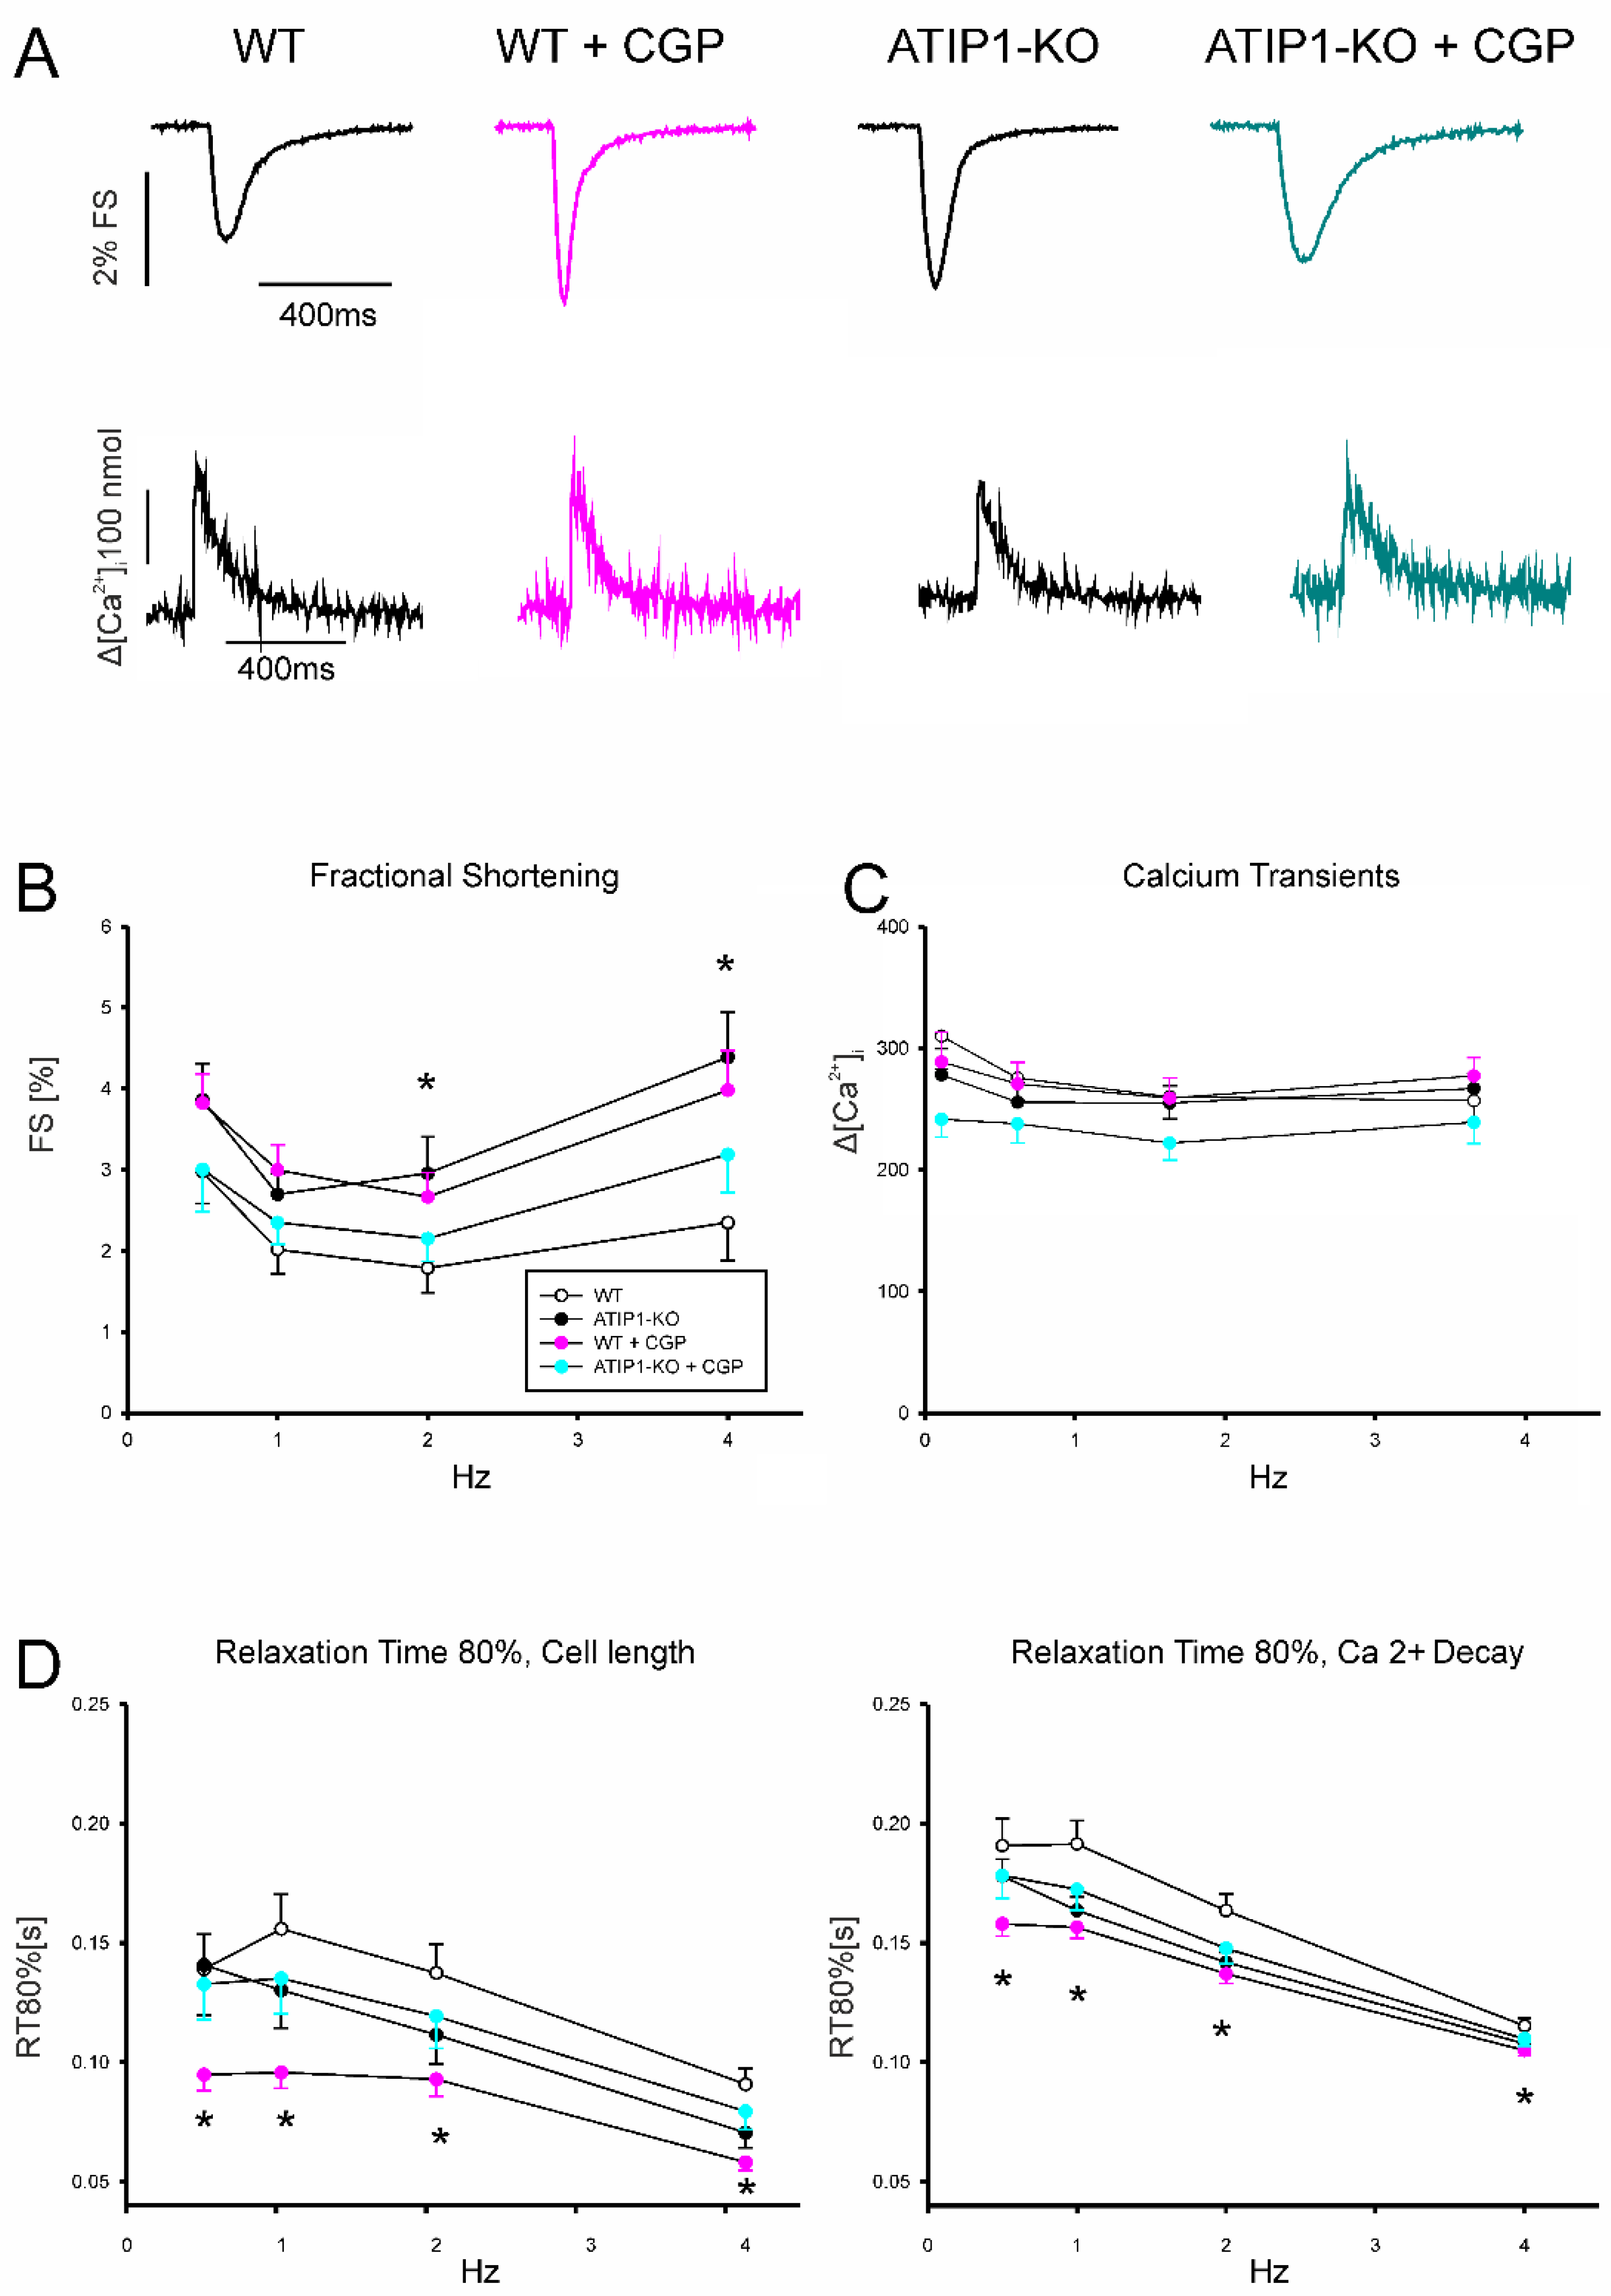
Figure 7.
(A, upper panel) Exemplary Western blot showing ATIP1 expression in heart lysates, either untreated, after chronic AngII administration, and after three weeks TAC. (A, lower panel) ATIP1 expression in heart lysates, either untreated, after chronic AngII administration, and after three weeks TAC in relation to GAPDH signal on the same membranes, respectively (B) Relative serum Renin activity in untreated mice and after three weeks TAC. (C) Western blot analysis revealed a significant increase of ERK phosphorylation in hearts of ATIP1-KO animals after two weeks of chronic AngII infusion (n=12, p<0.05). (D) Relative protein expression of SERCA2a, Phospholamban (PLB), Voltage-gated Ca2+ channel (Cav1.2), and CaMKII. All signals were normalized to cardiac alpha-Actin, WT expression levels were set to a value of 1 and KO-signals are displayed in relation to the WT value (n=12, *, p<0.05).
5. Discussion
Our aim was to unravel the physiological functions of ATIP1 in a loss-of-function mouse model generated by a gene trap approach. In sum, our results suggest an important role of ATIP1 in AT2-dependent signaling in cardiac hypertrophy and regulation of cell contractility.
Our findings in cardiomyocytes are in line with previous publications demonstrating ATIP1 cell membrane association, but in sharp contrast to the suggested localization in mitochondria [17,20,21]. Based on our data, we conclude that membrane-associated interaction with AT2 is likely. Previous publications [19,21], suggesting the existence of various ATIP1 splice isoforms [19,21], prompted us to identify variants expressed in the heart. Using primers, which cover all predicted splice variants, we could sufficiently detect the expression of the murine ATIP1 isoform 4 only. However, we cannot completely exclude the existence of other predicted forms or their expression in other tissues. The functionality and nomenclature of different ATIP1 splice isoforms is not finally set yet. Indeed, different names were used for equivalent variants, e.g. ATIP1, MTUS1, and ATBP50 stand for the shortest variant, originally called Mtus1, variant 4 (NCBI: NM_001005865.2), which we found to be the most abundant in the heart. Additionally, the mouse Mtus1 gene is lacking exons as compared to the human gene, which results in a less complex possible expression pattern [36]. The genetic organization of the Mtus1 gene and a comprehensive overview of described splice variants in different species depicts the complexity of this topic [36], which needs further clarification in the future.
In our model, the gene trap vector insertion resulted not only in a disruption at the genomic level but also on RNA and protein level. There were no signs of leakiness detectable, not even with an antibody generated against the common C-terminus of all possible variants. Based on this, we hereby excluded expression of read-through products or splice variants. Based on our RACE data, identifying isoform 4 as the only isoform expressed in the heart, the gene trap vector inserted past the third used exon, making the expression of a truncated protein unlikely, which was also supported by our Western blotting data. Therefore, our mouse model resembles the first description of ATIP1-deficiency on cardiac function. The use of the β-geo reporter, which was under control of the endogenous Mtus1 promoter, revealed a surprisingly high intensity compared to other organs, thus reflecting the strong Mtus1 promoter activity in the heart. Although the regulation of ATIP1 expression by PARP-1 had been investigated using PARP-1 knockout mice, it has not been confirmed in vivo up to now [22]. Therefore, our gene trap model, reflecting endogenous promoter activity, is an ideal tool to investigate ATIP1 expression in vivo.
The first hint suggesting a putative role of ATIP1 in the heart arose from our observation of an increased heart weight/body weight ratio in KO mice without any gender relation and, most importantly, not caused by altered blood pressure. Transgenic mice constitutively over-expressing ATIP1 under control of the CMV promoter did not have increased blood pressure and any signs of cardiac hypertrophy which is in contrast to our mouse model of ATIP1-deficiency [24]. The increase in heart weight was consistent with other typical signs of cardiac hypertrophy in our mouse model, such as broadened cardiomyocytes, almost doubled amount of cardiac collagen and reduced chamber volumes suggesting concentric hypertrophy. To gain more insight in the mechanisms underlying these phenotypic differences and the previously suggested interaction with AT2 [20,21], we investigated AngII-dependent and AT2-mediated inhibitory pathways. Long-term in vivo treatment with AngII via osmotic mini pumps resulted in a significantly reduced maximum volume, elevated end-systolic pressure, reduced end-diastolic volume, and a diminished cardiac output in KO mice as compared to WT controls. We interpreted these as signs of compensated cardiac hypertrophy. As reflected by the cardiac output, which is elevated after long-term AngII treatment in WT mice but reduced in KO mice, the hypertrophic effects of AngII seem to outbalance the positive inotropic effects in KO hearts. On the molecular level, after long-term AngII treatment the ratio of phospho-ERK to ERK that is a known marker activated in cardiac hypertrophy, was strongly increased in ATIP1-KO hearts, confirming the lack of the inhibitory effect of ATIP1 on ERK activity in our mice [20]. These data imply that ATIP1 is involved in the anti-hypertrophic signaling of AT2.
In addition to that, our functional data from isolated cardiomyocytes reveal important insights about the AT1 and AT2 pathways on regulation of cardiomyocyte contractility. Firstly, our data show that ATIP1 is a critical downstream signal in the AT2 pathway in the regulation of cell shortening. Secondly, our results point to the important but previously poorly understood role of the AT2 in the regulation of the excitation-contraction coupling. The role of AT1 in the heart has been widely explored in the past and is well-established. AT1 mediates the positive inotropic response of AngII in a dose-dependent manner [37], and AT2 has been suggested to antagonize these AT1 effects, although consistent data are missing [38,39]. However, our data clearly support this concept. In our mouse model of ATIP1 deficiency, isolated myocytes reveal at low frequencies (i.e. 0.5 and 1 Hz) a significantly increased shortening compared to WT, although Ca2+ transient amplitudes did not show any significant difference. This is consistent with our in-vivo data, which show significantly increased ejection fraction in ATIP1-KO mice. These findings point to a disruption of the AT2 pathway due to ATIP1 deficiency and loss of the inhibitory effect of AT2 on AT1, which presumably leads to increased contractility in our ATIP1-KO myocytes. For further exploration, we conducted experiments using acute AngII superfusion on isolated cardiomyocytes. Interestingly, while Ang II significantly increased contractility in cells from WT mice, it was reduced in cells from ATIP1-KO mice by Ang II. In cells from WT mice, the increase in contractility by AngII reflects the well-known positive inotropic effect of AngII. This does not occur in myocytes from ATIP1-KO mice, which might be due to the already maximally activated AT1-pathway in ATIP1-KO lacking the inhibitory effect of AT2. Nevertheless, this observation needs to be further validated, as we did not address it in our model. To further explore the putatively defective AT2 pathway, we used the AT2 selective agonist CGP42112A in a subset of experiments. Similar to our experiments with AngII, CGP42112A exerted a positive inotropic response in cardiomyocytes from WT mice, but contractility was reduced in cells from ATIP1-KO mice. This furthermore gives evidence for a properly working AT2 signal cascade in WT cells and a disruption of the AT2 pathway in ATIP1-KO cells. Strikingly, throughout our experiments we did not detect any differences in the Ca2+ transient amplitudes between those groups albeit significant differences in cell shortening occurred. This might at least partly be explained by altered myocyte Ca2+ sensitivity in our mouse model, as AngII mainly exerts its inotropic effects through altered myocyte Ca2+ sensitivity and only in part through altered Ca2+ fluxes that are reflected by the Ca2+ transient amplitude [40,41]. Nevertheless, this finding needs further exploration.
Concerning relaxation properties, cardiomyocytes from ATIP1-KO mice exhibited slightly faster relaxation compared to cells from WT mice. Since the function of the Na+/Ca2+ exchanger (NCX) measured as Ca2+ decline following local application of caffeine was unchanged, it is suggestive that increased SERCA2a activity is responsible for the faster relaxation in ATIP1-KO cells. This is in line with the observation of increased SERCA2a expression in ATIP1-KO hearts. Interestingly, AngII accelerated relaxation in cells from WT mice but not in cells from ATIP1-KO, which furthermore stresses a disturbed AngII pathway in ATIP1-KO mice. Moreover, relaxation was also accelerated in cells from WT mice but unaffected in cells from ATIP1-KO mice by CGP42112A.
Our in vivo data and data from isolated cardiomyocytes clearly support the biochemically demonstrated evidence of physical and functional interaction of ATIP1 and AT2 [20,21]. In sum, loss of ATIP1 disrupts an anti-hypertrophic signaling cascade in KO mice, resulting in spontaneous cardiac hypertrophy. Additionally, we provide first evidence that ATIP1 is a downstream signal in the AT2 pathway impacting cardiomyocyte contractility presumably through disinhibition of the AT1-pathway.
6. Conclusions
In sum, loss of ATIP1 disrupts an anti-hypertrophic signaling cascade in KO mice, resulting in spontaneous cardiac hypertrophy. Additionally, we provide evidence that ATIP1 is a downstream signal in the AT2 pathway impacting cardiomyocyte contractility presumably through disinhibition of the AT1-pathway.
Author Contributions
Conceptualization, T.F. and K.S.; methodology, T.F., S.G., N.S., P.M.B., B.F., M.U., M.A., J.R., A.G.R., L.S.M., H.A.B.; software, M.A., J.R., A.G.R., K.S.; validation, P.M.B., M.U., L.S.M., K.S.; formal analysis, M.A., S.G., N.S., J.R., A.G.R.; investigation, T.F., B.F., A.G.R., J.R., H.A.B; resources, K.S.; data curation, P.M.B, M.U., and K.S..; writing—original draft preparation, K.S..; writing—review and editing, S.G., and K.S.; visualization, T.F. and K.S.; funding acquisition, K.S. All authors have read and agreed to the published version of the manuscript.
Funding
We are grateful to the Comprehensive Heart Failure Center Wuerzburg for start-up funding of this project to K. Schuh.
Institutional Review Board Statement
The animal study protocol experiments and animal care were performed in accordance with the German legislation on protection of animals and the guide for the care and use of laboratory animals (NIH publication no. 85-23. Revised 1985) and were approved by the local governmental animal care committee at the Government of Lower Franconia, Wuerzburg, Bavaria, Germany (approval code: 55.22531.01-62/08).
Informed Consent Statement
Not applicable.
Acknowledgments
We thank Drs. Christina Zuern and Stefan Seibold for handing over of ATIP1-deficient mice to conduct this study.
Conflicts of Interest
The authors declare no conflicts of interest.
References
- de Gasparo, M.; Catt, K.J.; Inagami, T.; Wright, J.W.; Unger, T. International union of pharmacology. Xxiii. The angiotensin ii receptors. Pharmacol Rev 2000, 52, 415–472. [Google Scholar] [PubMed]
- Kaschina, E.; Unger, T. Angiotensin at1/at2 receptors: Regulation, signalling and function. Blood Press 2003, 12, 70–88. [Google Scholar] [PubMed]
- Lindberg, H.; Nielsen, D.; Jensen, B.V.; Eriksen, J.; Skovsgaard, T. Angiotensin converting enzyme inhibitors for cancer treatment? Acta Oncol 2004, 43, 142–152. [Google Scholar]
- Levy, B.I. Can angiotensin ii type 2 receptors have deleterious effects in cardiovascular disease? Implications for therapeutic blockade of the renin-angiotensin system. Circulation 2004, 109, 8–13. [Google Scholar] [PubMed]
- Widdop, R.E.; Jones, E.S.; Hannan, R.E.; Gaspari, T.A. Angiotensin at2 receptors: Cardiovascular hope or hype? Br J Pharmacol 2003, 140, 809–824. [Google Scholar]
- Horiuchi, M.; Akishita, M.; Dzau, V.J. Recent progress in angiotensin ii type 2 receptor research in the cardiovascular system. Hypertension 1999, 33, 613–621. [Google Scholar]
- Matsubara, H. Pathophysiological role of angiotensin ii type 2 receptor in cardiovascular and renal diseases. Circ Res 1998, 83, 1182–1191. [Google Scholar] [PubMed]
- Siragy, H.M. The role of the at2 receptor in hypertension. Am J Hypertens 2000, 13, 62S–67S. [Google Scholar]
- Stoll, M.; Steckelings, U.M.; Paul, M.; Bottari, S.P.; Metzger, R.; Unger, T. The angiotensin at2-receptor mediates inhibition of cell proliferation in coronary endothelial cells. J Clin Invest 1995, 95, 651–657. [Google Scholar]
- Volpe, M.; Musumeci, B.; De Paolis, P.; Savoia, C.; Morganti, A. Angiotensin ii at2 receptor subtype: An uprising frontier in cardiovascular disease? J Hypertens 2003, 21, 1429–1443. [Google Scholar]
- Carey, R.M.; Jin, X.H.; Siragy, H.M. Role of the angiotensin at2 receptor in blood pressure regulation and therapeutic implications. Am J Hypertens 2001, 14, 98S–102S. [Google Scholar] [CrossRef] [PubMed]
- Hansen, J.L.; Servant, G.; Baranski, T.J.; Fujita, T.; Iiri, T.; Sheikh, S.P. Functional reconstitution of the angiotensin ii type 2 receptor and g(i) activation. Circ Res 2000, 87, 753–759. [Google Scholar] [CrossRef] [PubMed]
- Zhang, J.; Pratt, R.E. The at2 receptor selectively associates with gialpha2 and gialpha3 in the rat fetus. J Biol Chem 1996, 271, 15026–15033. [Google Scholar] [CrossRef] [PubMed]
- Feng, Y.H.; Sun, Y.; Douglas, J.G. Gbeta gamma -independent constitutive association of galpha s with shp-1 and angiotensin ii receptor at2 is essential in at2-mediated itim-independent activation of shp-1. Proc Natl Acad Sci U S A 2002, 99, 12049–12054. [Google Scholar] [CrossRef]
- Cui, T.; Nakagami, H.; Iwai, M.; Takeda, Y.; Shiuchi, T.; Daviet, L.; Nahmias, C.; Horiuchi, M. Pivotal role of tyrosine phosphatase shp-1 in at2 receptor-mediated apoptosis in rat fetal vascular smooth muscle cell. Cardiovasc Res 2001, 49, 863–871. [Google Scholar] [CrossRef]
- Senbonmatsu, T.; Saito, T.; Landon, E.J.; Watanabe, O.; Price, E., Jr.; Roberts, R.L.; Imboden, H.; Fitzgerald, T.G.; Gaffney, F.A.; Inagami, T. A novel angiotensin ii type 2 receptor signaling pathway: Possible role in cardiac hypertrophy. EMBO J 2003, 22, 6471–6482. [Google Scholar] [CrossRef]
- Seibold, S.; Rudroff, C.; Weber, M.; Galle, J.; Wanner, C.; Marx, M. Identification of a new tumor suppressor gene located at chromosome 8p21.3-22. FASEB J 2003, 17, 1180–1182. [Google Scholar] [CrossRef]
- Zuern, C.; Heimrich, J.; Kaufmann, R.; Richter, K.K.; Settmacher, U.; Wanner, C.; Galle, J.; Seibold, S. Down-regulation of mtus1 in human colon tumors. Oncol Rep 2010, 23, 183–189. [Google Scholar] [CrossRef]
- Di Benedetto, M.; Bieche, I.; Deshayes, F.; Vacher, S.; Nouet, S.; Collura, V.; Seitz, I.; Louis, S.; Pineau, P.; Amsellem-Ouazana, D. , et al. Structural organization and expression of human mtus1, a candidate 8p22 tumor suppressor gene encoding a family of angiotensin ii at2 receptor-interacting proteins, atip. Gene 2006, 380, 127–136. [Google Scholar] [CrossRef]
- Nouet, S.; Amzallag, N.; Li, J.M.; Louis, S.; Seitz, I.; Cui, T.X.; Alleaume, A.M.; Di Benedetto, M.; Boden, C.; Masson, M. , et al. Trans-inactivation of receptor tyrosine kinases by novel angiotensin ii at2 receptor-interacting protein, atip. J Biol Chem 2004, 279, 28989–28997. [Google Scholar] [CrossRef]
- Wruck, C.J.; Funke-Kaiser, H.; Pufe, T.; Kusserow, H.; Menk, M.; Schefe, J.H.; Kruse, M.L.; Stoll, M.; Unger, T. Regulation of transport of the angiotensin at2 receptor by a novel membrane-associated golgi protein. Arterioscler Thromb Vasc Biol 2005, 25, 57–64. [Google Scholar] [CrossRef] [PubMed]
- Reinemund, J.; Seidel, K.; Steckelings, U.M.; Zaade, D.; Klare, S.; Rompe, F.; Katerbaum, M.; Schacherl, J.; Li, Y.; Menk, M. , et al. Poly(adp-ribose) polymerase-1 (parp-1) transcriptionally regulates angiotensin at2 receptor (at2r) and at2r binding protein (atbp) genes. Biochem Pharmacol 2009, 77, 1795–1805. [Google Scholar] [CrossRef] [PubMed]
- Pillai, J.B.; Gupta, M.; Rajamohan, S.B.; Lang, R.; Raman, J.; Gupta, M.P. Poly(adp-ribose) polymerase-1-deficient mice are protected from angiotensin ii-induced cardiac hypertrophy. Am J Physiol Heart Circ Physiol 2006, 291, H1545–H1553. [Google Scholar] [CrossRef] [PubMed]
- Fujita, T.; Mogi, M.; Min, L.J.; Iwanami, J.; Tsukuda, K.; Sakata, A.; Okayama, H.; Iwai, M.; Nahmias, C.; Higaki, J. , et al. Attenuation of cuff-induced neointimal formation by overexpression of angiotensin ii type 2 receptor-interacting protein 1. Hypertension 2009, 53, 688–693. [Google Scholar] [CrossRef]
- Stryke, D.; Kawamoto, M.; Huang, C.C.; Johns, S.J.; King, L.A.; Harper, C.A.; Meng, E.C.; Lee, R.E.; Yee, A.; L'Italien, L. , et al. Baygenomics: A resource of insertional mutations in mouse embryonic stem cells. Nucleic Acids Res 2003, 31, 278–281. [Google Scholar] [CrossRef]
- Ullrich, M.; Schuh, K. Gene trap: Knockout on the fast lane. Methods Mol Biol 2009, 561, 145–159. [Google Scholar]
- Ullrich, M.; Bundschu, K.; Benz, P.M.; Abesser, M.; Freudinger, R.; Fischer, T.; Ullrich, J.; Renne, T.; Walter, U.; Schuh, K. Identification of spred2 (sprouty-related protein with evh1 domain 2) as a negative regulator of the hypothalamic-pituitary-adrenal axis. J Biol Chem 2011, 286, 9477–9488. [Google Scholar] [CrossRef]
- Bundschu, K.; Gattenlohner, S.; Knobeloch, K.P.; Walter, U.; Schuh, K. Tissue-specific spred-2 promoter activity characterized by a gene trap approach. Gene Expr Patterns 2006, 6, 247–255. [Google Scholar] [CrossRef]
- Arias-Loza, P.A.; Hu, K.; Schafer, A.; Bauersachs, J.; Quaschning, T.; Galle, J.; Jazbutyte, V.; Neyses, L.; Ertl, G.; Fritzemeier, K.H. , et al. Medroxyprogesterone acetate but not drospirenone ablates the protective function of 17 beta-estradiol in aldosterone salt-treated rats. Hypertension 2006, 48, 994–1001. [Google Scholar] [CrossRef]
- Tchoukalova, Y.D.; Harteneck, D.A.; Karwoski, R.A.; Tarara, J.; Jensen, M.D. A quick, reliable, and automated method for fat cell sizing. J Lipid Res 2003, 44, 1795–1801. [Google Scholar] [CrossRef]
- Sag, C.M.; Dybkova, N.; Neef, S.; Maier, L.S. Effects on recovery during acidosis in cardiac myocytes overexpressing camkii. J Mol Cell Cardiol 2007, 43, 696–709. [Google Scholar] [CrossRef] [PubMed]
- Wagner, S.; Dybkova, N.; Rasenack, E.C.; Jacobshagen, C.; Fabritz, L.; Kirchhof, P.; Maier, S.K.; Zhang, T.; Hasenfuss, G.; Brown, J.H.; et al. Ca2+/calmodulin-dependent protein kinase ii regulates cardiac na+ channels. J Clin Invest 2006, 116, 3127–3138. [Google Scholar] [CrossRef]
- Maier, L.S.; Zhang, T.; Chen, L.; DeSantiago, J.; Brown, J.H.; Bers, D.M. Transgenic camkiideltac overexpression uniquely alters cardiac myocyte ca2+ handling: Reduced sr ca2+ load and activated sr ca2+ release. Circ Res 2003, 92, 904–911. [Google Scholar] [CrossRef] [PubMed]
- Toischer, K.; Rokita, A.G.; Unsold, B.; Zhu, W.; Kararigas, G.; Sossalla, S.; Reuter, S.P.; Becker, A.; Teucher, N.; Seidler, T.; et al. Differential cardiac remodeling in preload versus afterload. Circulation 2010, 122, 993–1003. [Google Scholar] [CrossRef] [PubMed]
- Pacher, P.; Nagayama, T.; Mukhopadhyay, P.; Batkai, S.; Kass, D.A. Measurement of cardiac function using pressure-volume conductance catheter technique in mice and rats. Nat Protoc 2008, 3, 1422–1434. [Google Scholar] [CrossRef]
- Rodrigues-Ferreira, S.; Nahmias, C. An atipical family of angiotensin ii at2 receptor-interacting proteins. Trends Endocrinol Metab 2010. [CrossRef]
- Ishihata, A.; Endoh, M. Pharmacological characteristics of the positive inotropic effect of angiotensin ii in the rabbit ventricular myocardium. Br J Pharmacol 1993, 108, 999–1005. [Google Scholar] [CrossRef]
- Mattiazzi, A. Positive inotropic effect of angiotensin ii. Increases in intracellular ca2+ or changes in myofilament ca2+ responsiveness? J Pharmacol Toxicol Methods 1997, 37, 205–214. [Google Scholar]
- Porrello, E.R.; Delbridge, L.M.; Thomas, W.G. The angiotensin ii type 2 (at2) receptor: An enigmatic seven transmembrane receptor. Front Biosci 2009, 14, 958–972. [Google Scholar] [CrossRef]
- De Mello, W.C.; Monterrubio, J. Intracellular and extracellular angiotensin ii enhance the l-type calcium current in the failing heart. Hypertension 2004, 44, 360–364. [Google Scholar]
- Watanabe, A.; Endoh, M. Relationship between the increase in ca2+ transient and contractile force induced by angiotensin ii in aequorin-loaded rabbit ventricular myocardium. Cardiovasc Res 1998, 37, 524–531. [Google Scholar] [CrossRef] [PubMed]

Table 1.
Haemodynamic parameters before and after chronic AngII administration or transversal aortic constriction (TAC). n=12 in each group, Ap≤0.05 KO without Ang II vs. WT without Ang II; Bp≤0.05 WT after Ang II vs. WT without Ang II; Cp≤0.05 KO after Ang II vs. KO without Ang II; Dp≤0.05 KO after Ang II vs. WT after AngII; Ep≤0.05 KO TAC vs. WT TAC; NIBP, Non-invasive blood pressure; HW/BW, heart/body weight ratios; CO, cardiac output; dP/dtmax, peak rate of pressure rise; dP/dtmin, peak rate of pressure decline; Ea, arterial elastance (measure of ventricular afterload); EDV, end-diastolic volume; EF, ejection fraction; ESP, end-systolic pressure; ESV, end-systolic volume; HR, heart rate; Tau (W), relaxation time constant calculated by Weiss method (regression of log(pressure)); V@dP/dt max, Volume at dP/dt max; V@dP/dt min, Volumen at dP/dt min; P@dP/dt max, Pressure at dP/dt max; SV, Stroke Volume.
| Haemodynamics / NIBP | untreated | After Ang II | TAC | |||
| WT | KO | WT | KO | |||
| NIBP | ||||||
| SBP (mmHG) | 112 | 106 | 129B | 130C | ||
| DBP (mmHG) | 75 | 71 | 90 | 86 | ||
| MBP (mmHG) | 87 | 84 | 102 | 102 | ||
| HR (min-1) | 678 | 620 | 617 | 592 | ||
|
Haemodynamic parameters (isoflurane) |
WT | KO | ||||
| HW/BW (mg/g) | 4.7 | 6.4A | 5.0 | 6.6D | 6.9 | 7.6E |
| HR (min-1) | 478.00 | 508.36 | 489.56 | 446.89C | 505.1 | 493.90 |
| Maximum Volume (µl) | 23.08 | 17.32A | 14.49B | 11.63C,D | 21.2 | 20.6 |
| Minimum Volume (µl) | 15.06 | 9.65A | 5.33B | 3.67C,D | 10.5 | 9.5 |
| Maximum Pressure (mmHg) | 100.36 | 96.92 | 105.51 | 108.15C | 178.9 | 165.1 |
| SV (µl) | 8.02 | 7.68 | 5.32 | 7.45 | 10.6 | 8.2E |
| ESP (mmHg) | 99.03 | 93.27 | 100.49 | 103.01C | 162.0 | 155.4 |
| ESV (µl) | 13.58 | 10.44A | 5.55B | 4.23C | 12.2 | 14.0 |
| EDV (µl) | 22.34 | 16.45A | 13.72B | 10.42C,D | 20.8 | 20.0 |
| CO (µl min-1) | 3844.92 | 3941.22 | 4445.77 | 3519.55D | 5345.4 | 3829.0E |
| V@dP/dt max (µl) | 22.60 | 16.88A | 13.65B | 11.12C,D | 20.6 | 20.1 |
| V@dP/dt min (µl) | 15.35 | 10.25A | 5.61B | 4.20C | 11.1 | 12.9 |
| P@dP/dt max (mmHG) | 53.48 | 53.87 | 61.09 | 64.85C,D | 63.9 | 57.9 |
| Ea (mmHg µl-1) | 13.32 | 12.72 | 11.54 | 13.65C,D | 15.6 | 20.4E |
| Systolic indices | ||||||
| EF (%) | 36.48 | 45.85A | 63.37B | 69.81C | 53.8 | 47.0 |
| dP/dtmax (mmHg s-1) | 6966.56 | 8217.14A | 8823.00 | 9448.33C | 10466.2 | 8464.4E |
| dV/dt max (µl s-1) | 372,56 | 329,86 | 365,25 | 286,25D | 725.2 | 627.1 |
| Diastolic indices | ||||||
| -dP/dtmin (mmHg s-1) | 6806.33 | 8364.59A | 9060.78B | 8855.67 | 10624.1 | 8383.6E |
| Tau (W) (ms) | 7.66 | 5.92A | 6.48 | 6.55 | 6.6 | 8.3E |
Disclaimer/Publisher’s Note: The statements, opinions and data contained in all publications are solely those of the individual author(s) and contributor(s) and not of MDPI and/or the editor(s). MDPI and/or the editor(s) disclaim responsibility for any injury to people or property resulting from any ideas, methods, instructions or products referred to in the content. |
© 2025 by the authors. Licensee MDPI, Basel, Switzerland. This article is an open access article distributed under the terms and conditions of the Creative Commons Attribution (CC BY) license (http://creativecommons.org/licenses/by/4.0/).
Copyright: This open access article is published under a Creative Commons CC BY 4.0 license, which permit the free download, distribution, and reuse, provided that the author and preprint are cited in any reuse.


