
Submitted:
27 January 2025
Posted:
27 January 2025
You are already at the latest version
Abstract
Breast cancer, the most common cancer globally, has prompted research into alternative treatments due to potential harm from conventional methods. Bacterial agents, particularly actinomycetes, are being explored as a source of biologically active secondary metabolites with antitumor properties and other pharmaceutical applications. This study investigated the antitumor activity of Streptomyces violaceochromogenes strain M12 extract against breast cancer. The extract's cytotoxic effect was evaluated on MCF-7, MDA-MB-231, and MCF-10A cell lines using MTT assay, real-time PCR, and flow cytometry. The MCF7 cell line showed the lowest survival rate at 48 hours (IC50: 24.58 μg/ml), while the extract demonstrated selective cytotoxicity against MCF-10A cells. Treatment of MCF-7 cells resulted in increased apoptotic cells. Gene expression analysis revealed reduced Bax and caspase 9 levels, while caspase 8 expression and caspase 3/7 activity increased, suggesting an extrinsic apoptosis pathway. In vivo studies using Balb/c mice showed reduced mitoses, nuclear pleomorphism, and tumor angiogenesis in tumor tissue. LC-MS analysis identified 11 metabolites, mostly phenolic and peptid compounds in the extract, potentially contributing to its apoptotic effect. These findings indicate that the S. violaceochromogenes M12 extract effectively induces MCF-7 cell death and may serve as a promising alternative treatment for breast cancer.
Keywords:
In vivo
; MCF-7
; apoptosis
; Streptomyces violaceochromogenes
; Caspase 8
; Caspase 3/7.0
1. Introduction
Breast cancer, which has a high incidence rate, is a leading cause of cancer-related death globally [1]. The World Health Organization (WHO) reported that breast cancer is the most common cancer worldwide, accounting for approximately 12% of all cancer cases in 2020. That year, the WHO reported over 2.3 million new cases and 685,000 deaths from breast cancer. Projections estimate that by 2024, breast cancer will account for a quarter of all cancer cases and will affect more than three million individuals [2]. Common indicators of breast cancer include discharge, redness, or alterations in the texture or visual presentation of the nipple or breast surface. Regular breast examinations are essential for the early detection of these symptoms, thereby assisting in the prevention of disease progression [3].
The MCF-7 and MDA-MB-231 cell lines exhibited contrasting hormonal responses, with MCF-7 cells displaying hormone receptor activity and MDA-MB-231 cells showing hormone receptor inactivity. This differentiation underscores the critical importance of therapeutic interventions aimed at suppressing hormone receptors, particularly those involving progesterone receptor (PR) and estrogen receptor (ER), in effectively treating individuals afflicted with this condition[4]. Currently, patients with breast cancer are typically treated via two primary methods: chemotherapy and surgery. Regrettably, chemotherapy is associated with a range of adverse effects and poses a potential risk of cancer reoccurrence[4]. In light of these data and the adverse effects associated with chemotherapy, along with the multifaceted determinants of breast cancer [5], scholars have explored novel strategies for cancer control, including the application of bacterial agents.
Actinomycetes are gram-positive bacteria with a filamentous structure and a complex life cycle. They belong to the Actinobacteria phylum [6] and are widely distributed across various ecosystems. Their diverse biological activities and distinctive structures are of particular interest [7]. They generally thrive in moderate living conditions, as they are well adapted to moderate temperatures and pH levels [8,9]. These bacteria are valuable sources of biologically active secondary metabolites, including biocontrol agents, antibiotics, pharmaceutical compounds, pesticides, plant growth hormones, antitumor compounds, antiviral agents, pigments, enzymes, enzyme inhibitors, and anti-inflammatory compounds [7]. The increased recognition and importance of secondary metabolites of actinobacteria in cellular, biological, and physiological processes have highlighted their significant role [10]. Notably, more than 60% of approved drugs and approximately 50% of natural antibiotics are derived from actinomycetes[11]. Therefore, actinomycetes are considered crucial origins of biologically active compounds [5].
Studies have demonstrated that actinomycetes play a significant role in the production of antitumor metabolites, particularly in the context of breast cancer. The diversity of bioactive compounds produced by actinomycetes presents promising opportunities for cancer research and drug development [12,13,14]. However, there is a paucity of data on the anticancer effects of metabolites derived from actinomycetes, particularly in the context of identifying pharmaceutical treatments for cancer. This study aimed to explore the anticancer properties of an actinomycete strain against both the MDA-MB-213 and MCF-7 cell lines. To this end, the antitumor activity of the extract of Streptomyces violaceochromogenes M12, which was isolated from the Garmsar Salin River, was investigated.
2. Results
2.1. Identification of the Actinomycete Strain and Its Metabolites
The partial 16S rRNA gene sequence of strain M12 was highly similar (99.67%) to that of S. violaceochromogenes NBRC 13100. The phylogenetic tree is shown in Figure 1.
Qualitative detection of the bioactive compounds in the ethyl acetate extract was performed using ESI‒LCMS profiling (Figure S1). The extract contained 11 bioactive compounds, which were categorized into two main groups: peptides and phenolic compounds. Additionally, one alkaloid, one fatty acid derivative, and one terpenoid compound were identified in the ethyl acetate extract (Table 1 and Figure 2). The LC‒MS full-scan chromatograms, chromatograms and the chromatogram of the identified compounds are included in Figures S1 and S2, respectively.
Among the tentatively identified compounds, peptides were the dominant group, consisting of five chemical constituents: carnosine, homocarnosine, l-kynurenine, tentoxin, and dehydrocyclopeptine. The ethyl acetate extract contained three phenolic compounds: 4-hydroxybenzoyl choline, ferulic acid, and sinapinic acid. Sinapinic acid was the most highly concentrated metabolite in the extract (41%).
2.2. Anti-Proliferative Activity of S. violaceochromogenes Strain M12 Extract Against Human Breast Cancer Cells
To determine the cytotoxic effects of the S. violaceochromogenes strain M12 extract on MCF-7, MDA-MB-231, and MCF-10A cells, the cells were treated with 0–500 μg/ml of the culture extract for 24, 48, and 72 h, followed by a cell viability assessment via the MTT assay. As shown in Figure 3, exposure of MCF-7 cells to the actinomycete extract resulted in a dose-dependent reduction in cell viability. The most diminished survival rate was noted at the 48-hour time point, with an IC50 value of 24.58 μg/ml.
As shown in Figure 4, when MDA-MB-231 cells were exposed to the actinomycete extract, there was a concentration-dependent decrease in cell viability. The survival rate at the 48-hour time point had an IC50 value of 132.6 μg/ml, which was higher than that of the MCF7 cell line at the same time point. The survival rate of the MDA-MB-231 cells at the 72-hour time point closely resembled that of the MCF-10A cells (Figure 4 and Figure 5). The extract showed selective cytotoxicity against MCF-10A cells, as evidenced by the elevated IC50 values (384.8 μg/ml) after a 48-hour exposure period (Figure 5).
2.3. Induction of Apoptosis in the MCF-7 Cell Line Following Treatment with the S. violaceochromogenes Strain M12 Extract
Annexin V-FITC and PI staining were used to assess whether the inhibitory effect of the culture extract on cell viability was associated with the induction of apoptosis. After 48 hours of treatment with 24.58 μg/ml extract, both apoptotic and necrotic cells were evaluated. Apoptosis was observed in cells exposed to different doses of the actinomycete extract, whereas the necrotic population was almost negligible. As shown in Figure 6, the percentages of early and late apoptotic cells (annexin V-positive) increased to 1.36% and 43%, respectively, when the MCF-7 cells were treated with 24.58 μg/ml extract. These data suggest that the extract caused a dose-dependent increase in apoptotic cell death in the human breast cancer cell line MCF-7 after 48 h.
2.4. S. violaceochromogenes Strain M12 Culture Extract Affects Apoptotic Gene Expression
BCL-2 family members regulate cytochrome c release from the mitochondria during apoptosis [15]. We examined the expression levels of BAX, an apoptosis cell death-promoting protein in the BCL-2 family that triggers cytochrome c release. According to our findings, treating cells with the actinomycete extract for 48 hours led to a 0.215 ± 0.068-fold decrease in the BAX gene expression level (Figure 7).
Caspases are part of a highly conserved family of cysteine proteases that specifically target aspartate residues. These enzymes are found in multicellular organisms and consist of 15 mammalian members grouped into two major subfamilies: apoptotic caspases and inflammatory caspases. Apoptotic caspases are further subdivided into two subgroups: initiator caspases, such as caspases 8 or 9, which are responsible for initiating an apoptotic cascade, and executioner caspases, such as caspases 3 and 7, which cause cell fragmentation [16]. In this study, the actinomycete extract increased the expression of CASPASE 8 and CASPASE 3 by 2.70 ± 0.407- and 9.240 ± 3.230-fold, respectively. Moreover, the expression of CASPASE 9 decreased by tree times (0.272 ± 0.063) after 48 h (Figure 7).
3.5. Effect of the S. violaceochromogenes Strain M12 Culture Extract on CASPASE 3/7 Activity
CASPASE-3/7 activity, an indicator of apoptosis, was assessed via a CASPASE-3/7 assay kit. Compared with that in the control group, the activity of CASPASE-3/7 in MCF-7 cells treated with the extract increased by 0.45 mU/ml after 48 h (Figure 8). These findings confirmed the results of the quantitative apoptosis evaluation, which revealed a significant increase (p< 0.0001) in apoptosis in MCF-7 cells.
3.6. Histological Examination
Hematoxylin and eosin (H&E) staining was used to identify alterations in the actinomycete-treated group compared with the control group. Remarkable changes included an increase in tumor necrosis in the actinomycete group compared with the control group (45% vs 35% in the control group). The actinomycete group presented a lower mitotic count (23 per 10 high-power fields (HPFs) vs 25 per 10 HPFs), reduced nuclear pleomorphism (2 per 10 HPFs vs 3 per 10 HPFs), and decreased tumor angiogenesis (15 per 10 HPFs vs 20 per 10 HPFs) (Figure 9).
3. Discussion
Actinomycetes are a class of bacteria that are well known for their capacity to produce a wide range of bioactive secondary metabolites. They have become a major focus in the search for novel antimicrobial and anticancer compounds[7]. The present study aimed to investigate the cytotoxic effects of an actinomycete extract on human breast cancer cell lines and to elucidate the molecular pathways involved in inducing cell death. To assess the potential synergistic effect of the complete mixture of M12 metabolites in the extract on tumor cells, the extract was left unfractionated and unpurified. The investigation of the viability of two human breast cancer cell lines, MCF-7 and MDA-MB-231, revealed that the ethyl acetate extract of S. violaceochromogenes strain M12 inhibited the growth of MCF-7 and MDA-MB-231 cells. Consequently, the proliferation capacity was eliminated in a time- and dose-dependent manner. Notably, the extract was more effective against the MCF-7 cell line, possibly because of the mutation in the p53 gene in the MDA-MB-231 cells, which could explain its increased survival rate in response to the treatment [17]. These results suggest that the M12 strain extract has the potential to inhibit the growth of breast cancer cells. Moreover, the significant decrease in the number of viable cells indicates that the antiproliferative effect of the extract may be attributed, at least partially, to its ability to induce cell death. Importantly, the study revealed no toxicity of the M12 strain extract toward normal cells. The methanolic extract of Streptomyces sp. strain KSF 83 has been shown by others to induce dose-dependent cytotoxic effects on the two human breast cancer cell lines examined in our study (MCF-7 and MDA-MB-231), with EC50 concentrations of 230.40 μg/ml and 260.10 μg/ml, respectively[18]. Notably, the extract demonstrated increased anticancer activity toward the MCF-7 cell line. Interference with the apoptotic signaling pathway is commonly a significant contributor to the development of tumors and confers resistance to therapeutic interventions in cancer cells [19]. The initiation of apoptosis in cells represents a viable approach for the use of chemotherapeutic agents to eliminate cancerous cells [20]. In the present study, apoptosis was confirmed through the concurrent staining of cells with FITC-annexin-V/PI, which allows for the identification of distinct cell states. MCF-7 cells treated with moderate concentrations (IC50 values) of the S. violaceochromogenes strain M12 extract for 48 hours presented an increase in the number of cells undergoing early and late apoptosis (6.14% and 65.7%, respectively). The results of another study revealed that steffimycin-B derived from Streptomyces scabrisporus was effective against MCF7 breast adenocarcinoma cells, leading to cell death through apoptosis [21].
The initiation of programmed cell death in tumor cells represents a fundamental process targeted by chemotherapeutic agents [22]. Our findings indicate that exposure to the extract of S. violaceochromogenes M12 resulted in the downregulation of caspase-9. These findings suggest that the modulation of breast cancer cell apoptosis by the S. violaceochromogenes M12 extract does not operate via the intrinsic apoptotic pathway. Prior studies have established the importance of caspase-8 activity in the induction of extrinsic apoptosis [23]. The current study revealed that the extract of S. violaceochromogenes M12 upregulated caspase 8 but not caspase 9 and triggered the activation of caspase-3/7, indicating the involvement of an extrinsic pathway in the apoptotic mechanism induced by this extract.
4T1 breast cancer cells have a high affinity for engraftment into the mammary fat layer, facilitating tumor growth and progression [24]. To further explore the effectiveness of the S. violaceochromogenes strain M12 extract against triple-negative breast cancer, a BALB/c breast cancer mouse model was utilized to transplant 4T1 cells. The results revealed that the groups treated with a moderate dose (IC50) of the extract experienced a reduction in tumor growth and size, indicating that the actinomycete extract has anti-breast cancer properties. Histopathological examination of the breast cancer tissue through H&E staining revealed that a medium dose of actinomycete extract induced tumor cell necrosis, destruction, and infiltration of inflammatory cells. To the best of our knowledge, there are no documented reports regarding the anti-breast cancer properties of S. violaceochromogenes either in vitro or in vivo. Nonetheless, two studies have examined the effects of its extract on the A549 cell line (lung cancer), sarcoma S-180, and Ehrlich ascites tumors via the MTT assay[25,26]. Numerous studies have highlighted the anti-breast cancer potential of metabolites from other species of Streptomyces, as discussed earlier in this section.
LC‒MS analysis of the S. violaceochromogenes M12 extract identified 11 compounds as the principal metabolites. All of these phenolic metabolites were previously reported in the plants Triticum aestivum [27] and Ferula foetida [28,29] to have biopesticide activity, as well as antimicrobial, anti-inflammatory, antioxidant, and anticancer potential [30,31]. However, sinapinic acid, compound 5, which has the highest concentration in the extract, has not been reported in any bacterial extract to our knowledge. Although the anti-breast cancer effect of sinapinic acid has been revealed, there is a lack of in vivo research on its antitumor properties. Here, we demonstrated that the bacterial extract has significant in vivo effects, including increased tumor apoptosis, reduced nuclear pleomorphism, and decreased mitotic count and tumor angiogenesis. In addition to the aforementioned phenolic compounds, the extract contained five different peptides. For the first time, compounds 2, 4, and 6 from S. violaceochromogenes are described, which aligns with the literature on animal tissue [32]. These compounds have shown effective anticancer activity, although there are no reports on the potential anti-breast cancer effects of compounds 2 and 4 [33]. Compound 6 has been shown to exhibit anticancer activity against the MCF7 breast cancer cell line [34]. Compound 8, an acyclopeptide detected in Alternaria sp., has been reported to have potent anti-breast cancer activity [35] and has not been previously identified as being produced from the Streptomyces genus. Additionally, there are no reports on the anticancer activity of compound 9, which has not yet been detected in Streptomyces, only penicillium sp. [36]. Compound 10, a terpenoid, has been found to possess potent antifungal properties in plants and has also been detected in Streptomyces melanosporofaciens [37,38]. Finally, compound 11, a pentacyclic alkaloid isolated from Akebia quinata and Buergenerula spartinae, exhibited antibacterial, anti-inflammatory, antioxidant, antidiuretic, and analgesic properties [39]. To our knowledge, this is the first instance of its detection in the Streptomyces genus. It is hypothesized that the observed in vitro and in vivo effects are attributed not only to sinapinic acid, the most abundant compound in the extract but also to the presence of other compounds with antioxidant or anticancer properties that are likely to have synergistic effects on tumor cells.
Our findings offer novel perspectives for the advancement of the potential of the whole actinomycete extract for the treatment of breast cancer and various other forms of cancer.
4. Materials and Methods
4.1. Molecular Identification of the Actinomycete Strain and Extract Preparation
The Streptomyces sp. strain M12, which was obtained from the microbiology laboratory at Kharazmi University (Tehran, Iran), was cultured according to a standard protocol [40]. Briefly, strain M12 was incubated in starch casein broth (SC agar) (g/L); soluble starch, 20; K2HPO4, 0.5; KNO3, 1; MgSO4·7H2O, 0.5; and at 28 °C, 220 rpm for 4 d. Ethyl acetate (1:2 v/v) was employed as the solvent for extracting metabolites over two hours. The solvent layer, potentially containing potentially bioactive metabolites, was subsequently evaporated via a rotary evaporator set at 40 °C. The resulting crude extract was assessed for its antitumor efficacy [41].
To conduct molecular identification of strain M12, a culture was prepared in SC broth and incubated at 28 °C and 220 rpm for 4 days. The cells were subsequently harvested, and their genomes were extracted following the protocol outlined by [42]. The 16S rDNA was amplified via PCR with pfu DNA polymerase and the primers 9F (5’ AAG AGT TTG ATC ATG GCT CAG 3’) and 1542R (5’ AGG AGG TGA TCC AAC CGC 3’). The PCR mixture (100 μl) included 1 μl of genomic DNA, 0.5 μl of pfu DNA polymerase, 0.2 mM dNTPs, and 0.5 mM each primer in a final volume of 30 μl. The amplification process began with initial denaturation at 95 °C for 300 seconds, followed by 30 cycles of denaturation at 95 °C for 30 seconds, annealing at 54.5 °C for 60 seconds, and extension at 72 °C for 90 seconds. Finally, a final extension at 72 °C for 300 s was performed.
Agarose gel electrophoresis was employed for the analysis of the PCR products, which were subsequently subjected to purification and sequencing at Macrogen Inc. in Seoul, Korea. The phylogenetic relationships of the isolates and the pairwise 16S rDNA sequence similarities were determined utilizing the Eztaxon server (http://www.ezbiocloud.net/eztaxon). Sequence alignment was carried out using CLUSTAL X software, whereas phylogenetic analysis was performed using the neighbor-joining method with MEGA software. Mycobacterium avium MG13T served as the outgroup for the analysis. Bootstrap analysis was conducted with 1,000 replicates to assess the tree topology. The partial 16S rRNA gene sequence (>1000 nt) of isolate M12 was deposited in the GenBank database under the accession number OR739420.
4.2. Analytical LC‒MS of the Crude Extract
Liquid chromatography and mass spectrometry (LC‒MS) analysis was performed on a Micromass Quattro micro-API mass spectrometer interfaced with a Waters Alliance 2695 HPLC system. The mobile phase consisted of 0.1% formic acid in acetonitrile (channel A) and 0.1% formic acid in H2O (channel B). Chromatographic separation was performed using a Eurospher C18, 4.6×120 mm column operated at a flow rate of 0.3 ml/min. The following gradient was used: 10% A for 0–10 min, 50% A from 8–15 min, and 80% A from 15–30 min. The method employed a flow of 3.0 mL min-1, 5 μL injection volume, and a column temperature of 35 °C. The mass spectrometer was operated in positive mode, monitoring a mass range from 100 to 1400 atomic mass units (amu) and a capillary voltage of 4000 V. The analyte was ionized using a chemical ionization source under the following conditions: 120 °C source temperature, 300 °C desolvation temperature, and 300 L/h gas flow.
4.3. Cell Culture
The breast cancer cell lines MDA-MB-231 and MCF-7, as well as the normal human breast cell line MCF-10A, were obtained from Roshd Azma Co. (Karaj, Iran). MCF-10A cells were cultured in a T25 culture flask containing DMEM/F-12 media supplemented with 5% horse serum, 10 μg/ml insulin, 0.5 μg/ml hydrocortisone, 20 ng/ml EGF, 100 ng/ml cholera toxin, and 1% penicillin/streptomycin and incubated at 37 °C in 5% CO2. The MDA-MB-231 and MCF-7 cell lines were cultured in a T25 culture flask containing DMEM-F12 (Bioidea, Iran) supplemented with 5% FBS (Gibco, Brazil) and 1% antibiotics (100 U/ml penicillin G and 100 µg/ml streptomycin; Bioidea, Iran) and incubated at 37 °C in 5% CO2. The medium was refreshed every 3 days. At 70–80% confluency, the cells were harvested with 0.25% trypsin-EDTA (GIBCO, Brazil) solution and subsequently plated for the next passage.
4.4. Cytotoxicity Assay
The MTT assay was utilized to assess the cytotoxic and antiproliferative effects of the actinomycete extract on both breast cancer and normal cell lines. The cells were cultured in 96-well plates at a density of 1 × 10⁴ cells/well for 24 hours to ensure cell stabilization and adhesion. These cells were then exposed to Actinomycetes extract at concentrations ranging from 0 to 500 μg/ml for 24, 48, and 72 hours. Subsequently, 10 μL of 3-[4,5-dimethylthiazole-2-yl]-2,5-diphenyltetrazolium bromide (Sigma, United States) at a concentration of 0.5 mg/ml was added to each well and incubated for 4 hours at 37 °C in the dark. The medium was then removed, and 100 μL of DMSO (Sigma, United States) was added to each well. The optical density (OD) values were measured at a wavelength of 570 nm using a microplate reader (Bio-Rad, USA). The percentage of viable cells was determined by calculating the number of live cells and comparing it with that of the control sample.
4.5. Annexin V Assay
Apoptosis was evaluated by employing an annexin V-FITC apoptosis detection kit (MabTag, Germany). MCF-7 cells were cultured in a 6-well plate and allowed to incubate for 24 hours before exposure to Actinomycetes extract at IC50 concentrations for 24 hours. The cells were subsequently collected via trypsinization and suspended in 100 μl of binding buffer. The cell suspensions were then incubated with 1 μl of annexin V-FITC and 1 μl of propidium iodide (PI) for 10 minutes at room temperature in the absence of light. Flow cytometry (BD FACSLyric, US) was promptly employed to assess the cells. The percentage of apoptotic cells (annexin V+) was determined using the FLOWJO software (FlowJo Engine v4.00770).
4.6. Quantitative Real-Time PCR
An RNX-Plus RNA isolation kit (Cinna Gen Co., Tehran, Iran) was used for the extraction of total RNA following the manufacturer's guidelines. Total RNA was then subjected to DNase I treatment (Roche) to remove any genomic DNA. The synthesis of cDNA was carried out using a commercial kit (EasyTM cDNA Synthesis Kit, Parstous, Iran) at 47 °C for 60 minutes. The RealQ Plus One-step RT‒PCR Kit (Ampliqon, Denmark) was utilized to assess the expression levels of the BAX, CASPASE 3, CASPASE 8, and CASPASE 9 genes. The forward and reverse primer pairs were designed via Primer 3 Plus software (Qiagen, Hilden, Germany) and validated via the Primer-Blast tool available at www.ncbi.nlm.nih.gov/tools/primer-blast. The amplification primers for BAX, CASPASE 3, CASPASE 8, and CASPASE 9 and the B2M internal reference are detailed in Table 2.
4.7. CASPASE-3/7 Assay
CASPASE-3/7 activity was assessed utilizing a CASPASE -3/7 assay kit (Kiazist Company, Iran) according to the manufacturer's instructions. Approximately 500,000 cells were briefly trypsinized, followed by centrifugation to discard the supernatant. The cells were then incubated with 500 μl of caspase lysis buffer for 20 minutes at 4 °C to induce lysis. The sample was subsequently centrifuged at 12,000 rpm for 15 minutes at 4 °C. Fifty microliters of the sample was dispensed into each well of a 96-well plate, and 55.5 µl of a solution containing 50 µl of caspase buffer, 0.5 µl of DTT, and 5 µl of caspase substrate was added to each well. Following 90 min of incubation at 37 °C, the optical absorbance of each sample was measured at a wavelength of 405 nm. The standard curve, constructed using known concentrations of pure CASPASE 3.7, was used to determine the absolute values of the experimental samples.
CASPASE-3/7 activity was calculated using the following formula:
CASPASE Activity (mU/mL) =
4.8. In Vivo Studies
4.8.1. Animals
Six male BALB/c mice, aged 8–10 weeks and weighing approximately 25 ± 2 g, were obtained from Roshd Azma Co. (Karaj, Iran) and housed at the Center of Laboratory Animal Care. The mice were kept under controlled conditions, including a 12-hour light/dark cycle, temperatures between 20 and 25 °C, and 45–55% humidity. They were placed in polyethylene cages with metal-fenced tops and wood-chip bedding, allowing free access to food and water. Cages were arranged to ensure uniform light and air circulation. Prior to the experiments, the animals underwent a two-week adaptation period. To reduce stress, a single person was administered the injections simultaneously. The mice were chosen on the basis of sex and average weight, with the potential exclusion of signs of weakness or anorexia. However, no animals were excluded from this study, and all the data were included in the analysis. The study complied with the ARRIVE guidelines and was approved by the local ethics committee of Tehran University (IR.UT.SPORT.REC.1403.065).
4.8.2. Experimental Design
The highly tumor-susceptible male BALB/c mice[43] were divided into two groups using Microsoft Excel's RAND() function. The group size was calculated using the equation E = total number of animals - total number of groups [44]. The control group (n=3) received 100 µL of normal saline, while the experimental group (n=3) was injected with 1 × 10⁶ 4T1 cells to establish a breast cancer model. Twenty-two days after tumor formation, 100 µL of the actinomycete extract was administered to the experimental group through the tail vein. The mice were observed daily, and body weight and tumor size were recorded. Following the treatment period, the animals were euthanized with sodium thiopental (40 mg/kg). Tumor tissues were extracted from each mouse for histopathological examination and preserved in a 10% formalin solution.
4.9. Histological Examination
Histological examination was performed to assess and contrast tissue alterations in the control and treatment cohorts. The tumor tissue was subjected to gradual dehydration in an alcohol series and subsequently embedded in paraffin for analysis. The samples were then sliced to a thickness of 5 μm, rehydrated, stained with hematoxylin and eosin (H&E), and examined under a light microscope.
4.10. Statistical Analysis
Statistical analyses were performed using GraphPad Prism software, version 9.0 (GraphPad Software, Inc., La Jolla, CA, USA). The findings are expressed as the means ± standard deviations. The statistical analyses involved two-way ANOVA, followed by Tukey's post hoc test. The Shapiro‒Wilk test was used to check the normality of the data. A P value< 0.05 was considered statistically significant.
5. Conclusions
In this study, we examined how the actinomycete extract affects MCF-7 cells in vitro and in a 4T1-BALB/c model. Additionally, the mechanism of the most effective active component was investigated in MCF-7 cells. The results showed that the actinomycete extract prevents the proliferation of tumor cells and promotes the apoptosis of human breast cancer cells. The in vivo actinomycete extract inhibited tumor growth and induced apoptosis by increasing the expression levels of caspase-8 and -3 and damaging the nuclei of cells in vitro. This study provides key insights into the anti-breast cancer properties of the actinomycete extract and lays the groundwork for further research on its potential as a treatment option.
Supplementary Materials
The following supporting information can be downloaded at the website of this paper posted on Preprints.org. Supplementary materials are available in the figshare repository as part of these records: (Fig S1; Fig S2) https://drive.google.com/file/d/1soKLV_21aD-ZS_wdnqeoVuEIccV9opZz/view?usp=sharing.
Author Contributions
P.F. prepared all the figures in the manuscript. E.S. wrote a part of the manuscript text, edited it, and prepared online resources 1 and 2. M.T. wrote the main part of the text and prepared the figures. M.M. evaluated the statistical part of the study, all the figures and text, and S.I. edited the manuscript. S.A.E. set up the methods. All the authors reviewed the manuscript.
Funding
This research did not receive any specific grant from funding agencies in the public, commercial, or not-for-profit sectors.
Institutional Review Board Statement
The study complied with the ARRIVE guidelines and was approved by the local ethics committee of Tehran University (IR.UT.SPORT.REC.1403.065).
Informed Consent Statement
The study did not involve humans.
Data Availability Statement
The data used in this study are publicly available in the GenBank database and can be accessed with OR739420.
Acknowledgments
Special thanks to Roshdazma Ltd for their invaluable help in conducting experiments and to Molla Sadra Research Center for their support.
Conflicts of Interest
The authors declare no conflicts of interest.
References
- Moslemi, M., Moradi, Y., Dehghanbanadaki, H., Afkhami, H., Khaledi, M., Sedighimehr, N., Fathi, J., & Sohrabi, E.. The association between ATM variants and risk of breast cancer: a systematic review and meta-analysis. BMC Cancer, 2021, 21(1), 27. [CrossRef]
- Nandi, D., Parida, S., & Sharma, D. The gut microbiota in breast cancer development and treatment: The good, the bad, and the useful! Gut Microbes, 2023, 15(1), 2221452. [CrossRef]
- Ikhuoria, E. B., & Bach, C. Introduction to Breast Carcinogenesis – Symptoms, Risks factors, Treatment and Management. Eur. J. Eng. Educ. 2018.
- Waks, A. G., & Winer, E. P. Breast Cancer Treatment: A Review. Jama, 2019, 321(3), 288-300. [CrossRef]
- Sarkar, G., & Suthindhiran, K. Diversity and Biotechnological Potential of Marine Actinomycetes from India. Indian J. Microbiol., 2022, 62(4), 475-493. [CrossRef]
- Sharma, M., Dangi, P., & Choudhary, M. Actinomycetes: Source, Identification, and Their Applications. 2014, 801-832.
- Selim, M. S. M., Abdelhamid, S. A., & Mohamed, S. S. Secondary metabolites and biodiversity of actinomycetes. J. Genet. Eng. & Biotechnol., 2021, 19(1), 72. [CrossRef]
- Shivlata, L., & Satyanarayana, T. Thermophilic and alkaliphilic Actinobacteria: biology and potential applications. Front Microbiol, 2015, 6, 1014. [CrossRef]
- Jagannathan, S. V., Manemann, E. M., Rowe, S. E., Callender, M. C., & Soto, W. Marine Actinomycetes, New Sources of Biotechnological Products. Mar Drugs, 2021, 19(7). [CrossRef]
- Salwan, R., & Sharma, V. Molecular and biotechnological aspects of secondary metabolites in actinobacteria. Microbiol. Res., 2020, 231, 126374. [CrossRef]
- Subramani, R., & Sipkema, D. Marine Rare Actinomycetes: A Promising Source of Structurally Diverse and Unique Novel Natural Products. Mar Drugs, 2019, 17(5). [CrossRef]
- Ravikumar, S., Fredimoses, M., & Gnanadesigan, M. Anticancer property of sediment actinomycetes against MCF-7 and MDA-MB-231 cell lines. Asian Pac J Trop Biomed, 2012 2(2), 92-96. [CrossRef]
- Davies-Bolorunduro, O. F., Adeleye, I. A., Akinleye, M. O., & Wang, P. G. Anticancer potential of metabolic compounds from marine actinomycetes isolated from Lagos Lagoon sediment. J Pharm Anal, 2019 9(3), 201-208. [CrossRef]
- Abd-Elnaby, H., Abo-Elala, G., Abdel-Raouf, U., Abd-elwahab, A., & Hamed, M. Antibacterial and anticancer activity of marine Streptomyces parvus: optimization and application. Biotechnol. Biotechnol. Equip., 2016 30(1), 180-191. [CrossRef]
- Ponder, K. G., & Boise, L. H. The prodomain of caspase-3 regulates its own removal and caspase activation. Cell Death Discov., 2019, 5(1), 56. [CrossRef]
- Chowdhury, I., Tharakan, B., & Bhat, G. K. Caspases - an update. Comp Biochem Physiol B Biochem Mol Biol, 2008, 151(1), 10-27. [CrossRef]
- Hui, L., Zheng, Y., Yan, Y., Bargonetti, J., & Foster, D. A. Mutant p53 in MDA-MB-231 breast cancer cells is stabilized by elevated phospholipase D activity and contributes to survival signals generated by phospholipase D. Oncogene, 2006, 25(55), 7305-7310. [CrossRef]
- Baharudin, N. F., Malek, N., Zulkifli, N., Lani, R., Injan, C., Hassandarvish, P., Khairat, J., & Azman, A. S. Cytotoxic activity of methanolic extract of Streptomyces sp. strain KSF 83 on growth of human breast and colon cancer cells. Malays. J. Microbiol., 2021, 17. [CrossRef]
- Peng, F., Liao, M., Qin, R., Zhu, S., Peng, C., Fu, L., Chen, Y., & Han, B. Regulated cell death (RCD) in cancer: key pathways and targeted therapies. Signal Transduct. Target. Ther., 2022, 7(1), 286. [CrossRef]
- Hannun, Y. A. Apoptosis and the Dilemma of Cancer Chemotherapy. Blood, 1997, 89(6), 1845-1853. [CrossRef]
- Rodríguez-Peña K, M.-R. M., Rocha-Zavaleta L, Trenado-Uribe M, Rodríguez-Sanoja R, et al. Streptomyces Scabrisporus, an Endophyte Isolated from Amphipterygium Adstringens as Producer of an Anthracycline Active against Different Cancer Cell Lines. Glob. drugs ther., 2018, 3. [CrossRef]
- Farghadani, R., & Naidu, R. Curcumin as an Enhancer of Therapeutic Efficiency of Chemotherapy Drugs in Breast Cancer. Int. J. Mol. Sci., 2022, 23(4).
- Contadini, C., Ferri, A., Cirotti, C., Stupack, D., & Barilà, D. Caspase-8 and Tyrosine Kinases: A Dangerous Liaison in Cancer. Cancers (Basel), 2023, 15(13). [CrossRef]
- Garcia, C. M. S., De Araújo, M., paz lopes, M., Ferreira, M. A. N. D., & Cassali, G. Morphological and immunophenotipical characterization of murine mammary carcinoma 4t1. Braz. J. Vet. Pathol., 2014, 7, 158-165.
- Kawai, H., Hayakawa, Y., Nakagawa, M., Furihata, K., Seto, H., & Otake, N. Arugomycin, a new anthracycline antibiotic. II. Structural elucidation. J Antibiot (Tokyo), 1987, 40(9), 1273-1282. [CrossRef]
- Zakalyukina, Y. V., Birykov, M. V., Lukianov, D. A., Shiriaev, D. I., Komarova, E. S., Skvortsov, D. A., Kostyukevich, Y., Tashlitsky, V. N., Polshakov, V. I., Nikolaev, E., Sergiev, P. V., & Osterman, I. A. Nybomycin-producing Streptomyces isolated from carpenter ant Camponotus vagus. Biochimie, 2019, 160, 93-99. [CrossRef]
- Kong, L., Xie, Y., Hu, L., Si, J., & Wang, Z. Excessive nitrogen application dampens antioxidant capacity and grain filling in wheat as revealed by metabolic and physiological analyses. Sci. Rep., 2017, 7(1), 43363. [CrossRef]
- Wang, Y.-C., Chuang, Y.-C., & Ku, Y.-H. Quantitation of bioactive compounds in citrus fruits cultivated in Taiwan. Food Chem., 2007, 102, 1163-1171. [CrossRef]
- Hlasiwetz, H., & Barth, L. Mittheilungen aus dem chemischen Laboratorium in Innsbruck I) Ueber einige Harze [Zersetzungsproducte derselben durch schmelzendes Kali]. Eur. J. Org. Chem., 1866, 138(1), 61-76.
- Bao, X., Li, W., Jia, R., Meng, D., Zhang, H., & Xia, L. Molecular mechanism of ferulic acid and its derivatives in tumor progression. Pharmacol Rep, 2023, 75(4), 891-906. [CrossRef]
- Nićiforović, N., & Abramovič, H. Sinapic Acid and Its Derivatives: Natural Sources and Bioactivity. Compr Rev Food Sci Food Saf, 2014, 13(1), 34-51. [CrossRef]
- Peiretti, P. G., Medana, C., Visentin, S., Giancotti, V., Zunino, V., & Meineri, G. Determination of carnosine, anserine, homocarnosine, pentosidine and thiobarbituric acid reactive substances contents in meat from different animal species. Food Chem, 2011, 126(4), 1939-1947. [CrossRef]
- Gaunitz, F., & Hipkiss, A. R. Carnosine and cancer: a perspective. Amino Acids, 2012, 43(1), 135-142. [CrossRef]
- Hussein, M. M. A., Abdelfattah-Hassan, A., Eldoumani, H., Essawi, W. M., Alsahli, T. G., Alharbi, K. S., Alzarea, S. I., Al-Hejaili, H. Y., & Gaafar, S. F. Evaluation of anti-cancer effects of carnosine and melittin-loaded niosomes in MCF-7 and MDA-MB-231 breast cancer cells. Front Pharmacol, 2023, 14, 1258387. [CrossRef]
- Abdou, R., & Zakareia, M. Cytotoxic metabolites of alternaria alternata, an endophyte of the medicinal plant bidens bipinnata. Int. J. Pharm. Sci., 2020, 42-48. [CrossRef]
- El Euch, I. Z., El-Metwally, M. M., Frese, M., Sewald, N., Abdissa, N., & Shaaban, M. Secondary metabolites from Penicillium sp. 8PKH isolated from deteriorated rice straws. Z Naturforsch C J Biosci, 2019, 74(11-12), 283-288. [CrossRef]
- Dudley, M. W., Green, T. R., & West, C. A. Biosynthesis of the Macrocyclic Diterpene Casbene in Castor Bean (Ricinus communis L.) Seedlings : The Purification and Properties of Farnesyl Transferase from Elicited Seedlings. Plant Physiol, 1986, 81(2), 343-348. [CrossRef]
- Görner, C., Schrepfer, P., Redai, V., Wallrapp, F., Loll, B., Eisenreich, W., Haslbeck, M., & Brück, T. Identification, characterization and molecular adaptation of class I redox systems for the production of hydroxylated diterpenoids. Microb. Cell Fact., 2016, 15(1), 86. [CrossRef]
- An, Y., Li, J., Liu, Y., & Fan, M. Ormosanine improves neuronal functions in spinal cord-injured rats by blocking peroxynitrite/calpain activity. Transl Neurosci, 2020, 11(1), 182-191. [CrossRef]
- Yi, J., Qinyuan, L., Xiu, C., & Chenglin, J. Isolation and Cultivation Methods of Actinobacteria. In D. Dharumadurai & J. Yi (Eds.), Actinobacteria (pp. Ch. 2). IntechOpen. 2016. [CrossRef]
- Sengupta, S., Pramanik, A., Ghosh, A., & Bhattacharyya, M. Antimicrobial activities of actinomycetes isolated from unexplored regions of Sundarbans mangrove ecosystem. BMC Microbiol., 2015, 15(1), 170. [CrossRef]
- Kieser, T., Bibb, M. J., Buttner, M. J., Chater, K. F., Hopwood, D. A., & John Innes, F. Practical Streptomyces genetics. John Innes Foundation. 2000.
- Nakamura, H. BALB/c Mouse. In S. Maloy & K. Hughes (Eds.), Brenner's Encyclopedia of Genetics (Second Edition) (pp. 290-292). Academic Press. 2013 . [CrossRef]
- Arifin, W. N., & Zahiruddin, W. M. Sample Size Calculation in Animal Studies Using Resource Equation Approach. Malays J Med Sci, 2017, 24(5), 101-105. [CrossRef]
Figure 1.
A neighbor-joining tree based on partial 16S rDNA sequences showing the relationship between strain M12 and the genus Streptomyces sp. The outgroup used was Micobacterium avium. Bootstrap values based on 1000 resamplings were assigned to the branch nodes. The 0.01 bar represents substitutions per nucleotide position. T: Type strain.
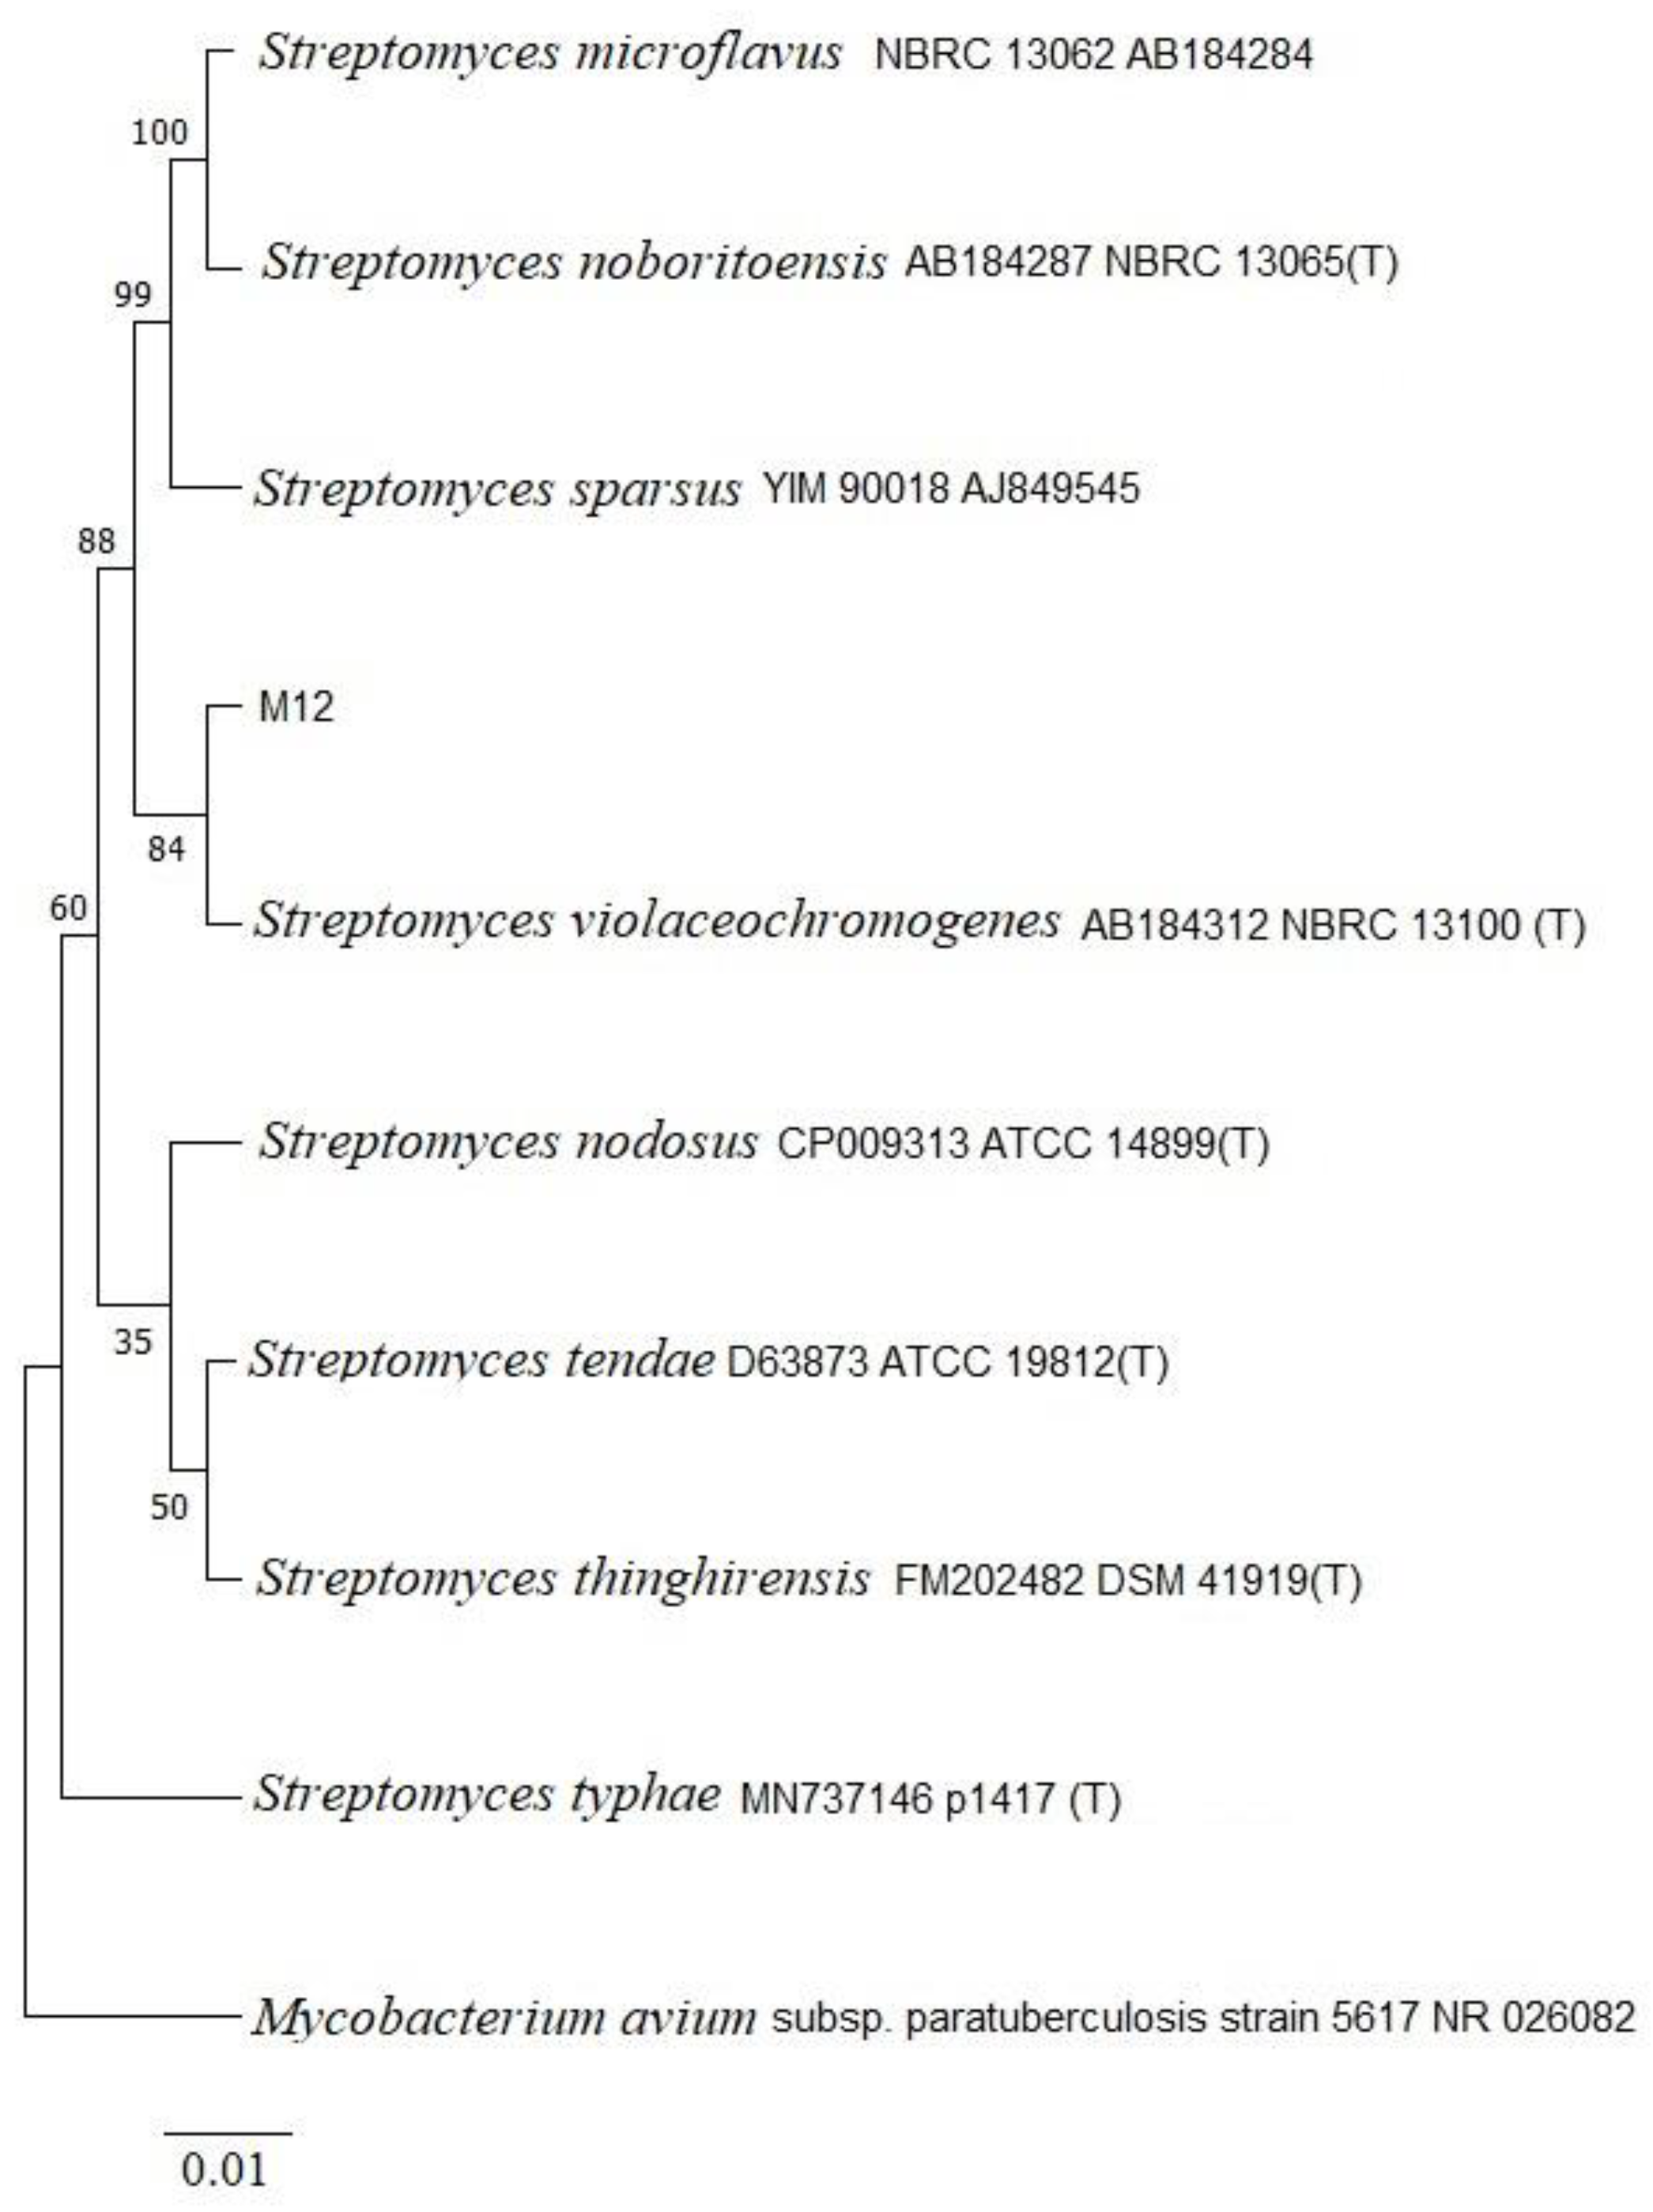
Figure 2.
Tentative identification of the compounds in the EtOAc extract of S. violaceochromogenes M12 via ESI‒LC‒MS.
Figure 2.
Tentative identification of the compounds in the EtOAc extract of S. violaceochromogenes M12 via ESI‒LC‒MS.
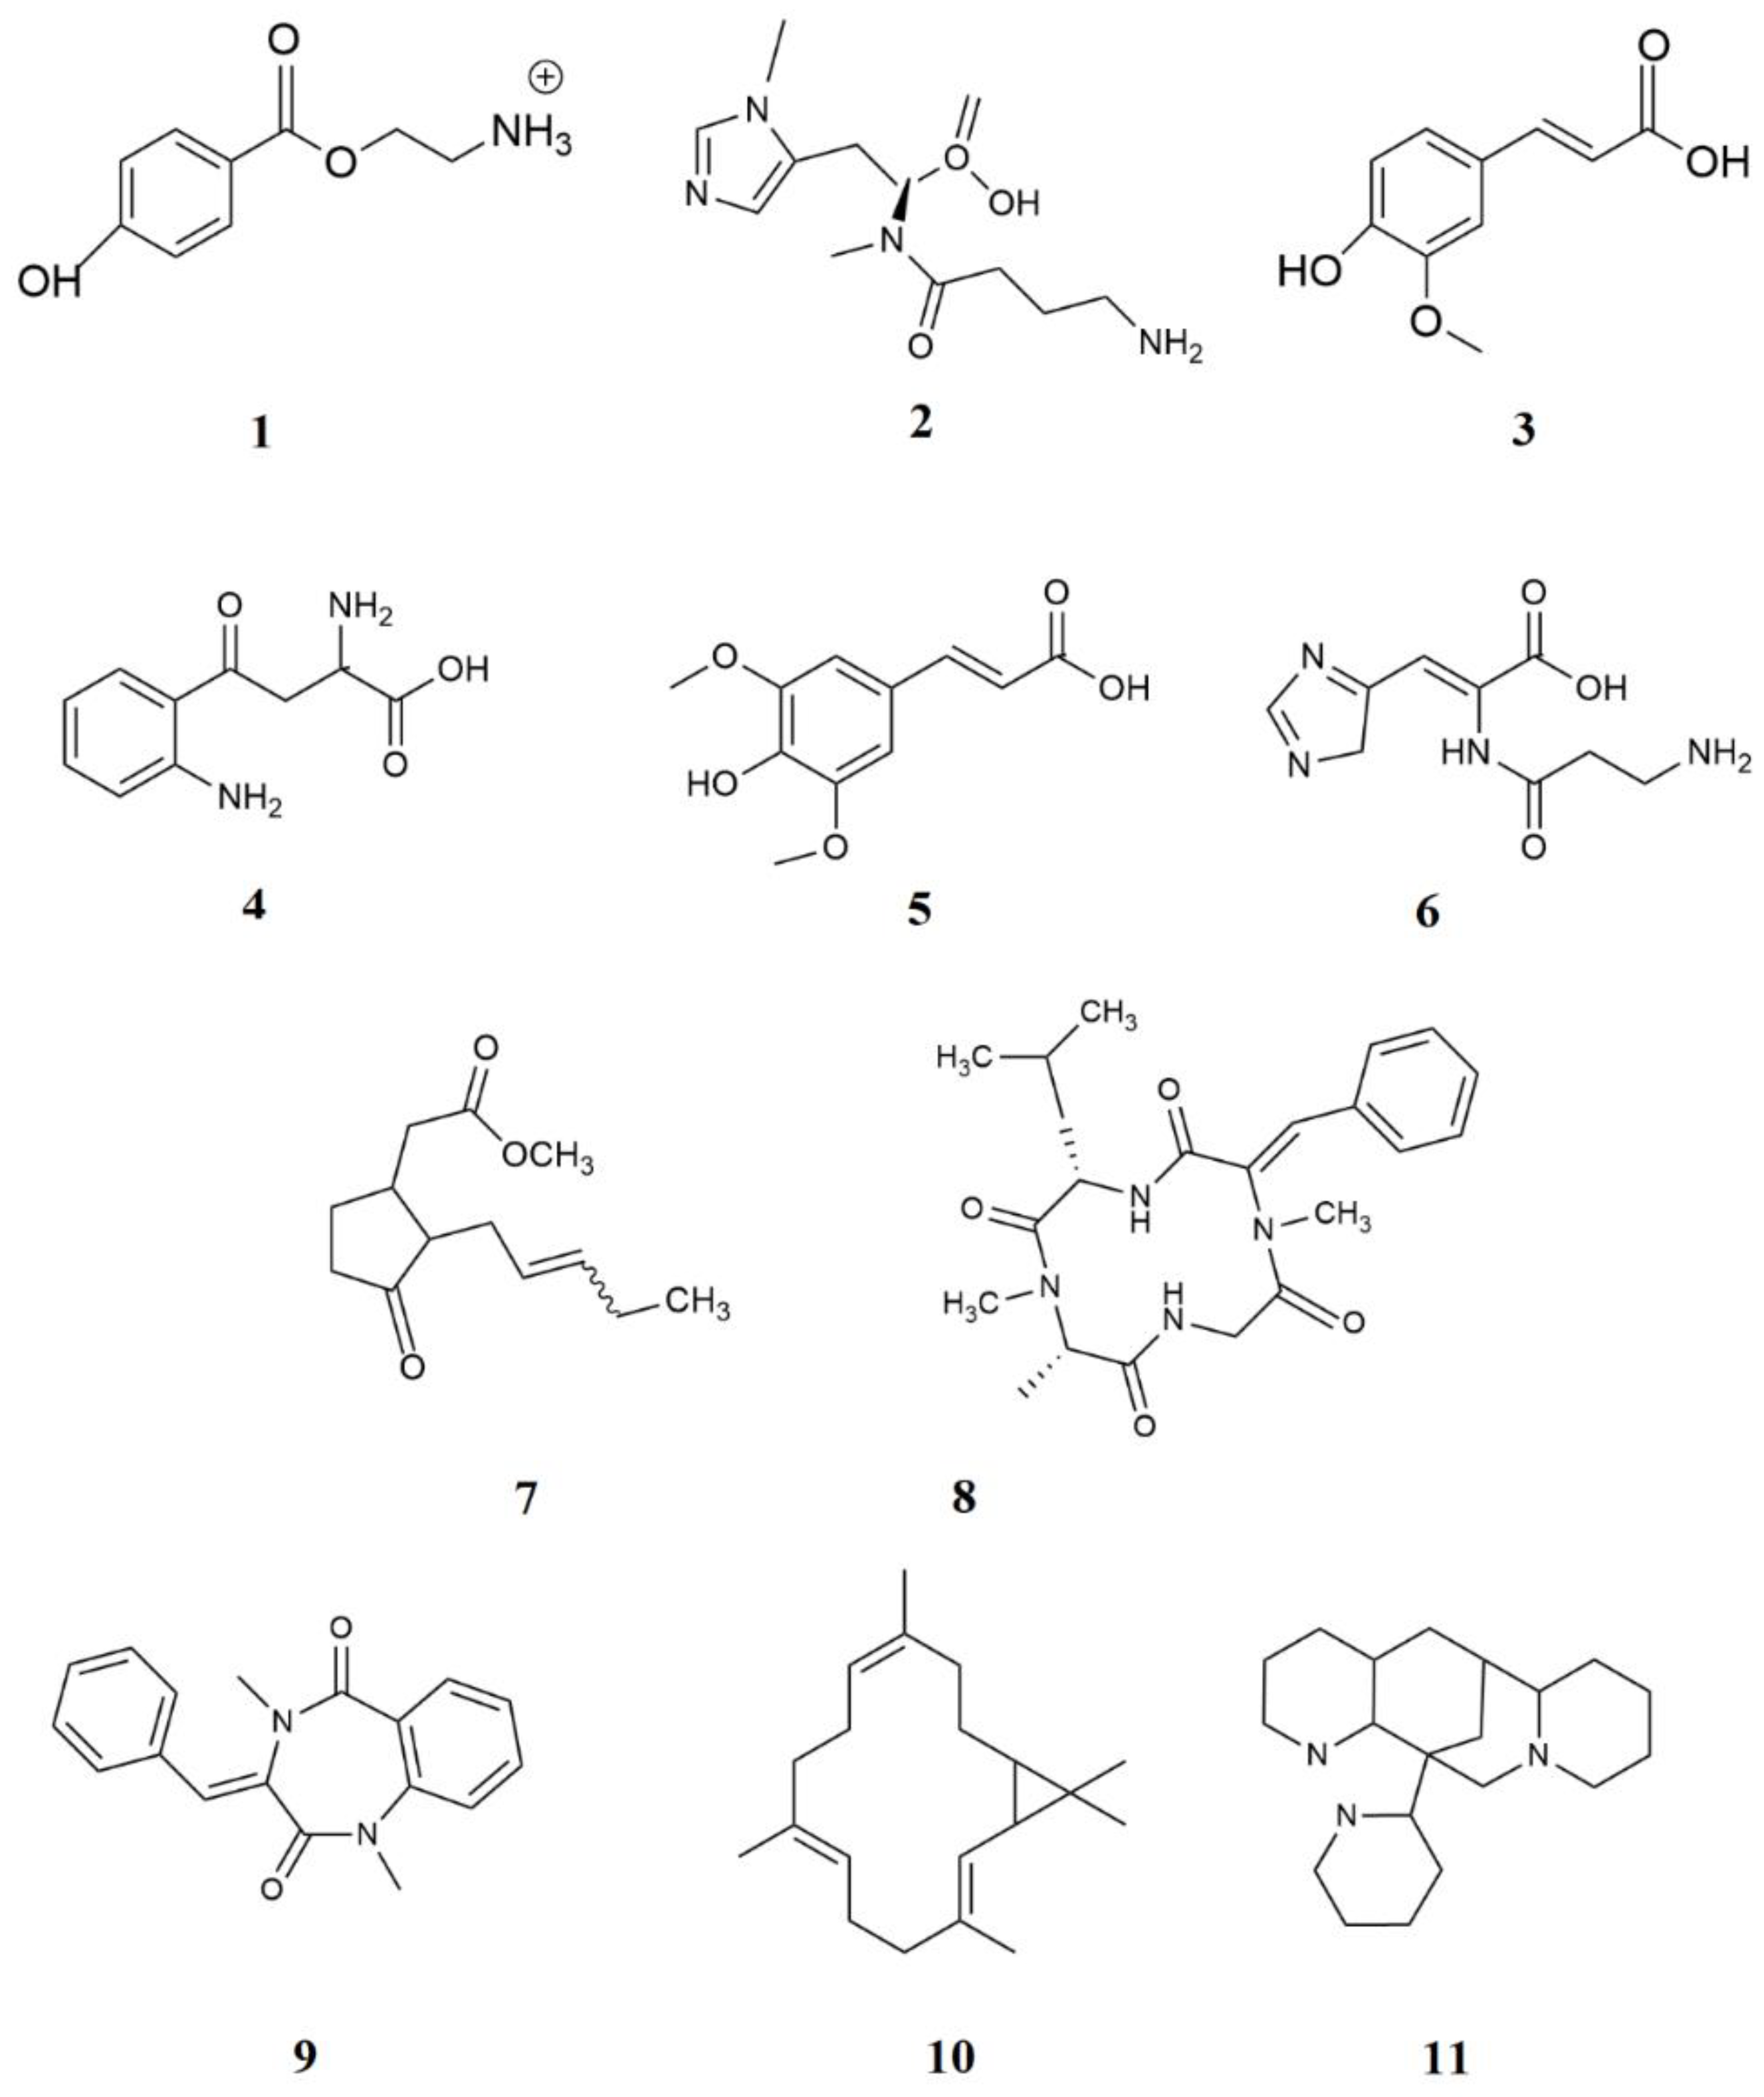
Figure 3.
Changes in the viability of MCF-7 cells after exposure to the actinomycete extract were examined via the MTT assay. The viability of MCF-7 cells decreased with increasing concentrations of the bacterial extract. The most diminished survival rate was noted at the 48-hour time point, with an IC50 of 24.58 μg/ml. (Control: Untreated cells). The data are presented as the means ± SEMs. (****P < 0.0001, *** P = 0.0001, ** p ≤ 0.001, *P < 0.05 and ns: not significant).
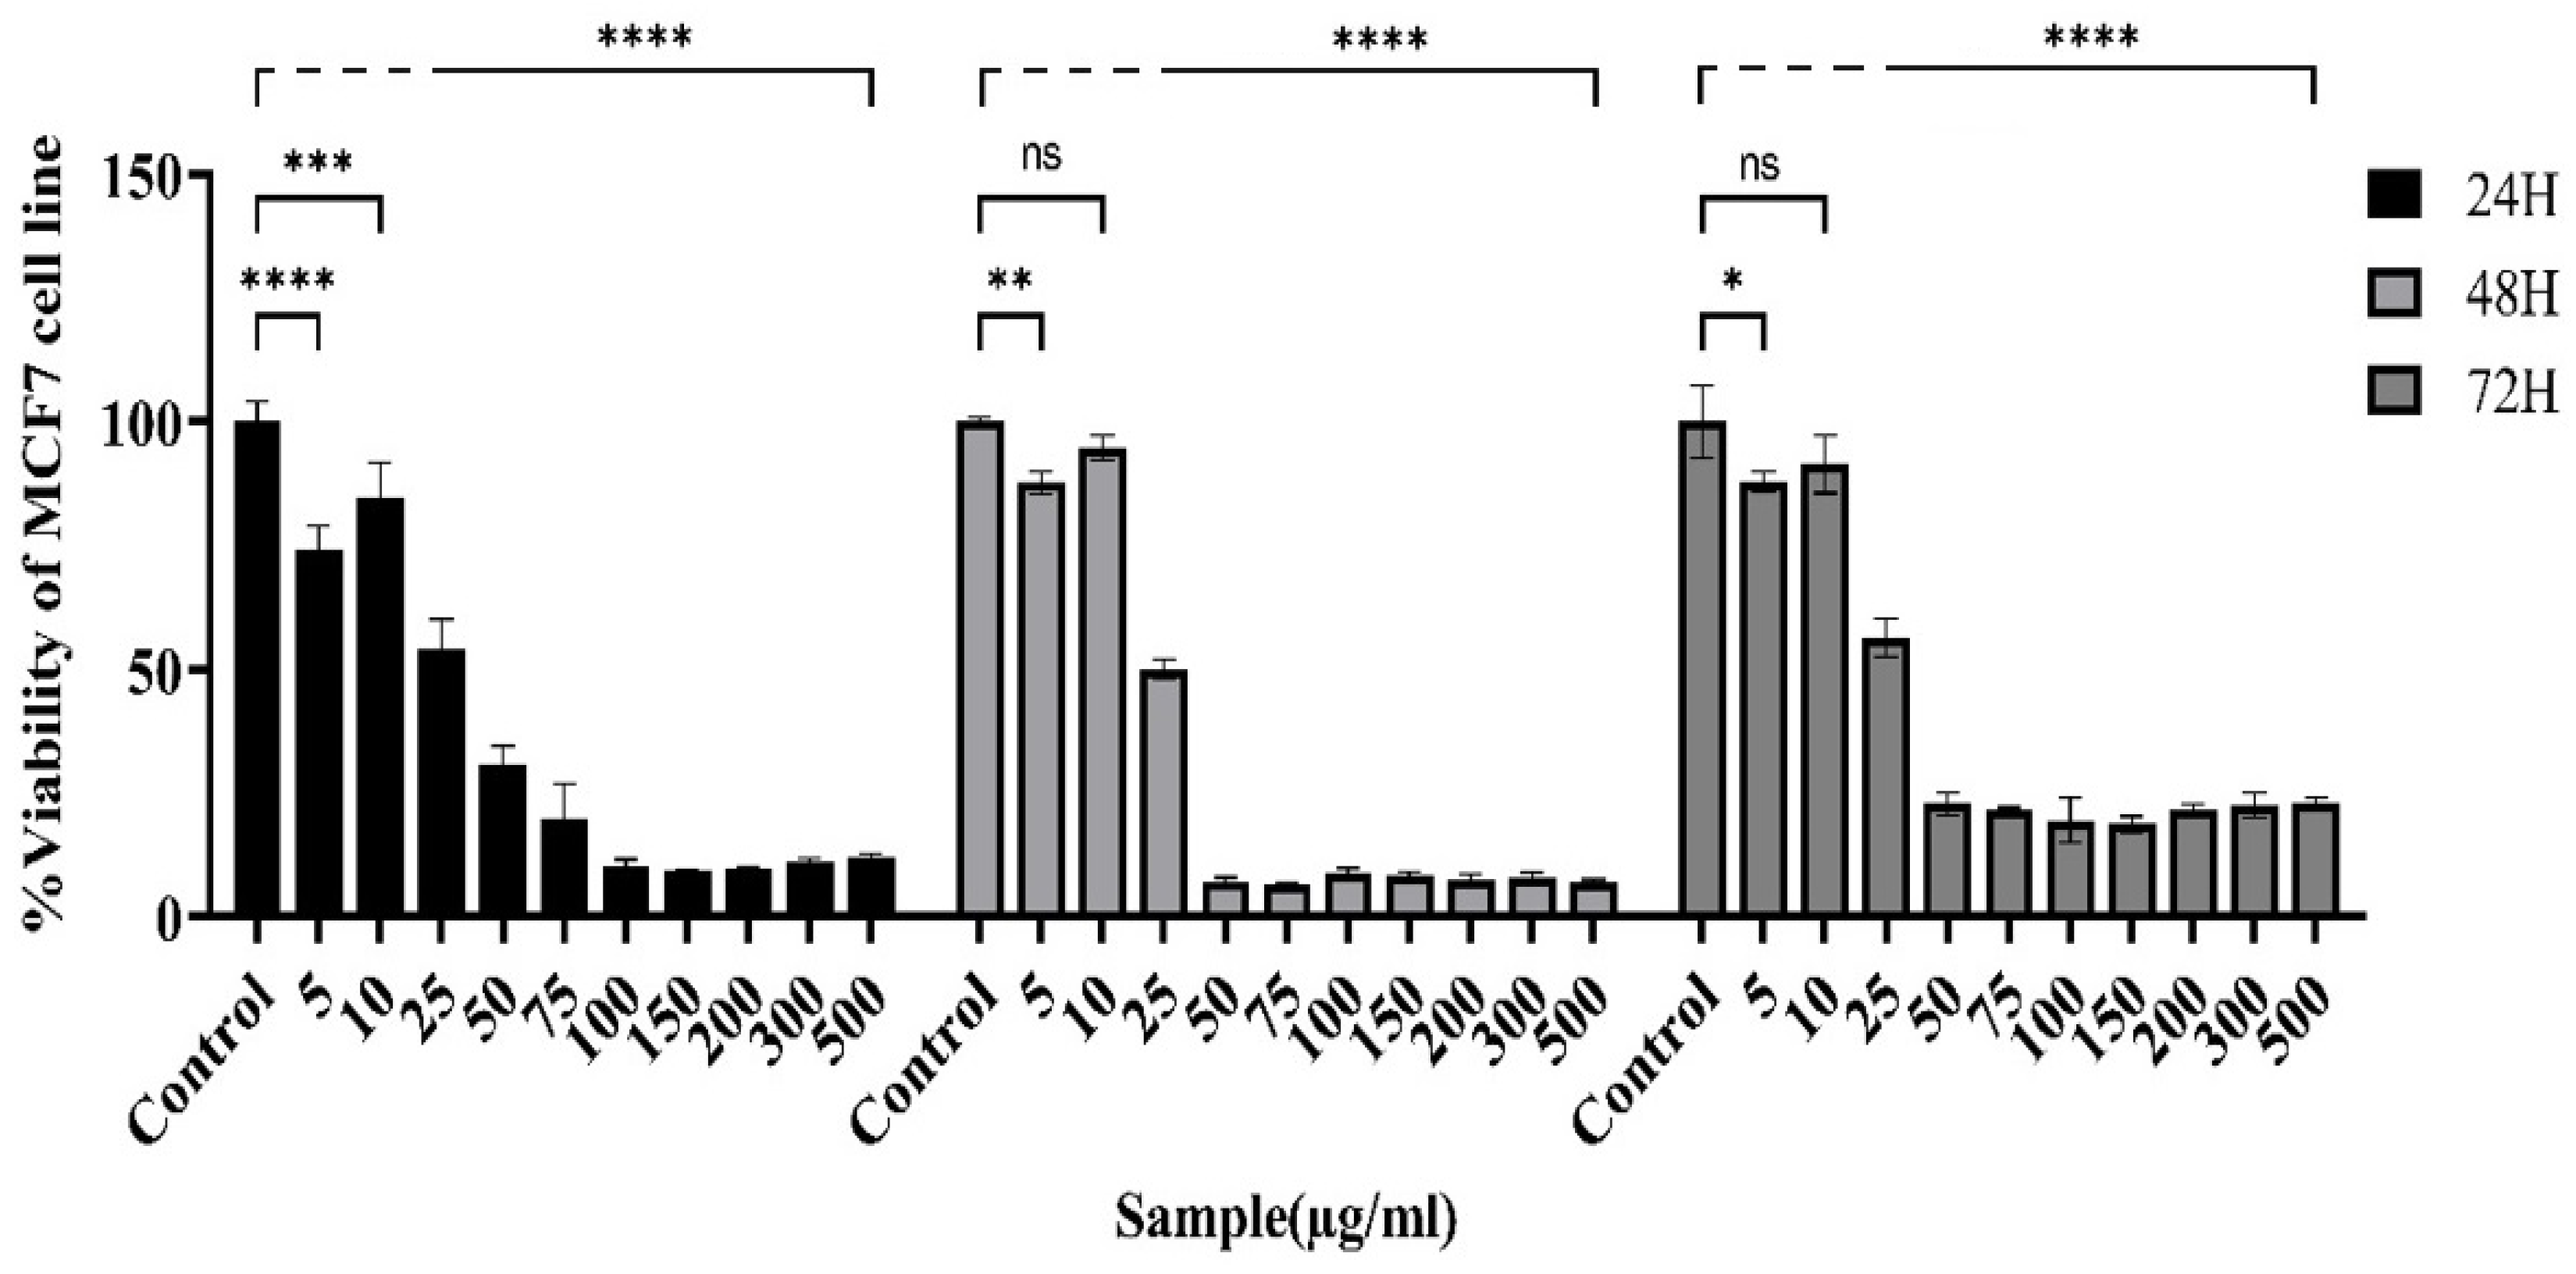
Figure 4.
Alterations in the viability of MDA-MB231 cells after exposure to the actinomycete extract were analyzed via the MTT assay. The viability of MDA-MB-231 cells was reduced in both concentration- and time-dependent manners. The survival rate at the 48-hour time point presented an IC50 value of 132.6 μg/ml. (Control: untreated cells). The data are presented as the means ± SEMs. (****P < 0.0001, *** P = 0.0001, ** p ≤ 0.001, *P < 0.05 and ns: not significant).
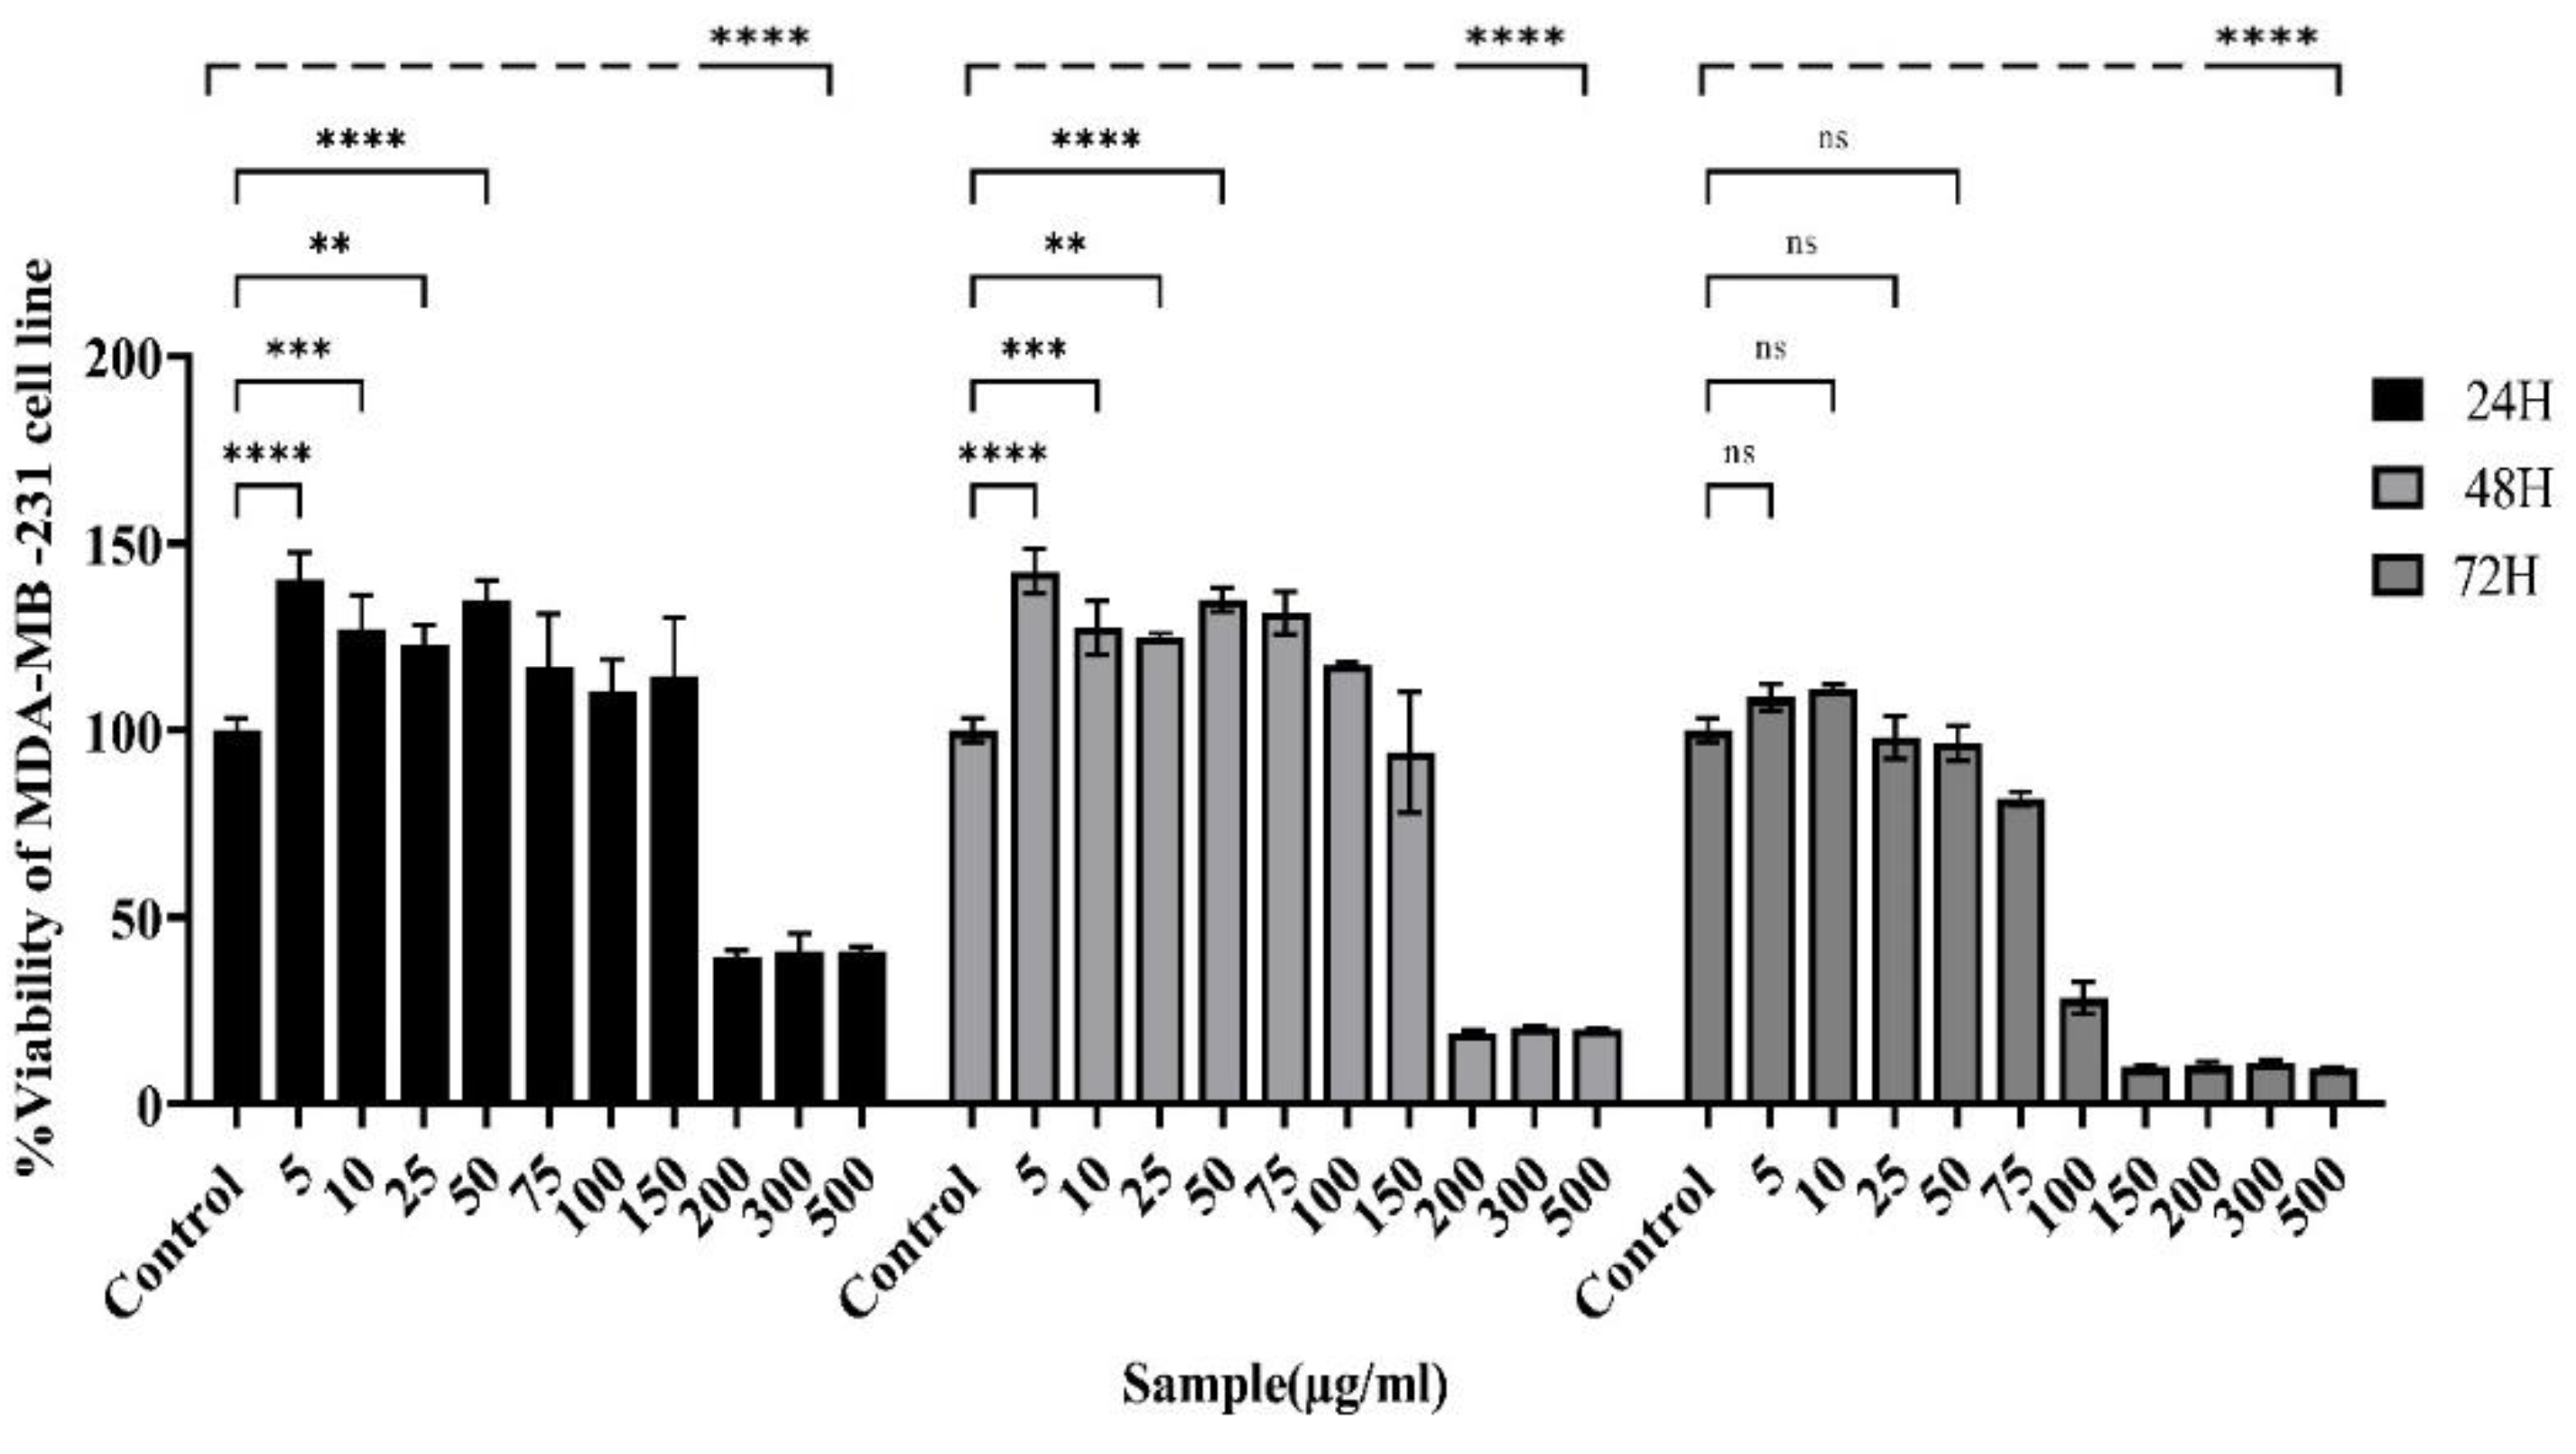
Figure 5.
Bargraph showing changes in the viability of MCF-10A cells following treatment with the Actinomycete culture extract examined by MTT. The viability of MCF-10A cells is reduced in both concentration- and time-dependent manners. The extract from the actinomycete culture showed specific toxicity toward MCF-10A cells, with the IC50 values increasing to 384.8 μg/ml following a 48-hour exposure. (Control: Untreated cells). The data are presented as the means ± SEMs. (****P < 0.0001, *** P = 0.0001, ** p ≤ 0.001, *P < 0.05 and ns: not significant).
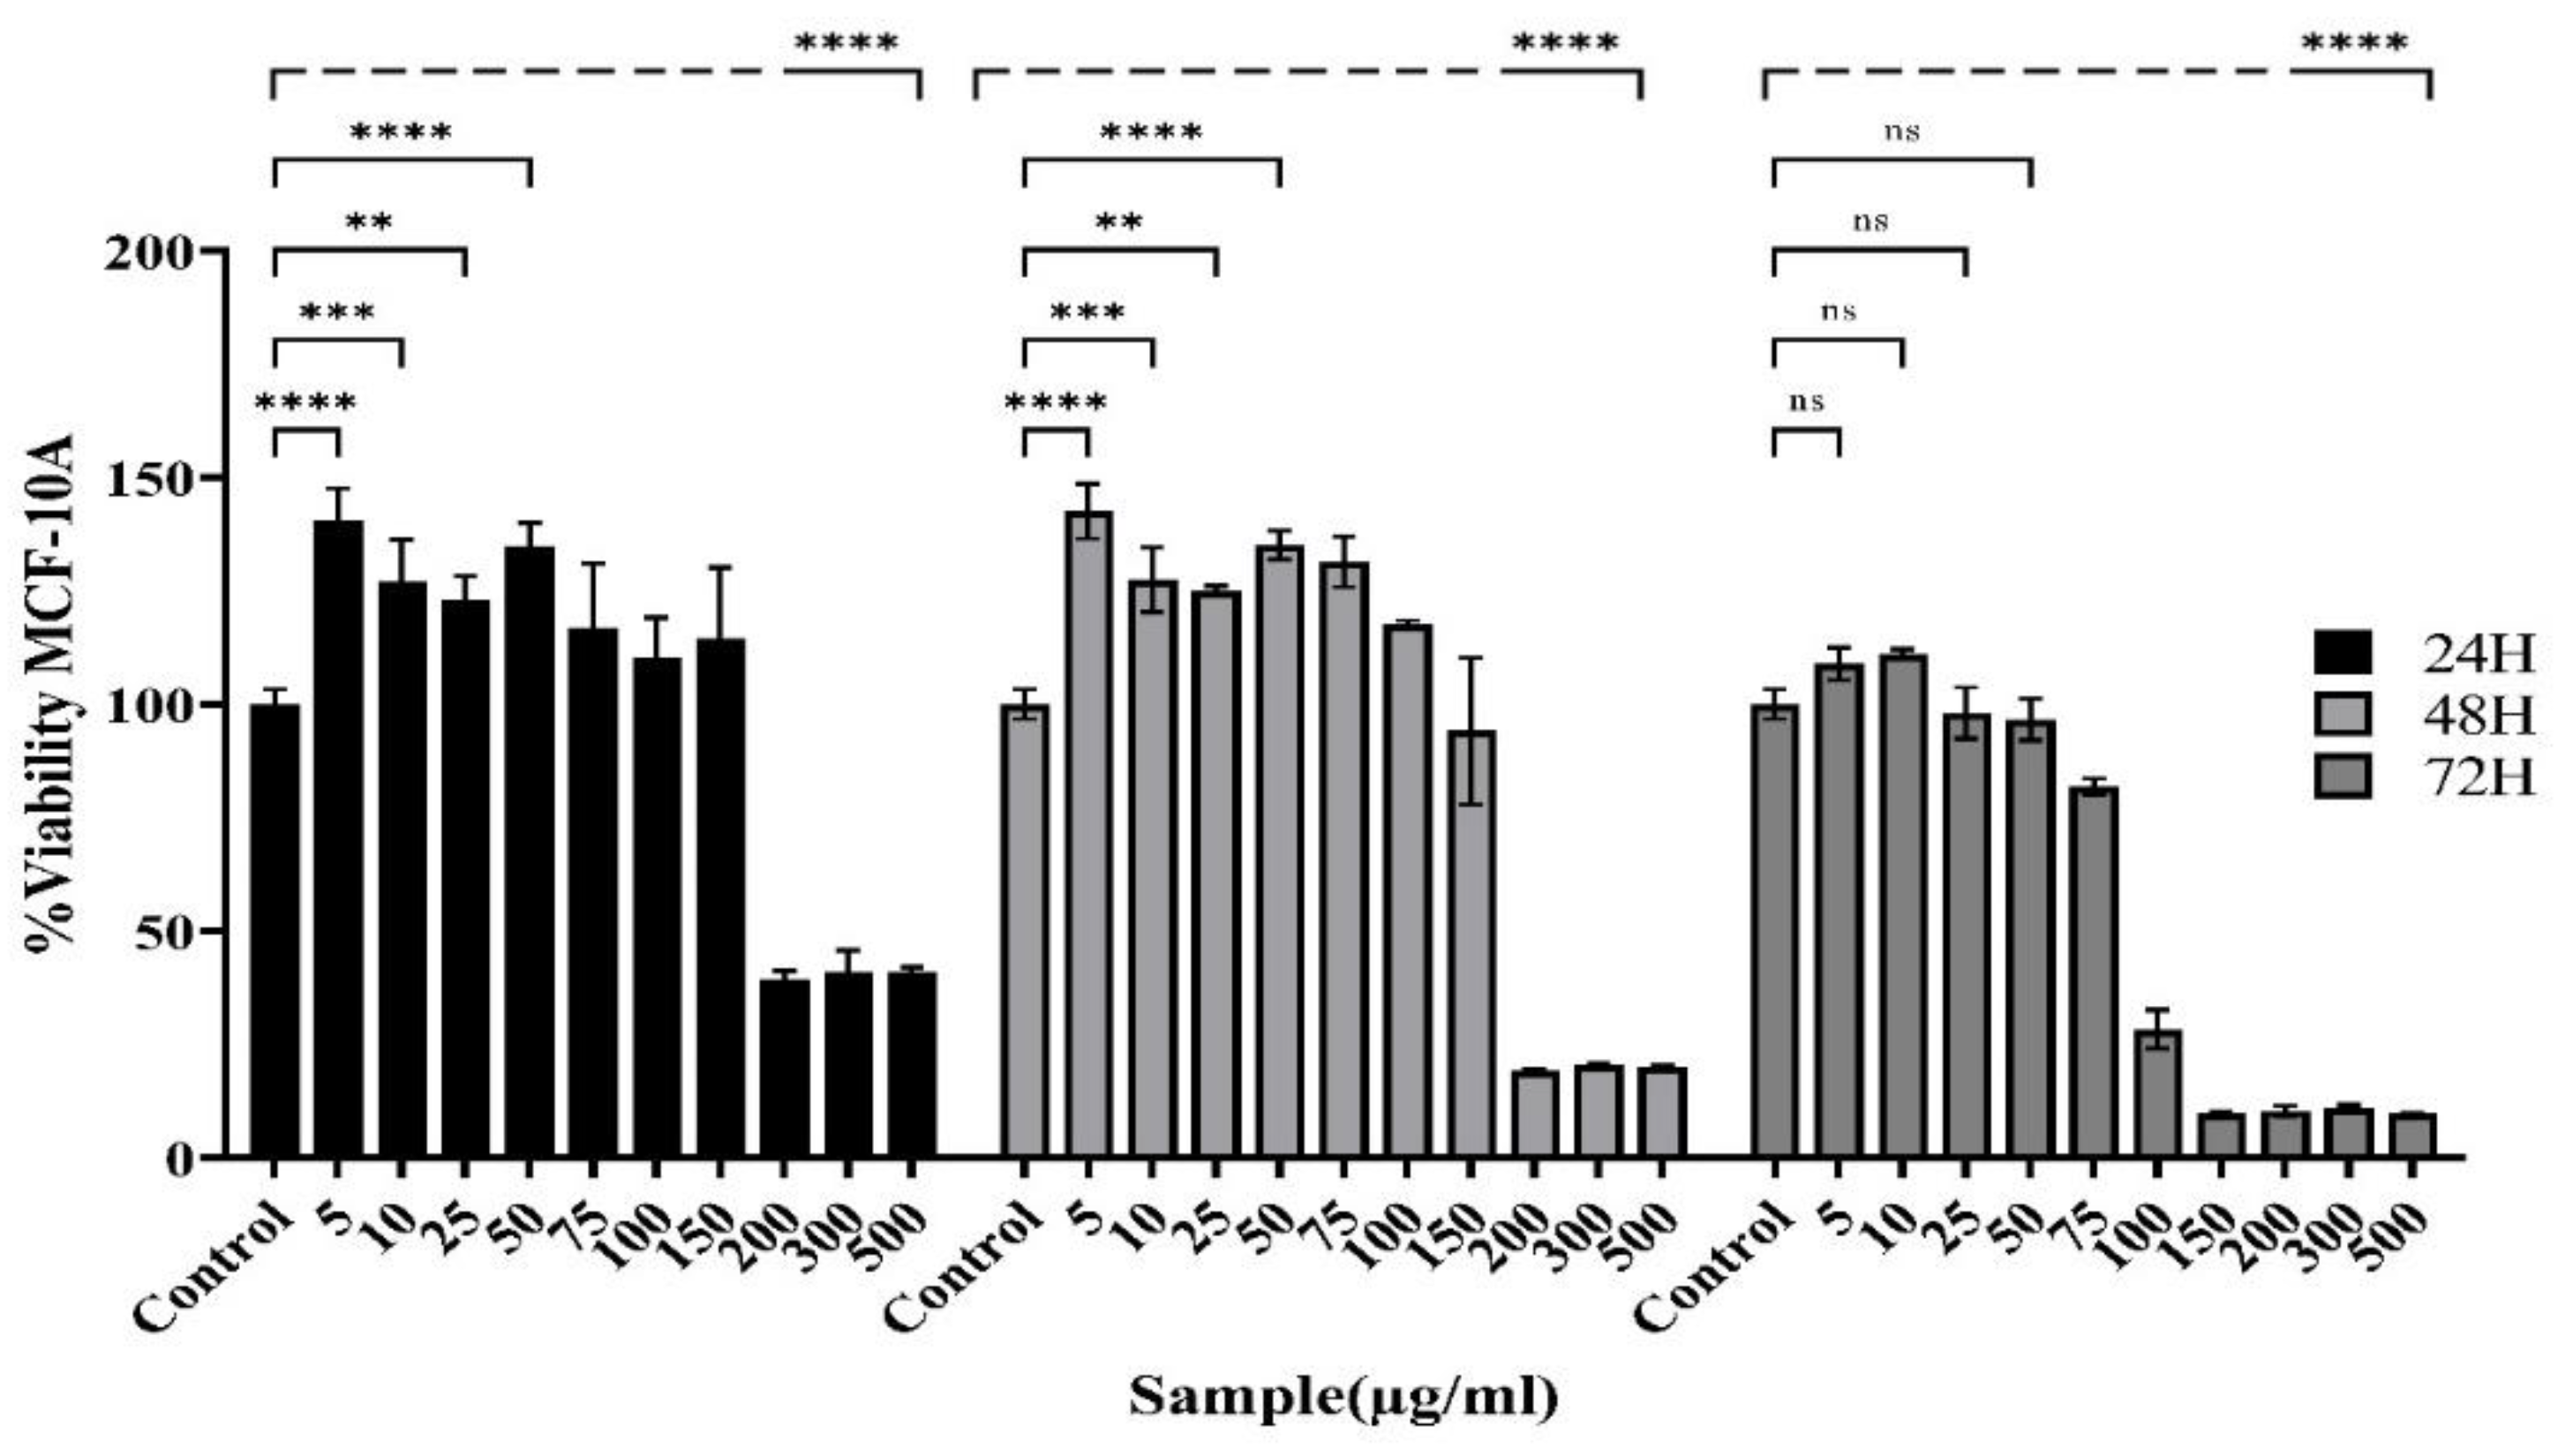
Figure 6.
Scatter plot of logarithmically amplified fluorescence signals of living and dead cells by flow cytometry assay in untreated (control) and treated (24.58 μg/ml Streptomyces culture extract at 48 h) MCF-7 cells.
Figure 6.
Scatter plot of logarithmically amplified fluorescence signals of living and dead cells by flow cytometry assay in untreated (control) and treated (24.58 μg/ml Streptomyces culture extract at 48 h) MCF-7 cells.
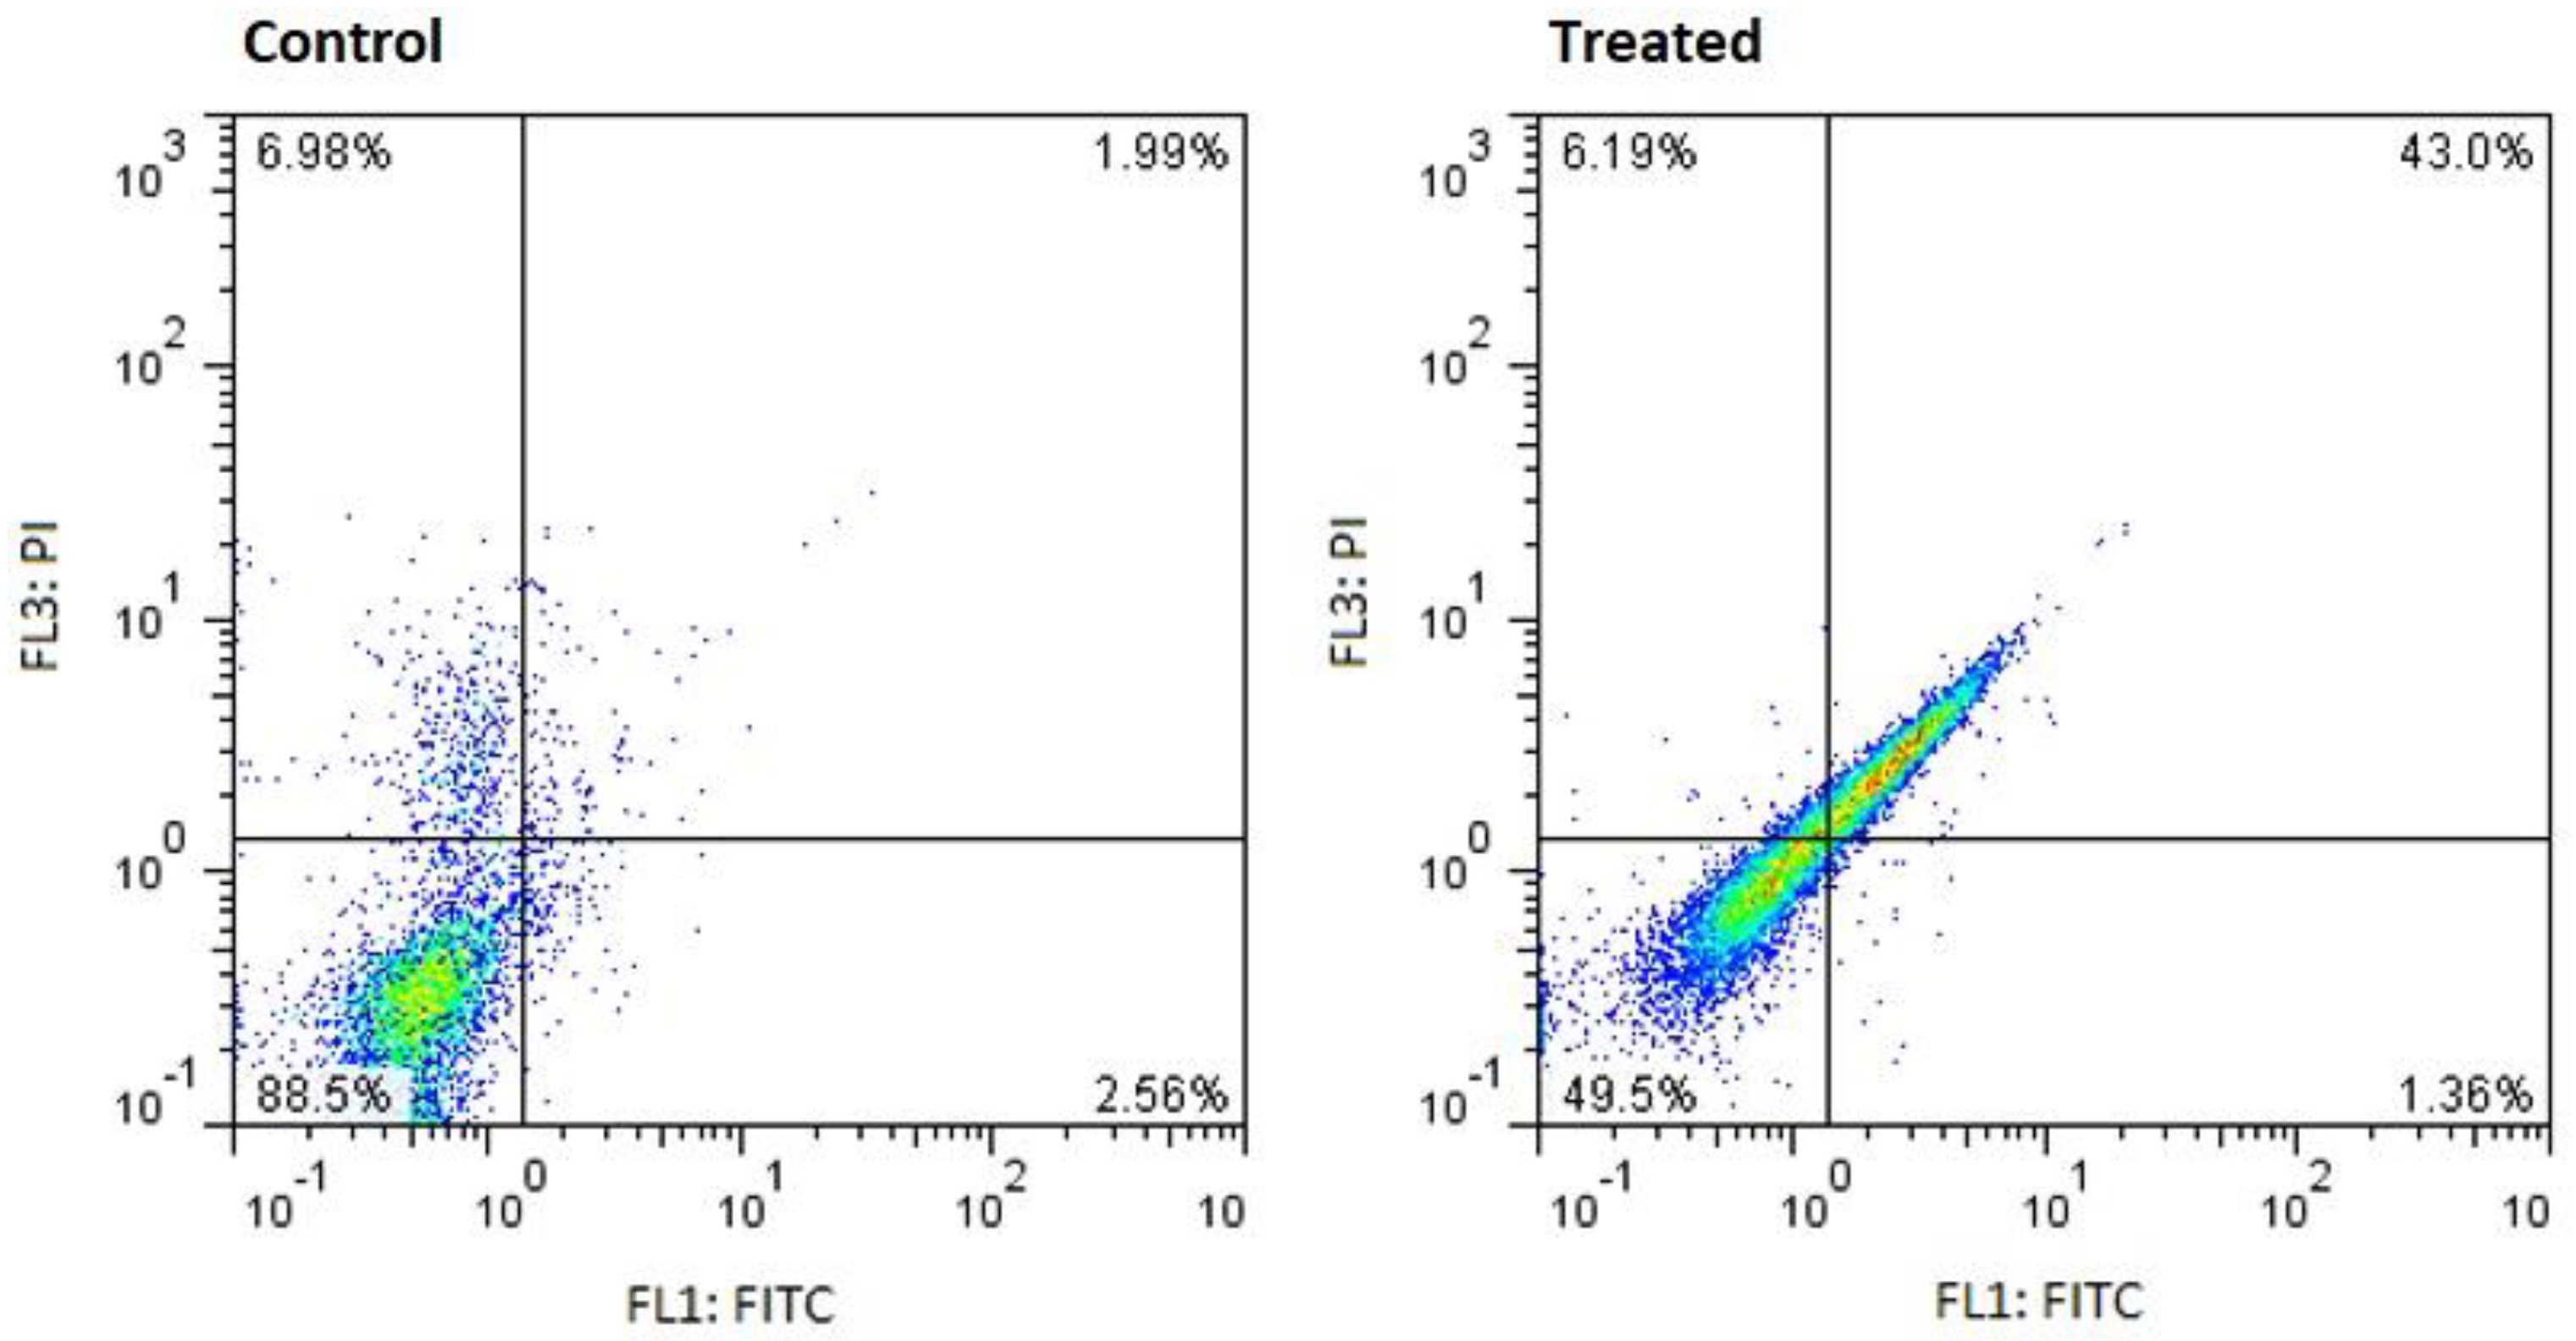
Figure 7.
Alterations in the expression values of the BAX and CASPASE 3, 8 & 9 genes were examined via qRT‒PCR following treatment with 24.58 μg/ml bacterial culture extract. B2M was used as a loading control (****P < 0.0001 and ** p ≤ 0.001).
Figure 7.
Alterations in the expression values of the BAX and CASPASE 3, 8 & 9 genes were examined via qRT‒PCR following treatment with 24.58 μg/ml bacterial culture extract. B2M was used as a loading control (****P < 0.0001 and ** p ≤ 0.001).
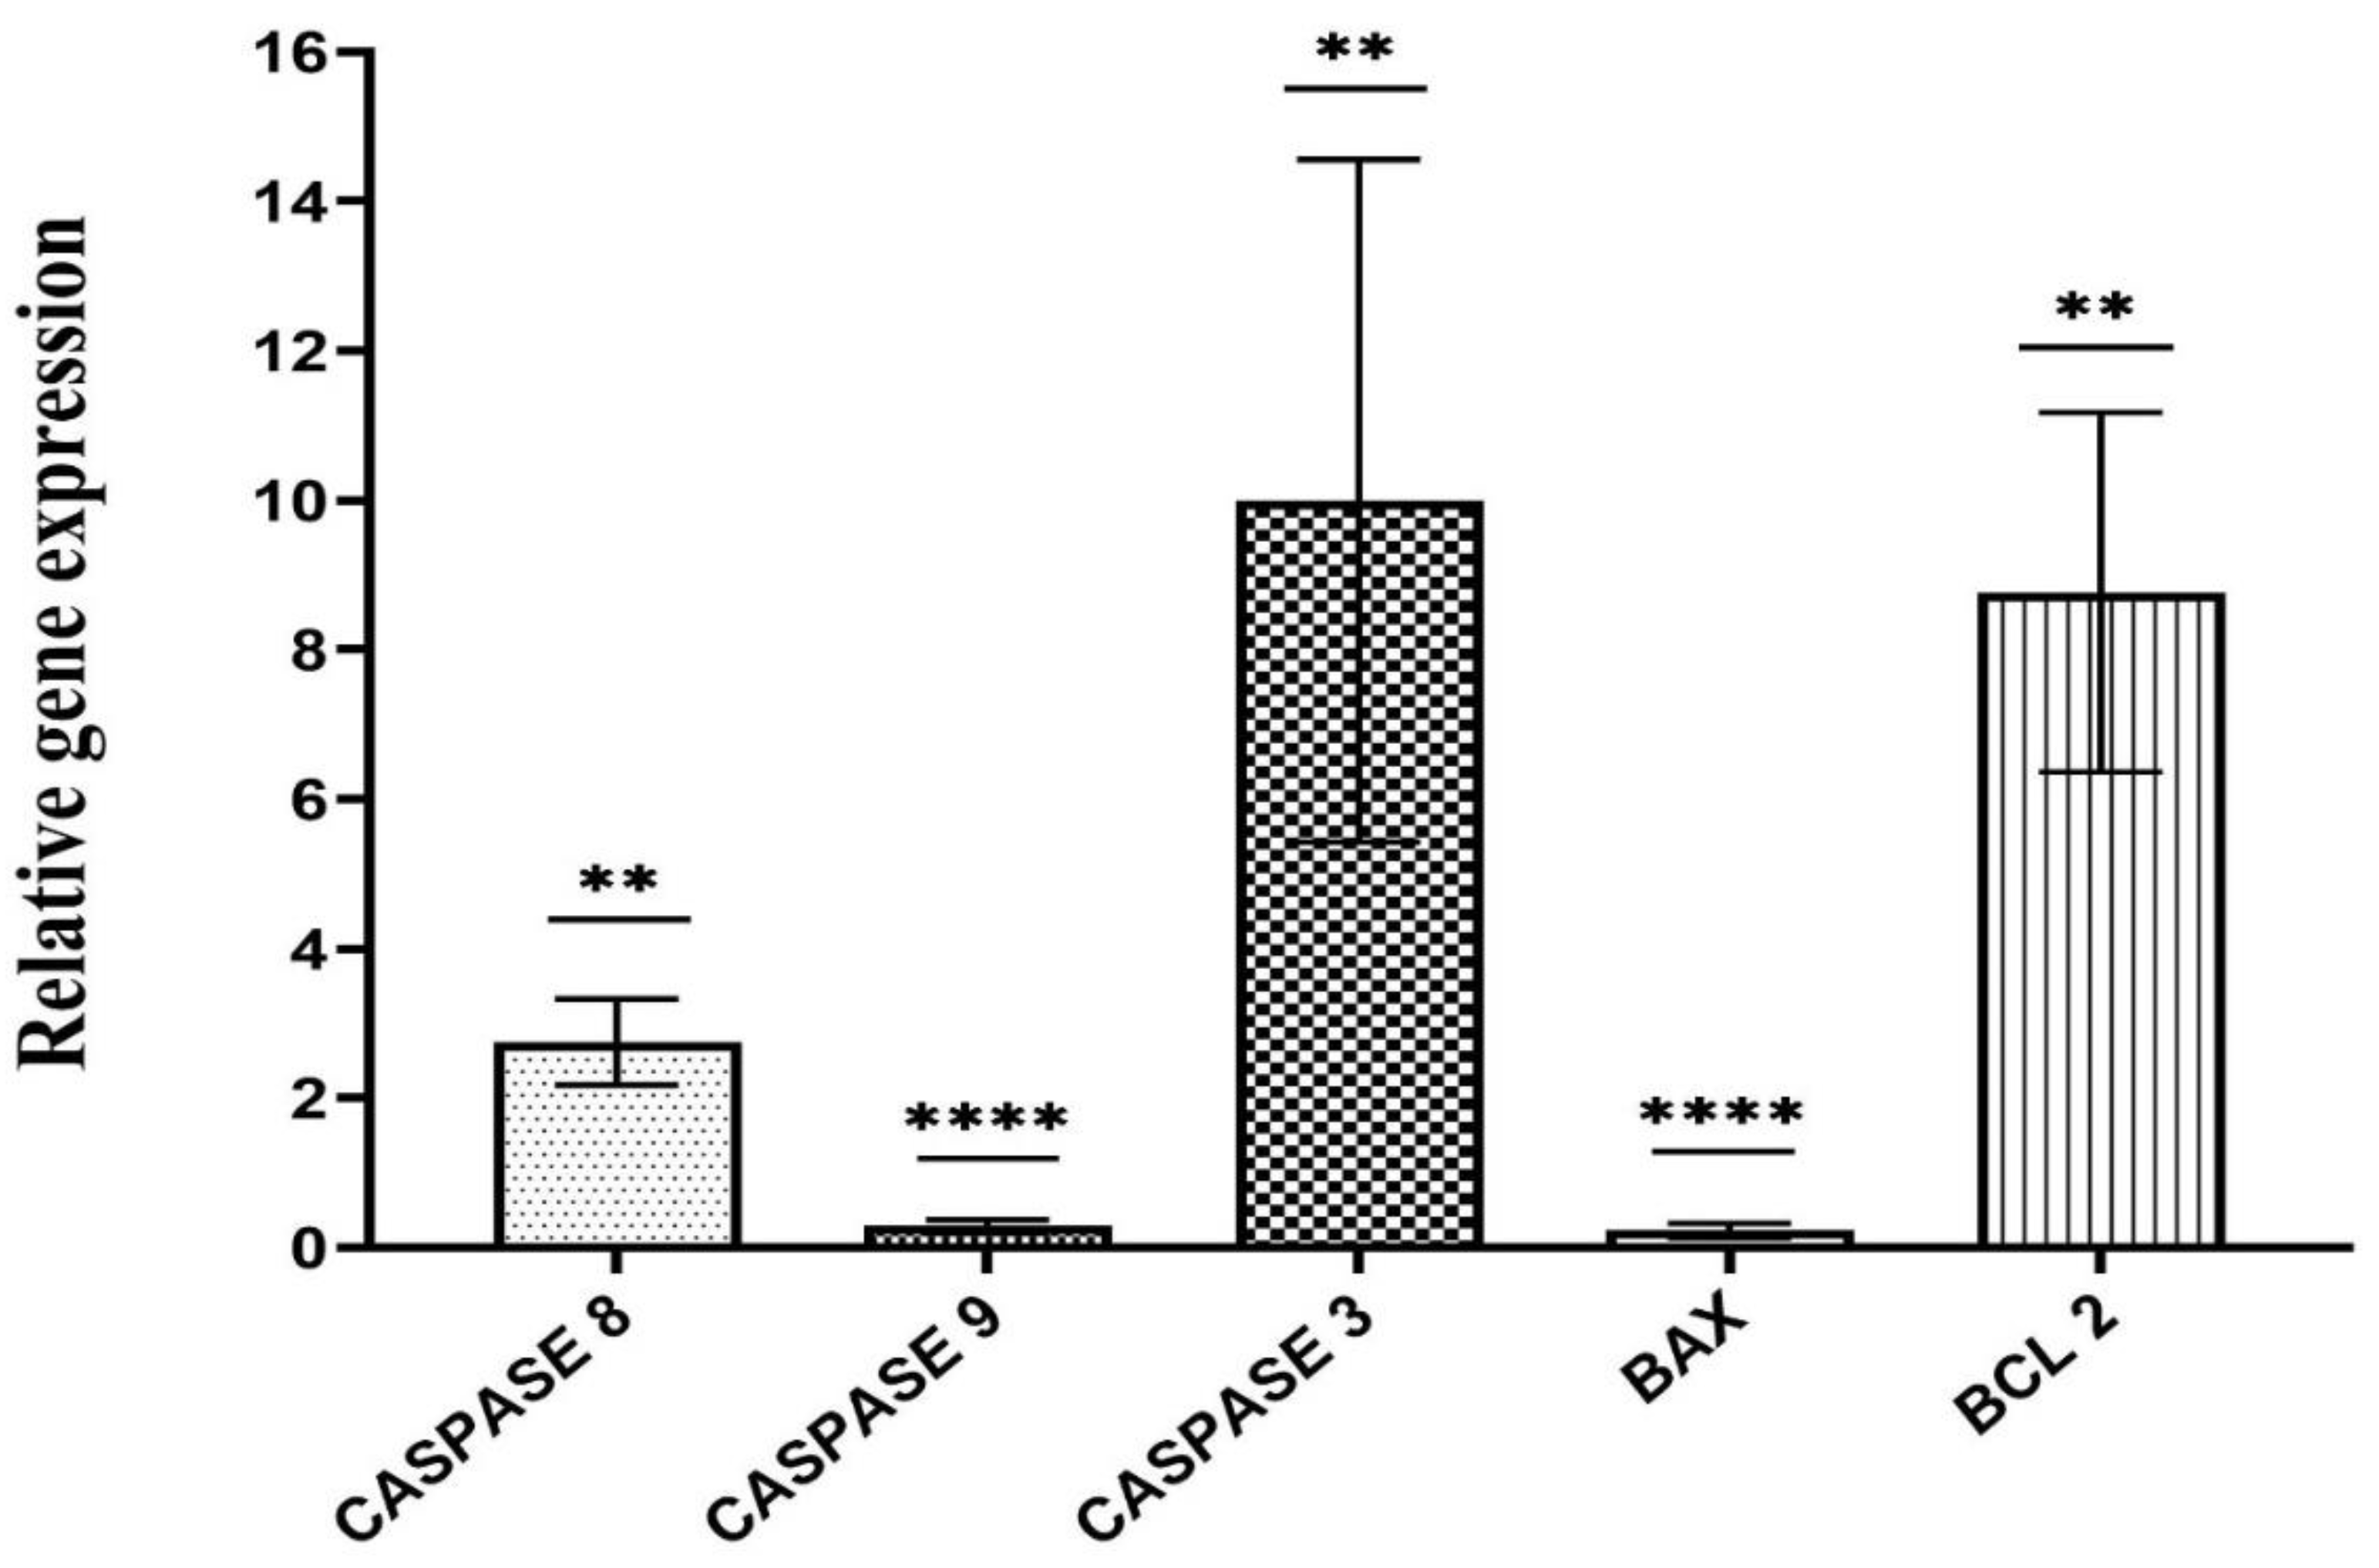
Figure 8.
The activity value of CASPASE 3/7 in MCF-7 cells following exposure to 24.58 μg/ml S. violaceochromogenes strain M12 culture extract for 48 h compared with that of the control group (**** p < 0.0001).
Figure 8.
The activity value of CASPASE 3/7 in MCF-7 cells following exposure to 24.58 μg/ml S. violaceochromogenes strain M12 culture extract for 48 h compared with that of the control group (**** p < 0.0001).
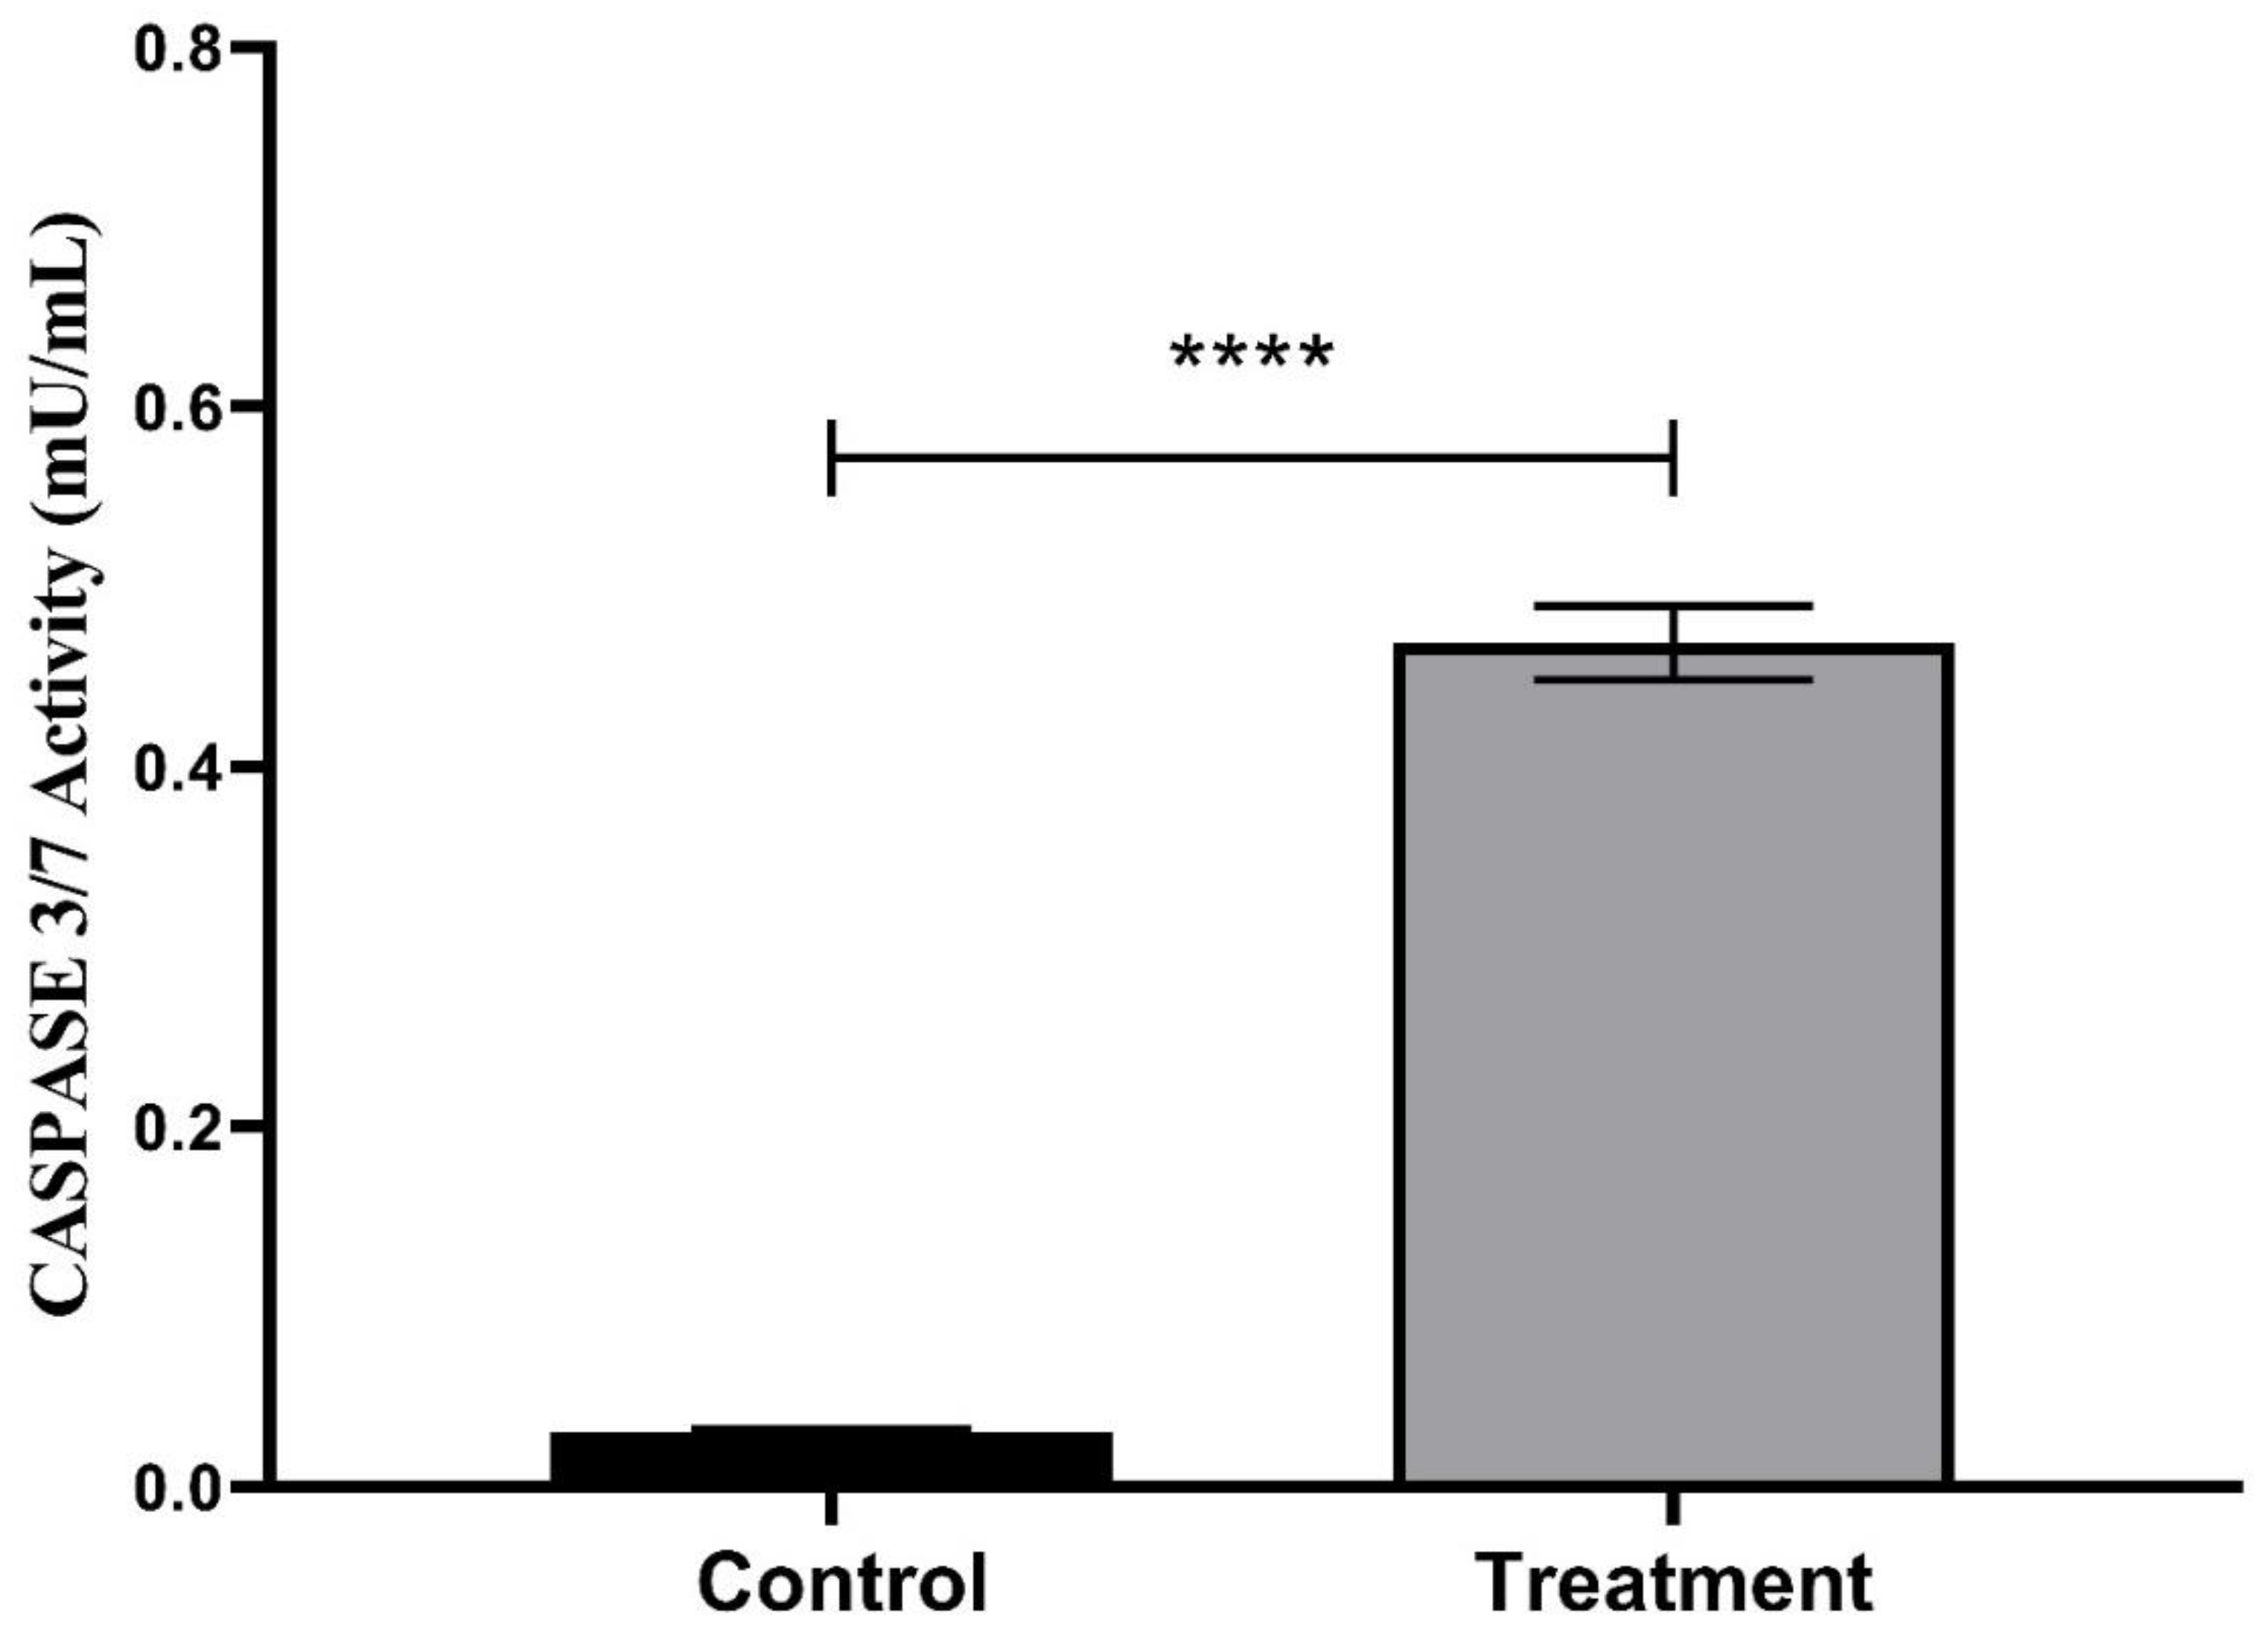
Figure 9.
Hematoxylin and eosin-stained sections of the tumors tissue in control and actinomycete-treated group (Images scale bar; Left, 40 and right, 10 μm).
Figure 9.
Hematoxylin and eosin-stained sections of the tumors tissue in control and actinomycete-treated group (Images scale bar; Left, 40 and right, 10 μm).
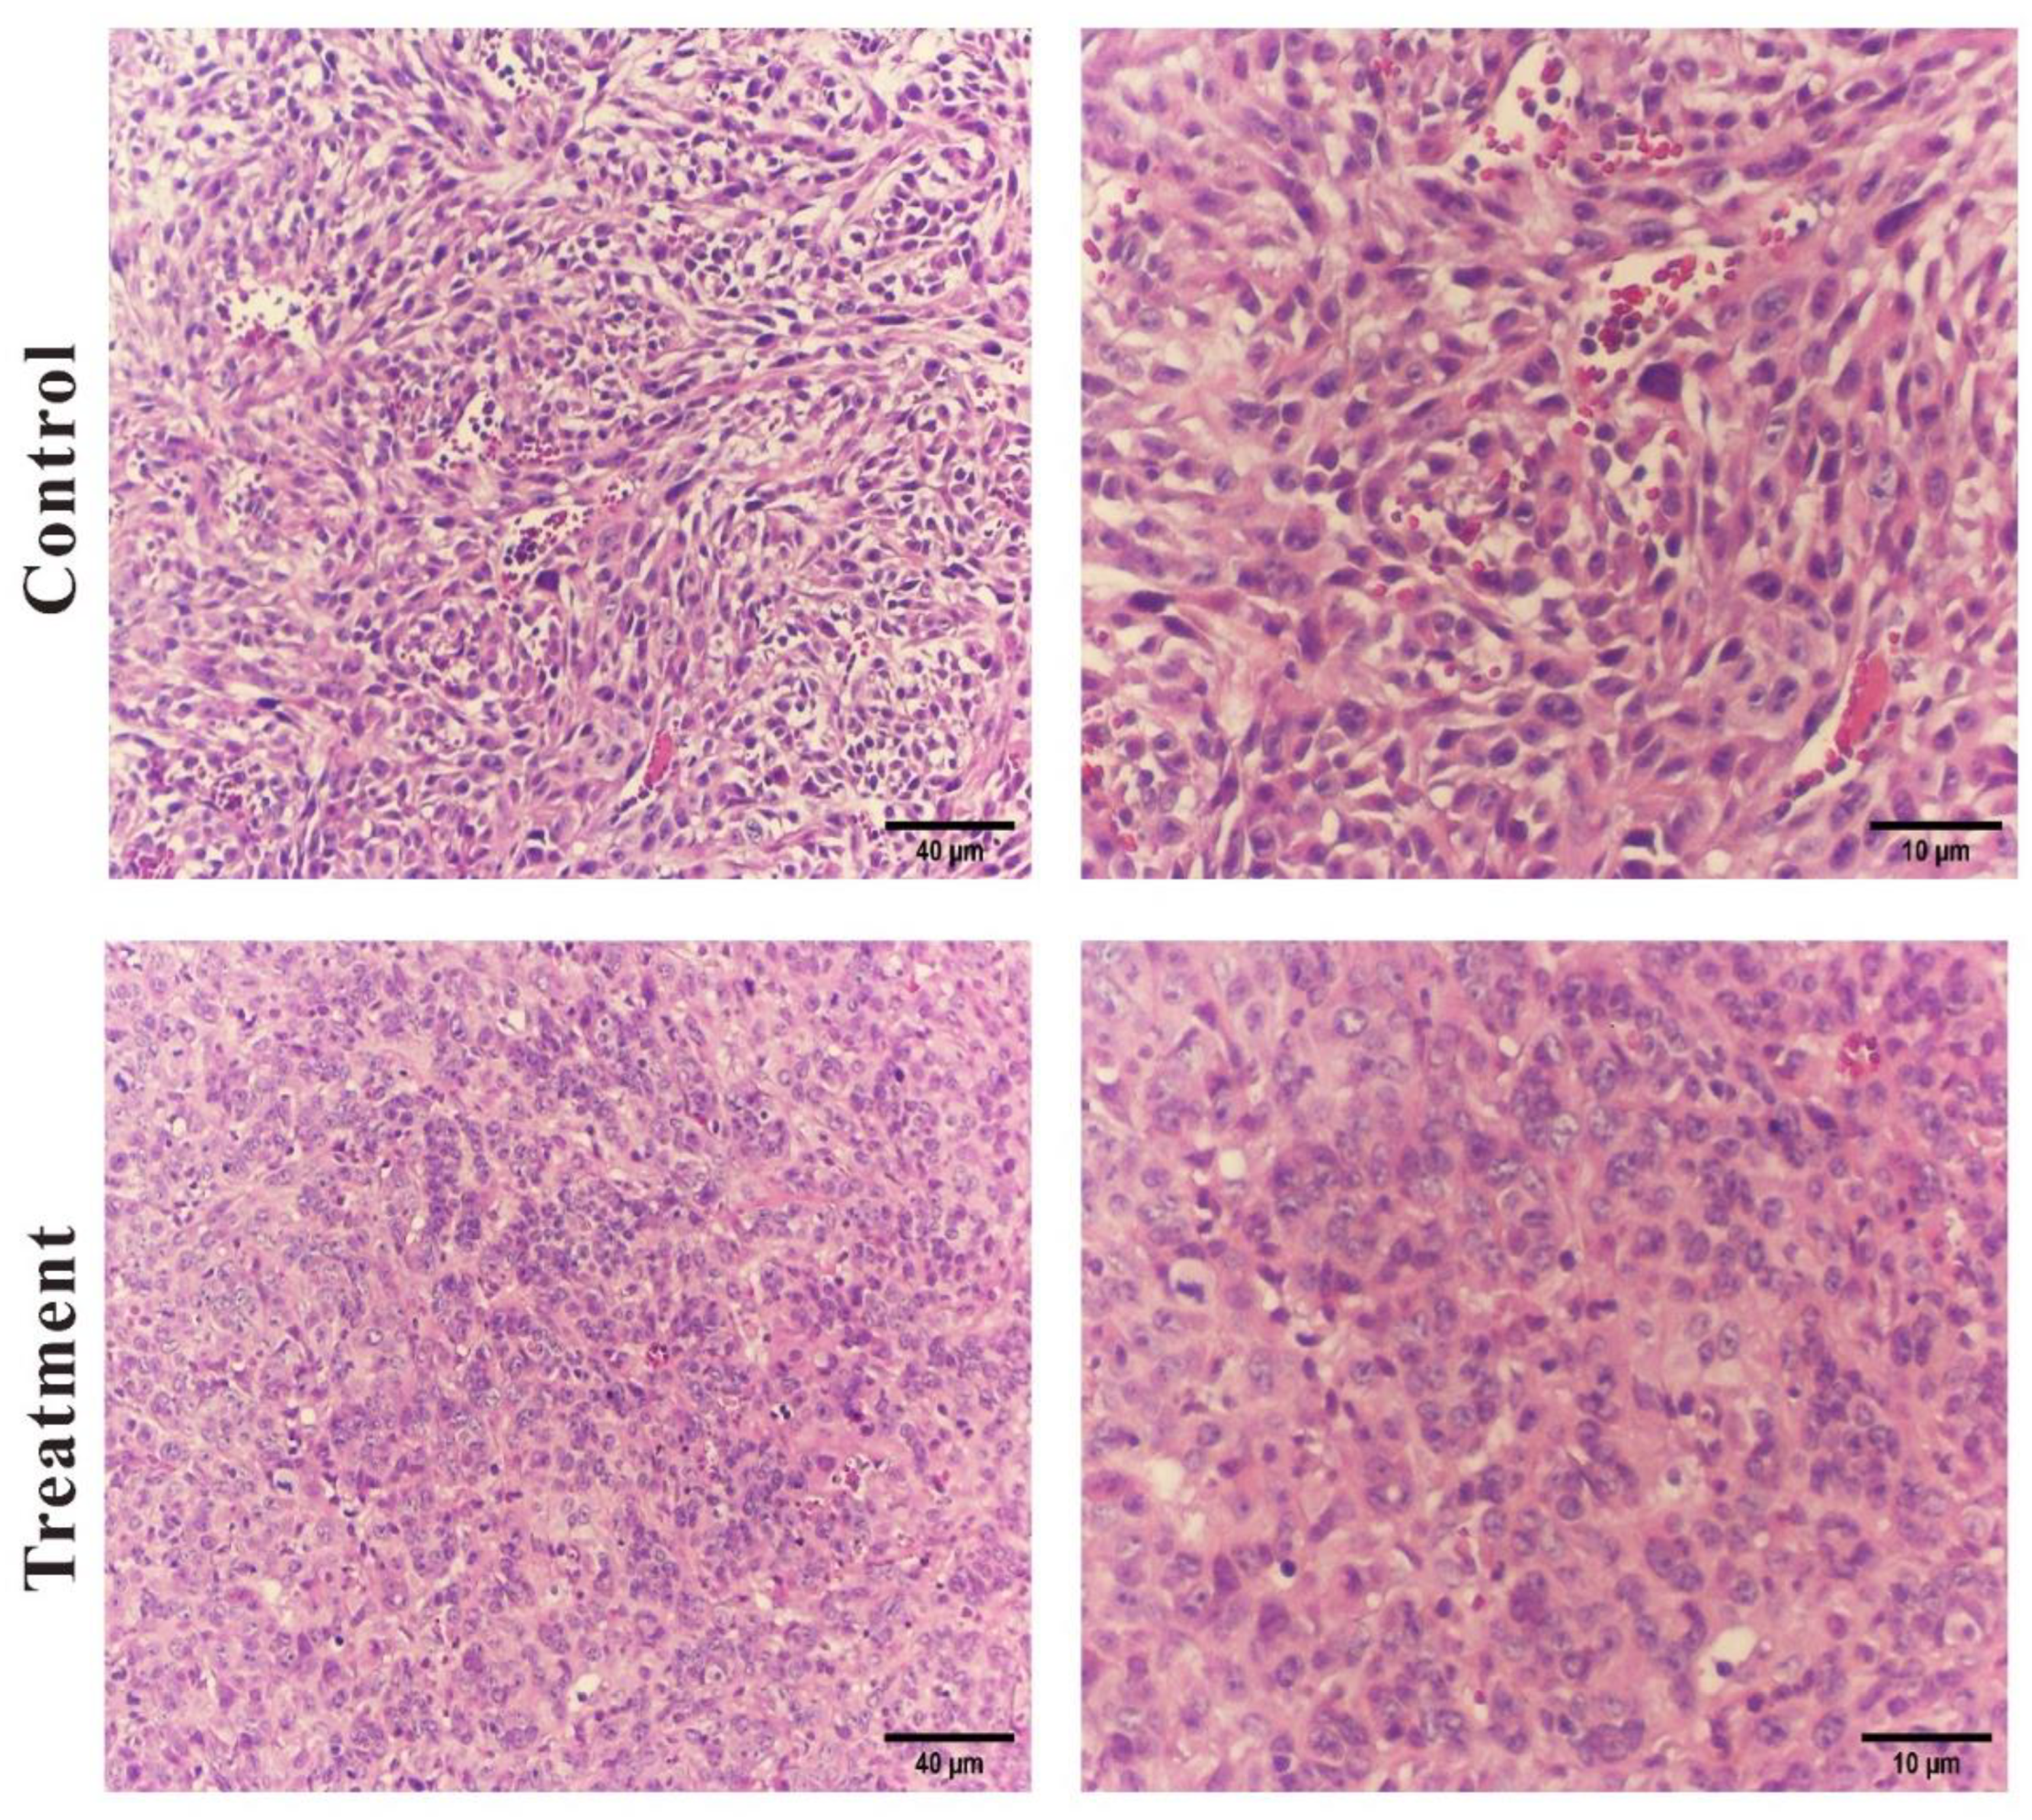

Table 1.
List of chemical constituents identified in the EtOAc extract of S. violaceochromogenes M12 via ESI‒LC‒MS.
Table 1.
List of chemical constituents identified in the EtOAc extract of S. violaceochromogenes M12 via ESI‒LC‒MS.
| No. | RT (min) | MW | Tentative identification | Class | % of total |
| 1 | 11.60 | 224.17 | 4-Hydroxybenzoyl choline | Phenol | 4.61 |
| 2 | 12.34 | 240.12 | Homocarnosine | Peptide | 1.77 |
| 3 | 12.86 | 195.16 | Ferulic acid | Phenol | 3.32 |
| 4 | 13.91 | 208.23 | L-Kynurenine | peptide | 8.08 |
| 5 | 14.36 | 224.17 | Sinapinic acid | phenol | 41.99 |
| 6 | 14.78 | 225.17 | Carnosine | Peptide | 2.73 |
| 7 | 15.94 | 224.17 | Methyl Jasmonic acid | Jasmonic acid (fatty acid) | 5.53 |
| 8 | 16.49 | 414.26 | Tentoxin | Peptide | 4.90 |
| 9 | 16.94 | 278.13 | Dehydrocyclopeptine | Peptide | 5.08 |
| 10 | 19.16 | 273.27 | Casbene | Terpenoid | 9.24 |
| 11 | 19.59 | 317.32 | (-)-Ormosanine | Alkaloid | 5.08 |
RT = Retention Time; MW = Molecular Weight; % = percent relative concentration.
Table 2.
List of primer pairs used for qRT‒PCR amplification.
| Gene | Sequence | Product size(bp) |
| B2M-F | 5`- GACCACTTACGTTCATTGACTCC - 3` | 171 |
| B2M-R | 5`- CAGGGTTTCATCATACAGCCAT - 3` | |
| BAX-F | 5`-TCAGGATGCGTCCACCAAGAAG - 3` | 103 |
| BAX-R | 5`-TGTGTCCACGGCGGCAATCATC - 3` | |
| CASPASE 3-F | 5`-CATGGAAGCGAATCAATGGACT - 3` | 139 |
| CASPASE 3-R | 5`-CTGTACCAGACCGAGATGTCA - 3` | |
| CASPASE 8-F | 5`- AGAAGAGGGTCATCCTGGGAGA - 3` | 142 |
| CASPASE 8-R | 5`- TCAGGACTTCCTTCAAGGCTGC - 3` | |
| CASPASE 9-F | 5`-GTTTGAGGACCTTCGACCAGCT - 3` | 129 |
| CASPASE 9-R | 5`-CAACGTACCAGGAGCCACTCTT - 3` |
Disclaimer/Publisher’s Note: The statements, opinions and data contained in all publications are solely those of the individual author(s) and contributor(s) and not of MDPI and/or the editor(s). MDPI and/or the editor(s) disclaim responsibility for any injury to people or property resulting from any ideas, methods, instructions or products referred to in the content. |
© 2025 by the authors. Licensee MDPI, Basel, Switzerland. This article is an open access article distributed under the terms and conditions of the Creative Commons Attribution (CC BY) license (http://creativecommons.org/licenses/by/4.0/).
Copyright: This open access article is published under a Creative Commons CC BY 4.0 license, which permit the free download, distribution, and reuse, provided that the author and preprint are cited in any reuse.


