
Submitted:
15 January 2025
Posted:
16 January 2025
You are already at the latest version
Abstract
Monthly climatology of thermal fronts in the South China Sea was derived from high-resolution (2 km) high-frequency (hourly) SST data of the Advanced Himawari Imager (AHI) onboard the Japanese Himawari-8 geostationary satellite. The Belkin and O’Reilly algorithm (BOA) was applied to SST data from 2015-2022 to generate maps of SST gradient magnitude GM, which were log-transformed to enhance contrasts in digital maps and reveal additional features (fronts). The combination of high-resolution cloud-free four-day-composite SST imagery from AHI, advanced front-preserving gradient algorithm BOA, and digital contrast enhancement with log-transformation of SST gradients allowed us to identify numerous mesoscale/submesoscale fronts (including a few fronts that have never been reported) and document their month-to-month variability and spatial variability on the submesoscale. Spatio-temporal variability of SST fronts was analyzed in detail in five regions: (1) In Taiwan Strait, six fronts were identified: China Coastal Front, Taiwan Bank Front, Northern/Eastern Changyun Ridge fronts, and Eastern/Western Penghu Islands fronts; (2) The Guangdong Shelf is dominated by the China Coastal Front in winter, with the eastern and western Guangdong fronts separated by the Pearl River outflow; (3) Hainan Island is surrounded with fronts formed by wind-induced coastal upwelling in the southeast; tides and topographic upwelling in the northeast; and tidal mixing and upwelling in the west, where fronts are steered by giant sand ridges; in the western Beibu Gulf, the Red River Outflow Front extends southward as the Vietnam Coastal Front, while the northern Beibu Gulf features a tidal mixing front off the Guangxi coast; (4) Off SE Vietnam, the 11°N coastal upwelling gives rise to a summertime front, while the Mekong Outflow and associated front extend seasonally toward Cape Camau, close to the Gulf of Thailand Entrance front; (5) In Luzon Strait, the Kuroshio front manifests as a chain of three submesoscale fronts across the Babuyan Islands, while west of Luzon Island a broad offshore frontal zone persists in winter. The summertime eastward jet (SEJ) off SE Vietnam is documented from five-day mean SST data. The SEJ emerges in June-September off the 11°N coastal upwelling center and extends up to 114°E. The zonally oriented SEJ was observed located between two large gyres, each about 300 km in diameter.
Keywords:
Ocean front
; South China Sea
; SST
; Front Detection
1. Introduction
The South China Sea (SCS) features numerous fronts of different physical nature. These fronts were extensively studied from in-situ data since the 1960s and from remote sensing data since the advent of satellite oceanography in the 1970s. The important role of these fronts in physical, chemical, biological, and geological processes was recognized and investigated, and several quasi-stationary, seasonally persistent fronts were identified, so that the large-scale pattern of fronts was established (Wang DX et al., 2001; Belkin and Cornillon, 2003; Hu JY et al., 2003; Tong JQ et al., 2010; Lee MA et al., 2015; Hu JY and Wang XH, 2016; Hu JY et al., 2018; Yu Y et al., 2019; Wang YT et al., 2020; Wu Q et al., 2020; Zhao LH et al., 2022; Xing QW et al., 2023). Yet despite the tremendous progress in frontal studies of this vast sea, some aspects of its frontal oceanography remain unexplored or understudied. The overwhelming majority of remote sensing studies focused on surface fronts in temperature or chlorophyll, while salinity fronts were not studied until the 2010s. The in-situ data coverage of this sea is extremely uneven, with most data collected in the north. The remote sensing of the SCS is hampered by particular meteorological conditions such as cloudiness, high humidity, and persistent haze, the latter rendering satellite data unusable or unsuitable for research purposes. As a result, our knowledge of local fronts remains patchy and incomplete. While the general frontal pattern appears to be well known, most individual fronts still await in-depth observational studies. In particular, seasonal climatologies of individual fronts are sorely lacking. Meanwhile, such seasonal climatologies are needed in a variety of fundamental studies and maritime applications and activities such as fisheries, aquaculture, transportation, recreation, weather forecasting, climate research, offshore exploration and mining etc. In this study we focused on thermal fronts. Salinity fronts in the South China Sea will be the subject of a follow-up study.
Regionally and thematically, this study extends our study of the China Coastal Front in the East China Sea (Belkin et al., 2023) and South China Sea (Belkin et al., 2024). Therefore, a certain overlap between the previous and present studies is unavoidable. At the same time, we applied a relatively new technique in the present study. Alongside traditional maps of SST and SST gradient magnitude GM, we analyzed maps of log-transformed GM, following Belkin and Shen (2024). The newly analyzed maps of log-transformed GM revealed a sheer number of moderate and weak fronts (especially in the open sea), whose integral ecological impact could be significant.
This paper is structured as follows. The rest of Section 1 is a concise review of remote sensing studies of SST fronts in the South China Sea. Section 2 describes satellite data used in this study, namely SST data provided by the Advanced Himawari Imager (AHI) flown onboard Himawari-8. Section 3 describes our methodology. The results of this study are presented in Section 4, followed by a discussion in Section 5, in which our main results and novel findings are compared with previous studies of SST fronts in the South China Sea. The final Section 6 Conclusions sums up the main aspects of this study.
Remote sensing studies of SST fronts in the South China Sea: Previous satellite studies of SST fronts in the SCS published in English-language journals are reviewed chronologically below and summed up in Table 1, while Chinese-language studies were recently reviewed by Shen and Belkin (2023). Regional aspects are discussed in Section 4 and Section 5.
The first state-of-the-art computer algorithm for front detection in satellite SST imagery was developed by Jean-François Cayula and Peter Cornillon at the University of Rhode Island (Cayula and Cornillon, 1992; Cayula and Cornillon, 1995). The Cayula-Cornillon algorithm (CCA) based on the histogram approach has been used in numerous studies, including a global survey of SST fronts (Belkin, Cornillon, Sherman (2009) and references therein).
Dongxiao Wang and collaborators studied SST fronts in the Northern SCS (NSCS; Wang DX et al., 2001), using the gradient approach. Following Hickox et al. (2000)’s front envelope method, Wang DX et al. (2001) determined frontal envelopes and cross-frontal SST steps for six fronts in the NSCS, including the most prominent Fujian-Guangdong Front, and noted the alongshore continuity of this front in winter up to ~115°E, where this front abuts the Pearl River Estuary front. Farther west, the Hainan Island East Coast front was identified. Thus, according to Wang DX et al. (2001), the Fujian-Guangdong-Hainan Front consists of three disconnected fronts. Later studies affirmed the alongshore continuity of this front during the cold season, especially in winter.
Yi Chang and collaborators mapped SST fronts in the NSCS, including the Taiwan Strait (Chang et al., 2006; Chang et al., 2008; Chang et al., 2010; Lee et al., 2015), with the Shimada algorithm (Shimada et al., 2005). Using high-resolution (0.01°) data, Chang et al. (2006) and Chang et al. (2008) documented the Mainland China Coastal Front (MCCF) and its seasonal variability. The MCCF is a sharp front with GM up to 0.3°C/km in January, when the MCCF’s intensity peaks (Chang et al., 2006; Chang et al., 2008; Chang et al., 2010). Using 1-km SST data, Chang et al. (2010) documented the continuous MCCF in December and January, extending along the Fujian-Guangdong coast up to Hainan Island, with no signs a local break-up off the Pearl River Estuary.
Shi R et al. (2015) mapped monthly mean GM in the NSCS from OSTIA data. The relatively low values of GM in the monthly maps presented by Shi R et al. (2015, Figure 2) are likely the result of the relatively low data resolution. As shown by Belkin et al. (2024), low values of GM obtained in some other studies (Yu et al., 2019; Shi R et al., 2022) underestimate the real intensity of the China Coastal Front and other fronts as reported, e.g., by Dong J and Zhong Y (2020) who observed sharp SST fronts in winter, with GM exceeding 1.3°C/km.
Yu Y et al. (2019) evaluated long-term trends of SST fronts (identified with enhanced SST gradient magnitude GM) in the SCS during 2003-2017. The only significant linear trends of GM (all positive) were found in three interconnected areas: over the Guangdong Shelf, east and south of the Hainan Island, and off eastern Vietnam, with winter trends being larger than summer trends. The connectivity of these areas and winter amplification of positive trends of GM are suggestive of the key role played by advection. Indeed, in winter, the circulation is dominated by the southward current that connects these areas.
Wang YT et al. (2020) mapped gradient magnitude GM from MODIS data using their own algorithm based on the Canny (1986) algorithm modified by Castelao and Wang YT (2014) and Wang YT et al. (2015). Pixels were defined as frontal when GM exceeded 0.014°C/km. This low threshold allowed weak fronts to be mapped and counted.
Zhao et al. (2022) mapped SST fronts in the entire SCS from low-resolution (0.25° x 0.25°) DOISST data processed with the Cayula and Cornillon (1992) single image edge detection algorithm (CCA-SIED). They studied spatial and temporal variability of SST fronts on a variety of scales over a 40-year span (1981-2021).
Chen JY and Hu ZF (2023) mapped SST fronts in the NSCS from high-resolution (1 km) GHRSST data (2002-2021) processed with the Shimada et al. (2005) algorithm. The SST fronts were classified into cold fronts, warm fronts, and cross-isobath fronts based on the fronts’ associations with the underlying bathymetry (Ullman and Cornillon, 1999; Ullman and Cornillon, 2001).
Xing et al. (2023) identified >50 fronts in the SCS and studied their long-term variability in 1982-2021 using a new front detection algorithm based on the modified Cayula and Cornillon (1992) algorithm. Their inventory of persistent SST fronts in the SCS is the most complete one to date. Xing et al. (2024) expanded their SCS study over the global ocean’s Large Marine Ecosystems to document significant long-term trends in fronts’ intensity and occurrence.
The proliferation of remote sensing studies of SST fronts in the SCS greatly improved our knowledge of such fronts, first of all their large-scale spatial distribution and temporal variability on a variety of scales, from seasonal to decadal. Yet, lacking are seasonal climatologies of individual fronts and their spatial patterns down to mesoscale as well as their temporal variations on month-to-month basis. In this study we set out to develop and analyze monthly climatologies of individual SST fronts in the SCS from the most recent satellite data with high spatiotemporal resolution. The emphasis on the most recent data minimizes possible effects of regional climate change, while the high spatiotemporal resolution of satellite data minimizes the detrimental effect of sparse data on gradient estimation. Our main goals were: (1) document and analyze the spatial and temporal patterns of SST fronts in the SCS, and (2) detect and document quasi-stationary fronts that feature prominently in frontal frequency maps.
2. Data
We use the same data as in our previous study of the China Coastal Front (Belkin et al., 2023; Belkin et al., 2024). Nonetheless, to make this paper self-contained, a concise description of this dataset is provided below, with details available in Bessho et al. (2016).
Himawari-8/9 satellites and Advanced Himawari Imager (AHI): The Japanese geostationary meteorological satellites Himawari 8/9 (Bessho et al., 2016) are stationed at 140.7°E. They carry the Advanced Himawari Imager (AHI) that covers the 80°E-160°W, 60°N-60°S area, providing full disk images every 10 minutes. The AHI has 16 spectral bands, with spatial resolution of 500 m to 2 km depending on the spectral band. A novel cloud-masking algorithm uses 500-m resolution visual images that resolve individual cumulus clouds. Combined with a novel cloud-tracking algorithm and high-frequency (every 10 min.) full disk scanning, these advanced algorithms enable the production of cloud-free full disk composite images every four days (Bessho et al., 2016). In this study, we used L3 level SST data with 1-hour temporal resolution and 2-km spatial resolution from July 2015 through December 2022, downloaded from a website operated by the Japan Aerospace Exploration Agency, JAXA (https://www.eorc.jaxa.jp/ptree; accessed 14 January 2025).
3. Methods
In this study, we updated the methodology used by Belkin et al. (2023) and Belkin et al. (2024) to study the China Coastal Front in the East China Sea and South China Sea respectively. Namely, we used logarithmic transformation of SST gradient magnitude GM to bring out moderate and week fronts in the open sea, over the deep-sea basin of the South China Sea, and in coastal waters.
3.1. Front Detection
We used the gradient method which identifies fronts with high-gradient zones in satellite images. Horizontal gradients of SST were computed with the Belkin and O’Reilly (2009) algorithm (BOA). The BOA’s centerpiece is a contextual shape-preserving, scale-sensitive, adaptive median filter that effectively eliminates noise while preserving intact major features such as ramp-like steps (fronts), roof-like ridges, and significant peaks or valley-like minima.
3.2. Front Mapping, Front Intensity, and Front Stability
The BOA generates maps of gradient magnitude (GM) and gradient direction (GD). Maps of GM can be converted to frontal maps by setting a threshold T for GM. Every pixel with GM>T is considered a frontal pixel. Next, maps of frontal frequency FF are generated with pixel-based FF calculated as a ratio of N1 to N2, where N1 is the number of times this pixel was frontal, and N2 is the number of times the pixel contained valid data. Gradient magnitude GM is identified with front intensity (sharpness), while frontal frequency FF is identified with front stability (robustness). In most applications, the choice of threshold T depends on the problem in question or task at hand.
3.3. Front Strength and Cross-Frontal Ranges of Oceanic Variables
Front strength is defined as the total cross-frontal change (also called step, range, or differential) of the oceanic variable in question. Belkin et al. (2023) and Belkin et al. (2024) determined monthly variability of SST steps (dSST) across the China Coastal Front along a series of closely spaced fixed lines (transects). This approach allowed the authors to study and visualize the spatiotemporal variability across and along the front.
3.4. Logarithmic Transformation of SST Gradient
Logarithmic transformation (or log-transform) of data is warranted when data distribution is highly skewed as is the case with SST gradients. Log-transform is an efficient method of contrast enhancement of digital maps. In oceanography, log-transform has been routinely applied to chlorophyll data yet almost never been applied to other remotely sensed observables or derivatives. Recently, Belkin and Shen (2024) used log-transform to study salinity fronts from satellite data. Here we apply the same technique to temperature fronts. After running the BOA algorithm over SST data to obtain SST gradients, we log-transformed SST gradient magnitude GM using natural logarithms (ln). Maps of log-transformed SST gradient magnitude ln(GM) reveal more fronts, particularly moderate and weak fronts in the open sea and in coastal waters.
4. Results
This section consists of three parts. In Part 1 (Section 4.1-4.3) we present monthly maps of SST, SST gradient magnitude GM, and log-transformed gradient LN(GM) for the entire SCS. In Part 2 (Section 4.4-4.8) we present monthly maps of GM in five regions that feature most fronts and warrant detailed investigations: Region 1, Taiwan Strait; Region 2, Guangdong Shelf; Region 3, Hainan Island and Beibu Gulf; Region 4, Mekong River Outflow and Gulf of Thailand entrance; Region 5, Luzon Strait and west of Luzon Island. Part 3 (Section 4.9) is focused on the summertime eastward jet off SE Vietnam. All maps in Section 4.1-4.8 are long-term mean monthly maps from 2015-2022. Section 4.9 is based on five-day mean maps from June-September 2015-2022.
4.1. Sea Surface Temperature and Its Seasonal Variability: Large-Scale Pattern and Meso-Scale Features
Before presenting results on SST fronts, it is instructive to inspect monthly maps of SST (Figure 1). To visually enhance SST gradients and facilitate visual recognition of various features, we adjusted SST color scale for each monthly map. The three peculiar large-scale spatio-temporal patterns of SST variability in the SCS are: (1) cold tongue in winter; (2) rapid warming in spring; (3) rapid cooling in June-July.
4.1.1. Cold Tongue in Winter
The meridional cold tongue is maintained by the southward Vietnam Coastal Current and its extension, the Sunda Slope Current (identified by Liu QY et al., 2004). Driven by the NE monsoon winds, the cold tongue develops by November (Liu QY et al., 2004, Figure 6) and reaches its maximum extent and intensity in January-February (Varikoden et al., 2010, Figure 1). SST fronts are expected along the western and eastern flanks of the cold tongue. According to Varikoden et al. (2010, Figure 2), zonal gradients of SST across the cold tongue’s western (coastal) flank exceed 0.5°C/25 km.
4.1.2. Rapid Warming in Spring
In spring, the seasonal warming of surface water proceeds very fast. For example, in the northern Beibu Gulf, SST peaks at 30-31°C as early as May-June. The rapid warming is explained by the extremely high solar radiation (400-600 W/m2) over most of the SCS (particularly off Vietnam, in the central SCS, and across the entire Gulf of Thailand) combined with very light winds and shallow upper mixed layer, UML (Tan HJ et al., 2022, Figures A2 and A3). The shallow UML is efficiently trapping solar radiation so that the rapid warming of the shallow UML in spring is maintained owing to positive feedback.
4.1.3. Rapid Cooling in June-July
From late spring (May) to mid-summer (July), the seasonal warming trend reverses, and the SST decreases over large parts of the SCS. The cooling in June and July can be noticed in monthly maps of SST (Figure 1) despite the different color scales used in these maps. The custom color scales bring out subtle regional features but hinder month-to-month comparisons. Nonetheless, the contrast between May and June-July is too stark to be missed. To quantify the magnitude of the early summer cooling, we computed area-averaged long-term (2016-2022) mean monthly SST in three areas, where the early summer cooling appears most pronounced: (1) west of Luzon Island (12-15°N, 115-120°E); (2) central SCS (6-12°N, 110-115°E), and (3) Gulf of Thailand (6-14°N, 99-105°E). The results in Table 2 show that in all three regions the cooling occurred in June-July, and the cooling magnitude (difference between SST in May and July) was 0.70, 1.07, and 1.08°C, respectively.
Our results are generally consistent with Qu (2001), who used historical SST data and noted the dramatic warming in April/May, when the SST increase rate exceeded 2.0°C/month. The early summer cooling can be explained by evaporative cooling (Wyrtki, 1961; Qu, 2001) or, alternatively, by coastal upwelling off SE Vietnam driven by the summer southwesterlies (Xie et al., 2003). Our monthly SST maps show that the coastal upwelling off SE Vietnam reaches its maximum intensity in August (see also Xie et al., 2003, Figure 3), which is too late for this upwelling to be the main cause of the rapid cooling observed across the SCS in early summer (Table 2). Therefore, evaporative cooling appears to be the principal driver of the rapid cooling in June-July. Also, the rapid decrease of SST in the Gulf of Thailand cannot be explained by neither the remote upwelling off SE Vietnam, nor by the much smaller and weaker upwelling along the east coast of Peninsular Malaysia (ECPM), even when the upwelling is augmented by advection of colder water from the Java Sea, because the local cooling is confined to a limited area off the ECPM (Kok et al., 2022).
4.2. SST Gradients
We processed monthly maps of SST with the BOA algorithm (Belkin and O’Reilly, 2009), which generates two scalar components of vector gradients of SST, namely gradient magnitude GM and gradient direction GD. Maps of GD can be quite useful for detection of fronts with seasonally reversing cross-frontal SST gradients (Belkin, Cornillon, Sherman, 2009) as, e.g., the Jiangsu Front (Subei Shoal Front) in the Yellow Sea (Hickox et al., 2000). In this paper we presented and analyzed monthly maps of GM only (Figure 2).
Figure 2.
Long-term (2015-2022) mean monthly maps of SST gradient magnitude GM (°C/km) (with custom color scales).
Figure 2.
Long-term (2015-2022) mean monthly maps of SST gradient magnitude GM (°C/km) (with custom color scales).
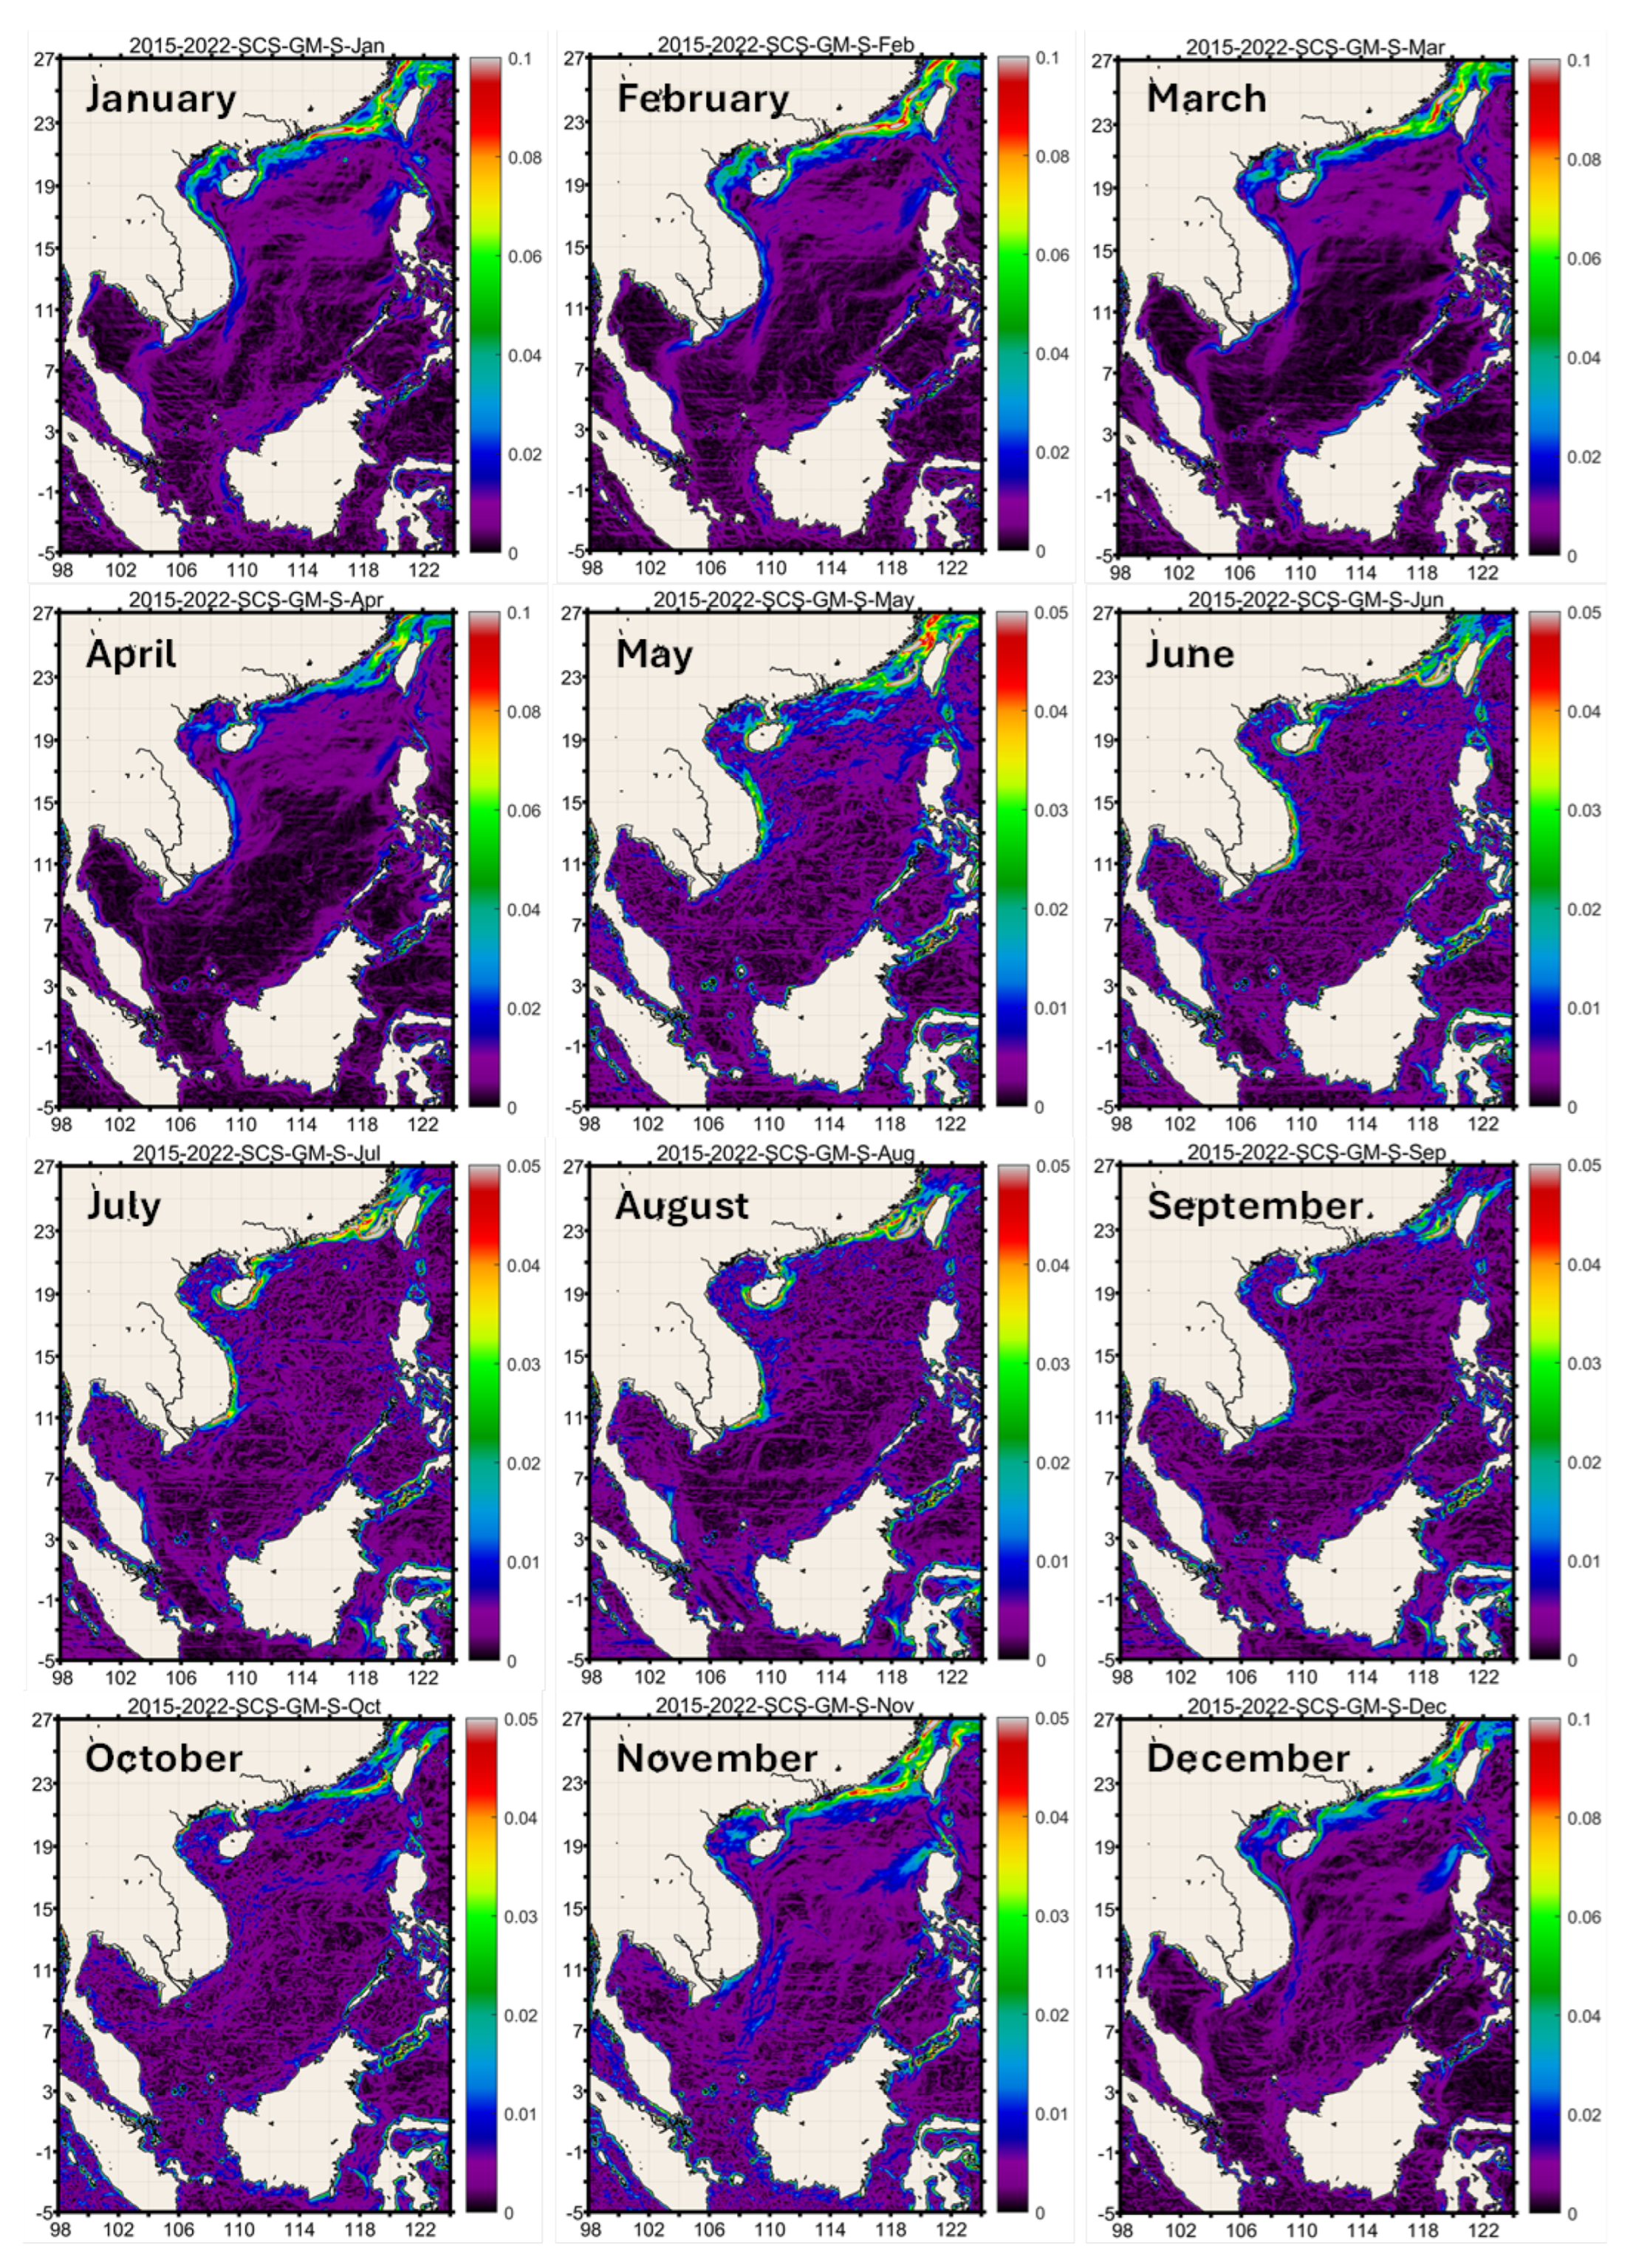
January: In winter, the NE monsoon winds force the advection of cold water by the CCF from the ECS to the northern SCS, then westward along the Guangdong Shelf toward the Leizhou Peninsula, into the Qiongzhou Strait (and eventually into the Beibu Gulf), and toward eastern Hainan. The Western Beibu Gulf Front extends southward and continues as the Vietnam Coastal Current Front. The Mekong Outflow Front extends WSW alongshore past Mekong’s delta. The Gulf of Thailand Entrance Front (GOTF) is developed off Cape Camau. The Kuroshio Front in Luzon Strait trends SE-NW across the Babuyan Islands. The West Luzon Front persists as a broad NE-SW high-gradient zone west and northwest of Luzon Island. Submesoscale fronts are developed west and northwest of Borneo Island. High-gradient inshore fronts are observed along the entire east coast of the GOT from Cape Camau (9°N) in the south to the Upper GOT’s apex (13.5°N) in the north. The southward Vietnam Coastal Current/Front separates from the Vietnam coast at 11°N and continues SSW along a steep slope of the Sunda Shelf. This southward extension is integrated into a broader Cold Tongue driven southward by the NE monsoon winds.
February: The CCF is at the peak of its strength and intensity, extending all the way to the eastern Hainan Island and along Hainan’s SE coast. The Western Beibu Gulf Front, albeit weakened, still dominates the Gulf. The Mekong Outflow Front propagated WSW along the Camau Peninsula. Submesoscale fronts are developed NW of Borneo Island. The GOTF reaches its peak of strength and intensity.
March: The submesoscale East Leizhou Peninsula Front emerges east of the Peninsula. This front persists though September. The Western Beibu Gulf Front is weakened but largely intact and connected to the Vietnam Coastal Front. The NW Borneo fronts now extend along the entire length of the NW coast of Borneo except for the Kuching Bay (Sarawak, East Malaysia) south of 3°N.
April: The GOTF disappeared. The Mekong Outflow Front disappeared. The submesoscale fronts off the NW coast of Borneo disappeared except for a small area in the extreme north (5°N-7°N, north of Brunei and west of Sabah).
May: The West Palawan Coastal Front emerges to persist through November, extending from the Balabac Strait (~8°N) south of Palawan up to the Mindoro Strait (12.5°N) north of Palawan. Submesoscale fronts emerge around islands of the Sunda Shelf, particularly the Natuna Islands and smaller islands located SSE and WSW of the Natuna Islands. Submesoscale fronts are well developed around all islands in Luzon Strait, particularly around the Babuyan and Batanes Islands. The Batanes Islands Front persists year-round, while the Babuyan Islands Front gradually weakens over summer and fall. The shelf break front in the northern SCS emerges in May along ~20°N yet disappears in June. A submesoscale front develops along the eastern shore of the Kuching Bay (Sarawak, Malaysia).
June: Nearshore fronts around the GOT are strong along the East Coast and weak along the West Coast. There is no trace of the Mekong Outflow Front. The Kuching Front (Sarawak) weakens. The Palawan Front weakens slightly. Coastal fronts spread around the Beibu Gulf. Fronts around the Babuyan and Batanes Islands persist. Well-developed fronts are observed off the west, south, and east coasts of Hainan Island.
July: Submesoscale coastal fronts emerge east of Peninsular Malaysia between 3°N and 6°N. The summertime eastward jet (SEJ) develops east of the 11°N upwelling center off SE Vietnam. The Palawan Front weakens. The Kuching Front weakens. Fronts around the islands of the Natuna Sea (Sunda Shelf) are no longer detectable.
August: The Babuyan Islands Front is weakened but still detectable. A strong upwelling front exists off SE Vietnam, near ~11°N. Fronts off Borneo and Palawan almost disappeared. Coastal fronts around the Beibu Gulf are weak but detectable.
September: The Babuyan Islands Front disappeared. The East Leizhou Peninsula Front still persists.
October: The Babuyan Islands Front is still detectable (the last month). The East Leizhou Peninsula Front disappeared.
November: The Batanes Islands Front is still detectable (the last month).
December: In the southern SCS, most fronts disappeared except for near-shore fronts in the Northwestern GOT (weak fronts) and Northeastern GOT (strong fronts). The Western Beibu Gulf Front strengthens. The Vietnam Coastal Front strengthens.
4.3. Log-Transformed Gradient of SST
As pointed out in the Methods section, log-transformation of SST gradient magnitude GM enhances contrasts in digital maps of GM. The monthly maps of log-transformed GM (Figure 3) reveal numerous moderate and weak fronts that do not manifest in the respective monthly maps of GM. The description below is focused on a few features or aspects of fronts that are revealed by the maps of log-transformed gradient magnitude LN(GM). This approach allowed a multitude of moderate and moderate-to-weak fronts to be visualized and their spatio-temporal variability to be quantified and studied. Since all types of fronts are known to play important roles in marine ecosystems, an integral impact of numerous moderate and weak fronts might be significant. In the absence of quantitative estimates of such an impact, we can only hypothesize that the magnitude of the integral ecological impact of moderate and weak fronts can be comparable to the magnitude of the ecological impact of major large-scale fronts.
January: The extremely wide frontal field (zone) occupies the entire northern SCS north of ~15°N. The Vietnam Coastal Front separates from the Vietnam coast at ~11°N and extends SSW along the steep slope of the Sunda Shelf down to 7°N. This front is the western edge of the Cold Tongue. The Kuroshio Current can be distinguished east and northeast of Luzon Island as a narrow band of low LN(GM) between two high-gradient bands (fronts). Two submesoscale fronts are observed west of Borneo Island, south of the Equator.
February: The Vietnam Coastal Front and its extension as the Sunda Slope Front are strong. The Kuroshio Current and two fronts that border the current are clearly distinguishable. The dual submesoscale fronts west of Borneo Island persist.
March: The Vietnam Coastal Front and Sunda Slope Front are strong. The dual submesoscale West Borneo fronts persist.
April: The Sunda Slope Front disappeared completely. The West Borneo fronts almost disappeared. The broad frontal field (zone) in the northern SCS persists north of 16°N.
May: The only strong fronts left in the SCS are the Taiwan Bank Front and Vietnam Coastal Front. All other fronts disappeared.
June: The CCF reappears as an upwelling front, with the costal upwelling off the eastern Guangdong driven by the SW monsoon winds. The Taiwan Bank Front is strong, maintained by the wind-induced upwelling. The 11°N upwelling center off SE Vietnam is well developed. The broad frontal zone north of 16°N is gone.
July: The coastal front off the NW Borneo Island extends along the entire NW coast of Borneo.
August: The Beibu Gulf is devoid of fronts. Strong fronts are observed around the Taiwan Bank, off the Fujian Coast, around Hainan Island, and off the 11°N upwelling center.
September: The Taiwan Bank front remains strong.
October: The only strong fronts are the 20°N shelf-break front and the 16°N front in the central SCS.
November: The Cold Tongue bordered by two fronts is strong as it extends southward down to 7°N.
December: Two disjoint fronts in the Western Beibu Gulf are observed.
4.4. Region 1: Taiwan Strait
Figure 4 shows monthly maps of SST over bathymetry, which plays a major role in this region by steering currents and fronts. The Taiwan Strait features strong and diverse fronts owing to the advection and confluence of contrasting water masses from the north and south and also owing to the monsoon winds-driven coastal upwelling. The frontal pattern here changes dramatically on the seasonal and monthly scales. During winter, the China Coastal Front (CCF) is at its maximum strength off the coast of Fujian, centered slightly south of 25°N, reaching its maximum extent and intensity (up to 0.14°C/km) in late winter/early spring (March-April). The CCF intensity is sharply reduced in May. The Taiwan Bank Front (TBF) located along the southern flank of the bank is present almost year-round except in March. The TBF is best developed in summer (June-September), reaching its maximum strength, intensity and spatial extent in July. Other fronts in the Taiwan Strait are smaller than the CCF and TBF. Nonetheless, these fronts are ecologically important as they define habitats of fish, squid etc. These mesoscale-to-submesoscale fronts are relatively stable as they are steered by the rugged bathymetry of the Taiwan Strait. The quai-zonal front along the northern part of the Changyun Ridge is distinct in December-February, best developed in January, centered at 119.7°E, slightly north of 24°N, across the Penghu Channel from the Penghu Islands. We predict this front’s intensity to peak along the SW flank of the Changyun Ridge, where the ridge’s slope is the steepest and the bathymetric cross-slope gradient is at maximum. We called this feature the Northern Changyun Ridge Front (NCYRF). The local topography of the eastern Taiwan Strait steers another front along the Eastern Changyun Ridge at 120°E and its steep western slope, nearly parallel to Taiwan’s west coast. This feature (we called it the Eastern Changyun Ridge Front, ECYRF) is distinct in December-February, being best developed in January-February. The smallest front that we distinguished in this area is located immediately east and NE of the Penghu Islands, over the steep submarine slope facing the Penghu Channel. This front is quite robust as it is present year-round at the same location. It is best developed in May-September. We called it the Eastern Penghu Islands Front (EPIF). Another front is located west of the Penghu Islands, distinct in June-September and best developed in July-August. We called it the Western Penghu Islands Front (WPIF). Thus, within a relatively small Region 1, we identified six seasonally persistent, quasi-stationary mesoscale/submesoscale fronts, namely CCF, TBF, NCYRF, ECYRF, EPIF, and WPIF. Transient fronts created by the Kuroshio intrusions into the SCS via the Luzon Strait are left outside the scope of this study.
4.5. Region 2: Guangdong Shelf
Figure 5 shows monthly maps of SST in Region 2 Guangdong Shelf (GDS). The frontal pattern of GDS is dominated by the China Coastal Front (CCF). The spatial and seasonal variability of CCF in the Northern SCS was recently documented by Belkin et al. (2024). Here, we elaborate on the frontal pattern and its spatio-temporal variability. In winter, when the CCF dominates EGDS from October through April, the CCF is a water mass convergence front created by the advection of cold waters from the East China Sea with the China Costal Current. The CCF is traced down to Hainan Island, with the CCF strength and intensity decreasing westward (Belkin et al., 2024). In summer, from May through September, the SW monsoon winds drive coastal upwelling off the Guangdong Coast, so the CCF becomes an upwelling front. In winter, the CCF is traced reliably across EGDS and WGDS, whereas in summer the CCF is barely detectable in the west.
4.6. Region 3: Hainan Island and Beibu Gulf
Figure 6 shows monthly maps of GM that feature a variety of fronts around Hainan Island and Beibu Gulf (Gulf of Tonkin). The diverse population of fronts in this region is created by various processes such as the advection of water masses from the Northern SCS via the Qiongzhou Strait, riverine water outflow (mostly by the Red River), monsoon winds-driven coastal upwelling, topographic upwelling, and tidal mixing. The diversity of physical mechanisms in this region explains why adjacent fronts are sometimes created by different mechanisms, e.g., fronts off NE and SE Hainan (see Section 5 Discussion and Belkin et al., 2024).
Fronts off NE and SE Hainan have different origin and different seasonality. The NE Hainan Front emerges in winter, being best developed in February. The SE Hainan Front emerges in summer, being best developed in June-July. The tiny submesoscale front off the East Cape (the easternmost point of Hainan) persists year-round except October. Fronts of the East Coast of Hainan have been known and studied intensely. The West Coast fronts were not studied in detail. Therefore, the summertime arc-shaped front that skirts the entire West and SW Coast of Hainan seems to be a novel feature that has never been reported before. In June-September this front’s shape morphs into an asymmetrical horseshoe consisting of two fronts, a short coastal (near-shore) front and a much longer offshore front extending along a quarter of Hainan’s circumference, from Hainan’s westernmost point to its southernmost point. The dual-front pattern is best developed in July and especially in August, when two front centers (“cores”) with local maxima of GM are most apparent. The two cores are stacked up off the West Coast at ~18.5-19°N, where these cores are collocated with giant submarine sand ridges (sand dunes; see Ma XC et al. (2024) and references therein) that likely steer the fronts.
The Beibu Gulf features strong fronts in winter, while being devoid of fronts in summer. In winter, there are three fronts (in the north, west and south) that are tenuously connected. The western front’s origin is likely related to the Red River outflow. The origin of the northern front (off the Guangxi Coast) is likely related to the winter cooling of the coastal water mass and formation of a tidal mixing front. The westward flow of colder waters from the Western Guangdong Shelf via the Qiongzhou Strait into the Beibu Gulf contributes to the formation of the northern front off the Guangxi Coast. The Red River outflow extends southward along the Vietnam Coast, where the western front connects to the southern front, which continues farther south as the Vietnam Coastal Front. The southern front features a well-defined core of local maximum of GM off the 18°N promontory (cape). This submesoscale front (embedded in the large-scale Vietnam Coastal Front) is anchored by the local coastal and submarine topography. The 18°N front is best developed in winter, especially in January-February. In the middle of Beibu Gulf, an isolated local maximum of GM near 20°N, 108°E marks a submesoscale winter front, whose origin is unclear. The front has a short sub-seasonal life span as it peaks in March and quickly fades in April.
4.7. Region 4: Mekong River Outflow and Gulf of Thailand Entrance
Figure 7 shows monthly maps of GM. Region 4 includes the area off SE Vietnam centered on the Mekong River outflow and a major upwelling center at 11°N as well as the entrance to the Gulf of Thailand, where a major front is located. In winter, the frontal pattern of this region includes the Vietnam Costal Front, the broad quasi-meridional high-gradient frontal zone associated with the Cold Tongue, a few submesoscale coastal/nearshore fronts associated with the Mekong River Outflow, the Gulf of Thailand entrance front (GOTF), and a high-gradient nearshore zone in the SE Gulf of Thailand. The GOTF persists in December-March, disappears in April and is completely absent in May-November. The Vietnam Coastal Front appears as a continuous feature during December-January. During the rest of the year, the Vietnam Coastal Front appears as a few disconnected (or tenuously connected) frontal segments. The local maximum of GM off the 13°N cape persists in January-September and disappears in October-December. This submesoscale front at times is embedded into the Vietnam Coastal Front. The location of this front is very close to the location of an upwelling center in the vicinity of the 13°N cape. Apparently, the local coastline and submarine bathymetry steer and anchor the front. Another major upwelling front is well developed in June-September near 11°N. This upwelling is the source of the summertime eastward jet (SEJ) (see a section on SEJ below). The Mekong River Outflow fronts are completely absent from June-October. These fronts emerge in November east of 107°E, then spread westward alongshore during winter and fade in May.
The Gulf of Thailand Entrance Front (GOTF) is extremely peculiar in that its strength and intensity peak right off Cape Camau and then sharply decrease alongfront over a short distance, then continue decreasing alongfront (first westward, then southward) as the front curves across the Gulf toward the Peninsular Malaysia. The unique peculiarity of the front is caused by the physiography of the area around Cape Camau. The rugged coastline and submarine topography of this area create conditions for the collision of two tidal systems coming from the Gulf and SCS (details are in Section 5 Discussion).
4.8. Region 5: Luzon Strait and West of Luzon
Figure 8 shows monthly maps of GM. Region 5 covers the northeastern SCS, including Luzon Strait. In winter, a train of fronts in the Luzon Strait is observed from October through June, while being undetectable in July-September owing to the seasonally decreasing temperature contrast between the Philippine Sea and South China Sea in summer. This chain of fronts runs NNW from Cape Engaño (18°34′42″N, 122°08′28″E; the northern point of Palaui Island off the northeastern point of Luzon Island), extending between the Babuyan Islands, passing next to the islands of Camiguin (18°50′00″N, 121°51′36″E) and Calayan (19°19′37″N, 121°27′57″E). These fronts are segments of the Kuroshio Front. The Kuroshio skirts the islands very closely, creating an appearance of the Kuroshio Front being broken by the islands, which is probably not the case. High-resolution in situ oceanographic data are needed to confirm the chain pattern of the Kuroshio fronts in the Luzon Strait.
The broad high-gradient frontal zone west of Luzon Island was identified by Belkin and Cornillon (2003) and called the West Luzon Front (WLF). The WLF emerges fully developed in October, persists through winter, peaks in January-February, and disappears in May. Various physical mechanisms were proposed for the WLF generation and frontolysis (discussed in Section 5) such as the NE monsoon wind stress curl, topographically enhanced gap winds, intensified wind jet in the lee of Luzon Island’s mountains, water mass exchange with the Sulu Sea etc.
4.9. Summertime Eastward Jet Off SE Vietnam
Monthly maps of SST and GM presented in Section 4.1-4.8 reveal quasi-stationary fronts and document their seasonal variability. Such quasi-stationary fronts are steered by local bathymetry of the shelf and shelf break/upper slope. Fronts of the open deep SCS are not steered by deep-sea bathymetry and therefore are less stable. One of the most peculiar frontal features of the open deep SCS is an eastward jet that develops during summer off the southeastern Vietnam, hence termed the summertime eastward jet (SEJ; Shaw and Chao, 1994; Hu JY et al., 2000; Xie SP et al., 2003; Wang GH et al., 2006; Gan and Qu, 2008; Chen CS et al., 2012). Typically, the SEJ emerges off the main upwelling center at 11°N. Occasionally, the SEJ originates off another upwelling center, north of 13°N. The SEJ path is quite variable while the time scale of the SEJ formation and disintegration is measured in weeks. The short time scale of the SEJ life cycle and high degree of spatial variability explain why the SEJ is not present in long-term mean monthly maps of SST (Figure 1) and GM (Figure 2 and Figure 3). Moreover, the SEJ is elusive even in individual monthly maps of SST and GM. In eight years (2015-2022), we found only five instances when monthly maps of SST and GM revealed the SEJ. Clearly, a fast-varying feature can only be studied with high-frequency data, whose frequency is commensurate with the feature’s duration. Therefore, we chose to analyze five-day maps of SST and GM. Such maps were made for each summer (June-September), 2015-2022. Visual analysis of these maps allowed us to detect the SEJ during each month. During July, August, and September, the SEJ originates off the main (southern) upwelling center near 11°N, while in June the SEJ originates off the secondary (northern) upwelling center located north of the 13°N cape. The 3D structure of these upwellings was recently reviewed and studied by Ngo and Hsin (2024).
Figure 9 shows the most pronounced SEJs and illustrates different morphological types of SEJ. Three major morphological types are (1) straight SEJ, (2) anticyclonic arc, (3) cyclonic arc. The curved paths of SEJ (cyclonic and anticyclonic arcs) are caused by gyres that pull and entrain the SEJ. The most striking example of the SEJ interaction with two gyres of opposite sign occurred in July 2016, when the SEJ was sandwiched between two large (300 km in diameter) round-shaped gyres located symmetrically to the north and south of the SEJ (Figure 10). A detailed analysis of all SEJs observed during this study will be published shortly (Belkin IM, Zang YT, 2025, Summertime eastward jet in the South China Sea, 2015-2022, in preparation).
5. Discussion
5.1. China Coastal Front
This study extends the two-part study of the CCF by Belkin et al. (2023) and Belkin et al. (2024) that confirmed the wintertime continuity of the CCF along the Mainland China coast from the Yangtze Bank to Hainan Island (Wang DX et al., 2001; Chang Y et al., 2010; Wang YT et al., 2020; Tan KY et al., 2023), documented the spatiotemporal variability of the CCF strength and intensity, and emphasized the fundamental difference between the CCF formation mechanisms in winter (water mass convergence by advection due to the southward China Coastal Current) and summer (wind-driven coastal upwelling).
5.2. Taiwan Strait and Taiwan Bank
The frontal pattern in the Taiwan Strait is very dynamic and changes month-to-month even within the same monsoon season (Figure 4). Principal frontal features were identified by Chang Y et al. (2006), Chang Y et al. (2008), Lan KW et al. (2009), Chang Y et al. (2010), and Lee MA et al. (2015). Thermohaline structure of Taiwan Bank fronts was investigated by Zhang F et al. (2014). Summer monsoon southwesterlies drive coastal upwelling off Fujian (Hu JY and Wang XH, 2016; Hu JY et al., 2018; Shi WA et al., 2021). The Fujian upwelling stands out in our monthly maps of GM in June-September (Figure 4). As shown by Belkin et al. (2023), the CCF dynamics changes in winter, when the CCF becomes a water mass convergence front between cold water advected by the southward China Coastal Current offshore and warm resident water inshore.
5.3. Eastern Guangdong Shelf
The summer upwelling front off Eastern Guangdong was intensely studied by numerous researchers (e.g., Hu JY and Wang XH, 2016; Hu JY et al., 2018; Shi WA et al., 2021). In winter, the southward China Coastal Current brings cold water, so this front becomes a water mass front, similar to the CCF off Fujian but weaker.
5.4. Pearl River Plume Front
In summer, the Pearl River discharge increases eight-fold relative to the winter minimum. Accordingly, the Pearl River plume swells and extends across the Guangdong Shelf beyond the 50-m isobath (Zhi HH et al., 2022, Figure 14), thereby breaking the CCF into two disconnecting fronts, the Eastern Guangdong Front and Western Guangdong Front (Belkin et al., 2024). The EGF is much stronger than the WGF year-round. In summer, both fronts are weakened, with the EGF fragmented but clearly present, while the WGF is all but disappeared (Qiu CH et al., 2017; Belkin et al., 2024).
5.5. Western Guangdong Shelf
In winter, the China Coastal Current (CCC) and associated China Coastal Front (CCF) extend along the entire Guangdong Coast up to the Leizhou Peninsula, eastern entrance to the Qiongzhou Strait and eventually to the east coast of Hainan Island. The CCC branches off into the Qiongzhou Strait to flow to the Beibu Gulf (Gulf of Tonkin); this westward flow is the strongest in winter (Piton et al., 2021). On the largest (basin-wide) spatial scale, the intensity and strength of the CCF decrease westward (downstream) as reported by Belkin et al. (2024). This trend is not monotonous: The CCF intensity and strength peak off the eastern Guangdong at 116°E, then decrease off the Pearl River Estuary, then increase again to peak off the western Guangdong at 113°E. The wintertime local maximum GM at 113°E (where GM exceeds 0.1°C/km) is also apparent in long-term (1982-2022) mean monthly maps of GM in Zhou X et al. (2024, Figure 1).
5.6. Hainan Island
Oceanic fronts around Hainan Island are diverse and dynamically different from one another. Moreover, different physical mechanisms were proposed for the same fronts, thereby creating a controversy with regard to the origin of some fronts, particularly the fronts west of Hainan discussed in the next section. Wang DX et al. (2001) studied SST fronts in the northern SCS, including SST fronts around Hainan, from satellite data. Wang DX et al. (2003) studied SST fronts west of Hainan, in the Gulf of Tonkin (Beibu Gulf). Hu JY et al. (2003) used satellite data and numerical model to study fronts around Hainan and predict locations of tidal mixing fronts west of Hainan and in the Qiongzhou Strait. Tong JQ et al. (2010) calculated predicted locations of tidal mixing fronts around Hainan (using the Simpson-Hunter criterion) and compared these locations with satellite observations of CHL fronts. Zeng XZ et al. (2014), Jing ZY et al. (2015), and Jing ZY et al. (2016) studied the upwelling front SE of Hainan. Lin PG et al. (2016) and Li YN et al. (2020) studied the dynamics of the northeastern front, while Bai P et al. (2020) studied the impact of topography on the cold pool off the eastern entrance to the Qiongzhou Strait. Belkin et al. (2024) have shown that the East Hainan front’s strength dSST along 20°N peaks at 2.5°C in winter and summer, even though the front’s dynamics is fundamentally different during these opposite seasons (Jing ZY et al., 2015; Jing ZY et al., 2016; Lin PG et al., 2016; Li YN et al., 2020; Li JY et al., 2023). Using high-resolution (5-km station spacing) CTD data SE of Hainan, Xie LL et al. (2017) diagnosed the banded structure of the front, with alternating bands of upwelling and downwelling in and around the frontal zone.
5.7. Beibu Gulf (Gulf of Tonkin)
While fronts off the East Coast of Hainan received much attention, fronts off the West Coast (in the Gulf of Tonkin/Beibu Gulf) have not been studied in detail, except for a few studies (e.g., Wang DX et al., 2003). Therefore, our results that document a front west of Hainan appear to be novel. Thanks to the availability of detailed geomorphological studies of this area (Ma XC et al., 2024 and references therein), we were able to link this front to the local sea bed’s morphological features (giant sand ridges) that control the front’s location. Various physical mechanisms were proposed for the fronts off the West Coast of Hainan. Hu JY et al. (2003) and Tong JQ et al. (2010) focused on tidal mixing and tidal mixing fronts, while Lü XG et al. (2008) have shown that the upwelling west of Hainan was induced by a tidal mixing front. Zhu JY et al. (2023) emphasized the importance of wind-induced coastal upwelling west of Hainan, which is suggestive of upwelling fronts. Conceivably, some mutually exclusive concepts can be reconciled if these fronts change their physical nature seasonally; for example, a tidal mixing front in summer can become an upwelling front in winter. The China Coastal Front (CCF) is an example of such seasonal transformation: The CCF is a water mass convergence front in winter and an upwelling front in summer (Belkin et al., 2023; Belkin et al., 2024).
The western Beibu Gulf receives copious amount of freshwater brought to the sea by the Red River and other, smaller rivers down the coast of Vietnam (Nguyen-Duy et al., 2021). The stream temperature of the Red River water varies widely from 15°C in winter to >30°C in summer (Nguyen-Duy et al., 2021, Figure 11), while the offshore SST varies from 10°C to >30°C respectively. During the wet season of 2000, the plume was 1–3°C colder than ambient seawater (van Maren, 2007), which is a typical summer condition, whereas the temperature contrast in winter is much larger than in summer. Therefore, a thermal front can be expected between the Red River plume and offshore waters for most of the year, with the plume SST front being the strongest during the cold season. The seasonal variability of the Red River plume was studied by Nguyen-Duy et al. (2021) who found that the plume extends almost exclusively southward along the Vietnam coast for most of the year; the plume reaches its maximum width and cross-shelf extent (up to 100 km offshore) in April-September after the peak discharge. Our results corroborate the main findings by Nguyen-Duy et al. (2021) and the earliest results by Belkin and Cornillon (2003). The western SST front in the Beibu Gulf documented in our study is apparently the Red River plume front. The northern SST front in our results is tenuously connected to the western SST front (Red River plume front). This pattern is consistent with the modeling results by Nguyen-Duy et al. (2021) who showed that the plume’s northward extent is limited by Ha Long Bay (21°N). The two-front pattern in the western Beibu Gulf is a novel result. Previous studies identified a single continuous coastal front in the western Beibu Gulf, extending northward up to the Guangxi coast at ~21.7°N (Wang DX et al., 2001; Wang DX et al., 2003; Wang YT et al., 2020; Zhao LH et al., 2022; Xing QW et al., 2023). The two-front pattern that emerged in this study is particularly important because the western and northern fronts are formed by different mechanisms. While the western front is a boundary of the Red River outflow, the northern front is a boundary of a cold-water mass, which forms in the northern Beibu Gulf off the Guangxi coast due to a massive heat loss in winter, when the sea water temperature drops down to 10-12°C (Gao JS et al., 2024).
The Red River plume area varies greatly, following the Red River discharge variations, with a maximum area of >40,000 km2 (or 27% of the total area of Beibu Gulf) and a minimum area of <2,000 km2 (Nguyen-Duy et al., 2021). Accordingly, the location, strength, and intensity of the western Beibu Gulf front (Red River plume front) are expected to vary in sync with the plume area and discharge variations. Therefore, the profound changes of the Red River hydrological regime caused by climate change and human activities are bound to affect the Beibu Gulf oceanography. Following the construction of numerous dams and impoundment of reservoirs, the Red River sediment discharge plunged by 90% between 1958 and 2021, while water discharge decreased by 13% (Nguyen QH and Tran VN, 2024). The order of magnitude reduction of suspended sediment concentration SSC drastically affected the detectability of the Red River plume and attendant plume front in satellite ocean color imagery. Also, the sharply reduced SSC and turbidity of the river plume affected the plume dynamics and its mixing with ambient waters and spreading offshore and alongshore.
5.8. Central and SE Vietnam Shelf
The Vietnam Coastal Current (VCC) is a western boundary current that flows southward along the Vietnam Shelf (Wang DX et al., 2013). The VCC is fed by low-salinity waters of Red River from the Beibu Gulf and high-salinity waters from the northeastern SCS, the latter joining the VCC southwest of Hainan. The VCC is associated with an SST front (termed here the Vietnam Coastal Current Front or VCCF) that has been identified in several remote sensing studies (Belkin and Cornillon, 2003; Belkin et al., 2009; Wang YT et al., 2020; Zhao LH et al., 2022; Xing QW et al., 2023). Despite being associated with a major current (VCC), the VCCF off central Vietnam has not been studied in detail since most studies focused on fronts off SE Vietnam. The SW monsoon winds blowing along the Vietnam coast cause upwelling, which is especially pronounced off SE Vietnam (Xie SP et al., 2003; Yu Y et al., 2019), where the upwelling generates fronts studied by Yu Y et al. (2020), Le and Fisher (2021), and Ngo and Hsin (2024). Using MODIS SST data processed with the Cayula and Cornillon single image edge detection (SIED) algorithm, Le and Fisher (2021) generated long-term (2003-2018) frontal frequency maps during the NE and SW monsoons and distinguished two types of fronts in the 10-13°N, 107-111°E area. Shelf fronts run over the 0-200 m depth range during the winter NE monsoon. Upwelling fronts form during the summer SW monsoon and often extend far offshore in a general eastward direction, hence called “summertime eastward jets” or SEJ discussed in the next section. Yu Y et al. (2020) used summertime (June-August) MODIS SST data (2002-2017) to map a coastal upwelling front (identified with enhanced SST gradients) off SE Vietnam. The front consist of two segments (ibid., Figure 1), the southern one (10.5-12°N) with SST gradients up to 5°C/100 km and the northern one (13-14°N) with much weaker SST gradients (<3°C/100 km). This high-resolution local mapping result confirms the pattern obtained by Yu Y et al. (2019), who mapped a nearly continuous front along the Vietnam coast (10.5-18.5°N) with a gap between 12-13°N. Zhao LH et al. (2022) identified a coastal front off Vietnam but only up to 16°N, where this front (termed Vietnam Front) is clearly separated from the Bakbo Bay Front in the Beibu Gulf (Gulf of Tonkin). Conversely, Xing QW et al. (2023) distinguished the East Vietnam Coastal Front as a continuous feature between 11-19°N, connected to the Beibu Gulf fronts (ibid., Figure 9).
5.9. Summertime Eastward Jet Off SE Vietnam
In summer, the southwesterly monsoon winds drive the upper-layer circulation in the central SCS that features two gyres – an anticyclone in the south and a cyclone in the north – and an eastward jet in between (Shaw and Chao, 1994; Hu JY et al., 2000; Wang GH et al., 2006). Earlier studies of this jet were reviewed by Fang GH et al. (1998), who called this jet the Southeast Vietnam Off-Shore Current (SEVOC). Different generation mechanisms of the summer eastward jet (SEJ) have been proposed such as wind stress curl (Shaw and Chao, 1994; Xie SP et al., 2003), coastal current interaction with the SE Vietnam shelf topography (Gan and Qu, 2008), and the convergence of two opposing along-shelf flows near 11-12°N (Chen CS et al., 2012). The advection by SEJ was invoked by Lin HY et al. (2017) to explain the origin of a peculiar subsurface lens-shaped structure observed off SE Vietnam. Fang WD et al. (1998) and Fang WD et al. (2002) reported a subsurface zonal front between 11-12°N during the SW monsoon in September 1994. The front was aligned with a strong eastward jet (North Nansha Current) sandwiched between two gyres (cyclone in the north and anticyclone in the south). The front extended to 300-400 m (best developed at 200 m), with cross-frontal steps of temperature and salinity of 7-8°C (Fang WD et al. (1998); up to 10°C, according to Fang WD et al. (2002)) and 1 psu, respectively. Figure 12 in Fang WD et al. (2002) shows a strong zonal front between SE Vietnam and 114°E with temperature at 50 m ranging from <20°C to 28°C across the front. Figure 14 in Fang WD et al. (2002) shows that this subsurface front does not manifest above 40 m. The subsurface R-type (“ramp”) ocean front is thus collocated with the surface-intensified SEJ featuring V-type (“valley”) transversal distribution of SST (Figure 10).
Li YL et al. (2014) studied interannual variability of the SEJ using data from July-September 1992-2012 between 110°E and 113°E. The SEJ latitude varied between 10.7°N and 14.3°N (12°N on average). We showed that the SEJ often emerges in June following the commencement of summer upwelling off SE Vietnam. We also showed that the SEJ often extends up to 114°E and is occasionally traceable up to 116°E. Along the offshore extent of the SEJ, its lateral scale remains nearly constant at O(~50) km, which is significantly larger than the SEJ lateral scale of O(~10) km in the modeling study by Huang XL et al. (2020). We did not observe any widening of SEJ from west to east contrary to the findings by Sun Y and Lan JA (2021) who used the SODA data along four meridians between 110E-113E and reported SEJ as having a wide north-south span of 330-407 km, with the current axis of SEJ varying between 10.7°E and 11.7°N. The typical meridional dipole structure that drives the SEJ (cyclone in the north, anticyclone in the south) is occasionally flipped as shown by Yu ZT et al. (2023) who found the Southeast Vietnam Offshore Current (SVOC) to be anomalous in 1995, 1998, 2007, 2010, and 2015 while extreme positive anomalies of SST off SE Vietnam were observed in 1995, 1998, 2010, an 2015 (ibid., Figure 16).
5.10. Mekong Estuary and Shelf
The Mekong River outflow does not form a large, wide plume extending offshore across the shelf like many other great rivers, e.g., Yangtze (Changjiang). Nonetheless, the term “plume” is routinely applied to the Mekong River outflow (Feng YK et al., 2024). While the Mekong River plume was the subject of numerous observational and modeling studies, the spatial and temporal variability of the plume front has not been investigated. We documented the seasonal variability of the plume front (Figure 7). The location of the plume front is fairly stable year-round as the front is aligned with the local bathymetry, extending alongshore over a narrow depth range. The plume front’s locational stability (bathymetric fidelity) is consistent with the bimodal monsoon-driven spatio-temporal pattern of the Mekong River outflow, which is directed SW in winter and NE in summer, according to the dominant wind direction during the respective seasons.
The Mekong River discharge has been reduced over the last decades by the construction of multiple dams and reservoirs in the Mekong River basin (Ruiz-Barradas and Nigam, 2024). As a result, the Mekong River plume has shrunk dramatically (Feng YK et al., 2024). The dams and reservoirs also reduced the sediment load that the river delivers to the sea (Loisel et al., 2014). The planned construction of more dams and reservoirs will ensure the continuation of this trend. Thus, the location, intensity and strength of the plume front are expected to change over the next decade. Our study thus provides a useful benchmark for future investigations of the Mekong River plume and plume front.
5.11. Gulf of Thailand
The SST field inside the Gulf of Thailand (GOT) remains relatively uniform year-round (Figure 1) except for coastal embayments, especially those along the east coast of the GOT, that feature strong SST gradients (Figure 2). The only large-scale front in the Gulf is a thermohaline front across the Gulf entrance, described by Belkin and Cornillon (2003) based on hydrographic data from NAGA cruises in 1959-1960 presented by Yanagi and Takao (1998). Belkin and Cornillon (2003) termed this feature the Gulf of Thailand Front (GTF). This front was originally reported from the NAGA data by Robinson (1974) who wrote, “A sharp temperature and salinity front was observed north of Cape Camau” (ibid., p. 59), and noted an “intense temperature gradient entering the Gulf beyond Cape Camau” (ibid., p. 89), with a 2°C temperature range from 25.4-26.2 to 27.5-28.0°C.
Lin Zhang and collaborators (Zhang L et al., 2024) studied the thermal GTF in winter 1982-2021 using the Optimal Interpolation SST (OISST) data set. The thermal GTF (called “thermal front east of the Gulf of Thailand (TFEGT)” by Zhang L et al., 2024) is best developed in January-February (consistent with our results), when the front’s intensity (GM) peaks at a mere 0.11°C/10 km (ibid., Figure 4) or a quarter of the maximum GM of 0.4°C/10 km across the same front as documented by our maps (Figure 2). The low intensity obtained by Zhang L et al. (2024) is most likely explained by the coarse spatial resolution of the OISST data (0.25° x 0.25°). The sharp local intensification of the GTF off Cape Camau (evident in our Figure 2 and also in Zhang L et al., 2024) is likely constrained by the inshore bathymetry since the GM maximum in winter is found over a steep slope drop spanning the 5-to-15-m depth range (Figure 2); for the inshore bathymetry see Figure 5 in Liu JP et al., 2017). The front is collocated with the northern terminus of the distal depocenter of Mekong-derived sediments (for the latter see Figure 16 in Liu JP et al., 2017). This collocation is not coincidental. The causal links between oceanic fronts and sedimentation are well documented. Sharp changes in suspended sediment concentration (SSC) and ocean color are often congruent with oceanic fronts (see, e.g., Figure 10 in Wang X et al. (2024) featuring a sharp color front off Cape Camau; also see Figure 8 in Loisel et al. (2014) for monthly climatology of suspended particulate matter (SPM) featuring a sharp SPM front off Cape Camau). The GTF sharpness off Cape Camau is owing to the confluence of two tidal systems: A semidiurnal tide coming from the SCS and a diurnal tide coming from the Gulf (Zu et al., 2008; Unverricht et al., 2014; Wang X et al., 2024). This confluence is constrained by local bathymetry, which features an abrupt morphological change north of Cape Camau, at 8.8°N, where the inner shelf (depth < 10 m) suddenly narrows (see Figure 1 in Loisel et al. (2014) based on high-resolution bathymetric data by Becker et al. (2009)).
The GTF formation mechanisms proposed by various authors include geostrophic advection by the southward western boundary current driven by the winter monsoon’s northeasterlies (Zhang L et al., 2024) and buoyancy contribution by the southward coastal current driven by the Mekong River outflow (Belkin and Cornillon, 2003). The importance of buoyancy flux by the copious rainfall over the offshore Gulf was emphasized by Pokavanich et al. (2024). The buoyancy flux to the coastal belt by numerous small rivers around the Gulf is deemed less important since their cumulative discharge is likely dwarfed by the influx of the diluted Mekong River outflow and direct offshore rain (see, e.g., Figure 3 in Pokavanich et al., 2024).
5.12. Peninsular Malaysia
In summer, the SW monsoon winds cause upwelling off the East Coast of Peninsular Malaysia (ECPM) between 5°N and 6°N (Akhir et al., 2015; Kok et al., 2015). The upwelling creates a cold-water belt at some distance from the shore. This cold-water belt is bordered by thermal fronts from both sides, inshore and offshore (Kok et al., 2015; Kok et al., 2017; Daud et al., 2019; Kok et al., 2019; Kok et al., 2022). The V-shape cross-frontal pattern of SST is evident along a fixed transect at 5.5°N during summertime upwelling (Daud et al., 2019). The intensity and strength of the upwelling front off ECPM vary seasonally and interannually. Based on AVHRR SST data from 2005-2015 along 5.5°N, an exceptionally strong and intense upwelling front was observed during the extremely hot summer of 2010, when the ECPM upwelling and attendant upwelling front persisted for eight months, lasting from April through November (Daud et al., 2019, Figure 9). The V-shape (“valley”) transversal pattern of SST across the ECPM summertime upwelling is similar to the summertime transversal pattern of SST across the China Coastal Front in the East China Sea (Belkin et al., 2023) and South China Sea (Belkin et al., 2024).
5.13. Sunda Shelf
The temperature field of the Sunda Shelf is relatively uniform year-round. The Sunda Shelf is devoid of conspicuous quasi-stationary seasonally persistent SST fronts. The overwhelming majority of the World Ocean’s shelves feature oceanic fronts at the shelf break and over the upper slope. In that respect, the Sunda Shelf is a study in contrast. Unlike most shelves, the Sunda Shelf does not feature a large-scale water mass of its own, at least in the surface layer. Instead, waters from adjacent areas such as the northern SCS, Gulf of Thailand, and Indonesian seas are carried across the Sunda Shelf by currents driven by seasonally reversing monsoon winds (e.g., Daryabor et al., 2016). These currents are efficient in large-scale horizontal mixing of surface waters, creating a mélange of water masses (Roseli et al., 2015). Thus, the Sunda Shelf lacks a major frontogenetic mechanism, which is the convergence of large-scale water masses with distinct properties. Even the shelf break of the central and eastern Sunda Shelf does not feature a robust SST front – unlike the overwhelming majority of shelf breaks in the World Ocean. Only the western Sunda Shelf features a shelf break front along 108-110°E associated with the southward Vietnam Coastal Current and its extension, the Vietnam Current (alternatively termed the Sunda Slope Current by Liu QY et al., 2004). Farther east, over the eastern Sunda Shelf, satellite data on chlorophyll concentration CHL and phytoplankton primary production PPP reveal no sign of a front along the northern boundary of the Sunda Shelf (Wang TH et al., 2023; Deng L et al., 2024). The Sunda Shelf’s shelf break does not manifest in CHL maps: The entire Sunda Shelf is flooded with oligotrophic waters typical of the open SCS (Wang TH et al., 2023). The same pattern transpires in the long-term distributions of phytoplankton’s primary production presented by Deng L et al. (2024), where the Sunda Shelf’s shelf break does not appear as a biogeographical boundary.
The southward advection of cold waters from the north toward the Sunda Shelf was proposed as a viable frontogenetic mechanism (e.g., Kok et al., 2015). As discussed in section 4.1.1 (Cold Tongue in winter), the southward advection peaks in winter when the NE monsoon winds drive the Vietnam Coastal Current and its extension, the Vietnam Current (Sunda Slope Current). However, the wintertime southward advection of cold water is not strong enough to create a robust front along the Sunda Shelf’s northern boundary, which is its shelf break.
5.14. Borneo Shelf
Belkin and Cornillon (2003) identified the Shelf-Slope Front (SSF) off the Borneo Island (north of 5°N) and off the Palawan Island. The 5°N limit is justified bathymetrically as the southernmost extent of the SCS deep basin. However, the frontal maps analyzed by Belkin and Cornillon (2003) documented multiple instances of a NE-to-SW-trending front along Borneo’s NW coast, with the front extending southward well beyond 5°N, often down to 3°N, to continue over the Sunda Shelf. In an extreme case (August 1989) this front extended parallel to Borneo’s NW coast (50-100 km offshore) all the way between 7.5°N and 2.5°N, with the front’s northern part running along the shelf break off Palawan and the front’s southern part crossing over the Sunda Shelf off Borneo. A situation where a shelf-slope front leaves the shelf break and crosses onto the shelf deems highly unusual and incompatible with the physical nature of shelf-slope fronts.
Using the Simpson-Hunter criterion, Tong JQ et al. (2010) mapped the predicted locations of tidal mixing fronts (TMFs) in the SCS. The majority of these TMFs are corroborated by in situ or satellite data. The predicted TMF north of Borneo has been observed by Belkin and Cornillon (2003) from satellite SST data.
5.15. West Luzon Front
Wang GH et al. (2012) proposed a scenario for the formation of a large-scale winter front west of Luzon Island. The NE monsoon’s interaction with the Luzon Island’s mountains results in a positive wind stress curl and the formation of the cyclonic Luzon cold eddy (LCE), which facilitates the West Luzon Front (WLF) formation via differential advection of cold and warm waters. The interannual and seasonal variability of LCE and WLF were studied by Sun RL et al. (2015) and Sun RL et al. (2023), respectively. Sun RL et al. (2024) found a poor spatial correspondence between LCE and WLF in 1993-2022 and suggested that the WLF is formed due to advection of warm water by a northward current west of Luzon Island.
5.16. Luzon Strait
Fronts in the Luzon Strait have been recently investigated by Chang Y et al. (2022) and Lao QB et al. (2023). Processing 5-km monthly OSTIA SST data from 1985-2017 with the BOA algorithm, Chang Y et al. (2022) mapped SST gradient magnitude GM and distinguished three morphological types of the Kuroshio path in winter (January-March), namely the leaking, leaping and looping paths (ibid., Figure 2), consistent with previous studies. In summer, the Kuroshio SST front in this area cannot be reliably detected because of the exceedingly small horizontal gradients of SST between the Kuroshio and SCS. Lao QB et al. (2023) used the 0.05° × 0.05° resolution monthly OSTIA SST from 1982-2021 and the BOA algorithm to map SST GM (ibid., Figure 2). The Kuroshio SST front emerges in October, matures in November (with GM>0.04°C/km) and persists until February, being much stronger in the southern part of the Luzon Strait and tapering off northward. These results are similar to ours. Notably though, our maps clearly show a chain of three separate fronts aligned SE-NW, whereas maps in Figure 2 of Lao QB et al. (2023) portray this chain of fronts as a single continuous feature. This difference can be explained by the different spatial resolutions of the respective data sets: 2 km in our study vs. 5 km in Lao QB et al. (2023). The chain of fronts is aligned with two major islands of the Babuyan Islands, namely Calayan (19°19′37″N, 121°27′57″E) and Camiguin (18°50′00″N, 121°51′36″E). Thus, this frontal chain is located far west (20-30 km) of Babuyan (19°31′20″N, 121°57′13″E). This is an important regional detail and correction to the well-known schematic by Caruso et al. (2006, Figure 3), in which the Kuroshio extends east of Babuyan via the Balintang Channel between the Babuyan and Batanes Islands.
6. Conclusions
Seasonal climatology of surface thermal fronts in the South China Sea was derived from high-resolution (2 km) high-frequency (hourly) SST data of the Advanced Himawari Imager flown onboard the Japanese Himawari-8 geostationary satellite. The Belkin and O’Reilly algorithm (BOA) applied to SST data from 2015-2022 generated monthly maps of SST gradient magnitude GM, which were log-transformed to enhance contrasts in gradient magnitude maps, thereby revealing a multitude of moderate and weak fronts. Seasonal and spatial variability of SST fronts was analyzed in five regions: Taiwan Strait, Guangdong Shelf, Hainan Island/Beibu Gulf, Mekong Outflow/Gulf of Thailand entrance, and Luzon Strait/west of Luzon Island. In Taiwan Strait, six fronts were identified: China Coastal Front, Taiwan Bank Front, Northern/Eastern Changyun Ridge fronts, and Eastern/Western Penghu Islands fronts. The Guangdong Shelf in winter is dominated by the strong and continuous China Coastal Front, which extends all the way up to SE Hainan Island, while in summer this front is maintained by the SW monsoon winds-driven coastal upwelling off the eastern Guangdong. Hainan Island is surrounded with various fronts formed by wind-induced coastal upwelling off SE Hainan; tides and topographic upwelling off NE Hainan; and tidal mixing and SW monsoon winds-driven upwelling off the west coast of Hainan, where fronts are anchored/steered by giant sand ridges (sand waves). In the western Beibu Gulf, the Red River Outflow Front extends southward and continues as the Vietnam Coastal Front. The northern Beibu Gulf features a tidal mixing front off the Guangxi Coast. Off SE Vietnam, the Mekong Outflow front extends seasonally toward Cape Camau, where the Mekong Outflow front tenuously connects to the Gulf of Thailand Entrance front. The Kuroshio front in Luzon Strait manifests as a chain of three submesoscale fronts across the Babuyan Islands. West of Luzon Island, a broad NE-SW offshore frontal zone persists in winter. The summertime eastward jet off SE Vietnam emerges in June-September off the 11°N upwelling center. The jet extends from 109°E up to 114°E (at times traced up to 116°E), persisting up to three weeks (as documented) and likely longer. The zonally oriented jet was observed between two large counterrotating gyres, each about 300 km in diameter.
Author Contributions
I.M.B.: Conceptualization, methodology, data analysis, and writing; Y.-T. Z: Data curation, processing, visualization, discussions, and writing.
Funding
Yi-Tao Zang was funded by the Science and Technology Project of Zhoushan (Grant No. 2023C41020). Igor Belkin was supported by Zhejiang Ocean University.
Data Availability Statement
All data and results reported in this paper, as well as the BOA code, are available upon request from the corresponding author.
Acknowledgments
The Japanese Space Exploration Agency (JAXA) is gratefully acknowledged for making the Himawari-8 AHI SST data freely available. We are thankful to Dr. Lei Lin of the Shandong University of Science and Technology for providing a Matlab code of the BOA algorithm.
Conflicts of Interest
The authors declare no conflict of interest.
References
- Akhir MF, Daryabor F, Husain ML, Tangang F, Qiao FL, 2015. Evidence of upwelling along Peninsular Malaysia during southwest monsoon. Open Journal of Marine Science, 5(3), 273-279. [CrossRef]
- Bai P, Yang JL, Xie LL, Zhang SW, Ling Z, 2020. Effect of topography on the cold water region in the east entrance area of Qiongzhou Strait. Estuarine, Coastal and Shelf Science, 242, Article 106820. [CrossRef]
- Becker JJ, Sandwell DT, Smith WHF, Braud J, Binder B, Depner J, Fabre D, Factor J, Ingalls S, Kim SH, Ladner R, Marks K, Nelson S, Pharaoh A, Trimmer R, Von Rosenberg J, Wallace G, Weatherall P, 2009. Global bathymetry and elevation data at 30 arc seconds resolution: SRTM30_PLUS. Marine Geodesy, 32(4), 355-371. [CrossRef]
- Belkin IM, 2021. Remote sensing of ocean fronts in marine ecology and fisheries. Remote Sensing, 13(5), Article 883. [CrossRef]
- Belkin IM, Cornillon PC, 2003. SST fronts of the Pacific coastal and marginal seas. Pacific Oceanography, 1(2), 90-113. http://ferhri.ru/images/stories/FERHRI/PacificOceanography/povol1n2.pdf. Accessed 15 November 2024.
- Belkin IM, Cornillon PC, 2007. Fronts in the World Ocean’s Large Marine Ecosystems. ICES CM 2007/D:21, 33 pp. https://www.ices.dk/sites/pub/CM%20Doccuments/CM-2007/D/D2107.pdf. Accessed 15 November 2024.
- Belkin IM, O’Reilly JE, 2009. An algorithm for oceanic front detection in chlorophyll and SST satellite imagery. Journal of Marine Systems, 78(3), 317-326. [CrossRef]
- Belkin IM, Shen XT, 2024. Salinity fronts in the South Atlantic. Remote Sensing, 16(9), Article 1578. [CrossRef]
- Belkin IM, Cornillon PC, Sherman K, 2009. Fronts in Large Marine Ecosystems. Progress in Oceanography, 81(1-4), 223-236. [CrossRef]
- Belkin IM, Lou SS, Yin WB, 2023. The China Coastal Front from Himawari-8 AHI SST Data—Part 1: East China Sea. Remote Sensing, 15(8), Article 2123. [CrossRef]
- Belkin IM, Lou SS, Zang YT, Yin WB, 2024. The China Coastal Front from Himawari-8 AHI SST Data—Part 2: South China Sea. Remote Sensing, 16(18), Article 3415. [CrossRef]
- Bessho K, Date K, Hayashi M, Ikeda A, Imai T, Inoue H, Kumagai Y, Miyakawa T, Murata H, Ohno T, Okuyama A, Oyama R, 2016. An introduction to Himawari-8/9 — Japan’s new-generation geostationary meteorological satellites. Journal of the Meteorological Society of Japan, 94(2), 151-183. [CrossRef]
- Canny J, 1986. A computational approach to edge detection. IEEE Transactions on Pattern Analysis and Machine Intelligence, 8(6), 679-698. [CrossRef]
- Caruso MJ, Gawarkiewicz GG, Beardsley RC, 2006. Interannual Variability of the Kuroshio Intrusion in the South China Sea. Journal of Oceanography, 62(4), 559-575. [CrossRef]
- Castelao RM, Wang YT, 2014. Wind-driven variability in sea surface temperature front distribution in the California Current System. Journal of Geophysical Research: Oceans, 119(3), 1861-1875. [CrossRef]
- Cayula JF, Cornillon P, 1992. Edge detection algorithm for SST images. Journal of Atmospheric and Oceanic Technology, 9(1), 67-80. [CrossRef]
- Cayula JF, Cornillon P, 1995. Multi-image edge detection for SST images. Journal of Atmospheric and Oceanic Technology, 12(4), 821-829. [CrossRef]
- Chang Y, Shimada T, Lee MA, Lu HJ, Sakaida F, Kawamura H, 2006. Wintertime sea surface temperature fronts in the Taiwan Strait. Geophysical Research Letters, 33(23), L23603. [CrossRef]
- Chang Y, Lee MA, Shimada T, Sakaida F, Kawamura H, Chan JW, Lu HJ, 2008. Wintertime high-resolution features of sea surface temperature and chlorophyll-a fields associated with oceanic fronts in the southern East China Sea. International Journal of Remote Sensing, 29(21), 6249-6261. [CrossRef]
- Chang Y, Shieh WJ, Lee MA, Chan JW, Lan KW, Weng JS, 2010. Fine-scale sea surface temperature fronts in wintertime in the northern South China Sea. International Journal of Remote Sensing, 31(17), 4807-4818. [CrossRef]
- Chang Y, Shih YY, Tsai YC, Lu YH, Liu JT, Hsu TY, Yang JH, Wu XH, Hung CC, 2022. Decreasing trend of Kuroshio intrusion and its effect on the chlorophyll-a concentration in the Luzon Strait, South China Sea. GIScience & Remote Sensing, 59(1), 633-647. [CrossRef]
- Chen CS, Lai ZG, Beardsley RC, Xu QC, Lin HC, Viet NT, 2012. Current separation and upwelling over the southeast shelf of Vietnam in the South China Sea. Journal of Geophysical Research: Oceans, 117(C3), Article C03033. [CrossRef]
- Chen JY, Hu ZF, 2023. Seasonal variability in spatial patterns of sea surface cold- and warm fronts over the continental shelf of the northern South China Sea. Frontiers in Marine Science, 9, Article 1100772. [CrossRef]
- Daryabor F, Ooi SH, Samah AA, Akbari A, 2016. Dynamics of the water circulations in the southern South China Sea and its seasonal transports. PLoS ONE, 11(7), Article e0158415. [CrossRef]
- Daud NR, Akhir MF, Muslim AM, 2019. Dynamic of ENSO towards upwelling and thermal front zone in the east coast of Peninsular Malaysia. Acta Oceanologica Sinica, 38(1), 48-60. [CrossRef]
- Deng L, Zhao J, Sun SJ, Ai B, Zhou W, Cao WX, 2024. Two-decade satellite observations reveal variability in size-fractionated phytoplankton primary production in the South China Sea. Deep-Sea Research Part I, 206, Article 104258. [CrossRef]
- Dong J, Zhong Y, 2020. Submesoscale fronts observed by satellites over the Northern South China Sea shelf. Dynamics of Atmospheres and Oceans, 91, Article 101161. [CrossRef]
- Dong LX, Su JL, Wong LA, Cao ZY, Chen JC, 2004. Seasonal variation and dynamics of the Pearl River plume. Continental Shelf Research, 24(16), 1761-1777. [CrossRef]
- Fang GH, Fang WD, Fang Y, Wang K, 1998. A survey of studies on the South China Sea upper ocean circulation. Acta Oceanographica Taiwanica, 37(1), 1-16. https://www.researchgate.net/profile/Guohong-Fang/research. Accessed 2024-11-24.
- Fang WD, Guo ZX, Huang YT, 1998. Observational study of the circulation in the southern South China Sea. Chinese Science Bulletin, 43(11), 898-905. [CrossRef]
- Fang WD, Fang GH, Shi P, Huang QZ, Xie Q, 2002. Seasonal structures of upper layer circulation in the southern South China Sea from in situ observations. Journal of Geophysical Research: Oceans, 107(C11), Article 3202. [CrossRef]
- Feng YK, Park E, Wang JY, Feng L, Tran DD, 2024. Severe decline in extent and seasonality of the Mekong plume after 2000. Journal of Hydrology, 643, Article 132026. [CrossRef]
- Gan JP, Qu TD, 2008. Coastal jet separation and associated flow variability in the Southwest South China Sea. Deep-Sea Research Part I, 55(1), 1-19. [CrossRef]
- Gao JS, Mo LQ, Lu HF, Meng XN, Wu GD, Wang DP, Nguyen KC, Hu BQ, Tran AT, 2024. Spring circulation characteristics and formation mechanism in the Beibu Gulf. Frontiers in Marine Science, 11, Article 1398702. [CrossRef]
- Guo L, Xiu P, Chai F, Xue HJ, Wang DX, Sun J, 2017. Enhanced chlorophyll concentrations induced by Kuroshio intrusion fronts in the northern South China Sea. Geophysical Research Letters, 44(22), 11,565-11,572. [CrossRef]
- Hickox R, Belkin I, Cornillon P, Shan Z, 2000. Climatology and seasonal variability of ocean fronts in the East China, Yellow and Bohai Seas from satellite SST data. Geophysical Research Letters, 27(18), 2945-2948. [CrossRef]
- Hu JY, Kawamura H, Hong HS, Qi YQ, 2000. A review on the currents in the South China Sea: Seasonal circulation, South China Sea warm current and Kuroshio intrusion. Journal of Oceanography, 56(6), 607-624. [CrossRef]
- Hu JY, Kawamura H, Tang DL, 2003. Tidal front around the Hainan Island, northwest of the South China Sea. Journal of Geophysical Research: Oceans, 108(C11), Article 3342. [CrossRef]
- Hu JY, Wang XH, 2016. Progress on upwelling studies in the China seas. Review of Geophysics, 54(3), 653-673. [CrossRef]
- Hu JY, San Liang X, Lin HY, 2018. Coastal upwelling off the China coasts. In: X. San Liang and Yuanzhi Zhang (editors), Coastal Environment, Disaster, and Infrastructure: A Case Study of China’s Coastline, IntechOpen, London, UK, pp. 3-25. [CrossRef]
- Hu ZF, Xie GH, Zhao J, Lei YP, Xie JC, Pang WH, 2022. Mapping diurnal variability of the wintertime Pearl River plume front from Himawari-8 geostationary satellite observations. Water, 14(1), Article 43. [CrossRef]
- Huang TH, Chen CTA, Bai Y, He XQ, 2020. Elevated primary productivity triggered by mixing in the quasi-cul-de-sac Taiwan Strait during the NE monsoon. Scientific Reports, 10(1), Article 7846. [CrossRef]
- Huang XL, Jing ZY, Zheng RX, Cao HJ, 2020. Dynamical analysis of submesoscale fronts associated with wind-forced offshore jet in the western South China Sea. Acta Oceanologica Sinica, 39(11), 1-12. [CrossRef]
- Jing ZY, Qi YQ, Du Y, Zhang SW, Xie LL, 2015. Summer upwelling and thermal fronts in the northwestern South China Sea: Observational analysis of two mesoscale mapping surveys. Journal of Geophysical Research: Oceans, 120(3), 1993-2006. [CrossRef]
- Jing ZY, Qi YQ, Fox-Kemper B, Du Y, Lian SM, 2016. Seasonal thermal fronts on the northern South China Sea shelf: Satellite measurements and three repeated field surveys. Journal of Geophysical Research: Oceans, 121(3), 1914-1930. [CrossRef]
- Kok PH, Akhir MF, Tangang FT, 2015. Thermal frontal zone along the east coast of Peninsular Malaysia. Continental Shelf Research, 110, 1-15. [CrossRef]
- Kok PH, Akhir MFM, Tangang F, Husain ML, 2017. Spatiotemporal trends in the southwest monsoon wind-driven upwelling in the southwestern part of the South China Sea. PLoS ONE, 12(2), Article e0171979. [CrossRef]
- Kok PH, Akhir MF, Qiao FL, 2019. Distinctive characteristics of upwelling along the Peninsular Malaysia’s east coast during 2009/10 and 2015/16 El Niños. Continental Shelf Research, 184, 10-20. [CrossRef]
- Kok PH, Wijeratne S, Akhir MF, Pattiaratchi C, Chung JX, Roseli NH, Daud NR, 2022. Modeling approaches in the investigation of upwelling along the east coast of Peninsular Malaysia: Its driven mechanisms. Regional Studies in Marine Science, 55, Article 102562. [CrossRef]
- Lan KW, Kawamura H, Lee MA, Chang Y, Chan JW, Liao CH, 2009. Summertime sea surface temperature fronts associated with upwelling around the Taiwan Bank. Continental Shelf Research, 29(7), 903-910. [CrossRef]
- Lao QB, Zhang SW, Li ZY, Chen FJ, Zhou X, Jin GZ, Huang P, Deng ZY, Chen CQ, Zhu QM, Lu X, 2022. Quantification of the seasonal intrusion of water masses and their impact on nutrients in the Beibu Gulf using dual water isotopes. Journal of Geophysical Research: Oceans, 127(7), Article e2021JC018065. [CrossRef]
- Lao QB, Liu SH, Wang C, Chen FJ, 2023. Global warming weakens the ocean front and phytoplankton blooms in the Luzon Strait over the past 40 years. Journal of Geophysical Research: Biogeosciences, 128(12), Article e2023JG007726. [CrossRef]
- Le PTD, Fischer AM, 2021. Trends and patterns of SST and associated frontal frequency in the Vietnamese upwelling center. Journal of Marine Systems, 222, Article 103600. [CrossRef]
- Lee MA, Chang Y, Shimada T, 2015. Seasonal evolution of fine-scale sea surface temperature fronts in the East China Sea. Deep-Sea Research Part II, 119, 20-29. [CrossRef]
- Li JY, Li M, Wang C, Zheng QA, Xu Y, Zhang TY, Xie LL, 2023. Multiple mechanisms for chlorophyll a concentration variations in coastal upwelling regions: a case study east of Hainan Island in the South China Sea. Ocean Science, 19(2), 469-484. [CrossRef]
- Li YL, Han WQ, Wilkin JL, Zhang WFG, Arango H, Zavala-Garay J, Levin J, Castruccio FS, 2014. Interannual variability of the surface summertime eastward jet in the South China Sea. Journal of Geophysical Research: Oceans, 119(10), 7205-7228. [CrossRef]
- Li YN, Curchitser EN, Wang J, Peng SQ, 2020. Tidal effects on the surface water cooling northeast of Hainan Island, South China Sea. Journal of Geophysical Research: Oceans, 125(10), Article e2019JC016016. [CrossRef]
- Lin HY, Hu JY, Liu ZY, Belkin IM, Sun ZY, Zhu J, 2017. A peculiar lens-shaped structure observed in the South China Sea. Scientific Reports, 7(1), Article number 478. [CrossRef]
- Lin HY, Sun ZY, Chen ZZ, Zhu J, JY Hu, 2020. Wintertime Guangdong coastal currents successfully captured by cheap GPS drifters. Acta Oceanologica Sinica, 39(1), 166-170. [CrossRef]
- Lin PG, Cheng P, Gan JP, Hu JY, 2016. Dynamics of wind-driven upwelling off the northeastern coast of Hainan Island. Journal of Geophysical Research: Oceans, 121(2), 1160-1173. [CrossRef]
- Liu JP, DeMaster DJ, Nittrouer CA, Eidam EF, Nguyen TT, 2017. A seismic study of the Mekong subaqueous delta: Proximal versus distal sediment accumulation. Continental Shelf Research, 147, 197-212. [CrossRef]
- Liu QY, Jiang X, Xie SP, Liu WT, 2004. A gap in the Indo-Pacific warm pool over the South China Sea in boreal winter: Seasonal development and interannual variability. Journal of Geophysical Research: Oceans, 109(C7), Article C07012. [CrossRef]
- Liu ZZ, Fagherazzi S, Liu XH, Shao DD, Miao CY, Cai YZ, Hou CY, Liu YL, Li Xia, Cui BS, 2022. Long-term variations in water discharge and sediment load of the Pearl River Estuary: Implications for sustainable development of the Greater Bay Area. Frontiers in Marine Science, 9, Article 983517. [CrossRef]
- Loisel H, Mangin A, Vantrepotte V, Dessailly D, Dinh DN, Garnesson P, Ouillon S, Lefebvre JP, Mériaux X, Phan TM, 2014. Variability of suspended particulate matter concentration in coastal waters under the Mekong’s influence from ocean color (MERIS) remote sensing over the last decade. Remote Sensing of Environment, 150, 218-230. [CrossRef]
- Lü XG, Qiao FL, Wang GS, Xia CS, Yuan YL, 2008. Upwelling off the west coast of Hainan Island in summer: Its detection and mechanisms. Geophysical Research Letters, 35(2), Article L02604. [CrossRef]
- Ma XC, He YW, Gao M, Gong T, 2024. The morphology and formation of a binary sand ridge in the Beibu Gulf, northwestern South China Sea. Geomorphology, 458, Article 109251. [CrossRef]
- Ngo MH, Hsin YC, 2024. Three-dimensional structure of temperature, salinity, and velocity of the summertime Vietnamese upwelling system in the South China Sea on the interannual timescale. Progress in Oceanography, 229, Article 103354. [CrossRef]
- Nguyen QH, Tran VN, 2024. Temporal changes in water and sediment discharges: impacts of climate change and human activities in the Red River basin (1958–2021) with projections up to 2100. Water, 16, Article 1155. [CrossRef]
- Nguyen-Duy T, Ayoub NK, Marsaleix P, Toublanc F, De Mey-Frémaux P, Piton V, Herrmann M, Duhaut T, Tran MC, Ngo-Duc T, 2021. Variability of the Red River plume in the Gulf of Tonkin as revealed by numerical modeling and clustering analysis. Frontiers in Marine Science, 8, Article 772139. [CrossRef]
- Ou SY, Zhang H, Wang DX, 2009. Dynamics of the buoyant plume off the Pearl River Estuary in summer. Environmental Fluid Mechanics, 9(5), 471-492. [CrossRef]
- Pi QL, Hu JY, 2010. Analysis of sea surface temperature fronts in the Taiwan Strait and its adjacent area using an advanced edge detection method. Science China Earth Sciences, 53 (7), 1008-1016. [CrossRef]
- Ping B, Su FZ, Meng YS, Du YY, Fang SH, 2016. Application of a sea surface temperature front composite algorithm in the Bohai, Yellow, and East China Seas. Chinese Journal of Oceanology and Limnology, 34 (3), 597-607. [CrossRef]
- Piton V, Herrmann M, Marsaleix P, Duhaut T, Ngoc TB, Tran MC, Shearman K, Ouillon S, 2021. Influence of winds, geostrophy and typhoons on the seasonal variability of the circulation in the Gulf of Tonkin: A high-resolution 3D regional modeling study. Regional Studies in Marine Science, 45, Article 101849. [CrossRef]
- Pokavanich T, Worrawatanathum V, Phattananuruch K, Koolkalya S, 2024. Seasonal dynamics and three-dimensional hydrographic features of the eastern Gulf of Thailand: Insights from high-resolution modeling and field measurements. Water, 16(14), Article 1962. [CrossRef]
- Qiu CH, Cui YS, Hu SQ, Huo D, 2017. Seasonal variation of Guangdong coastal thermal front based on merged satellite data. Journal of Tropical Oceanology, 36(5), 16-23 (in Chinese, with English abstract and captions). [CrossRef]
- Qiu Y, Li L, Chen CTA, Guo XG, Jing CS, 2011. Currents in the Taiwan Strait as observed by surface drifters. Journal of Oceanography, 67(4), 395-404. [CrossRef]
- Qu TD, 2001. Role of ocean dynamics in determining the mean seasonal cycle of the South China Sea surface temperature. Journal of Geophysical Research: Oceans, 106(C4), 6943-6955. [CrossRef]
- Ren SH, Zhu XM, Drevillon A, Wang H, Zhang YF, Zu ZQ, Li A, 2021. Detection of SST fronts from a high-resolution model and its preliminary results in the South China Sea. Journal of Atmospheric and Oceanic Technology, 38(2), 387-403. [CrossRef]
- Robinson MK, 1974. The physical oceanography of the Gulf of Thailand, Naga Expedition. Naga Report, Volume 3, Part 1. The University of California, Scripps Institution of Oceanography, La Jolla, California. https://escholarship.org/uc/item/4mf3d0b7. Accessed 2024-12-08.
- Roseli NH, Akhir MF, Husain ML, Tangang F, Ali A, 2015. Water mass characteristics and stratification at the shallow Sunda Shelf of southern South China Sea. Open Journal of Marine Science, 5(4), 455-467. [CrossRef]
- Ruiz-Barradas A, Nigam S, 2024. Hydroclimate variability and change over the Mekong River Basin. In: Hong Quan Nguyen, Heiko Apel, Quang Bao Le, Minh Tú Nguyễn, and Venkataramana Sridhar (editors), The Mekong River Basin, Chapter 1, pp. 3-52. Elsevier. [CrossRef]
- Shaw PT, Chao SY, 1994. Surface circulation in the South China Sea. Deep-Sea Research Part I, 41(11-12), 1663-1683. [CrossRef]
- Shen XT, Belkin IM, 2023. Observational studies of ocean fronts: A systematic review of Chinese-language literature. Water, 15(20), Article 3649. [CrossRef]
- Shi MC, Chen CS, Xu QC, Lin HC, Liu GM, Wang H, Wang F, Yan JH, 2002. The role of Qiongzhou Strait in the seasonal variation of the South China Sea circulation. Journal of Physical Oceanography, 32(1), 103-121. [CrossRef]
- Shi R, Guo XY, Wang DX, Zeng LL, Chen J, 2015. Seasonal variability in coastal fronts and its influence on sea surface wind in the Northern South China Sea. Deep-Sea Research Part II, 119, 30-39. [CrossRef]
- Shi R, Chen J, Guo XY, Zeng LL, Li J, Xie Q, Wang X, Wang DX, 2017. Ship observations and numerical simulation of the marine atmospheric boundary layer over the spring oceanic front in the northwestern South China Sea. Journal of Geophysical Research: Atmospheres, 122(7), 3733-3753. [CrossRef]
- Shi R, Guo XY, Chen J, Zeng LL, Wu B, Wang DX, 2022. Effects of spatial scale modification on the responses of surface wind stress to the thermal front in the northern South China Sea. Journal of Climate, 35(1), 179-194. [CrossRef]
- Shi WA, Huang Z, Hu JY, 2021. Using TPI to map spatial and temporal variations of significant coastal upwelling in the northern South China Sea. Remote Sensing, 13, Article 1065. [CrossRef]
- Shimada T, Sakaida F, Kawamura H, Okumura T, 2005. Application of an edge detection method to satellite images for distinguishing sea surface temperature fronts near the Japanese coast. Remote Sensing of Environment, 98(1), 21-34. [CrossRef]
- Shu YQ, Wang Q, Zu TT, 2018. Progress on shelf and slope circulation in the northern South China Sea. Science China (Earth Sciences), 61(5), 560-571. [CrossRef]
- Su JL, 2004. Overview of the South China Sea circulation and its influence on the coastal physical oceanography outside the Pearl River Estuary. Continental Shelf Research, 24(16), 1745-1760. [CrossRef]
- Sun RL, Ling Z, Chen CL, Yan YW, 2015. Interannual variability of thermal front west of Luzon Island in boreal winter. Acta Oceanologica Sinica, 34(11), 102-108. [CrossRef]
- Sun RL, Li PL, Gu YZ, Zhou CJ, Liu C, Zhang L, 2023. Seasonal variation of the shape and location of the Luzon cold eddy. Acta Oceanologica Sinica, 42(5), 14-24. [CrossRef]
- Sun RL, Li PL, Zhai FG, Gu YZ, Bai P, 2024. New insight into the formation mechanism of wintertime thermal front west of Luzon Island. Journal of Geophysical Research: Oceans, 129(6), Article e2023JC020774. [CrossRef]
- Sun Y, Lan JA, 2021. Summertime eastward jet and its relationship with western boundary current in the South China Sea on the interannual scale. Climate Dynamics, 56(3-4), 935-947. [CrossRef]
- Tan HJ, Cai RS, Wu RG, 2022. Summer marine heatwaves in the South China Sea: Trend, variability and possible causes. Advances in Climate Change Research, 13(3), 323-332. [CrossRef]
- Tan KY, Xie LL, Li MM, Li M, Li JY, 2023. 3D structure and seasonal variation of temperature fronts in the shelf sea west of Guangdong. Haiyang Xuebao (Acta Oceanologica Sinica Chinese Edition), 45(10), 42-55. [CrossRef]
- Tong JQ, Gan ZJ, Qi YQ, Mao QW, 2010. Predicted positions of tidal fronts in continental shelf of South China Sea. Journal of Marine Systems, 82(3), 145-153. [CrossRef]
- Ullman DS, Cornillon PC, 1999. Satellite-derived sea surface temperature fronts on the continental shelf off the northeast U.S. coast. Journal of Geophysical Research: Oceans, 104(C10), 23459-23478. [CrossRef]
- Ullman DS, Cornillon PC, 2001. Continental shelf surface thermal fronts in winter off the northeast US coast. Continental Shelf Research, 21(11-12), 1139-1156. [CrossRef]
- Unverricht D, Nguyen TC, Heinrich C, Szczuciński W, Lahajnar N, Stattegger K, 2014. Suspended sediment dynamics during the inter-monsoon season in the subaqueous Mekong Delta and adjacent shelf, southern Vietnam. Journal of Asian Earth Sciences, 79, 509-519. [CrossRef]
- van Maren DS, 2007. Water and sediment dynamics in the Red River mouth and adjacent coastal zone. Journal of Asian Earth Sciences, 29(4), 508-522. [CrossRef]
- Varikoden H, Samah AA, Babu CA, 2010. The cold tongue in the South China Sea during boreal winter and its interaction with the atmosphere. Advances in Atmospheric Sciences, 27(2), 265-273. [CrossRef]
- Wang DX, Liu Y, Qi YQ, Shi P, 2001. Seasonal variability of thermal fronts in the Northern South China Sea from satellite data. Geophysical Research Letters, 28(20), 3963-3966. [CrossRef]
- Wang DX, Luo L, Liu Y, Li SY, 2003. Seasonal and interannual variability of thermal fronts in the Tonkin Gulf. In: Ocean Remote Sensing and Applications (SPIE Proceedings, Vol. 4892), pp. 415-425. SPIE. [CrossRef]
- Wang DX, Liu QY, Xie Q, He ZG, Zhuang W, Shu YQ, Xiao XJ, Hong B, Wu XY, Sui DD, 2013. Progress of regional oceanography study associated with western boundary current in the South China Sea. Chinese Science Bulletin, 58(11), 1205-1215. [CrossRef]
- Wang GH, Chen D, Su JL, 2006. Generation and life cycle of the dipole in the South China Sea summer circulation. Journal of Geophysical Research: Oceans, 111(C6), Article C06002. [CrossRef]
- Wang GH, Li JX, Wang CZ, Yan YW, 2012. Interactions among the winter monsoon, ocean eddy and ocean thermal front in the South China Sea. Journal of Geophysical Research: Oceans, 117(C8), Article C08002. [CrossRef]
- Wang TH, Sun Y, Su H, Lu WF, 2023. Declined trends of chlorophyll a in the South China Sea over 2005−2019 from remote sensing reconstruction. Acta Oceanologica Sinica, 42(1), 12-24. [CrossRef]
- Wang TH, Sun Y, Su H, Lu WF, 2023. Declined trends of chlorophyll a in the South China Sea over 2005−2019 from remote sensing reconstruction. Acta Oceanologica Sinica, 42(1), 12-24. [CrossRef]
- Wang X, Zhang WY, Xie XO, Chen H, Chen BC, 2024. Holocene sedimentary distribution and morphological characteristics reworked by East Asian monsoon dynamics in the Mekong River shelf, South Vietnam. Estuarine, Coastal and Shelf Science, 302, Article 108784. [CrossRef]
- Wang YC, Chen WY, Chang Y, Lee MA, 2013. Ichthyoplankton community associated with oceanic fronts in early winter on the continental shelf of the southern East China Sea. Journal of Marine Science and Technology, 21 (Suppl.), 65-76. [CrossRef]
- Wang YC, Chan JW, Lan YC, Yang WC, Lee MA, 2018. Satellite observation of the winter variation of sea surface temperature fronts in relation to the spatial distribution of ichthyoplankton in the continental shelf of the southern East China Sea. International Journal of Remote Sensing, 39(13), 4550-4564. [CrossRef]
- Wang YT, Castelao RM, Yuan YP, 2015. Seasonal variability of alongshore winds and sea surface temperature fronts in Eastern Boundary Current Systems. Journal of Geophysical Research: Oceans, 120(3), 2385-2400. [CrossRef]
- Wang YT, Yu Y, Zhang Y, Zhang HR, Chai F, 2020. Distribution and variability of sea surface temperature fronts in the South China Sea. Estuarine, Coastal and Shelf Science, 240, 106793. [CrossRef]
- Wu Q, Lin HY, Hu JY, 2020. Oceanic fronts in the Northern South China Sea. In: Jianyu Hu, Chung-Ru Ho, Lingling Xie, and Quanan Zheng (editors), Regional Oceanography of the South China Sea, World Scientific Publishing, Singapore, pp. 379-402. [CrossRef]
- Wyrtki K, 1961. Scientific Results of Marine Investigations of the South China Sea and the Gulf of Thailand 1959-1961. Naga Report, Volume 2, 195 pp. The University of California, Scripps Institution of Oceanography, La Jolla, California. https://escholarship.org/uc/item/49n9x3t4. Accessed 2024-11-14.
- Xie LL, Pallas-Sanz E, Zheng QA, Zhang SW, Zong XL, Yi XF, Li MM (2017). Diagnosis of 3D vertical circulation in the upwelling and frontal zones east of Hainan Island, China. Journal of Physical Oceanography, 47(4), 755-774. [CrossRef]
- Xie SP, Xie Q, Wang DX, Liu WT, 2003. Summer upwelling in the South China Sea and its role in regional climate variations. Journal of Geophysical Research: Oceans, 108(C8), Article 3261. [CrossRef]
- Xing QW, Yu HQ, Wang H, Ito SI, 2023. An improved algorithm for detecting mesoscale ocean fronts from satellite observations: Detailed mapping of persistent fronts around the China Seas and their long-term trends. Remote Sensing of Environment, 294, Article 113627. [CrossRef]
- Xing QW, Yu HQ, Wang H, 2024. Global mapping and evolution of persistent fronts in Large Marine Ecosystems over the past 40 years. Nature Communications, 15(1), Article 4090. [CrossRef]
- Yanagi T, Takao T, 1998. Seasonal variation of three-dimensional circulations in the Gulf of Thailand. La Mer, 36(2), 43-55.
- Yang CY, Ye HB, 2021. The features of the coastal fronts in the Eastern Guangdong coastal waters during the downwelling-favorable wind period. Scientific Reports, 11, Article 10238. [CrossRef]
- Yang LQ, Huang ZD, Sun ZY, Hu JY, 2021. Surface currents along the coast of the Chinese Mainland observed by coastal drifters in autumn and winter. Marine Technology Society Journal, 55(5), 161-169. [CrossRef]
- Yang LQ, Sun ZY, Hu ZY, Huang ZD, Chen ZZ, Zhu J, Hu JY, 2023. Surface currents along the coast of the Chinese Mainland observed by coastal drifters during April-May 2019. Marine Technology Society Journal, 57(1), 156-167. [CrossRef]
- Yao JL, Belkin IM, Chen J, Wang DX, 2012. Thermal fronts of the southern South China Sea from satellite and in situ data. International Journal of Remote Sensing, 33(23), 7458-7468. [CrossRef]
- Yu Y, Zhang HR, Jin JB, Wang YT, 2019. Trends of sea surface temperature and sea surface temperature fronts in the South China Sea during 2003–2017. Acta Oceanologica Sinica, 38(4), 106-115. [CrossRef]
- Yu Y, Wang YT, Cao L, Tang R, Chai F, 2020. The ocean-atmosphere interaction over a summer upwelling system in the South China Sea. Journal of Marine Systems, 208, Article 103360. [CrossRef]
- Yu ZT, Fan YL, Metzger EJ, 2023. On the anomalous structure of the Southeast Vietnam Offshore Current during 1994 to 2015. Ocean Modelling, 183, Article 102199. [CrossRef]
- Zeng XZ, Belkin IM, Peng SQ, Li YN, 2014. East Hainan upwelling fronts detected by remote sensing and modelled in summer. International Journal of Remote Sensing, 35(11-12), 4441-4451. [CrossRef]
- Zhang F, Li XF, Hu JY, Sun ZY, Zhu J, Chen ZZ, 2014. Summertime sea surface temperature and salinity fronts in the southern Taiwan Strait. International Journal of Remote Sensing, 35(11-12), 4452-4466. [CrossRef]
- Zhang L, Dong J, 2021. Dynamic characteristics of a submesoscale front and associated heat fluxes over the northeastern South China Sea shelf. Atmosphere-Ocean, 59(3), 190-200. [CrossRef]
- Zhang L, Sun RL, Li PL, Ye GQ, 2024. Seasonal and interannual variabilities of the thermal front east of Gulf of Thailand. Frontiers in Marine Science, 11, Article 1398791. [CrossRef]
- Zhang SR, Lu XX, Higgitt DL, Chen CTA, Han JT, Sun HG, 2008. Recent changes of water discharge and sediment load in the Zhujiang (Pearl River) basin, China. Global and Planetary Change, 60(3-4), 365-380. [CrossRef]
- Zhang Y, Zeng LL, Wang Q, Geng BX, Liu CJ, Shi R, Liu N, Wang WP, Wang DX, 2021. Seasonal variation in the three-dimensional structures of coastal thermal front off western Guangdong. Acta Oceanologica Sinica, 40(7), 88-99. [CrossRef]
- Zhao LH, Yang DT, Zhong R, Yin XQ, 2022. Interannual, seasonal, and monthly variability of sea surface temperature fronts in offshore China from 1982–2021. Remote Sensing, 14(21), Article 5336. [CrossRef]
- Zhi HH, Wu H, Wu JX, Zhang WX, Wang YH, 2022. River plume rooted on the sea-floor: Seasonal and spring-neap variability of the Pearl River plume front. Frontiers in Marine Science, 9, Article 791948. [CrossRef]
- Zhou X, Zhang SW, Liu SH, Chen CQ, Lao QB, Chen FJ, 2024. Thermal fronts in coastal waters regulate phytoplankton blooms via acting as barriers: A case study from western Guangdong, China. Journal of Hydrology, 636, Article 131350. [CrossRef]
- Zhu JY, Zhou QY, Zhou QQ, Geng XX, Shi J, Guo XY, Yu Y, Yang ZW, Fan RF, 2023. Interannual variation of coastal upwelling around Hainan Island. Frontiers in Marine Science, 10, Article 1054669. [CrossRef]
- Zhu XM, Wang H, Liu GM, Régnier C, Kuang XD, Wang DK, Ren SH, Jing ZY, Drévillon M, 2016. Comparison and validation of global and regional ocean forecasting systems for the South China Sea. Natural Hazards and Earth System Sciences, 16(7), 1639-1655. [CrossRef]
- Zu TT, Gan JP, Erofeeva SY, 2008. Numerical study of the tide and tidal dynamics in the South China Sea. Deep-Sea Research Part I, 55(2), 137-154. [CrossRef]
- Zu TT, Wang DX, Gan JP, Guan WB, 2014. On the role of wind and tide in generating variability of Pearl River plume during summer in a coupled wide estuary and shelf system. Journal of Marine Systems, 136(1), 65-79. [CrossRef]
- Zu TT, Gan JP, 2015. A numerical study of coupled estuary–shelf circulation around the Pearl River Estuary during summer: Responses to variable winds, tides and river discharge. Deep-Sea Research Part II 117, 53-64. [CrossRef]
Figure 1.
Long-term (2015-2022) mean monthly maps of SST (°C) (with custom color scales).
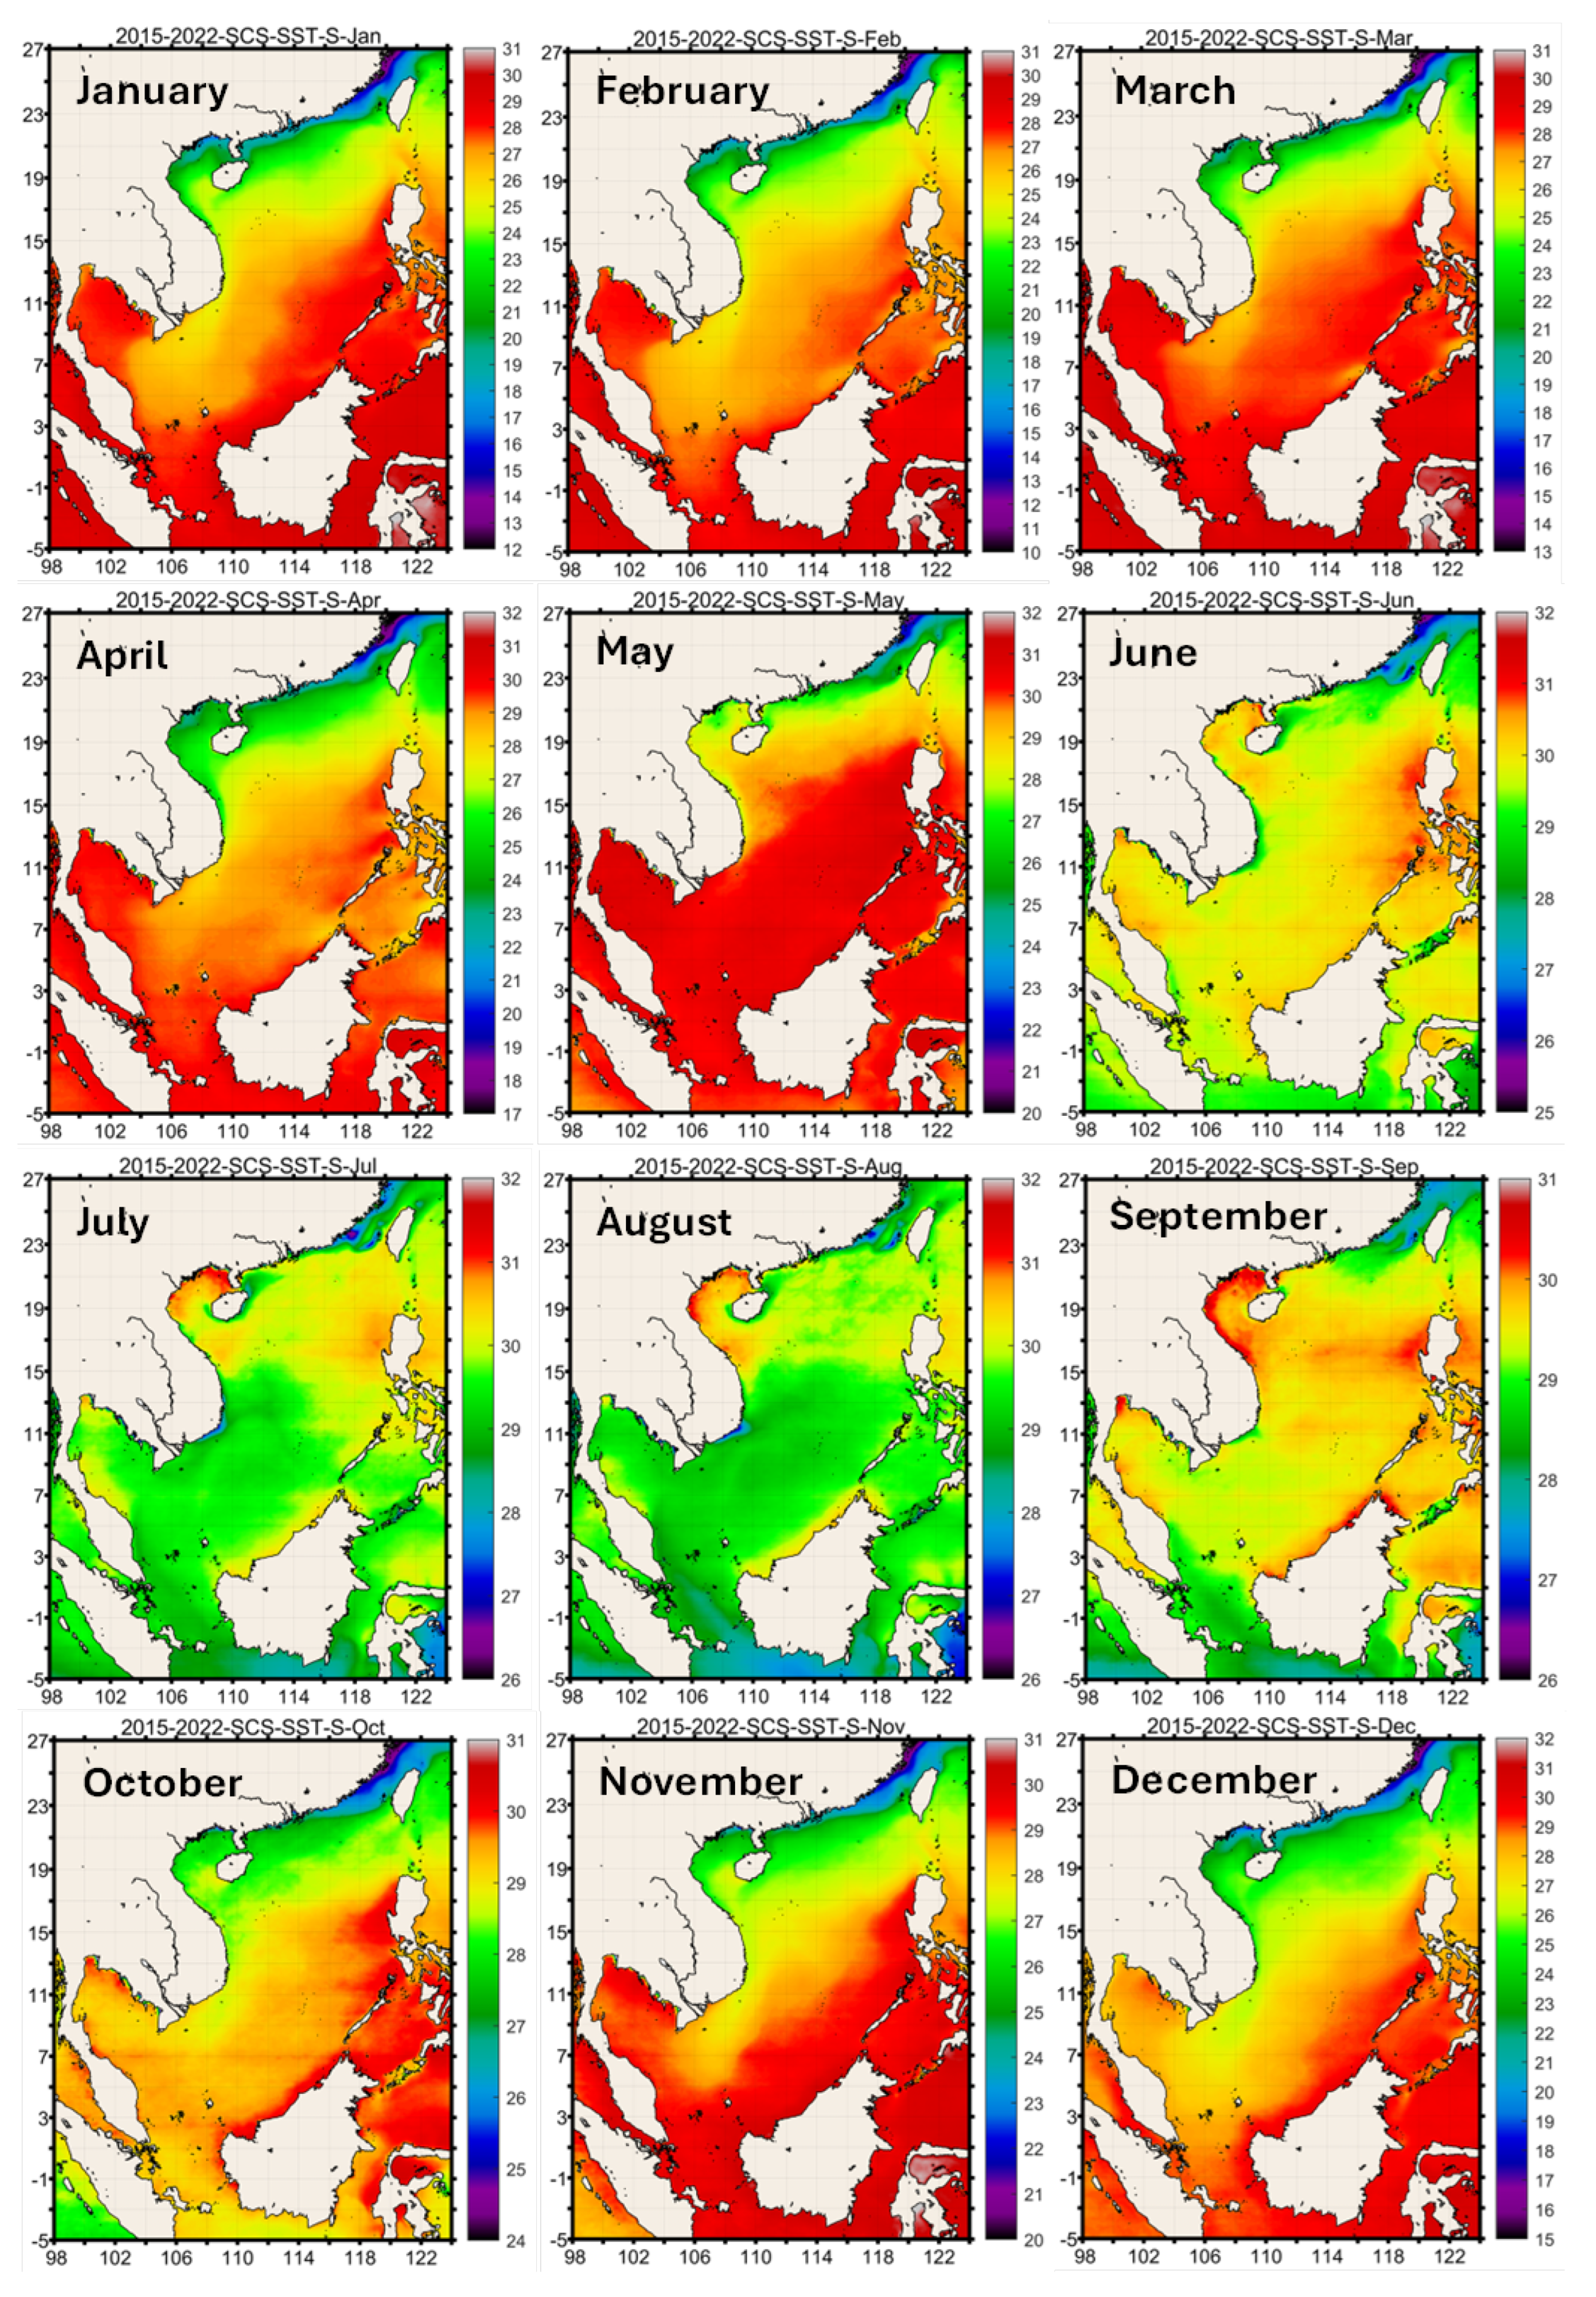
Figure 3.
Long-term (2015-2022) mean monthly maps of log-transformed SST gradient magnitude LN(GM) (with custom color scales).
Figure 3.
Long-term (2015-2022) mean monthly maps of log-transformed SST gradient magnitude LN(GM) (with custom color scales).
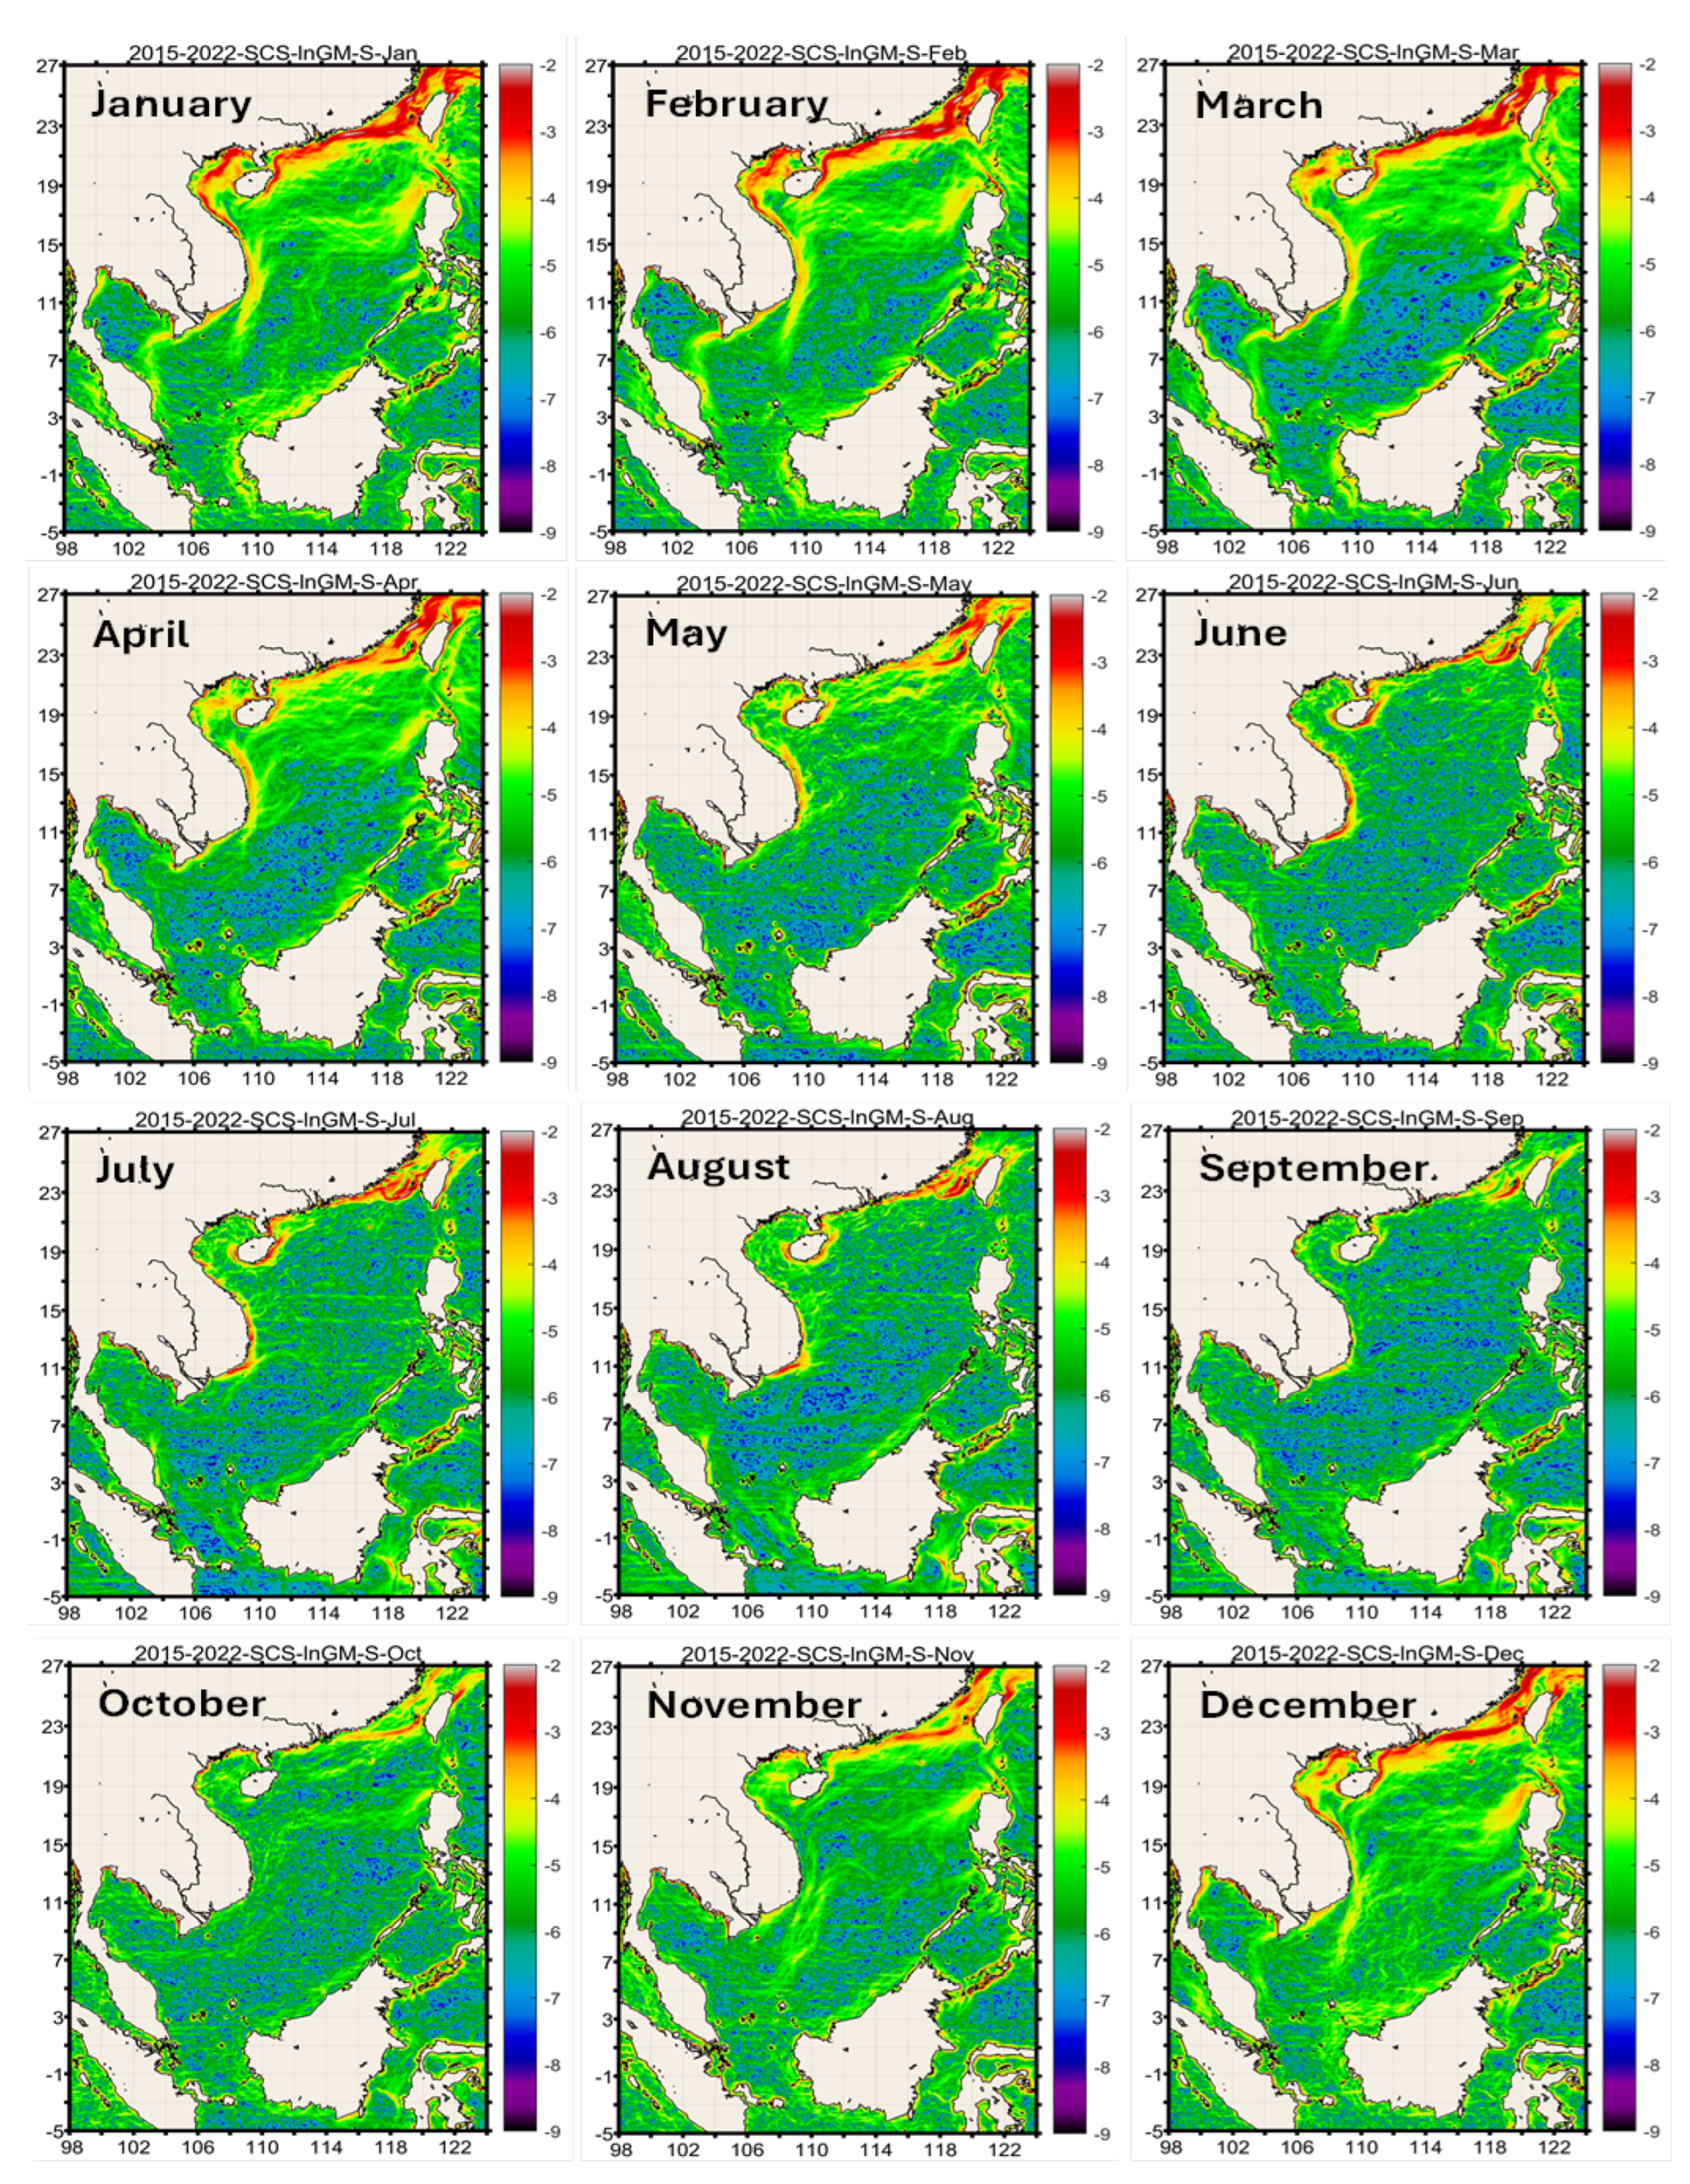
Figure 4.
Long-term mean monthly maps of GM (°C/km) in Region 1 (with custom color scales).
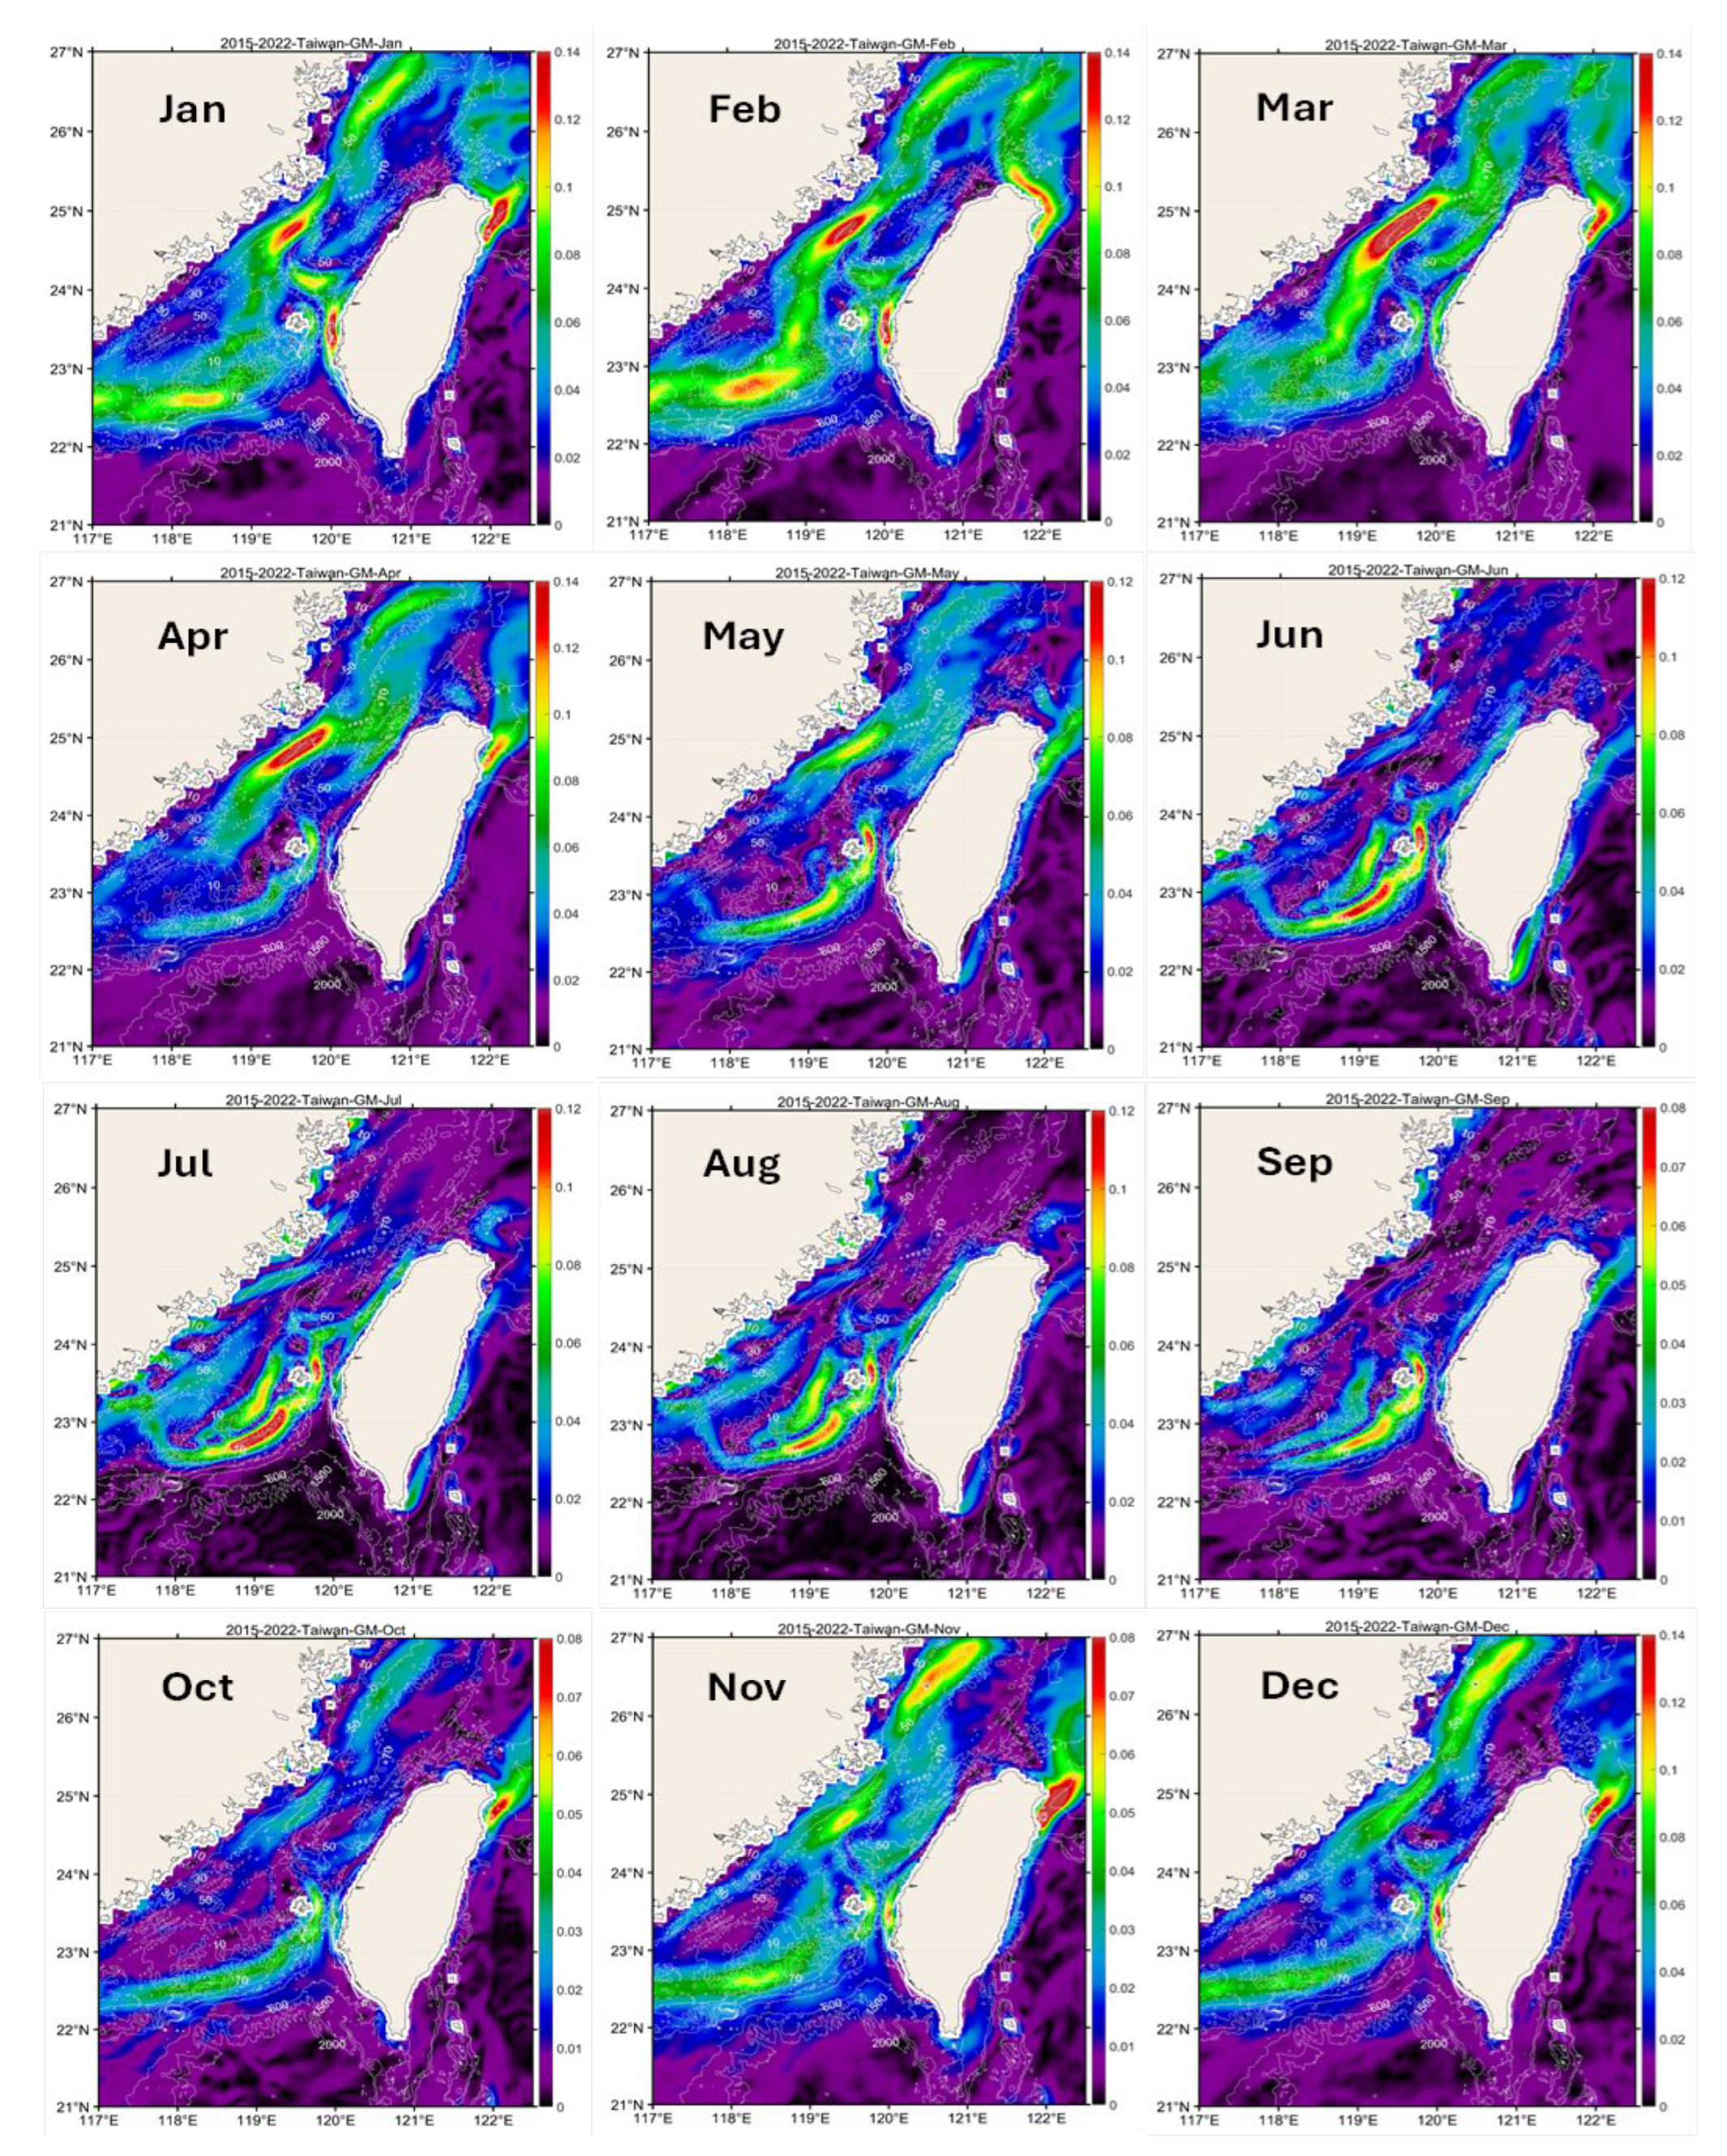
Figure 5.
Long-term mean monthly maps of GM (°C/km) in Region 2 (with custom color scales).
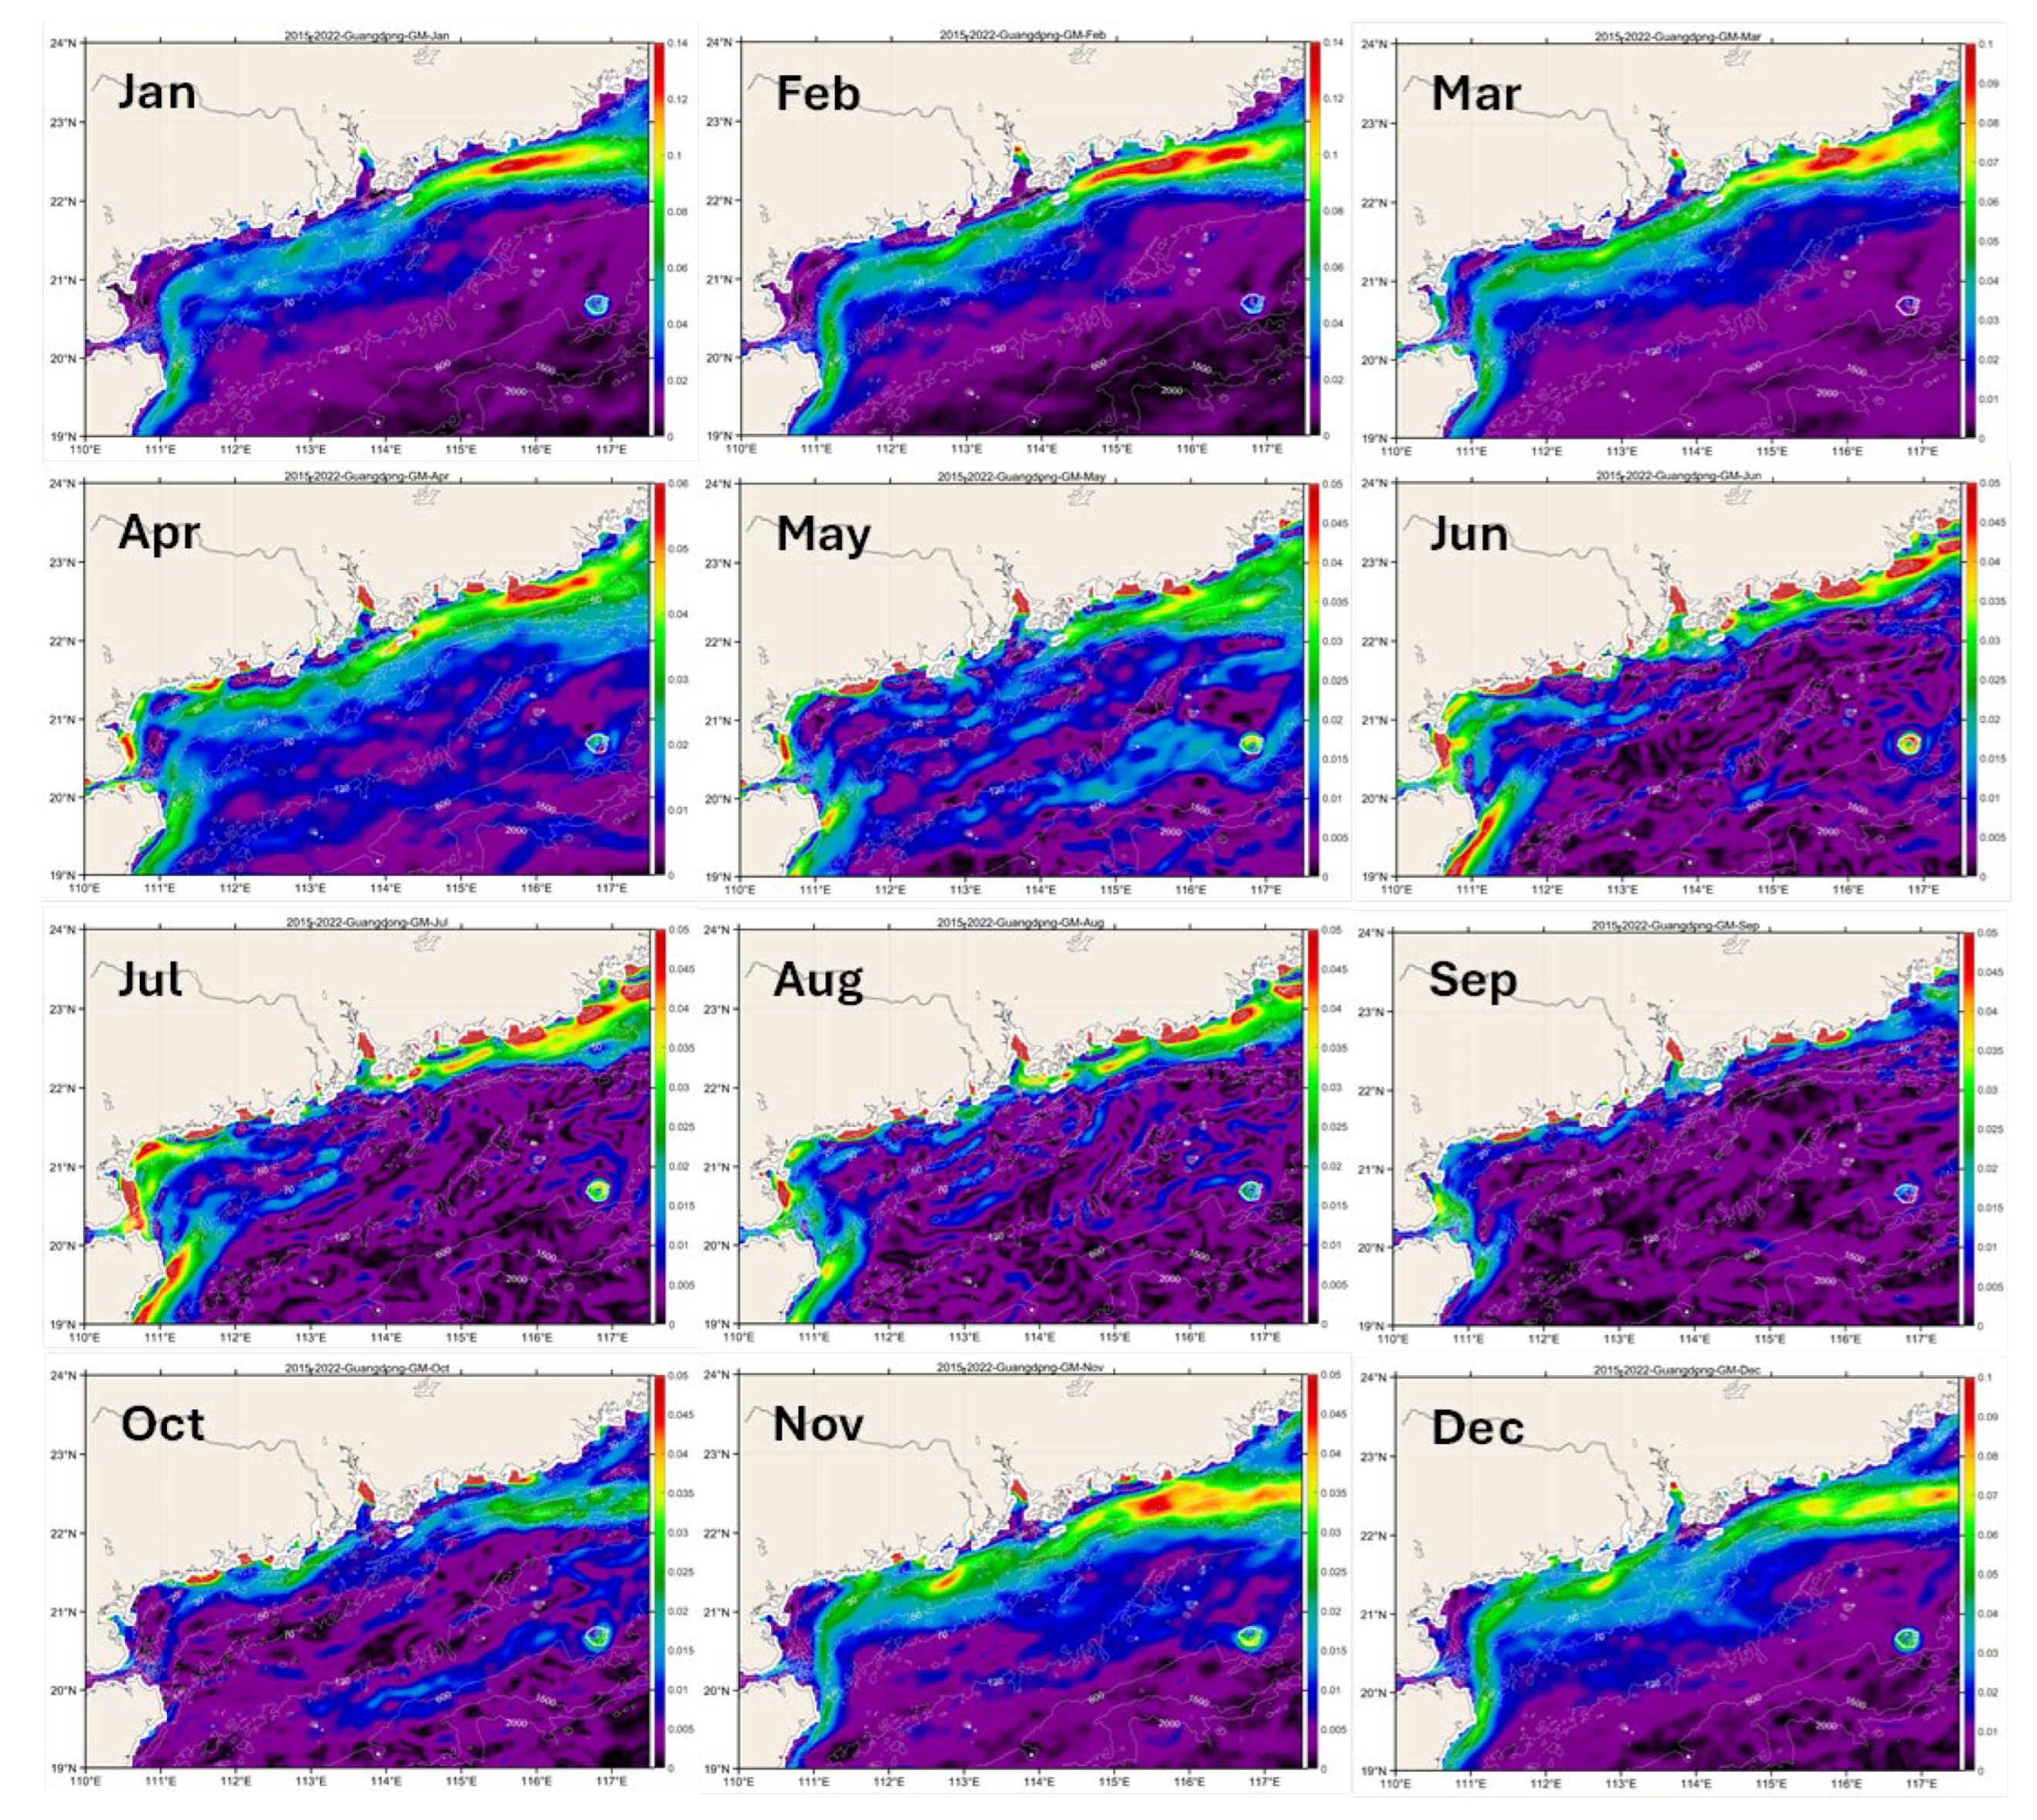
Figure 6.
Long-term mean monthly maps of GM (°C/km) in Region 3 (with custom color scales).
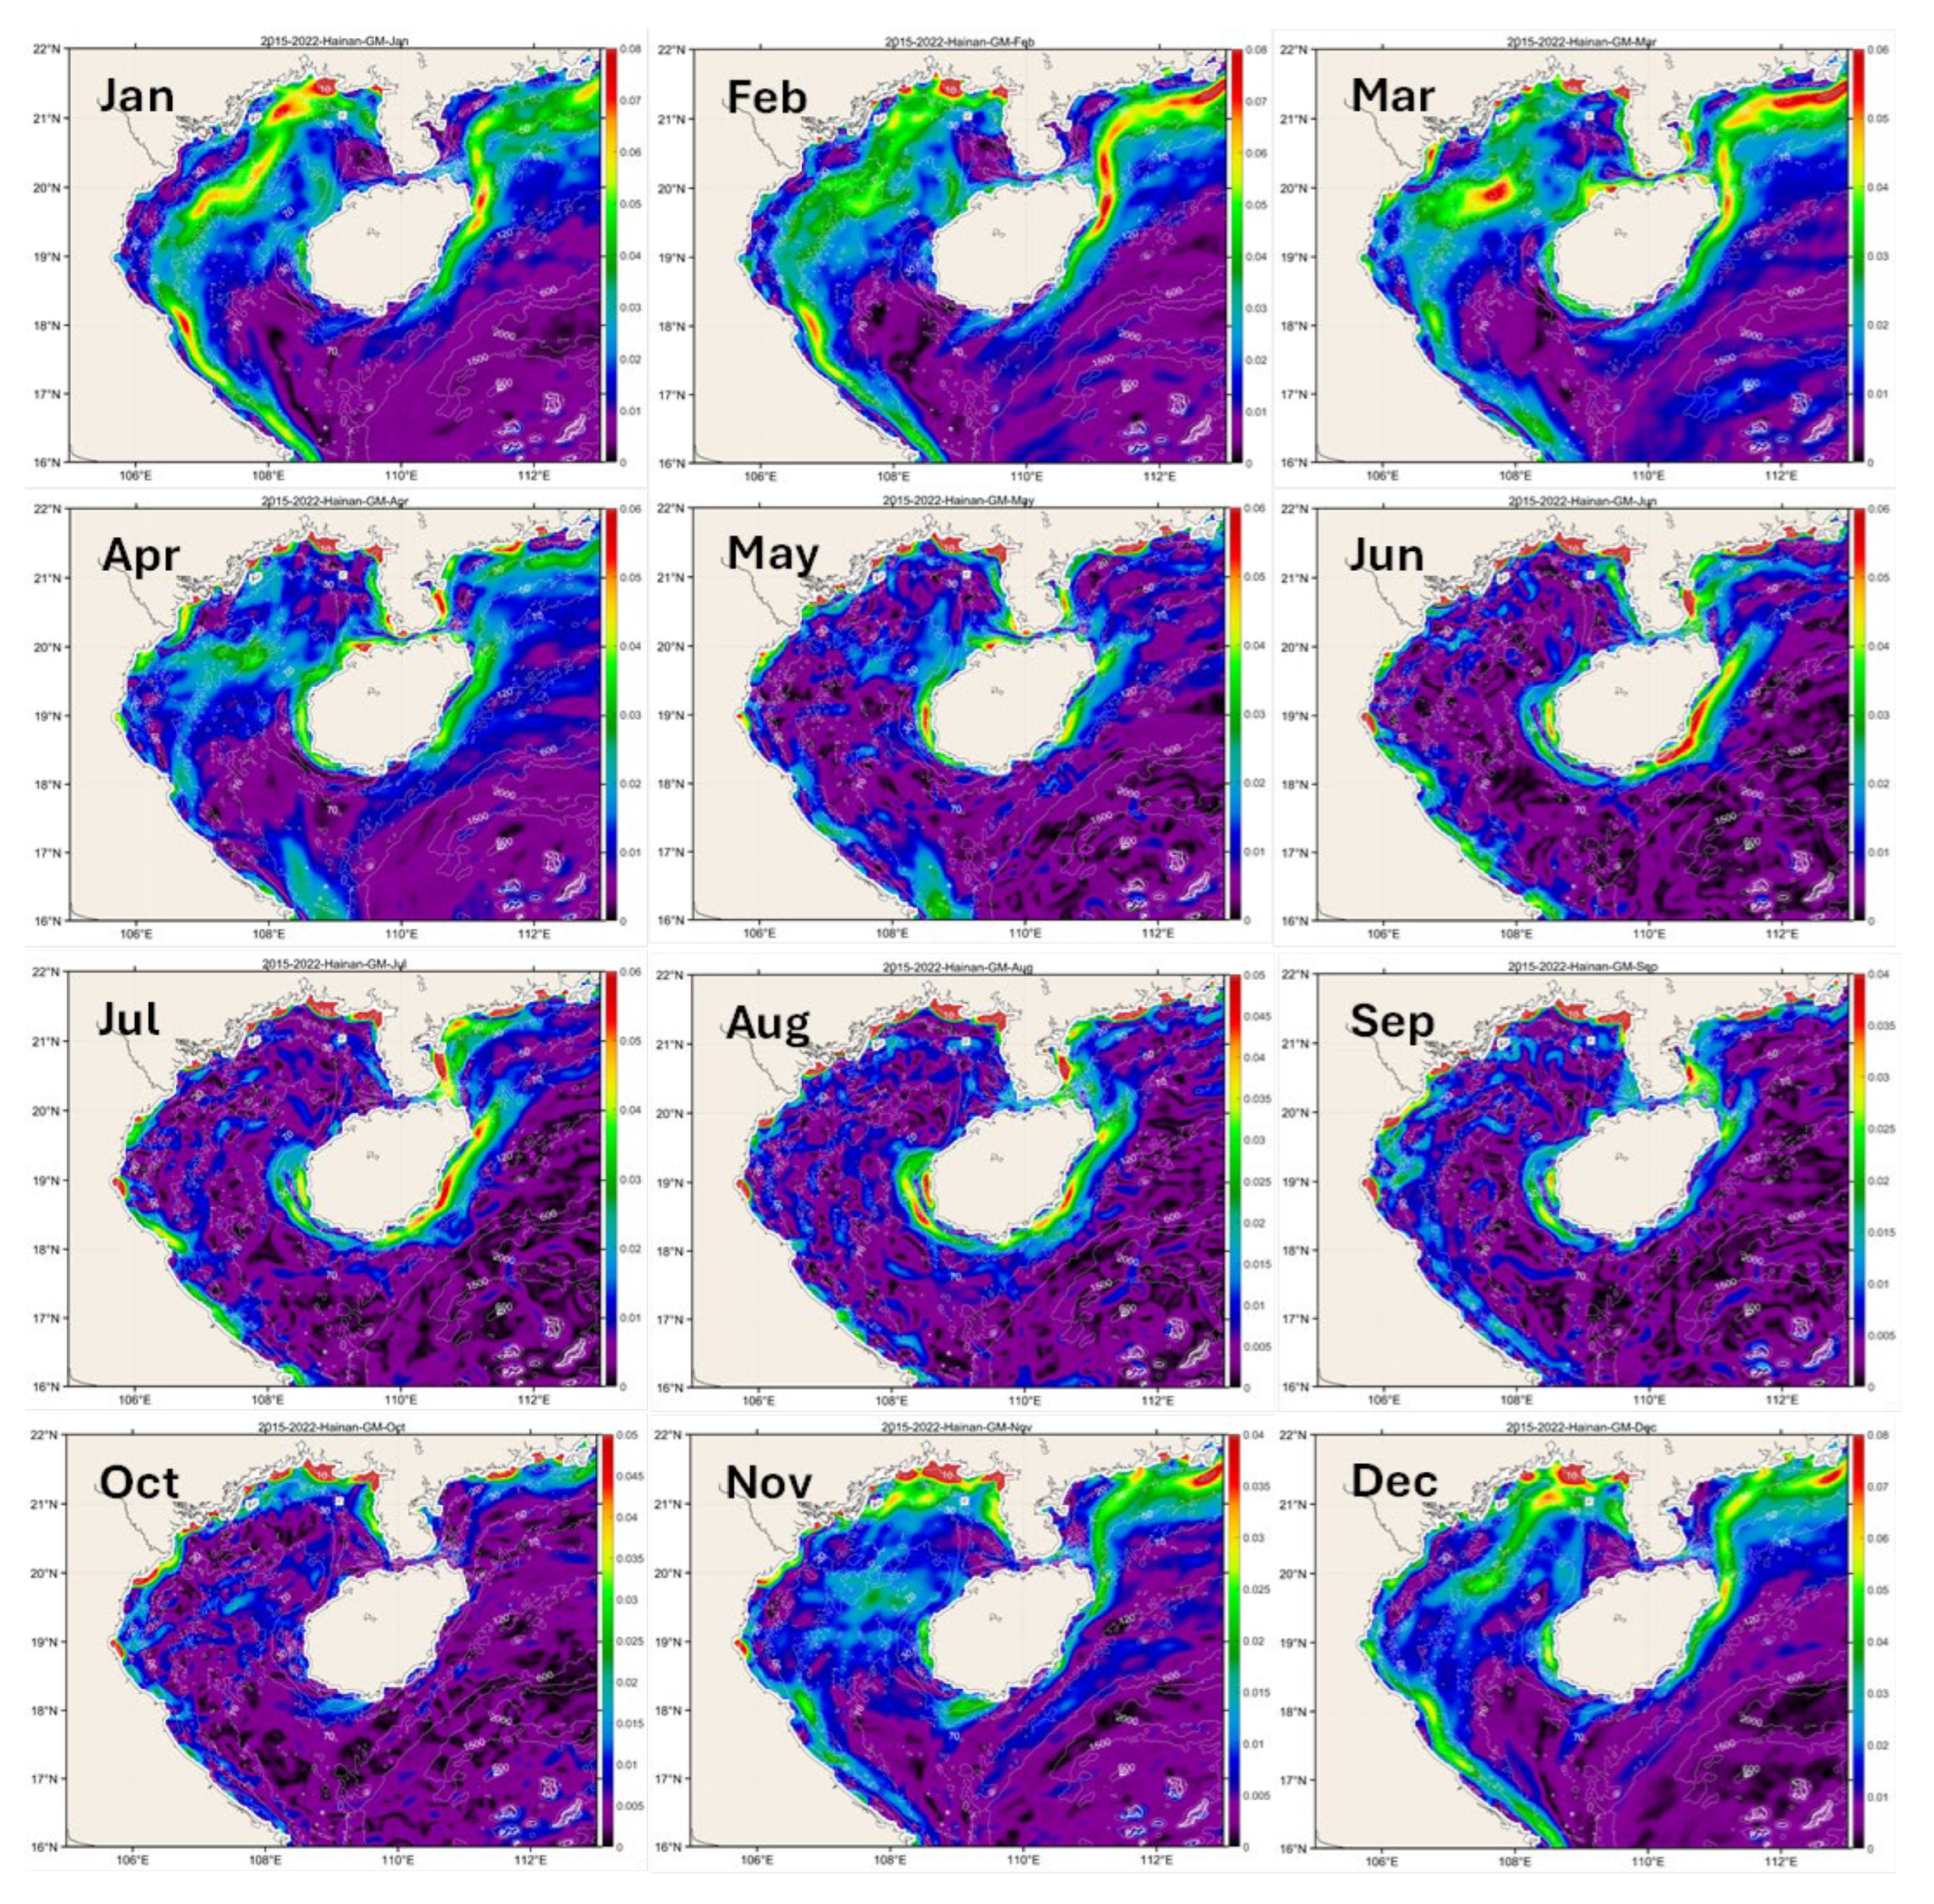
Figure 7.
Long-term mean monthly maps of GM (°C/km) in Region 4 (with custom color scales).
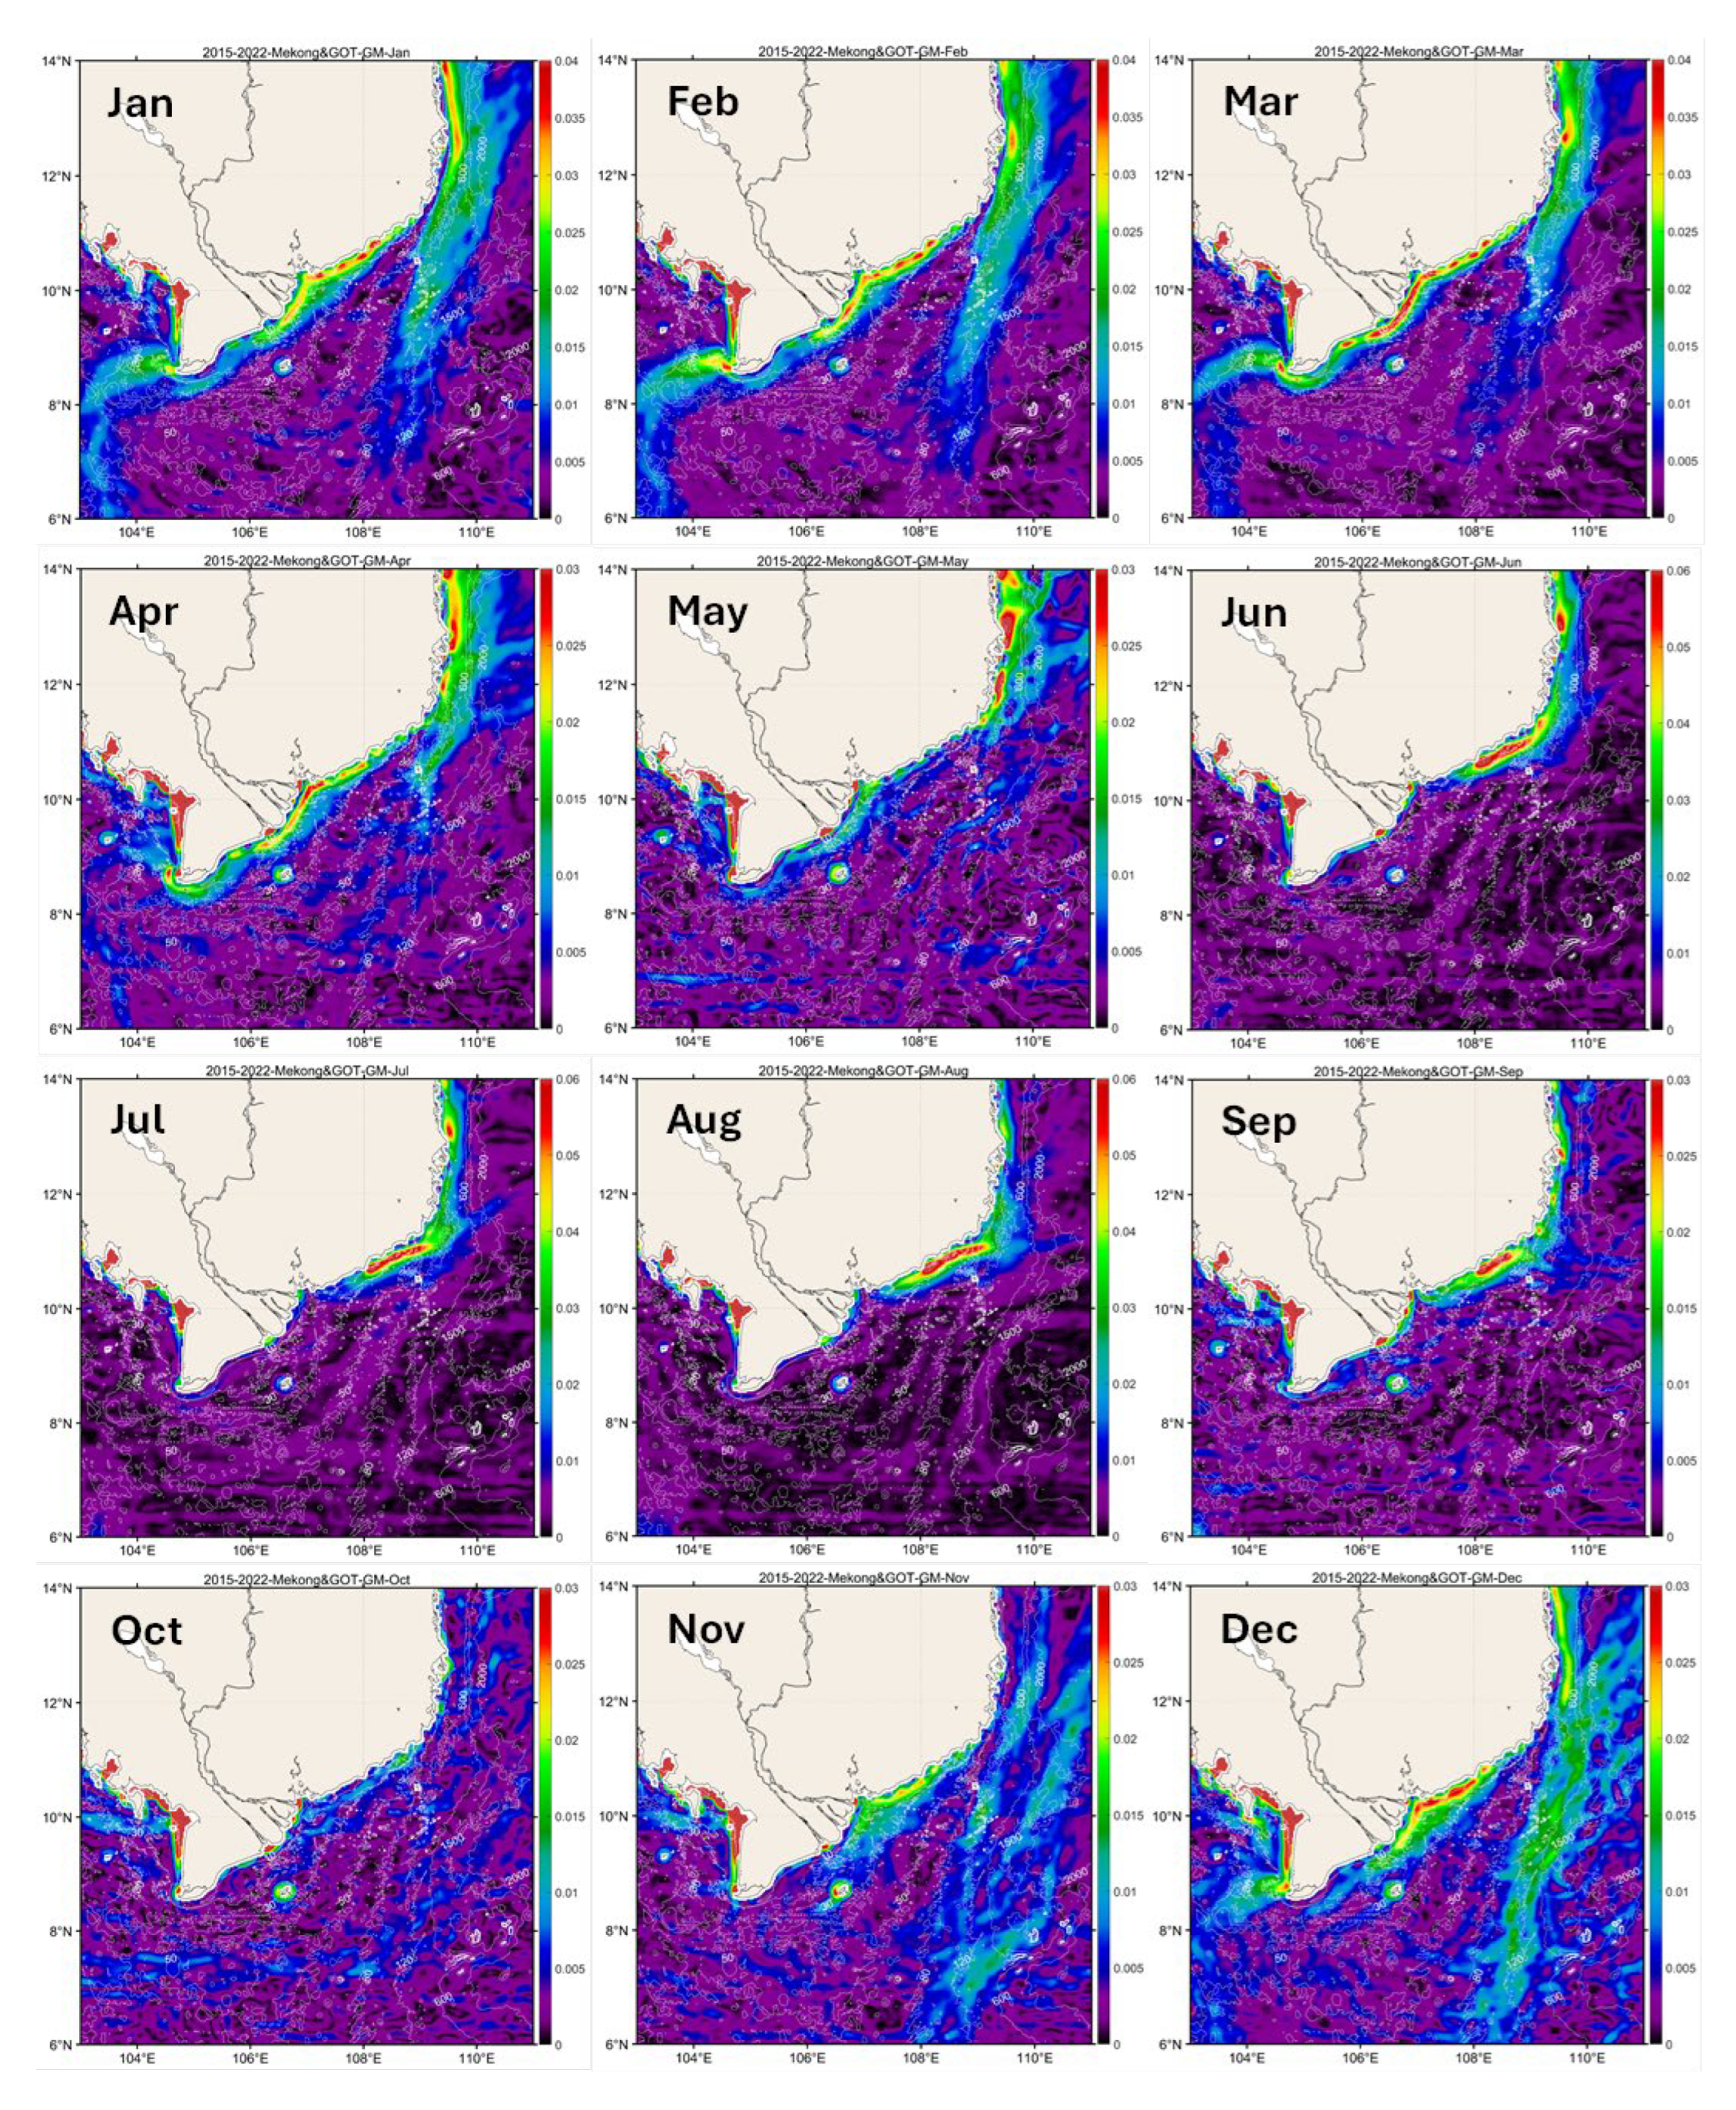
Figure 8.
Long-term mean monthly maps of GM (°C/km) in Region 5 (with custom color scales).
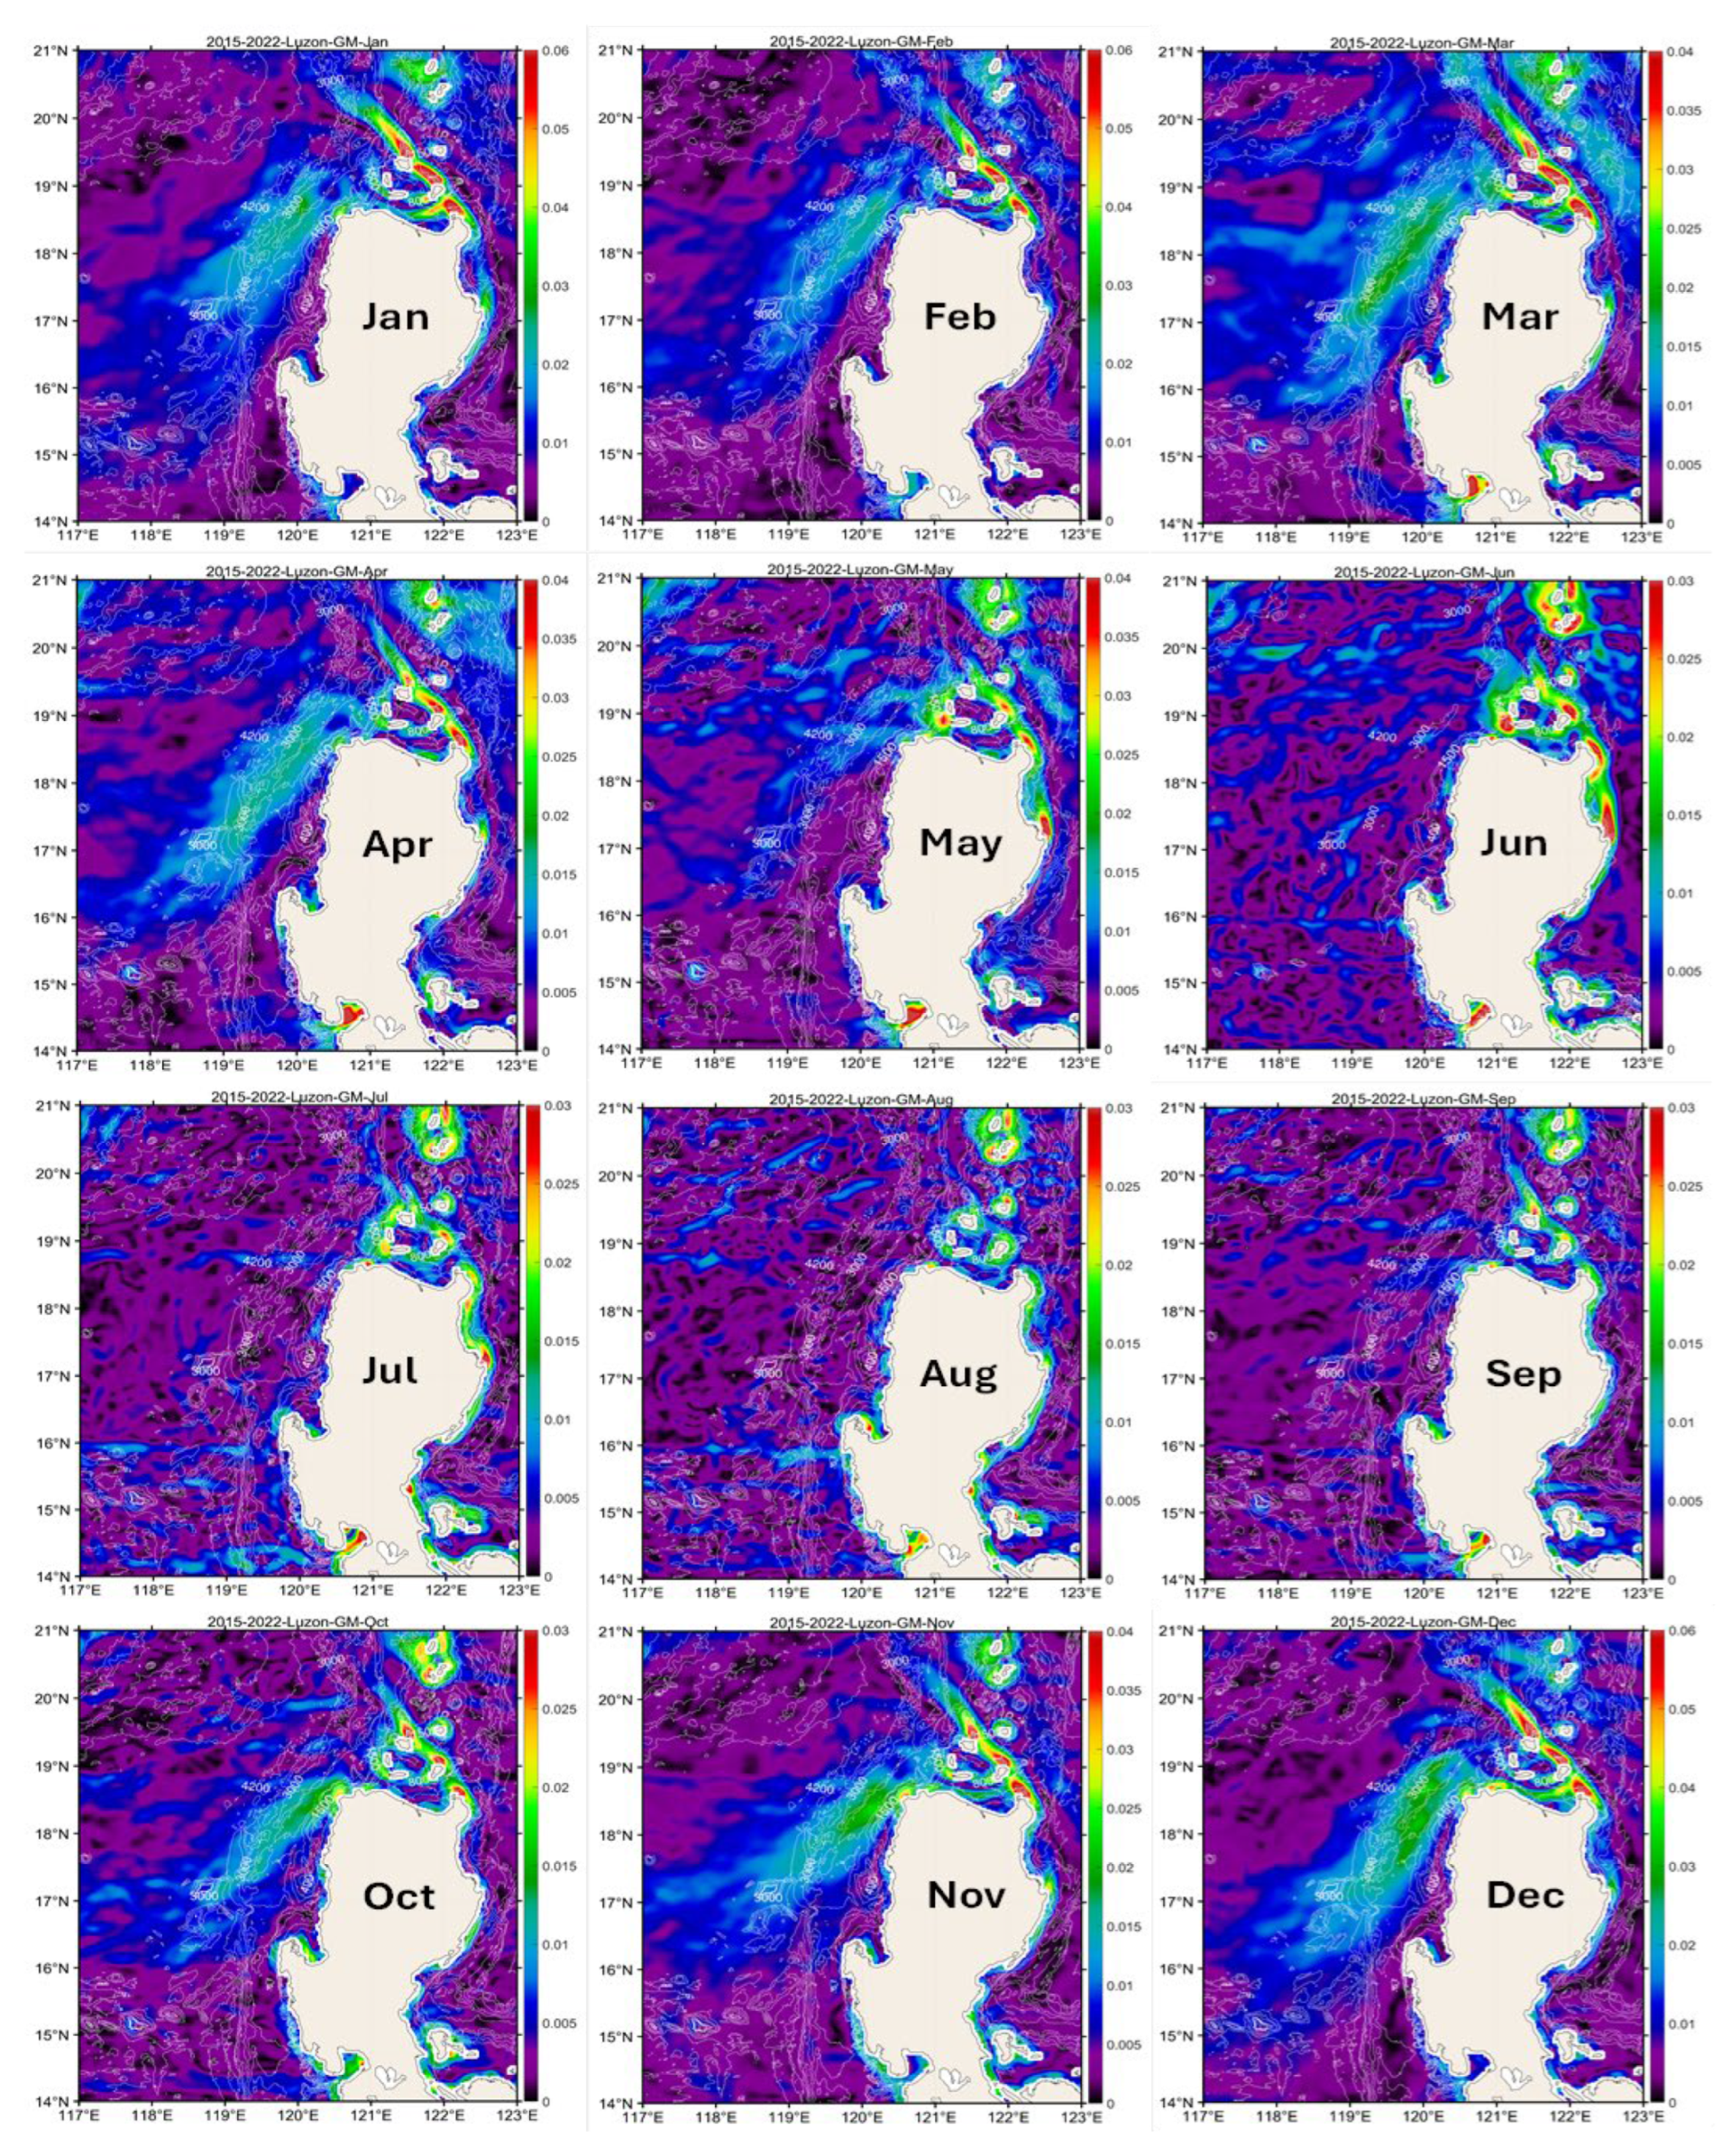
Figure 9.
Five-day mean maps of SST (°C) showing the most pronounced summertime eastward jets in June-September 2015-2022 (with custom color scales).
Figure 9.
Five-day mean maps of SST (°C) showing the most pronounced summertime eastward jets in June-September 2015-2022 (with custom color scales).
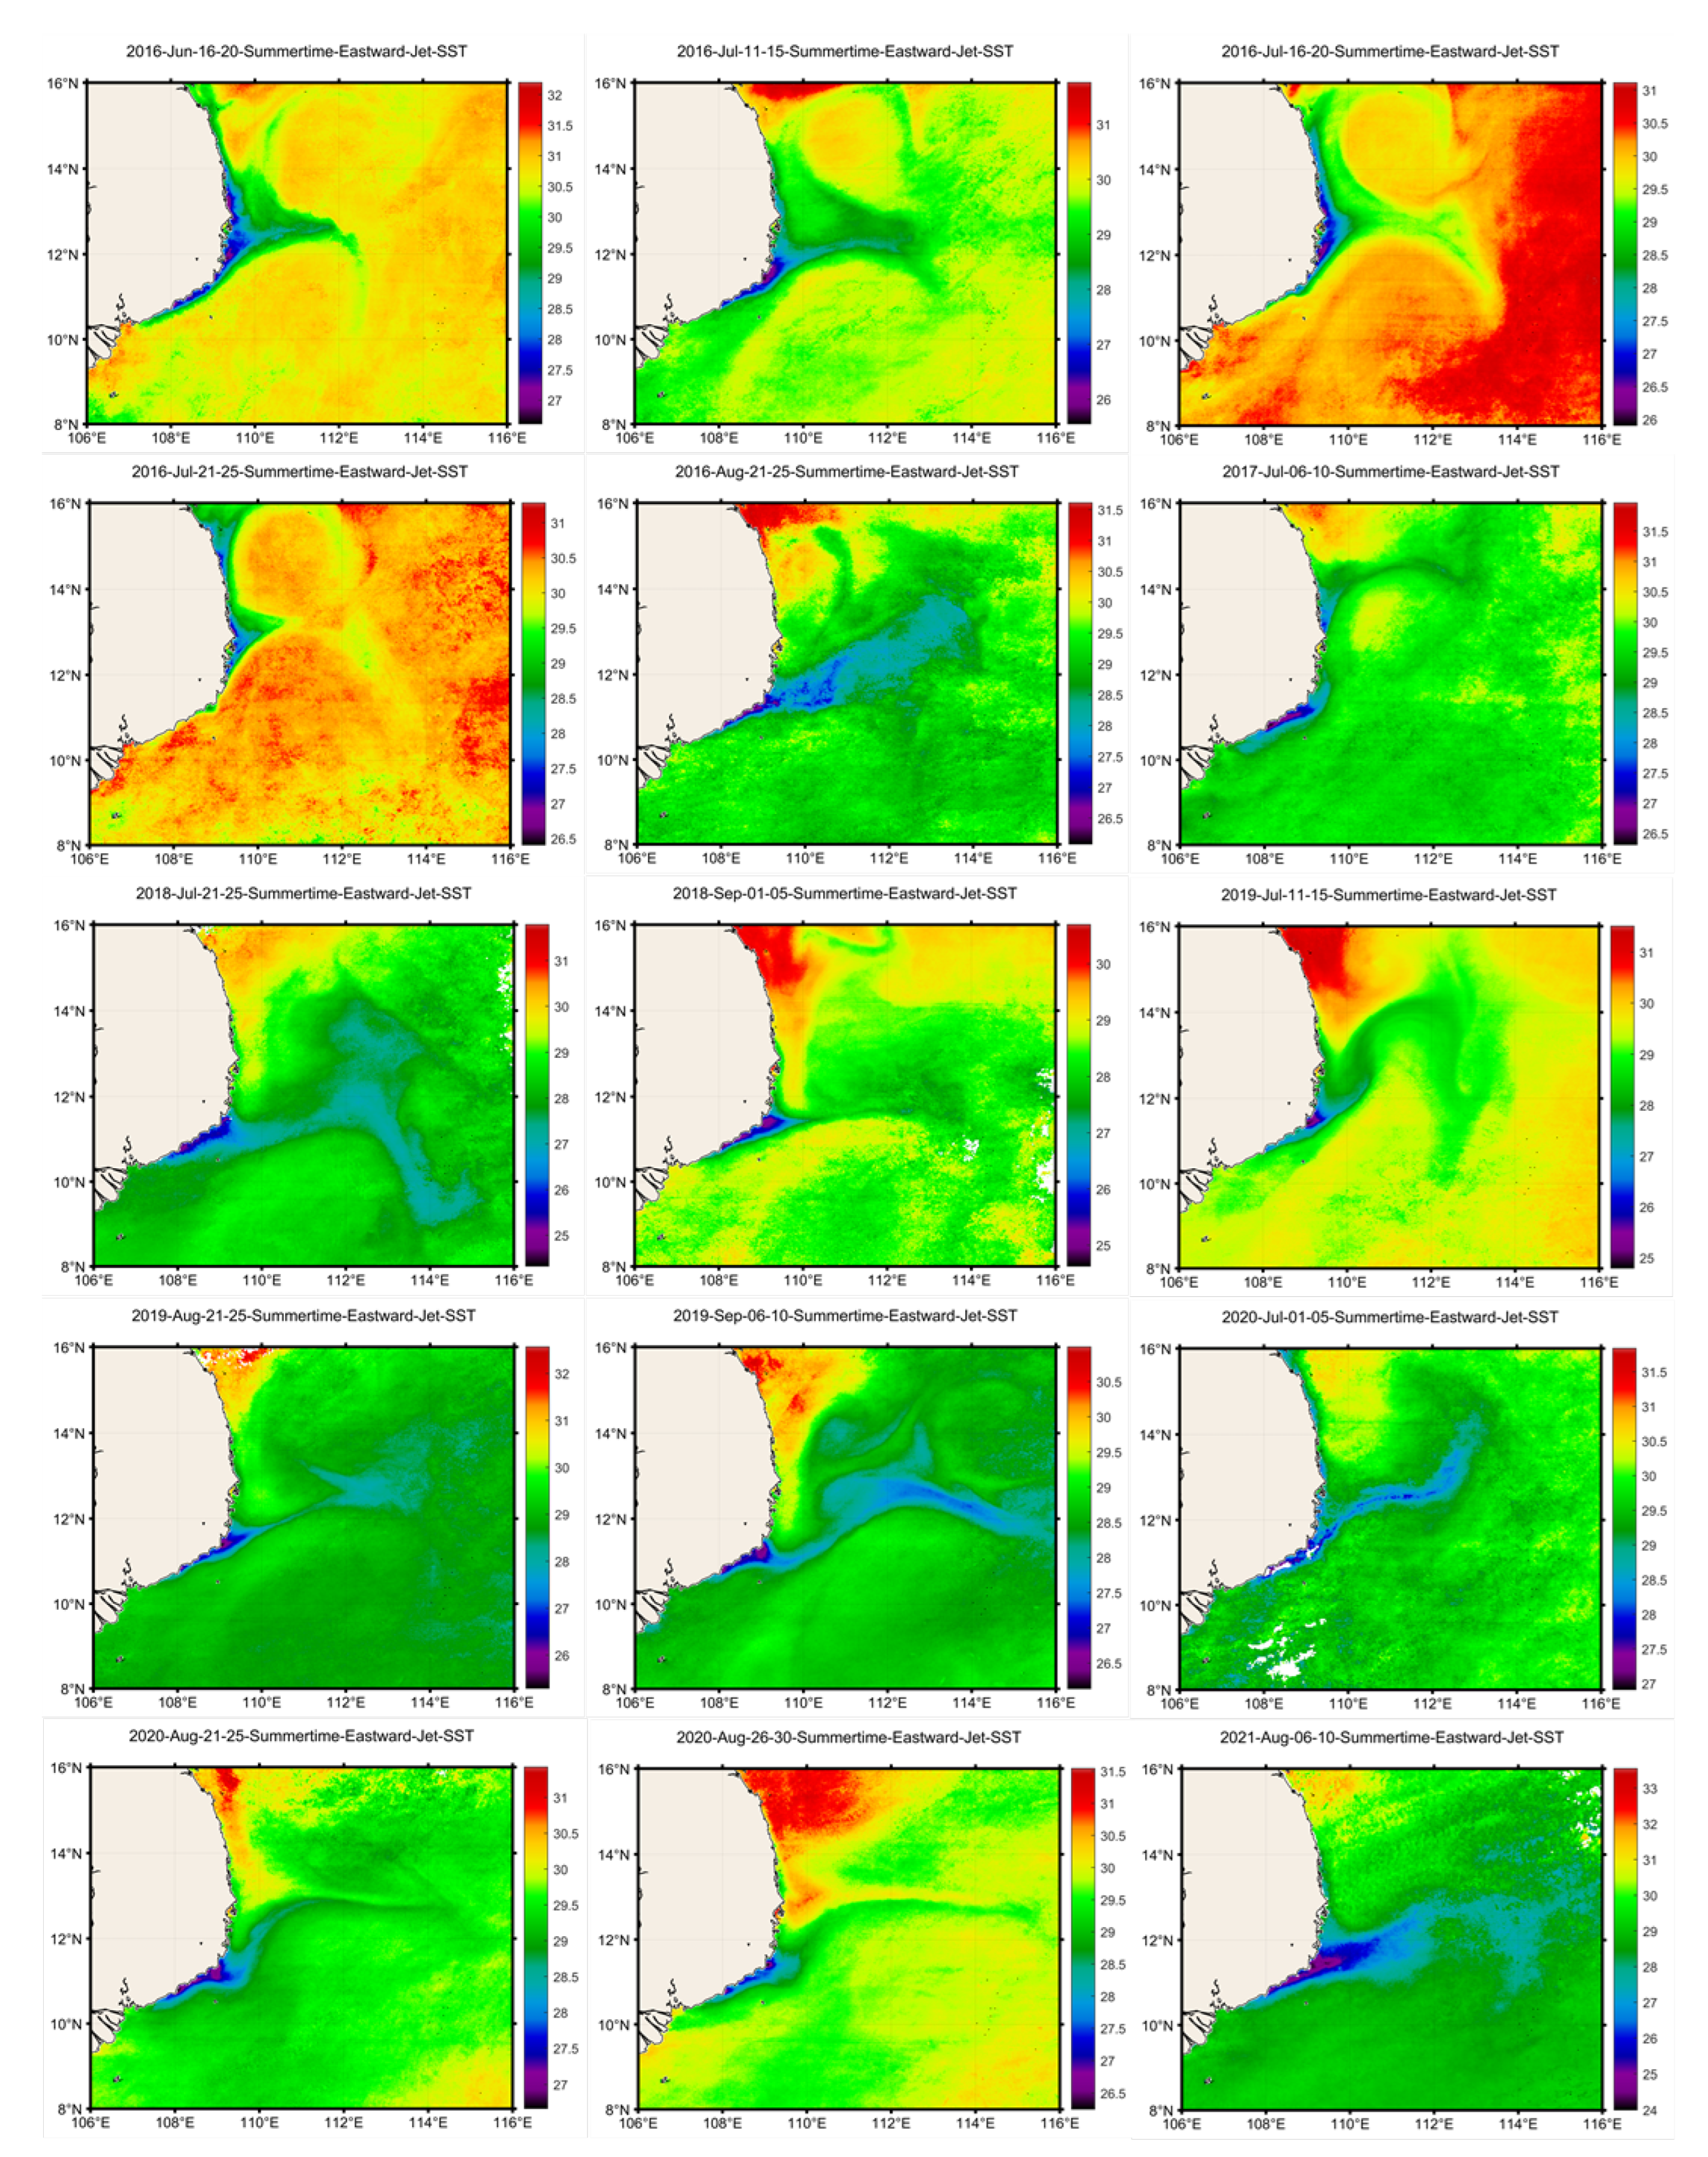
Figure 10.
Summertime eastward jet in five-day mean maps of SST (top left) and GM (top right) during 16-20 June 2016. Vertical lines along 111.5°E mark the location of cross-jet distributions of SST and GM (bottom). The cross-jet distribution of SST is symmetrical and V-shaped, which is typical of most cases when a well-developed SEJ was observed (38 cases in 2015-2022).
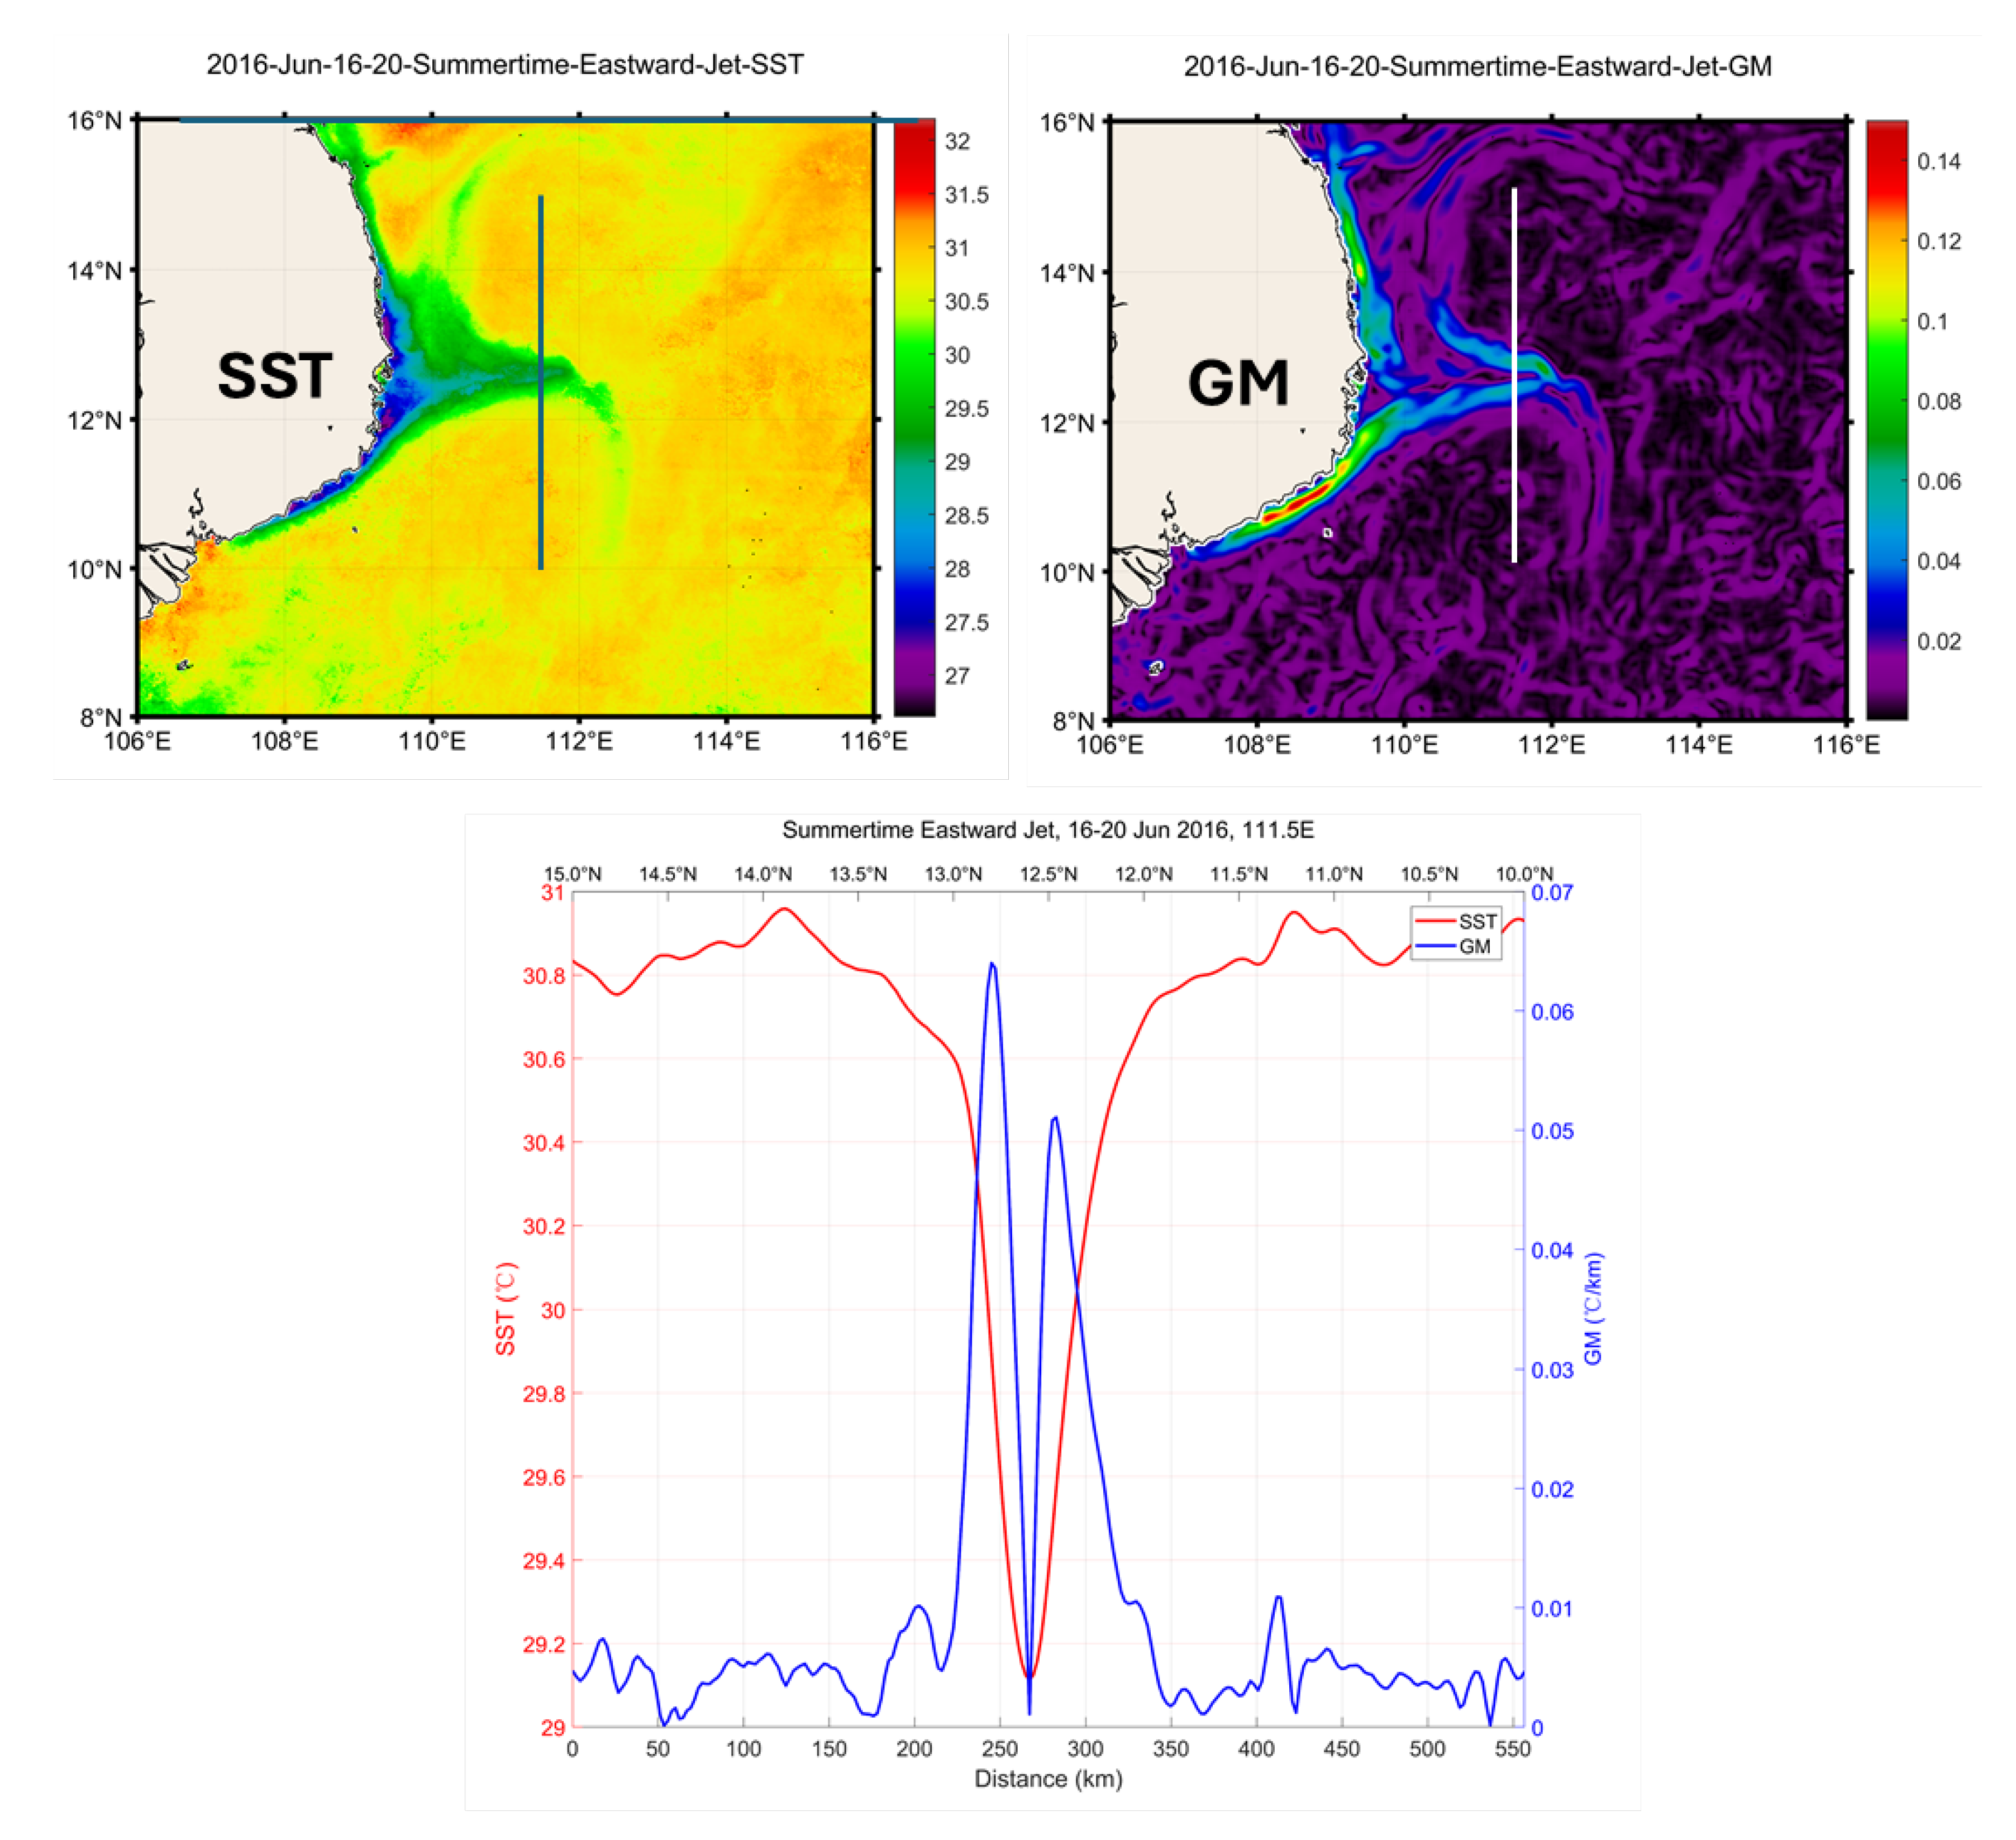

Table 1.
Satellite studies of SST fronts in the South China Sea. Place names: SCS, South China Sea; NSCS, Northern SCS; TS, Taiwan Strait. Algorithms and datasets: BOA2009, Belkin and O’Reilly (2009); CCA1992, Cayula and Cornillon (1992); CW2014, Castelao and Wang (2014); PH2010, Pi and Hu (2010); S2005, Shimada et al. (2005); W2020, Wang YT et al. (2020) (combination of Canny (1986), Castelao and Wang (2014), and Wang YT et al. (2015) algorithms); G1SST, Global 1-km SST; OISST, Optimum Interpolation SST; OSTIA, Operational SST and Sea Ice Analysis. Asterisk (*): AVHRR, MODIS, and AMSR-E data merged. Other acronyms: GM, Gradient magnitude; NA, Not Available.
| Reference | Data | Period | Algorithm | Region |
| Belkin and Cornillon 2003 | AVHRR | 1985-1996 | CCA1992 | SCS |
| Belkin and Cornillon 2007 | AVHRR | 1985-1996 | CCA1992 | SCS |
| Belkin et al. 2009 | AVHRR | 1985-1996 | CCA1992 | SCS |
| Belkin and Zang (this study) | AHI | 2015-2022 | BOA2009 | SCS |
| Chang Y et al. 2006 | AVHRR | 1996-2005 | S2005 | TS |
| Chang Y et al. 2008 | AVHRR | 1996-2005 | S2005 | TS |
| Chang Y et al. 2010 | AVHRR | 2001-2007 | S2005 | NSCS |
| Chang Y et al., 2022 | OSTIA | 1985-2017 | BOA2009 | Luzon Strait |
| Chen JY and Hu ZF 2023 | GHRSST | 2002-2021 | S2005 | NSCS |
| Dong and Zhong 2020 | AVHRR MODIS |
2009-2012 | GM | NSCS |
| Guo L et al. 2017 | G1SST | 2003-2013 | BOA2009 | NW of Luzon Island |
| Hu JY et al. 2003 | AVHRR | 1997-2003 | NA | Hainan I.; Beibu Gulf |
| Jing ZY et al. 2015 | OSTIA | 2006-2013 | GM | NSCS |
| Jing ZY et al. 2016 | GHRSST | 2006-2014 | GM | NSCS |
| Lan KW et al. 2009 | AVHRR | 1996-2005 | S2005 | TS |
| Lao QB et al. 2023 | OSTIA | 1982-2021 | BOA2009 | Luzon Strait |
| Lee MA et al. 2015 | AVHRR | 1996-2009 | S2005 | TS |
| Pi and Hu 2010 | Misc.* | 2002-2008 | PH2010 | NSCS |
| Ping et al. 2016 | MODIS | 2000-2013 | CCA1992 | TS |
| Ren et al. 2021 | Model | 2005-2018 | Canny (1986) | SCS |
| Shi R et al. 2015 | OSTIA | 2006-2011 | GM | NSCS |
| Sun RL et al. 2015 | OISST | 1993-2013 | GM | West of Luzon Island |
| Sun RL et al. 2024 | OISST | 1993-2022 | GM | West of Luzon Island |
| Wang DX et al. 2001 | AVHRR | 1991-1998 | GM | NSCS |
| Wang DX et al. 2003 | AVHRR | 1991-1998 | GM | Beibu Gulf |
| Wang TH et al. 2023 | GHRSST | 2005-2019 | BOA2009 | SCS |
| Wang YC et al. 2013 | AVHRR | 2006-2009 | S2005 | TS |
| Wang YC et al. 2018 | AVHRR | 2005-2015 | S2005 | TS |
| Wang YT et al. 2020 | MODIS | 2002-2017 | W2020 | NSCS |
| Xing QW et al. 2023 | AVHRR | 1982-2021 | CCA1992 | China Seas |
| Yang CY and Ye HB 2021 | MODIS | 2003-2017 | NA | NSCS |
| Yu Y et al. 2019 | MODIS | 2002-2017 | GM | SCS |
| Zeng XZ et al. 2014 | MODIS | 2002-2011 | BOA2009 | East Hainan |
| Zhang L et al. 2024 | OISST | 1982-2021 | GM | Gulf of Thailand |
| Zhang L and Dong J 2021 | MODIS | 2016-2017 | GM | NSCS |
| Zhang Y et al. 2021 | OSTIA | 2006-2015 | GM | NSCS |
| Zhao LH et al. 2022 | OISST | 1982-2021 | CCA1992 | China Seas |
| Zhou X et al. 2024 | OSTIA | 1982-2022 | GM | West Guangdong |
Table 2.
Monthly SST and magnitude of summer cooling (July SST minus May SST) in three regions, where the summer cooling appears most pronounced.
Table 2.
Monthly SST and magnitude of summer cooling (July SST minus May SST) in three regions, where the summer cooling appears most pronounced.
| Region |
May SST (°C) |
June SST (°C) |
July SST (°C) |
Cooling magnitude (July SST – May SST) |
| West of Luzon | 30.7093 | 30.3820 | 30.0098 | 0.70 |
| Central SCS | 30.5234 | 29.9536 | 29.4660 | 1.07 |
| Gulf of Thailand | 30.6651 | 29.8138 | 29.5900 | 1.08 |
Disclaimer/Publisher’s Note: The statements, opinions and data contained in all publications are solely those of the individual author(s) and contributor(s) and not of MDPI and/or the editor(s). MDPI and/or the editor(s) disclaim responsibility for any injury to people or property resulting from any ideas, methods, instructions or products referred to in the content. |
© 2025 by the authors. Licensee MDPI, Basel, Switzerland. This article is an open access article distributed under the terms and conditions of the Creative Commons Attribution (CC BY) license (http://creativecommons.org/licenses/by/4.0/).
Copyright: This open access article is published under a Creative Commons CC BY 4.0 license, which permit the free download, distribution, and reuse, provided that the author and preprint are cited in any reuse.


