Submitted:
12 January 2025
Posted:
14 January 2025
You are already at the latest version
Abstract
The present work applies techniques of data science to the "Student Performance Dataset" in finding factors that could predict academic achievement of secondary school students in Portugal. Based on demographics, study habits, parental education, and schools, this research searches for the performance trend and patterns of students. Specific techniques applied for this study were EDA and correlation analysis, predictive modeling of results, therefore, giving actionable insight into how individualized learning strategies could best be improved upon. It is noted that the study time, absenteeism, parents' education, and final grades are all highly correlated. Further, different predictive models on student performance were developed using Linear Regression, Support Vector Regression, and Decision Tree Regression, while the best results in light of R-squared and Mean Squared Error metrics came out for Linear Regression. The hidden message from this study is that interventions should be tailored in education, with data-driven approaches being the need of the hour to increase academic performance. Dealing with outliers, optimization of feature selection, and using a robust preprocessing technique are in tune with the broader objective of equitable and effective educational systems. These findings have practical implications for policymakers, educators, and institutions seeking to implement evidence-based strategies for academic excellence.
Keywords:
data science
; academic outcomes
; machine learning
; predictive modeling
; educational analytics
1. Introduction
In a world increasingly dominated by data-driven decision-making, educational institutions have started exploring the potential of data science to revolutionize student outcomes. By systematically analyzing patterns in student performance data, schools, colleges, and universities are able to garner actionable insights aimed at improving academic success. Data-driven approaches have been indispensable in addressing issues related to student absenteeism, ineffective study habits, and insufficient parental involvement. According to Nguyen et al. (2021), data analytics in education not only helps in identifying performance determinants but also supports personalized learning strategies tailored to the needs of each student [2,3].
This study uses the "Student Performance Dataset," obtained from the UCI Machine Learning Repository, to analyze the major factors that determine the academic performance of secondary school students in Portugal. The dataset contains a broad set of attributes, from demographic data to parental education and study habits. This research uses exploratory data analysis, EDA, correlation analysis, and predictive modeling to draw actionable insights that could improve student results. Previous works shown the potential of predictive analytics for improving education by offering data-driven interventions [4,5,6].
The general objective of this work is to illustrate how data science techniques can contribute to building evidence-based strategies for personalized learning. From identifying trends to outliers, this study further contributes to fostering an inclusive and equitable educational system in ways that optimize academic outcomes [7].
1.1. Background and Business Goal
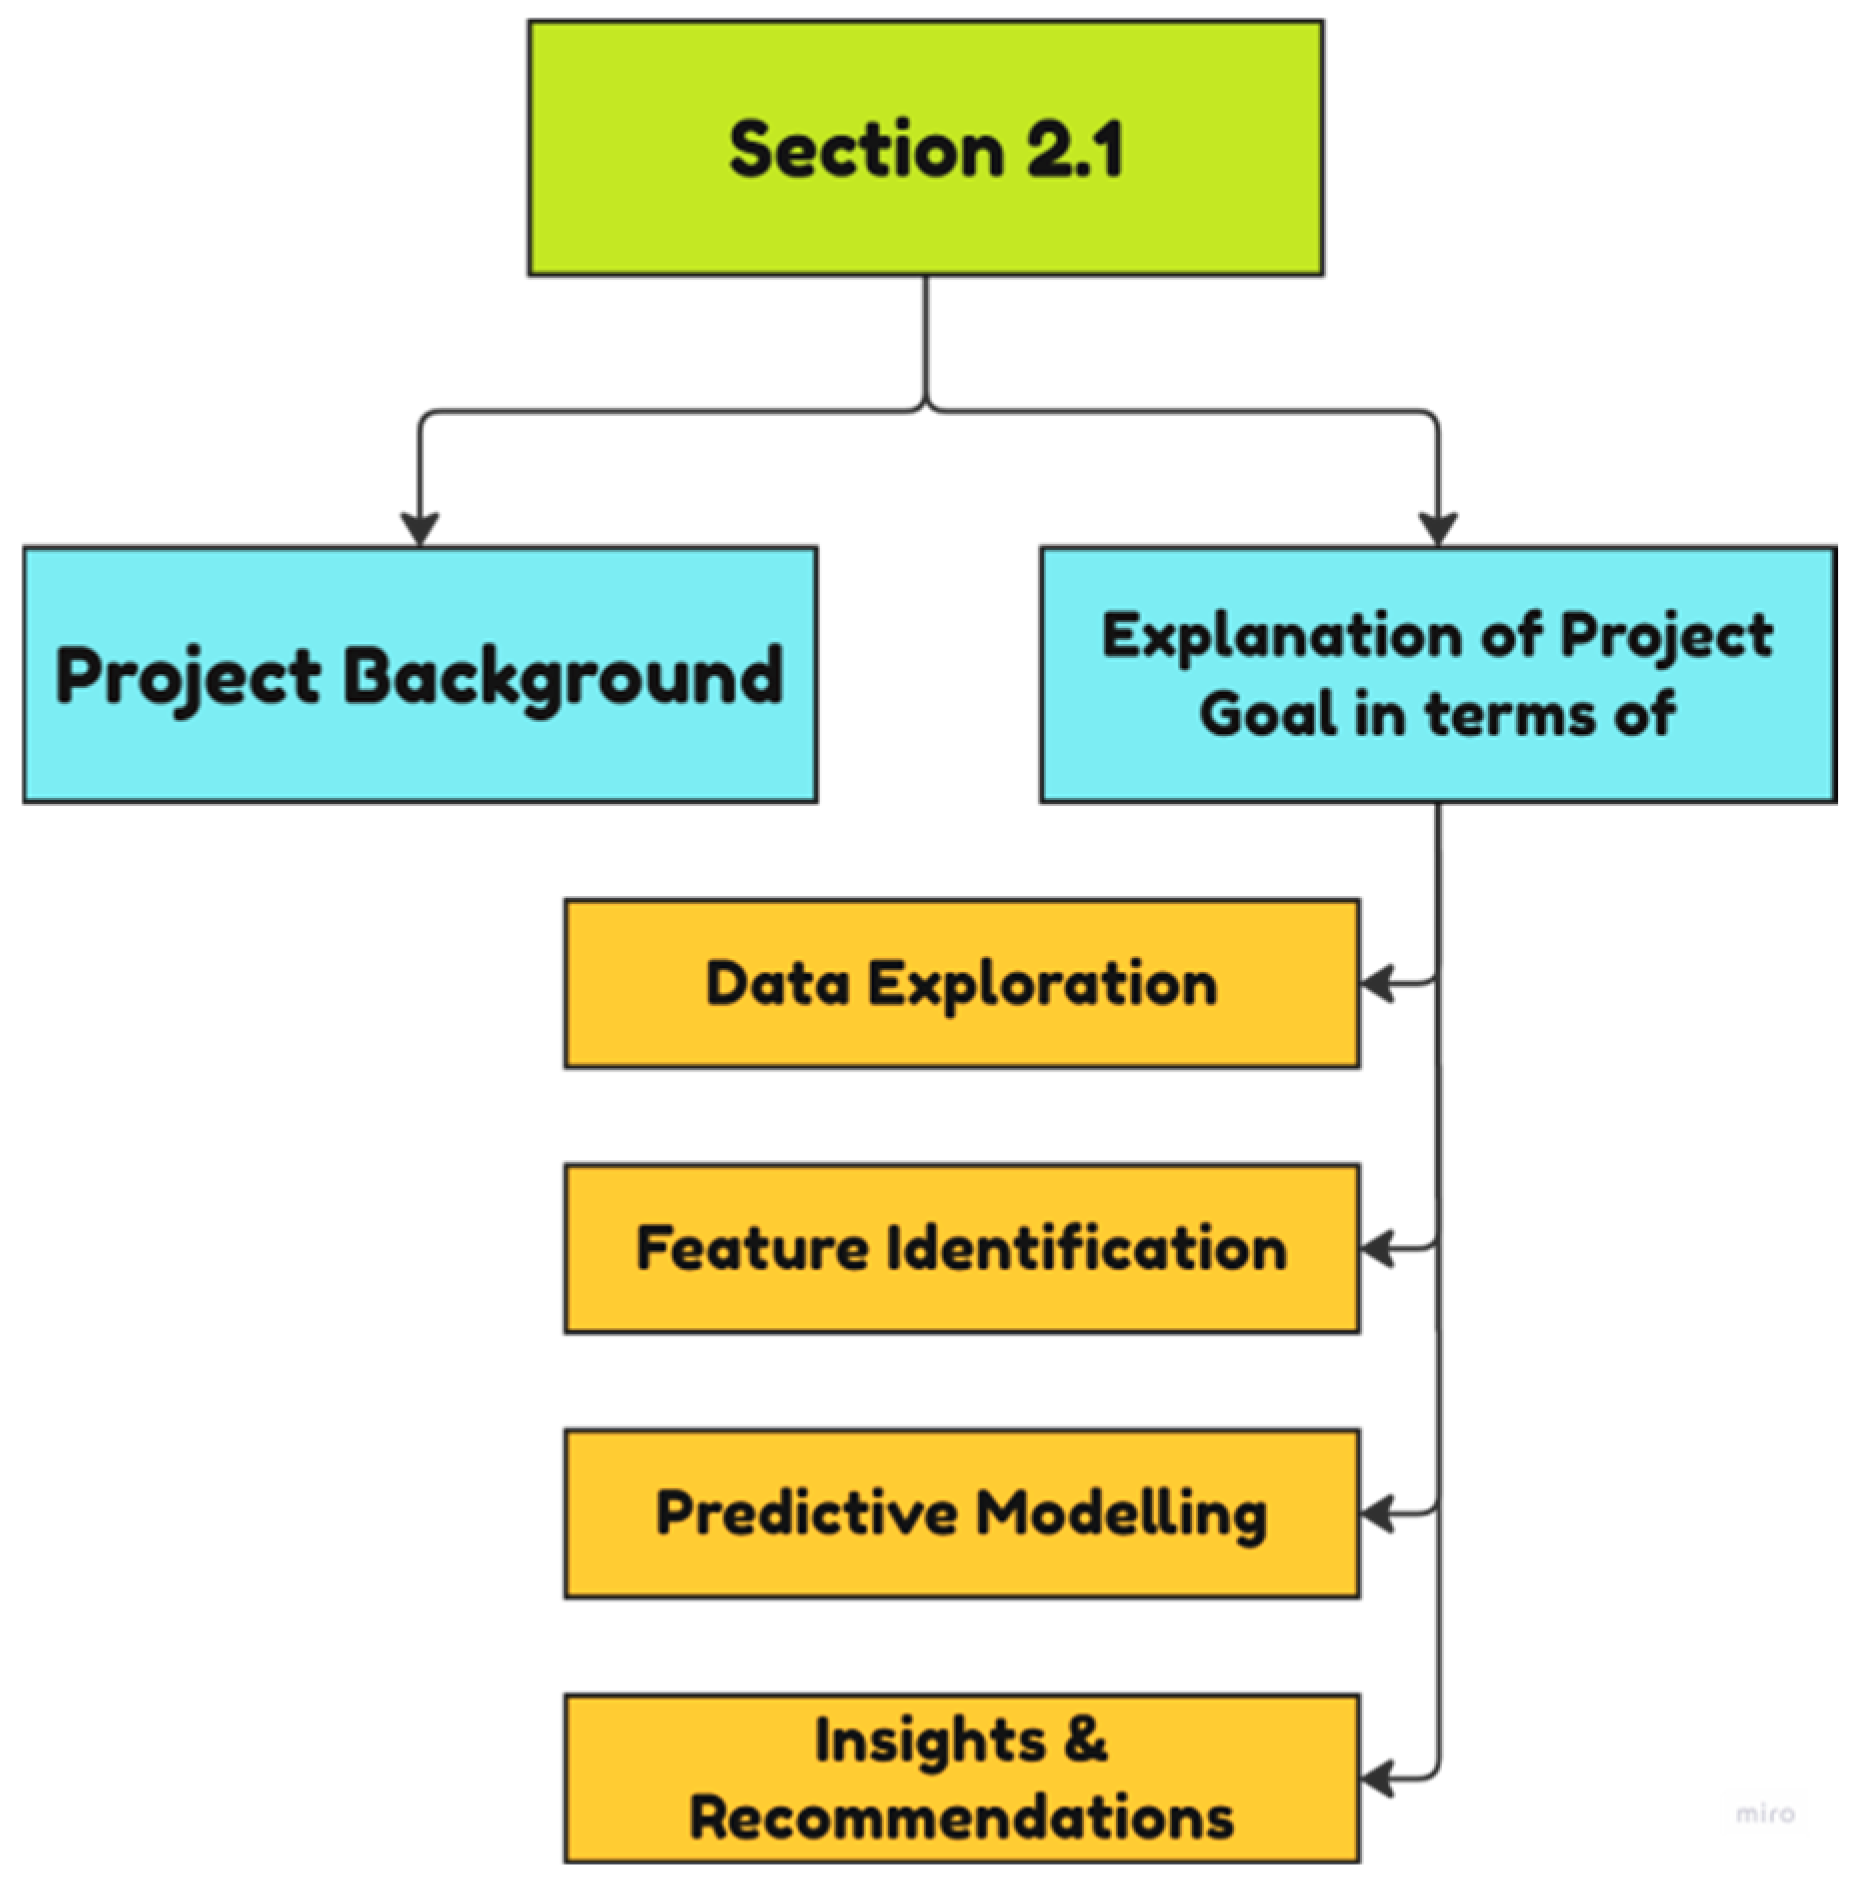
This section discusses the Background of our project as to why we have done it in the first place and what are our motivations behind it and what we expect this project to achieve.
Figure 1.
Diagram oversimplifying the topics discussed in this section.
In the last few years, a number of organizations in different sectors have been adopting data analytics and data science to optimize operations for better outcomes. More than ever before, the education sector has realized the transformative potential of these technologies. Schools, colleges, and universities are using data to make informed decisions that improve student performance. Through financial and family background information, study habits, and academic performances, it helps institutions identify areas of difficulty and problems in meeting students' needs for successful academic pursuits [8,9,10,11,12].
The use of data science in education can be implemented using the Student Performance Dataset, which provides detailed information on secondary school students in Portugal. It consists of variables concerning academic grades, study time, parents' education level, and other related school variables. From our analysis, the focus is to identify patterns and trends from which improvement in academic performance strategies will be suggested. Apart from these, the project has identified some students who needed academic support; it also revealed that some factors had made students become outstanding-for example, good learning skills are promoted when students have more time for constant study [13,14,15,16,17,18]. Individualization of study plans involves tailoring a student's personal needs according to needs in most the developed world countries. It will thus be of essence to realize the different things affecting or influencing a student's performance academically. At this respect, personalized learning allows for appropriate interference necessary to have a boost for those who would be performing low and for enhancing the academic culture within this environment [19]. The main objective of the research work is to employ data science to extract from this dataset actionable insights, which would facilitate developing strategic and personalized study plans that help raise academic performance. The recommendations on the use of data in decision-making developed in this report support the contributions an educational institution will make to improving quality education for the facilitation of meeting diversified students' needs toward inclusive and effective education [20,21,22]. Future studies on leveraging data science to enhance academic outcomes can draw inspiration from diverse applications of machine learning models in fields such as cybersecurity and healthcare [23,26]. Approaches like sentiment classification and prediction using deep learning techniques [24,25] could further strengthen educational data analytics. Moreover, advancements in IoT and big data can offer new opportunities for optimizing learning systems [27,28,29]. Integrating secure coding practices [31,32] and anomaly detection techniques [30], [33] may also help improve the reliability of educational outcome predictions.
1.2. Project Goal
Academic achievement is one of the cornerstones of educational quality and societal advancement. Understanding those factors that influence students' academic performance allows for the instigation of evidence-based strategies for improvement in outcomes. The present study attempts to analyze the Student Performance Dataset with a view to identifying those factors significant in influencing students' final grades. The findings will provide actionable recommendations to enhance academic performance for the benefit of students by offering a clearer understanding of the challenges they face and potential paths forward.
1.2.1. Data Exploration
Data exploration is the deep investigation of the dataset in order to understand the structure, content, and distribution of features within it. This helps in the identification of patterns and relationships among variables that could lead to anomalies or outliers that may affect the analysis. Key characteristics such as students' study habits, family backgrounds, and school environments are analyzed to provide a foundation for meaningful insights.
1.2.2. Feature Identification
Feature identification searches for the most influential variables that will determine students' academic performances. Among the variables analyzed, study habits, parental involvement, economic background, and school environment show a correlation that will help predict final grades and thus intervene with proper guidance and academic support.
1.2.3. Predictive Modeling
It includes the development of machine learning models that can predict the final grade of students based on their characteristics. Such models should be robust and reliable, yielding realistic estimates of student academic outcomes. Various models were tried in order to establish which one would best suit this set of data.
1.2.4. Insights and Recommendations
The analysis aims to identify key themes that inform educational strategies and developmental initiatives. These insights will guide evidence-based recommendations for improved teaching methods, targeted support programs, and policy changes. This project seeks to create a more effective and supportive learning environment by addressing the elements influencing student performance.
2. Data Set Description
The dataset used in this study is the Student Performance Dataset sourced from the UCI Machine Learning Repository. Famous for educational research and analytics, this dataset is a good determinant of parameters influencing academic performance among high school students in Portugal. The entire dataset encompasses 395 records of each of the individual students that portray 33 different attributes. The attributes include demographics, parental education level, study habits, school-related variables, and grades, thus providing a rich source for analyzing the dynamics involved in student achievement.
Although all the characteristics present in the dataset are mostly categorized as either numerical or categorical, those numerical ones include the most important ones: student age, school absences, final grades (G3, G2), and first period grades (G1). Others like parental level of education and travel time are agglomerated as ranges. Categorical attributes include the sex of the student, the type of school-aiding activities, and other similar characteristics. The combined information of all these attributes gives sufficient knowledge regarding the factors affecting student performance.
Some columns were deemed irrelevant to the objectives of the project and were removed during preprocessing. The removal of unimportant features means there is great alignment between the remaining attributes and the goals of this analysis. With this approach of focusing on imperative features and clearing data quality, this dataset is a bonanza for unearthing patterns in student performance and relationships without any fears of being too less to be evident. The dataset now befriends targeted analysis, thus leading to the provision of actionable insights to effect changing educational outcomes.
Figure 2.
Diagram illustrating the key topics discussed in this section.
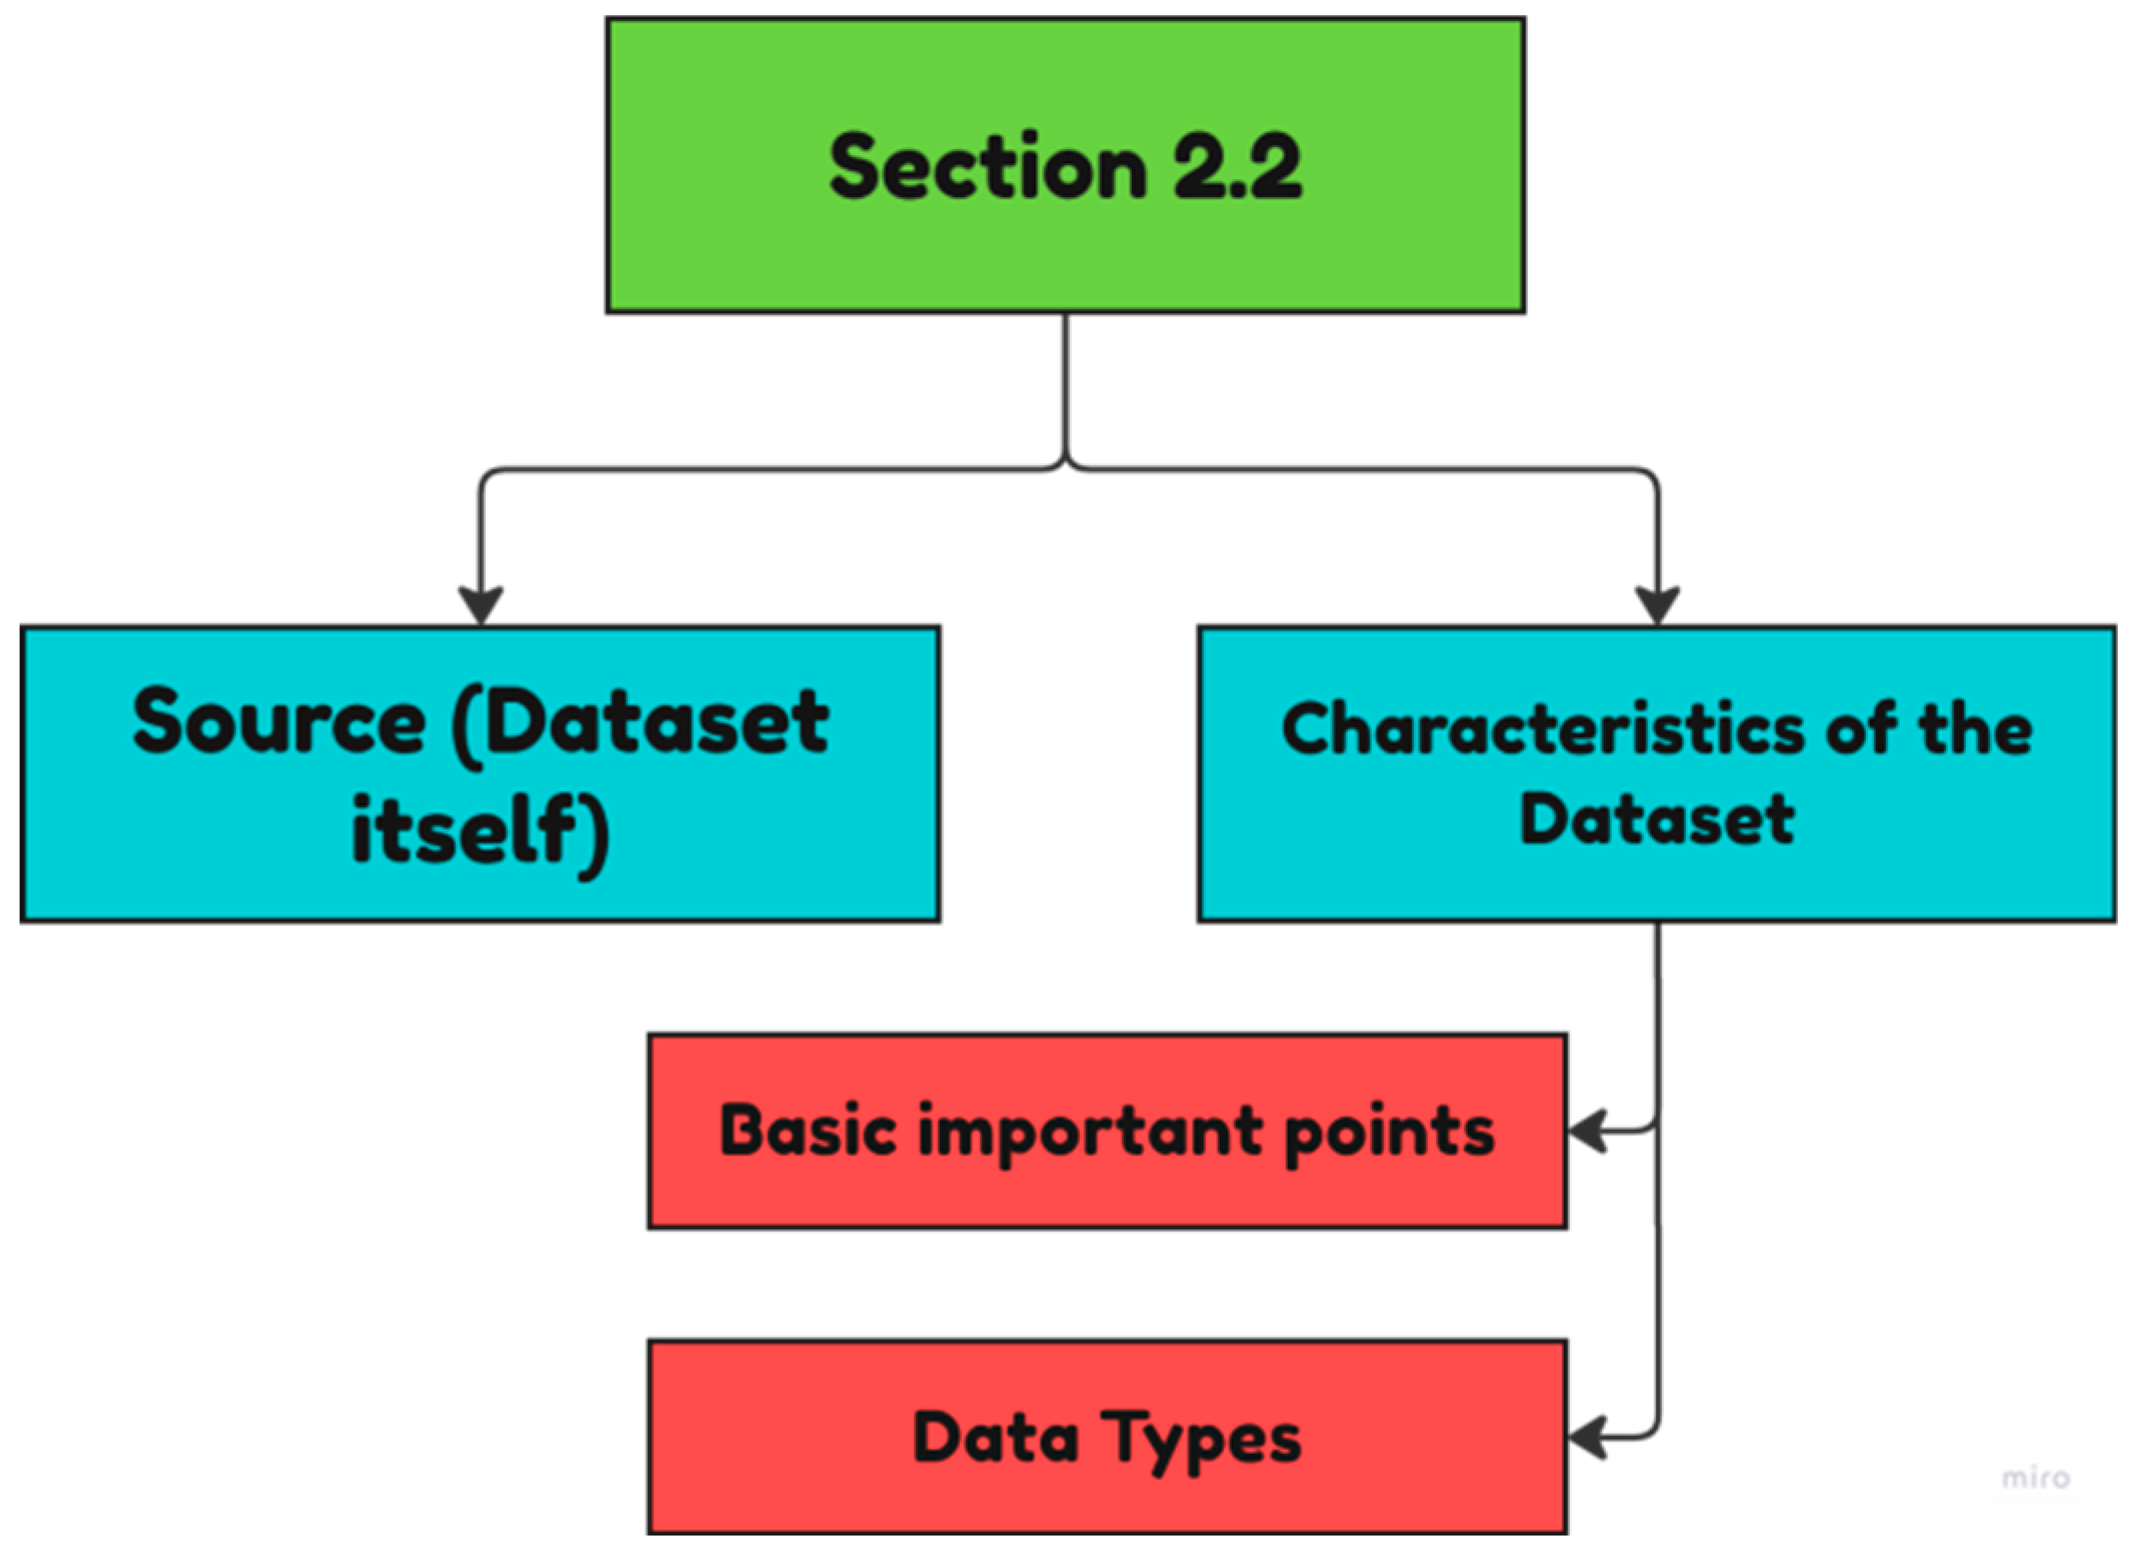
Figure 3.
Diagram illustrating the two primary data types in the dataset: numerical and categorical.
Figure 3.
Diagram illustrating the two primary data types in the dataset: numerical and categorical.
3. Data Preprocessing
preprocessing, certain columns were identified as irrelevant to the objectives of the project. These were removed to simplify the analysis and enhance model performance. The remaining columns were then carefully reviewed to confirm their relevance to the project. By focusing only on essential attributes, the dataset was refined to ensure the analysis remained precise and aligned with the research work.
| Data Type | Feature | Description |
| Numeric | age | The age of the student in numerical value. |
| absences | The number of school absences in numerical value. The range is 0-93. | |
| G1 | First period grade achieved by the student. The range is 0-20. | |
| G2 | Second period grade achieved by the student. The range is 0-20. | |
| G3 | Final year grade achieved by the student. This is the target variable. The range is 0-20. | |
| Fedu | The overall educational qualification of the student’s father represented as a number 0-4: | |
| - 0: No education | ||
| - 1: Primary education till 4th grade | ||
| - 2: 5th to 9th grade education | ||
| - 3: Secondary education | ||
| - 4: Higher education | ||
| Medu | The overall educational qualification of the student’s mother represented as a number 0-4 (same levels as Fedu). | |
| travel time | Time taken for students to travel to school, measured in range 1-4: | |
| - 1: Less than 15 minutes | ||
| - 2: 15-30 minutes | ||
| - 3: 30 minutes to 1 hour | ||
| - 4: More than 1 hour | ||
| failures | Number of times the student has failed in a subject, measured in range 0-4: | |
| - 0: No failures | ||
| - 1: Failed one class | ||
| - 2: Failed two classes | ||
| - 3: Failed three classes | ||
| - 4: Failed four or more classes | ||
| health | The health situation of students, measured in numbers from 1-5, where 1 means very bad and 5 means very good. | |
| Walc | Students’ weekend alcohol consumption, measured in range 1-5, where 1 is very low and 5 is very high. | |
| Categorical | sex | The sex (gender) of the student. "M" stands for Male and "F" stands for Female. |
| study time | Total amount of time spent studying per week, measured in range 1-4: | |
| - 1: Less than 2 hours per week | ||
| - 2: 2-5 hours per week | ||
| - 3: 5-10 hours per week | ||
| - 4: More than 10 hours per week | ||
| activities | Whether the student participates in extracurricular activities, recorded as “Yes” or “No”. |
4. Target Variable and Data Quality
It is not a type of data; rather, it assumes the data type of the target output that is to be predicted. For instance, if one is predicting a continuous variable, such as a final grade, then the target variable will be continuous. In the dataset model in use, the target variable is the column entitled G3, which represents the student's predicted final grade. The target variable is then derived based on various factors like study habits, frequency of attendance, and so forth. Other attributes that will be mentioned can also be used for derivation. This dataset is clean, but missing values, duplicate records, and outliers are possible; cleaning the dataset will be performed in the preprocessing step that will follow shortly.
4.1. High-Level Statistics
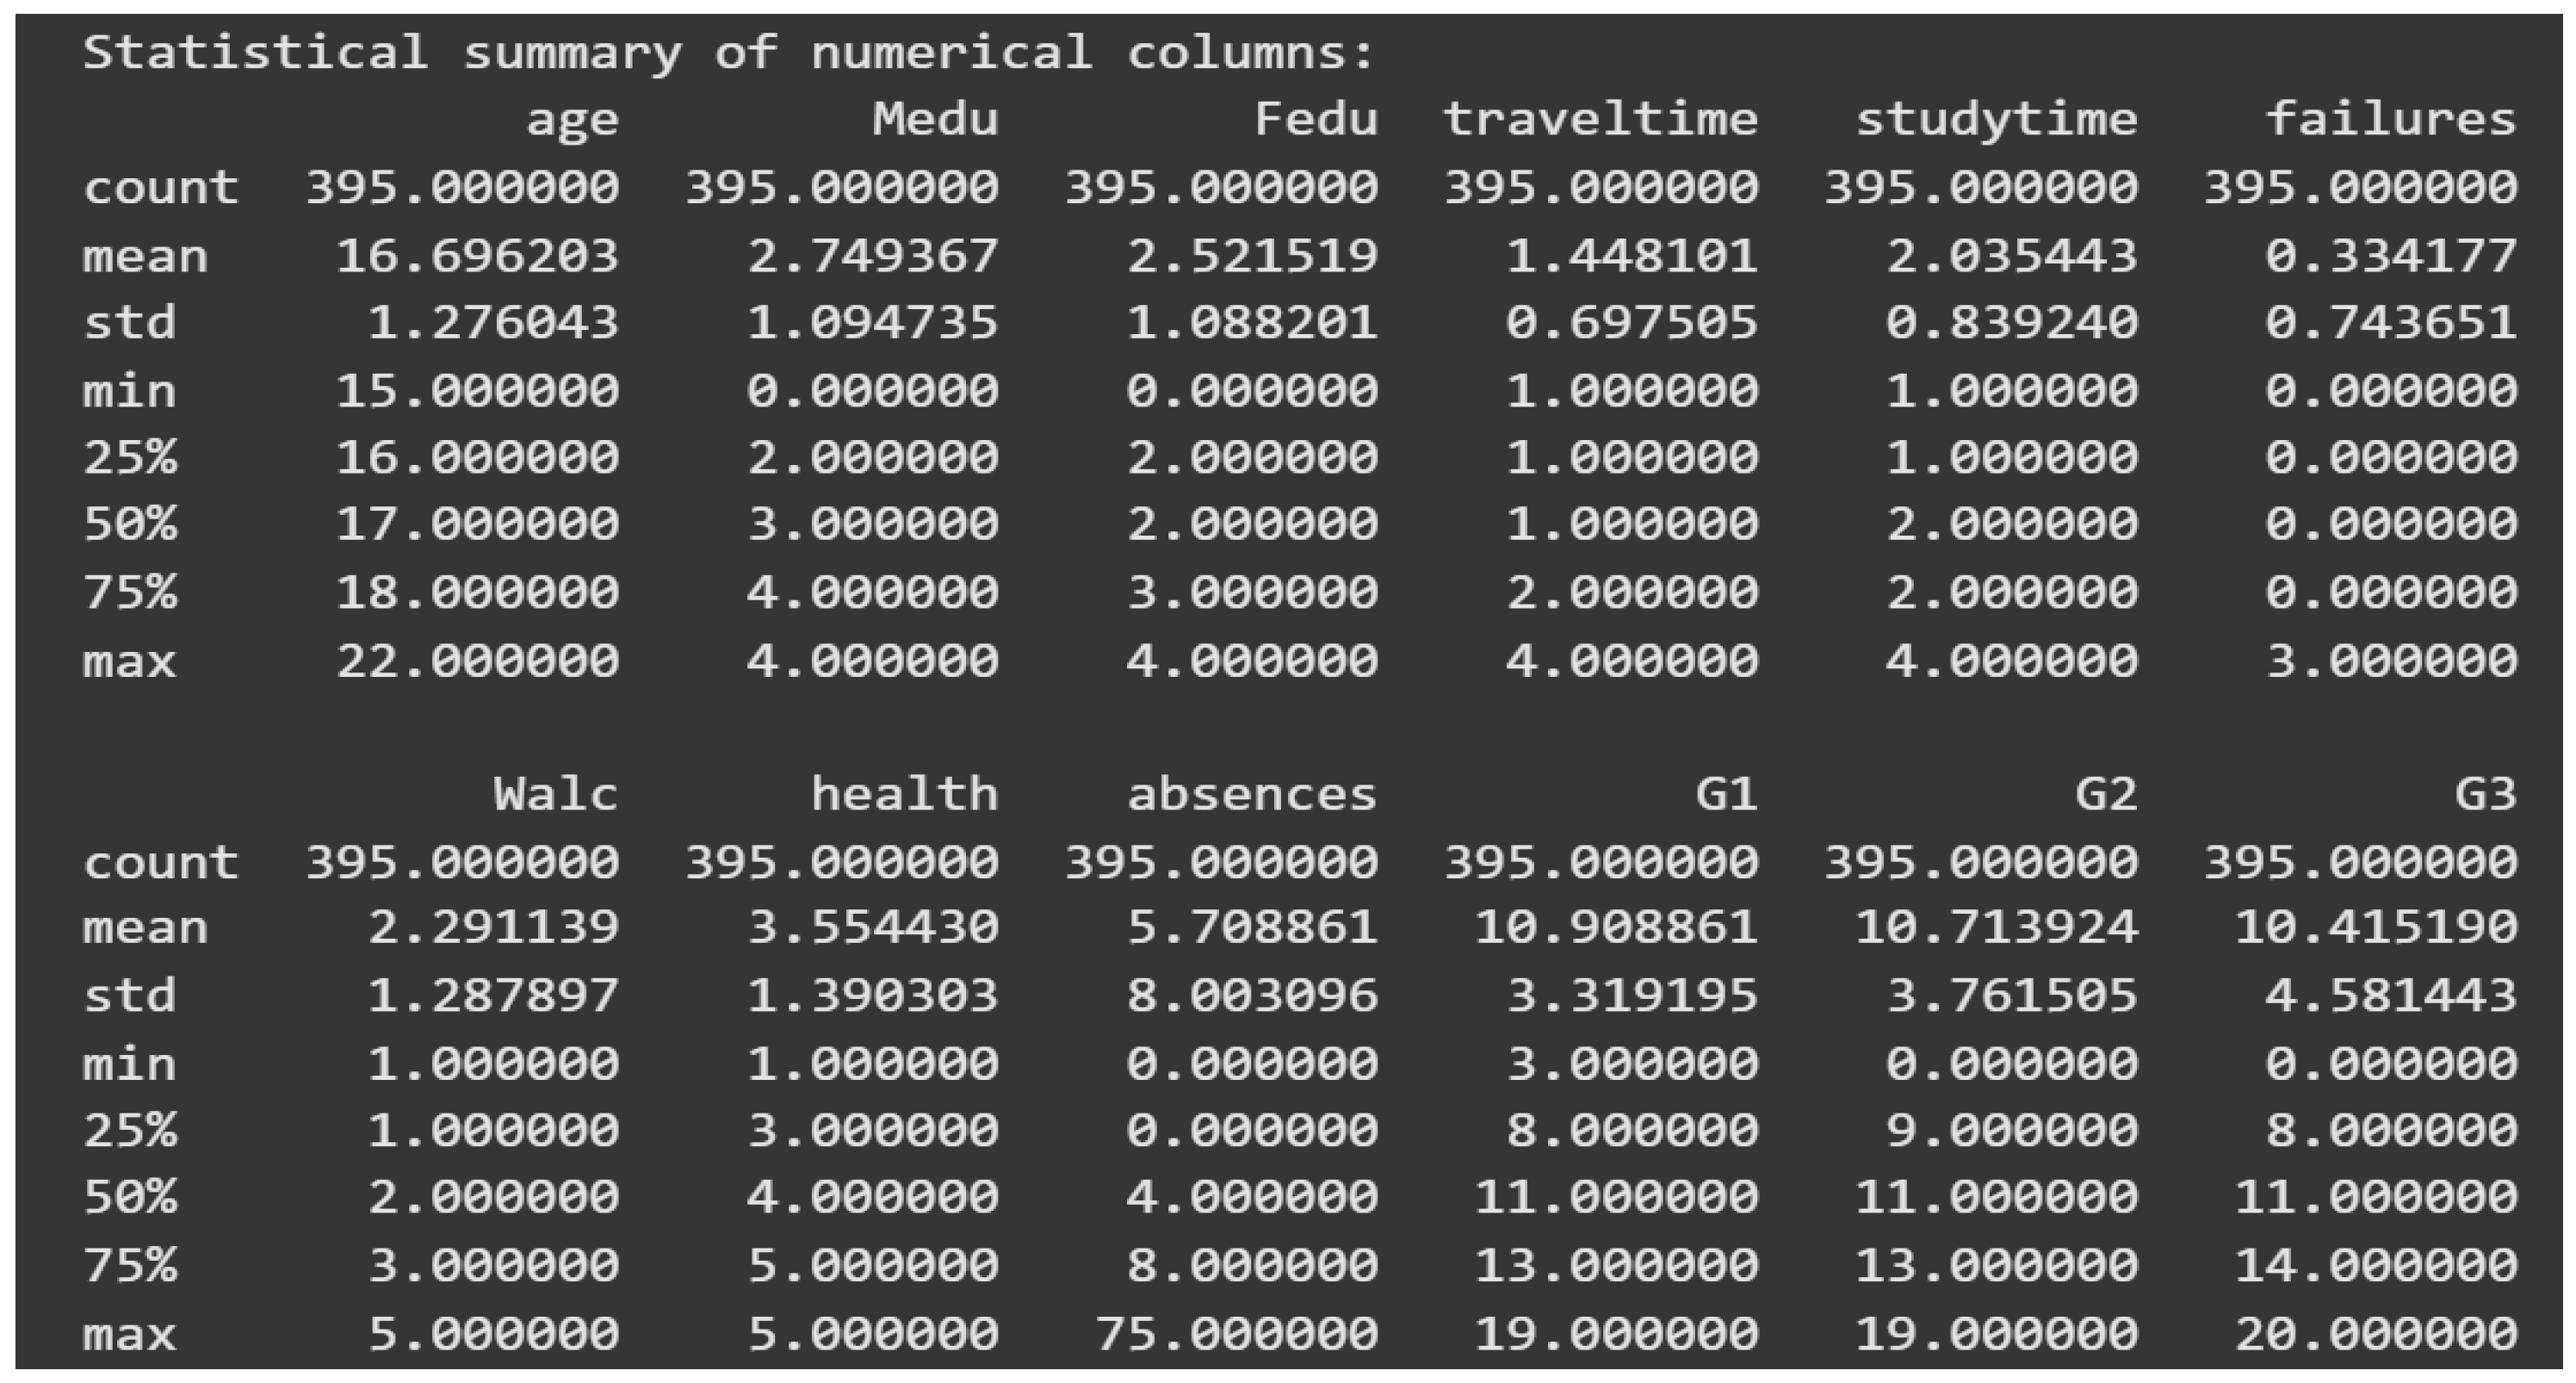
This section discusses the High-Level Statistics in our report by mentioning the statistic, its value in our dataset and a description of what that statistic is and what its abbreviation stands for. To get the high-level statistics for our dataset, we will need the Statistical Summary which we can get through the df. describe () command.
Figure 4.
Statistical summary of our dataset.
We now describe the key statistics and their uses:
Count: The number of records in each column. It is a measure of completeness.
Mean: This is the average value. It is useful to identify central tendencies.
Median: The middle value when data is ordered. A relationship between mean and median helps determines whether the distribution of data is symmetric or skewed. A large difference between these values indicates outliers.
Standard Deviation: A measure of data dispersion from the mean. A lower value indicates closely packed data, while a higher value suggests a wider spread.
Minimum and Maximum: The smallest and largest values in the dataset, which help identify outliers and establish data boundaries.
Percentiles (25%, 50%, 75%): These divide the dataset into quartiles, revealing the data distribution.
Examples of Statistics in Action
Example 1: Study Time
The study time column is the amount of time students spend studying, which ranges from 1 to 4 (1 = least, 4 = most).
Mean: 2.03, most students spend a moderate amount of time studying.
Standard Deviation: 0.84, most students' study times fall within a narrow range.
Minimum and Maximum: 1 (least) and 4 (most).
Percentiles:
| Percentile | Study Time |
| 25 % (first quartile) | 1 |
| 50 % (second quartile) | 2 |
| 75% (third quartile) | 2 |
This indicates that the majority of students studied a moderate amount of time; few students studied hardly at all, and few studied intensively.
Example 2: Absences
The Absences column represents the number of days students were absent from school.
Mean: 5.71 days represents the average number of absences.
Standard Deviation: 8 days, implying wide variation in the pattern of attendance.
Minimum and Maximum: 0 (no absences) and 75 (potential outlier).
This analysis reveals that most students were absent between 0 and 8 days, but extreme absenteeism, such as 75 days, was rare but occur to.
| Percentile | Absences |
| 25 % (first quartile) | 0 |
| 50 % (second quartile) | 4 or less (≤ 4) |
| 75% (third quartile) | 8 or less ( ≤ 8) |
5. Proposed Methodology
The methodology of analysis for the "Student Performance Dataset" will follow a structured approach in data science to ensure that the insights drawn are complete regarding the factors affecting academic outcomes. The steps are as follows:
5.1. Data Collection and Description
This dataset, obtained from the UCI Machine Learning Repository, consists of 395 student records and 33 attributes. This contains demographic, socio-economic, and academic performance data. A basic exploration was conducted to have a good overview of the structure of this dataset: numerical and categorical features.
5.2. Data Preprocessing
Missing values, duplicates, and irrelevant features are handled to preprocess the data. A variety of techniques have been used such as:
Missing Value Handling: The dataset was searched for null values; no missing entries were found.
Duplicate Records: Any duplicated records detected and removed for data integrity.
Feature Selection: Feature relevance had been done based on a correlation matrix. As a result, the "guardian," "Mjob, " and "Fjob" had less effect for arriving at "G3"-Hence deleted from the data frame. Outlier Treatment: Using the IQR Method in finding and reducing outliers for "absences and study time", the values capping after winsorisation.
5.3. Exploratory Data Analysis (EDA)
Box plots, histograms, and scatter plots were generated to show the relationship between features and the target variable, G3. Major trends in the data, like the positive correlation between study time and grades, were identified for subsequent modeling.
5.4. Predictive Modeling
Three machine learning models were developed to predict final grades based on the selected features, namely:
5.5. Linear Regression
Adopted because of its simplicity and interpretability.
Support Vector Regression (SVR): Applied for the possible presence of non-linear relationships.
Decision Tree Regression: Applied to capture higher-order patterns in the data.
Each model was evaluated based on metrics such as R-squared and Mean Squared Error (MSE) to determine the best-performing approach.
5.6. Model Validation
The data was split into 80% for training and 20% for testing subsets, respectively, in order to assess the models. K-fold cross-validation (k=5) ensured that the performance of the models was robust and stable. Residual analysis and scatter plots of actual vs. predicted values validated the reliability of the models.
5.7. Insights and Recommendations
Synthesize the results to present actionable recommendations that might include the encouragement of regular studying, treatment of excessive absenteeism, and data-driven intervention for personalized learning. This approach will ensure that the analysis of the dataset is holistic to provide actionable insights for educational institutions in improving student performance using data science techniques.
6. Identification of Data Issues
1. Missing Values:
Missing values can seriously affect data analysis by reducing the efficiency of statistical evaluations and possibly leading to biased estimates of parameters. This may compromise the representativeness of the sample. Therefore, identification and treatment of missing values are among the most important steps in data preprocessing. For handling missing values, the code snippet data.isnull().sum() had been used for checking missing values across all columns. This command when executed with a print statement shows the count of missing values for each column. During this check, no missing values were identified in the dataset. To make sure that analysis coverage is complete, the percentage of missing values was computed using the following code:
missing_percentage = df.isnull().mean() * 100
Also, the commands to drop columns with missing values were implemented. Given that no missing values were found, no column was dropped in this step.
2. Duplicates:
Dealing with duplicates is crucial to ensuring that the data provided is clean and valid. Duplicate or redundant records in a dataset can also bias analysis and predictions. The following steps were therefore carried out:
The code for finding the duplicate rows in a dataset was df.duplicated().sum().
If yes, command df.drop_duplicates(inplace=True) was ready and waiting to get rid of them
No record of duplicates found within the execution of this dataset, and hence no requirement for further processes.
3. Feature Selection:
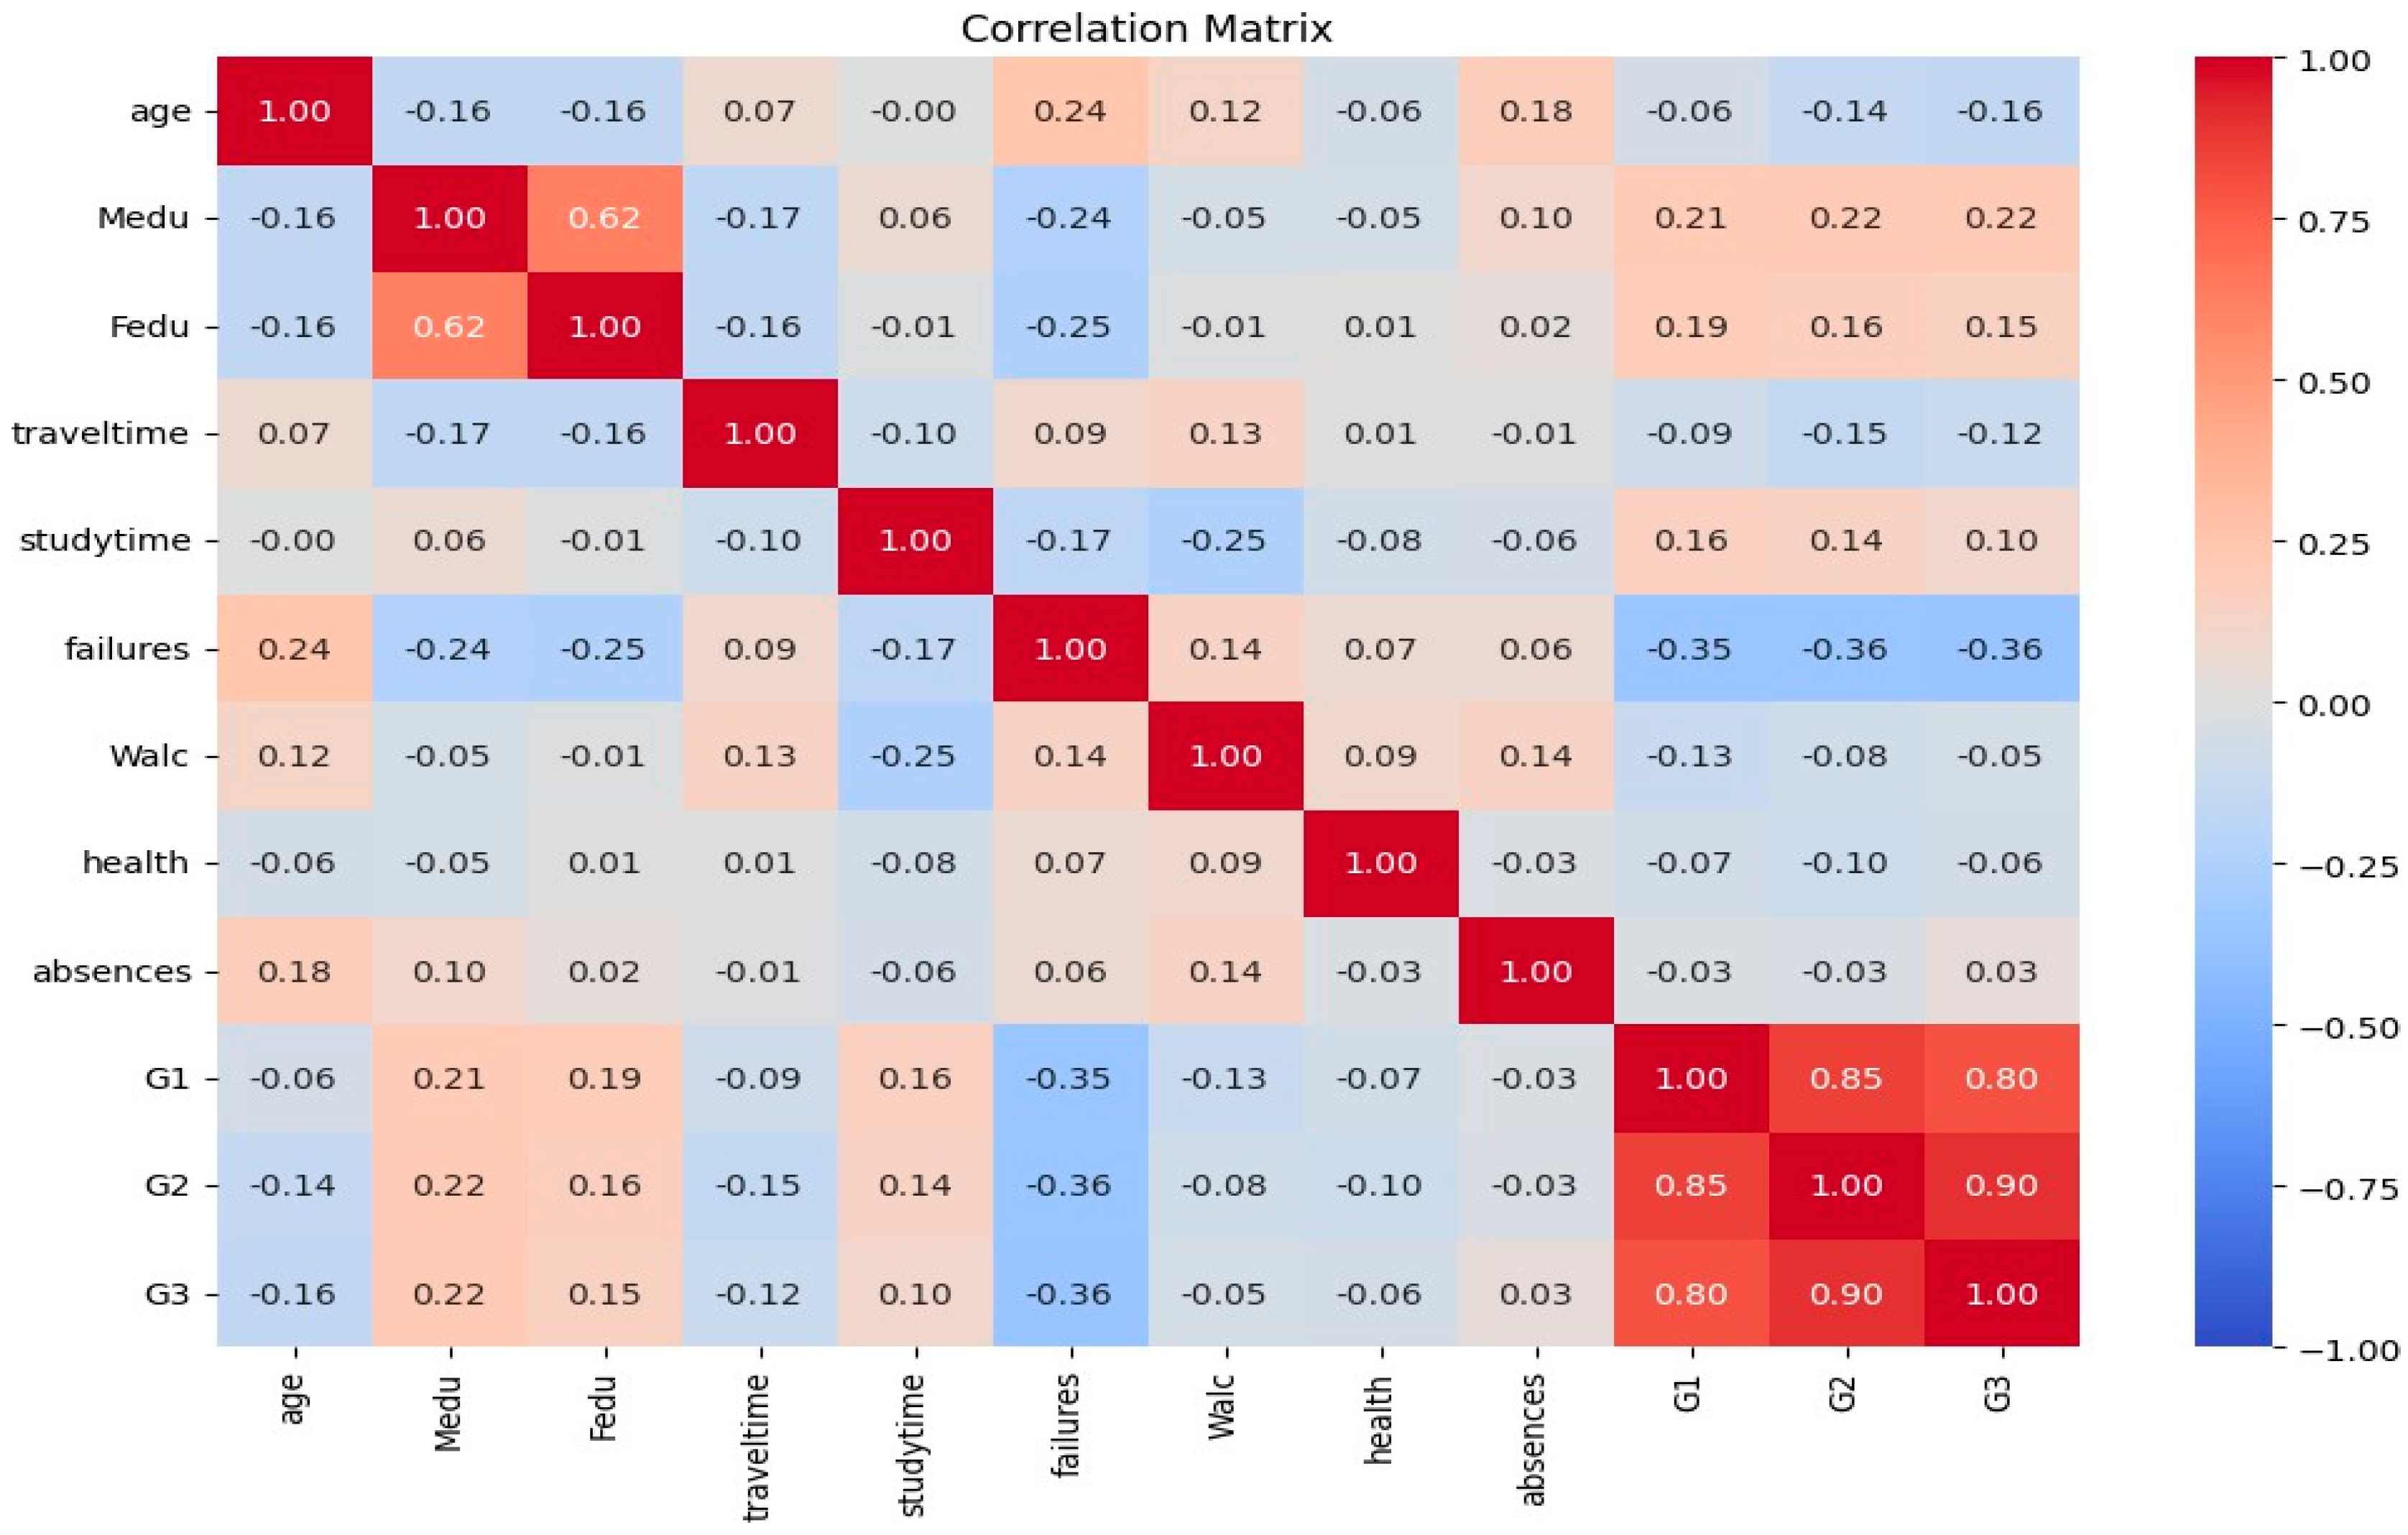
Feature selection has always been an important step in fine-tuning the effectiveness and interpretability of the dataset. Cleaning superfluous columns provides for easier analysis, underlining the most relevant attributes. To better understand the relationship among the variables, a correlation matrix was computed. The matrix was then further visualized using a heatmap to determine redundant or lesser features. Features that showed low correlations or had minimal contributions to the predictive model were dropped, improving overall dataset efficiency and ensuring that the analysis remained both focused and effective.
Figure 5.
Correlation Matrix before feature engineering.
6. Refining the Dataset: Correlation, Outliers, and Techniques
7.1. Correlation Analysis
From the correlation matrix, certain features (e.g., Fedu, Medu, G1, and G2) demonstrated minimal relevance to the key relationships affecting the dataset. These fields were considered for removal to improve the dataset's overall coherence and model efficiency.
Outliers: Identification and Treatment
Definition and Impact:
Outliers are data points that deviate significantly from the rest of the dataset. They can arise due to data collection errors, measurement variability, or valid but rare occurrences. Addressing outliers is essential, as they can distort statistical analyses and lead to inaccurate conclusions.
Identification Using IQR:
The Interquartile Range (IQR) method was employed to detect outliers. This technique calculates the bounds as follows:
- Lower Bound: Q1−1.5×IQRQ1 - 1.5 \times IQRQ1−1.5×IQR
- Upper Bound: Q3+1.5×IQRQ3 + 1.5 \times IQRQ3+1.5×IQR
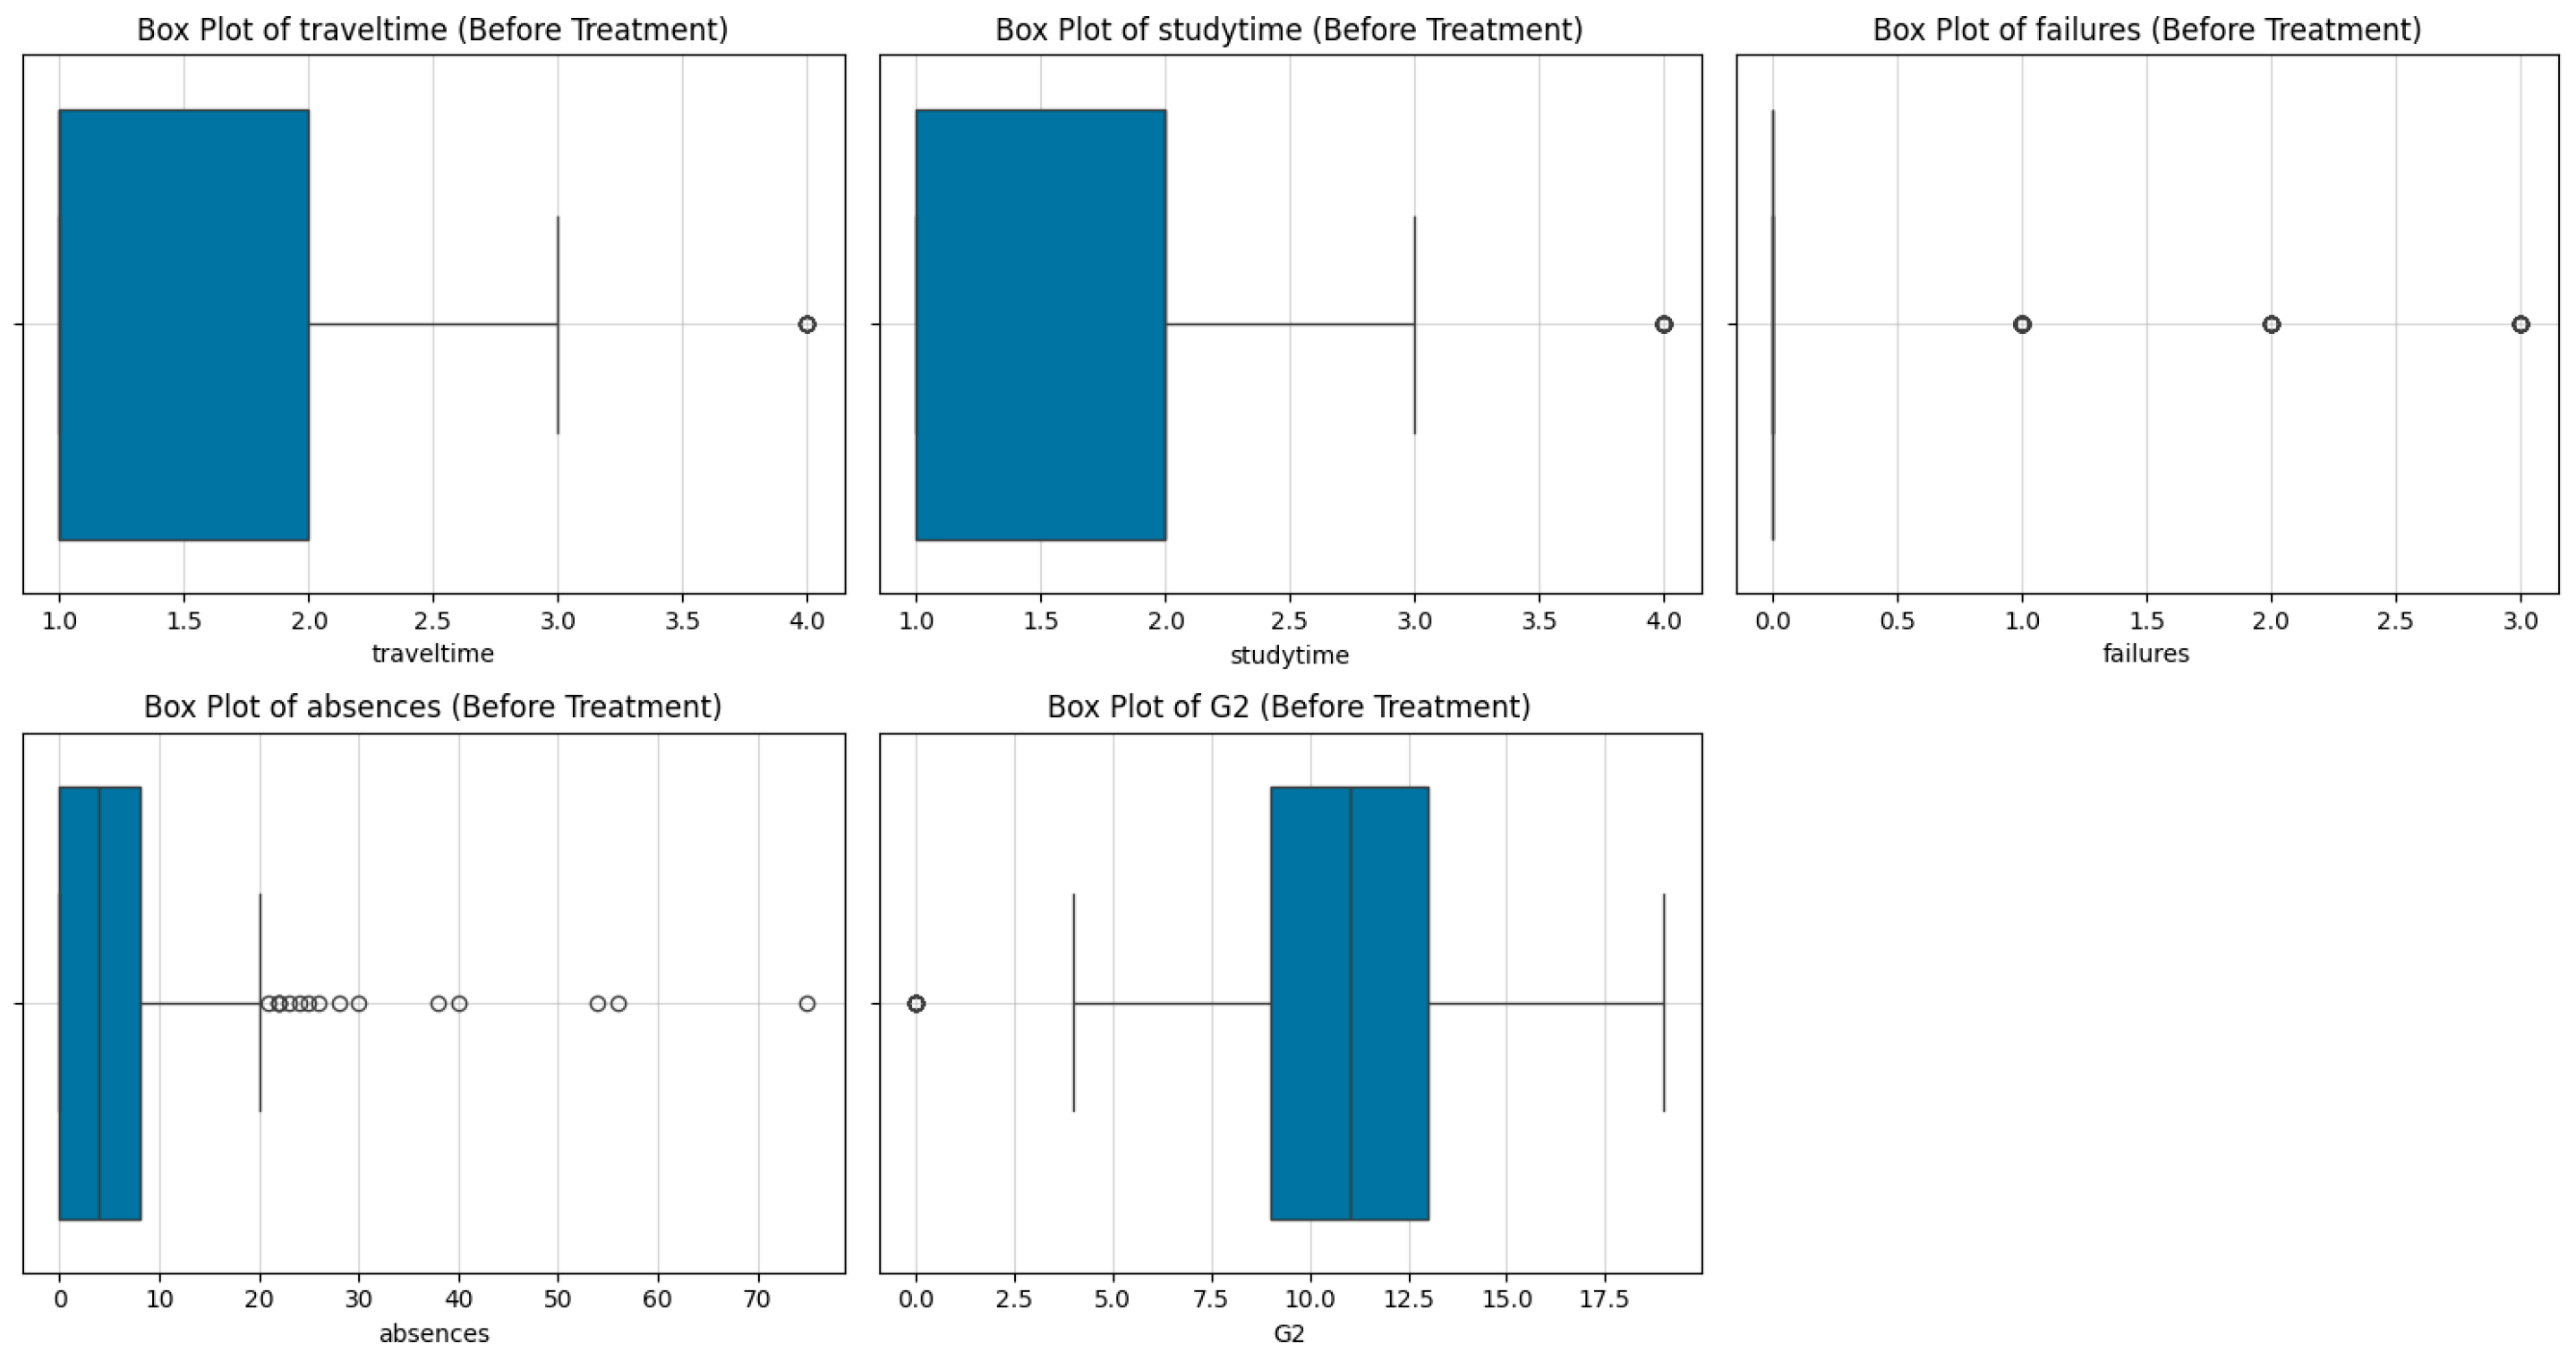
Box Plots for Visualization:
Box plots were generated for columns such as traveltime, studytime, failures, absences, and G2, revealing significant outliers in these variables.
Figure 6.
Box plots (before treatment).
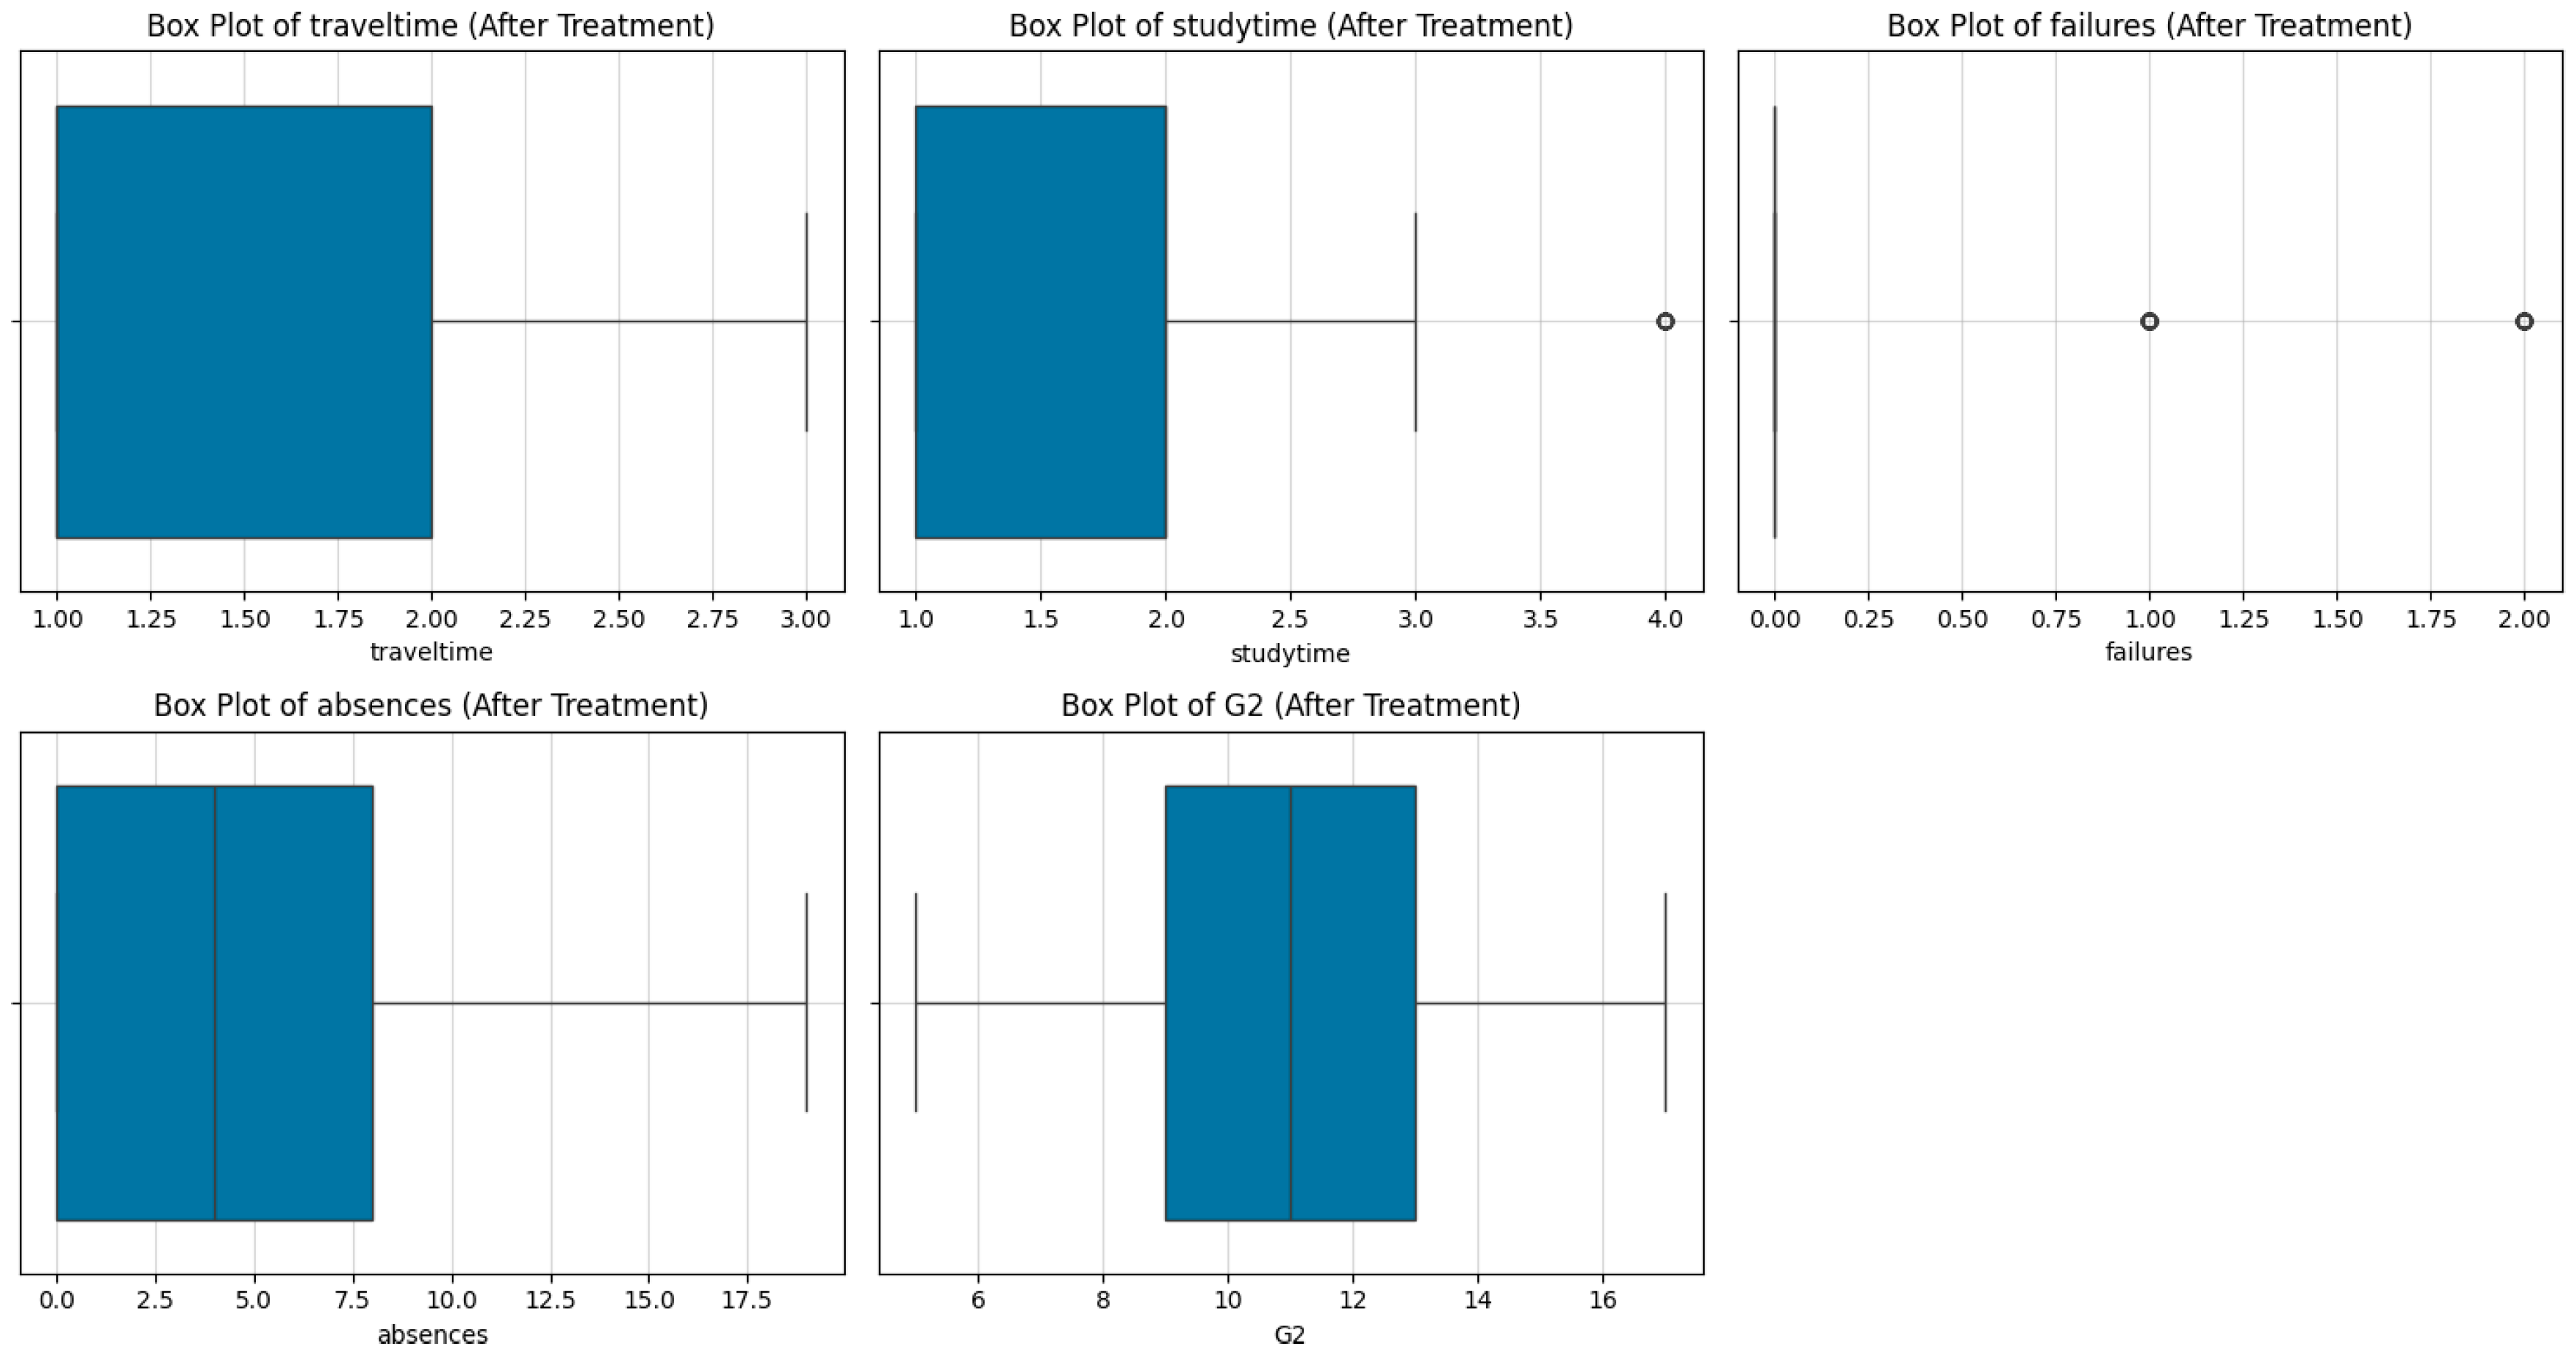
Outlier Treatment Using Winsorization:
To mitigate the influence of outliers, a winsorization technique was applied. High and low values were capped at the top and bottom 5% thresholds using the mstats.winsorize() function. This approach retained the dataset's integrity while minimizing the impact of extreme values.
Figure 7.
Box plots after outlier treatment.
7.1. Exploratory Data Analysis (EDA)
EDA was conducted using visual tools to explore data distributions, detect outliers, and uncover patterns:
- Pair Plots: Highlighted relationships between variables, such as the correlation between G3 (target variable) and other predictors.
- Box Plots: Used for identifying outliers through the IQR method.
- Histograms: Compared key features, such as absences and G3, to assess their relationship.
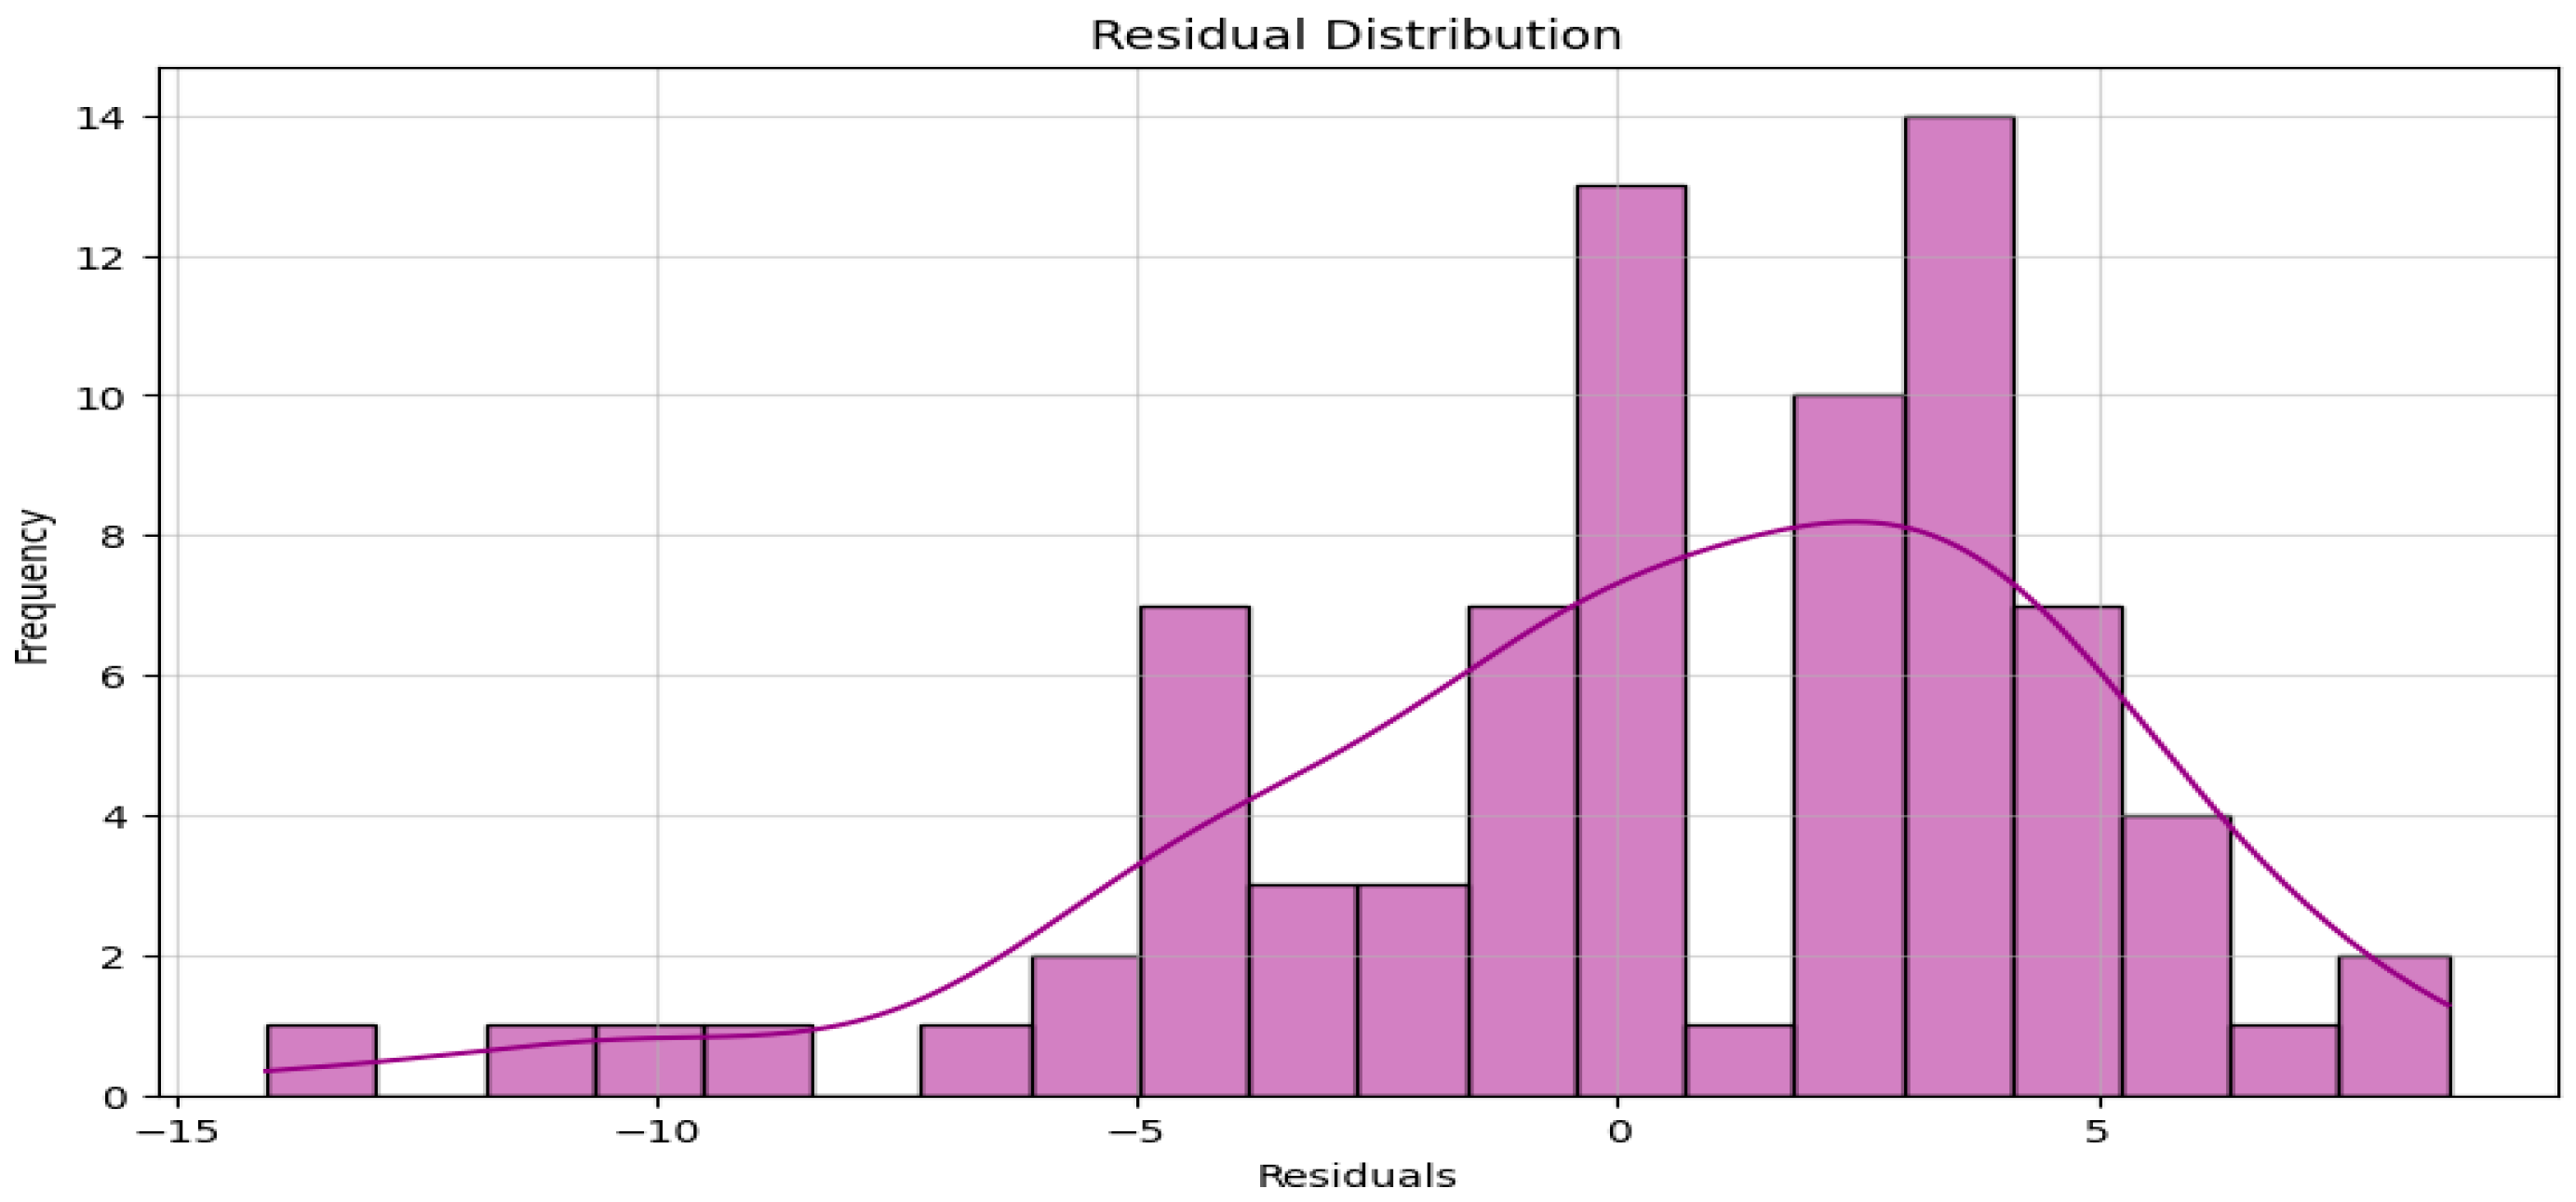
- Residual Plots: Confirmed the absence of systematic bias and validated model assumptions.
Figure 8.
Pair plot of predictors and G3.
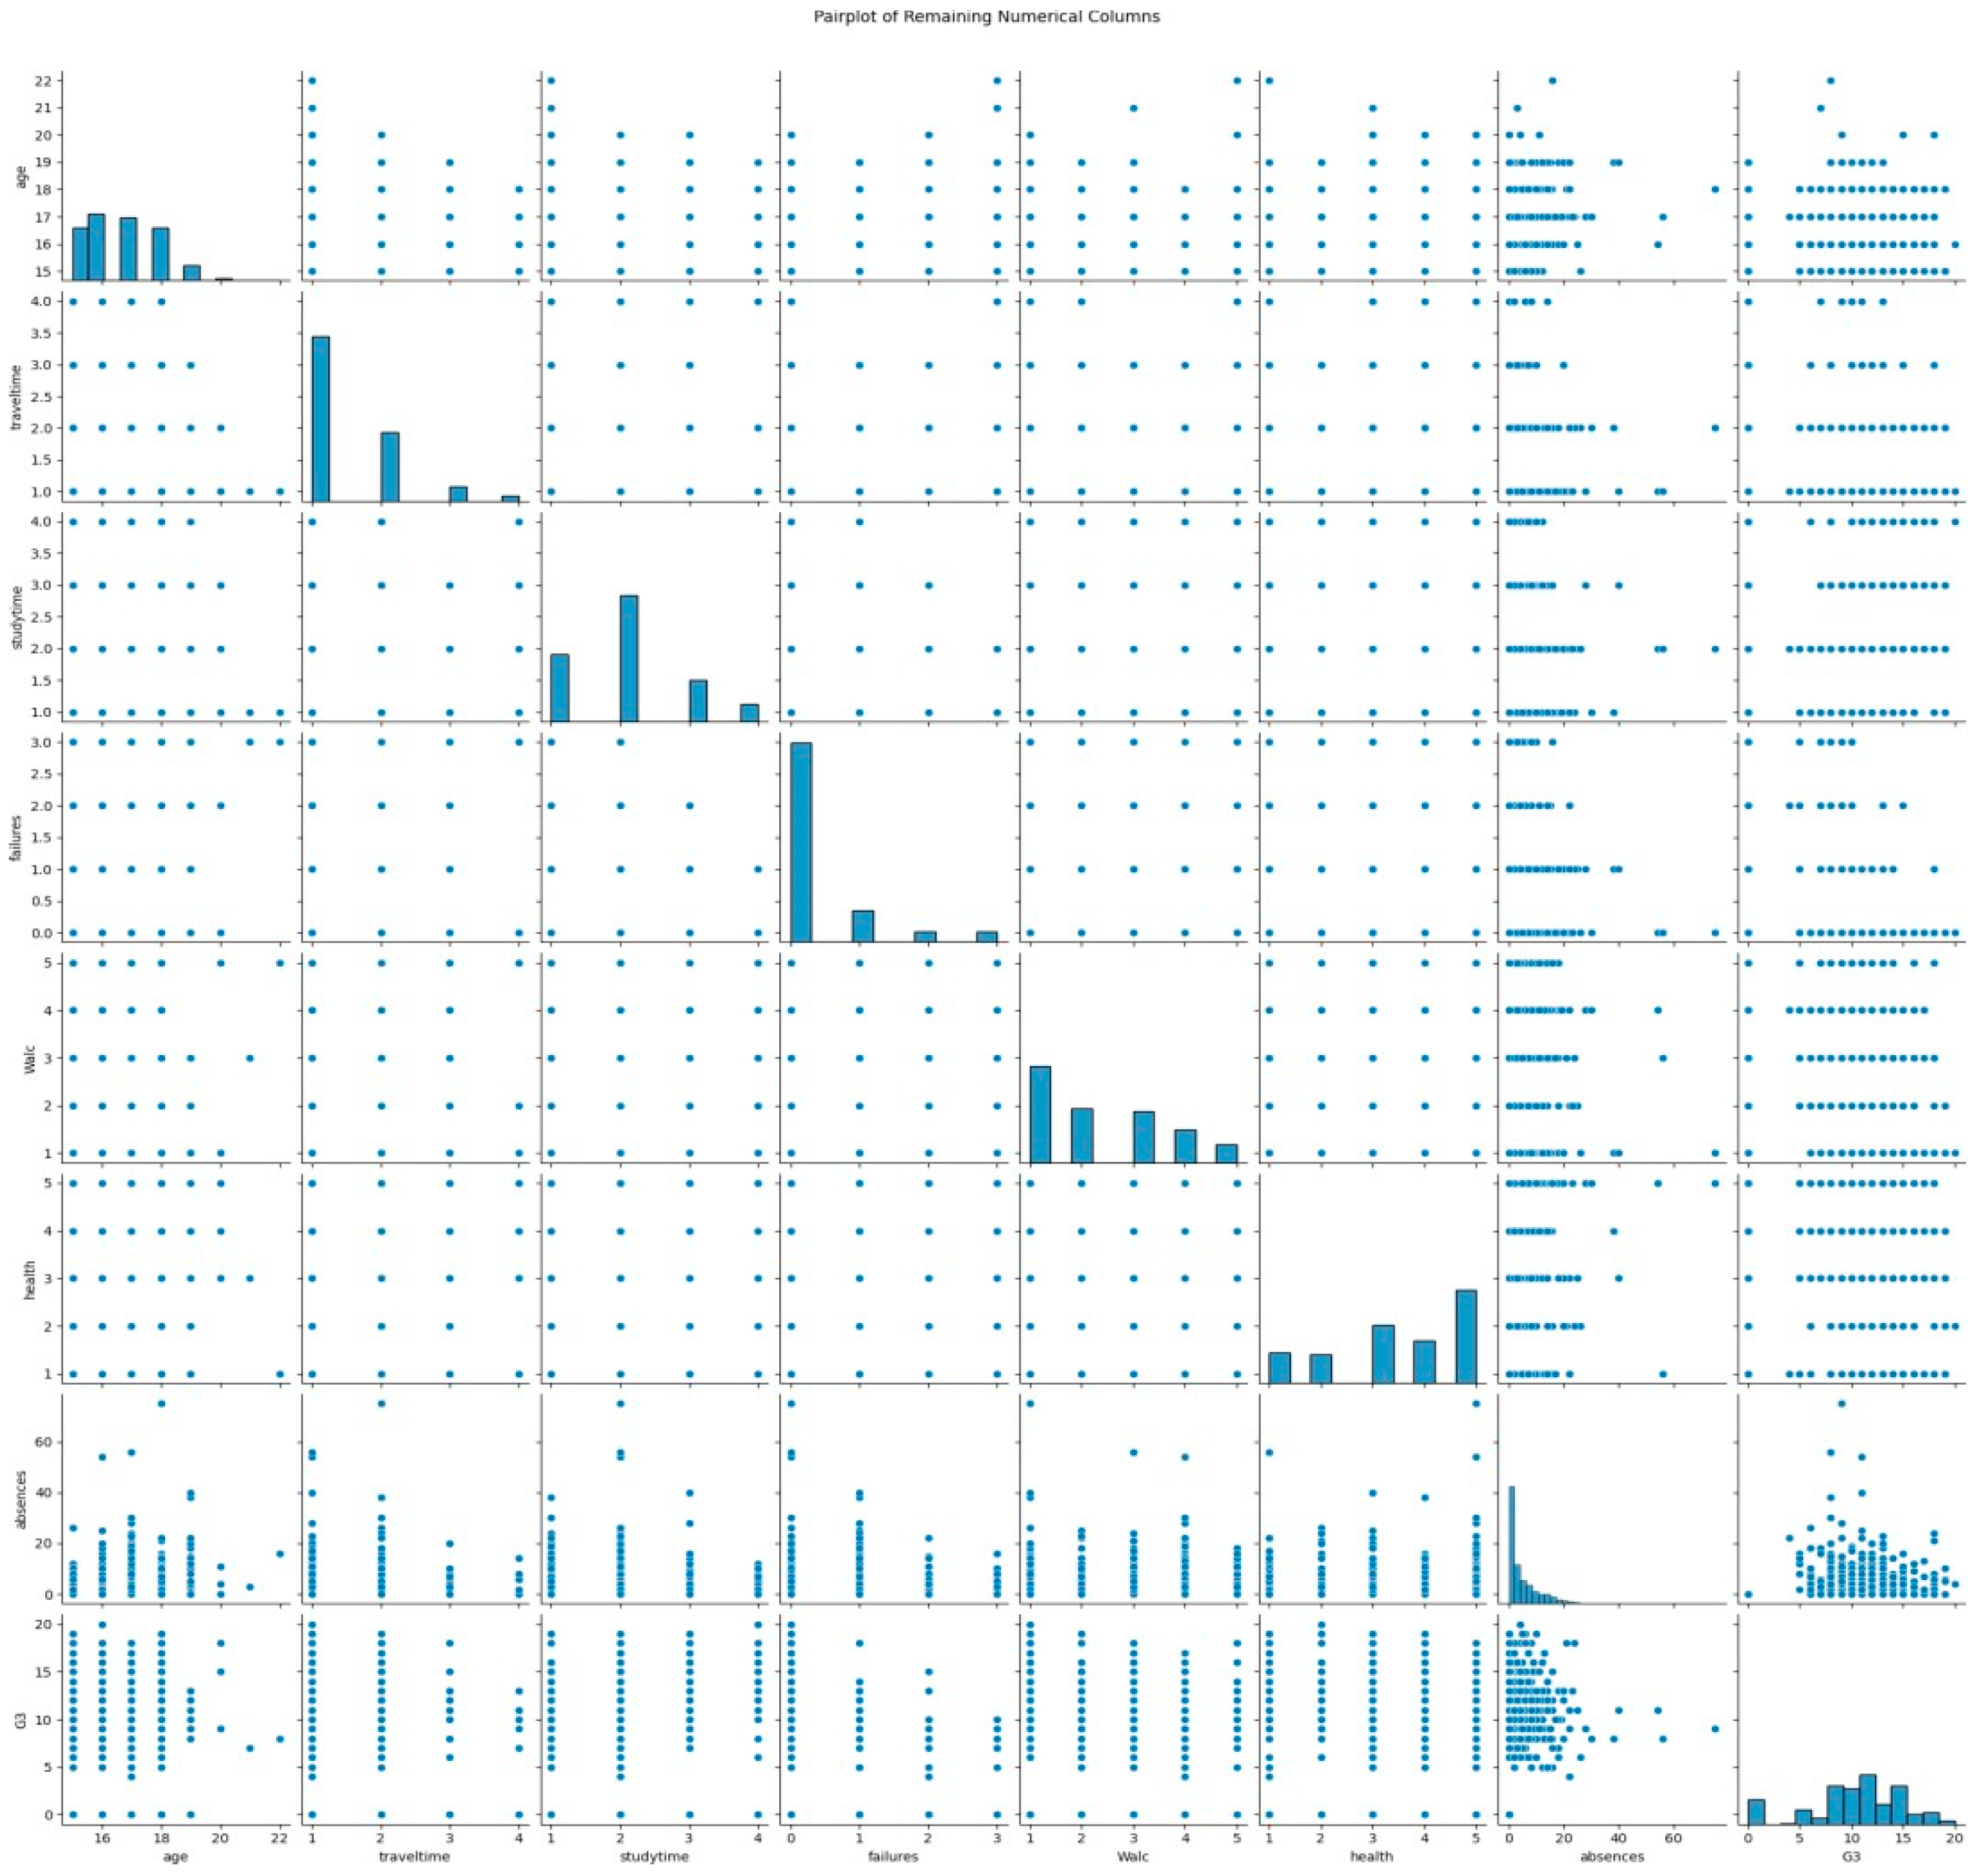
Figure 9.
Histogram comparing absences and G3.
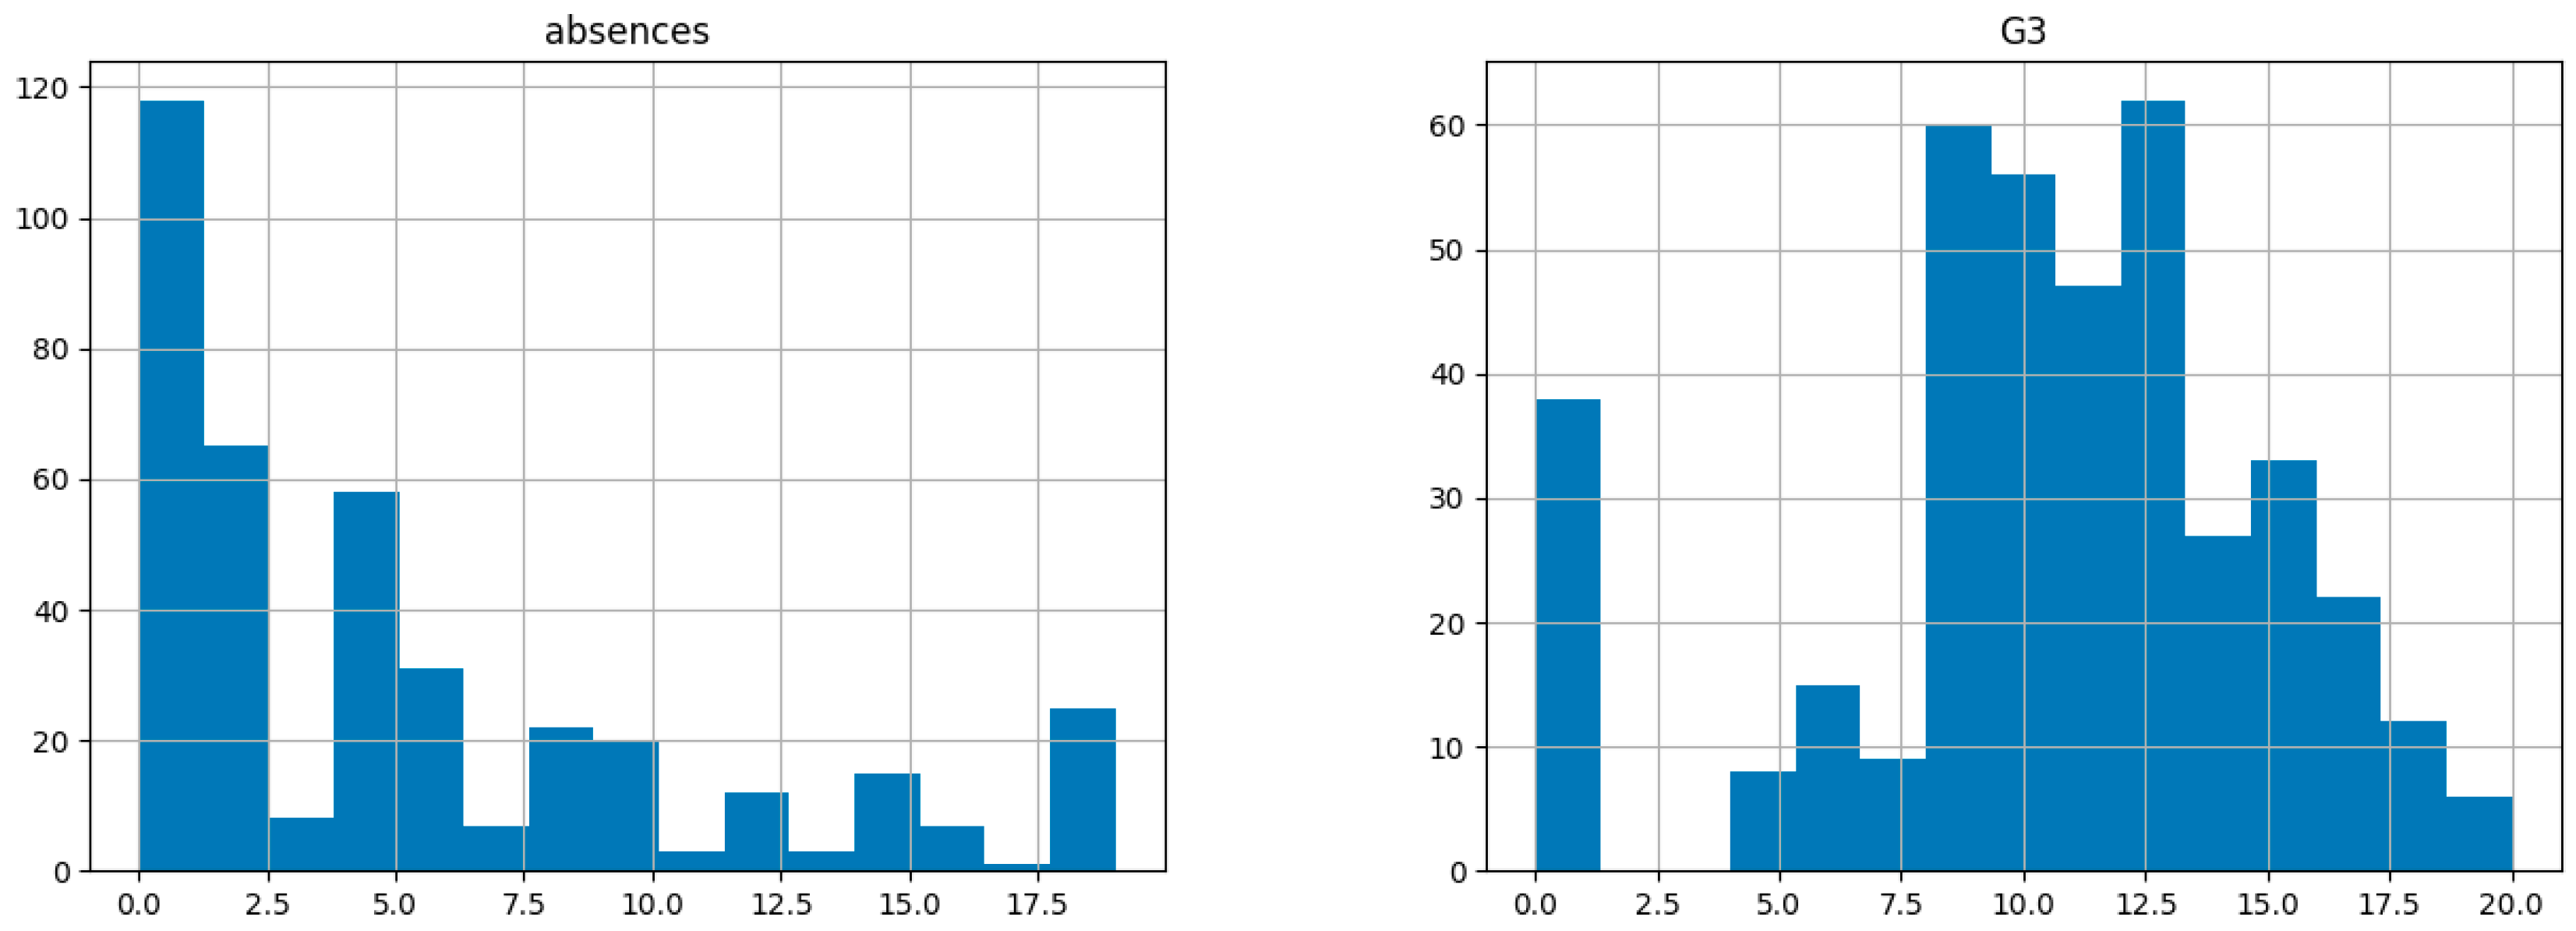
Figure 10.
Residual plot showing random error distribution.
7.2. Correlation Analysis
The correlation analysis played a vital role in finding the relationship between numeric features and the target variable, G3. From the correlation matrix, the high-priority predictors are identified: G1 and G2, because both show a high relationship with G3. The irrelevant features like guardian, Mjob, and Fjob are marked as unnecessary to keep in the dataset. This allowed the model to focus on the most relevant features and consequently improved its interpretability. Other features were dropped like 'school', 'reason', 'famsize', 'nursery', and 'address' to streamline the data and enhance model efficiency.
7.3. Predictive Modeling
The following models were developed on the selected features to predict the performance of students: Linear Regression was chosen because it is simple, provides a very strong baseline, and is easy to understand; Support Vector Regressor explores nonlinear relationships between features and G3; Decision Tree Regression can model more complicated, nonlinear patterns in the data. Numerical features were standardized using StandardScaler to make these models perform optimally, especially benefiting the SVR model, since it is sensitive to feature scaling. The model performance was evaluated against key metrics-R-squared, which is indicative of the proportion of variance in G3 explained by the model, and the Mean Squared Error, which considers the accuracy of the predictions.
7.4. Rationale for Technique Selection
These methods were chosen because, by using them, the project objectives can be met. EDA helped to understand the trend in data and the relationships of data. For example, from a pair plot, it can be seen that study time versus G3 has a positive correlation, but for absences versus G3, it has a negative relationship-higher absences mean lower grades. The most influencing predictors, G1 and G2, were identified using the correlation analysis, and irrelevant features like guardian and Mjob were removed. To model both linear and nonlinear relationships, different predictive techniques have been used, namely Linear Regression, to clearly understand and interpret the model; SVR to explore nonlinear trends; and Decision Tree Regression to handle complex patterns. Lastly, model evaluation metrics such as R² and MSE were targeted to make the predictions accurate and reliable in the view of project goals.
7.6. Model Validation
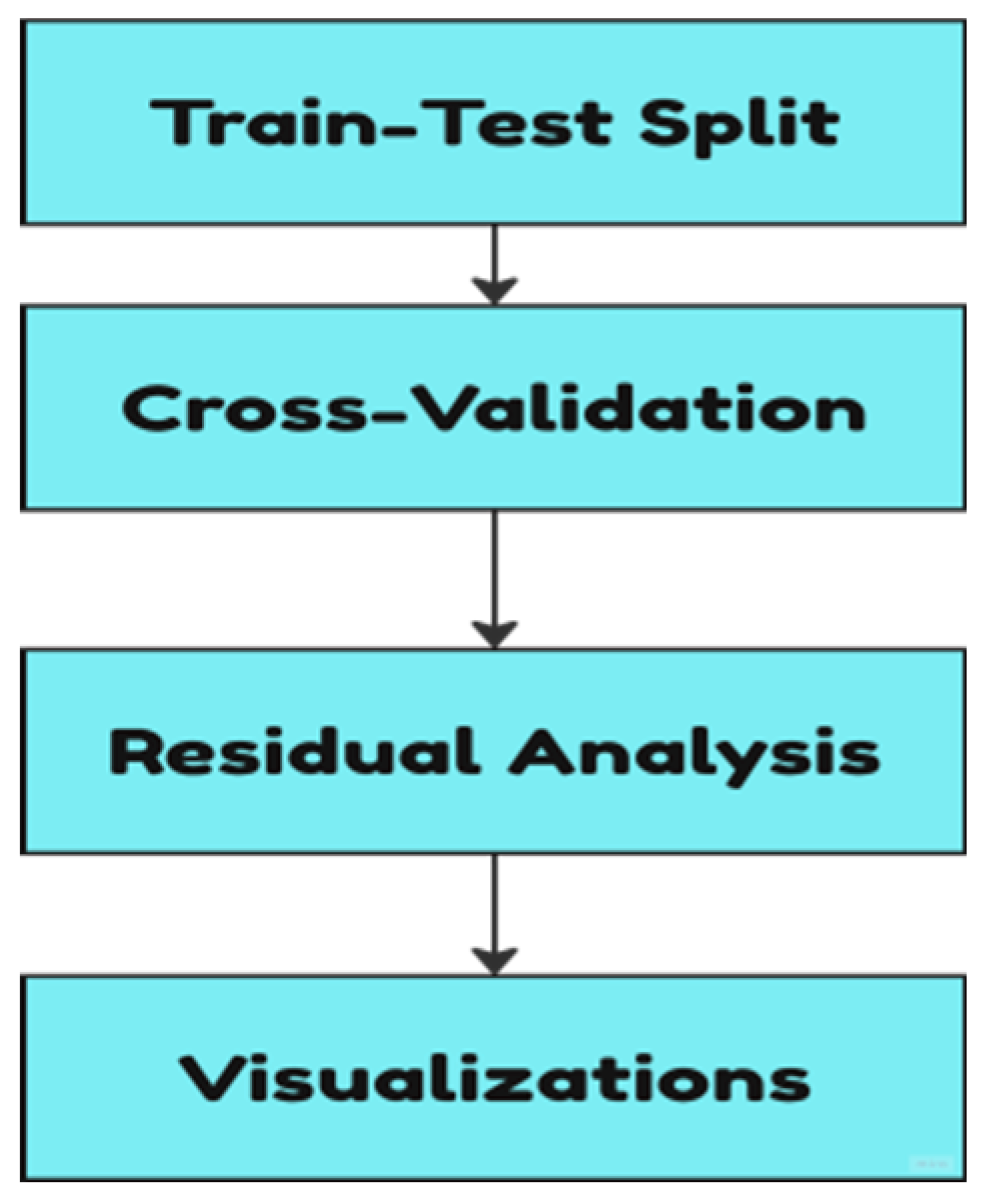
Model validation is an important step toward ensuring robustness and reliability in predictive models. This process includes the performance of the model on unseen data, minimizing overfitting, and confirmation of predictive accuracy. In this study, the first step in validation included a train-test split, wherein the dataset was divided into two subsets: 80% for training the predictive models and the remaining 20% reserved for testing. This split helps prevent overfitting by assessing model performance on data that the training never got to see, hence the model will generalize well on new data.
To enhance this further, K-fold cross-validation with k=5 was employed. In this method, the dataset is divided into five subsets, folds, and the model is trained on k−1 folds while being validated on the remaining fold. This process is repeated k times, once for every fold serving as a validation set in sequence. K-fold cross-validation improves this by eliminating possible overfitting and allows to a certain degree fair approximate model performance compared with doing just a holdout.
Figure 11.
Diagram showing the steps for Model Validation.
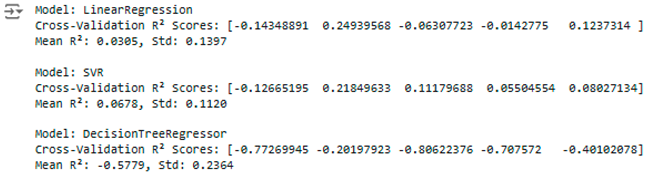
Residual analysis was performed in order to verify the accuracy of prediction. The residual plots demonstrated randomness without patterns; therefore, there was no systematic bias, while it also assured the assumptions of independence and constant variance that were necessary for the regression models. Other visualization techniques that have been used in this regard are actual versus predicted values scatter plots. Strong clustering of points along the diagonal line, where actual equals predicted, shows high accuracy. In total, there are two significant measures to explore model performance, such as MSE and R-squared. MSE reflects the mean of squared differences between the observed values and forecasted ones; the lesser it gets; the better the model's performance is. R² depicts the share of dispersion in a target variable, such as G3 explained by the model-the higher this index, the better. After K-fold cross-validation, the best model was Linear Regression. It has the lowest MSE, meaning the least prediction error, and the highest R², indicating it explains a large part of the variance in G3. From this, it is confirmed that Linear Regression is the most accurate and reliable model in predicting student performance based on the dataset.
8. Conclusion
In the end, the analysis of "Student Data Performance" shows how data science principles can be used to create transformational educational progress. It depicts how insights from the selected dataset can be used to further build on personalized learning strategies while emphasizing the relevance of data-driven decisions in education. By using various means such as exploratory data analysis, correlation analysis, and predictive modeling, the project captures the key patterns that influence the academic performance of students. However, for further improvement of the study, the following recommendations can be made which would enable it to become more practical for real-life usage:. Treatment of outliers, especially in critical variables like absences of students, would go a long way in providing insights into causes and implications for the student's final performance. Though the particular dataset was relatively clean, adding in preprocessing steps with advanced imputation techniques would ensure scalability for larger datasets. Another thing that would be of great consideration is to expand the predictive models to also include more success metrics, like dropout risks or subject-specific performances without the need for separating the dataset according to specific subjects; it would further widen the scope of impact. These results, when integrated, could even affect policies to be more comprehensive, such as the policy of structured study plan designs for students with particular needs and the policies that will allow educators to flag down those students who have extremely high absences. Real-time data integration allows for dynamic updating, enabling the continuous refinement of education strategies. The next step is taking improvement one step further to better visualize outcomes and communicating findings in more intuitive terms for easy understanding through straightforward stories. That ensures that insights really reach and inspire people making changes: educators, parents, and policymakers. These steps will not only help in magnifying the overall effect of the project but also provide a path for continuous development in the education sector with the help of data science.
References
- Nguyen, X., Tran, Y., & Le, Z. (2021). Data analytics in education: Identifying performance determinants and supporting personalized learning strategies. Journal of Educational Data Science, 15(3), 45-60.
- Misinem, M., Kurniawan, T. B., Dewi, D. A., Zakaria, M. Z., & Nazmi, C. M. A. (2024). Leveraging Data Analytics for Student Grade Prediction: A Comparative Study of Data Features. Journal of Applied Data Sciences, 5(4), 2025-2038. [CrossRef]
- Alam, A. (2023, April). The Secret Sauce of Student Success: Cracking the Code by Navigating the Path to Personalized Learning with Educational Data Mining. In 2023 2nd International Conference on Smart Technologies and Systems for Next Generation Computing (ICSTSN) (pp. 1-8). IEEE. [CrossRef]
- Alferidah, D. K., & Jhanjhi, N. Z. (2020, October). Cybersecurity impact over big data and IoT growth. In 2020 International Conference on Computational Intelligence (ICCI) (pp. 103-108). IEEE. [CrossRef]
- Jena, K. K., Bhoi, S. K., Malik, T. K., Sahoo, K. S., Jhanjhi, N. Z., Bhatia, S., & Amsaad, F. (2022). E-learning course recommender system using collaborative filtering models. Electronics, 12(1), 157. [CrossRef]
- Aherwadi, N., Mittal, U., Singla, J., Jhanjhi, N. Z., Yassine, A., & Hossain, M. S. (2022). Prediction of fruit maturity, quality, and its life using deep learning algorithms. Electronics, 11(24), 4100. [CrossRef]
- Karo, M. B., Miller, B. P., & Al-Kamari, O. A. (2024). Leveraging data utilization and predictive analytics: Driving innovation and enhancing decision making through ethical governance. International Transactions on Education Technology (ITEE), 2(2), 152-162. [CrossRef]
- Nwosu, N. T., Babatunde, S. O., & Ijomah, T. (2024). Enhancing customer experience and market penetration through advanced data analytics in the health industry. [CrossRef]
- Eboigbe, E. O., Farayola, O. A., Olatoye, F. O., Nnabugwu, O. C., & Daraojimba, C. (2023). Business intelligence transformation through AI and data analytics. Engineering Science & Technology Journal, 4(5), 285-307. [CrossRef]
- Saeed, S., & Abdullah, A. (2022). Hybrid graph cut hidden Markov model of K-mean cluster technique. CMC-Computers, Materials & Continua, 1–15.
- Saeed, S., & Haron, H. (2021). Improved correlation matrix of discrete Fourier transformation (CM-DFT) technique for finding the missing values of MRI images. Mathematical Biosciences and Engineering, 1–22. [CrossRef]
- Saeed, S. (2017). Implementation of failure enterprise systems in an organizational perspective framework. International Journal of Advanced Computer Science and Applications, 8(5), 54–63. [CrossRef]
- Ashaari, M. A., Singh, K. S. D., Abbasi, G. A., Amran, A., & Liebana-Cabanillas, F. J. (2021). Big data analytics capability for improved performance of higher education institutions in the Era of IR 4.0: A multi-analytical SEM & ANN perspective. Technological Forecasting and Social Change, 173, 121119. [CrossRef]
- Ajegbile, M. D., Olaboye, J. A., Maha, C. C., & Tamunobarafiri, G. (2024). Integrating business analytics in healthcare: Enhancing patient outcomes through data-driven decision making. World J Biol Pharm Health Sci, 19, 243-50. [CrossRef]
- Farooq, U., Naseem, S., Mahmood, T., Li, J., Rehman, A., Saba, T., & Mustafa, L. (2024). Transforming educational insights: Strategic integration of federated learning for enhanced prediction of student learning outcomes. The Journal of Supercomputing, 1-34. [CrossRef]
- Mahawar, K., & Rattan, P. (2024, August). Optimizing Educational Outcome Prediction: Leveraging Chi-Square Method for Effective Feature Selection. In 2024 IEEE 5th India Council International Subsections Conference (INDISCON) (pp. 1-6). IEEE. [CrossRef]
- Arnika, Sharma, R. K., Kanaujia, V. K., Yadav, S. P., & Al-Turjman, F. (2024, February). Leveraging Big Data Analytics to Enhance Networking Performance in Intelligent IoT. In International Conference On Artificial Intelligence Of Things For Smart Societies (pp. 117-124). Cham: Springer Nature Switzerland. [CrossRef]
- Baniata, L. H., Kang, S., Alsharaiah, M. A., & Baniata, M. H. (2024). Advanced Deep Learning Model for Predicting the Academic Performances of Students in Educational Institutions. Applied Sciences, 14(5), 1963. [CrossRef]
- Nicholas, I., Kuo, H., Perez-Concha, O., Hanly, M., Mnatzaganian, E., Hao, B., ... & Barbieri, S. (2024). Enriching Data Science and Health Care Education: Application and Impact of Synthetic Data Sets Through the Health Gym Project. JMIR Medical Education, 10(1), e51388. [CrossRef]
- Ajegbile, M. D., Olaboye, J. A., Maha, C. C., & Tamunobarafiri, G. (2024). Integrating business analytics in healthcare: Enhancing patient outcomes through data-driven decision making. World J Biol Pharm Health Sci, 19, 243-50. [CrossRef]
- Saeed, S., Abdullah, A., Jhanjhi, N. Z., Naqvi, M., & Nayyar, A. (2022). New techniques for efficiently k-NN algorithm for brain tumor detection. Multimedia Tools and Applications, 81(13), 18595–18616. [CrossRef]
- Saeed, S. (2024). Improved hybrid K-nearest neighbors’ techniques in segmentation of low-grade tumor and cerebrospinal fluid. [CrossRef]
- Gopi, R., Sathiyamoorthi, V., Selvakumar, S., Manikandan, R., Chatterjee, P., Jhanjhi, N. Z., & Luhach, A. K. (2022). Enhanced method of ANN based model for detection of DDoS attacks on multimedia internet of things. Multimedia Tools and Applications, 1-19. [CrossRef]
- Dogra, V., Singh, A., Verma, S., Kavita, Jhanjhi, N.Z., Talib, M.N. (2021). Analyzing DistilBERT for Sentiment Classification of Banking Financial News. In: Peng, SL., Hsieh, SY., Gopalakrishnan, S., Duraisamy, B. (eds) Intelligent Computing and Innovation on Data Science. Lecture Notes in Networks and Systems, vol 248. Springer, Singapore. [CrossRef]
- Alex, S. A., Jhanjhi, N. Z., Humayun, M., Ibrahim, A. O., & Abulfaraj, A. W. (2022). Deep LSTM model for diabetes prediction with class balancing by SMOTE. Electronics, 11(17), 2737. [CrossRef]
- Chesti, I. A., Humayun, M., Sama, N. U., & Jhanjhi, N. Z. (2020, October). Evolution, mitigation, and prevention of ransomware. In 2020 2nd International Conference on Computer and Information Sciences (ICCIS) (pp. 1-6). IEEE. [CrossRef]
- Alkinani, M. H., Almazroi, A. A., Jhanjhi, N. Z., & Khan, N. A. (2021). 5G and IoT based reporting and accident detection (RAD) system to deliver first aid box using unmanned aerial vehicle. Sensors, 21(20), 6905. [CrossRef]
- Alferidah, D. K., & Jhanjhi, N. Z. (2020, October). Cybersecurity impact over bigdata and iot growth. In 2020 International Conference on Computational Intelligence (ICCI) (pp. 103-108). IEEE. [CrossRef]
- Humayun, M., Jhanjhi, N. Z., Hamid, B., & Ahmed, G. (2020). Emerging smart logistics and transportation using IoT and blockchain. IEEE Internet of Things Magazine, 3(2), 58-62. [CrossRef]
- Srinivasan, K., Garg, L., Chen, B. Y., Alaboudi, A. A., Jhanjhi, N. Z., Chang, C. T., ... & Deepa, N. (2021). Expert System for Stable Power Generation Prediction in Microbial Fuel Cell. Intelligent Automation & Soft Computing, 30(1). [CrossRef]
- Humayun, M., Niazi, M., Jhanjhi, N. Z., Mahmood, S., & Alshayeb, M. (2023). Toward a readiness model for secure software coding. Software: Practice and Experience, 53(4), 1013-1035. [CrossRef]
- Mughal, M. A., Ullah, A., Cheema, M. A. Z., Yu, X., & Jhanjhi, N. Z. (2024). An intelligent channel assignment algorithm for cognitive radio networks using a tree-centric approach in IoT. Alexandria Engineering Journal, 91, 152-160. [CrossRef]
- Konatham, B., Simra, T., Amsaad, F., Ibrahem, M. I., & Jhanjhi, N. Z. (2024). A Secure Hybrid Deep Learning Technique for Anomaly Detection in IIoT Edge Computing. Authorea Preprints. [CrossRef]
Disclaimer/Publisher’s Note: The statements, opinions and data contained in all publications are solely those of the individual author(s) and contributor(s) and not of MDPI and/or the editor(s). MDPI and/or the editor(s) disclaim responsibility for any injury to people or property resulting from any ideas, methods, instructions or products referred to in the content. |
© 2025 by the authors. Licensee MDPI, Basel, Switzerland. This article is an open access article distributed under the terms and conditions of the Creative Commons Attribution (CC BY) license (http://creativecommons.org/licenses/by/4.0/).
Copyright: This open access article is published under a Creative Commons CC BY 4.0 license, which permit the free download, distribution, and reuse, provided that the author and preprint are cited in any reuse.


