
Submitted:
07 January 2025
Posted:
08 January 2025
You are already at the latest version
Abstract
Change detection, as a popular research direction for dynamic monitoring of land cover change, usually use hyperspectral remote sensing images as data sources. Hyperspectral images have rich spatial-spectral information, but traditional change detection methods have limited ability to express the features of hyperspectral images, and it is difficult to identify the complex detailed features, semantic features, and spatial-temporal correlation features in the two-phase hyperspectral images. Therefore, how to effectively use the abundant spatial information and spectral information in hyperspectral images to complete change detection has become a challenging task. This paper proposes a hyperspectral image change detection method based on deep Siamese network, which uses the spatiotemporal attention module to translate bi-temporal hyperspectral images to the same eigenspace, uses the deep Siamese network structure to extract deep semantic features and shallow spatial features, and measures sample features according to Euclidean distance. In the training phase, the model is optimized by minimizing the loss of distance maps and label maps. In the testing phase, the prediction map is generated by simple thresholding of distance maps. Experiments show that on the four datasets, the proposed method can achieve a good change detection effect.
Keywords:
hyperspectral image
; change detection
; siamese network
; metrics learning
1. Introduction
In recent years, satellite remote sensing technology is characterized by macro, comprehensive, rapid, dynamic, and accurate, which is well used to investigate Earth resources, to observe regional environmental changes, and to study the change of global environmental [1]. As the most advanced means to acquire land-cover information, remote sensing has many merits such as real-time, objective and wide coverage [2]. Since the 1990s, remote sensing image technology has performed well in various applications such as urban development planning, natural resource investigation and monitoring, and agricultural fine identification [3,4,5].
Hyperspectral images in remote sensing data can detect substances with diagnostic spectral absorption characteristics, and simultaneously image the target area through fine and continuous spectral bands. There is presumably continuous spectrum of surface objects in the imaging area [6]. Hyperspectral image data can be vividly described by “three-dimensional data blocks”. In the two-dimensional plane coordinate system, the wavelength information axis of each pixel is added, which integrates image spatial and spectral information. Moreover, it has higher spectral resolution and spatial resolution, thus providing more abundant ground object information [7]. With the wide coverage, rich spatial and spectral information, hyperspectral images are becoming the main means of ground observation. Therefore, using multi-temporal hyperspectral data for dynamic monitoring of land cover changes is gradually becoming a popular research direction in remote sensing [8].
Hyperspectral change detection is based on bi-temporal hyperspectral image data collected from two different periods and covering the same position to analyze the dynamic changes of the ground surface. Specifically, labels are assigned to each pixel in an image, which indicates whether the category of ground objects of the corresponding pixel changes [9]. Therefore, accurate analysis results require many high-quality remote sensing data. Hyperspectral remote sensing images have rich spatial-spectral information, but traditional change detection methods [10,11,12] have limited ability to express the features of hyperspectral images. And it is hard to identify complex detailed characteristics, semantic features and spatial-temporal correlation properties in bi-temporal hyperspectral remote sensing images. In addition, the models of traditional change detection also have great differences in performance, poor generalization ability, low detection accuracy, obvious detection noise on different quality sample sets and other shortcomings, which can no longer meet the current demand for high-precision change detection [13].
Along with the rapid advances in the technology of image processing and computer vision, the research progress in machine learning promotes that the corresponding algorithms is applied in change detection domain. The object-oriented analysis thought in computer vision is applied to the change detection. [14] proposed an unsupervised method, which directly calculates image differences in feature space, and used kernel K-means algorithm and support vector machine to determine the change area. [15] studied the applicability of SVM in hyperspectral image change detection, proposed two combination frameworks of SVM, and verified the effectiveness of SVM in hyperspectral image change detection through recognition rate and other indicators. In addition, the support vector machines designed for high-resolution images in [16], decision trees used for automatic recognition of change regions in [17], multi-core learning models designed in [18], and the extreme learning machine used in [19]. These theories and methods have obtained better accuracy in change detection. However, due to the large amount of computation and complex form, these methods are difficult to simultaneously utilize both image difference information and their own spatial information. Therefore, these methods fail to have good generalization in different data distributions.
With the advantages of deep learning in various fields and the advent of the remote sensing big data era, deep learning is introduced into remote sensing image change detection. [20] overlaid two temporal images to generate fused features and implemented change detection by using CNN. [21] used CNN with Siamese structure to extract features from images of two periods respectively and used matrix multiplication to realize feature fusion for feature maps extracted from two Siamese branches. In computer vision tasks, change detection is considered to be a semantic segmentation problem. In recent years, the change detection framework combining typical semantic segmentation models and Siamese networks has gradually been widely applied in change detection tasks. And experiments have shown that the change detection model designed using this framework can achieve similar or even better qualitative and quantitative effects compared to existing specialized change detection models [22]. [23] proposed the processing method of nested structure and new Siamese network features, improved the semantic segmentation network UNet++, proposed a full convolutional Siamese network for change detection. [24] proposed the method of combining Siamese networks with attention mechanism, proposed a self-attention mechanism for change detection, which is used to model the spatiotemporal correlation between bi-temporal images and to update the feature map in the process of feature extraction to obtain features with time invariability. [25] used the high symmetry of hyperspectral images to propose a cross-time interactive symmetric attention network, extracted spatial-spectral features with improved the dual-attention mechanism, and obtained the time correlation of bi-temporal images pixels by using interactive symmetry of corresponding images. Existing change detection models based on deep Siamese networks use Siamese structures to extract features and have strong interpretability [24]. However, the utilization of spatial features and spectral features is insufficient, and the spatiotemporal relationship between the changing data is ignored. Meanwhile, these methods perform poorly on datasets with extremely imbalanced samples.
Given the considerations above, this article mainly proposes a hyperspectral image change detection model based on deep Siamese network. Then establish the model by combining the spatiotemporal attention mechanism and semantic feature extraction to construct the change detection method. The spatiotemporal attention mechanism is used to translate the bi-temporal hyperspectral images into the same feature space. Extracting deep semantic features and shallow spatial features by semantic feature extraction. So this method can effectively balance both differential information and self-spatial information, emphasizing the spatiotemporal relationship between changing data, thereby alleviating the problem of poor performance in imbalanced sample datasets.
2. Materials and Methods
2.1. Overview
Given bi-temporal remote sensing images and of size . The goal of change detection is to generate a label map named M that is equal in size to the input images. And every spatial position of the M is assigned a changeable label. This paper focuses on binary change detection, so the label contains 1 (changed) and 0 (unchanged). However, some datasets contain unlabeled regions, so the change labels on these of the datasets are 2 (unlabeled areas), 1 (changed), and 0 (unchanged).
Figure 1 shows the flow block diagram of this paper. This thesis proposes the deep Siamese neural network, which consists of three modules: attention module (Section 2.2), feature extractor (Section 2.3), and metrics module (Section 2.4). First, the original three-dimensional hyperspectral data is normalized and sliced, and the processed data is transformed into a hyperspectral dataset named , which contains bi-temporal images called and . This dataset has N samples of hyperspectral data blocks , each sample contains pixel patch of size in the neighborhood around the pixels, with spectral segments. For each sample, in order to obtain attention feature pairs , two hyperspectral data blocks are entered into the attention module simultaneously. Then after the feature extraction module processes these feature maps, the feature vectors can be obtained, where is the channel dimension of the feature vectors. In the metrics module, calculate the Euclidean distance between features for each sample pair in bi-temporal images and a distance map D can be generated. In the process of training, the model is optimized by minimizing distance and batch-balanced contrastive loss of label maps, so that the large distance value is changed point, and the small distance value is unchanged point. In the process of testing, use the simple thresholding of the distance map to calculate the predicted label map P.
2.2. Attention Module
The inspiration for attention mechanism comes from human research on biological systems [26]. It has a wide range of applications in various tasks of the computer vision, including object detection and image classification, and the effectiveness of attention mechanism in modeling spatiotemporal relationships has been demonstrated [27]. The key concept of attention mechanism is following with interest the emphasis of images. Inspired by this, this paper applies attenion mechanism in hyperspectral image change detection. Through the attention module, the input tensors of the bi-temporal sample pair are translated into the same feature space. This attention mechanism eliminates the noise difference effect of the pictures taken at different time. And it can capture abundant spatiotemporal relationships between sample pair, which helps to obtain attention features rich in spatiotemporal-spectral information. The attention module is described in detail below:
The attention module used in this article is shown in Figure 2. The attention module stacks bi-temporal features and into a feature tensor . Then sequentially inputing the feature tensor into the channel attention module and the spatial attention module [28] to generate an updated feature tensor . Finally, splitting it into bi-temporal feature maps .
In the channel attention module, the global max pooling and global average pooling sequentially process the input feature maps, so that the input features are compressed into channel descriptors of , and thereby the spatial information of bi-temporal feature map are compressed into the same spatial descriptor. Then it passes the fully connected layer to get attention weight matrix. The features output by the fully connected layer are activated by sigmoid to get the update channel attention feature map. Generate calibrated attention feature map The input feature map is multiplied pixel by pixel with the channel attention feature map, the calibrated attention feature map will be generated.
Equation (1) is the specific calculation process:
Where is sigmoid operation, is global average pooling, is global max pooling, is multilayer perceptron.
The input of the spatial attention module is the feature map, which is output from the channel attention module. First, proceeding global max pooling and global averag pooling, and connecting these processed feature maps to generate a valid feature descriptor , so that the bi-temporal input data is translated into the same feature space. Then the dimension of the bi-temporal input data is decreased to a single channel, and these data is activated by sigmoid to get the spatial attention feature. At last, the spatial attention feature is multiplied pixel by pixel with the input feature of the module, the final generated feature will be obtained and output.
Equation (2) is the specific calculation process:
Where is sigmoid operation, is a 2DCNN convolutional operation with convolutional kernel, is global average pooling, is global max pooling.
2.3. Feature Extractor Module
In tasks of remote sensing, deep convolutional neural networks have been extensively used, including land-use classification, image super-resolution and change detection [29]. And the change detection framework combining typical semantic segmentation models and Siamese networks has gradually been widely used in change detection tasks. Experiments have shown that the change detection model designed using this framework is similar or even better qualitative and quantitative effects than the existing change detection model [24]. The hyperspectral change detection task requires predicting images change labels pixel by pixel, which is a classification task. Therefore, this paper constructs a feature extractor by using ResNet [30].
A feature extractor based on ResNet-50 [30] was designed in this paper. The change detection task requires output change plots that are equal in size to the input image. For this reason, this paper omits the global pooling layer and the fully connected layer, which used in primary ResNet to map image features to 1000-dimensional vectors. Deep-level feature semantics in convolutional neural networks are accurate but the spatial information is rough, while shallow-level feature spaces are rich in detail but lack of semantic information. Therefore, deep-level semantic information will be combined with shallow-level spatial information to produce more detailed features in this paper. The feature extractor has four residual blocks. Each channel dimension is transformed into .The output feature of each residual block is sent to different convolutional layers. Then, all feature maps are resized to size . In this way, four groups of feature maps can be obtained from various phases of this network. Concatenate these four groups of feature maps at the channel dimension (the result is ) and send to the convolutional layer to produce the final feature vector (). This convolutional layer can generate more discriminative and representative features by reducing the feature channel dimension. In the experiment, after a trade-off, and is separately set to 96 and 64 to give consideration to efficiency and accuracy.
2.4. Metrics Module
2.4.1. Deep Metrics Learning
Deep metrics learning trains the network to study nonlinear transformations from input to embedded space, which makes the feature tensor of homologous samples is close while the feature tensor of different samples is far apart. Change detection methods based on deep metrics learning have achieved good performance over the last couple of years. This paper optimizes the model by minimizing distance and label loss, improves the comparison loss, and makes the distance of inter-class features long while the distance of intra-class features short. In each iteration of the training phase, given a sample feature pair , calculated the Euclidean distance of feature vectors in the embedding space. Learning the network parameters by improving contrastive loss so that the distance between changed pixels is large while the distance between unchanged pixels is small. In the process of testing, got predicted change labels through fixed threshold segmentation.
Equation (3) is the Euclidean distance of tensor and :
where is the hyperspectral feature vector of the first temporal, is the hyperspectral feature vector of the second temporal. The automatic learning process of the distance is achieved by training two branches of convolutional neural network that share same weights. If the two hyperspectral data blocks are similar, the distance between two tensors is short, otherwise, if they change, the distance is long.
In the process of testing, got change map P through fixed threshold segmentation:
Equation (3) is the threshold division process:
i , j are the indexes of pixel abscissa and pixel ordinate, respectively. The threshold is set to 1. The pixels marked as 1 are recognized as change pixels in the changed map P, and the pixels marked as 0 are recognized as unchanged pixels.
2.4.2. Loss Function
Most multi-classification tasks in machine learning generally have imbalance issues [31]. For change detection in remote sensing images, there is a significant difference in the number of changed and unchanged pixels. Usually, the changed pixels only account for a small portion of all pixels, and this can cause bias in the network in the process of training. This article cites the batch-balanced contrastive loss (BCL) [32] to reduce the impact of class imbalances and uses batch weights instead of the original class weights of the contrastive loss. Given a bi-temporal sample pair (), , , where are bi-temporal samples, M is a label map. The sample distance is acquired by means of the attention module and the feature extraction module.
Equation (4) is the definition of BCL:
where D expresses the distance map composed of the Euclidean distance of a training batch of bi-temporal hyperspectral images. M represents the label map composed of the category labels of a training batch of bi-temporal hyperspectral images. represents the elements in distance map D. expresses the elements in the label map M; b represents the training batch. i, j stands for the indexes of pixel abscissa and pixel ordinate, respectively. , represents the number of changed and unchanged pixels, respectively. m represents the threshold.
2.5. Dataset Description
The first dataset used in the experiment, Farm, includes two hyperspectral images for change detection, which were respectively collected on May 3, 2006, and April 23, 2007. The images are data of agricultural wet areas of Yancheng, Jiangsu Province and acquired by Earth Observing-1 (EO-1) sensor with 242 spectral bands. The spatial resolution of the sensor is about 30 meters covering a spectrum with a wavelength of 0.4-2.5 microns, with a spectral resolution of 10 nanometers. Due to interference from atmospheric water vapor, the collected data exhibits low signal-to-noise ratio noise. After removing the bands affected by water vapor interference, the experiment used the dataset size of pixels, 155 bands. Figure 3a shows dataset images and the ground-truth images.
The second dataset used in the experiment, River, includes two hyperspectral images for change detection, which were collected on May 3, 2013, and November 31, 2013, respectively, the data of changes in the river basin of a certain place in Jiangsu Province. The images were collected by EO-1 sensor. Based on existing research and ENVI analysis, spectral segments with high signal-to-noise ratio were selected for experimentation in this paper. The experiment used the dataset size of pixels, 198 bands. Figure 3b illustrates dataset and ground-truth images.
The third dataset, Babara, includes two hyperspectral images for change detection, which were respectively collected in 2013 and 2014 in Santa Barbara, California. And the images were collected by Airborne Visible Infrared Imaging Spectrometer (AVIRIS) sensor with 224 bands. The AVIRIS data can provide a spatial resolution of 20 meters covering a spectrum with a wavelength of 0.4-2.5 microns, with a spectral resolution of 10 nanometers. The experiment used the dataset size of pixels, 224 bands. Figure 3c shows dataset images and ground-truth images. In the figure, purple indicates unlabeled pixels, cyan indicates unchanged pixels, and yellow indicates changed pixels.
The fourth dataset used in the experiment, Bayarea, includes two hyperspectral images for change detection, which were respectively collected in 2013 and 2015 in Patterson, California. The images were collected by AVIRIS sensor. The experiment used the dataset size of pixels, 224 bands. Figure 3d shows the dataset images and the ground-truth images. In the figure, purple indicates unlabeled pixels, cyan indicates unchanged pixels, and yellow indicates changed pixels.
2.6. Implementation Details
2.6.1. Criteria
This paper will use the confusion matrix to obtain Classification accuracy, Precision, Recall, Missing alarm, and False alarm as evaluation criteria.

Table 1.
Confusion matrix.
| Real Images | ||||
|---|---|---|---|---|
| Predicted Images | Pixel type | Changed | Unchanged | Row Total |
| Changed | ||||
| Unchanged | ||||
| Column Totals | N | |||
Classification accuracy = , which reflects the proportion of samples judged to be correct in all samples.
Precision = , which reflects the proportion of true positives in the positive samples.
Recall = , which reflects the ratio of correctly judged positive samples in all positive samples.
Missing alarm = , which reflects that how many positive samples have been missed.
False alarm = , which reflects that how many of the samples judged as positive were wrong.
2.6.2. Dataset
This paper splits the dataset into two parts at random, with 10% for training and 90% for testing. Each sample pixel block in the dataset contains neighborhood pixels in a range of around it.
2.6.3. Training Setting
The implementation of this method is based on the Pytorch [33]. This model was fine-tuned based on ResNet-50[29] model, which was pre-trained by ImageNet. The initial learning rate is . In the first 30 epochs, maintain the same learning rate, while in the remaining 70 epochs gradually decreased it linearly to 0. This article adopts the Adam optimizer [34], which batch size is 32.
2.6.4. Comparison Method
CNN: The input of this network is a difference map between bi-temporal sample pair. The network structure is the same as the feature extractor based on Resnet-50 while the residual structure is deleted, and the 2D convolutional layer is followed by the feature extractor to reduce the changing feature to 1 dimension. In the process of training, learning the network parameters by using contrast loss so that the distance between changed pixels is large while the distance between unchanged pixels is small. In the process of testing, the predicted change labels are obtained by means of a fixed threshold segmentation.
Siam-Resnet: The input of this network is bi-temporal sample pair. The network has two branch structures, each branch structure is the same as the Section 2.3 feature extractor, and the feature extractor is followed by the metric module to output the Euclidean distance of their feature. During the training stage, studying network parameters through contrastive loss, so that the distance between changed pixels is large while the distance between unchanged pixels is small. During the testing stage, the predicted changed label is obtained by means of a fixed threshold segmentation.
3. Results and Discussion
This part gives a thorough evaluation of the model presented in this paper and makes a comparison with several other change detection methods. Our experiments were done on the Farm, River, Babara, and Babarea datasets.
3.1. Experiment on Farm Dataset
Attention Module Ablation Experiment: Verify the effectiveness of the attention module by comparing Siam-Resnet with the method presented in this article. The ablation experiment of the Farm testing dataset is shown in Table 2. The performance of our method can be evaluated by calculating classification accuracy, precision, and recall. We can observe that the method in this paper of adding attention module is significantly improved than Siam-Resnet. Compared with Siam-Resnet, this article method has improved classification accuracy, precision and recall. Meanwhile, the attention module has a better effect using convolutional kernel of size than using convolutional kernel of size on the Farm dataset.
Batch-balanced contrastive loss ablation experiment: The BCL used in this paper is helpful to alleviate imbalances of class. Table 3 shows the BCL ablation experiment on the Farm testing dataset. It can be observed that compared with traditional Contrastive Loss, the performance of various models (CNN, Siam-Resnet, method in this paper) has been improved with BCL. In each training iteration, the contribution of minority (changed) samples and majority (unchanged) samples to loss is dynamically balanced with BCL. And it can reduce the likelihood that the network will skew toward a certain category, and thus bring with improvement in model performance.
Figure 4 illustrates the comparison of various change detection method. The triangle part on the right edge of the CNN prediction map is significantly different from the label map. At the same time, there is a large amount of white noise in the prediction map, and there has a serious false alarm phenomenon. The prediction map generated by Siam-Resnet has many continuous banded noise bars, and the noise bar occurrence area is similar to the noise region of the CNN prediction map. It is because neither the CNN method nor the Siam-Resnet method can eliminate the misjudgment of the same region caused by the noise difference caused by the image taken at different times. The edge of the prediction map produced by the CSA-Net method is clear and continuous. The model learns the joint features of time-space-spectrum through the cross-time interactive attention module, but it is easy to dilute the differences between different samples in the process of complementing the features in the time domain. It can be result in the discriminating the changed pixels of the entire region as unchanged pixels, such as the triangle part of the right edge of the prediction map. It can be observed that more detailed results are obtained in this article method. Because using spatiotemporal attention module to learn local spatiotemporal relationships between the corresponding pixel blocks, and these relationships are used to obtain better features.
The deep features extracted by CNN, Siam-Resnet and the method in this paper respectively on Farm dataset was processed of dimensionality reduction and visualization by the method of t-SNE. Figure 5 shows the comparison result. Compared with the CNN method and Siam-Resnet method, the method in this paper has the larger distance between changed and unchanged pixels, and extracts more representative features. It can be observed that the spacing of the feature classes extracted by CNN and Siam-Resnet is small, and there is partial aliasing. In this paper, the extracted feature classes spacing are greater and outliers are less, and it can separate changed pixels and unchanged pixels more effectively.
To analyze feature extraction performance of various methods in the class imbalance dataset more intuitively, using the Farm dataset as an example for visual analysis. Figure 6 shows the metric feature visualization comparison results of Siam-Resnet and this article method. Compared with Siam-Resnet, the extracted features by the method in this paper are more differentiated and more conducive to the threshold division of the measurement module. The metric characteristics extracted by Siam-Resnet in the figure have many noise peaks. It is not conducive to the threshold division of the measurement module. The metric characteristics extracted in this methodology are closer to the visualization results of the real label map, so the network in this paper can get better performance.
3.2. Experiment on River, Babara, Bayarea Datasets
The performance of this article is also evaluated on several other datasets and compared it to CNN and Siam-Resnet. Figure 7 illustrates the performance of change detection by various methods on different datasets. This paper model can obtain the more accurate and smoother results than other methods. Figure 8 illustrates the performance data comparison of various methods on three datasets. It can be observed that the method proposed in this paper consistently outperforms other methods in precision, missing alarm, and false alarm.
Figure 7 illustrates the result on three datasets, result of this article method consistently performs more accurately and smoothly, and the false alarm is lower than other methods. On the River dataset, as shown in Figure 7a,d, for some unchanged regions, CNN and Siam-Resnet incorrectly detect them as changed regions, such as the circular beach in the lower left part and in the middle of the figure. This paper method can learn the data distribution of hyperspectral images, eliminate the influence of noise, and obtain more effective feature representation, so as to achieve better change detection effect. Bayarea dataset is a change detection dataset of urban scenes. As shown in Figure 7e, CNN method detects some unchanged regions as changed regions, for example, the part of the figure on the right side where the change labels are scattered. Figure 7f shows that the Siam-Resnet method has a false check of the entire block in the lower edge of the figure. Figure 7g shows that this method is more sensitive to contour changes, and the distinction between the intersection of the changed area and the unchanged region is smoother and more accurate. On the Babara dataset, as shown in Figure 7i, the CNN method has a large number of false detection areas. Figure 7j shows that Siam-Resnet contains many cyan noise spots. Figure 7h shows the method in this paper eliminates the atmospheric influence and environmental noise of taking hyperspectral images at different times. Because it learns the space-time-spectral joint information of hyperspectral images and obtains more effective feature representation and obtain better prediction maps.
Figure 8 illustrates the performance comparation of various methods on three datasets. Change detection task requires both high precision and low missing alarm. The method proposed in this paper is always better than other methods in terms of precision, missing alarm and false alarm. It can accomplish the task of change detection better. Among them, compared with Siam-Resnet, the classification accuracy was improved by an average of 0.83%, and the missing alarm was reduced by an average of 0.77% on the three datasets. Compared with CNN, the classification accuracy was improved by an average of 2.16%, and the missing alarm was reduced by 2.05% on average.
4. Conclusions
This paper takes hyperspectral images as the research object and proposes a hyperspectral image change detection model based on deep Siamese network. Bi-temporal hyperspectral images are translated into the same feature space by using attention module, so that excluding the effects of atmospheric differences and noise in bi-temporal conditions. Extracting deep semantic features and shallow spatial features by using semantic segmentation network Resnet. Measuring sample features by using Euclidean distance. In the process of training, optimizing the model by minimizing distance and label loss. In the process of testing, labels are predicted by simple thresholding of distance map.
The experiments were done on four datasets: Farm, River, Bayarea, and Babara. Compared with the methods based on CNN and Siam-Resnet, the method in this paper obtains higher classification accuracy, lower missing alarm and lower false alarm. The prediction maps generated by this method are more detailed and smoother, with less noise. Ablation experiments were conducted on the attention module and the BCL module of the Farm dataset. The experiments have shown that the attention module significantly improved model performance. In the attention module, compared with the convolutional kernel of size , the convolutional kernel of size has better results. In CNN, Siam-Resnet and the method of this paper, BCL module can obtain good change detection indicators, and improve the performance of the model.
Future and Prospect: Hyperspectral data has the characteristics of difficulties in obtaining labeled samples. In this experiment, 10% of the samples are used for training, and 90% of samples for testing. However, there is still a problem that the high cost of sample labeling in practical applications. The next target is to build a suitable unsupervised hyperspectral image change detection method and find a suitable abnormal sample removal method to increases the accuracy and stability of prediction in it.
Author Contributions
Conceptualization, XT.L. and XL.L.; methodology, XT.L. and XL.L.; software and experiments, XT.L. and XL.L.; validation, XT.L. and XL.L.; writing—original draft preparation, XT.L. and XL.L.; writing—review and editing, XT.L., XL.L., Q.W., J.Q. and Y.W.; funding acquisition, XT.L., Q.W. and Y.W. All authors contributed to the results analysis and reviewed the manuscript. All authors have read and agreed to the published version of the manuscript.
Funding
This work is partly supported by Natural Foundation of Shandong Province (ZR2023ME057), Basic Research Support Program for Outstanding Young Teachers in Provincial Undergraduate Universities in Heilongjiang Province (YQJH2023262) and Scientific Research Foundation for Heilongjiang Postdoctoral (2901051708).
Institutional Review Board Statement
Not applicable.
Informed Consent Statement
Not applicable.
Data Availability Statement
Data are contained within the article.
Conflicts of Interest
The authors declare no conflicts of interest.
References
- Lai, J.B.; Kang, X.D.; Lu, X.K.; Li, S.T. A review of land observation satellite remote sensing application technology with new generation artificial intelligence. National Remote Sensing Bulletin. 2022, 26, 1530-1546. [CrossRef]
- Bai, J. Exploration of Dynamic Monitoring Methods for Surface Cover Water Surface Information. Surveying and Mapping Engineering. 2022, 31, 53-58. [CrossRef]
- Jia, P.; Chen, C.; Zhang, D.; Sang, Y.; Zhang, L. Semantic segmentation of deep learning remote sensing images based on band combination principle: Application in urban planning and land use. Computer Communications, 2024, 217, 97-106. [CrossRef]
- Jiao, Z. The Application of Remote Sensing Techniques in Ecological Environment Monitoring. Highlights in Science, Engineering and Technology, 2024, 81, 449-455. [CrossRef]
- Mariye, M.; Jianhua, L.; Maryo, M.; Tsegaye, G.; Aletaye, E. Remote sensing and GIS-based study of land use/cover dynamics, driving factors, and implications in southern Ethiopia, with special reference to the Legabora watershed. Heliyon. 2023, 10, e23380. [CrossRef]
- Song, R.X.; Feng, Y.N.; Cheng, W.; Wang, X.H. Advance in Hyperspectral Images Change Detection. Spectroscopy and Spectral Analysis, 2023, 43, 2354-2362. doi: 10.3964/j.issn.1000-0593.
- He, L.; Li, J.; Liu, C.Y.; Li, S.T. Recent Advances on Spectral-Spatial Hyperspectral Image Classification: An Overview and New 528 Guidelines. IEEE Trans on Geosci Remote Sens. 2018, 56, 1579-1597. [CrossRef]
- Yang, S.; Ji, L.Y.; Geng, X.R. Hyperspectral target detection method based on filter tensor analysis. Journal of University of Chinese Academy of Sciences. 2022, 39, 684-694. [CrossRef]
- Daudt, R.C.; Saux, B.L.; Boulch, A. Fully Convolutional Siamese Networks for Change Detection. 2018 25th IEEE International Conference on Image Processing (ICIP), Athens, Greece. 2018, 4063-4067. [CrossRef]
- Gong, M.G.; Su, L.Z.; Li, H.; Liu, J. Research Progress on Synthetic Aperture Radar Image Change Detection. Journal of Computer Research and Development. 2016, 53, 123-137. [CrossRef]
- Liu, J.; Gong, M.G.; Qin, K.; Zhang, P.Z. A Deep Convolutional Coupling Network for Change Detection Based on Heterogeneous Optical and Radar Images. IEEE Transactions on Neural Networks and Learning Systems. 2018, 29, 1-15. [CrossRef]
- Zhan, Y.; Fu, K.; Yan, M. et al. Change Detection Based on Deep Siamese Convolutional Network for Optical Aerial Images. IEEE Geoscience and Remote Sensing Letters. 2017, 14, 1845-1849. [CrossRef]
- Zhao, H.Y; Feng, K.Y; Wu, Y.; Gong, M.G. An Efficient Feature Extraction Network for Unsupervised Hyperspectral Change Detection. Remote Sensing. 2022, 14, 4646. [CrossRef]
- Volpi, M,; Tuia, D.; Camps-Vails, G.; Kanevski, M. Unsupervised Change Detection in the Feature Space using Kernels. 2011 IEEE International Geoscience & Remote Sensing Symposium(IGARSS), Vancouver, Canada, 2011; pp. 106-109. [CrossRef]
- Nemmour, H.; Chibani, Y. Multiple Support Vector Machines for Land Cover Change Detection: An Application for Mapping Urban Extensions. ISPRS Journal of Photogrammetry and Remote Sensing, 2006, 61, 125-133. [CrossRef]
- Cao, G.; Li, Y.P.; Liu, Y.Z.; Shang, Y.F. Automatic Change Detection in High-resolution Remote-sensing Images by Means of Level Set Evolution and Support Vector Machine Classification. International Journal of Remote Sensing, 2014, 35, 6255-6270. [CrossRef]
- Im, J.; Jensen, J.R. A change detection model based on neighborhood correlation image analysis and decision tree classification. Remote Sensing of Environment, 2005, 99, 326-340. [CrossRef]
- Saeid, N.; Begum, D.; Lorenzo, B.; Abdolreza, S.; Saeid, H. Multiple Kernel Learning for Remote Sensing Image Classification. IEEE Transactions on Geoscience and Remote Sensing, 2018, 56, 1425-1443. [CrossRef]
- Dahiya, N.; Singh, S.; Gupta, S.; Rajab, A.; Hamdi, M.; Elmagzoub, M.A.; Sulaiman, A.; Shaikh, A. Detection of Multitemporal Changes with Artificial Neural Network-Based Change Detection Algorithm Using Hyperspectral Dataset. Remote Sensing. 2023, 15, 1326. [CrossRef]
- Wang, Q.; Yuan, Z.H.; Du, Q.; Li, X.L. GETNET: A General End-to-End 2-D CNN Framework for Hyperspectral Image Change Detection. IEEE Transactions on Geoscience and Remote Sensing, 2019, 57, 3-13. [CrossRef]
- Lin, Y.; Li, S.T.; Fang, L.Y. Multispectral Change Detection With Bilinear Convolutional Neural Networks. IEEE Geoscience and Remote Sensing Letters, 2020, 17, 1757-1761. [CrossRef]
- Wu, W.H.; Lei, T.J. Research on the Framework of Remote Sensing Image Change Detection Method Based on Twin Network and Typical Semantic Segmentation Model. Land and Resources Informatization, 2021, (02): 15-21+6.
- Li, K.Y.; Li, Z.; Fang, S. Siamese Nested UNet Networks for Change Detection of High Resolution Satellite Image. International Conference on Control, Robotics and Intelligent System(CCRIS), New York,United States. 2020; pp. 42-48. [CrossRef]
- Chen, H.; Shi Z.W. A Spatial-Temporal Attention-Based Method and a New Dataset for Remote Sensing Image Change Detection. Remote Sensing, 2020, 12, 1662. [CrossRef]
- Song, R.X.; Ni, W.H.; Cheng W.; Wang, X.H. CSANet: Cross-Temporal Interaction Symmetric Attention Network for Hyperspectral Image Change Detection. IEEE Geoscience and Remote Sensing Letters, 2022, 19, 1-5. [CrossRef]
- Niu, Z.Y.; Zhong, G.Q.; Yu, H. A review on the attention mechanism of deep learning. Neurocomputing, 2021, 452, 48-62. [CrossRef]
- Guo, M.H.; Xu, T.X.; Liu, J.J. et al. Attention mechanisms in computer vision: A survey. Comp. Visual Media 8, 331–368 (2022). [CrossRef]
- Woo, S.; Park, J.; Lee, J.Y.; Kweon, I.S. CBAM: Convolutional Block Attention Module. Proceedings of the European Conference on Computer Vision (ECCV), 2018; pp. 3-19. [CrossRef]
- Zhu, X.X.; Tui, D.; Mou, L.; Xia, G.S.; Zhang, L.; Xu, F.; Fraundorfer, F. Deep learning in remote sensing: A comprehensive review and list of resources. IEEE Geosci. Remote. Sens. Mag, 2017, 5, 8–36. [CrossRef]
- Shafiq, M.; Gu, Z. Deep Residual Learning for Image Recognition: A Survey. Applied Sciences, 2022, 12, 8972. [CrossRef]
- Ghosh, K.; Bellinger, C.; Corizzo, R.; Branco, P.; Krawczyk, B.; Japkowicz, N. The class imbalance problem in deep learning. Machine Learning (2022). [CrossRef]
- Chen, H.; Shi, Z. A spatial-temporal attention-based method and a new dataset for remote sensing image change detection. Remote Sensing, 2020, 12, 1662. [CrossRef]
- Paszke, A.; Gross, S.; Chintala, S.; Chanan, G. et al. Automatic differentiation in PyTorch. In Proceedings of the 2017 Neural Information Processing Systems, Long Beach, CA, USA,2017; pp. 4–9. https://api.semanticscholar.org/CorpusID:40027675.
- Kingma, D.P.; Ba, J. Adam: A method for stochastic optimization. Computer Science, 2014. [CrossRef]
Figure 1.
Flow block diagram.
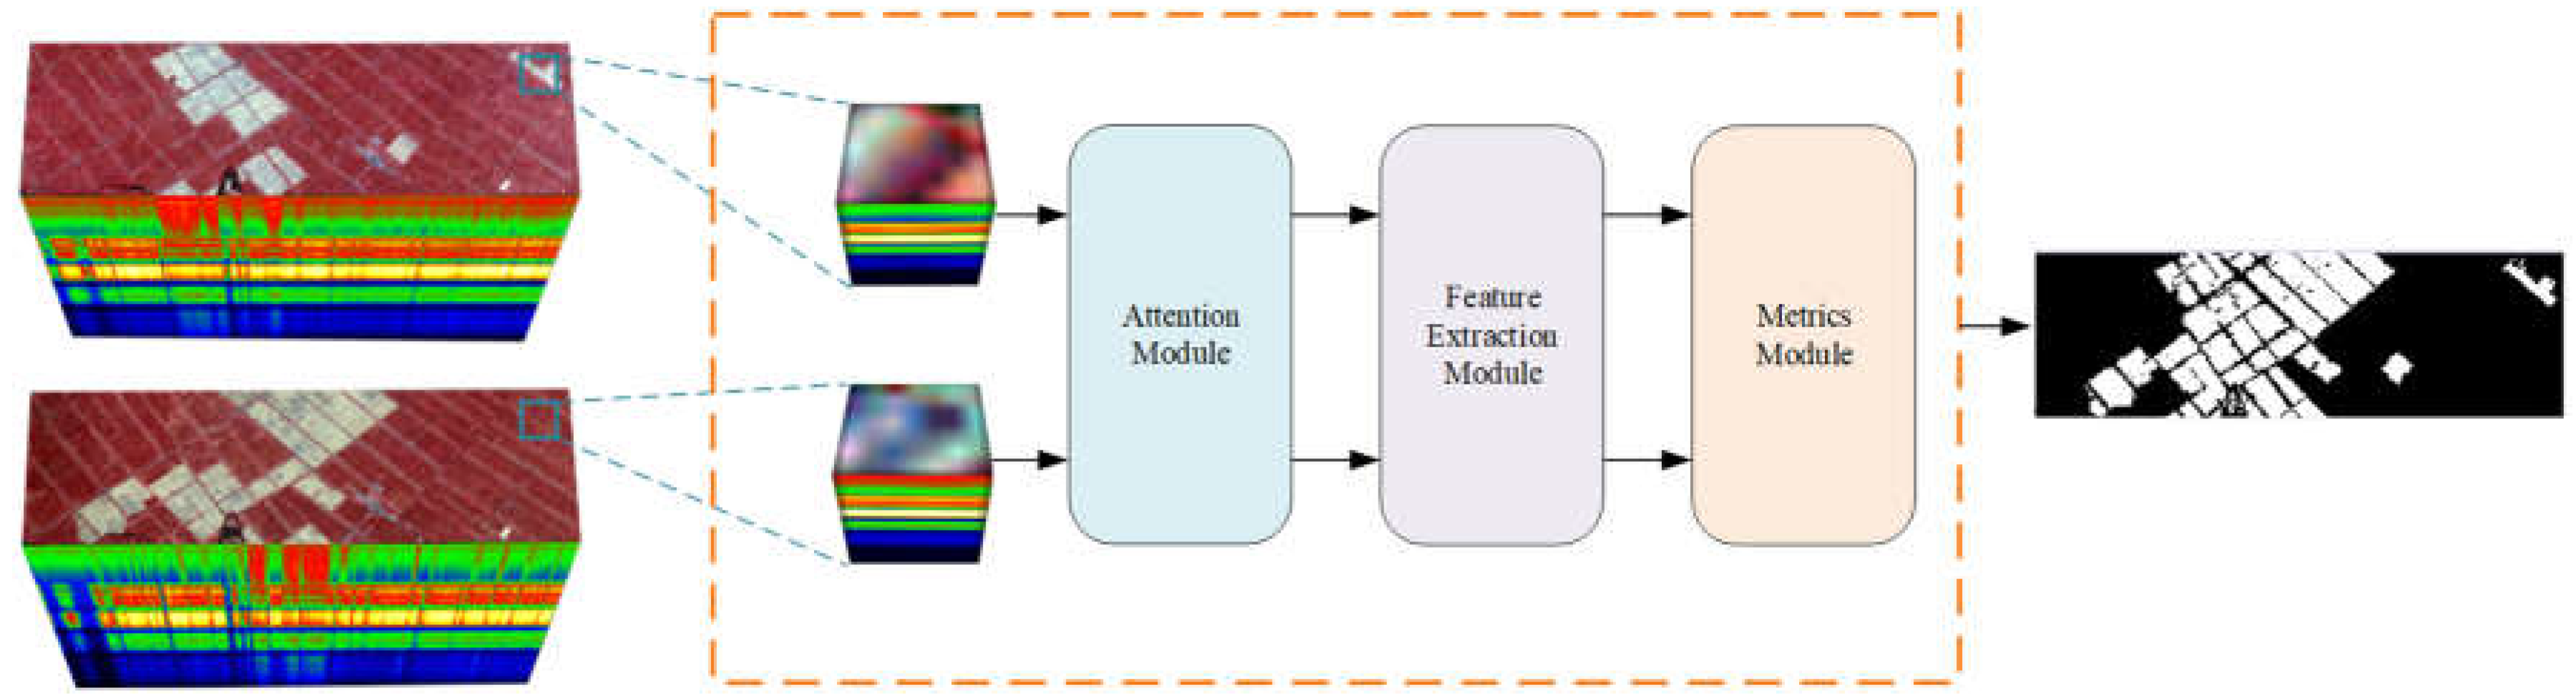
Figure 2.
Attention module of the change detection model.
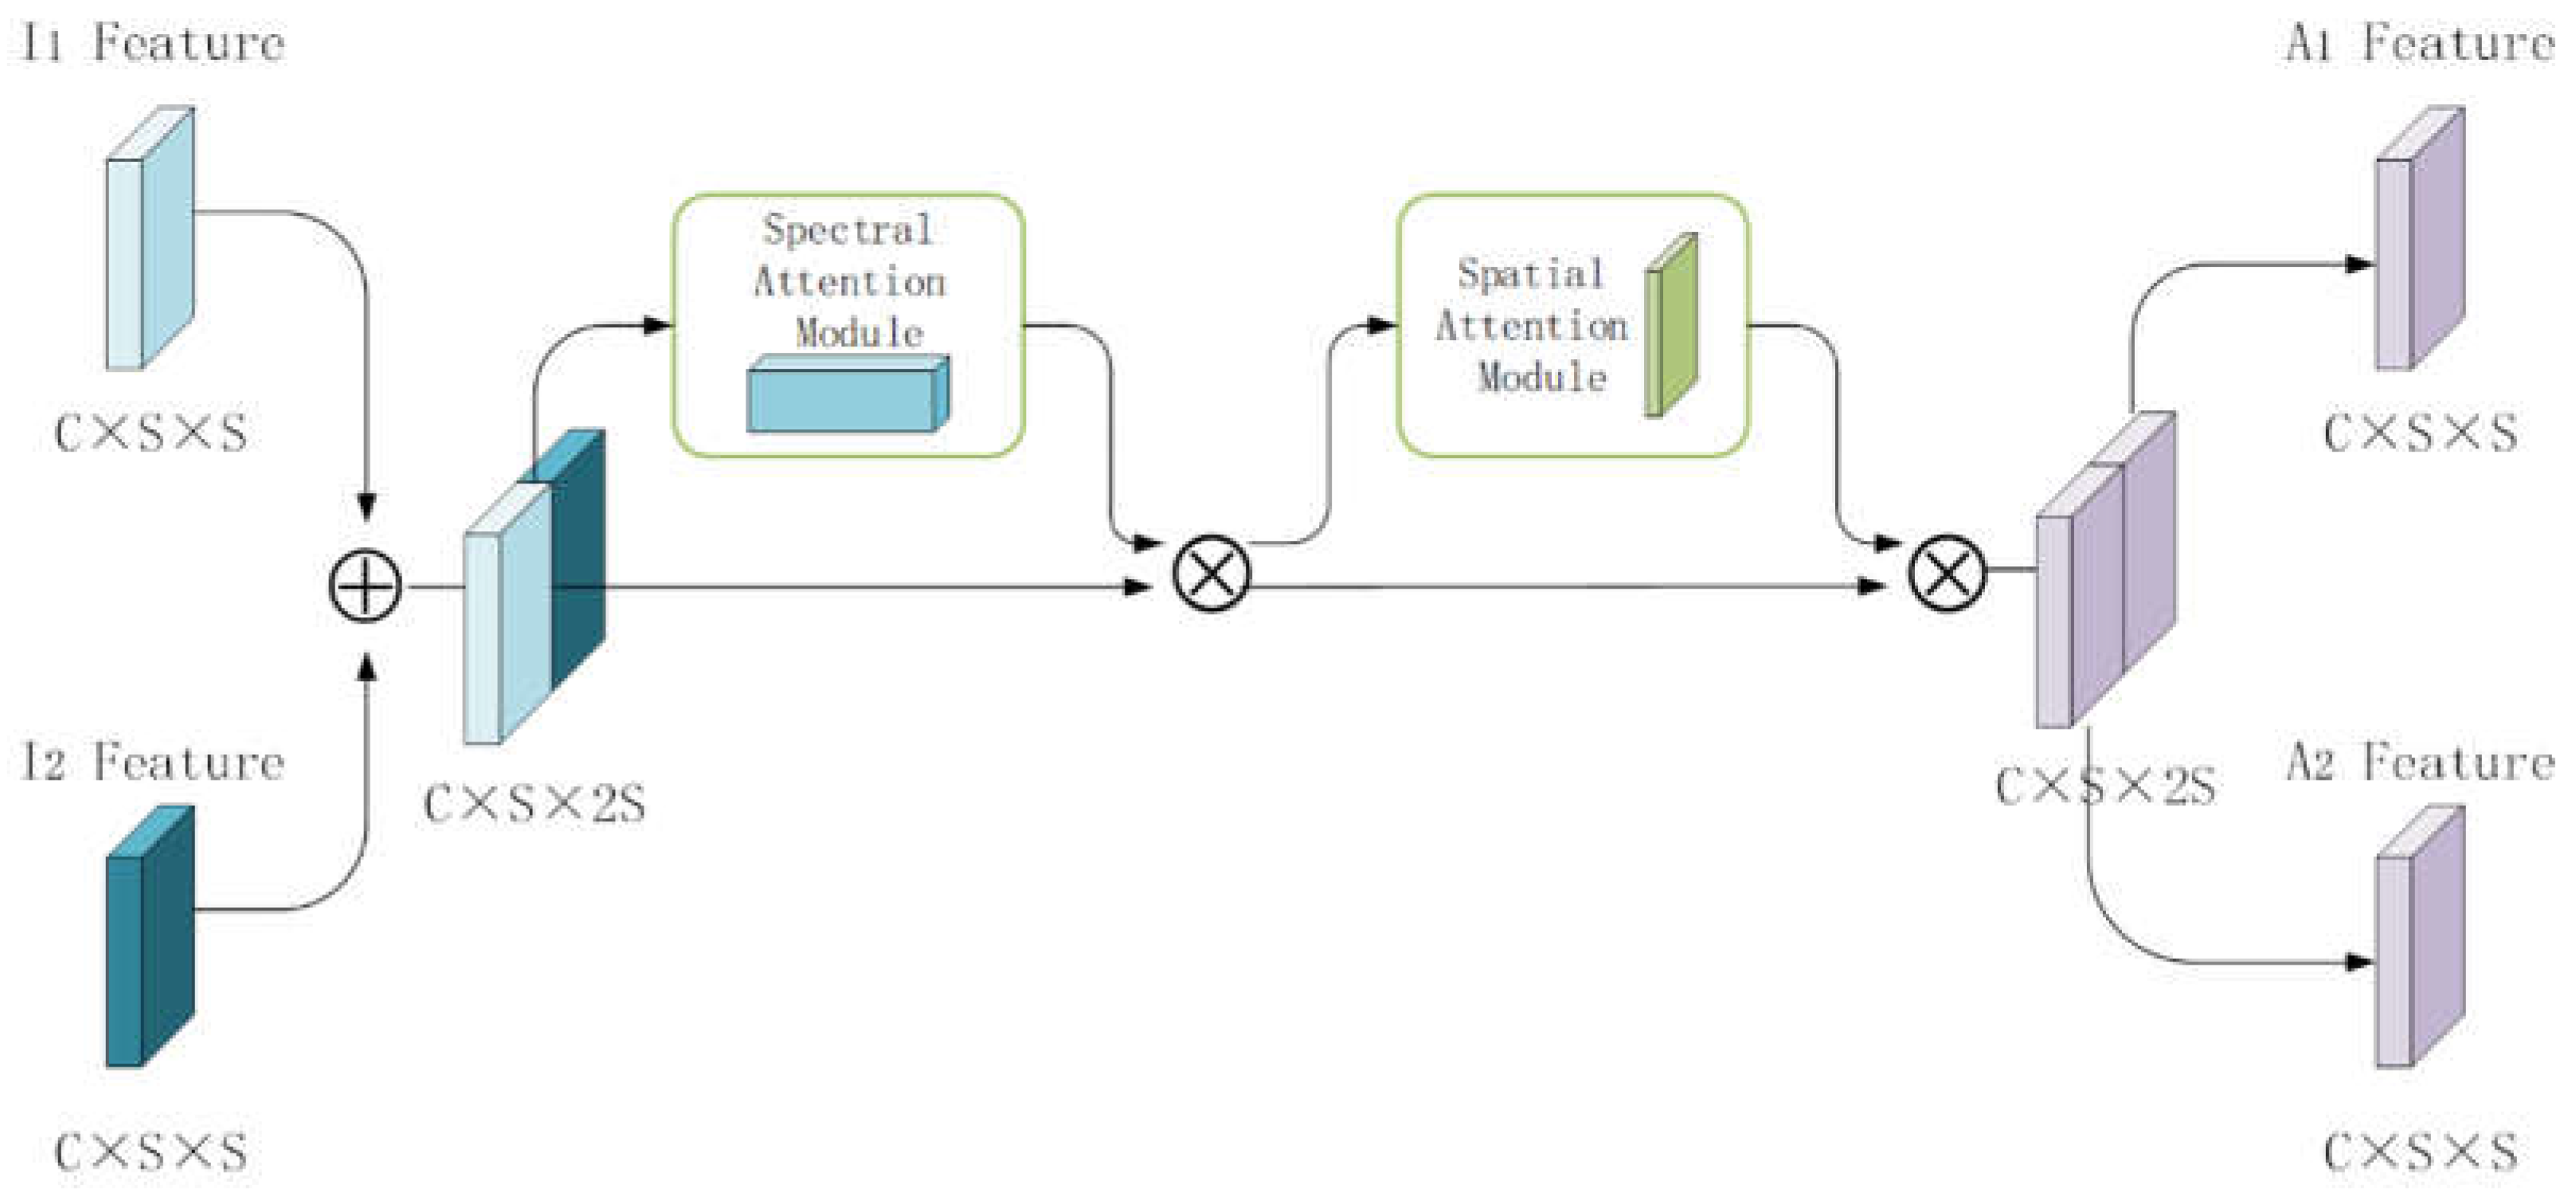
Figure 3.
The dataset used in this paper: (a)Farm dataset; (b)River dataset; (c)Babara dataset; (d)Bayarea dataser.
Figure 3.
The dataset used in this paper: (a)Farm dataset; (b)River dataset; (c)Babara dataset; (d)Bayarea dataser.
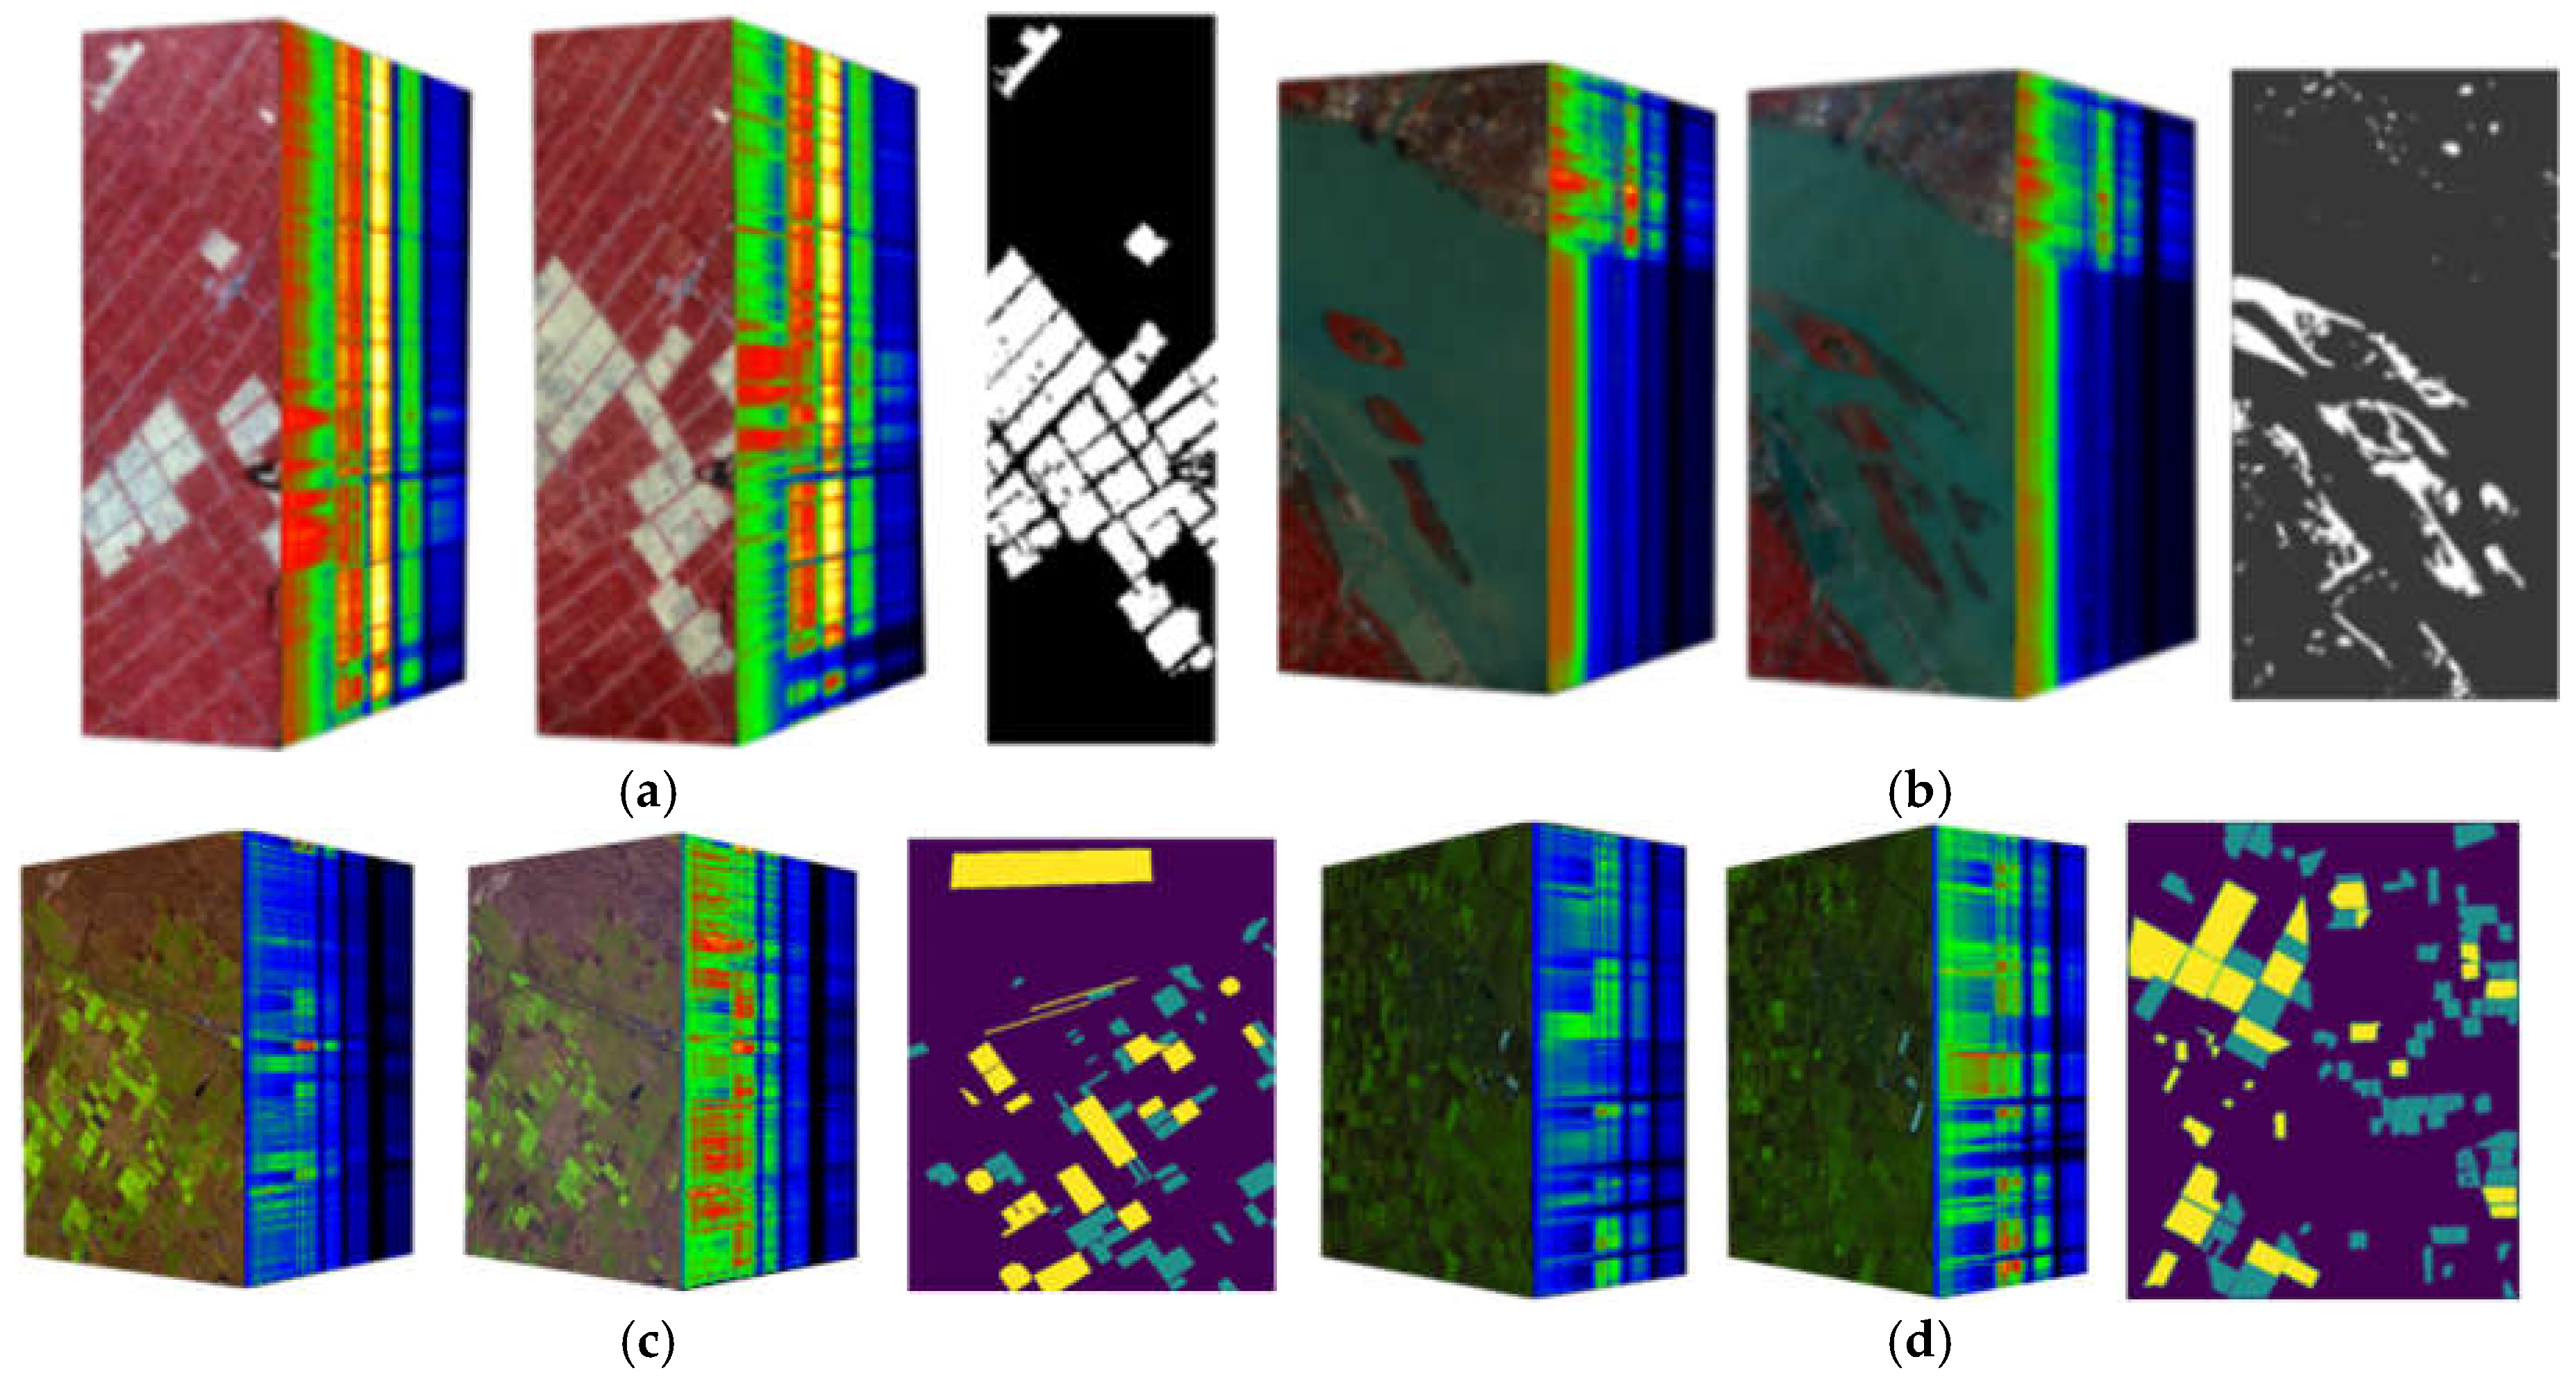
Figure 4.
Comparison of change detection effects on Farm dataset. (a) Change detection result of CNN model; (b) Change detection result of Siam-Resnet model; (c) Change detection result of CSA-net model; (d) Change detection result of the method in this paper; (e) Ground truth map.
Figure 4.
Comparison of change detection effects on Farm dataset. (a) Change detection result of CNN model; (b) Change detection result of Siam-Resnet model; (c) Change detection result of CSA-net model; (d) Change detection result of the method in this paper; (e) Ground truth map.
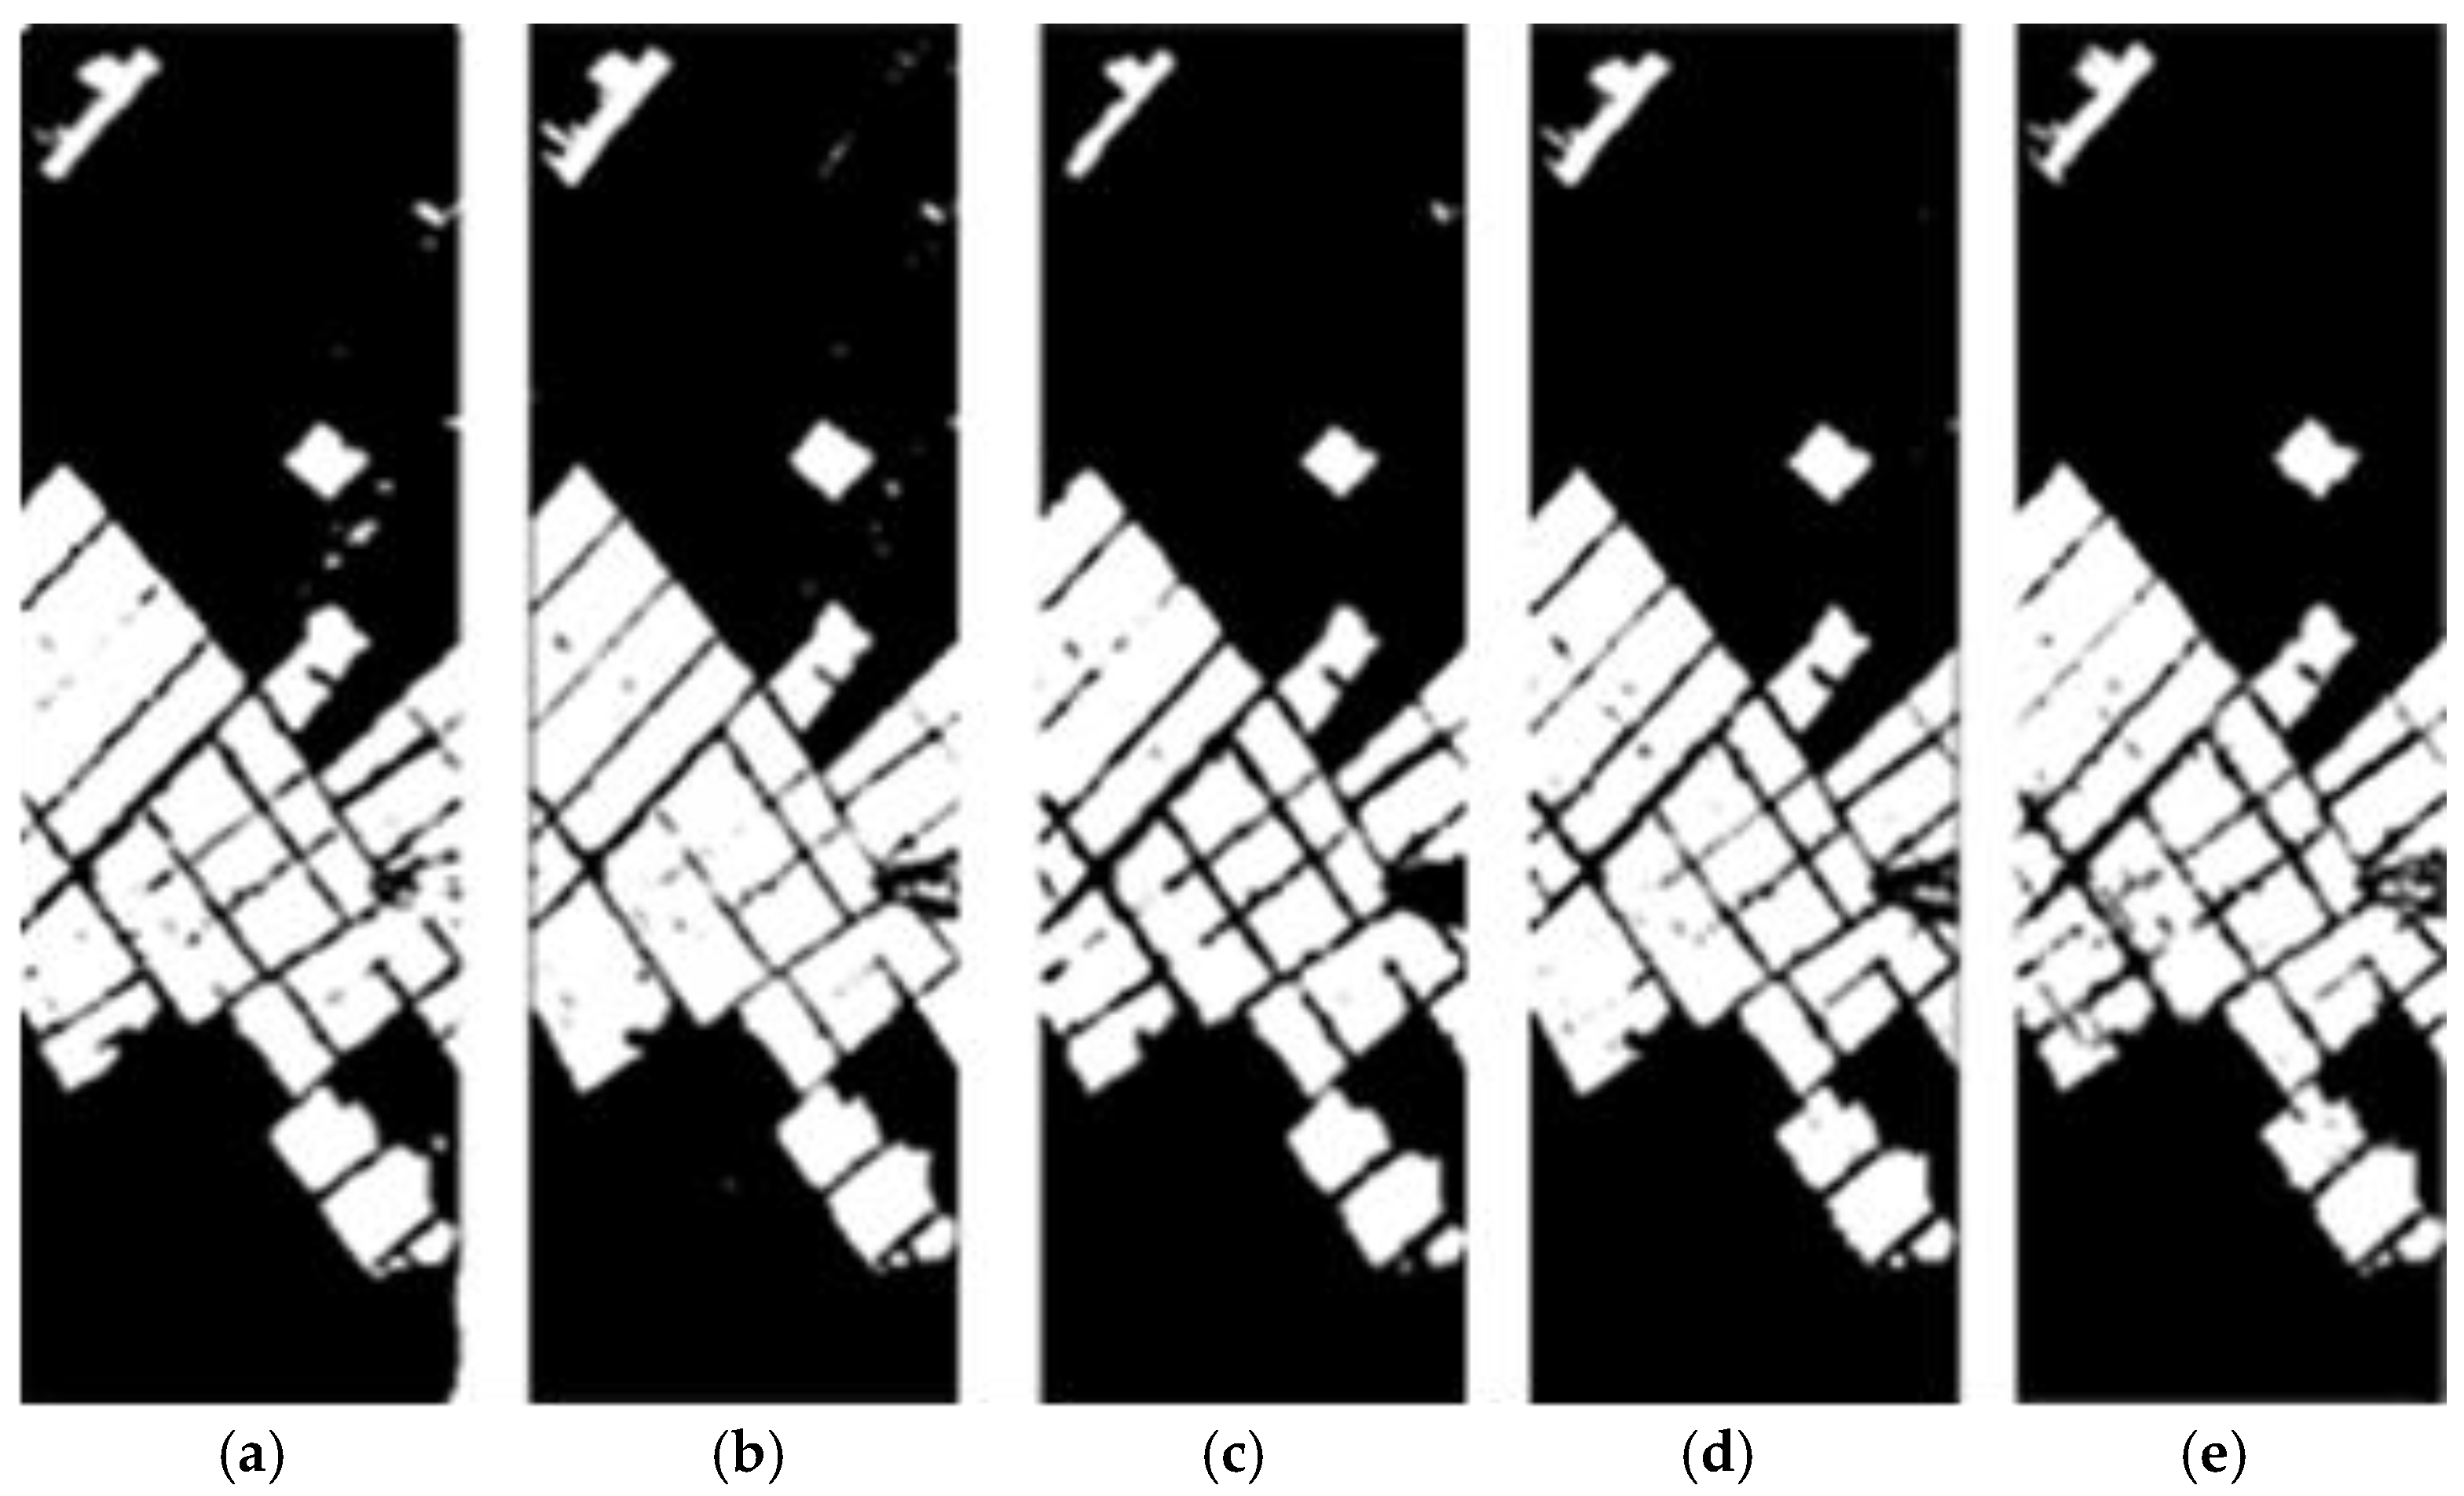
Figure 5.
Feature visualization comparison diagram of the three methods. (a) t-SNE feature extracted by CNN method; (b) t-SNE feature extracted by Siam-Resnet method; (c) t-SNE feature extracted by the method in this paper.
Figure 5.
Feature visualization comparison diagram of the three methods. (a) t-SNE feature extracted by CNN method; (b) t-SNE feature extracted by Siam-Resnet method; (c) t-SNE feature extracted by the method in this paper.
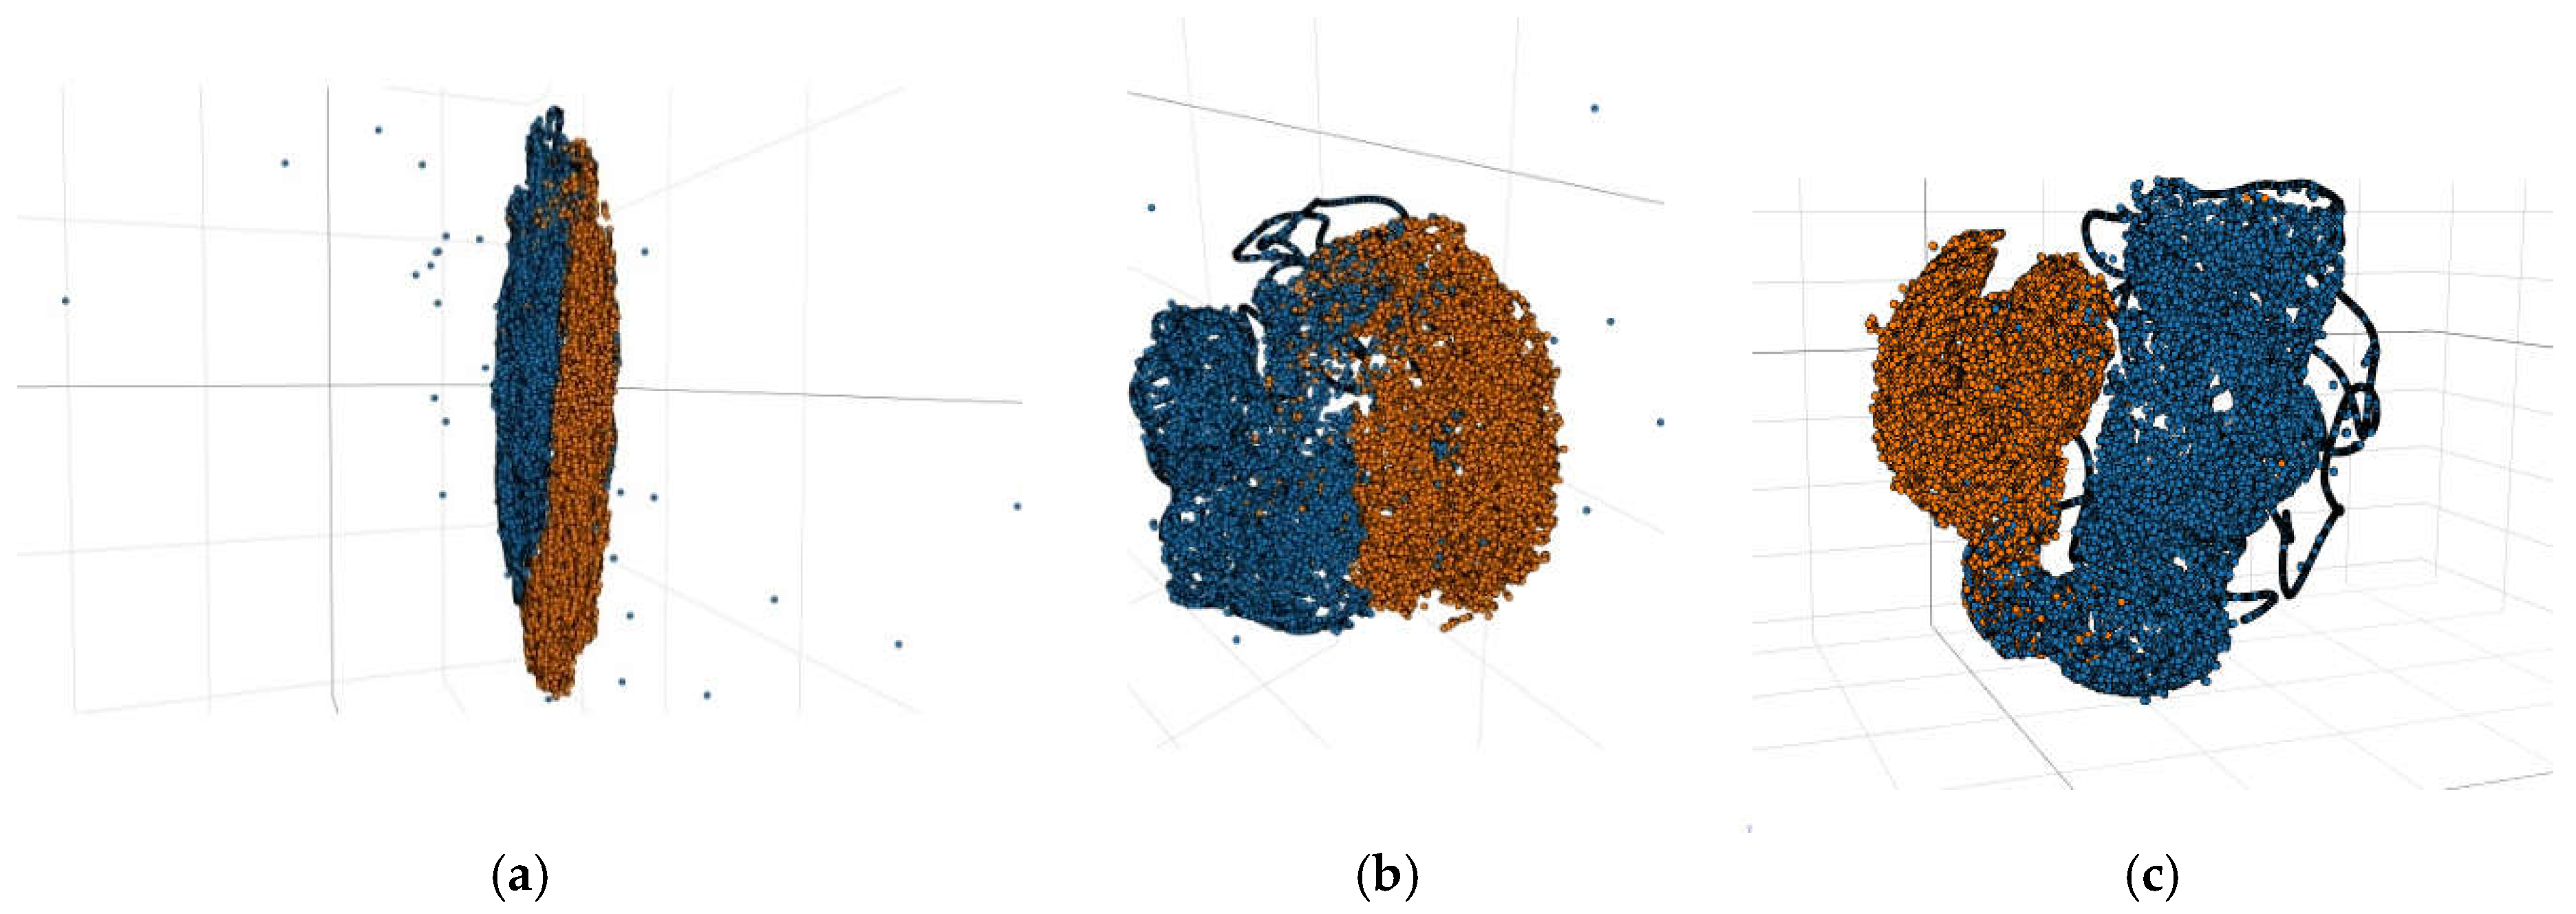
Figure 6.
Measurement feature comparison diagram of the two methods. (a) Measurement feature of Siam-Resnet method; (b) Measurement feature of the method in this paper; (c) Measurement feature of the label map.
Figure 6.
Measurement feature comparison diagram of the two methods. (a) Measurement feature of Siam-Resnet method; (b) Measurement feature of the method in this paper; (c) Measurement feature of the label map.
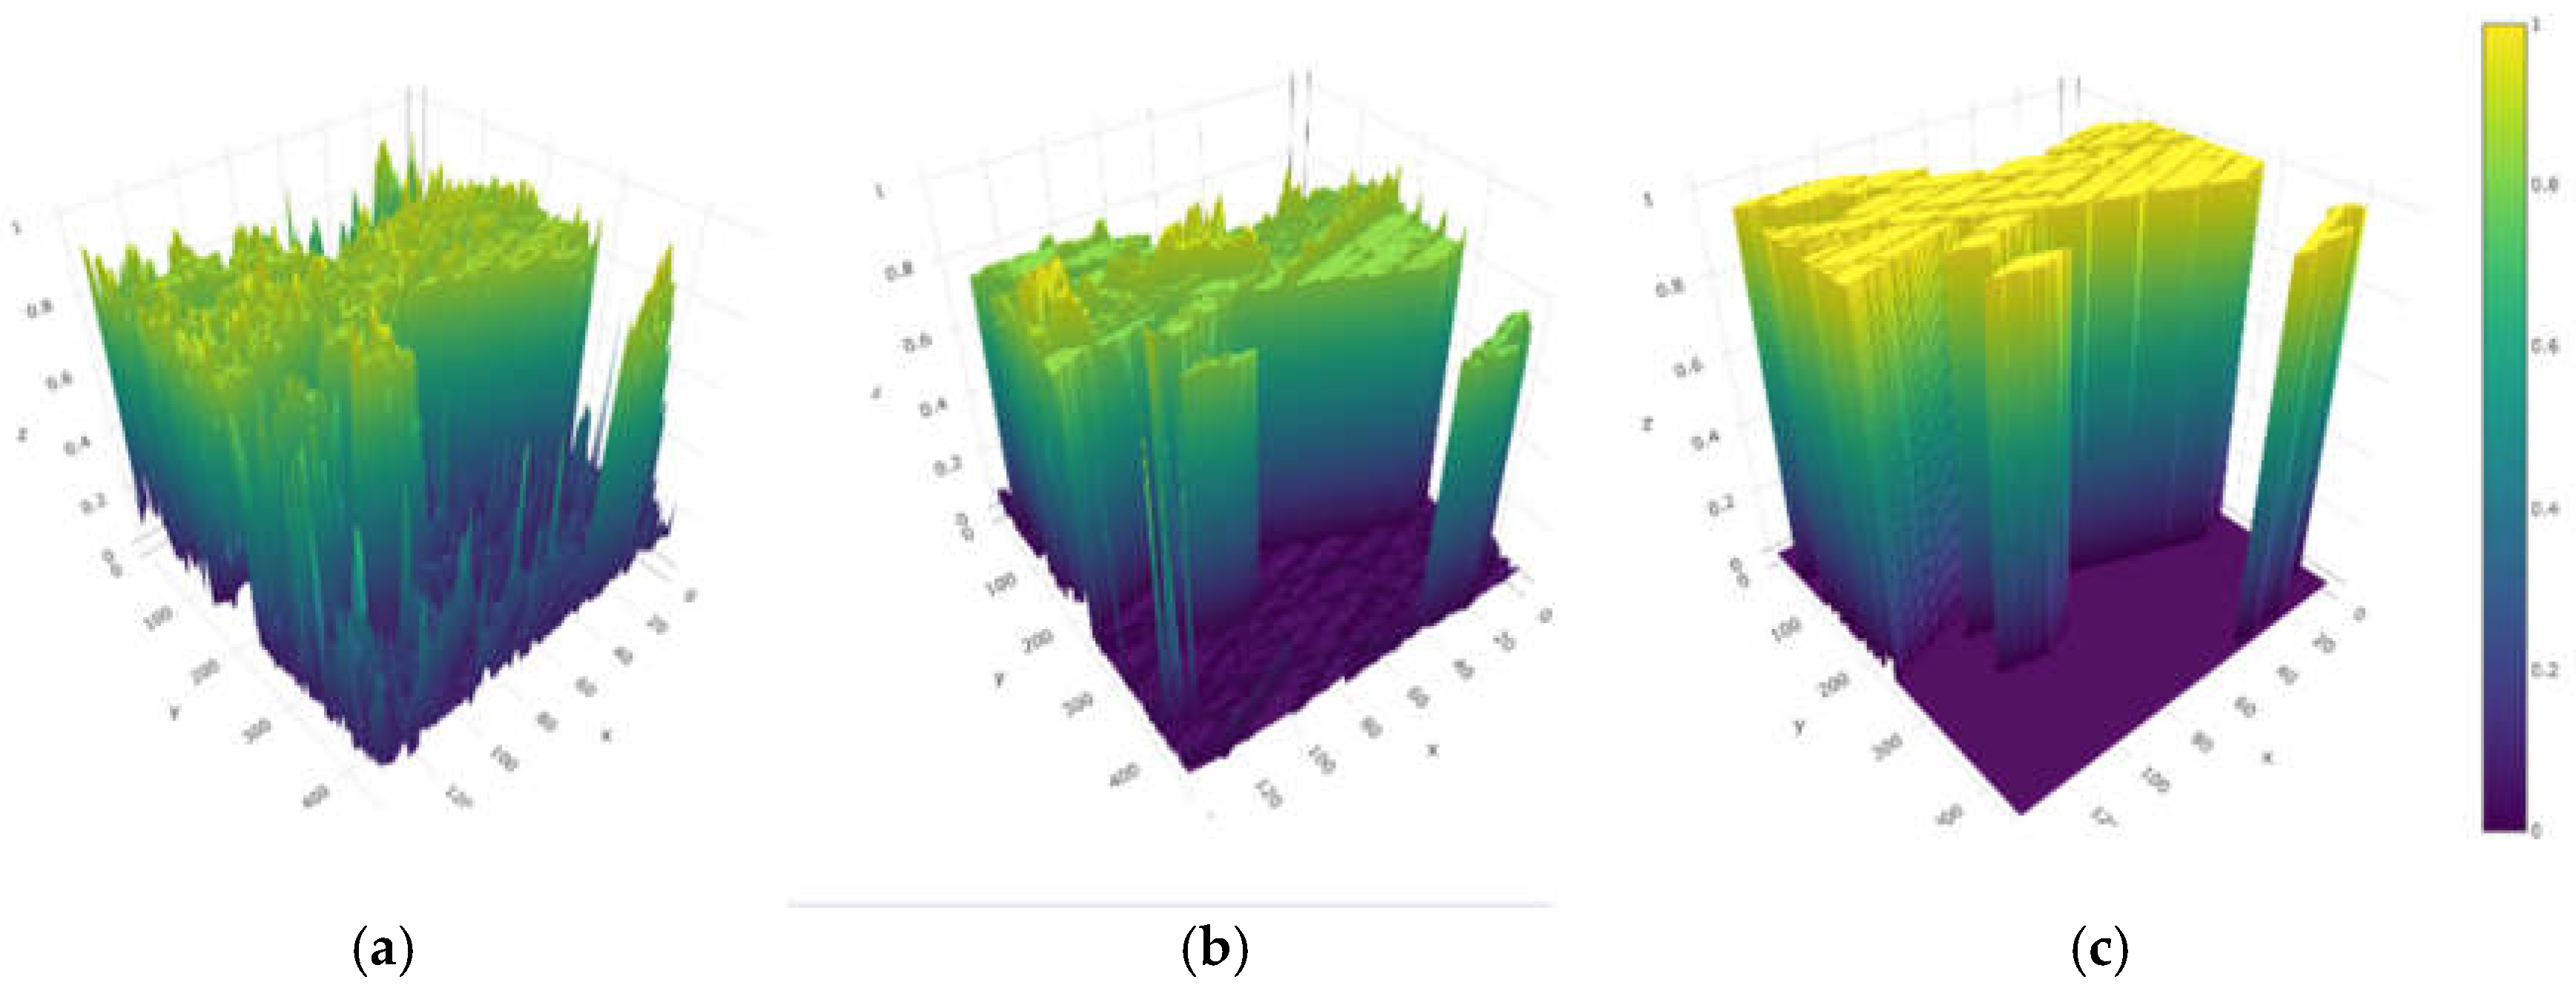
Figure 7.
Change detection results on different dataset. (a) CNN result on River dataset; (b) Siam-Resnet result on River dataset; (c) this paper method result on River dataset; (d) ground truth of River dataset; (e) CNN result on Bayarea dataset; (f) Siam-Resnet result on Bayarea dataset; (g) this paper method result on Bayarea dataset; (h) ground truth of Bayarea dataset; (i) CNN result on Babara dataset; (j) Siam-Resnet result on Babara dataset; (k) this paper method result on Babara dataset; (l) ground truth of Babara dataset.

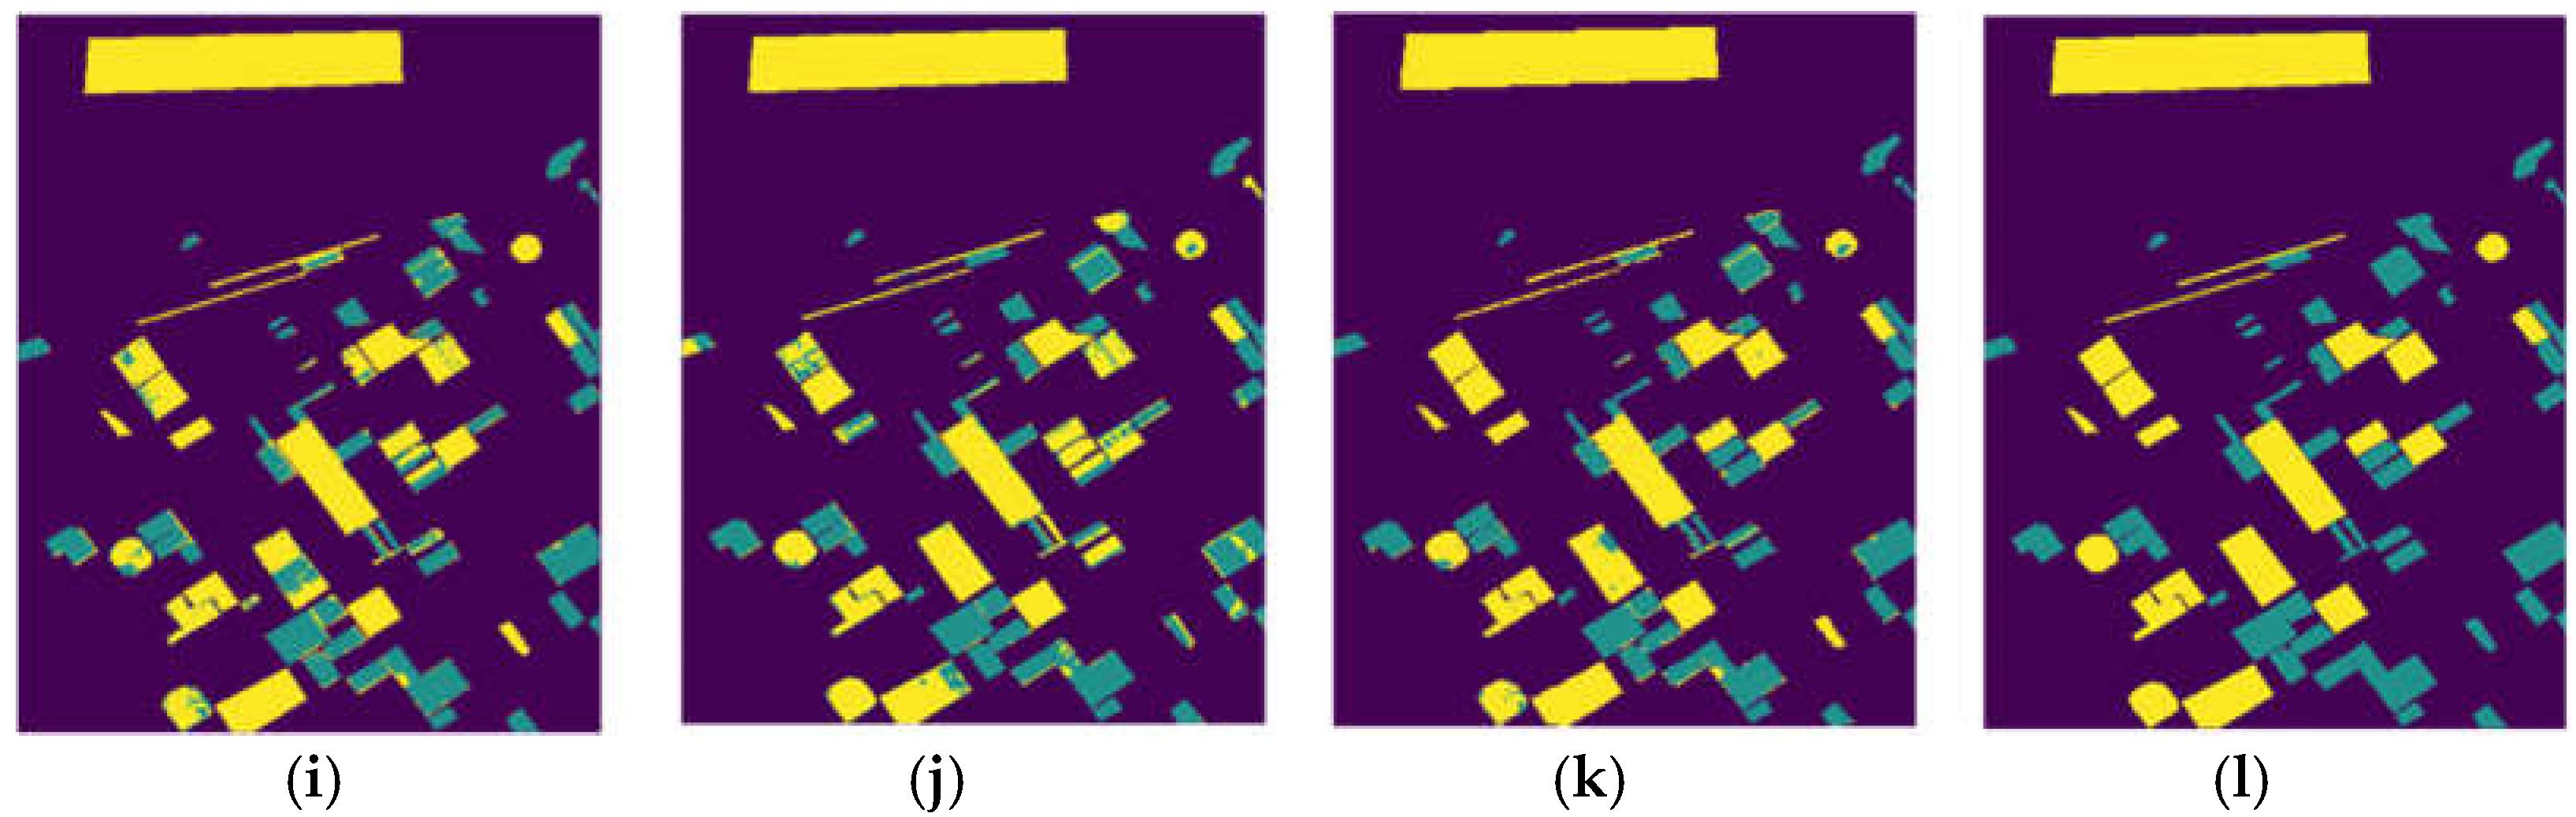
Figure 8.
Change detection performance comparison on three datasets.
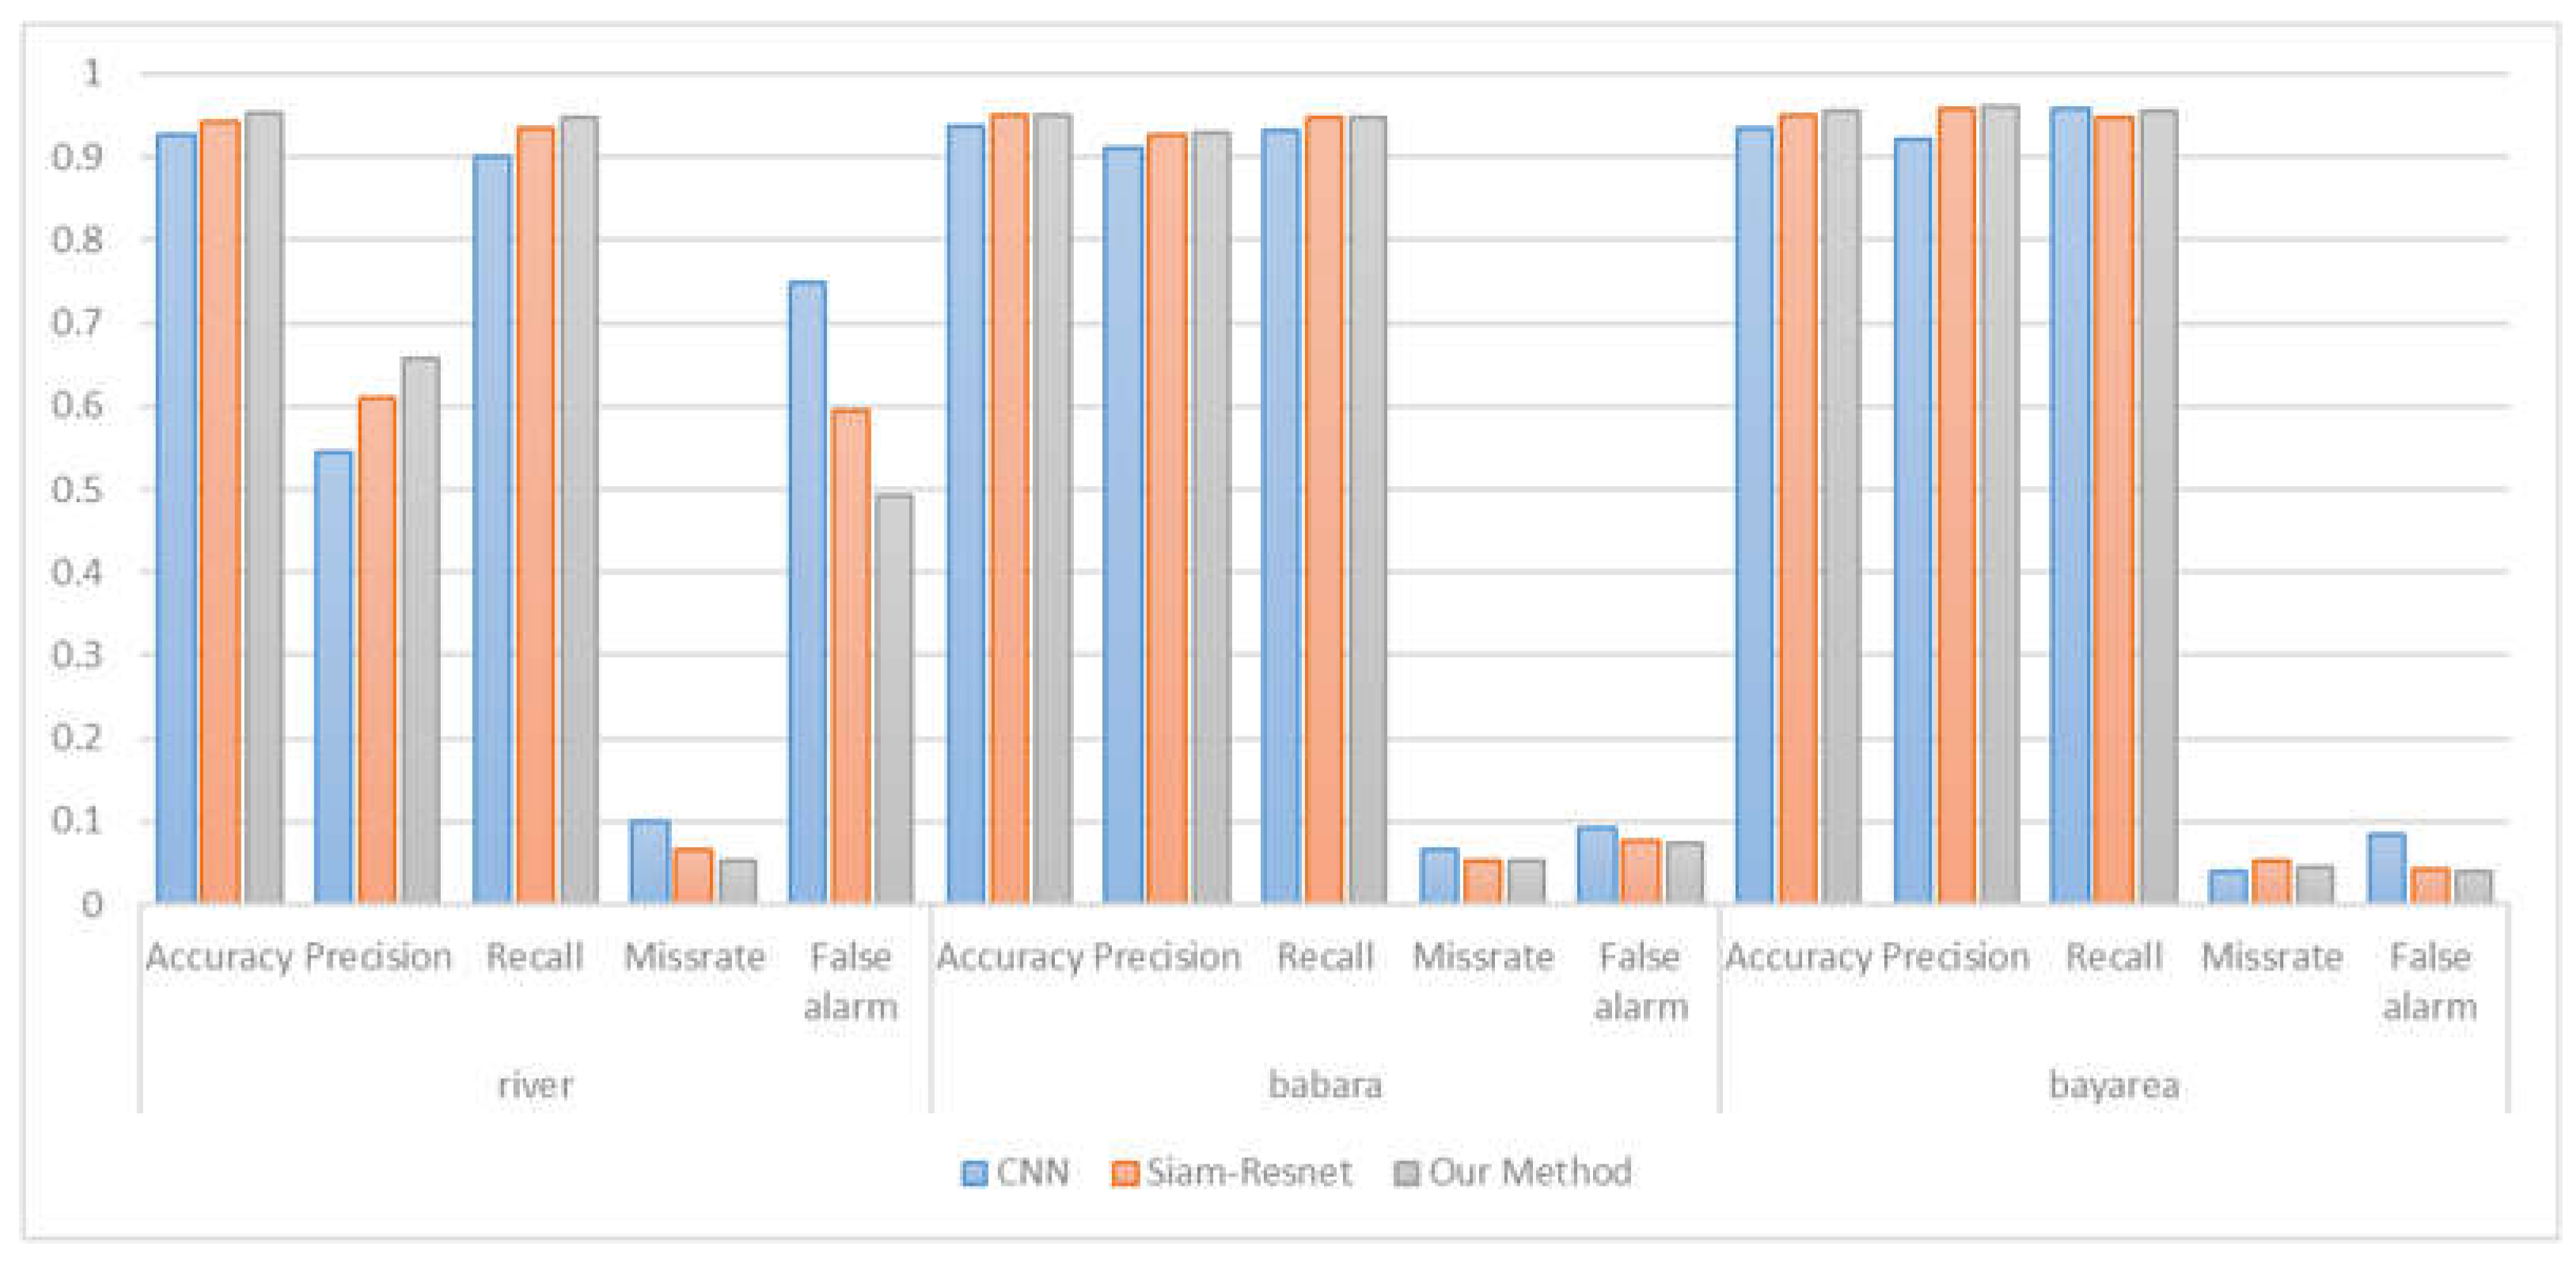
Table 2.
Ablation experiment of attention module.
| Module | Kernel size | Classification accuracy | Precision | Recall |
|---|---|---|---|---|
| Siam-Resnet | 96.05 | 95.87 | 92.82 | |
| Method in this paper | 97.31 | 96.29 | 94.54 | |
| Method in this paper | 97.45 | 96.48 | 94.84 |
Table 3.
Ablation experiment of BCL module.
| Module | Loss function | Classification accuracy | Precision | Recall |
|---|---|---|---|---|
| CNN | Contrastive Loss | 94.14 | 93.29 | 92.36 |
| CNN | BCL | 94. 58 | 93.43 | 92.55 |
| Siam-Resnet | Contrastive Loss | 95.71 | 94.90 | 92.26 |
| Siam-Resnet | BCL | 96.05 | 95.87 | 92.82 |
| Method in this paper | Contrastive Loss | 97. 23 | 96.33 | 94.59 |
| Method in this paper | BCL | 97.45 | 96.48 | 94.84 |
Disclaimer/Publisher’s Note: The statements, opinions and data contained in all publications are solely those of the individual author(s) and contributor(s) and not of MDPI and/or the editor(s). MDPI and/or the editor(s) disclaim responsibility for any injury to people or property resulting from any ideas, methods, instructions or products referred to in the content. |
© 2025 by the authors. Licensee MDPI, Basel, Switzerland. This article is an open access article distributed under the terms and conditions of the Creative Commons Attribution (CC BY) license (http://creativecommons.org/licenses/by/4.0/).
Copyright: This open access article is published under a Creative Commons CC BY 4.0 license, which permit the free download, distribution, and reuse, provided that the author and preprint are cited in any reuse.


