
Submitted:
07 January 2025
Posted:
07 January 2025
You are already at the latest version
Abstract
The global emissions from the transportation sector were nearly 7.7 GtCO2 in 2021. In Thailand, the transportation sector emitted 69 MtCO2 and consumed 27,460 ktoe of final energy consumption in the same year. Transitioning from internal combustion engine vehicles (ICEVs) to electric vehicles (EVs) can help reduce greenhouse gas emissions and air pollution, particularly PM2.5, in major metropolitan areas. However, the adoption of EVs in the early stages may affect consumers' considerations. This study aimed to investigate the motivators and environmental awareness for EV adoption in Thailand. An online questionnaire was conducted, and a total of 459 respondents participated. The results revealed that the top three motivators for respondents to consider EVs were the potential tax refund for purchasing an EV, lower charging costs compared to fuel costs for ICEVs, and lower operating costs for EVs compared to ICEVs. In terms of environmental awareness, respondents expressed concern about adapting to global warming and the environment, the potential for EVs to reduce air pollution, and a general concern for the environment. Based on the findings, individuals aged between 26 and 35 years old could be the key target group for early EV adoption.
Keywords:
EV
; electric vehicles
; motivators
; environment adoption
1. Introduction
The transport sector contributes roughly 20% of global carbon dioxide (CO2) emissions [3]. According to the IEA report, global emissions from the transport sector increased at an average annual rate of 1.7% between 1990 and 2022, rising faster than any other end-use sector except for industry (which also grew at an average rate of about 1.7%) [24].
In 2023, Thailand's carbon dioxide emissions from energy consumption totaled 243.6 million tons. The power generation sector was the largest contributor, accounting for 37% of the total emissions, followed by the transportation sector at 34% (EPPO report).
Figure 1 shows that Thailand has consistently exhibited a high proportion of CO2 emissions from the transportation sector over the years, primarily due to the increasing use of private vehicles, as illustrated in Figure 2. By the end of 2023, the total number of registered vehicles in Thailand had reached 44.3 million, representing a 2.2% increase compared to the previous year (Department of Land Transport). Furthermore, 99% of vehicles in Thailand are fossil fuel-powered (Department of Land Transport), significantly contributing to the high level of CO2 emissions, as indicated by the emission factor from the IPCC 2006 report.
According to Thailand's Energy Balance Report for 2023, the country recorded a total final energy consumption of 83,152 Ktoe, with 66.3% of this figure attributed to fossil fuel usage. Among the sectors utilizing fossil fuels, the transportation sector ranked first, accounting for three-fifths of the total consumption. Within this sector, 99% of the energy came from petroleum products and 3% from natural gas (source: Department of Alternative Energy Development and Efficiency, DEDE).
The Thai government announced its support for electric vehicles (EVs) through the National EV Policy Committee in 2019. This initiative aligns with the "30@30" policy, which aims to ensure that at least 30% of all vehicle production in Thailand by 2030 consists of zero-emission vehicles (ZEVs). This policy is seen as a key mechanism for transitioning Thailand toward a low-carbon society in the future [7].
Statistical data on EVs indicates that Thailand registered 100,219 new battery electric vehicles (BEV) in 2023, representing a 381% increase compared to the previous year. The Energy Regulatory Commission (ERC) analyzed key factors driving the demand for EVs, identifying the following 1) Decreasing vehicle prices and a wider variety of options, with Chinese EVs currently dominating the Thai market. 2) The downward trend in battery prices. 3) The growing number of charging stations. And 4) The volatility of energy prices. These factors collectively contribute to the increasing adoption of EVs in Thailand [25].
The research aims to identify factors motivating the adoption of electric vehicles (EVs), emphasizing the importance of economic incentives like tax refunds to address affordability challenges and make EVs competitive with internal combustion engine vehicles (ICEVs). It highlights consumer hesitation towards EVs due to their novelty in Thailand and underscores the potential role of environmental awareness in promoting sustainable transportation.
2. Literature Review
In our comprehensive literature review, numerous studies have extensively explored the multifaceted advantages of electric vehicles (EVs) in promoting environmentally sustainable transportation solutions. While the existing body of research has primarily focused on various aspects of EV adoption, this study adopts a distinct perspective by emphasizing the analysis of consumer willingness to embrace EVs. Within this rich body of literature, numerous factors influencing consumers' motivation to purchase EVs have been carefully examined and documented. This section critically analyzes these influential factors, highlighting their significance in shaping consumer choices. For clarity and accessibility, the information is summarized in Table 1.
2.1. Motivator Driving EV
Motivator driving EV, one significant stimulant for purchasing EVs is the tax refund. Research indicates that offering a rebate or tax credit of $1000 can stimulate public interest, leading to a 2.6% increase in the average sales of electric vehicles [12]. The addition of special EV lanes also increases the interest of EV users because it saves them more time [13]. Furthermore, from a study conducted in Philadelphia, it was found that people have a willingness to purchase electric vehicles (EVs) due to the exception of parking fee, which reduces parking costs for individuals in Philadelphia by $100 per month [6]. While Norway has achieved a high level of electric vehicle adoption, it is primarily due to government promotion through exemptions on import duties and sales taxes, as well as allowing the use of bus lanes and waiving toll charges [14]. When considering the maintenance costs of electric vehicles (EVs), it is found that they are approximately 40% lower than those of internal combustion engine (ICE) vehicles [16]. According to the U.S. Department of Energy, EVs have lower maintenance costs because the battery, motor, and associated electronics require minimal to no regular maintenance. Additionally, there are fewer fluids, such as engine oil, that require regular maintenance. Brake wear is significantly reduced due to regenerative braking, and there are far fewer moving parts compared to a conventional gasoline engine [16].
In the United Kingdom, there has been a reduction in electricity prices for EV users during nighttime hours. The average price per kWh on a standard flat rate tariff is 22.77 pence per kWh, while EV users pay a rate of 15.93 pence per kWh during nighttime hours [17]. Similarly, in Thailand, household electricity costs approximately 4.5888 Thai Baht per unit, and if you charge an EV after 10 pm, the electricity cost reduces to 2.804 Thai Baht per unit. When comparing the energy consumption of electricity by electric vehicles (EVs) to the fossil fuel consumption of internal combustion engines (ICE), it has been discovered that charging an EV result in savings of approximately 78%. According to a report by Energysage, it has been demonstrated that, in general, charging an electric vehicle is approximately three times more cost-effective per mile compared to fueling an ICE. However, these cost savings can vary depending on factors such as the type of vehicle and battery size [10].
Furthermore, there is currently a new technology called "vehicle-to-grid" or V2G, which is a process that extracts electricity from electric vehicle batteries and feeds it back into the main electrical grid. It is a method of managing the power grid, considering electric vehicles as a large-scale energy storage resource that can assist the electrical grid in various ways, such as serving as a backup power source and providing grid ancillary services. Users of electric vehicles participating in V2G programs receive compensation for supplying electricity from their vehicle batteries to the main electrical grid [27].
2.2. Environment Awareness
Environment Awareness, driven by the climate change crisis, carries global implications, leading numerous regions to prioritize environmental conservation and the reduction of greenhouse gas emissions. For example, the environmental concern regarding climate change is linked to the willingness to embrace electric vehicles (EVs) [26]. Electric vehicles (EVs) have the capacity to significantly curtail vehicle emissions, which are a major contributor to climate change, without causing a substantial decrease in convenience or mobility [1]. At the same time, Scientists from the Keck School of Medicine at USC conducted a groundbreaking study that provides evidence of electric cars leading to tangible reductions in air pollution and respiratory issues in real-world conditions [23]. Based on studies conducted in China, it has been discovered that EV adoption can have a substantial impact in reducing PM2.5 pollution. Specifically, for each additional unit of EV sold, there is a reduction of 1.75 × 10^-5 μg/m3 in PM2.5 levels [28]. Additionally, studies in the United States, where there is a plan for all new vehicles to be EVs by 2035, have found that with full electrification of on-road vehicle fleets, the statewide population-weighted annual average PM2.5 concentration is reduced by about 0.5 μg/m3 [22].
Furthermore, due to their silent operation, it can be asserted that Electric Vehicles lead to a genuine reduction in traffic noise pollution on the streets [9]. Furthermore, from the book Drawdown, it is evident that transitioning to electric vehicles is one of the seven behaviors with the greatest potential to reduce emissions [18].
2.3. Willingness to Buy
Willingness to buy, with findings indicating that factors such as environmental knowledge, technology perception, economic benefits, psychological needs, and performance attributes play a significant role in shaping consumers' EV acceptance [19]. Similarly, a survey conducted across China revealed the impact of factors such as age, income, marital status, sustainability, and vehicle comfort on consumers' intentions to purchase eco-friendly vehicles. [8]. Additionally, research from India found that consumers' adoption intentions are positively influenced by attitude, perceived behavioral control, subjective norms, environmental concern, and moral norms [21]. Canadian households displayed a favorable attitude toward EVs [5]. Furthermore, Spanish drivers' willingness to adopt EVs was influenced by factors such as cost, technology information, and beliefs regarding EV autonomy [20]. In summary, research on consumers' willingness to buy EVs encompasses various key areas, including lifestyle choices, cost considerations, charging station accessibility, impediments to acceptance, and the influence of Big Five personality traits, encompassing openness, conscientiousness, extraversion, agreeableness, and neuroticism [11].
3. Materials and Methods
3.1. Questionnaire and Survey
Motivators and environmental awareness were identified through an online questionnaire survey conducted in March 2024 for a duration of 15 days. The questionnaire was divided into three parts. Part 1 focused on the demographic information of the respondents, including gender, age, educational background, household income, occupation, family size, car ownership, and driving experience. Part 2 aimed to assess motivators and environmental awareness using a five-point Likert scale. Eight motivators and seven aspects of environmental awareness were selected for the survey, as shown in Table 1. Respondents were asked to rate the importance of these motivators and environmental aspects on a scale as follows: 1(not at all important), 2 (slightly important), 3 (important), 4 (fairly important) and 5 (strongly important). Part 3 consisted of an open-ended question where respondents could provide suggestions and opinions regarding the adoption of electric vehicles (EVs).
The collected questionnaires underwent data cleaning, which involved removing invalid responses based on the criteria of repeated or identical scores within the Likertscale variables. Out of the initial 485 questionnaires, only 459 (94.64% of total responses) passed this cleaning process.
Table 2 presents the characteristics of the respondents. The majority of respondents were male (60.3%) and female (39.7%). In terms of age, the largest groups were those between 26-35 years (53.4%) and 36-45 years (23.5%). Most respondents held a bachelor's degree (88.7%), which enabled them to evaluate the technological features, financial implications, and environmental benefits of EVs and internal combustion engine vehicles (ICEVs). Regarding occupation, 61.9% were company employees/employees, self-employed, or merchants, while government officials and state enterprise employees accounted for 26.6%. A significant proportion of respondents (88.4%) already owned a private car, and 90.2% held driver's licenses, with 73.6% having more than three years of driving experience. In terms of monthly income, 26.4% of respondents reported an income of THB 15,000-25,000, while 24.4% had a monthly income exceeding THB 50,001.
3.2. Chi-Squared Test
A statistical tool called the chi-squared test is used to determine statistical relationships between variables by assuming that there is no correlation between a set of groups and response outcomes. The significance level is set at 0.05; if the p-value is less than 0.05, the null hypothesis is rejected. The equation for the chi-squared test is as follows:
is Pearson's cumulative test statistic, which follows a nonparametric distribution with (r - 1) (c - 1). The rows represent the degrees of freedom, while the column variables are considered independent. represents the number of observations in row i and column j. The expected frequency value in row i and column j is denoted as . defines the total number of observations, and n is the number of cells in the table. In this study, the chi-squared test was used to examine the correlation between motivators, environmental awareness, personal characteristics, and EV adoption.
3.3. Reliability of Questionnaire
The reliability of the motivators and environmental awareness scales was evaluated using Cronbach's alpha, as shown in Table 3. A good reliability for Cronbach's alpha is generally considered to be above 0.70 [2]. The equation for Cronbach's alpha is as follows:
where α denotes Cronbach’s alpha, k represents the number of items, represents the average covariance between items, and represents the average variance of each item.
4. Result and Discussion
The questionnaires were processed and analyzed using descriptive statistics to investigate the perspectives of 459 respondents on EV motivators and environmental factors.
4.1. Descriptive Analysis
Table 4 summarizes the results of the descriptive analysis. The highest average score among motivators was for "EVs get Tax refund" (ME1), followed by "EVs charging cost is cheaper than ICEVs fuel cost" (ME7) and "EVs have operating cost less than ICEVs" (ME5) in second and third place, respectively. This suggests that most respondents are primarily concerned with the financial benefits and cost savings associated with EVs. While the battery charging bill contributes to the total operating cost of an EV, the long-term savings potential appears to be the most significant driver for consumer adoption. Conversely, concerns regarding EV performance, particularly range per charge, battery life, and safety, were identified as barriers to widespread adoption [15]. A tax refund could help reduce the purchase price of EVs, making them more competitive with ICEVs from a cost perspective.
The adaptation for global warming and environmental concerns (EA4) gave the highest average score, followed by EVs reducing air pollution (EA7) and environmental concern (EA3). This indicates that most respondents are concerned about global warming and climate change issues and are wide-awake to protect the environment.
The least important to respondents among motivators was a special lane for EVs. The reason may be traffic conditions in major cities and the limitation of road expansion and high land prices in metropolitan areas. Next, EVs exempt from parking fees was ranked higher than EVs’ special lanes, which could imply that respondents did not care for this benefit. This may be because EVs can charge at charging stations, which already have parking lots in malls, superstores, and gas stations. EVs getting toll-free access cannot motivate respondents to purchase EVs. This may be because some respondents do not drive on tollways, and these are located only in Bangkok and perimeter provinces.
Climate change harming yourself and your family (EA1) was the least important to respondents among environmental awareness factors. This could imply that respondents do not have a clear understanding of how climate change affects everyone as a connected Earth system. Another reason may be that respondents have not faced events related to climate change in their daily lives. EVs helping to reduce greenhouse gas (GHG) emissions (EA5) was ranked second from last, which could imply that respondents think EVs cannot help reduce GHG emissions if their electricity does not come entirely from renewable energy. Small-scale adoption of EVs may not be enough to significantly reduce GHG emissions; transforming almost all ICEVs to EVs in the transport sector may be a solution.
4.2. Respondent Characteristics
Gender, age, occupation, educational background, family size, driving experience, monthly income, and vehicle ownership were used to categorize respondents and identify the individual characteristics that significantly impact EV adoption.
4.2.1. Gender, Age, and Education Background
Various groups of motivators and environmental awareness were compared and shown in Table A1. Males and females held different views on both motivators and environmental awareness. Statistically significant differences were found in views on ME8 (EVs can do vehicle-to-grid), ME2 (EVs have a special lane), and ME1 (EVs get a tax refund). EA4 (Adapt behavior for global warming and the environment), EA5 (EVs reduce GHG emissions), EA6 (EVs reduce noise pollution), and EA7 (EVs charging cost is cheaper than ICEVs fuel cost) were also statistically significant.
Regarding age, a statistically significant difference was found between groups ME6 (EVs get charging prices cheaper than household electricity) and ME7 (EVs charging cost is cheaper than ICEVs fuel cost). EA5 (EVs reduce GHG emissions) and EA6 (EVs reduce noise pollution) also showed statistically significant differences. Respondents aged between 26 and 35 were found to be motivated to adopt EVs. These respondents are concerned about environmental and climate change.
In terms of educational background, two environmental awareness factors showed statistically significant results: EA2 (Air pollution affects) and EA3 (More environmental concern). Respondents with a higher education background believed that these environmental awareness factors were drivers for EV adoption.
4.2.2. Occupation, Family Size, Vehicles Ownership
As for occupation, three motivators were statistically significant: ME1 (EVs obtain a tax refund), ME2 (EVs have a special lane), and ME7 (EVs charging cost is less than ICEVs fuel cost). ME1, ME2, and ME7 were identified as motivators for EV adoption by respondents with a secure profession. EA6 (EVs reduce noise pollution) was also statistically significant.
Regarding family size, no motivators or environmental awareness factors were statistically significant. Regarding vehicle ownership, EA6 (EVs reduce noise pollution) was statistically significant.
4.2.3. Driving Experience and Monthly Income
Respondents were categorized into four groups: no driving experience, new drivers with fewer than three years of experience, intermediate drivers with three to five years of experience, and experienced drivers with more than five years of experience. ME5 (EV has operating costs less than ICEV) and ME7 (EV charging cost is cheaper than ICEV fuel cost) were statistically significant. Experienced drivers believed that EV operating costs were a motivator for EV adoption. This implied that experienced drivers focused on maintenance costs and fuel costs.
Regarding monthly income, ME1 (EV gets a tax refund), ME3 (EV is exempt from parking fees), and ME7 (EV charging cost is cheaper than ICEV fuel cost) were statistically significant. Only EA3 (More environmental concern) was statistically significant.
5. Conclusion
The investigation of motivators and environmental awareness involved collecting data from 459 respondents in Thailand. While EVs are considered a sustainable transportation choice despite being a new technology, respondents are hesitant to adopt them. To encourage widespread EV adoption, tax refunds appear to be the strongest motivator. This suggests that current EV prices might be unaffordable. Monetary incentives, such as tax breaks or refunds, should be offered in the early stages of adoption to make EVs economically competitive with internal combustion engine vehicles (ICEVs). Raising environmental awareness and promoting sustainable transportation could also accelerate consumer adoption of EVs.
One limitation of this study is that some respondents lacked real-world experience driving EVs due to their newness in Thailand. Respondents' perceptions may change after taking a test drive or gaining experience with EVs [4]. Additionally, the sample size was relatively small and might not be representative of the entire population. Future research on EV adoption should consider broadening the survey to include major cities as pilot regions to facilitate wider EV adoption.
Author Contributions
Conceptualization, C.P.; methodology, C.P.; software, C.P., S.J.; validation, C.P., T.B.; formal analysis, C.P., S.J.; investigation, C.P., T.B.; resources; S.J.; data curation, C.P.; writing—original draft preparation, C.P., S.J.; writing—review and editing, C.P.; visualization, C.P.; supervision, C.P.; project administration, S.J.; funding acquisition, C.P. All authors have read and agreed to the published version of the manuscript.
Funding
This research was funded by Rajamangala University of Technology Phra Nakhon (RMUTP), Thailand, Human Resources Development Fund.
Institutional Review Board Statement
Not applicable.
Informed Consent Statement
Not applicable.
Data Availability Statement
Not applicable.
Acknowledgments
This research was supported by Rajamangala University of Technology Phra Nakhon (RMUTP), Thailand, and The School of Mathematics and Statistics, The University of Melbourne.
Conflicts of Interest
The authors declare no conflict of interest.
Appendix A

Table A1.
Pearson chi-squared (χ2) test of respondent’s characteristics.
| Motivator | Gender (df = 4) |
Age (df = 20) |
Education Background (df = 12) | Monthly Income (df = 32) |
Occupation (df = 20) |
Family Size (df = 16) |
Living Region (df = 24) |
Driving Experience (df = 20) | Car Owner (df = 8) |
|||||||||
|---|---|---|---|---|---|---|---|---|---|---|---|---|---|---|---|---|---|---|
| χ2 | p-Value | χ2 | p-Value | χ2 | p-Value | χ2 | p-Value | χ2 | p-Value | χ2 | p-Value | χ2 | p-Value | χ2 | p-Value | χ2 | p-Value | |
| ME1 | 9.843 | 0.043 | 20.718 | 0.414 | 21.79 | 0.04 | 41.056 | 0.131 | 38.19 | 0.008 | 12.077 | 0.739 | 33.62 | 0.092 | 21.652 | 0.36 | 6.148 | 0.631 |
| ME2 | 13.168 | 0.01 | 27.551 | 0.12 | 6.6 | 0.883 | 36.536 | 0.266 | 30.541 | 0.062 | 15.854 | 0.463 | 33.26 | 0.099 | 22.482 | 0.315 | 5.178 | 0.738 |
| ME3 | 4.522 | 0.34 | 11.781 | 0.923 | 15.454 | 0.218 | 51.391 | 0.016 | 17.871 | 0.596 | 11.215 | 0.796 | 27.44 | 0.284 | 8.03 | 0.992 | 12.141 | 0.145 |
| ME4 | 6.099 | 0.192 | 16.882 | 0.661 | 6.912 | 0.863 | 35.315 | 0.314 | 20.606 | 0.421 | 18.378 | 0.302 | 27.73 | 0.271 | 16.383 | 0.693 | 7.824 | 0.451 |
| ME5 | 6.606 | 0.158 | 26.882 | 0.139 | 6.96 | 0.86 | 41.244 | 0.127 | 19.647 | 0.48 | 14.461 | 0.564 | 19.65 | 0.717 | 29.207 | 0.084 | 10.499 | 0.232 |
| ME6 | 6.575 | 0.16 | 42.751 | 0.002 | 4.956 | 0.959 | 48.477 | 0.031 | 27.352 | 0.126 | 20.396 | 0.203 | 45.39 | 0.005 | 12.921 | 0.881 | 9.668 | 0.289 |
| ME7 | 8.373 | 0.079 | 66.576 | 0 | 24.089 | 0.02 | 52.426 | 0.013 | 39.333 | 0.006 | 12.551 | 0.705 | 23.28 | 0.503 | 28.909 | 0.09 | 4.339 | 0.825 |
| ME8 | 19.649 | 0.001 | 38.749 | 0.007 | 11.297 | 0.504 | 52.72 | 0.012 | 36.634 | 0.013 | 20.087 | 0.216 | 28.42 | 0.243 | 15.466 | 0.749 | 12.904 | 0.115 |
| EA1 | 3.322 | 0.505 | 18.59 | 0.549 | 20.86 | 0.052 | 19.7 | 0.956 | 25.166 | 0.195 | 22.681 | 0.123 | 28.67 | 0.233 | 20.951 | 0.4 | 8.076 | 0.426 |
| EA2 | 5.615 | 0.23 | 25.145 | 0.196 | 21.476 | 0.044 | 41.367 | 0.124 | 21.147 | 0.389 | 21.858 | 0.148 | 35.25 | 0.065 | 21.385 | 0.375 | 6.691 | 0.57 |
| EA3 | 6.431 | 0.169 | 20.605 | 0.421 | 25.445 | 0.013 | 37.32 | 0.238 | 16.238 | 0.702 | 12.879 | 0.682 | 35.63 | 0.06 | 20.972 | 0.399 | 12.867 | 0.116 |
| EA4 | 12.983 | 0.011 | 31.313 | 0.051 | 25.473 | 0.013 | 33.927 | 0.375 | 17.95 | 0.591 | 12.904 | 0.68 | 36.18 | 0.053 | 19.838 | 0.468 | 11.344 | 0.183 |
| EA5 | 11.281 | 0.024 | 39.971 | 0.005 | 21.715 | 0.041 | 28.869 | 0.626 | 25.322 | 0.189 | 18.683 | 0.285 | 37.99 | 0.035 | 22.862 | 0.296 | 10.232 | 0.249 |
| EA6 | 17.909 | 0.001 | 53.308 | 0 | 15.728 | 0.204 | 52.581 | 0.012 | 25.484 | 0.184 | 16.857 | 0.395 | 18.15 | 0.796 | 33.848 | 0.027 | 18.625 | 0.017 |
| EA7 | 12.744 | 0.013 | 24.359 | 0.227 | 10.01 | 0.615 | 34.649 | 0.343 | 26.481 | 0.151 | 25.4 | 0.063 | 39.14 | 0.026 | 25.918 | 0.169 | 13.306 | 0.102 |
| PA1 | 23.873 | 0 | 40.215 | 0.005 | 30.151 | 0.003 | 48.19 | 0.033 | 27.541 | 0.121 | 11.354 | 0.787 | 24.69 | 0.423 | 34.378 | 0.024 | 19.381 | 0.013 |
References
- Benefits of electric cars on the environment. Available online: https://www.edfenergy.com/energywise/electric-cars-and-environment (accessed on 10 December 2024).
- Bernardi, R.A. Validating Research Results when Cronbach'S Alpha is Below .70: A Methodological Procedure. Educational and Psychological Measurement 1994, 54, 766–775. [CrossRef]
- Cars, planes, trains: where do CO₂ emissions from transport come from?. Available online: https://ourworldindata.org/co2-emissions-from-transport (accessed on 15 December 2024).
- Coffman, M.; Bernstein, P.; Wee, S. Electric vehicles revisited: A review of factors that affect adoption. Transport Reviews 2017, 37, 79–93. [CrossRef]
- Ferguson, M.; Mohamed, M.; Higgins, C.D.; Abotalebi, E.; Kanaroglou, P. How open are Canadian households to electric vehicles? A national latent class choice analysis with willingness-to-pay and metropolitan characterization. Transportation Research Part D: Transport and Environment 2018, 58, 208-224. [CrossRef]
- Guerra, E.; Daziano, R.A. Electric vehicles and residential parking in an urban environment: Results from a stated preference experiment. Transportation Research Part D: Transport and Environment 2020, 79, 102222. [CrossRef]
- Guidelines for promoting electric vehicles. Available online: https://www.eppo.go.th/index.php/en/component/k2/item/17415-ev-charging-221064-04 (accessed on 1 December 2024).
- Hao, Y.; Dong, X.Y.; Deng, Y.X.; Li, L.X.; Ma, Y. What influences personal purchases of new energy vehicles in China? An empirical study based on a survey of Chinese citizens. Journal of Renewable Sustainable Energy 2016, 8, 065904. [CrossRef]
- How Electric Vehicles lead to the end of traffic noise pollution. Available online: https://medium.com/age-of-awareness/how-electric-vehicles-lead-to-the-end-of-traffic-noise-pollution-adecdb4c8b44 (accessed on 10 December 2024).
- How much does it cost to charge an electric car?. Available online: https://news.energysage.com/electric-vehicle-charging-cost-vs-gas/ (accessed on 1 December 2024).
- Irfan, M.; Ahmad, M. Relating consumers' information and willingness to buy electric vehicles: Does personality matter?. Transportation Research Part D: Transport and Environment 2021, 100, 103049. [CrossRef]
- Jenn, A.; Springel, K.; Gopal, A.R. Effectiveness of electric vehicle incentives in the United States. Energy Policy 2018, 119, 349-356. [CrossRef]
- Kanamori, R.; Morikawa, T.; Ito, T. Evaluation of Special Lanes as Incentive Policies for Promoting Electric Vehicles. In Proceedings of Agent Based Simulation for a Sustainable Society and Multi-agent Smart Computing (PRIMA 2011), Wollongong, Australia, 14 November 2011. [CrossRef]
- Kittner, N.; Tsiropoulos, I.; Tarvydas, D.; Schmidt, O.; Staffell, I.; Kammen, D.M. Chapter 9 - Electric vehicles. Technological Learning in the Transition to a Low-Carbon Energy System 2020, 145-163. [CrossRef]
- Kongklaew, C.; Phoungthong, K.; Prabpayak, C.; Chowdhury, M.S.; Khan, I.; Yuangyai, N.; Yuangyai, C.; Techato, K. Barriers to Electric Vehicle Adoption in Thailand. Sustainability 2021, 13, 12839. [CrossRef]
- Maintenance Costs for EVs vs. ICE Vehicles. Available online: https://www.driveelectrictn.org/maintenance-costs-for-evs-vs-ice-vehicles/ (accessed on 15 December 2024).
- McKinney, T.R.; Ballantyne, E.E.F.; Stone, D.A. Rural EV charging: The effects of charging behaviour and electricity tariffs. Energy Reports 2023, 9, 2321-2334. [CrossRef]
- Pietras, C.J. Rule-Governed Behavior and Climate Change: Why Climate Warnings Fail to Motivate Sufficient Action. Behavior and Social Issues 2022, 31, 373–417. [CrossRef]
- Pradeep, V.H.; Amshala, V.T.; Kadali, B.R. Does perceived technology and knowledge of maintenance influence purchase intention of BEVs. Transportation Research Part D: Transport and Environment 2021, 93, 102759. [CrossRef]
- Rahmani, D.; Loureiro, M.L. Assessing drivers’ preferences for hybrid electric vehicles (HEV) in Spain. Research in Transportation Economics 2019, 73, 89-97. [CrossRef]
- Shalender, K.; Sharma, N. Using extended theory of planned behaviour (TPB) to predict adoption intention of electric vehicles in India. Environment, Development and Sustainability 2021, 665-681. [CrossRef]
- Skipper T.N.; Lawal, A.S.; Hu, Y.; Russell, A.G. Air quality impacts of electric vehicle adoption in California. Atmospheric Environment 2023, 294, 119492. [CrossRef]
- Study links adoption of electric vehicles with less air pollution and improved health. Available online: https://keck.usc.edu/study-links-adoption-of-electric-vehicles-with-less-air-pollution-and-improved-health/ (accessed on 10 December 2024).
- Transport. Available online: https://www.iea.org/energy-system/transport (accessed on 1 December 2024).
- Update on the global and Thai electric vehicle market situation in 2024. Available online: https://www.erc.or.th/th/energy-articles/3094 (accessed on 1 December 2024).
- White, L.V.; Sintov, N.D. You are what you drive: Environmentalist and social innovator symbolism drives electric vehicle adoption intentions. Transportation Research Part A: Policy and Practice 2017, 99, 94-113. [CrossRef]
- Why do we need vehicle to grid technology?. Available online: https://www.elektrobit.com/trends/vehicle-to-grid-technology/ (accessed on 1 December 2024).
- Wu, Y.; Gu, F.; Ji, Y.; Ma, S.; Guo, J. Electric vehicle adoption and local PM2.5 reduction: Evidence from China. Journal of Cleaner Production 2023, 396, 136508. [CrossRef]
Figure 1.
CO2 Emission from Energy Consumption by Sector.
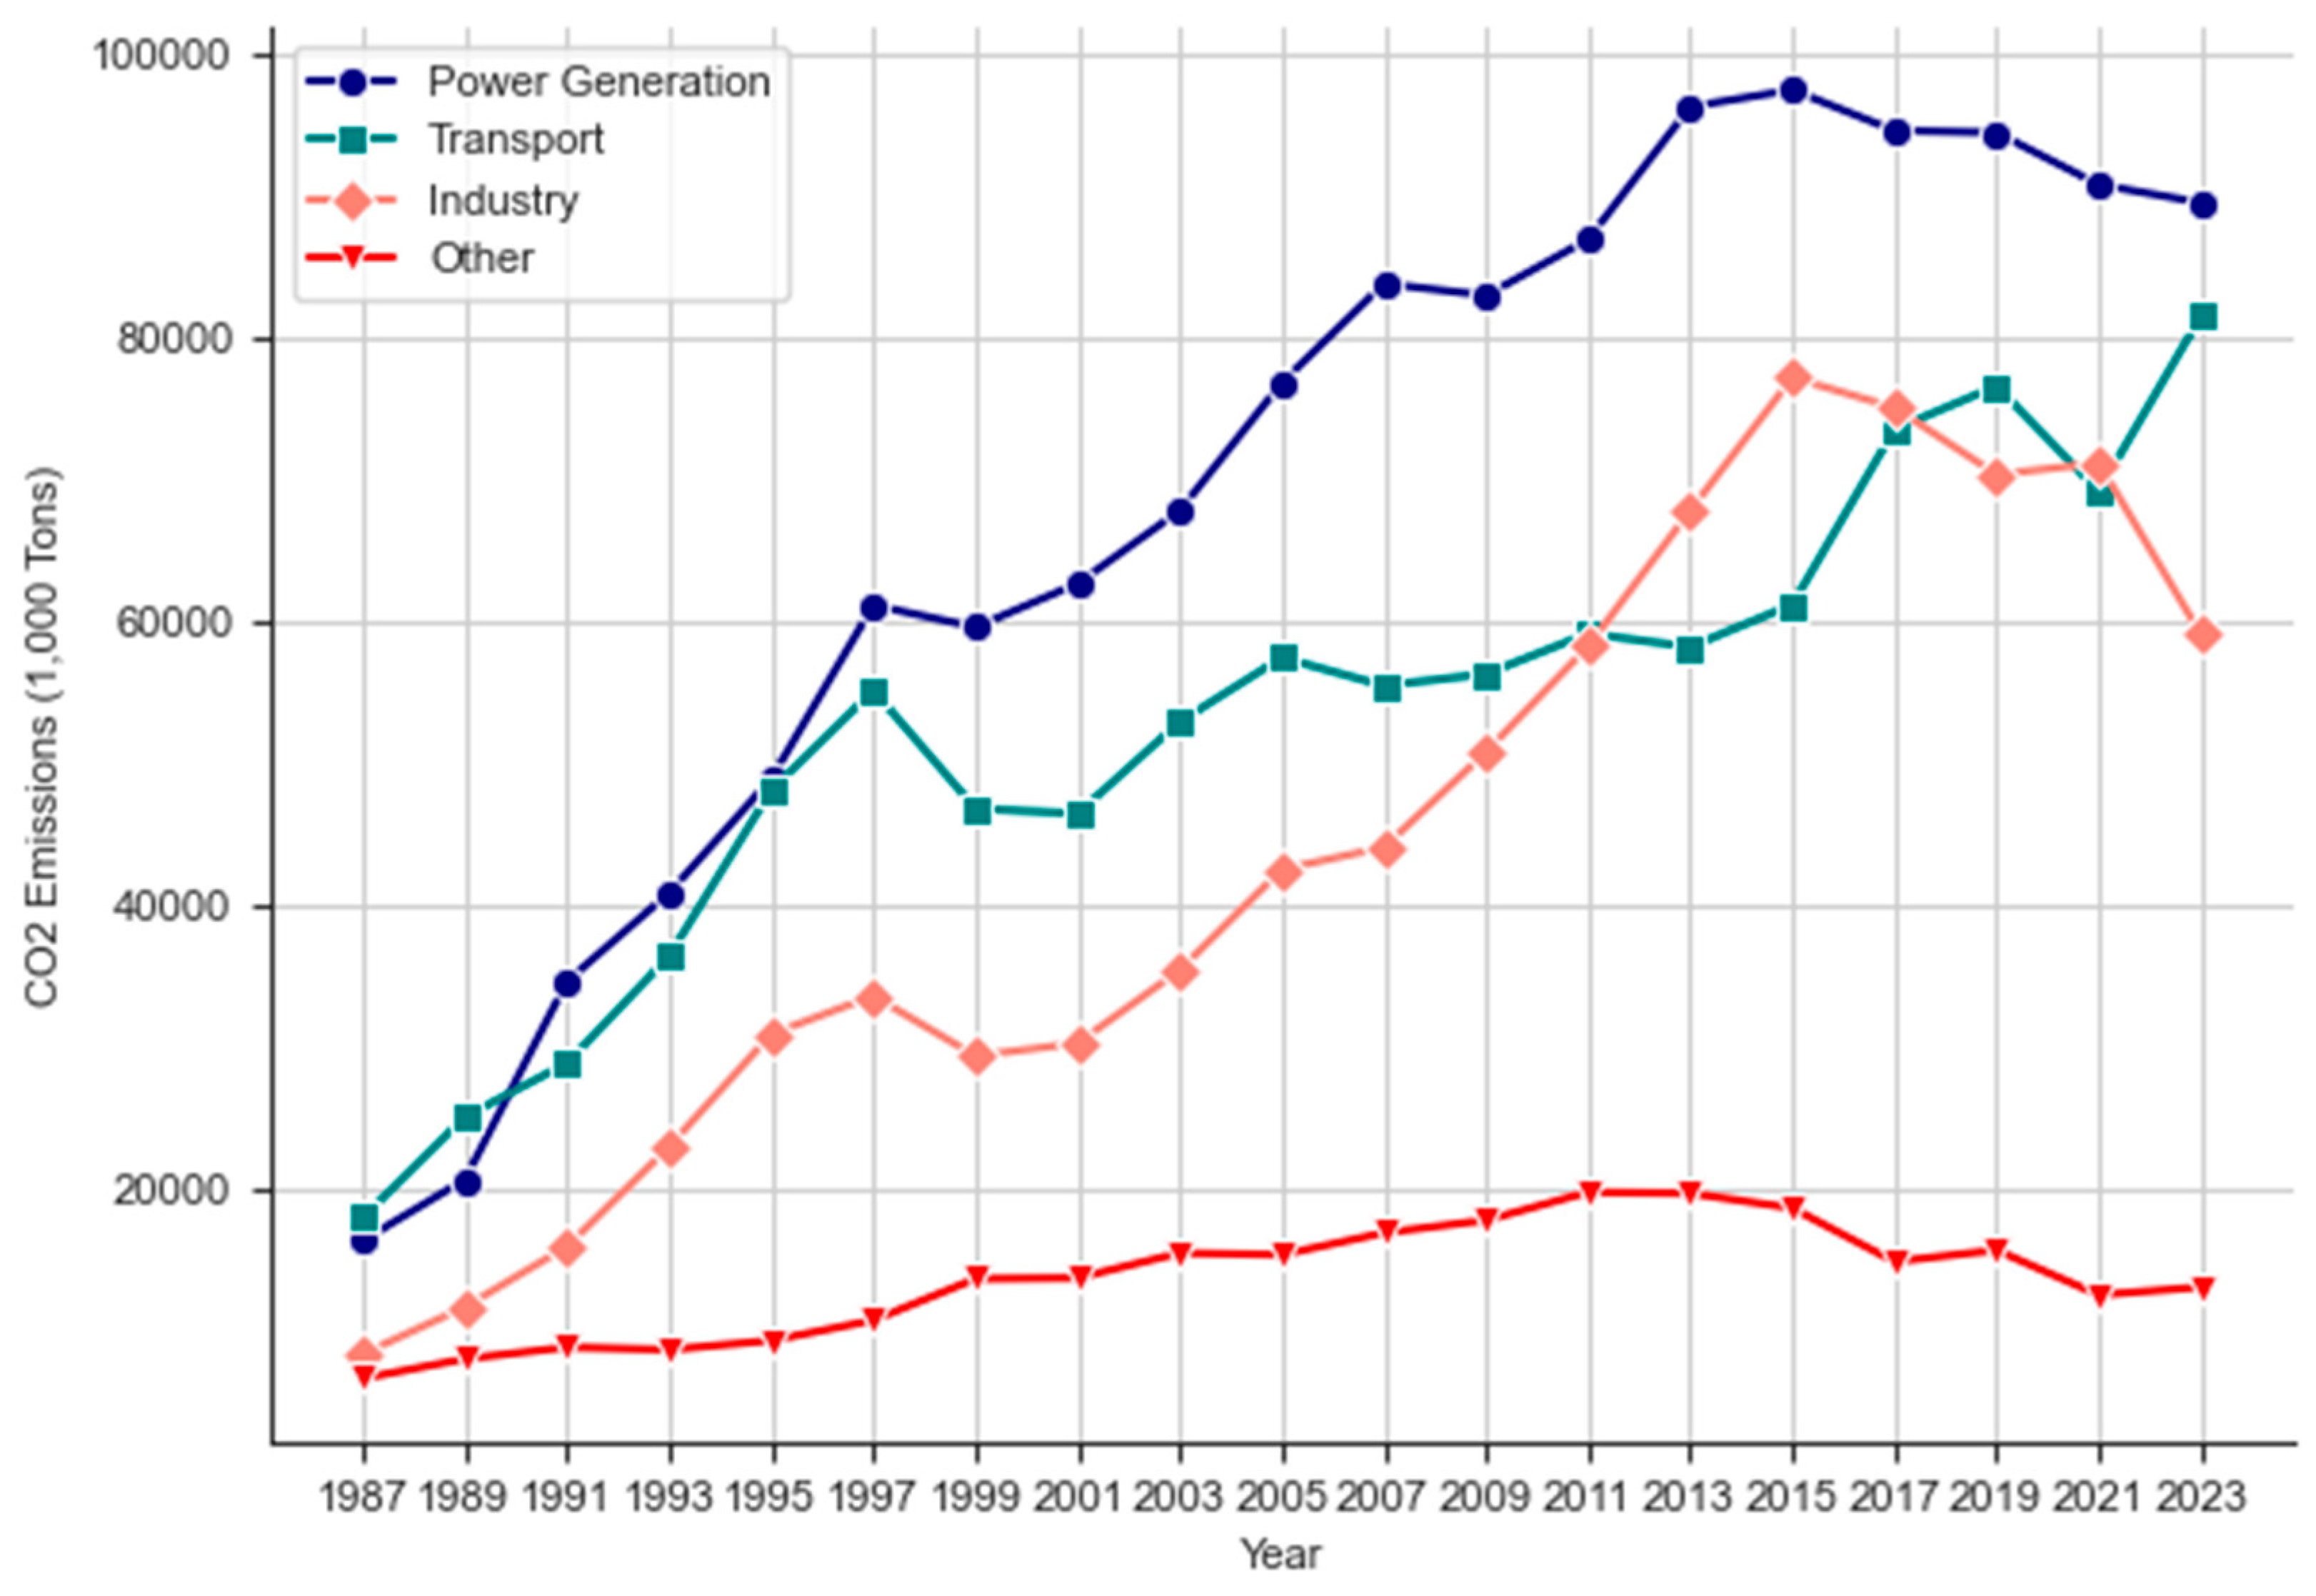
Figure 2.
Number of registered vehicles in Thailand.
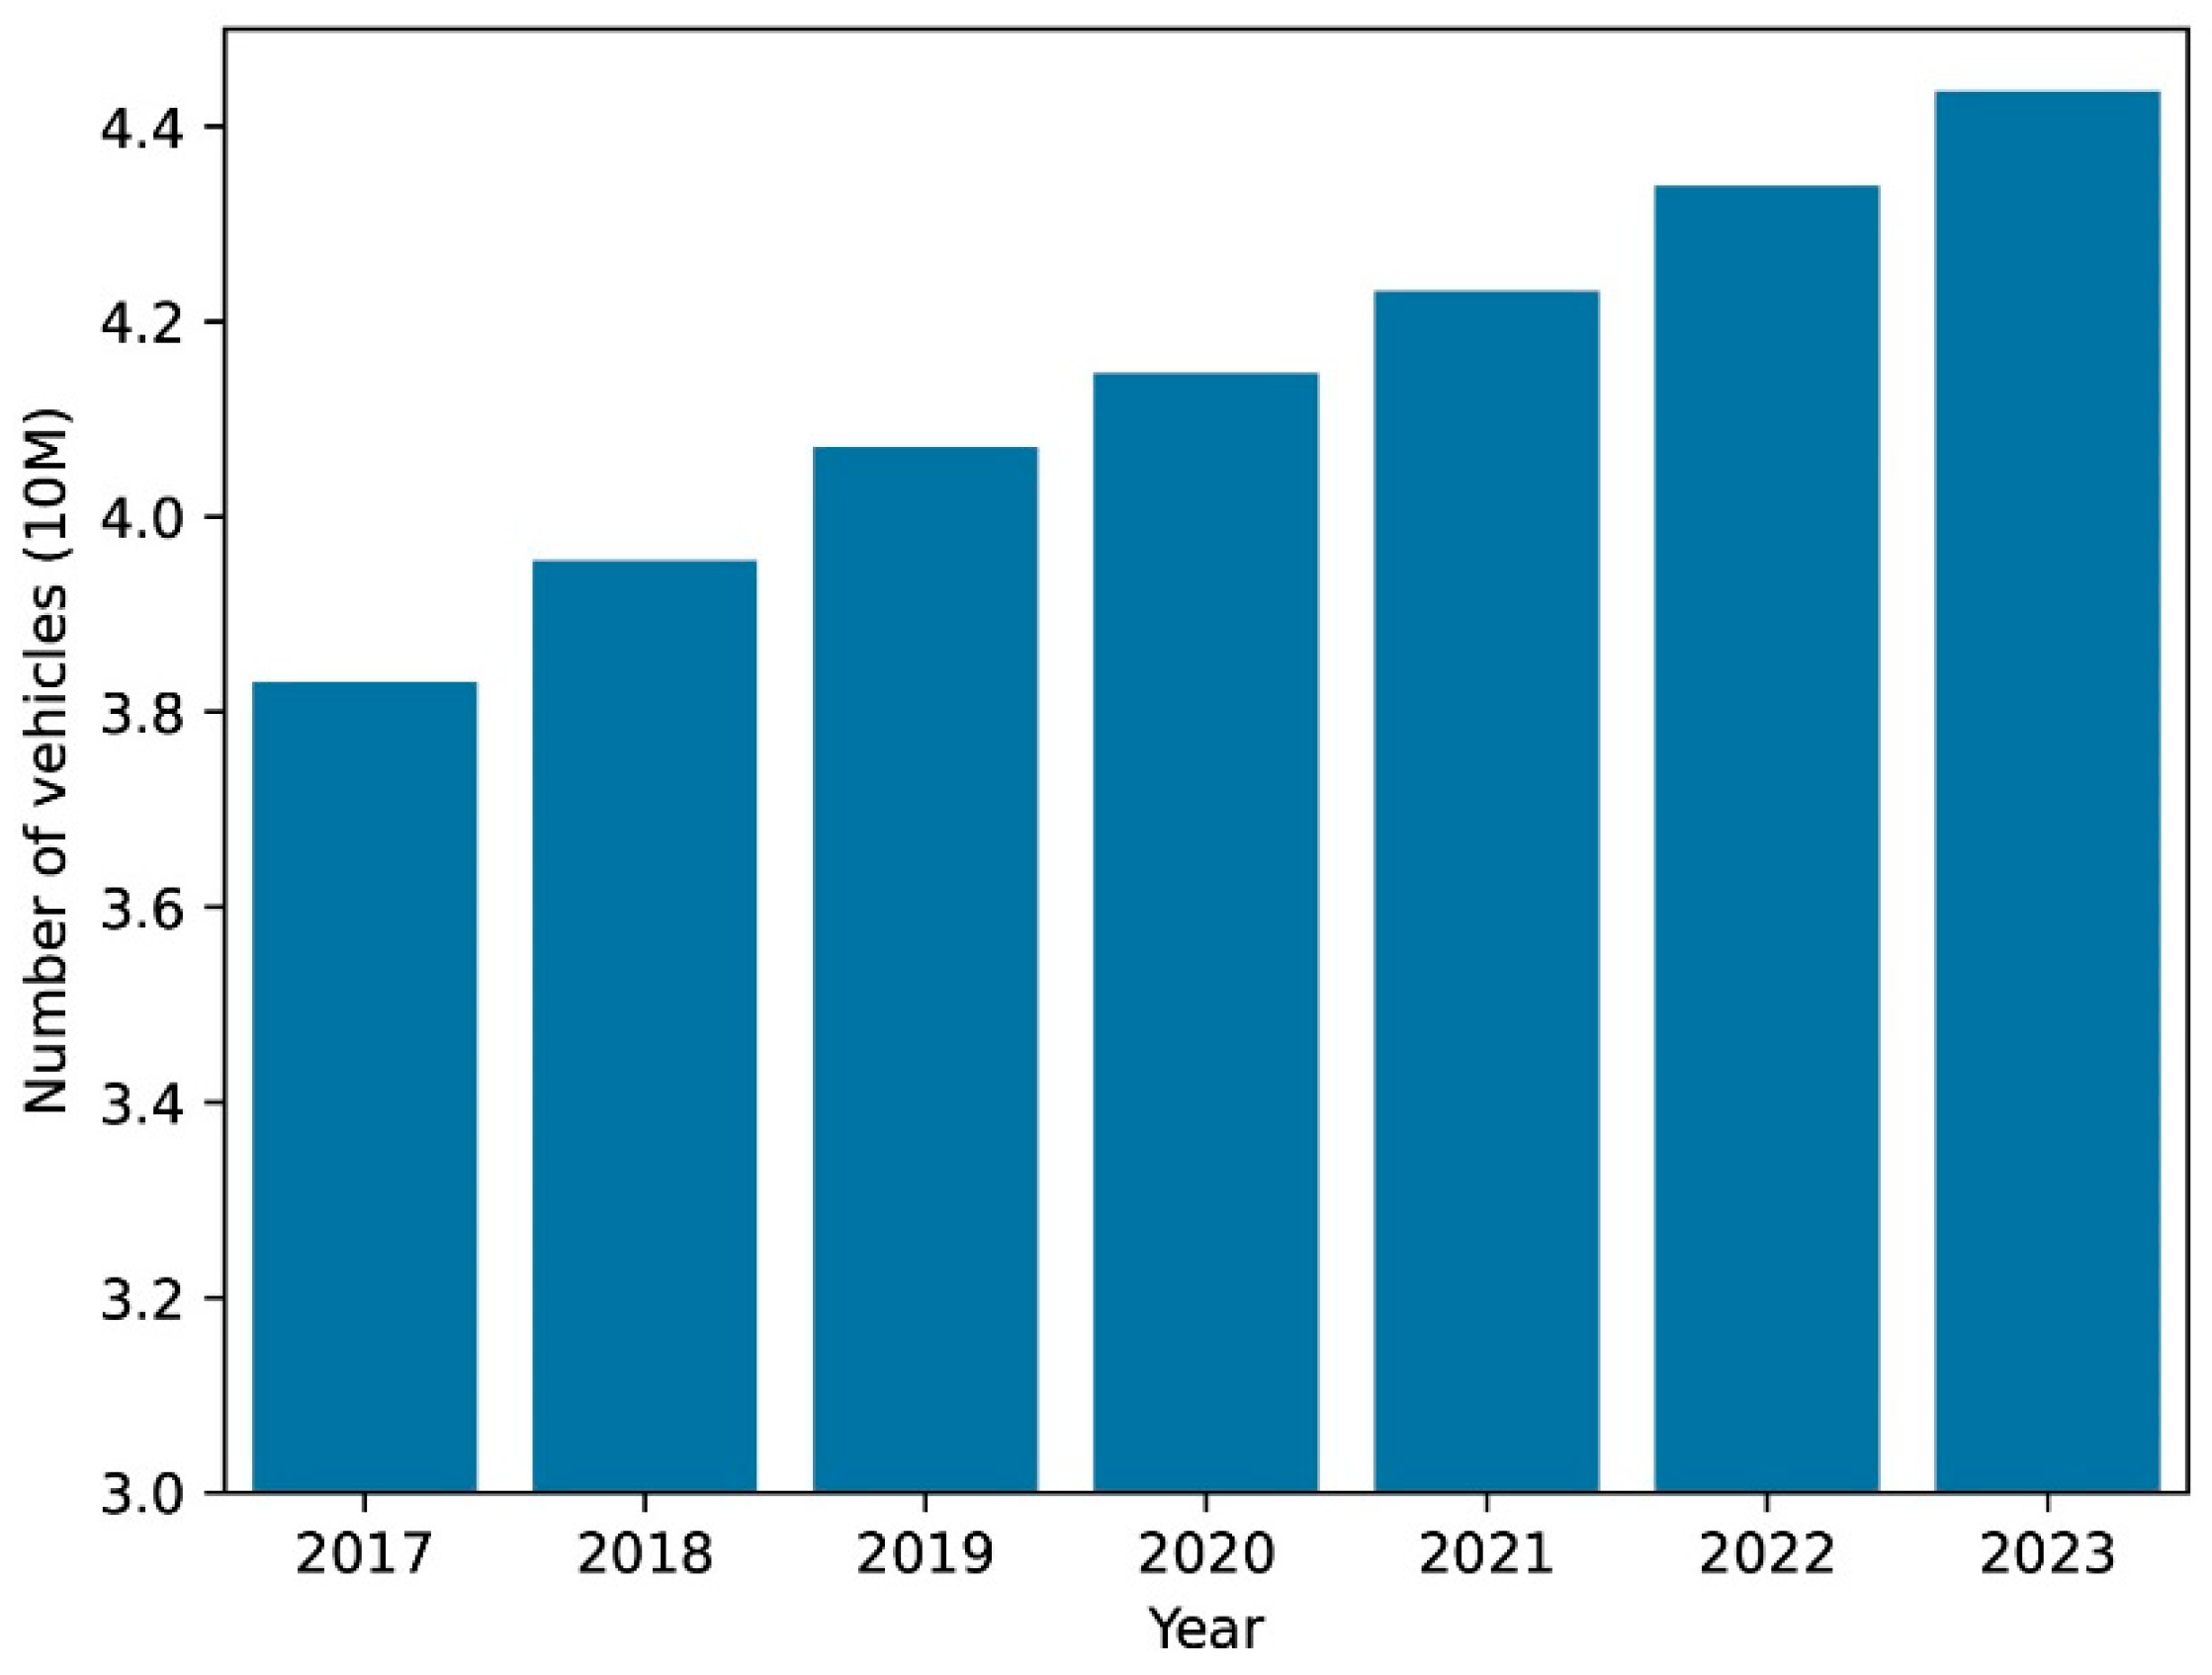
Table 1.
Supporting factors for EV adoption, selected from the literature for analysis.
| Supporting Factor Type | Code | Actual Factor | Explanation |
|---|---|---|---|
| Motivator driving EV | ME1 | EV get Tax refund | Financial incentives offered by governments to promote electric vehicle adoption. |
| ME2 | EV has special lane | The special lanes created to incentivize the adoption of electric vehicles. | |
| ME3 | EV is excepted parking fee | The owners of these vehicles are not required to pay the parking charges or fees. | |
| ME4 | EV get toll free | The owners of these vehicles are exempt from paying tolls or fees that are typically required to use certain roads, bridges, tunnels, or express lanes. | |
| ME5 | EV has maintenance cost less than ICEV | The expenses incurred to keep the vehicle in good working condition and ensure its reliability, safety, and performance over time. | |
| ME6 | EV get charging price less than household electricity | The cost associated with recharging the vehicle's battery compared to household electricity prices. | |
| ME7 | EV charging cost is cheaper than ICEV fuel cost | Comparing the cost of recharging an electric vehicle's battery to the expense of gasoline. | |
| ME8 | EV can do vehicle to grid | The new technology for transferring electricity from electric vehicle batteries into the main electrical grid. | |
| Environment Awareness | EA1 | Climate Change harm yourself and your family | The awareness of the dangers arising from current climate change. |
| EA2 | Air pollution affect | Benefits of using EVs to reduce air pollution problems. | |
| EA3 | More environment concern | Environmental concern or worry. | |
| EA4 | Adapt behavior for global warming and environment | Changing behavior for a better future. | |
| EA5 | EV help GHG emission | Benefits of using EVs to reduce oil consumption, which in turn affects greenhouse gas emissions. | |
| EA6 | EV reduce noise pollution | Reducing the problem of loud engine noise from using conventional cars. | |
| EA7 | EV reduce air pollution | Replacing ICE with EVs reduces the combustion of fossil fuels, which affects emissions into the air. | |
| Public acceptance | PA1 | Willingness to buy | Intention to purchase based on various personal factors, such as age, income, marital status, and more. |
Table 2.
Respondent demographics.
| Demographic | Item | Percentage |
|---|---|---|
| Gender | Male | 60.3 |
| Female | 39.7 | |
| Age | Under 25 years | 7.2 |
| 26-35 years | 53.4 | |
| 36-45 years | 23.5 | |
| 46-55 years | 12 | |
| Over 56 years | 3.9 | |
| Education background | Diploma/ College | 7.2 |
| Bachelor | 88.7 | |
| Maste or higher | 4.1 | |
| Occupation | Government official/state enterprise employee | 26.6 |
| Company employee/employee | 43.6 | |
| Self-employed/merchant | 18.3 | |
| Student | 6.8 | |
| Others | 4.8 | |
| Family size | 1-2 persons | 24.6 |
| Over 3 persons | 75.4 | |
| Car ownership | None | 15.3 |
| 1-2 cars | 70.4 | |
| Over 3 cars | 14.4 | |
| Driving experience | None | 9.8 |
| 0-3 years | 16.6 | |
| 3-5 years | 10.9 | |
| Over 5 years | 62.7 | |
| Monthly income | Under THB 15,000 | 10.9 |
| THB 15,000–25,000 | 26.4 | |
| THB 25,001–35,000 | 17.6 | |
| THB 35,001–45,000 | 10.2 | |
| THB 45,001–55,000 | 10.5 | |
| Over 55,001 | 24.4 | |
| N = 459 |
Table 3.
Reliability of questionnaires among motivators and environmental awareness.
| Variables | Items | Cronbach’s Alpha |
|---|---|---|
| Motivators | ME1, ME2, ME3, ME4, ME5, ME6, ME7, ME8 | 0.868 |
| Environment awareness | EN1, EN2, EN3, EN4, EN5, EN6, EN7 | 0.909 |
| Purchase intention | PA1 | 0.873 |
Table 4.
Descriptive analysis of motivators and environmental awareness to EV adoption.
| Factors | Code | Min | Max | Mean ± SD | Rank |
|---|---|---|---|---|---|
| Motivator | ME1 | 1 | 5 | 4.29 ± .992 | 1 |
| ME7 | 1 | 5 | 4.23 ± .969 | 2 | |
| ME5 | 1 | 5 | 4.19 ± .958 | 3 | |
| ME6 | 1 | 5 | 4.05 ± 1.097 | 4 | |
| ME8 | 1 | 5 | 3.84 ± 1.172 | 5 | |
| ME1 | 1 | 5 | 3.78 ± 1.260 | 6 | |
| ME3 | 1 | 5 | 3.73 ± 1.232 | 7 | |
| ME2 | 1 | 5 | 3.58 ± 1.213 | 8 | |
| Environment | EA4 | 1 | 5 | 4.41 ± .885 | 1 |
| EA7 | 1 | 5 | 4.41 ± .883 | 2 | |
| EA3 | 1 | 5 | 4.35 ± .956 | 3 | |
| EA6 | 1 | 5 | 4.33 ± .917 | 4 | |
| EA2 | 1 | 5 | 4.31 ± .964 | 5 | |
| EA5 | 1 | 5 | 4.31 ± .916 | 6 | |
| EA1 | 1 | 5 | 4.17 ± 1.040 | 7 |
Disclaimer/Publisher’s Note: The statements, opinions and data contained in all publications are solely those of the individual author(s) and contributor(s) and not of MDPI and/or the editor(s). MDPI and/or the editor(s) disclaim responsibility for any injury to people or property resulting from any ideas, methods, instructions or products referred to in the content. |
© 2025 by the authors. Licensee MDPI, Basel, Switzerland. This article is an open access article distributed under the terms and conditions of the Creative Commons Attribution (CC BY) license (http://creativecommons.org/licenses/by/4.0/).
Copyright: This open access article is published under a Creative Commons CC BY 4.0 license, which permit the free download, distribution, and reuse, provided that the author and preprint are cited in any reuse.


