Submitted:
03 January 2025
Posted:
03 January 2025
You are already at the latest version
Abstract
Reducing odor and particulate matter (PM) in confined swine houses is critical for environmental sustainability and animal welfare. This study evaluated the effects of different housing designs and bedding systems on aerial environmental conditions in swine confinement facilities. Three experimental swine house models (M1, M2, and M3) were constructed with distinct ventilation and bedding configurations. M1 employed circulating airflow with negative pressure and a recirculating ventilation system. M2 featured a plug flow air pattern with negative pressure and a perforated plastic bed, while M3 utilized a sawdust bedding system with recirculating ventilation. Each model housed nine fattening swine in a 12 m² area, and the study was conducted over 110 days (May 6–August 26, 2018). Measurements included odorous compounds, volatile organic acids (VOA), and PM concentrations. Ammonia (NH₃) levels were highest in M1 (9.07 ppm) and lowest in M3 (5.94 ppm). Hydrogen sulfide (H₂S) was undetectable in M3, while M1 and M2 recorded measurable levels. VOA concentrations were significantly lower in M3 (84.86 ppbv) compared to M1 (884.29 ppbv) and M2 (605.31 ppbv). PM10 levels exhibited notable variations, with concentrations of 115.25 μg/m³ in M1, 218.83 μg/m³ in M2, and 312.00 μg/m³ in M3. However, bacterial concentrations were highest in M3. The sawdust bedding system (M3) significantly reduced volatile fatty acids and odorous compounds compared to pit-based systems, while the ventilation system influenced odor control. Although M3 had higher PM levels, the findings emphasize the need for swine farming systems to balance environmental management with animal welfare considerations.
Keywords:
Ammonia
; Odor reduction
; Particulate matter
; Sawdust
; Swine house
; Ventilation
1. Introduction
The global landscape of meat production has undergone a dramatic transformation over the past few decades, marked by a substantial rise in intensive confined livestock operations to meet growing consumer demands [1,2]. This industrial approach to animal agriculture has introduced significant environmental challenges and raised pressing concerns about animal welfare. Concentrated Animal Feeding Operations (CAFOs) have fundamentally reshaped animal husbandry, often reducing animals to “cogs in a ma-chine” with limited regard for their natural behaviors or physiological needs [3]. Common practices include routine procedures such as piglet tail docking and tooth clipping, while animals are confined to restrictive spaces with metal flooring that inhibits natural behaviors like soil rooting. Furthermore, the environmental impact of these operations is considerable, particularly in terms of air pollution emanating from confined animal housing.
Ventilation systems in swine facilities often expel air containing high concentrations of odorous gases and particulate matter [2]. The emission of volatile organic compounds (VOCs) from these facilities has become a significant public health concern [4], contrib-uting to the formation of photochemical smog and respirable suspended particulates [5]. Particulate matter from swine houses also carries microorganisms and bio-aerosols, in-creasing the risk of respiratory infections in nearby communities [6]. Approximately 50% of odor emissions stem from livestock buildings (30%) and manure storage facilities (20%) [7]. The primary gaseous pollutants include ammonia, carbon dioxide, methane, sulfur compounds, and VOCs [8]. In response to these challenges, researchers and envi-ronmental engineers are actively developing and refining technologies to mitigate the environmental impacts of swine housing and manure management systems.
Various pollution control technologies have been explored to mitigate emissions from swine facilities, including activated carbon adsorption, wet scrubbing, and masking agents [9,10]. Among these, wet biofiltration has recently gained attention as a promising solution for managing low to moderate concentrations of odorous air and VOCs [11,12]. Biofilters have demonstrated the potential to reduce odor emissions by 40–83% in facilities near residential areas [13], with their effectiveness largely dependent on sufficient air contact time [14].
Innovative studies by Zong et al. [15,16] have focused on optimizing ventilation exhaust systems to identify cost-effective solutions for purifying air from swine housing. However, a critical gap persists in the literature: comprehensive investigations into the combined effects of bedding systems and ventilation strategies on odor mitigation and overall environmental impact. Addressing this gap is essential to developing integrated approaches for sustainable swine farming.
As global demand for meat continues to rise, the animal production industry faces an urgent need to develop engineering solutions that effectively manage gaseous odor pollutants while minimizing environmental and health risks. In this study, we adopted an integrated approach that incorporates bedding types, ventilation systems, and emission control technologies. This approach offers a promising pathway toward more sustainable and environmentally responsible livestock production.
2. Materials and Methods
2.1. Experimental Swine Houses Design and Operation
Three experimental swine housing models (M1, M2, and M3) were constructed to evaluate the effects of housing design on aerial environmental conditions (Table 1, Figure 1a–c, and Figure 2). The houses featured distinct biofilter configurations and flooring systems. M1 and M2 utilized fully slatted floors with underlying slurry storage pits, while M3 incorporated a sawdust bed. The biofilter systems varied across models: M1 employed vertically arranged cellulose materials, M2 utilized horizontally arranged cellulose materials, and M3 used a biofilter composed of biochar and flue gas desulfurization (FGD) gypsum. To maintain biofilter moisture, treated swine wastewater was recycled at a rate of 3.75 L/h, with the dripped water collected in a 2.8 m × 1.5 m × 1.0 m reservoir for reuse. Each housing unit accommodated nine fattening swine within a 12 m² area (3 m × 4 m), providing 1.3 m² per head—exceeding the typical field standard of 0.8–1.0 m² per head. The experiment was conducted over 16 weeks, from May 8 to August 26, 2018. The swine were provided with unrestricted access to food and water. Feed composition included 16% crude protein during the growing phase and 14.5% during the finishing phase. Each house was equipped with a distinct airflow pattern. In M1, air entered through an inlet duct, flowed downward, recirculated above the slatted floor, and exited through the vertical biofilter (Figure 1a). M2’s air entered through the inlet duct, flowed downward into the slurry pit, and exited through the horizontal biofilter (Figure 1b). M3 followed a similar airflow pattern to M2 but incorporated a sawdust bed to prevent infiltration (Figure 1c). Ventilation rates were automatically controlled (Vent System A/S, Roslev, Denmark) to maintain a constant temperature of 23°C, with a maximum flow capacity of 60 m³/head/h (2,160 m³/h or 0.67 m³/s). The system included recirculation of treated swine slurry into the pit to enhance microbial density and wetting of the biofilter to reduce micro-dust and odor emissions.
2.2. Analysis of PM and Odorous Compounds
Particulate matter was measured using an aerosol mass monitor (GT-331, SIBATA) oper-ating at a precise flow rate of 2.83 L/min. This equipment allowed for the simultaneous quantification of PM10, PM2.5, and total suspended particles (TSPs). For the analysis of volatile organic compounds (VOCs), gas chromatography coupled with mass spectrometry (GC/MS, Agilent GC6890N/5975C) was employed. Air samples were collected over five-minute intervals using 1-L Tedlar bags (No. 22053, Restek, Bellefonte, PA, USA) to ensure accuracy and consistency in sample capture. The analysis followed the protocol detailed by Kumari et al. [17], enabling precise identification and quantification of indi-vidual VOCs. The VOC analysis included specific compound groups. Sulfur compounds, such as dimethyl sulfide and dimethyl disulfide, were measured for their known contri-bution to odor intensity. Volatile fatty acids, including acetic acid, propionic acid, butyric acid, isobutyric acid, valeric acid, and isovaleric acid, were quantified due to their signif-icant role in swine facility emissions. Indoles (indole and skatole) and phenols (p-cresol) were also included, as these compounds are critical indicators of odor and air quality in livestock environments. Ammonia (NH₃) and hydrogen sulfide (H₂S) concentrations were determined using a Gastec probe (Gastec Co., Ltd., Kanagawa, Japan), providing real-time data on these key gaseous pollutants. The removal efficiency of the biofilters was calculated using a standard equation, as outlined by previous studies [18].
where C₁ represents inlet NH₃ concentrations and C₂ represents exhaust NH₃ concentrations.
RE = ((C₁ − C₂)/C₁) × 100
2.3. Airborne Bacteria Analysis
Airborne bacteria were monitored by measuring the total bacterial count (TBC), total Escherichia coli (TE), and total fecal coliform (TC) using the plate settling method. Standard Petri dishes (90 mm × 15 mm, SPL Life Sciences, Pochun-si, Korea) were employed for this purpose. Each bacterial group was cultured on selective media: Tryptic soy agar for TBC, Chromocult Coliformen agar for TE, and m-FC agar for TC. The plates were incubated under controlled conditions at 35°C for 24 hours to facilitate the growth of TBC, while TE and TC plates were incubated for 48 hours to allow for adequate bacterial growth. After the incubation period, bacterial colonies were counted and the results were expressed as colony-forming units per minute (cfu/min) of settling, providing a standardized measurement of airborne bacterial contamination.
2.4. Statistical Analysis
Statistical analysis employed ANOVA at 5% significance level, with Tukey’s test for comparing quantitative factor averages using SPSS software (SPSS Inc., Chicago, IL, USA)..
3. Results and Discussion
3.1. NH3 and H2S Reduction
The management of gaseous emissions, particularly ammonia (NH3) and hydrogen sulfide (H2S), remains a critical challenge in swine production facilities. These emissions affect both animal welfare and environmental quality [19]. Three pilot swine houses (M1, M2, and M3) were evaluated for NH3 concentrations (Figure 3). M1 exhibited significantly higher NH3 levels (9.07 ppm, p < 0.05) compared to M2 (6.10 ppm) and M3 (5.94 ppm). These findings align with research by Arogo et al. [20], who reported similar NH3 concentration patterns in conventional versus alternative housing systems. The sawdust bedding system (M3) initially demonstrated superior NH3 control, consistent with findings from Huang et al. [21], who attributed this to high organic carbon content binding with NH3 molecules. However, after day 14, NH3 levels in M3 increased significantly, potentially due to reduced absorption capacity of bedding material latter stages. This pattern aligns with observations by Gallmann et al. [22], who documented similar temporal changes in bedding-based systems. The increased NH3 emissions post-day 14 correlate with findings from Cao et al. [23] regarding the impact of urine and feces accumulation on bedding degradation processes. H2S concentrations varied significantly among systems, with M1 averaging 0.63 ppm, M2 at 0.57 ppm (p < 0.05), and M3 showing undetectable levels (Figure 4). These results support findings by Ni et al. [24], who demonstrated the effectiveness of alternative housing systems in H2S reduction. The peak H2S concentration in M1 (3.2 ppm) exceeded the recommended maximum of 3.0 ppm [25], consistent with observations by Grant and Boehm [26], regarding anaerobic conditions in conventional systems. M3 with sawdust bedding shows lower H2S emission than that of the pit slurry system. This study suggested integrating sawdust bedding into a pit slurry system to keep H2S in the permissible range.
3.2. VOCs and PM
Volatile organic compounds (VOCs) and particulate matter (PM) emissions from swine housing facilities are significant environmental and health concerns in livestock produc-tion [27]. This study evaluated three different swine housing systems to assess their impact on VOC (Table 2, Figure 5) and PM emissions (Figure 6). The results revealed significant differences in VOC concentrations across the three housing systems. M1 exhibited the highest VOC concentration (884.29 ppbv), followed by M2 (605.31 ppbv), and M3 (84.86 ppbv) (p < 0.05). These findings are consistent with those of Hutchings et al. [28], who reported that slurry pit systems generally produce higher VOC emissions compared to alternative bedding systems. The sawdust bedding system (M3) demonstrated an ap-proximately 85% reduction in VOC emissions compared to the pit systems, aligning with results from similar studies [29]. The recirculation of treated wastewater in M2 led to a 31% reduction in VOC emissions compared to the conventional pit system (M1). While phenolic compound concentrations were similar between M1 (0.86 ppbv) and M2 (0.94 ppbv), M3 showed significantly lower levels (0.56 ppbv, p < 0.05). This trend corresponds with the findings of Gallmann et al. [22], who observed lower phenolic emissions in bedding-based systems. Sulfuric compound emissions followed a similar pattern to VOCs, with M3 (2.44 ppbv) exhibiting significantly lower concentrations than M1 (14.42 ppbv) and M2 (5.06 ppbv). The sawdust bedding system demonstrated a reduction efficiency of 51.77–83.07% for sulfuric emissions. However, in contrast to VOC results, the sawdust bedding system (M3) generated higher PM levels. Specifically, PM10 concentrations in M3 were 312.0 μg/m³, and PM2.5 concentrations were 164.29 μg/m³, significantly exceeding those in M1 and M2 (p < 0.05). This observation aligns with the work of De Rooij et al.. [30], who reported elevated PM levels in bedding-based systems due to animal activity and bedding material properties. The pit bedding systems (M1 and M2) exhibited lower PM concentrations, reaching only 48–72% of M3’s PM2.5 levels and 37–79% of M3’s PM10 levels. These results suggest a trade-off between VOC and PM emissions when selecting housing systems. This study demonstrates that while sawdust bedding systems are effective in reducing VOC emissions, they may contribute to higher PM concentrations. Additionally, the use of recirculated treated wastewater shows promise in reducing VOC emissions in pit systems. These findings provide valuable insights into emission control strategies for swine production facilities.
3.3. Aerial Microbes’ Concentration
The concentration of airborne microbes in swine housing facilities is a significant concern for both animal and worker health. Understanding how different housing designs influence microbial dispersion is essential for optimizing facility management practices [30]. This study compared three swine housing systems (M1, M2, and M3), focusing on total bacterial count (TBC), total coliforms (TC), and total E. coli (TE) concentrations (Figure 7). The sawdust bedding system (M3) exhibited significantly higher concentrations of all measured microbial parameters compared to the slurry pit systems (M1 and M2). These findings are consistent with the work of Lühken et al. [31], who reported elevated airborne microbial loads in bedding-based systems. The slurry pit systems (M1 and M2), which featured slot-plastic porous floors separating the airspace from the pit space, demonstrated lower airborne microbial concentrations. This effect is explained by Bilić et al. [32], who documented the effectiveness of spatial separation in reducing microbial contamination in the air. In contrast, the sawdust bedding system (M3), lacking spatial separation, resulted in higher microbial dispersion, particularly when the bedding material dried. These results align with findings from Zhao et al. [33], who noted a relationship between bedding moisture content and microbial aerosolization. The increased microbial concentrations in M3 were also linked to enhanced pig activity, supporting the observations of Kim et al. [34], who noted that enriched environments with natural behaviors promote greater microbial dispersion. The sawdust bedding, while beneficial for animal welfare, encouraged natural behaviors such as rooting, digging, and increased movement patterns, which in turn led to greater microbial dispersal. As noted by Luiken [35], such behavioral patterns in bedding-based systems are key contributors to higher microbial loads in the air.
4. Conclusions
This comprehensive study of three swine housing systems (M1, M2, and M3) highlighted signifi-cant trade-offs between various emission types and environmental parameters. The sawdust bedding system (M3) demonstrated superior performance in reducing certain gaseous emissions, achieving an 85% reduction in volatile organic compounds (VOCs) compared to conventional systems and maintaining hydrogen sulfide (H₂S) at undetectable levels. However, this system exhibited notable limitations, particularly in particulate matter (PM) emissions and airborne microbial concentrations. In contrast, the recirculated treated wastewater system (M2) emerged as a promising intermediate solution. It achieved a 31% reduction in VOC emissions compared to the conventional pit system (M1), while avoiding the elevated PM levels observed with the sawdust bedding system. These findings suggest that hybrid approaches may offer the most balanced solution for emission control. Future research should focus on developing integrated systems that combine the advantages of each approach while minimizing their respective drawbacks, thereby optimizing both environmental and operational outcomes in swine production.
Author Contributions
Conceptualization, H.L.C.; A.F.; and S.I.A.S.; methodology, A.F.; A.R.; S.I.A.S.; and H.L.C.; software, A.F.; A.R.; and A.S.; validation, A.F.; S.I.A.S.; and H.L.C.; formal analysis, A.F.; S.I.A.S.; and A.S.; investigation, A.F.; A.R.; and H.L.C.; resources, A.F.; data curation, A.F.; H.L.C.; and A.S.; writing—original draft preparation, A.F.; H.L.C.; and A.S.; writing—review and editing, A.F.; S.I.A.S.; H.L.C.; A.S.; visualization, A.F.; and A.S.; supervision, H.L.C.; and C.N.Y.; project administration, A.F.; H.L.C.; and C.N.Y.; funding acquisition, H.L.C.; and C.N.Y.
Funding
Please add: “This research was funded by the Korea Institute of Planning and Evaluation for Technology in Food, Agriculture, and Forestry (iPET), project number 116049-3 of the Ministry of Agriculture, Food, and Rural Affairs”. The authors also thank the Indonesia Endowment Fund for Education (LPDP) for financial support during this study.
Data Availability Statement
The data presented in this study are available on request from the corresponding author.
Acknowledgments
). The authors want to express their gratitude to Seoul National University (SNU) Global Scholarship, SNU Lecture & Research Scholarship, SNU Merit-based Scholarship, and TrackFarm Co., Ltd. for the financial support the author received during his doctoral program. The authors would also like to thank Mr. Kim Myoung Dong for technical assistance during the experiment and Drs Priyanka Kumari and Balasubramani Ravindran for their scientific suggestions during the study.
Conflicts of Interest
The authors declare no conflicts of interest.
Abbreviations
The following abbreviations are used in this manuscript:
| CAFOs | Concentrated Animal Feed Operations |
| CFU | Colony Forming unit |
| FGD | Flue Gas Desulfurization |
| M1 | Model house 1 |
| M2 | Model house 2 |
| M3 | Model house 3 |
| MBR | Membrane Bioreactor |
| ND | Not Detected |
| PM | Particulate Matter |
| ppbv | Parts per billion by volume |
| ppm | Parts per million |
| TBC | Total bacterial Count |
| TC | Total Coliforms |
| TE | Total Escherichia coli |
| TSPs | Total Suspended Particles |
| VOA | Volatile Organic Acid |
| VOCs | Volatile Organic Compounds |
| VFAs | Volatile Fatty Acids |
References
- Hoff, S. J.; Harmon, J. D. Biofiltration of the Critical Minimum Ventilation Exhaust Air. In Workshop on Agricultural Air Quality, Washington, DC, USA, 2006; pp 760-764.
- Nimmermark, S. Influence of odour concentration and individual odour thresholds on the hedonic tone of odour from animal production. Biosyst. Eng. 2011, 108, 211-219. [CrossRef]
- ASPCA. A Closer Look at Animals on Factory Farms. https://www.aspca.org/fight-cruelty/farm-animal-cruelty/pigs-factory-farms (accessed March 7, 2019).
- Yang, C.; Chen, H.; Zeng, G.; Yu, G.; Luo, S. Biomass accumulation and control strategies in gas biofiltration. Biotechnol. Adv. 2010, 28, 531-540. [CrossRef]
- Le Leuch, L. M.; Subrenat, A.; Le Cloirec, P. Hydrogen sulfide adsorption and oxidation onto activated carbon cloths: applications to odorous gaseous emission treatments. Langmuir 2003, 19, 10869-10877. [CrossRef]
- Cai, L.; Koziel, J. A.; Lo, Y. C.; Hoff, S. J. Characterization of volatile organic compounds and odorants associated with swine barn particulate matter using solid-phase microextraction and gas chromatography-mass spectrometry-olfactometry. J. Chromatogr. A 2006, 1102, 60-72. [CrossRef]
- Mielcarek, P.; Rzeźnik, W. Odor emission factors from livestock production. Pol. J. Environ. Stud. 2015, 24, 27-35. [CrossRef]
- Dumont, E.; Hamon, L.; Lagadec, S.; Landrain, P.; Landrain, B.; Andres, Y. NH3 biofiltration of piggery air. J. Environ. Manage. 2014, 140, 26-32. [CrossRef]
- Chung, Y. C.; Ho, K. L.; Tseng, C. P. Two-stage biofilter for effective NH3 removal from waste gases containing high concentrations of H2S. J. Air Waste Manage. Assoc. 2007, 57, 337-347. [CrossRef]
- Liu, Z.; Powers, W.; Mukhtar, S. A review of practices and technologies for odor control in swine production facilities. Appl. Eng. Agric. 2014, 30, 477-492.
- Ryu, H. W.; Cho, K. S.; Lee, T. H. Reduction of ammonia and volatile organic compounds from food waste-composting facilities using a novel anti-clogging biofilter system. Bioresour. Technol. 2011, 102, 4654-4660. [CrossRef]
- Estrada, J. M.; Kraakman, N. B.; Lebrero, R.; Muñoz, R. A sensitivity analysis of process design parameters, commodity prices and robustness on the economics of odour abatement technologies. Biotechnol. Adv. 2012, 30, 1354-1363. [CrossRef]
- Martens, W.; Martinec, M.; Zapirain, R.; Stark, M.; Hartung, E.; Palmgren, U. Reduction potential of microbial, odour and ammonia emissions from a pig facility by biofilters. Int. J. Hyg. Environ. Health 2001, 203, 335-345. [CrossRef]
- Sheridan, B.; Curran, T.; Dodd, V.; Colligan, J. Biofiltration of odour and ammonia from a pig unit-a pilot-scale study. Biosyst. Eng. 2002, 82, 441-453. [CrossRef]
- Zong, C.; Li, H.; Zhang, G. Ammonia and greenhouse gas emissions from fattening pig house with two types of partial pit ventilation systems. Agric. Ecosyst. Environ. 2015, 208, 94-105. [CrossRef]
- Zong, C.; Li, H.; Zhang, G. Airflow characteristics in a pig house with partial pit ventilation system: an experimental chamber study. In ASABE Annual International Meeting, Paper No. 152172138, 2015. [CrossRef]
- Kumari, P.; Lee, J.; Choi, H. L. Characterization of odorant compounds from mechanical aerated pile composting and static aerated pile composting. Asian-Australas. J. Anim. Sci. 2016, 29, 594-598. [CrossRef]
- Ashtari, A. K.; Majd, A. M.; Riskowski, G. L.; Mukhtar, S.; Zhao, L. Removing ammonia from air with a constant pH, slightly acidic water spray wet scrubber using recycled scrubbing solution. Front. Environ. Sci. Eng. 2016, 10, 3. [CrossRef]
- Sigsgaard, T.; Balmes, J. Environmental effects of intensive livestock farming. American Journal of Respiratory and Critical Care Medicine. 2017, 196(9), 1092-3. [CrossRef]
- Arogo, J.; Westerman, P. W.; Heber AJ. A review of ammonia emissions from confined swine feeding operations. Transactions of the ASAE. 2003, 46(3), 805.
- Huang, G..F.; Wong, J. W.; Wu, Q. T.; Nagar, B. B. Effect of C/N on composting of pig manure with sawdust. Waste management. 2004 , 24(8), 805-13. [CrossRef]
- Gallmann, E.; Hartung, E.; Jungbluth, T. Long-term study regarding the emission rates of ammonia and greenhouse gases from different housing systems for fattening pigs–final results. InProceedings of the International Symposium on gaseous and odour emissions from animal production facilities. Horsens, Denmark 2003 , (Vol. 122).
- Cao, Y.; Bai, Z.; Misselbrook, T.; Wang, X.; Ma, L. Ammonia emissions from different pig production scales and their temporal variations in the North China Plain. Journal of the Air & Waste Management Association. 2021, 71(1), 23-33. [CrossRef]
- Ni, J. Q.; Heber, A. J.; Lim, T. T. Ammonia and hydrogen sulfide in swine production. InAir quality and livestock farming 2018, (pp. 29-47). CRC Press.
- World Health Organization. Guidelines for Air Quality in Livestock Facilities, 4th ed.; WHO Press: Geneva, 2022.Author 1, A.; Author 2, B. Title of the chapter. In Book Title, 2nd ed.; Editor 1, A., Editor 2, B., Eds.; Publisher: Publisher Location, Country, 2007; Volume 3, pp. 154–196.
- Grant, R. H.; Boehm, M. T. Emissions of H2S from hog finisher farm anaerobic manure treatment lagoons: Physical, chemical and biological influence. Atmosphere. 2022 , 13(2), 153. [CrossRef]
- Hobbs, P. J.; Webb, J.; Mottram, T. T.; Grant, B.; Misselbrook, T. M. Emissions of volatile organic compounds originating from UK livestock agriculture. Journal of the Science of Food and Agriculture. 2004, 84(11), 1414-20. [CrossRef]
- Hutchings, N. J.; ten Hoeve, M.; Jensen, R.; Bruun, S.; Søtoft, L. F. Modelling the potential of slurry management technologies to reduce the constraints of environmental legislation on pig production. Journal of environmental management. 2013, 130, 447-56. [CrossRef]
- Spiehs, M. J.; Brown-Brandl, T. M.; Parker, D. B.; Miller, D. N. Effect of bedding material on air quality of bedded manure packs in livestock facilities. ASABE Paper No. 12-1337890.
- De Rooij, M. M.; Hoek, G.; Schmitt, H.; Janse, I.; Swart, A.; Maassen, C. B.; Schalk, M.; Heederik, D. J.; Wouters, I. M. Insights into livestock-related microbial concentrations in air at residential level in a livestock dense area. Environmental science & technology. 2019, 53(13), 7746-58. [CrossRef]
- Lühken, E.; Nicolaisen, T.; Stracke, J.; Schulz, J.; Kemper, N. Microbiological air quality in free-farrowing housing systems for sows. Veterinary and animal science. 2019, 8, 100065. [CrossRef]
- Bilić, V.; Habrun, B.; Barač, I.; Humski, A. Distribution of airborne bacteria in swine housing facilities and their immediate environment. Arhiv za higijenu rada i toksikologiju. 2000, 51(2), 199-205.
- Zhao, Y.; Aarnink, A. J.; De Jong, M. C.; Groot Koerkamp, P. W. Airborne microorganisms from livestock production systems and their relation to dust. Critical Reviews in Environmental Science and Technology. 2014, 44(10), 1071-128. [CrossRef]
- Kim, K. Y.; Ko, H. J.; Kim, H. T.; Kim, C. N.; Byeon, S. H. Association between pig activity and environmental factors in pig confinement buildings. Australian Journal of Experimental Agriculture. 2008, 48(5), 680-6. [CrossRef]
- Luiken, R. E.; Van Gompel, L.; Bossers, A.; Munk, P.; Joosten, P.; Hansen, R. B.; Knudsen, B. E.; García-Cobos, S.; Dewulf, J.; Aarestrup, F. M.; Wagenaar, J. A. Farm dust resistomes and bacterial microbiomes in European poultry and pig farms. Environment International. 2020 , 143:105971. [CrossRef]
Figure 1.
Model swine houses M1 (a) with recirculation flow-vertical biofilter, M2 (b) with plug flow-horizontal biofilter, and M3 (c) with hybrid biochar/FGD layer.
Figure 1.
Model swine houses M1 (a) with recirculation flow-vertical biofilter, M2 (b) with plug flow-horizontal biofilter, and M3 (c) with hybrid biochar/FGD layer.
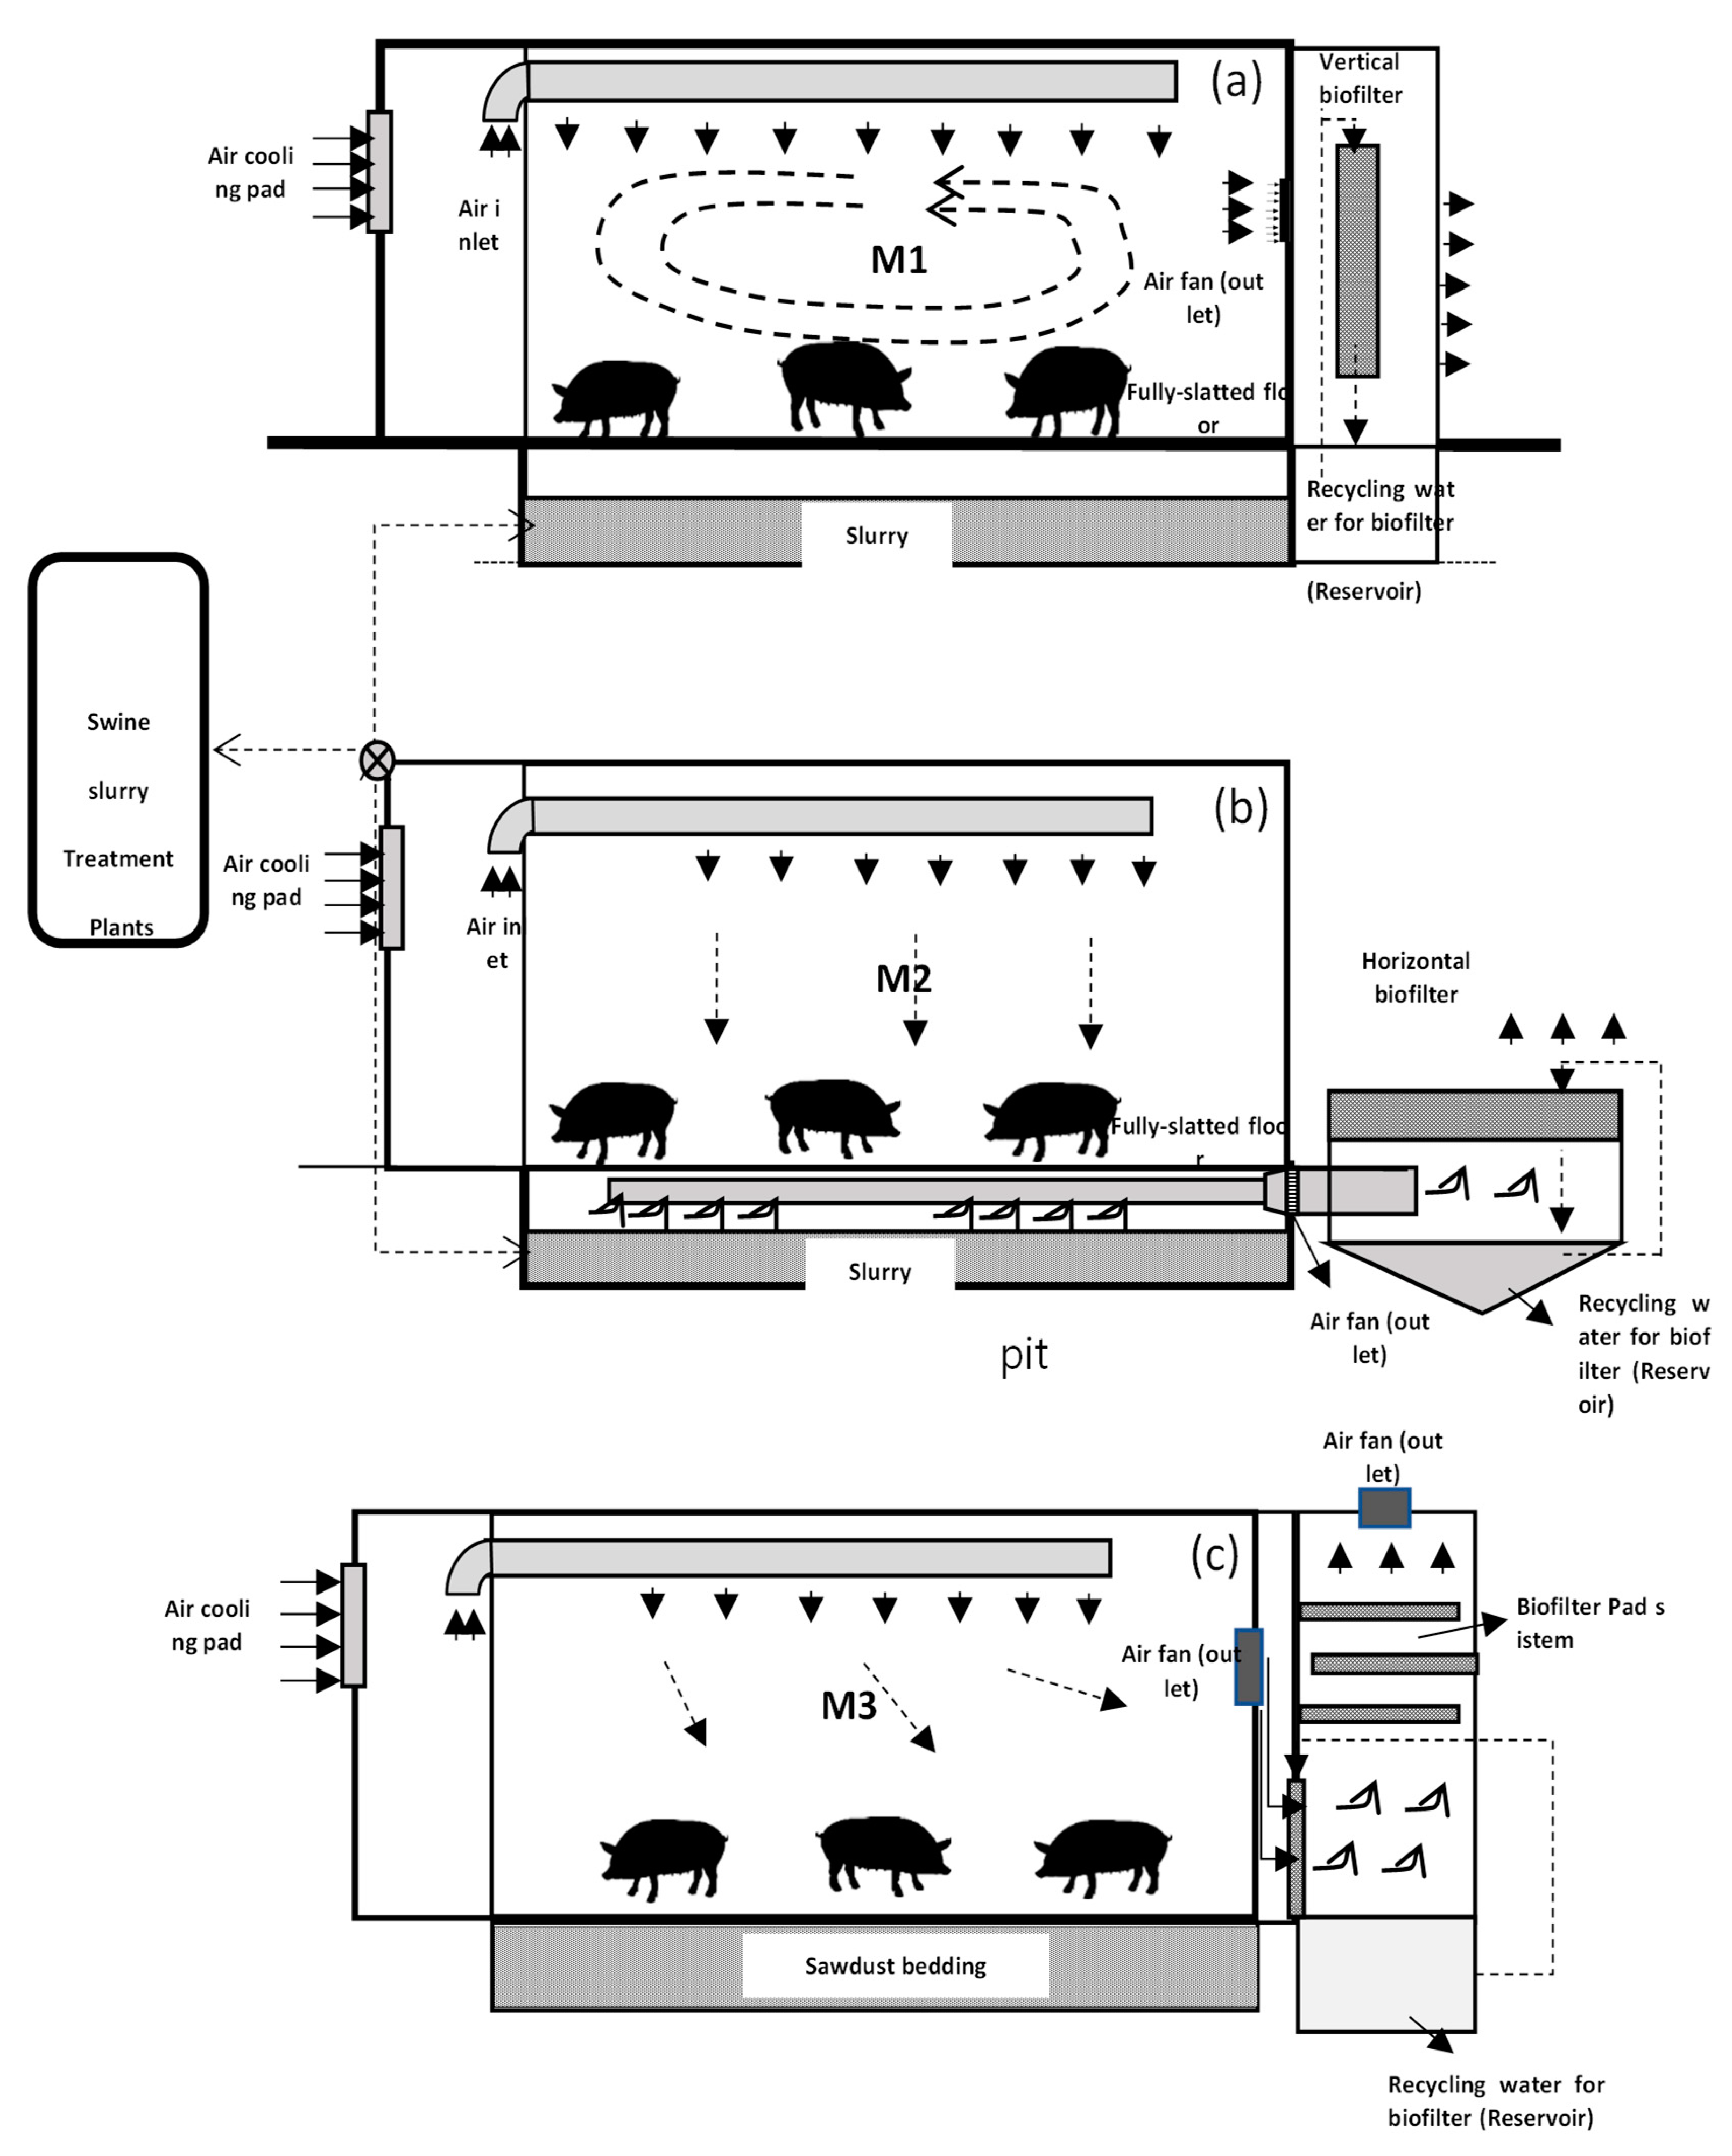
Figure 2.
Pilot swine houses (a), pig slurry treatment plant (b), and slurry treatment flow diagram (c).
Figure 2.
Pilot swine houses (a), pig slurry treatment plant (b), and slurry treatment flow diagram (c).
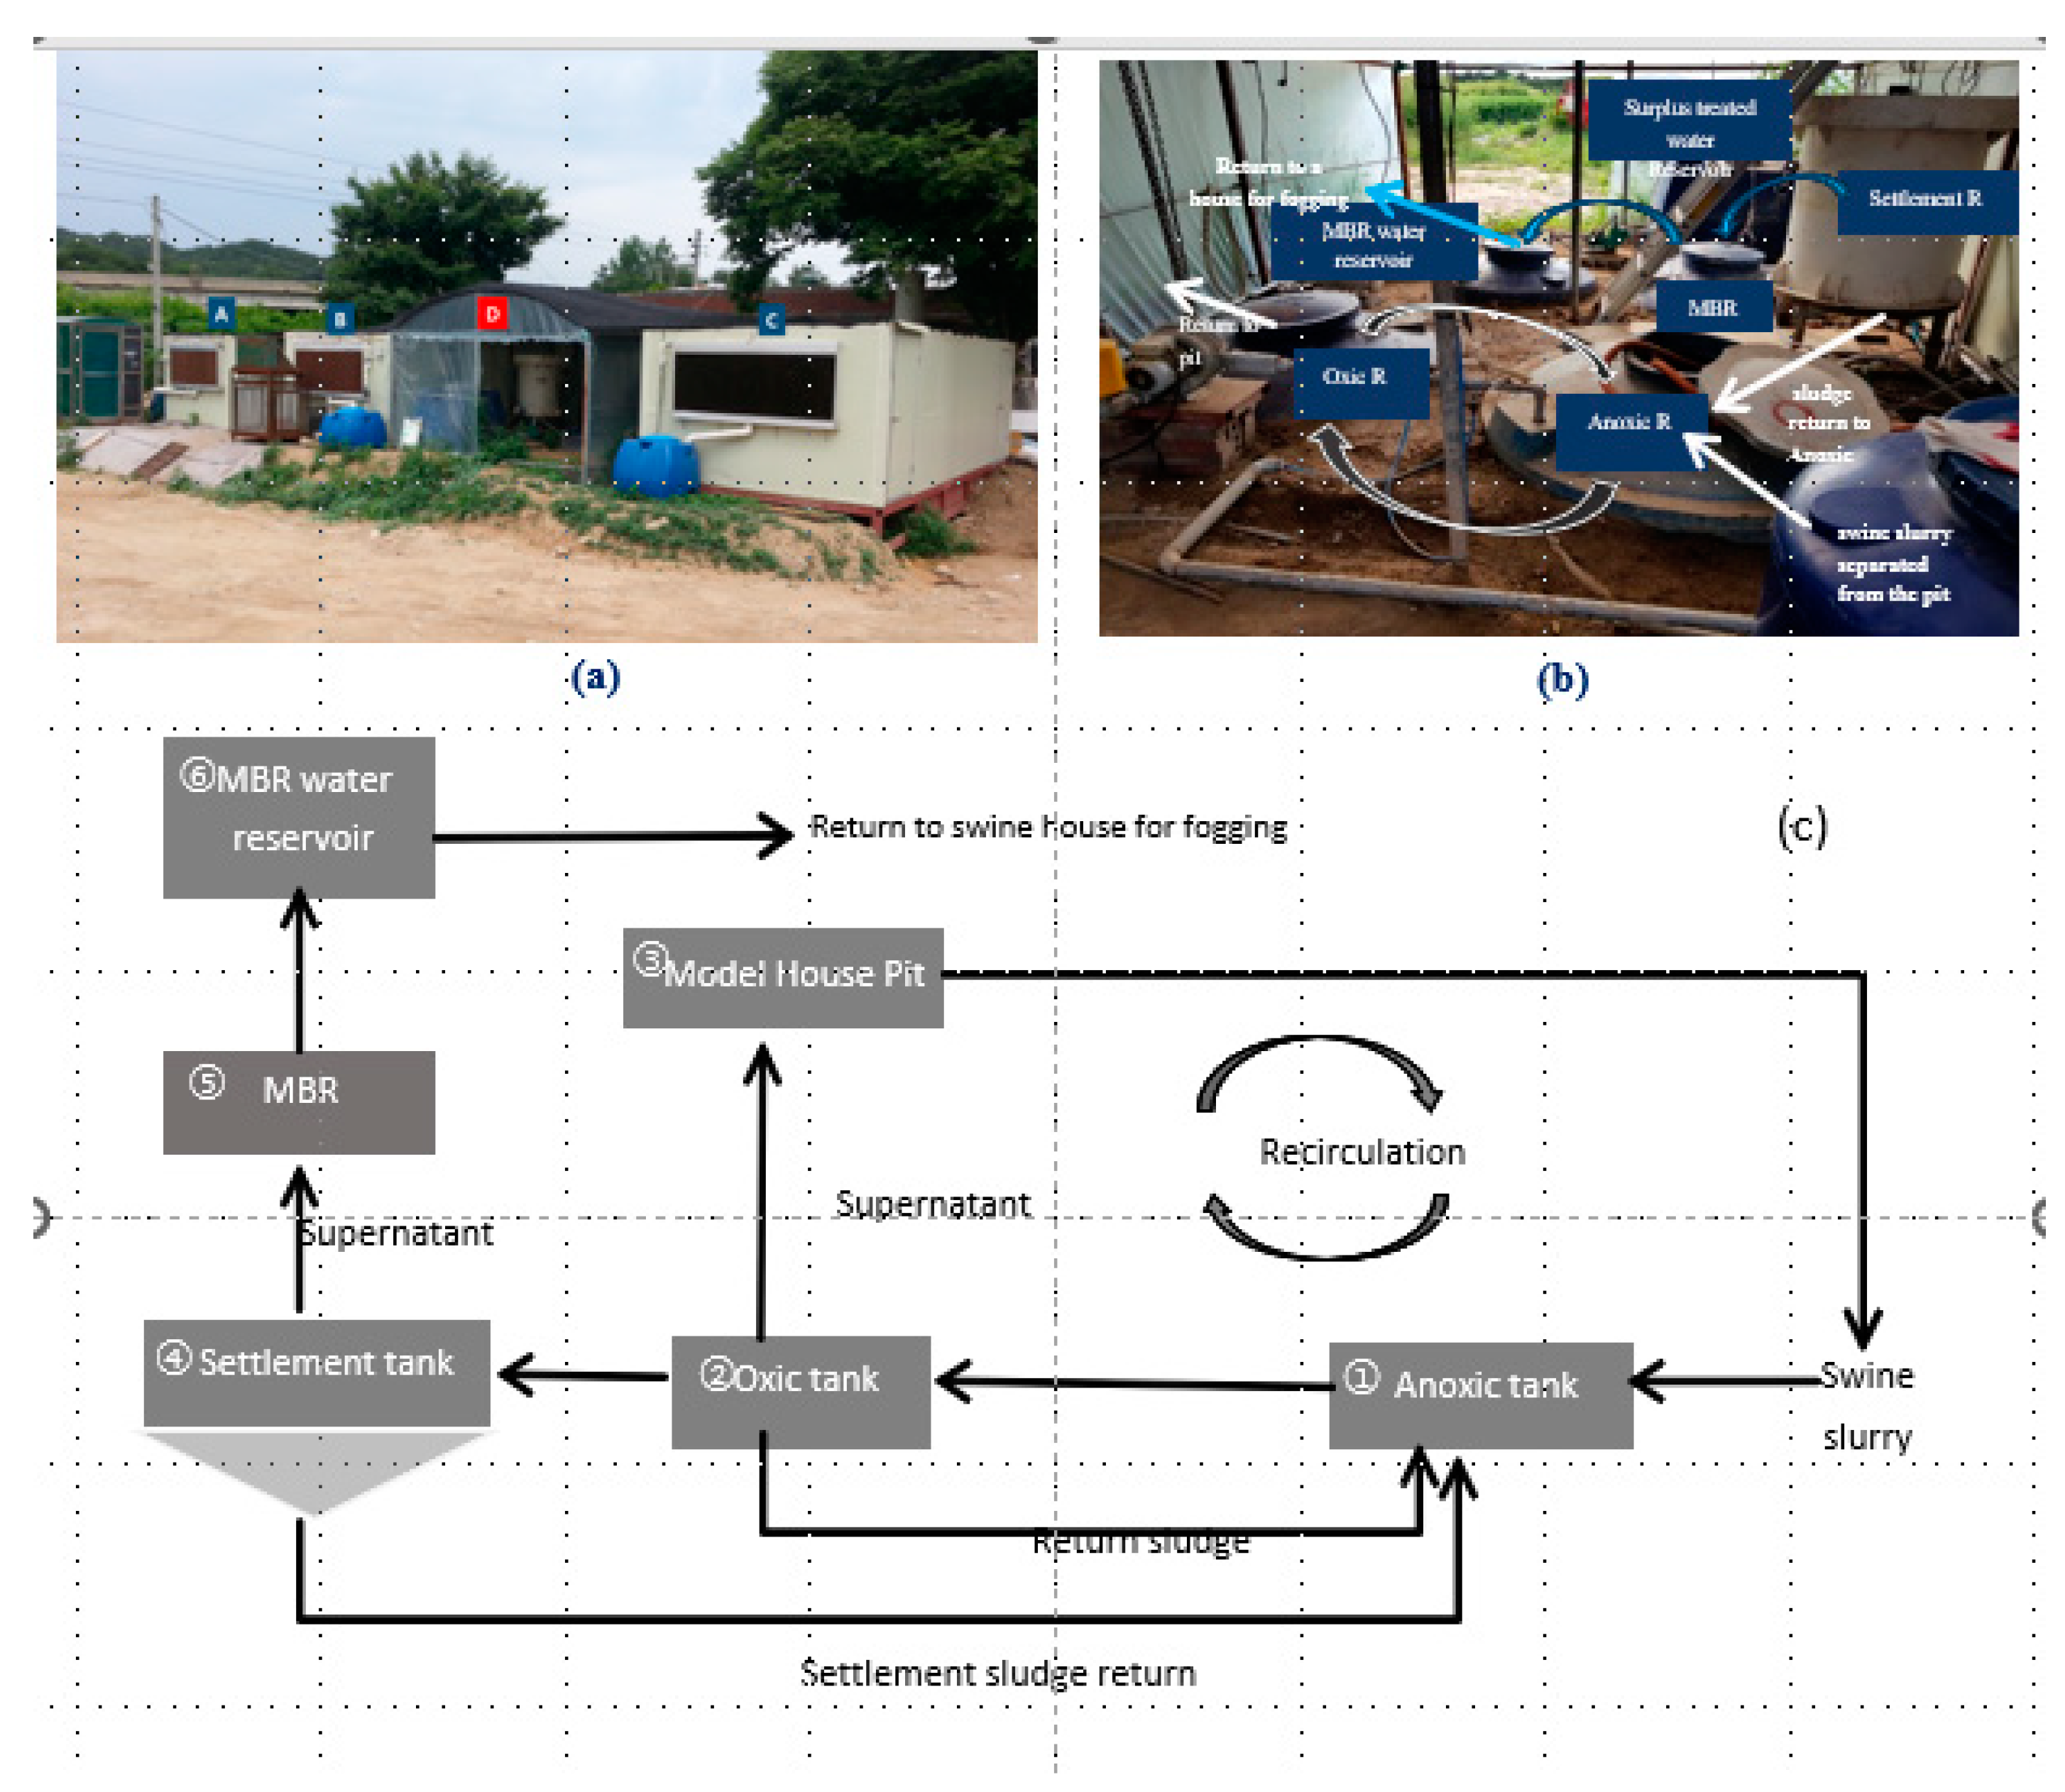
Figure 3.
Average daily ammonia (NH3) concentration of interior aerial environment of M1 (with recirculation flow-vertical biofilter), M2 (with plug flow-horizontal biofilter), and M3 (with hybrid biochar/FGD layer) pilot swine houses.
Figure 3.
Average daily ammonia (NH3) concentration of interior aerial environment of M1 (with recirculation flow-vertical biofilter), M2 (with plug flow-horizontal biofilter), and M3 (with hybrid biochar/FGD layer) pilot swine houses.
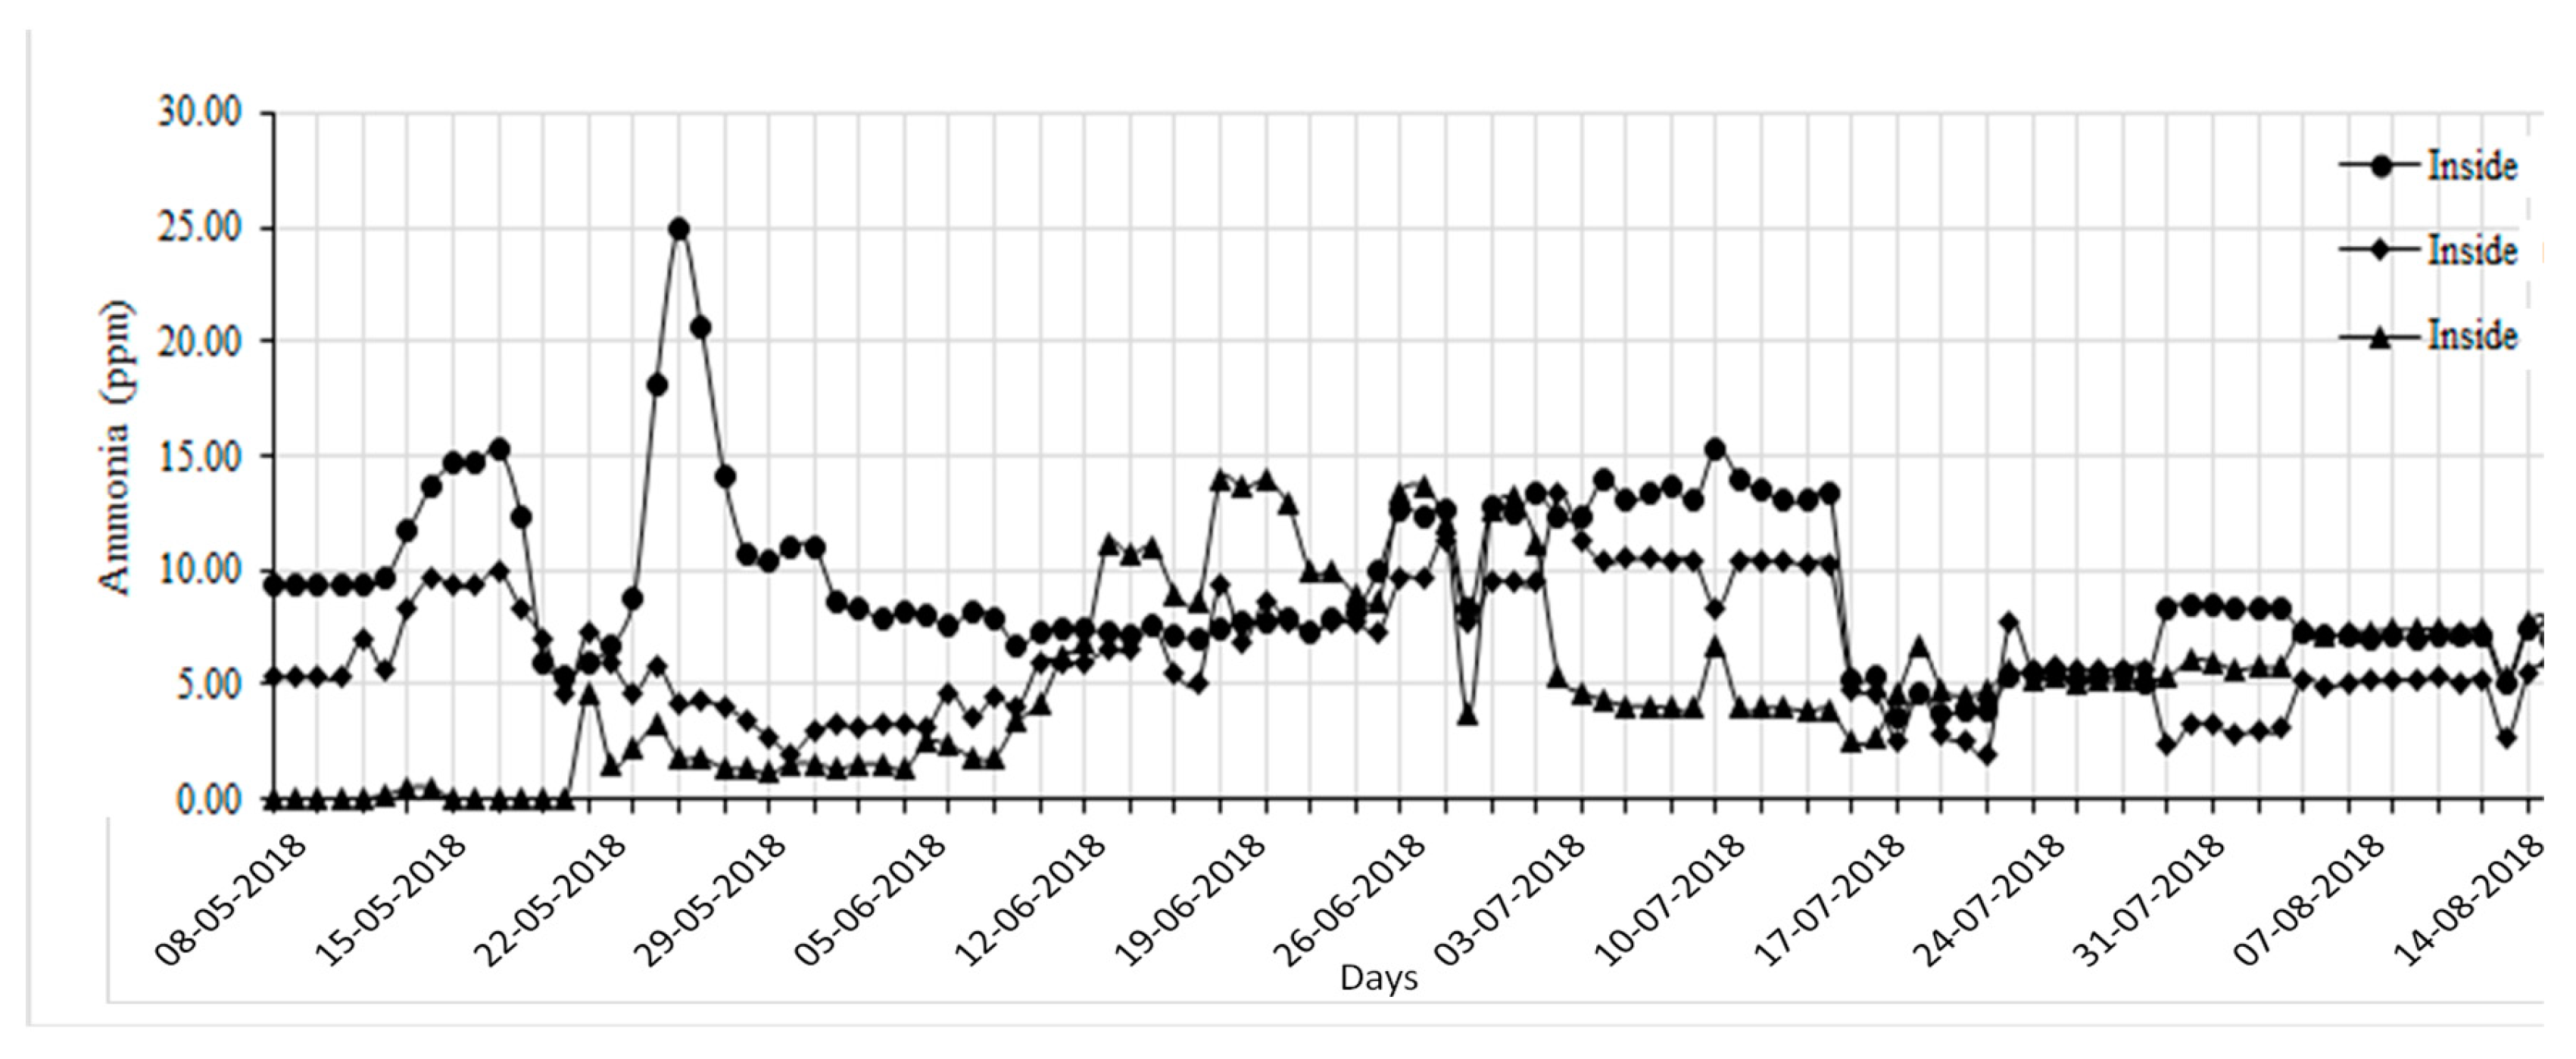
Figure 4.
Average daily hydrogen sulfide (H2S) concentration of interior aerial environment of M1 (with recirculation flow-vertical biofilter), M2 (with plug flow-horizontal biofilter), and M3 ( with hybrid biochar/FGD layer) pilot swine houses.
Figure 4.
Average daily hydrogen sulfide (H2S) concentration of interior aerial environment of M1 (with recirculation flow-vertical biofilter), M2 (with plug flow-horizontal biofilter), and M3 ( with hybrid biochar/FGD layer) pilot swine houses.
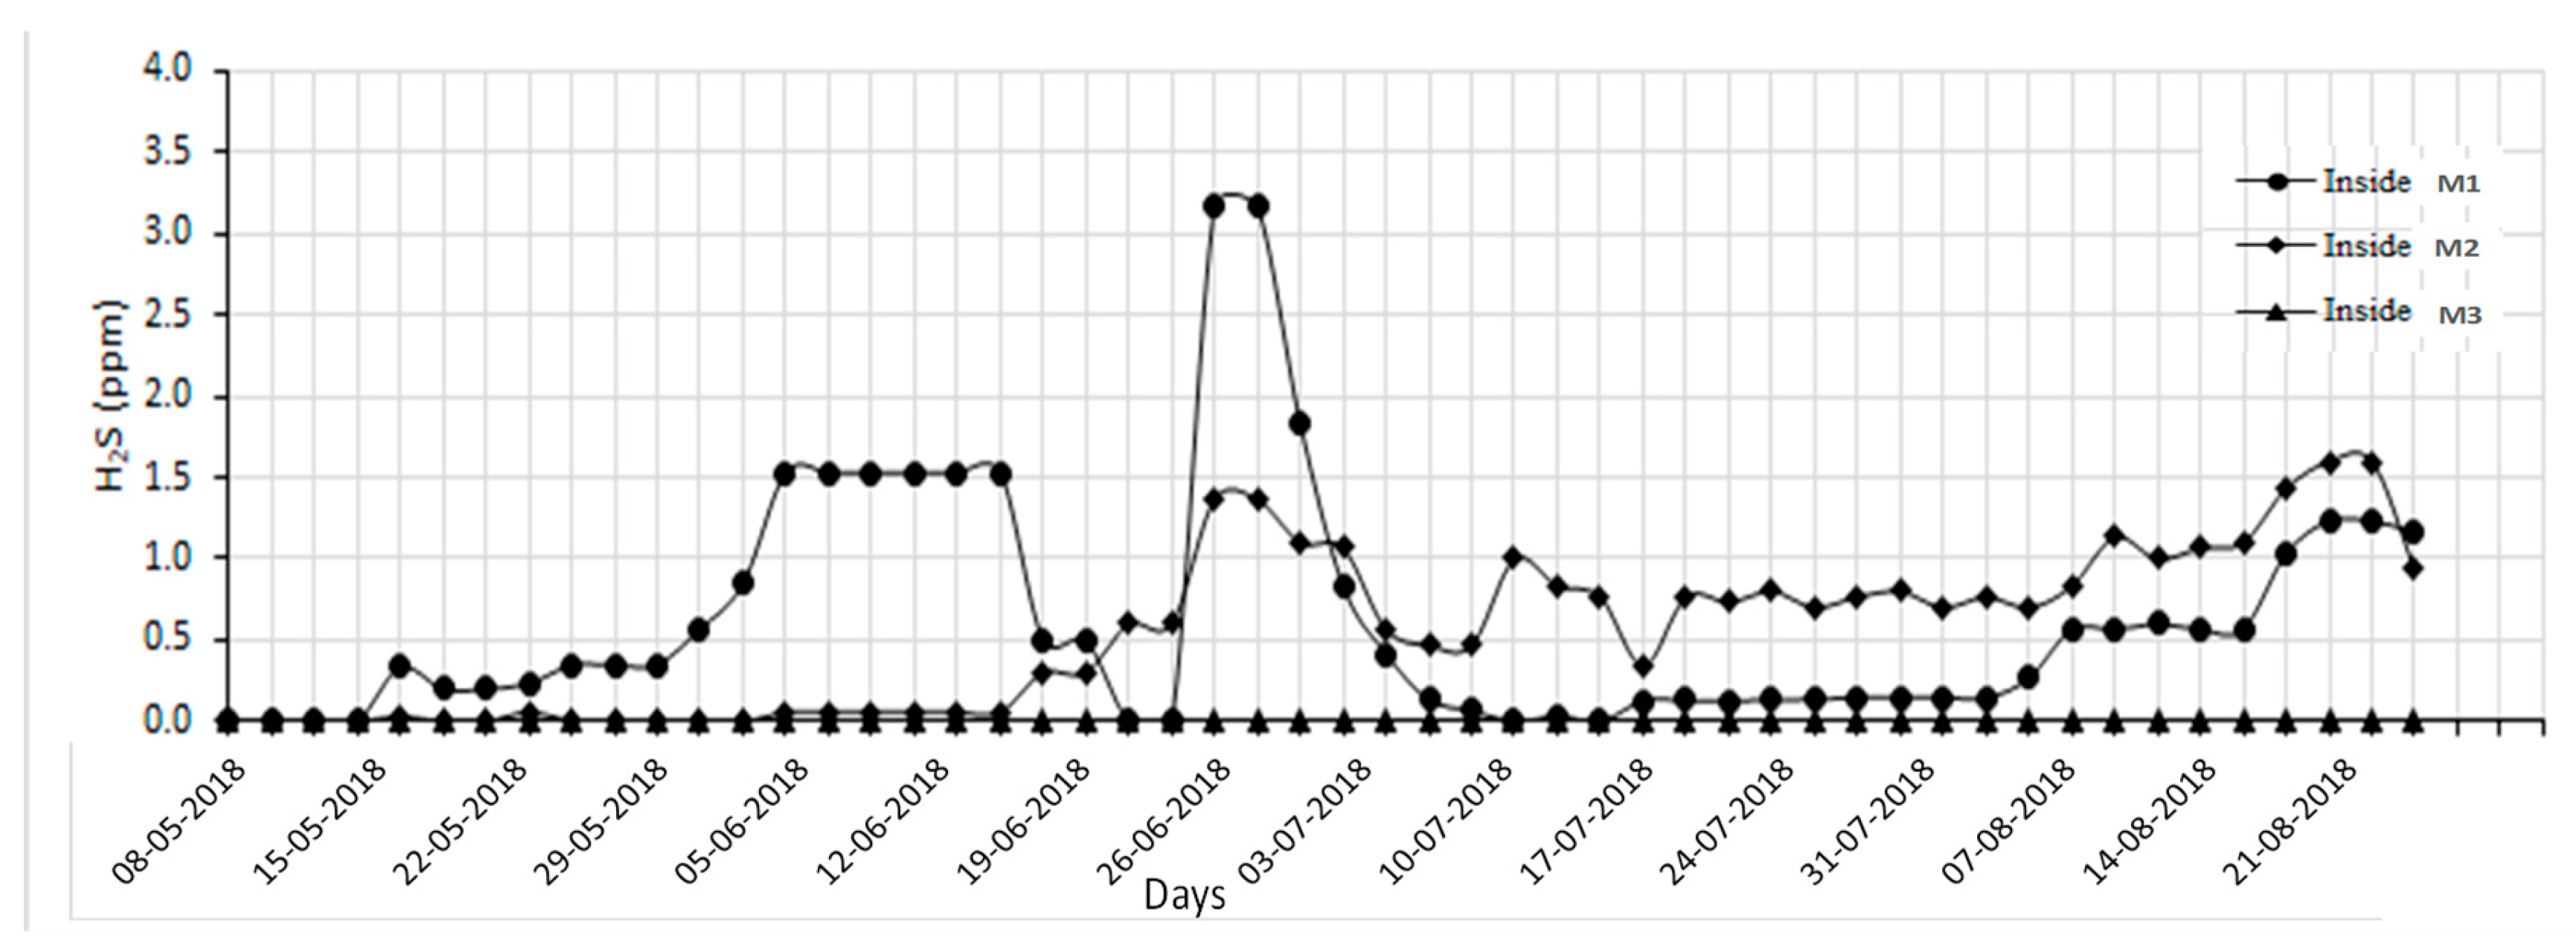
Figure 5.
Volatile organic acids and odorous compounds: (a) total VOA, (b) VFA, (c) total phenolic compounds, and (d) total sulfuric compounds in the interior of the pilot swine houses M1 (recirculation flow-vertical biofilter), M2 (plug flow-horizontal biofilter), and M3 (hybrid biochar/FGD layer).
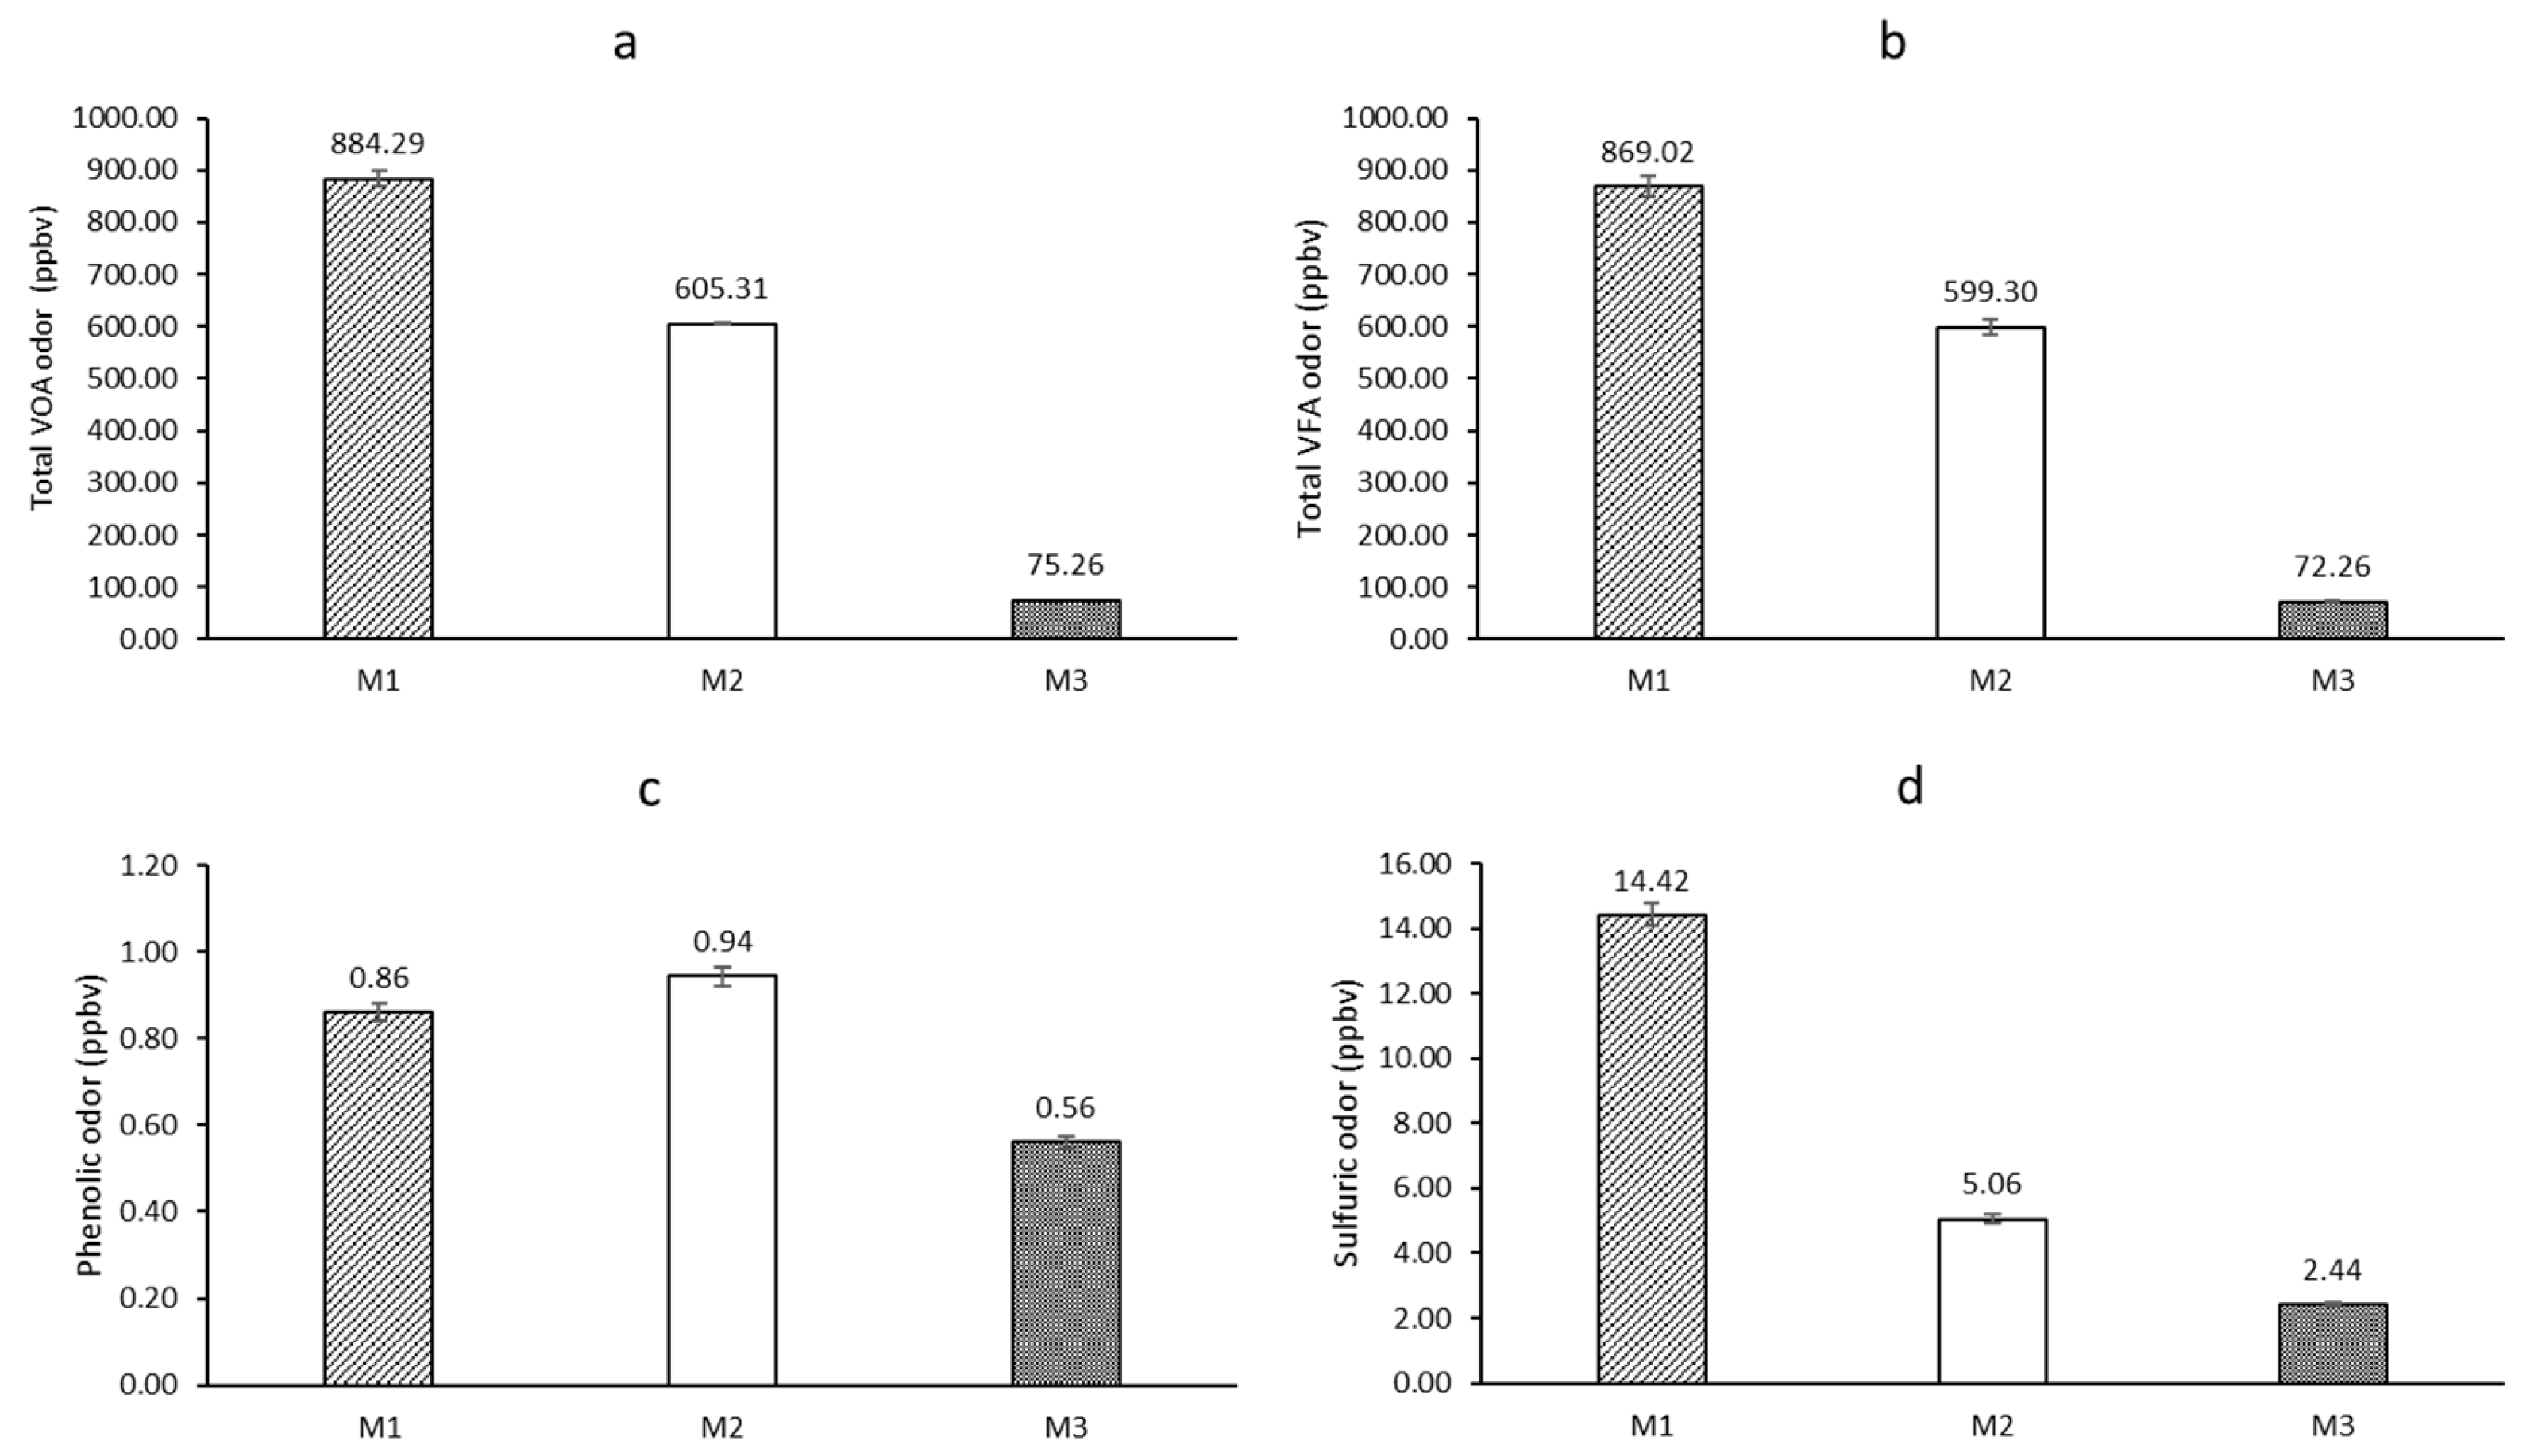
Figure 6.
Particulate matter concentrations inside the pilot swine houses M1 (recirculation flow-vertical biofilter), M2 (plug flow-horizontal biofilter), and M3 (hybrid biochar/FGD layer).
Figure 6.
Particulate matter concentrations inside the pilot swine houses M1 (recirculation flow-vertical biofilter), M2 (plug flow-horizontal biofilter), and M3 (hybrid biochar/FGD layer).
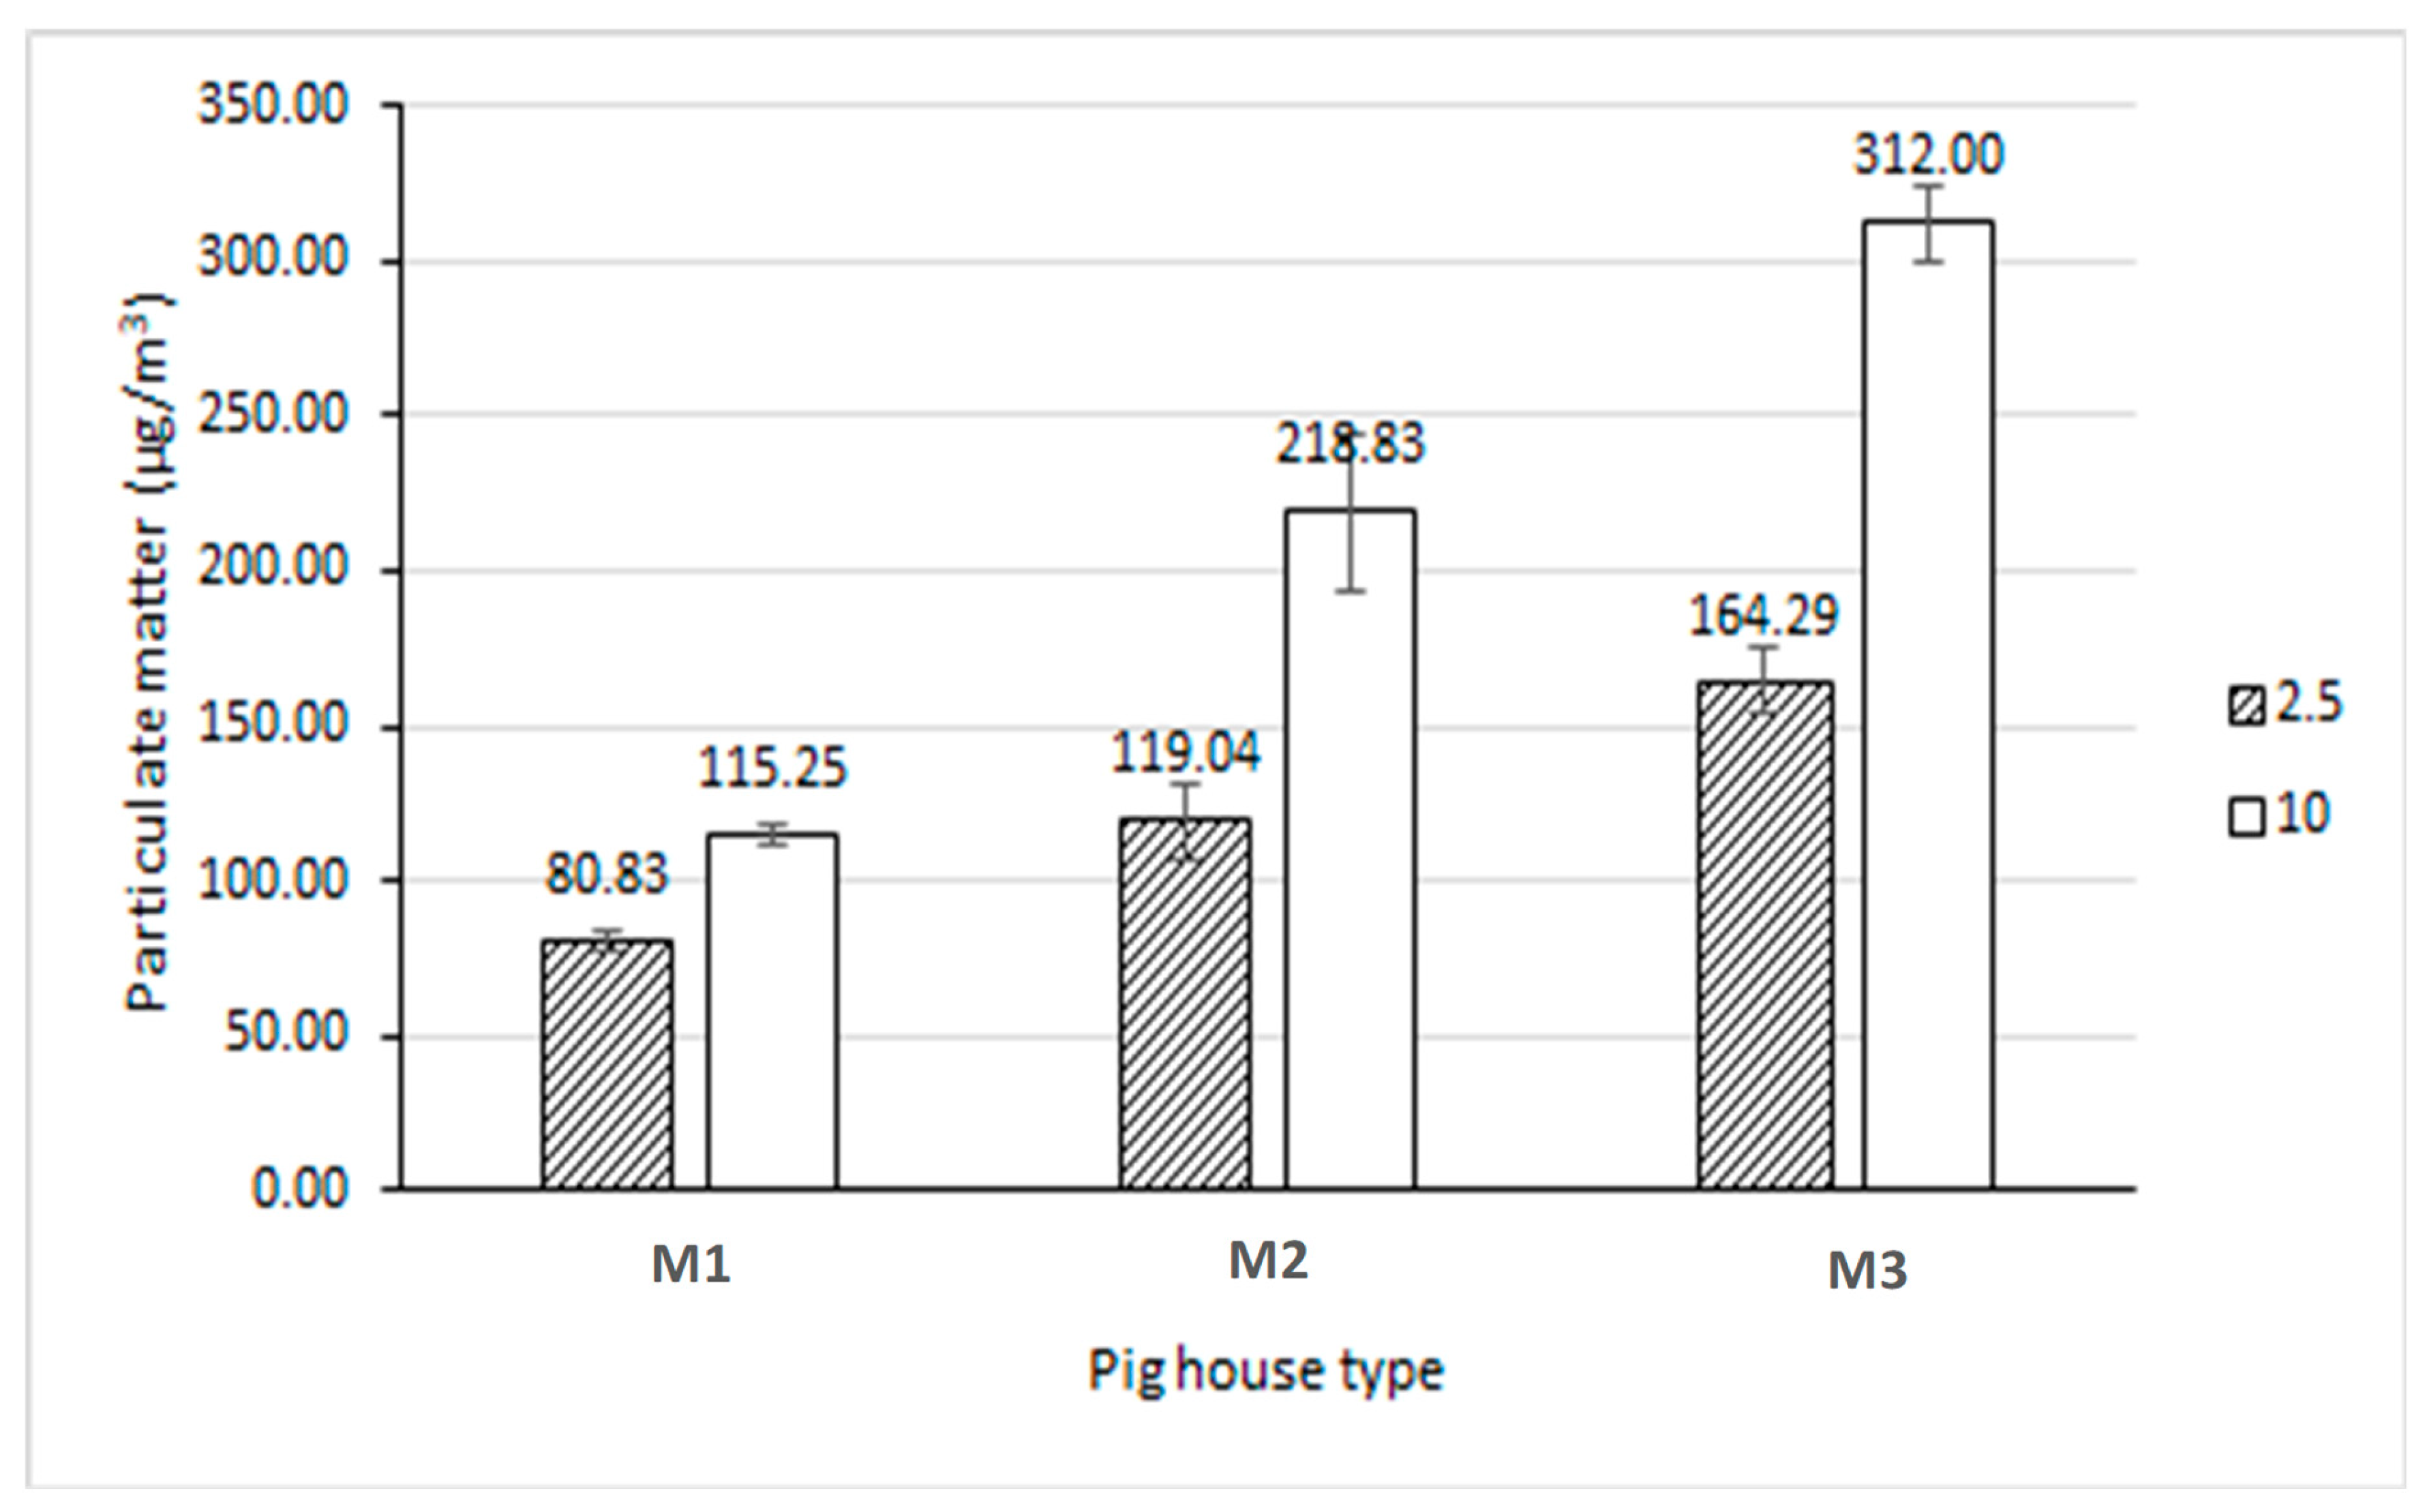
Figure 7.
Particulate matter concentrations inside the pilot swine houses M1 (recirculation flow-vertical biofilter), M2 (plug flow-horizontal biofilter), and M3 (hybrid biochar/FGD layer).
Figure 7.
Particulate matter concentrations inside the pilot swine houses M1 (recirculation flow-vertical biofilter), M2 (plug flow-horizontal biofilter), and M3 (hybrid biochar/FGD layer).
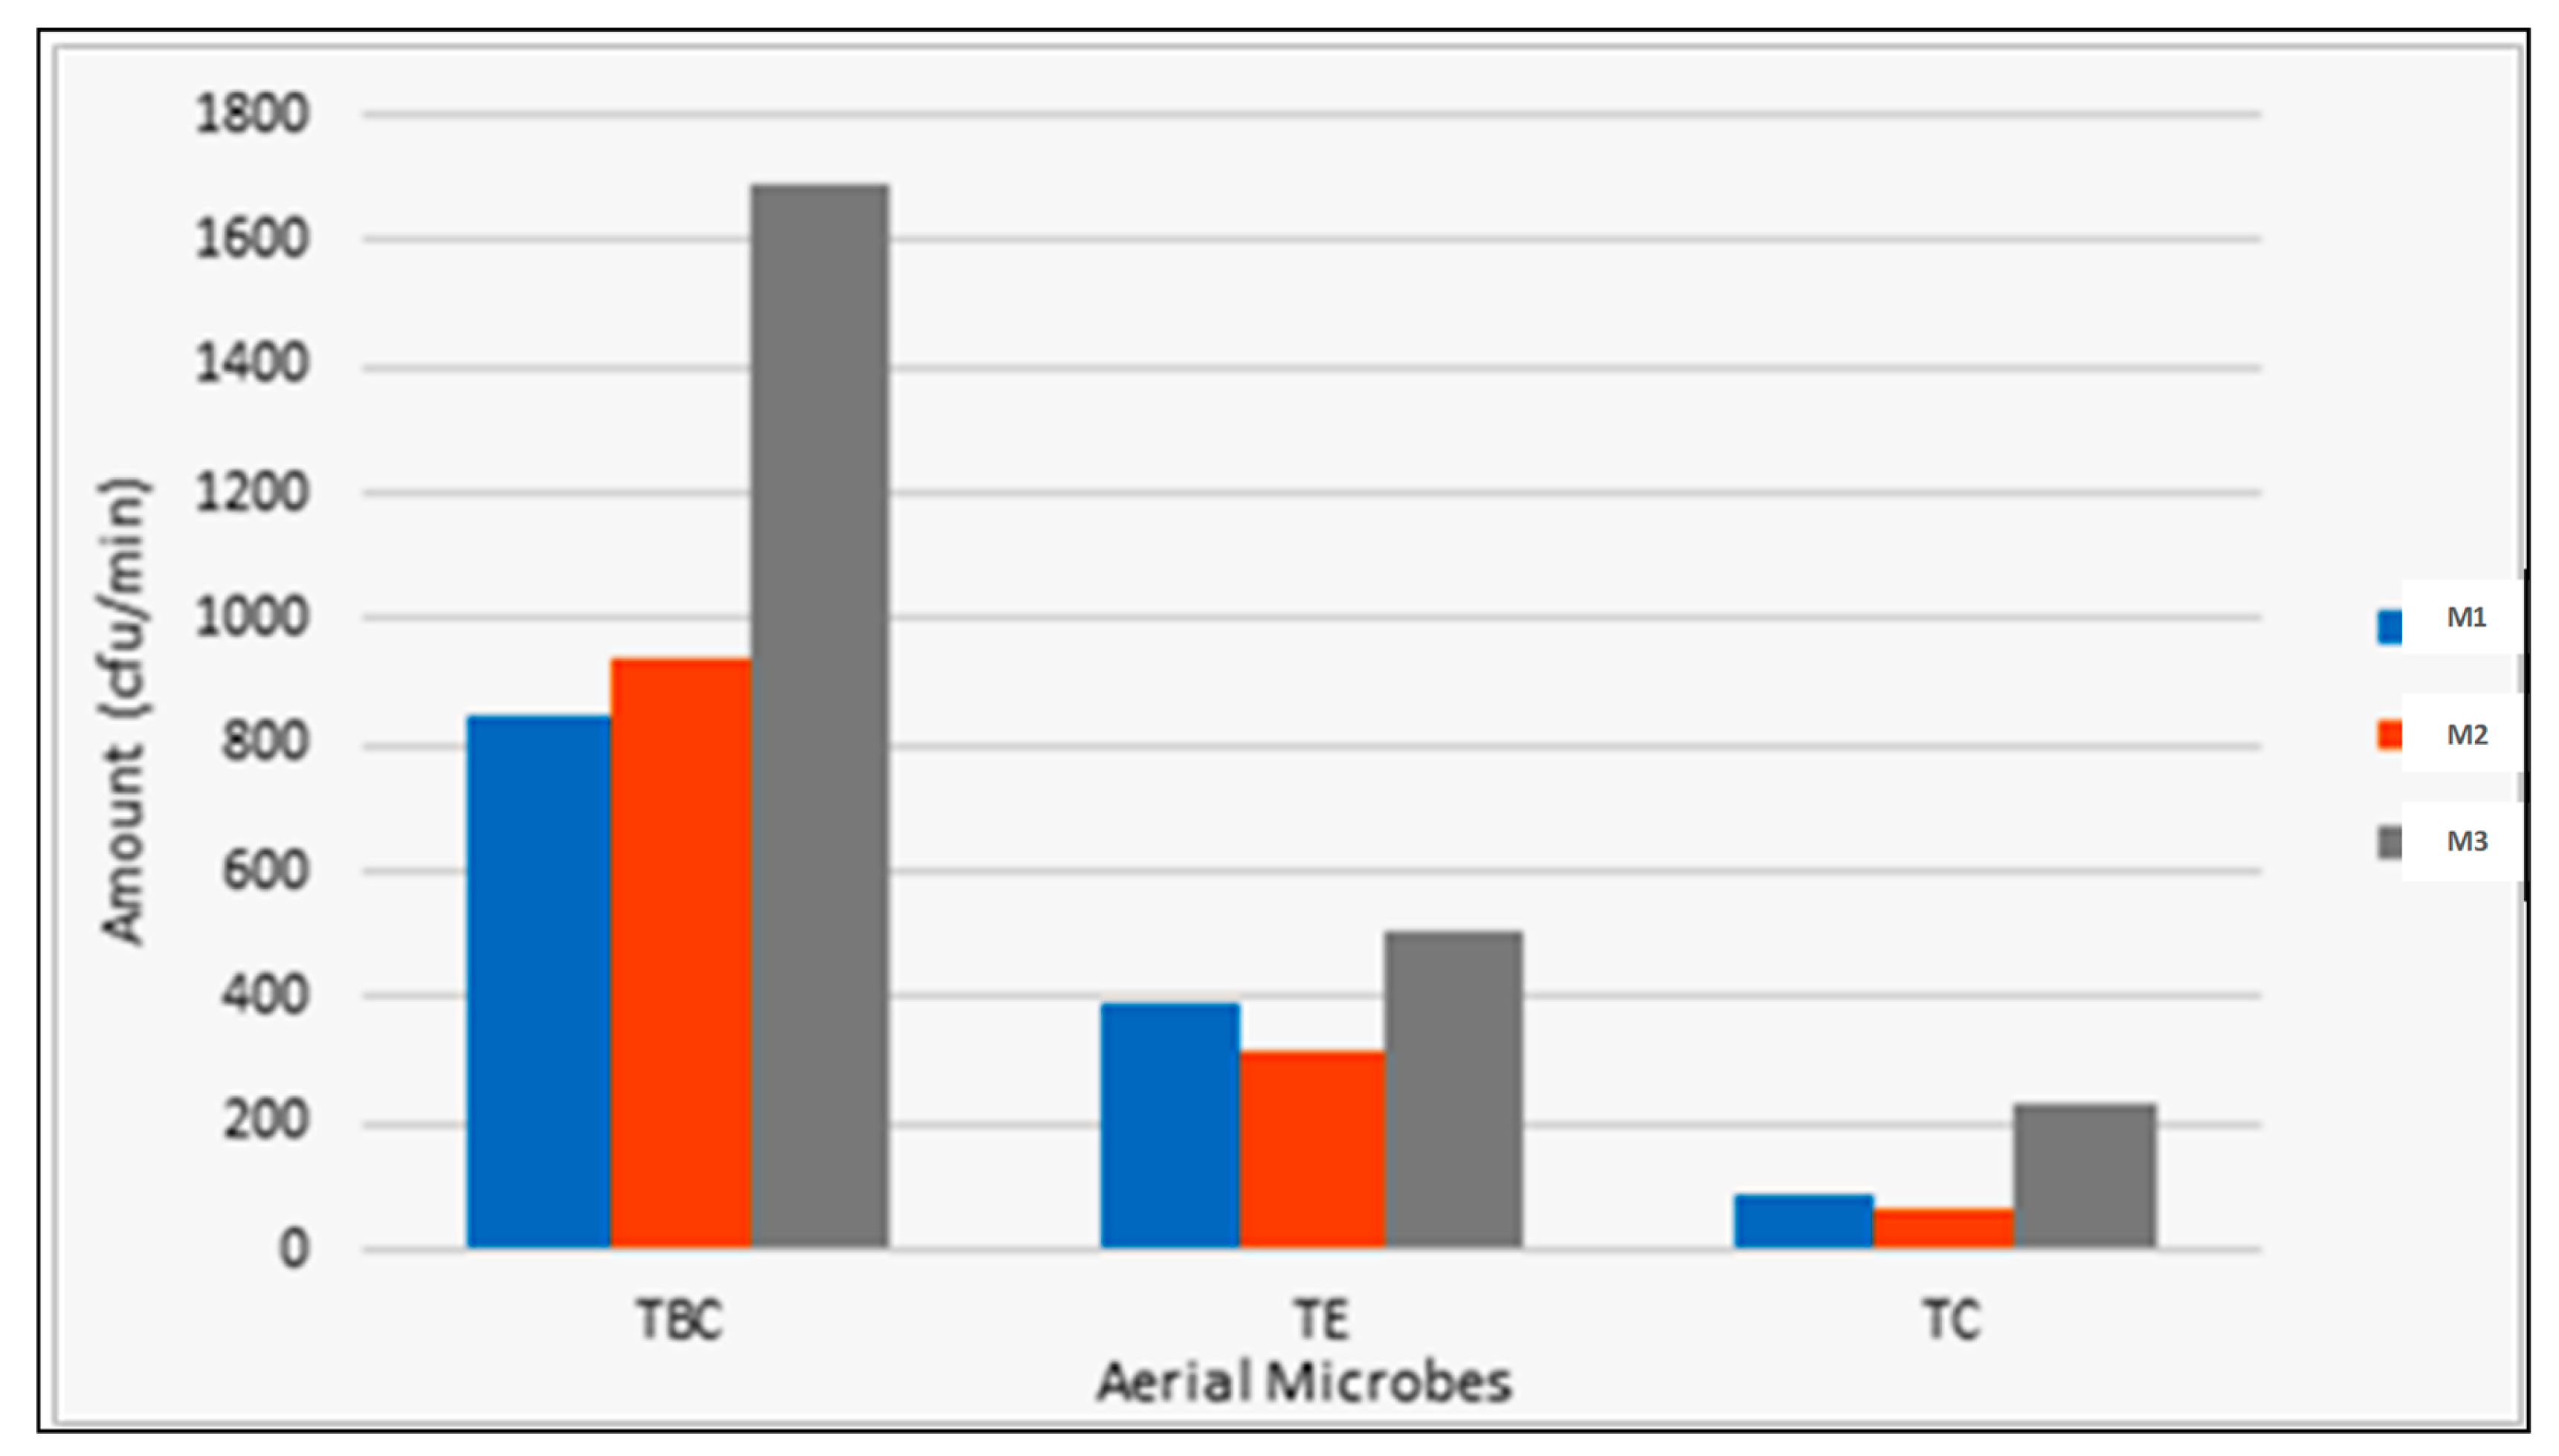

Table 1.
Characteristics of a model swine houses of M1, M2, and M3 used in the study.
| Characteristics of the Model | Model M1 | Model M2 | Model M3 | Specification |
|---|---|---|---|---|
| Construction material (roof walls) | 100 mm polyurethane panel 0.8 mm compressed with 0.8 mm metal sheet on both sides | Same as M1 | Same as M1 | Resistance (R) 3.85–4.33 K/W@0.1 m panel |
| Pit | Rectangular | Same as M1 | No pit | 3 m (W) × 4 m (L) × 0.4 m (D) |
| Floor (bedding system) | Fully slatted plastic bed | The same as M1 | Sawdust bed in a depth of 0.4 m | |
| Ventilation mode | Recirculation flow by exhaust fan on the end wall in the middle | Plug flow by exhaust fan on the outlet of pipe in the pit | Recirculation flow by exhaust fan on the end wall in the middle connected to biofilter tower | Exhaust fan capacity of 400 m3/h |
| Inlet | Circular inlet duct with perforated holes | The same as M1 | The same as M1 | D 200 mm with perforated holes of Φ10 mm |
| Biofilter composition | Corrugated thin plastic sheet pack | Two cellular pad sheets | Hybrid with Biochar/FGD gypsum layer | M1: 1.000 mm thickness, M2: 400 mm cellulose pad, M3: alternately biochar layer and FGD layer with depth of 100 mm |
| Biofilter orientation | Horizontal | Vertical | Horizontal |
Table 2.
Volatile Organic Acids, and Odorous Compounds in the Interior Pilot Pig Houses M1 (Recirculation Flow-Vertical Biofilter), M2 (Plug Flow horizontal Biofilter), and M3 (Hybrid Biochar/FGD Layer)a.
Table 2.
Volatile Organic Acids, and Odorous Compounds in the Interior Pilot Pig Houses M1 (Recirculation Flow-Vertical Biofilter), M2 (Plug Flow horizontal Biofilter), and M3 (Hybrid Biochar/FGD Layer)a.
| VOA Odor | Type of Pilot House | ||
|---|---|---|---|
| M1 | M2 | M3 | |
| Acetic acid | 87.32 | 73.16 | 32.61 |
| Propionic acid | 29.12 | 20.05 | ND |
| Isobutyric acid | 2.12 | 1.95 | 17.43 |
| Butyric acid | 15.44 | 10.17 | 0.01 |
| Isovaleric acid | 5.66 | 4.20 | 0.17 |
| Valeric acid | 729.36 | 489.78 | 31.64 |
| P-cresol | ND | 0.50 | ND |
| Indole | 0.86 | 0.44 | 0.56 |
| Skatole | ND | ND | ND |
| Dimethyl sulfide | 13.28 | 3.17 | 2.44 |
| Dimethyl disulfide | 1.14 | 1.89 | ND |
| Total VFA | 869.02 | 599.30 | 81.86 |
| Total Phenol | 0.86 | 0.94 | 0.56 |
| Total Sulfuric | 14.42 | 5.06 | 2.44 |
| Total VOA | 884.29 | 605.31 | 84.86 |
| aValues are expressed as mean ± standard deviation. Data with different letters in the same row are significantly different (p-value < 0.05).ND; not detected | |||
Disclaimer/Publisher’s Note: The statements, opinions and data contained in all publications are solely those of the individual author(s) and contributor(s) and not of MDPI and/or the editor(s). MDPI and/or the editor(s) disclaim responsibility for any injury to people or property resulting from any ideas, methods, instructions or products referred to in the content. |
© 2025 by the authors. Licensee MDPI, Basel, Switzerland. This article is an open access article distributed under the terms and conditions of the Creative Commons Attribution (CC BY) license (http://creativecommons.org/licenses/by/4.0/).
Copyright: This open access article is published under a Creative Commons CC BY 4.0 license, which permit the free download, distribution, and reuse, provided that the author and preprint are cited in any reuse.


