
Submitted:
01 January 2025
Posted:
02 January 2025
You are already at the latest version
Abstract
Background/Objectives: Dartmoor Estate Tea plantation in Devon, UK, is renowned for its unique microclimate and varied soil conditions, which contribute to the distinctive flavours and chemical profiles of tea. The chemical diversity of fresh leaf samples from different were assessed via samples collected from various garden locations within the plantation. Methods: Fresh leaf, which differed by location, cultivar, time of day, and variety, were analysed using Flow Infusion Electrospray Ionisation Mass Spectrometry (FIE-MS). Results: Random forest classification revealed no significant differences between Georgian N2 cultivar garden locations. However, a significant degree of variability was observed within four tri-clonal variants (Tocklai Variety) with TV9 exhibiting greater similarity to the Georgian N2 cultivar compared to TV8 and TV11, while TV11 was found to be most like TV1. The intraclass variability in leaf composition was similar between the varieties. We explored the metabolic changes over the day in one variant (Camellia assamica Masters), yielding a model with a significant R2 value of 0.617 (p < 0.01, 3000 permutations). Starch and sucrose metabolism was found to be significant where the abundance of these chemical features increased throughout the day and then began to decrease at night.Conclusion: This research highlights the complex interplay of cultivars, geographical location, and temporal factors on the chemical composition of tea. It provides insightful data on the metabolic pathways influencing tea cultivation and production and underscores the importance of these variables in determining the final chemical profile and organoleptic characteristics of tea products.
Keywords:
Camellia sinensis
; flow infusion electrospray ionisation mass spectrometry (FIE-MS)
; metabolomics
; random forest classification
; cultivars
; geographical location
; and temporal factors
1. Introduction
Tea is made from the leaves of the plant Camellia sinensis L. and is a widely consumed UK beverage. The regular consumption of tea promotes wellness, in particular, improved ageing, and a reduction of cardiovascular diseases, cancers, hepatopathy, obesity, and diabetes mellitus [1,2]. These benefits are largely attributed to the diverse bioactive compounds present in tea, which have been the subject of extensive research.
Tea contains an array of primary and secondary metabolites, including sugars, polyphenols, amino acids, alkaloids and volatile organic compounds which contribute significantly to its health-promoting properties [1,2]. These metabolites, however, are influenced by several factors, such as plucking season, shading conditions, growth altitude, soil composition, climate, and the variety or cultivar of the tea plant [3,4]. These variables not only affect the chemical profile of tea but also its sensory attributes, including flavour, aroma, and colour, and health-promoting attributes, underscoring the complexity of tea as a functional food.
The importance of genetic diversity, advanced analytical technologies, and targeted breeding objectives has been demonstrated in understanding and enhancing the chemical composition and quality of tea [5]. Metabolomics has emerged as a pivotal tool for evaluating the chemical composition, quality and authenticity of tea and tea-products. An advanced metabolomics approach facilitates the unbiased screening of primary and seconday chemical compounds, allowing researchers to detect subtle variations between tea samples based on their origin, processing methods, and storage conditions, alongside multiple other factors. Studies have demonstrated the effectiveness of metabolomics in distinguishing tea varieties and assessing quality markers [6,7,8]. Additionally, metabolomic approaches have been used to investigate the age-related differences of tea leaf metabolites in the fresh leaves collected from tea plants aged 8 and 25 years [9]. By combining metabolomics with traditional sensory evaluations and modern analytical techniques, a comprehensive understanding of tea’s complexity and health benefits can be achieved.
Overall, tea represents cultural heritage but also a functional beverage with significant health-promoting properties. Ongoing research into the varying bioactive compounds of tea continues to shed light on its multifaceted benefits, ensuring its enduring relevance in both dietary and therapeutic contexts.
2. Materials and Methods
2.1. Tea Plants
Six tea varieties were available at Dartmoor Estate Tea, UK in September: GRGN (Georgian N2 cultivar, 535 plants avaliable and 48 plants were randomily sampled between two gardens), TV 08, 09, 11 and 01 (Camellia Sinensis L Tocklai Tri-clonal Variants, 860 avaliable plants and 128 plants were randomily sampled between two gardens), and Sin.Ass = Camellia assamica Masters; syn C. sinensis var assamica variety (1560 avaliable plants in one garden, 64 plantswere randomily sampled ). A randomised sampling map was computer-generated before the investigation to account for batches, location (garden/plot) and time taken (Appendix 1).
Six tea varieties were as follows: Tocklai has developed numerous high-yielding and disease-resistant Camellia sinensis L tea clones and seed stock. These include improved varieties tailored for specific climatic and soil conditions, enabling better tea production.TV1 (Tocklai Variety 1) is known for its high yield potential, adaptable to diverse agro-climatic conditions and moderately resistant to common pests and diseases. TV8 (Tocklai Variety 8) offers a balanced profile of yield and cup quality, performs well in moderately acidic soils, typical of tea-growing regions in Assam and North Bengal and exhibits moderate resistance to certain pests and diseases. TV9 (Tocklai Variety 9) is a high yielding clone, tolerates waterlogged conditions better than many other clones, making it ideal for flood-prone areas and offers good resistance to certain fungal diseases.TV11 (Tocklai Variety 11) high yield and vigorous growth under diverse climatic conditions, moderate resistance to pests and diseases performs well under organic cultivation practices.
Tea originating from Georgia, a Chinese hybrid called Keymin, classified as a Georgian N2 cultivar (GRGN) which is heavy frost resistant. They were created in the 1940s as an indo-chinese hybrid by an agronomist Ksenia Bakhtadze. Lastly, Camellia assamica Masters; syn C. sinensis var assamica cultivar (Sin.Ass) from the himalayan region of India [10].
2.2. Fresh Leaf Sample Collection
For metabolome samples we took 6 laminar leaf punches using a single hole punch from three plants (biological replicates) for each experimental point. These punches avoided any major leaf veins. We placed the leaf punches into a 2mL Eppendorf tube containing a 5mm diameter steel ball bearing using tweezers and then immediately placed the Eppendorf tubes into a Dewar to snap freeze in liquid nitrogen. We cleaned the single hole punch after each use by spraying with 70% ethanol.
For temporal sampling, the same method was applied and samples were collected at 09:00, 12:00, 18:00 and 00:00, of the Sin.Ass variey, over one single day.
All leaf disc samples were frozen in liquid nitrogen immediately they were collected in the field, then transported in liquid nitrogen and then stored at -80°C.
2.3. Sample Preparation and Extraction
All procedures were carried out on ice. Mixer mill sample holders were pre-chilled at -80°C. Bligh and Dyer extraction mix (chloroform:methanol:water 2:5:2) was prepared in advance and chilled to -20°C, then stored on ice during use.
It was vitally important not to allow the samples to defrost during milling, so all sample tubes were first placed in liquid nitrogen before transferring to pre-chilled mixer mill holders. The samples were milled for 30 seconds at 30Hz then placed in liquid nitrogen once more. If necessary, the milling process was repeated until a fine powder was obtained. The ground leaf material was immediately extracted by adding 1ml of Bligh and Dyer extraction mix to each tube. The weight of milled material in each tube was not recorded, as a degree of uniformity was expected because each tube contained 6 leaf discs of uniform size. All samples were vortexed then shaken at 4°C for 20 min before centrifugation at 13,000rpm and 4°C for 5 min. The supernatants were transferred into new labelled Eppendorf tubes and stored at -80°C prior to analysis
2.4. Sample Preparation for Analysis
The tea leaf extracts were defrosted, vortexed and spun down (13,000rpm and 4°C for 5 min) before aliquoting. A preliminary trial had demonstrated that the optimum dilution for the samples was 1:10, so dilutions were prepared using Bligh and Dyer extraction mix before aliquoting 100µls into HPLC vials with 200µl inserts. For each sequence run, a quality control sample was prepared by combining 20µl aliquots from all diluted samples in the run in a separate 5ml Eppendorf tube and mixing before transferring 200µl into an HPLC vial. Bligh and Dyer extraction mix (200µl) was used as the control.
2.5. Flow Infusion Electrospray Ionisation Mass Spectrometry (FIE-MS)
FIE-MS is used to produce a comprehensive overview of the chemical content of biologically derived material as a high throughput metabolite fingerprinting tool [11]. Data obtained can be analysed using spectral binning [12] and further down-stream analysis. FIE-MS was performed using an Exploris 120 mass analyser equipped with a Dionex Vanquish UHPLC system (Thermo-Scientific). Metabolite fingerprints were generated in both positive and negative ionisation modes, in a single run.
All samples were randomised to minimise batch effects. Samples (20 µl) were injected into a flow of 100 µl min-1 methanol:water (70:30, v/v). Ion intensities were acquired between m/z 55 and 1200 for 3.5 min at a resolution setting of 120,000, resulting in 3 (± 1) ppm mass accuracy. Tuning and ESI source parameters were set according to manufacturer’s recommendations. Following data acquisition, Chromeleon.cmbx files were first exported to .raw files and then converted to the .mzML open file format and centroided [13] using msconvert (TransProteomicPipeline) [14]. Spectral binning was applied using the R package binneR [12] and then standard post acquisition processing routines were applied, including occupancy and QC filtering. Putative molecular formulas were generated by using MZedDB [15], an Aberystwyth University database for accurate mass annotation. The ionisation products of the assigned molecular formulas were first searched against the KEGG compound database specific to Camellia sinensis for putative matches. Initial data analysis including classification was performed in R package metabolyseR.
2.6. Hydrophilic Interaction Liquid Chromatography
Confirmational analysis was performed on a TSQ Quantum Ultra EMR QQQ mass spectrometer (Thermo Scientific) equipped with a heated electrospray ionisation source. Samples were delivered using an Accela UHPLC system (Thermo Scientific) consisting of autosampler, column heater, and quaternary UHPLC-pump. Chromatographic separation was performed on a ZIC-pHILIC (polymeric 5 µm, 150 × 4.6 mm) column (Merck) as described [16,17].
2.7. Data Analysis
To provide a compositional overview of the samples, consensus structural classifications were compiled for each of the m/z features that were assigned a molecular formula. To do this, the molecular formulas were first searched against the KEGG compound database. Matching compounds were filtered based on their potential to form the relevant adduct under electrospray ionisation using the MZedDB ionisation rules. Where no compound matches were identified in the KEGG compound database, the molecular formula was instead searched in the PubChem compound database using the same approach. The structural chemical classifications, based on the CHEMONT chemical taxonomy, were retrieved from the ClassyFire database for the matched compounds [18]. For each adduct of each assigned molecular formula, putative structural classifications were assigned to a depth based on a 66% or above consensus between the matched compounds.
Random Forest regression was used to identify m/z features related to processing steps. K-means clustering was performed on the percentage relative abundance of the explanatory features. Functional and structural enrichment analysis was performed on each of the clusters to potentially derive both chemical classes and biological functions related to the cluster trends. Functional enrichment was performed on each of the clusters using the PageRank approach of the FELLA R package [19,20]. Structural enrichment was performed on each of the clusters using over-representation analysis with Fisher’s exact test.
3. Results
3.1. Structural Composition of the Tea Samples
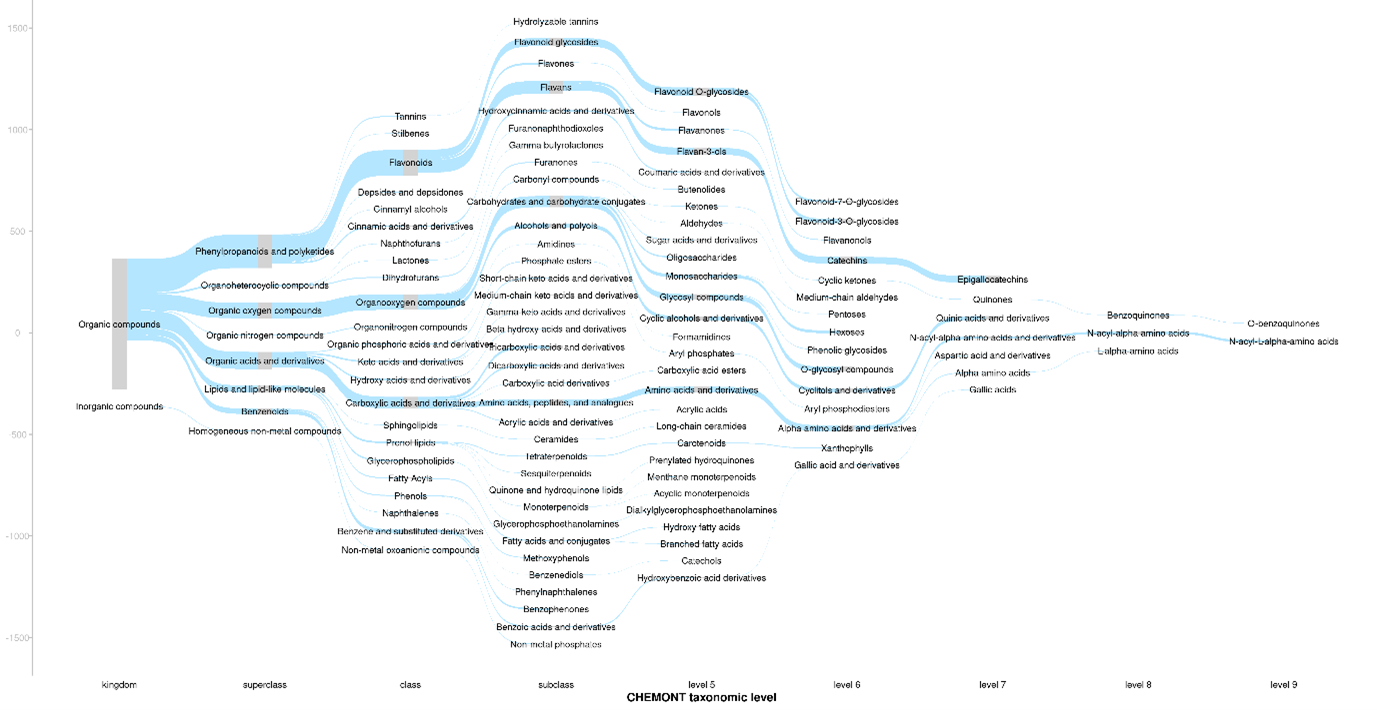
The ionisation products of the assigned molecular formulas were first searched against the KEGG compound database specific to Camellia sinensis for putative matches. Any the structural classifications for any metabolite matches were retrieved from the Classyfire database. For the ionisation products of each assigned molecular formula, a consensus structural classification was assigned based on all the possible database matches using a consensus threshold of 66%. For ionisation products that did not match to the KEGG compound database, these were then matched against the PubChem database and consensus structural classifications assigned accordingly. Figure 1 shows a sankey plot which provides an overview of the structural composition of the tea samples. There was a high frequency of m/z features putatively classified as phenylpropanoids and polyketides, organic oxygen compounds, organic acids and derivatives, lipids and lipid-like molecules and benzenoids.
3.1. Variability Within the Georgian Tea
Random Forest classification was performed to assess the difference of the Georgian tea plants between the two gardens. As shown in the multidimensional scaling plot (MDS) in Figure 2, there was no significant difference found between the plants in these gardens with a margin value of 0.00443 (p = 0.572, 3000 permutations). Very similar intraclass variability was also observed in both the gardens as shown by the intraclass distance distributions in the plot below. Gardens 3 and 4 had median distance values of 0.656 and 0.687 respectively (Figure 3).
3.2. Variability Within the Tocklai Tri-Clonal Variants
Before assessing the variability within the Tocklai tri-clonal variants, it was first important to establish the relative difference across all the varieties sampled. Pairwise comparisons of Random Forest classification were preformed between all the varieties to assess the chemical relatedness between the tea varieties. Figure 4 shows a dendrogram of hierarchical cluster analysis for the resulting Random Forest margin values. All these pairwise comparisons returned significant margin values (p < 0.05, 3000 permutations). This shows TV9 was more similar the Georgian varieties than TV8 and TV11, with TV11 showing the greatest similarity to TV1.
To quantify the intraclass variability within the Tocklai tri-clonal variants, all the sampled varieties were compared together using a single multinomial Random Forest classification model. The MDS plot is shown in Figure 5 that is based on the sample proximity values from the Random Forest model. This model gave a weak but significant margin value of 0.0183 (p < 0.001, 3000 permutations). The area of the ellipses provides an estimate of the intraclass variability of the collected samples. These ellipses are of similar size across all the varieties which suggests the observed intraclass variability in leaf composition is similar between the varieties.
3.3. Metabolic Changes over the Day in One Variant
Random Forest regression was used to identify m/z features related to sampling time point in C. sinensis var. assamica. This yielded a very strong model with a significant R2 value of 0.617 (p < 0.01, 3000 permutations). There were 174 m/z features that were found to be explanatory (% increase in mean squared error, p < 0.05, 3000 permutations). k-means clustering was performed on the log2 abundance ratios of the explanatory features taken relative to the first time point (9am). This grouped the explanatory features into five clusters of features showing similar trends across the sampling time points. An overview of the clusters are shown in Figure 6.
Functional and structural enrichment analysis was performed on each of the clusters to potentially derive both chemical classes and biological functions related to the cluster trends. This identified the following significant metabolic pathways (Table 1). Structural enrichment was performed with over-representation analysis using Fisher’s exact test (Table 2). Both the structural subclass Carbohydrates and carbohydrate conjugates and the metabolic pathway Starch and sucrose metabolism were found to be significant for cluster 1 where the abundance of these features increase throughout the day and then began to decrease at night. Cluster 1 included sucrose, the trend for which is shown in Figure 7. Sucrose was confirmed with standards using HILIC.
4. Discussion and Conclusion
Studies have demonstrated the effectiveness of metabolomics in distinguishing tea varieties and assessing quality markers [6,7,8]. Our study adds to this research and provides a detailed exploration of the chemical diversity and variability in tea samples from the Dartmoor Estate plantation in Devon, UK, highlighting the influence of cultivar, geographical location, and temporal factors. The findings demonstrate that while no significant differences were observed between Georgian garden locations, substantial chemical variability exists within tri-clonal Tocklai tea variants. Specifically, TV9 showed a greater similarity to Georgian cultivars than TV8 and TV11, with TV11 most closely related to TV01. These results underscore the role of genetic variation in influencing tea’s chemical composition and the potential for tailoring cultivation strategies to optimise specific traits.
Temporal analyses of Camellia sinensis var. assamica revealed dynamic metabolic changes over the course of the day, particularly in starch and sucrose metabolism. The abundance of related metabolites increased during daylight hours before declining at night, demonstrating the importance of diurnal rhythms in influencing tea leaf composition. This highlights the potential for targeted harvesting schedules to maximise desired chemical profiles. In another study, High Performance Liquid Chromatography, showed sucrose concentrations in the third and fourth tea leaves were significantly higher (P ≤0.05) than that of the bud, first, and second leaves. However, there was no significant effect of time of plucking sucrose, concentrations in fresh leaves, unlike our results [21]. On the otherhand, has been demonstrated the significant impact of seasonal changes on tea metabolite profiles, highlighting the intricate relationship between gene expression and metabolite biosynthesis [22].
The application of metabolomics, FIE-MS, uncovered subtle compositional differences and identities key metabolic pathways. By integrating metabolomics with functional and structural enrichment analyses, this research advances our understanding of the complex interplay of environmental, genetic, and temporal factors in tea cultivation.
The review by [23] highlights the role of metabolomics in tea cultivation and processing, emphasising its ability to provide comprehensive chemical profiles that inform breeding strategies, cultivation practices, and processing methods. Our insights contribute to this broader knowledge of tea science, emphasising the importance of precision in agricultural and processing practices. They also offer valuable guidance for optimising tea production, enhancing its sensory qualities and bioactive potential, and preserving its cultural and economic significance in the global tea industry. Additionally, we have recently published insightful data on the metabolic pathways influencing tea processing and underscores the importance of these variables in determining the final chemical profile and organoleptic characteristics of tea products [24]. Future studies should aim to further investigate the relationship between chemical composition and sensory attributes, as well as the role of microbial and environmental interactions in influencing tea quality.
Supplementary Materials
The following supporting information can be downloaded at the website of this paper posted on Preprints.org, Appendix 1.
Author Contributions
The study protocol was designed by AJL and AWW. Sample collection and data collection was carried out by AJL and AWW. PMM, LL, MB and AW provided metabolomic analysis. TW and JF provided statistical analysis. AJL wrote the first draft of the manuscript. The manuscript was critically reviewed by JD and MB. All authors read and approved the final version of the manuscript
Funding
Funded by Welsh Government Covid Recovery Challenge Funding, alongside Innovate UK Better Food for all (10068218), and an internal Joy Welch Educational Charitable Trust
Institutional Review Board Statement
This article does not contain any studies with human and/or animal participants performed by any of the authors.
Data Availability Statement
The metabolomics and metadata reported in this paper are available on request
Acknowledgments
We would like to thank Tetrim Teas (Mari Arthur and Steffan Mcallister) for their huge amount of support and sampling efforts.
Conflicts of Interest
The authors declare no conflicts of interest.
Abbreviations
The following abbreviations are used in this manuscript
GRGN (Georgian N2 cultivar,), TV 08, 09, 11 and 01 (Camellia Sinensis L Tocklai Tri-clonal Variant), Sin.Ass = Camellia assamica Masters; syn C. sinensis var assamica variety), (FIE-MS) Flow Infusion Electrospray Ionisation Mass Spectrometry, (HILIC) Hydrophilic interaction liquid chromatography
References
- Samanta, S. (2020). Potential Bioactive Components and Health Promotional Benefits of Tea (Camellia sinensis). Journal of the American Nutrition Association, 41(1), 65–93. [CrossRef]
- Cabrera, C., Artacho, R., & Giménez, R. (2006). Beneficial effects of green tea—a review. Journal of the American College of Nutrition, 25(2), 79-99. [CrossRef]
- Farag, M. A., Elmetwally, F., Elghanam, R., Kamal, N., Hellal, K., Hamezah, H. S., Zhao, C. & Mediani, A. (2023). Metabolomics in tea products; a compile of applications for enhancing agricultural traits and quality control analysis of Camellia sinensis. Food Chemistry, 404, 134628. [CrossRef]
- Ahmed S, Griffin TS, Kraner D, Schaffner MK, Sharma D, Hazel M, Leitch AR, Orians CM, Han W, Stepp JR, Robbat A, Matyas C, Long C, Xue D, Houser RF, & Cash SB. (2019) Environmental Factors Variably Impact Tea Secondary Metabolites in the Context of Climate Change. Front Plant Sci. 10:939. [CrossRef]
- Li, H., Song, K., Zhang, X., Wang, D., Dong, S., Liu, Y., & Yang, L. (2023). Application of Multi-Perspectives in Tea Breeding and the Main Directions. International Journal of Molecular Sciences, 24(16), 12643. [CrossRef]
- Li, J., Wang, Y. & Suh, J. H. (2022). Multi-omics approach in tea polyphenol research regarding tea plant growth, development and tea processing: current technologies and perspectives. Food Science and Human Wellness, 11, 524-536. [CrossRef]
- Lee JE, Lee BJ, Chung JO, Kim HN, Kim EH, Jung S, Lee H, Lee SJ, & Hong YS. (2015) Metabolomic unveiling of a diverse range of green tea (Camellia sinensis) metabolites dependent on geography. Food Chem. 1;174:452-9. [CrossRef]
- Fang, X., Xue, R., Xiao, J., Pu, Q., Wang, Y., Yuan, Y., Liu, B., Sui, M., Jiang, G., Niaz, R., Sun, Y., Yu, Z. & Huang, Y. (2024). Effects of different fermentation modes on tea leaves: Revealing the metabolites modification by quasi-targeted metabolomics. Food Bioscience, 62, 105223. [CrossRef]
- Rubel Mozumder, N. H. M., Lee, Y.-R., Hwang, K. H., Lee, M.-S., Kim, E.-H. & Hong, Y.-S. 2020. Characterization of tea leaf metabolites dependent on tea (Camellia sinensis) plant age through 1H NMR-based metabolomics. Applied Biological Chemistry, 63, 10. [CrossRef]
- Rawal, H. C., Borchetia, S., Rohilla, M., Mazumder, A., Gogoi, M., Patel, P. K., Ilango, R. V. J., Das, B., Mazumder, A. B., bandyopadhyay, T., Kumar, P. M., Soundararajan, S., Bera, B., MahadanI, P., Saha, G., Mukherjee, S., Sabhapondit, S., Barooah, A. K., Sharma, T. R., Singh, N. K. & Mondal, T. K. (2024). First chromosome-scale genome of Indian tea (Camellia assamica Masters; syn C. sinensis var assamica) cultivar TV 1 reveals its evolution and domestication of caffeine synthesis. Industrial Crops and Products, 222, 119992. [CrossRef]
- Beckmann, M., Parker, D., Enot, D. P., Duval, E. & Draper, J. (2008). High-throughput, nontargeted metabolite fingerprinting using nominal mass flow injection electrospray mass spectrometry. Nature Protocols, 3, 486-504. [CrossRef]
- Finch, J. P., Wilson, T., Lyons, L., Phillips, H., Beckmann, M. & Draper, J. (2022). Spectral binning as an approach to post-acquisition processing of high resolution FIE-MS metabolome fingerprinting data. Metabolomics, 18, 64. [CrossRef]
- Martens, L., Chambers, M., Sturm, M., Kessner, D., Levander, F., ShofstahL, J., Tang, W. H., RÖMPP, A., Neumann, S., Pizarro, A. D., Montecchi-palazzi, L., Tasman, N., Coleman, M., Reisinger, F., Souda, P., Hermjakob, H., Binz, P.-A. & Deutsch, E. W. 2011. mzML—a Community Standard for Mass Spectrometry Data. Mol Cell Proteomics, 10, R110.000133. [CrossRef]
- Chambers M.C, Maclean B, Burke R, et al. (2012) A Cross-platform Toolkit for Mass Spectrometry and Proteomics. Nat. Biotechnol. 30(10): 918-920. [CrossRef]
- Draper, J., Enot, D. P., Parker, D., Beckmann, M., Snowdon, S., Lin, W. &Zubair, H. (2009). Metabolite signal identification in accurate mass metabolomics data with MZedDB, an interactive m/z annotation tool utilising predicted ionisation behaviour ’rules’. BMC Bioinformatics, 10, 227.
- Beckmann, M., Wilson, T., Lloyd, A. J., Torres, D., Goios, A., Willis, N. D., Lyons, L., Phillips, H., Mathers, J. C. & Draper, J. 2020. Challenges Associated With the Design and Deployment of Food Intake Urine Biomarker Technology for Assessment of Habitual Diet in Free-Living Individuals and Populations—A Perspective. Frontiers in Nutrition, 7. [CrossRef]
- Lloyd, A. J., Wilson, T., Willis, N. D., Lyons, L., Phillips, H., Janssen, H. G., Stiegler, M., Xie, L., Tailliart, K., Beckmann, M., Stevenson, L., MatherS, J. C. & Draper, J. 2020. Developing community-based urine sampling methods to deploy biomarker technology for the assessment of dietary exposure. Public Health Nutrition, 23, 3081-3092. [CrossRef]
- Djoumbou Feunang Y, Eisner R, Knox C, Chepelev L, Hastings J, Owen G, Fahy E, Steinbeck C, Subramanian S, Bolton E, Greiner R, &Wishart DS. (2016). ClassyFire: Automated Chemical Classification With A Comprehensive, Computable Taxonomy. Journal of Cheminformatics, 8:61.
- Picart-Armada S, Fernandez-Albert F, Vinaixa M, Yanes O, & Perera-Lluna A (2018). FELLA: an R package to enrich metabolomics data. BMC Bioinformatics, 19(1), 538. [CrossRef]
- Picart-Armada S, Fernandez-Albert F, Vinaixa M, Rodriguez MA, Aivio S, Stracker TH, Yanes O, Perera-Lluna A (2017). Null diffusion-based enrichment for metabolomics data. PLOS ONE, 12(12), e0189012. [CrossRef]
- Piyasena., KGNP, Hettiarachchi., LSK, Jayawardhane., SADPS, Edirisinghe.,ENU, Jayasinghe., WS (2022). Evaluation of inherent Fructose, Glucose and Sucrose concentrations in tea leaves (Camellia sinensis L.) and in black tea. Applied food research, 2(1):100100-100100. [CrossRef]
- Gong, A.-D., Lian, S.-B., Wu, N.-N., Zhou, Y.-J., Zhao, S.-Q., Zhang, L.-M., Cheng, L. & Yuan, H.-Y. 2020. Integrated transcriptomics and metabolomics analysis of catechins, caffeine and theanine biosynthesis in tea plant (Camellia sinensis) over the course of seasons. BMC Plant Biology, 20, 294. [CrossRef]
- Wen, M., Zhu, M., Han, Z., Ho, C.-T., Granato, D., & Zhang, L. (2023). Comprehensive applications of metabolomics on tea science and technology: Opportunities, hurdles, and perspectives. Comprehensive Reviews in Food Science and Food Safety, 22, 4890–4924. [CrossRef]
- Lloyd AJ, Finch J, Warren-Walker, A, Watson A, Lyons L, Martinez Martin P, Wilson T, Draper J, Beckmann, M. (Submitted). Chemical attributes of UK grown tea and identifying health-promoting chemistry in tea after different processing methods using metabolomics and machine learning, Metabolomics,.
Figure 1.
a Sankey plot providing an overview for the consensus structural classes of the assigned molecular formulas. Where: grey bars show the frequencies of m/z features for each structural class.
Figure 1.
a Sankey plot providing an overview for the consensus structural classes of the assigned molecular formulas. Where: grey bars show the frequencies of m/z features for each structural class.
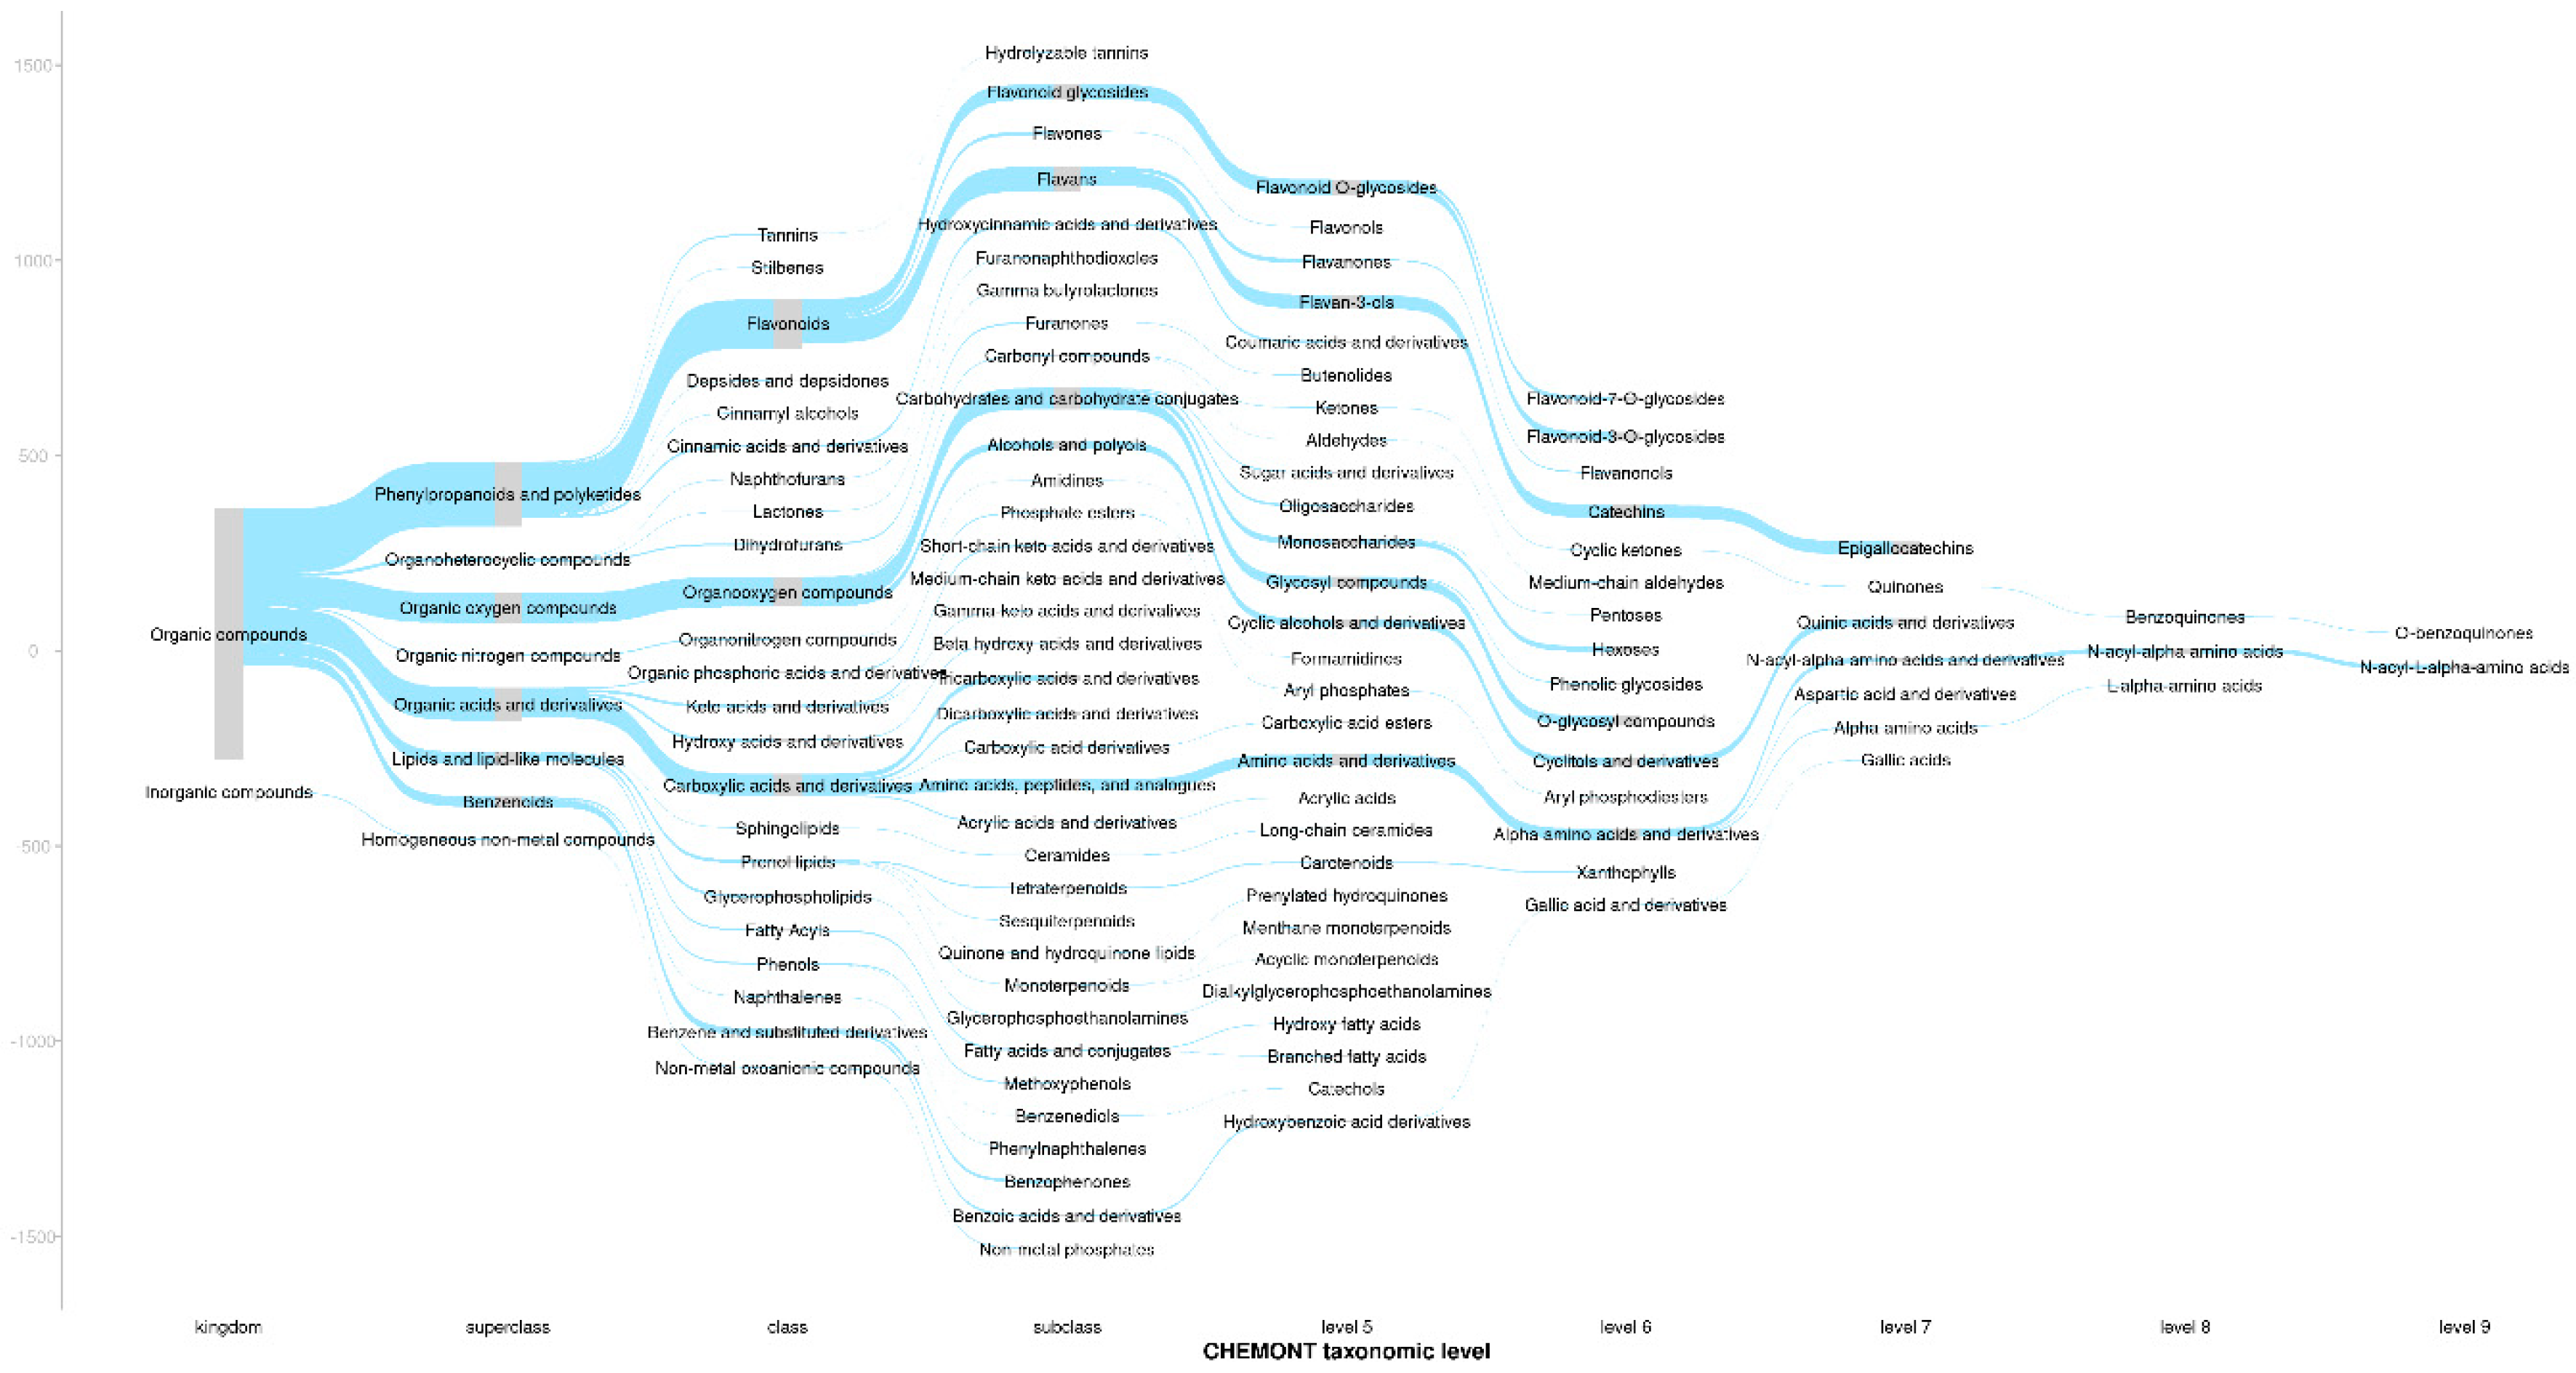
Figure 2.
The difference of the Georgian tea variety field samples between the gardens. Multi-dimensional scaling plot of field sample similarity (proximity) from a random forest classification model. Where the eclipse shows the 95% confidence interval for each variety, estimated using the multivariate normal distribution
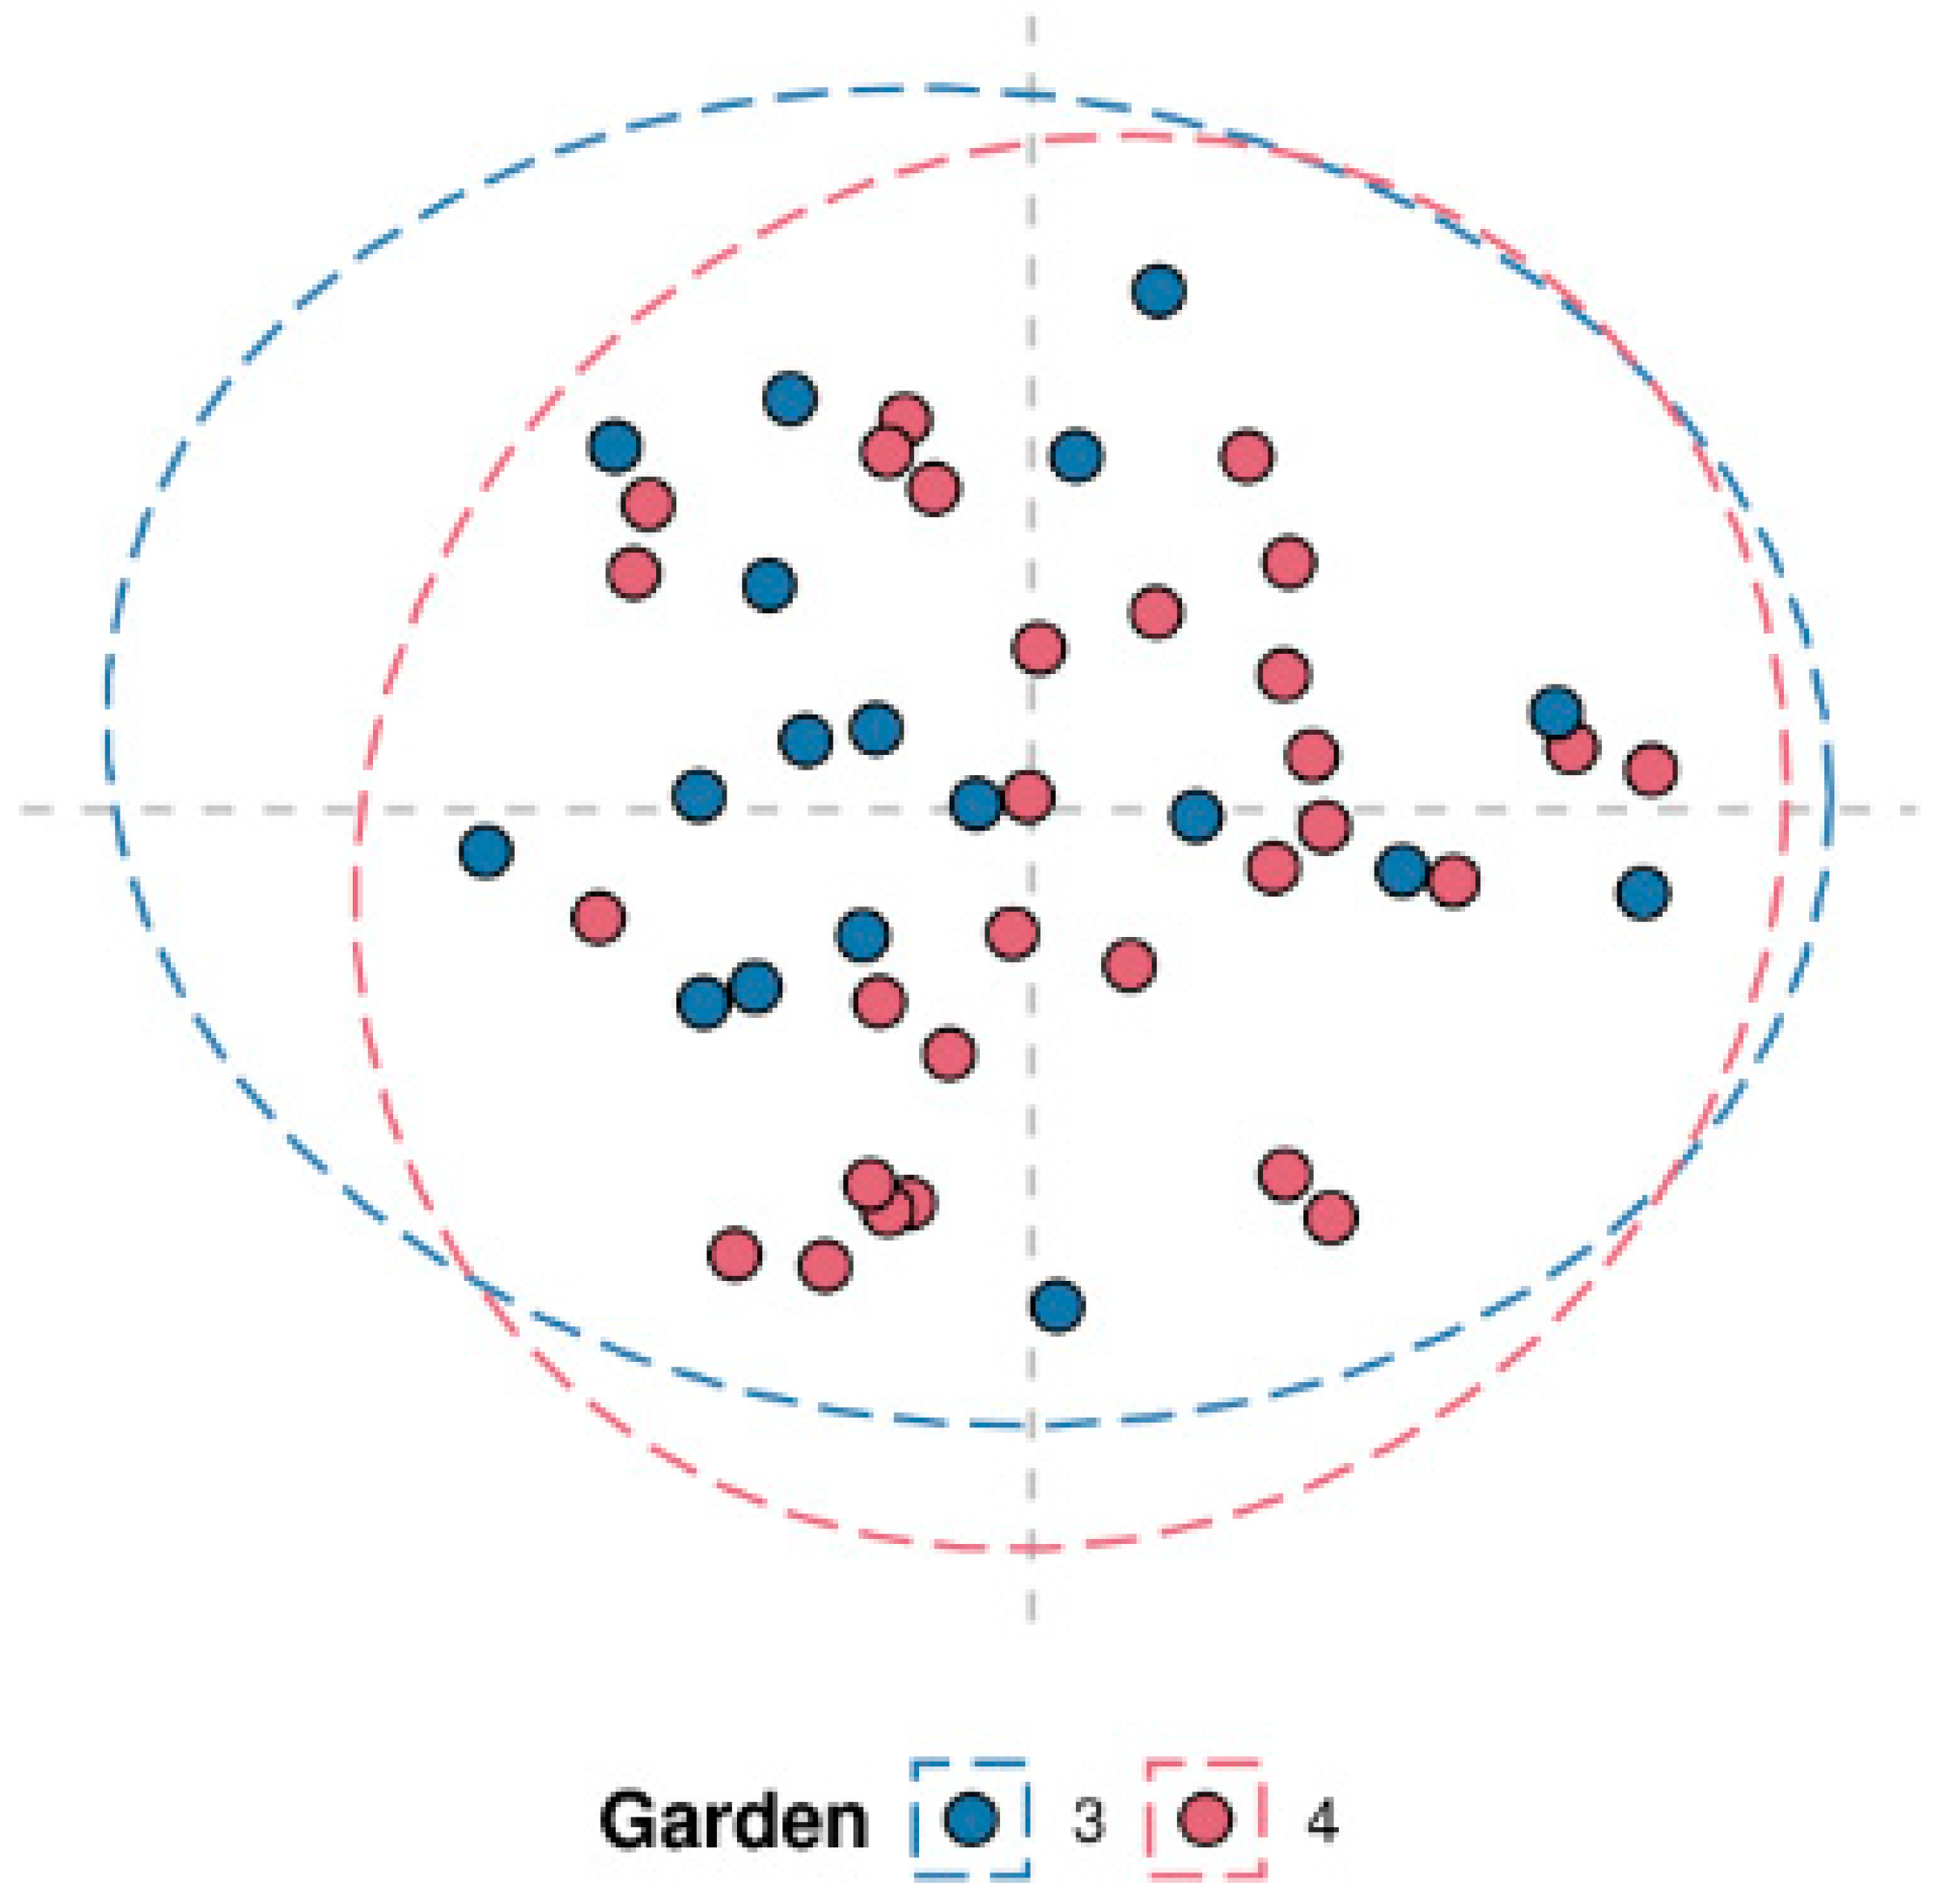
Figure 3.
Density distributions of interclass distances between samples of the Georgian tea plants, taken from different gardens. Where interclass distance based on the sample proximity values from a multinomial random classification model, supervised by garden.
Figure 3.
Density distributions of interclass distances between samples of the Georgian tea plants, taken from different gardens. Where interclass distance based on the sample proximity values from a multinomial random classification model, supervised by garden.
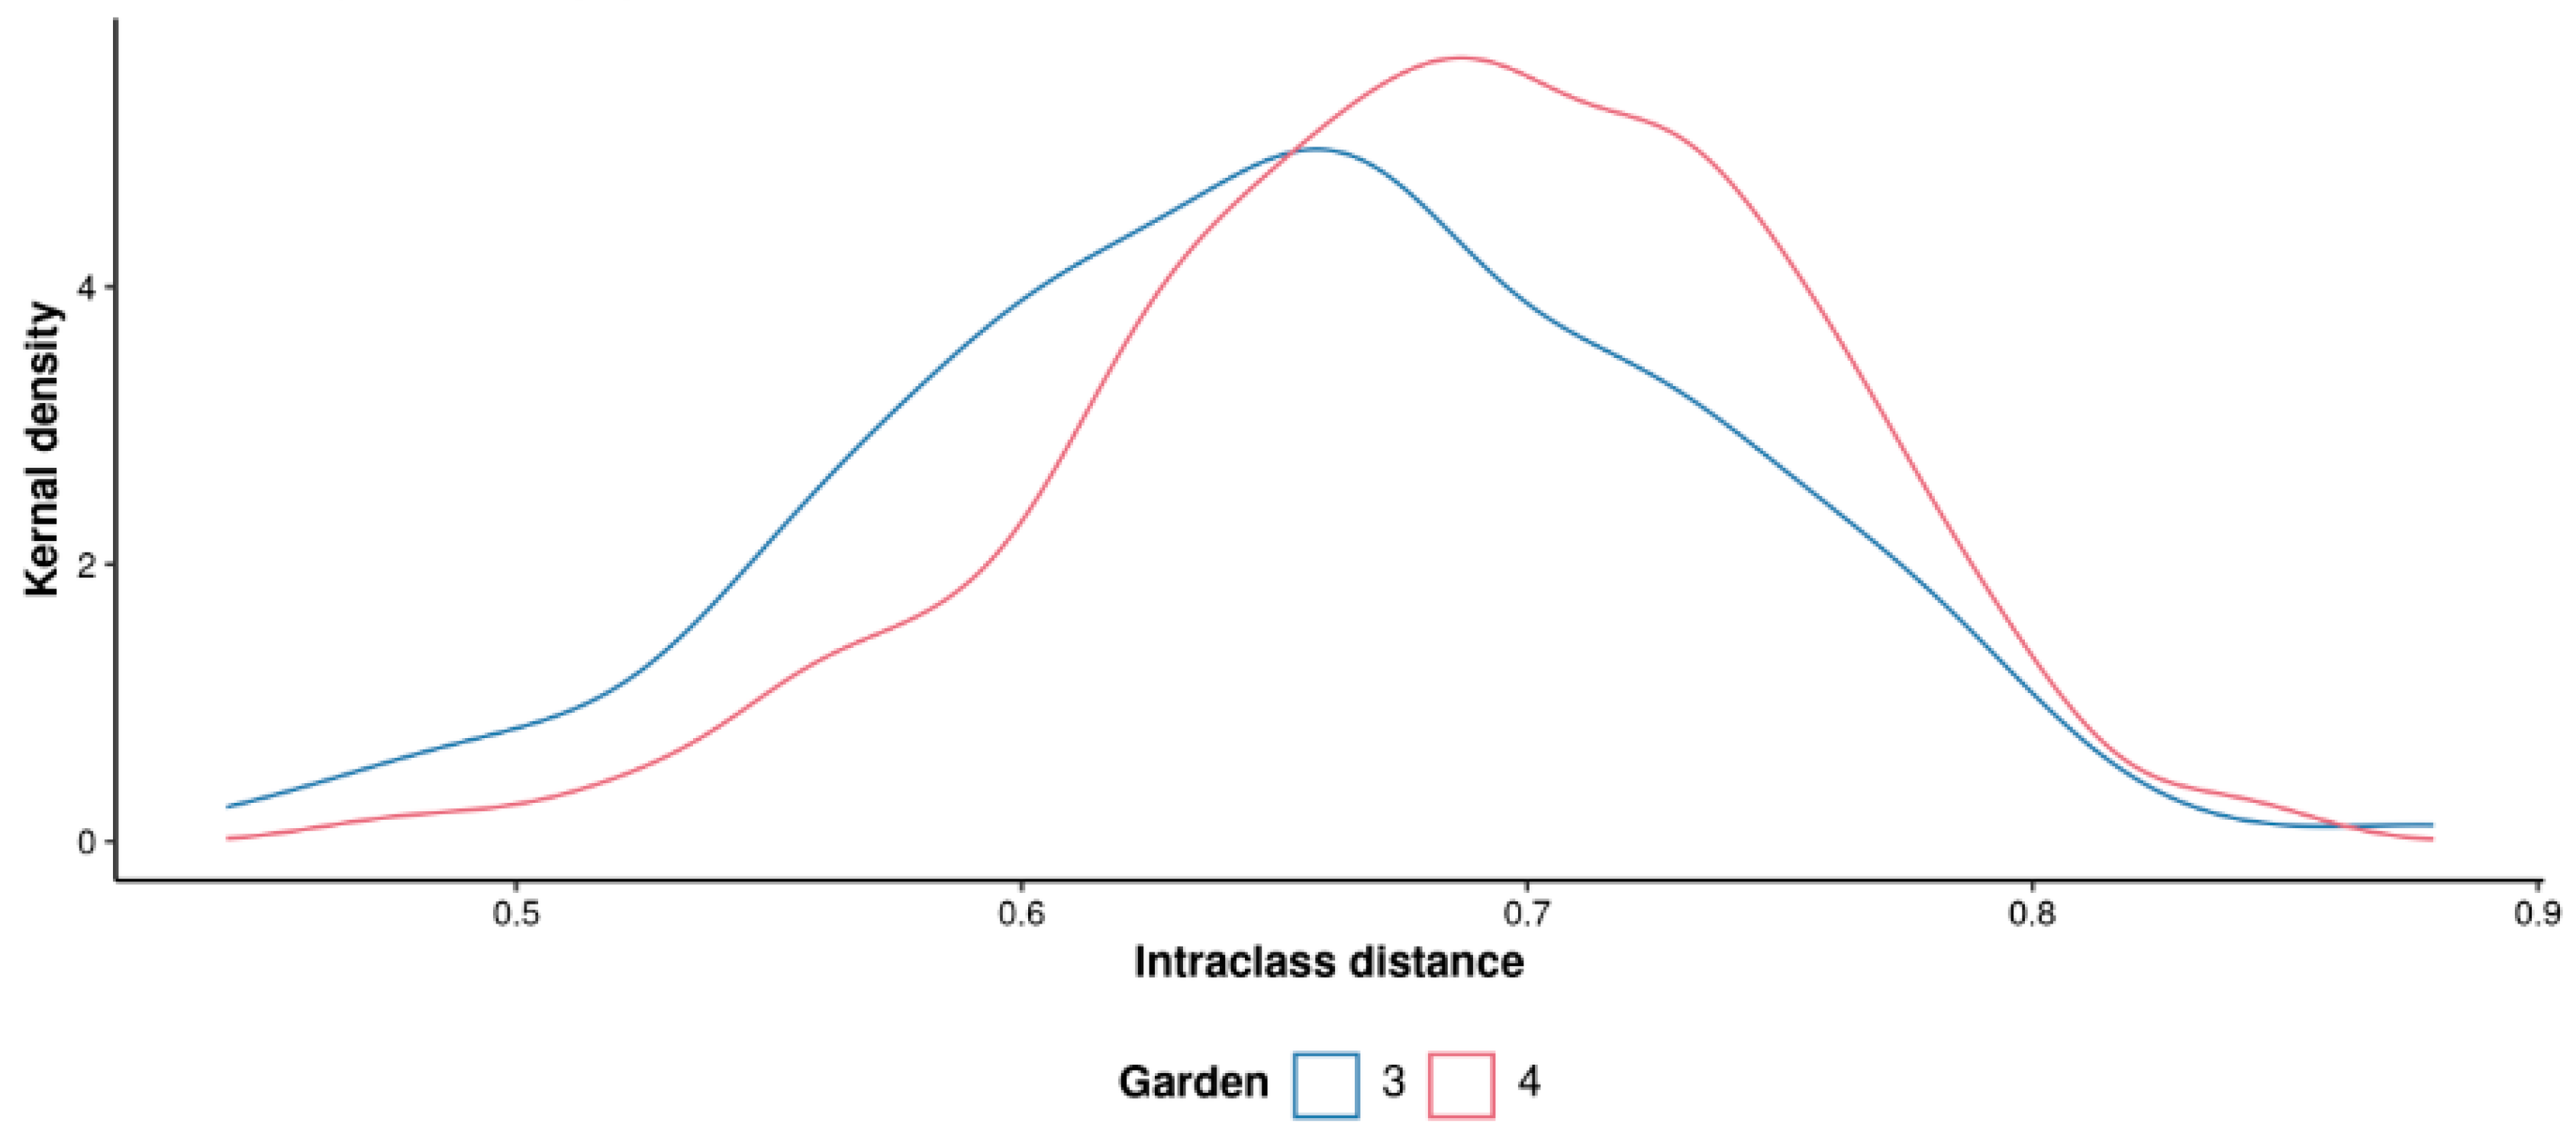
Figure 4.
The similarity of tea varieties based on metabolomic fingerprinting. Where similarity based on supervised Random Forest Classification margin values of binary comparisons between each of the tea varieties.
Figure 4.
The similarity of tea varieties based on metabolomic fingerprinting. Where similarity based on supervised Random Forest Classification margin values of binary comparisons between each of the tea varieties.
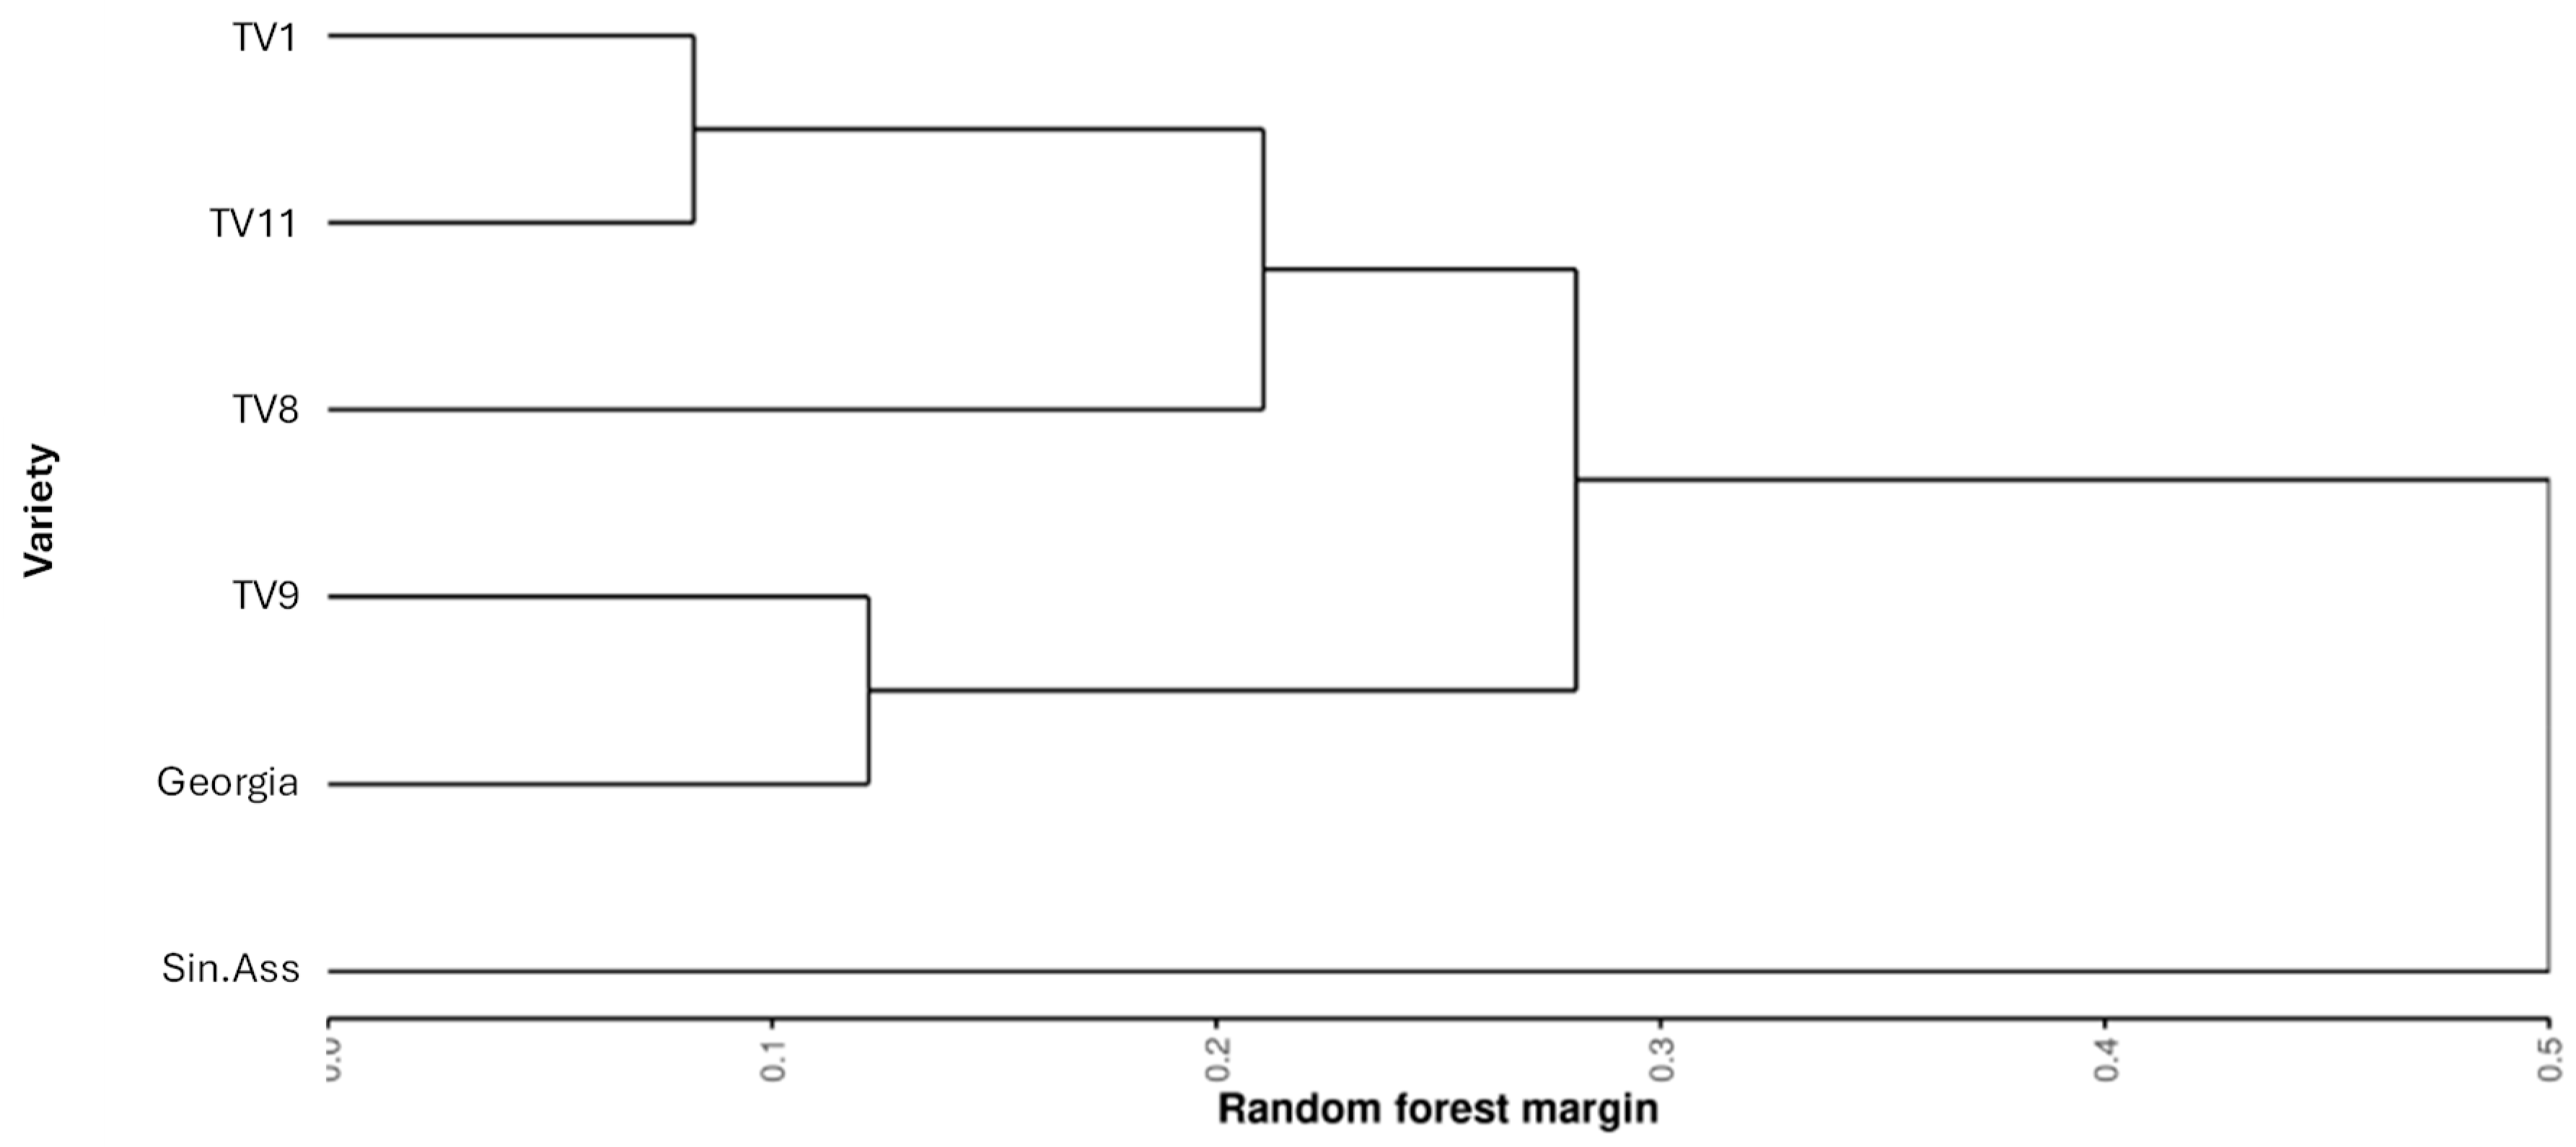
Figure 5.
The variance of the tea variety field samples. Multi-dimensional scaling plot of field samples similarity (proximity) from a multinominal random forest classification model. Where the eclipse shows the 95% confidence interval for each variety, estimated using the multivariate normal distribution.
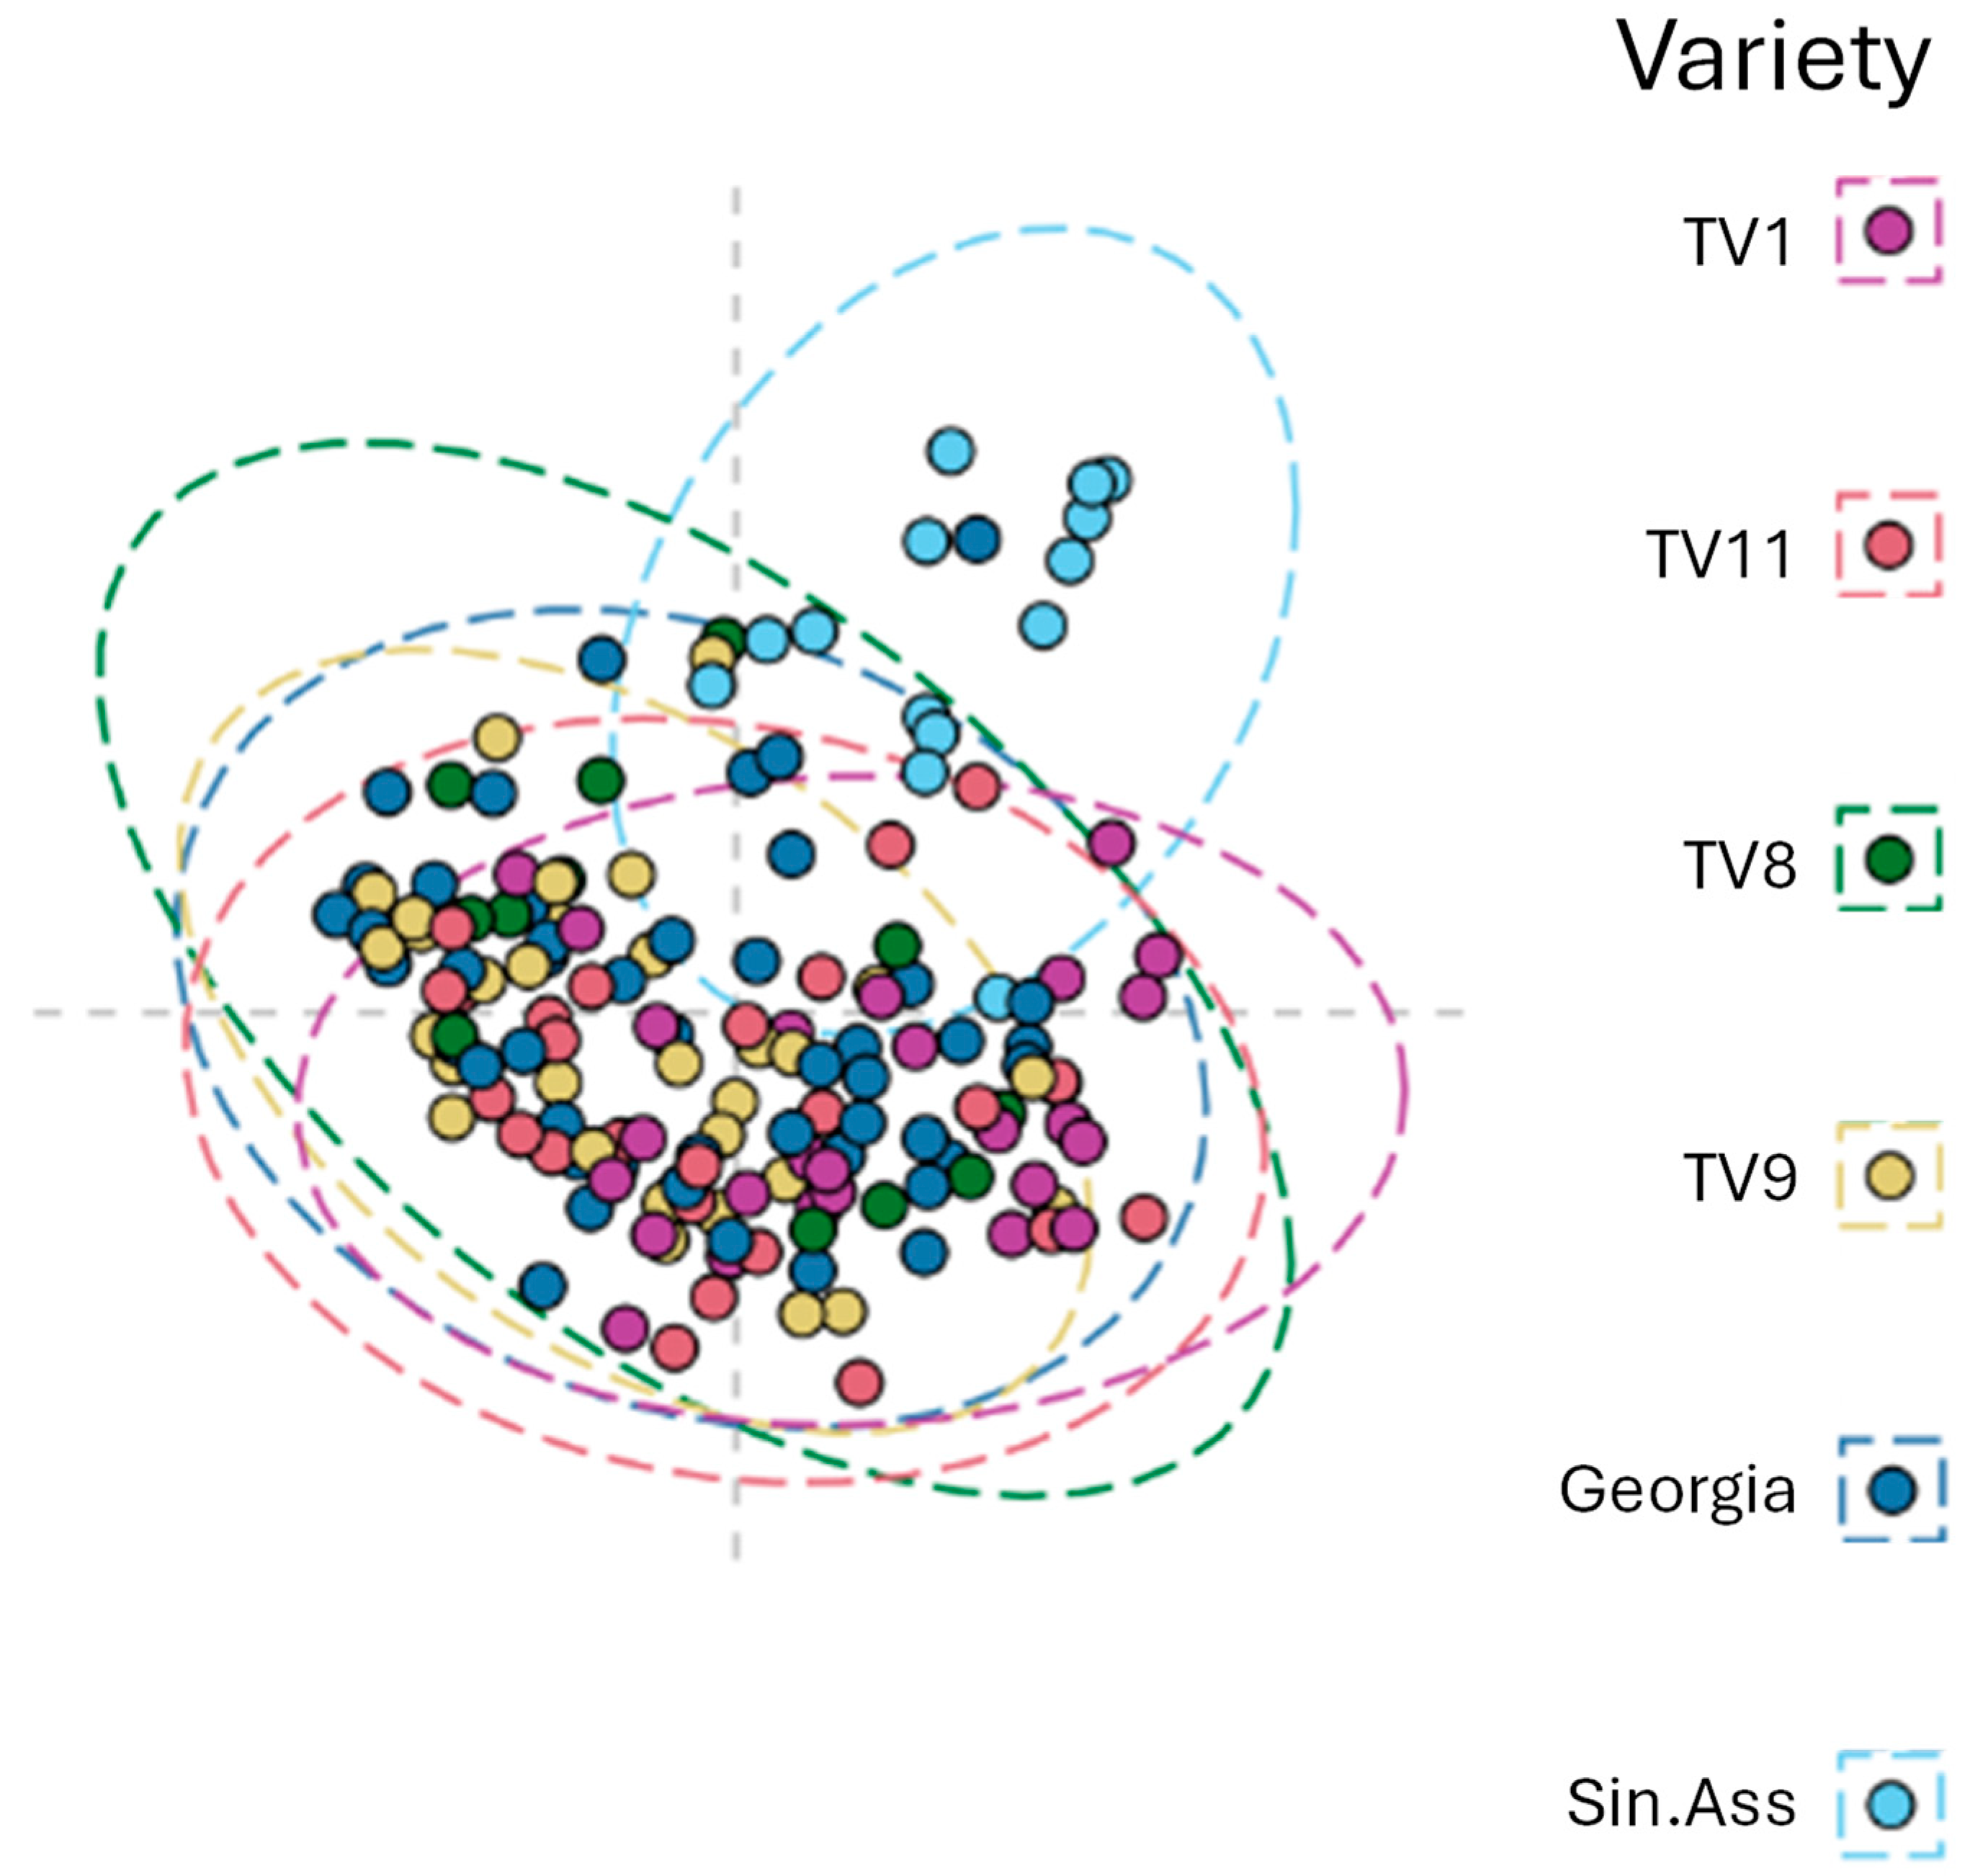
Figure 6.
Clusters of explanatory m/z feature trends across the sampling time points in Camellia sinensis var. assamica. Where the abundance radios were calculated using the m/z feature median values relative to the 09:00 sampling time point. The clusters were identified using k-means clustering. Cluster averages are shown in red.
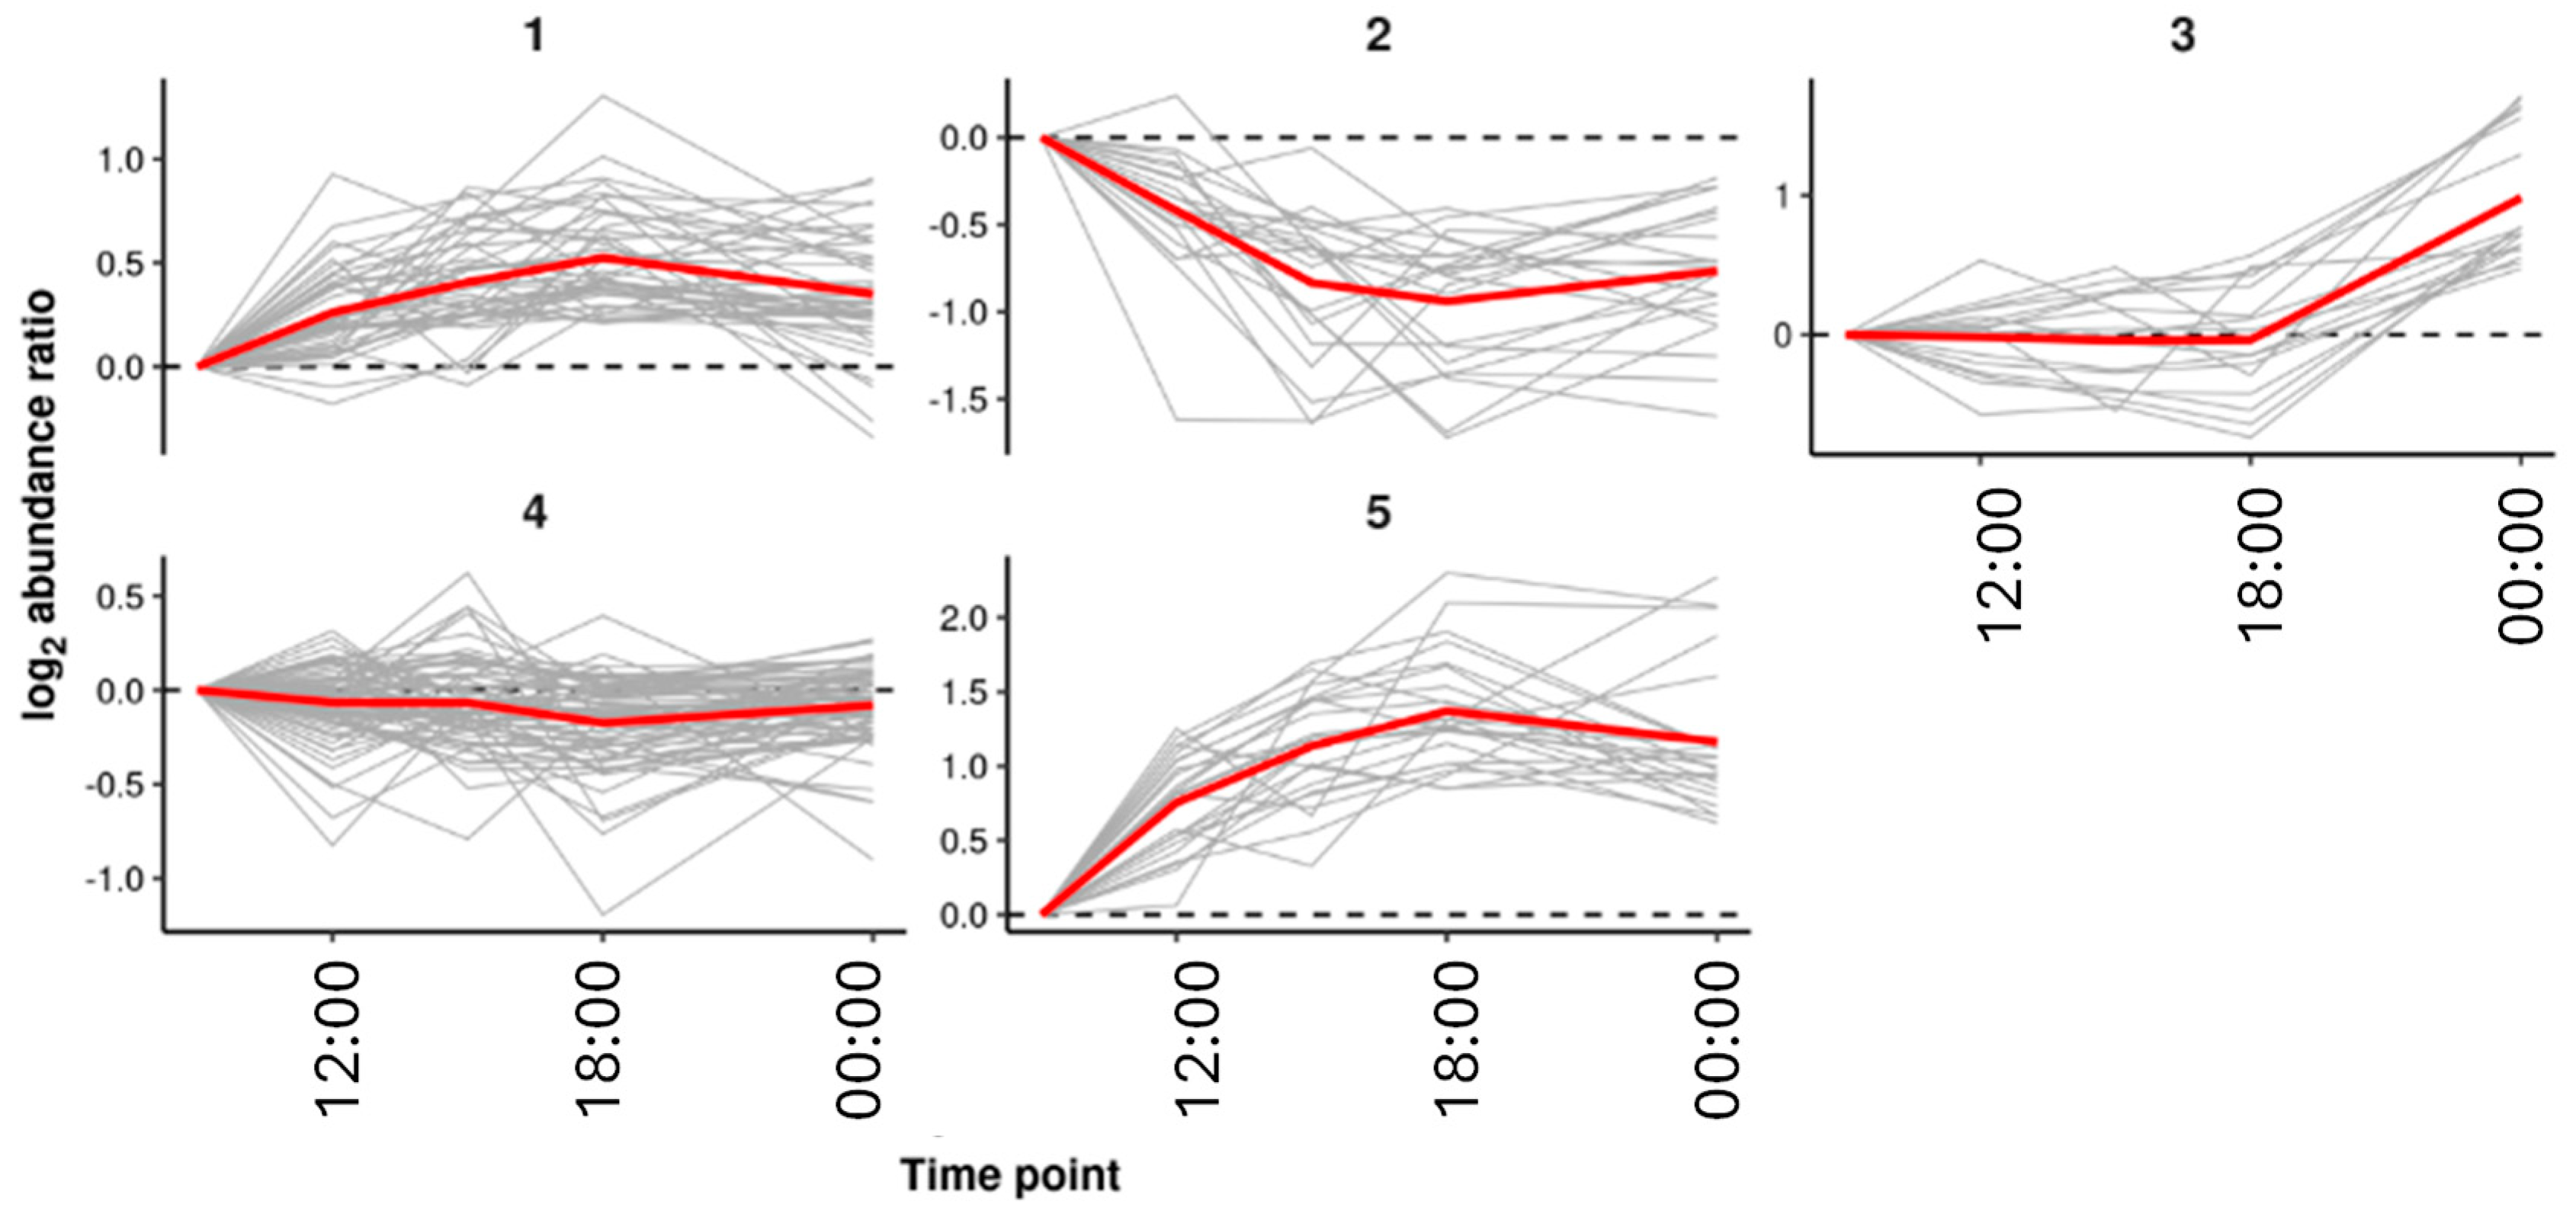
Figure 7.
Box plot of sucrose [M-H]1-.
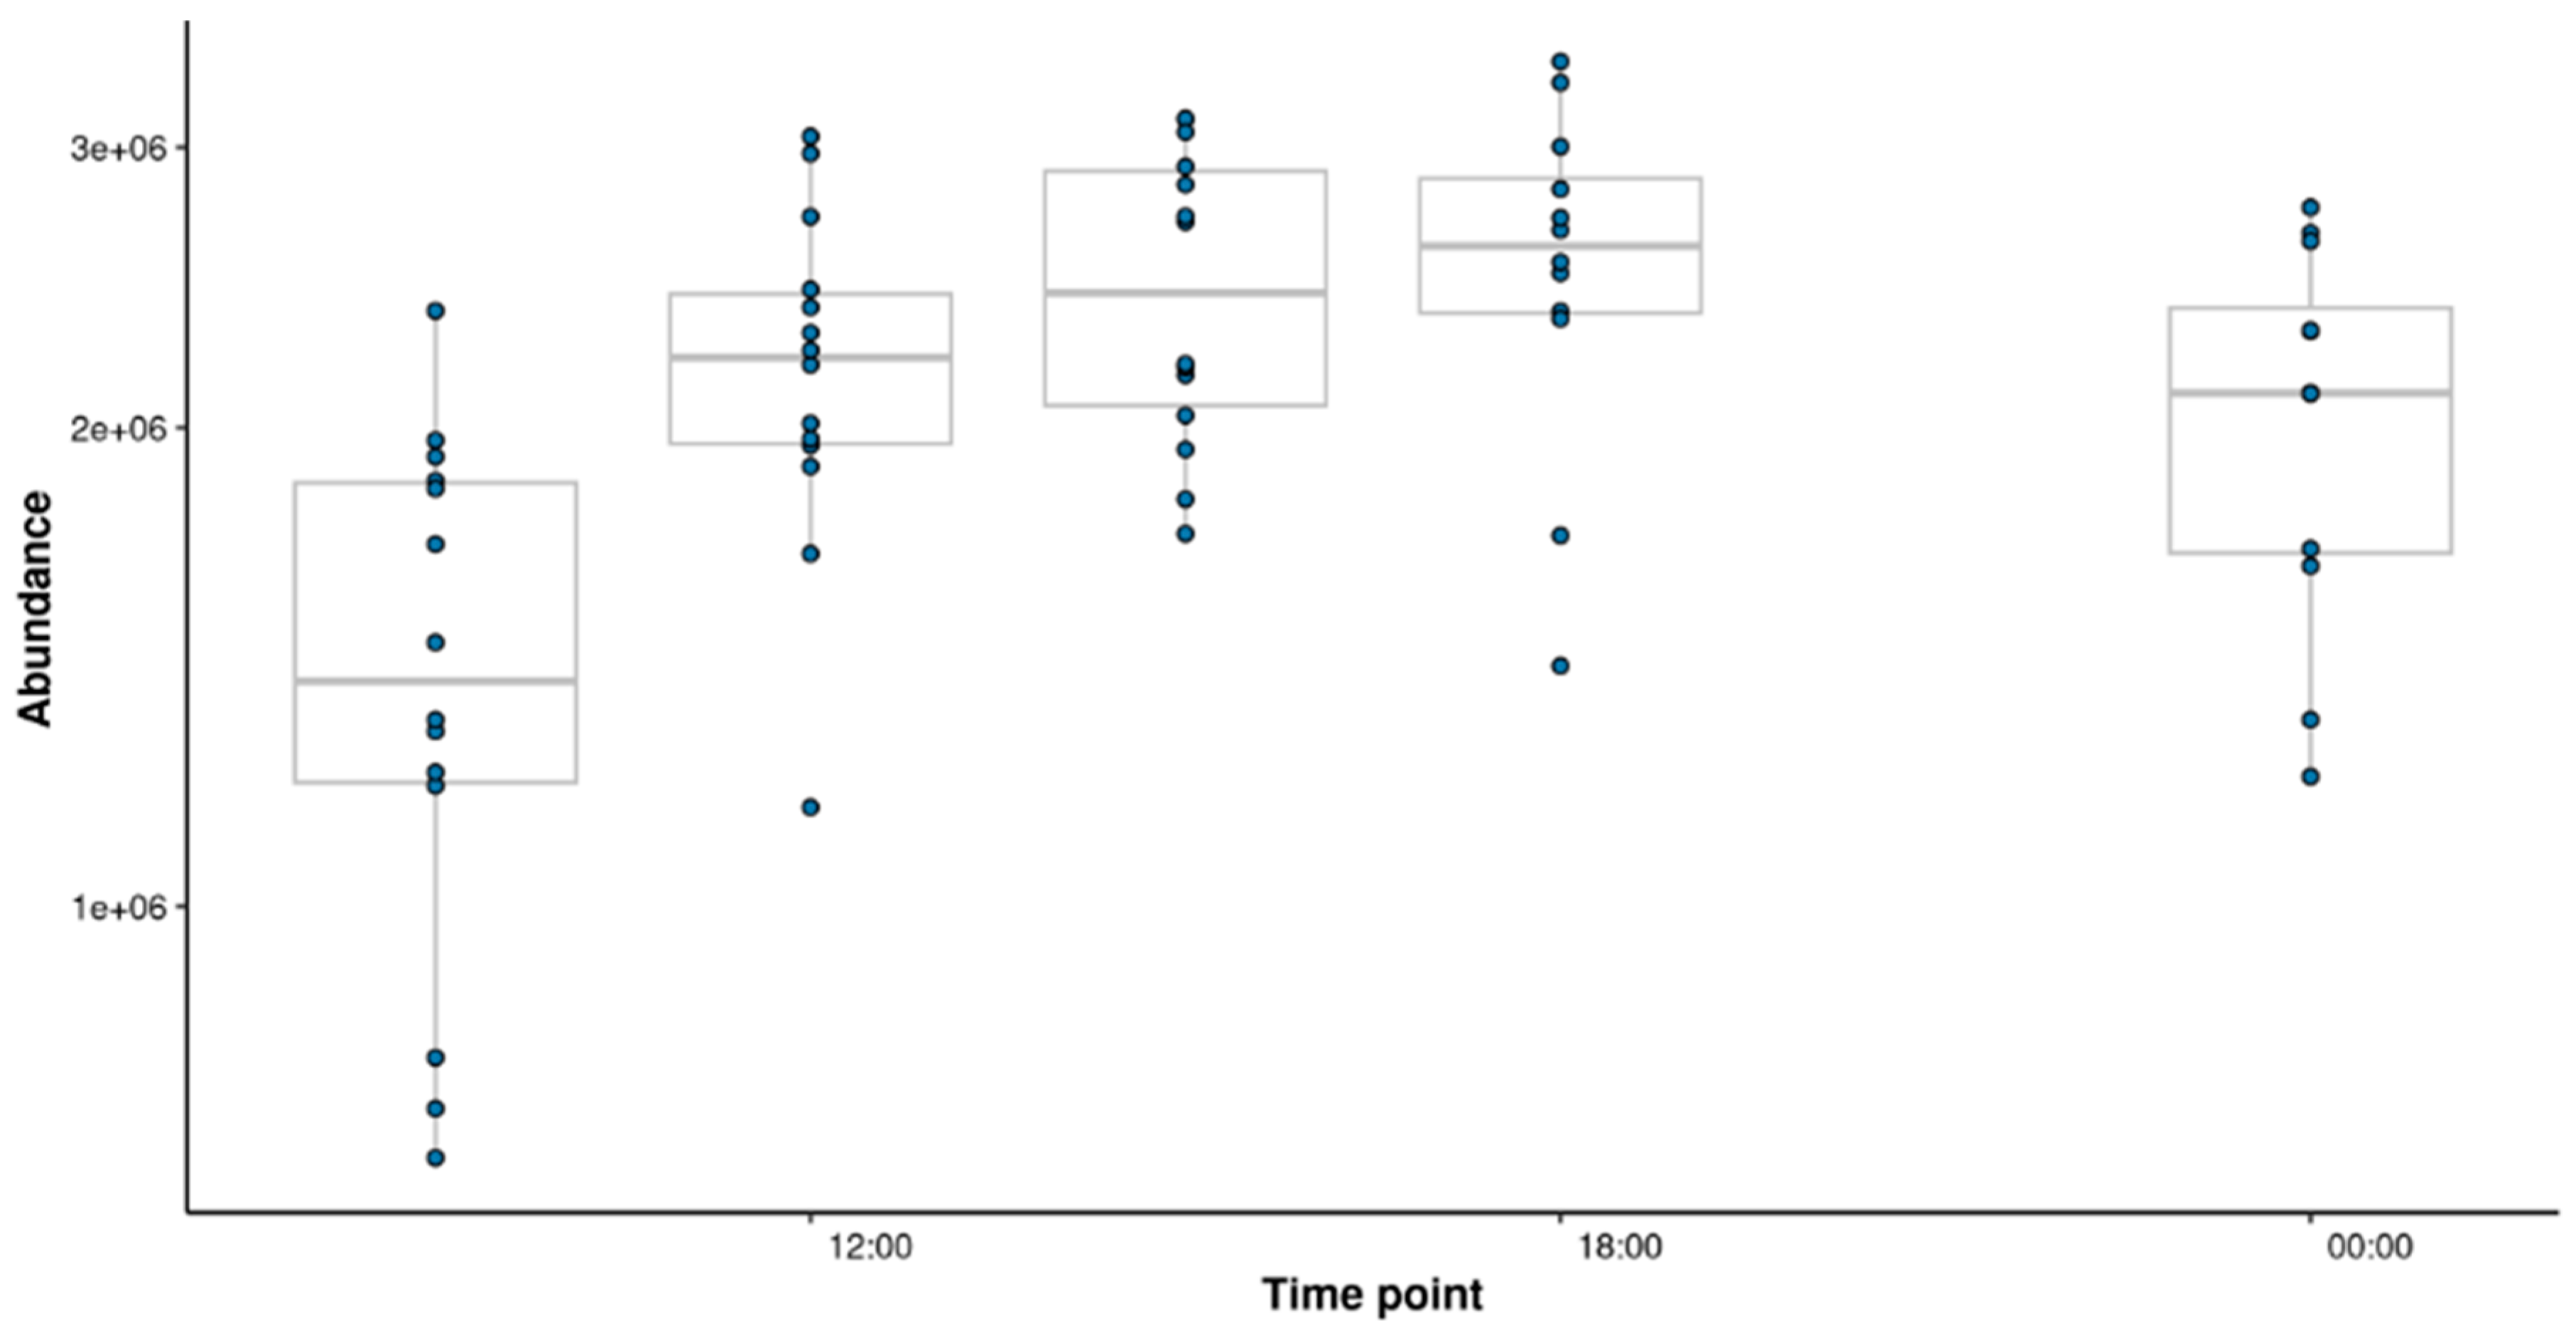

Table 1.
Functional enrichment analysis was performed on each of the clusters to potentially derive both chemical classes and biological functions related to the cluster trends.
Table 1.
Functional enrichment analysis was performed on each of the clusters to potentially derive both chemical classes and biological functions related to the cluster trends.
| Cluster | KEGG id | KEGG name | p-score |
| 1 | csin00020 | Citrate cycle (TCA cycle) | 0.0000 |
| 1 | csin00040 | Pentose and glucuronate interconversions | 0.0000 |
| 1 | csin00053 | Ascorbate and aldarate metabolism | 0.0000 |
| 1 | csin00500 | Starch and sucrose metabolism | 0.0000 |
| 1 | csin00600 | Sphingolipid metabolism | 0.0000 |
| 1 | csin00603 | Glycosphingolipid biosynthesis | 0.0000 |
| 1 | csin00660 | C5-Branched dibasic acid metabolism | 0.0000 |
| 1 | csin00760 | Nicotinate and nicotinamide metabolism | 0.0000 |
| 1 | csin02010 | ABC transporters | 0.0000 |
| 1 | csin04016 | MAPK signaling pathway | 0.0000 |
| 3 | csin00030 | Pentose phosphate pathway | 0.0472 |
| 3 | csin00040 | Pentose and glucuronate interconversions | 0.0054 |
| 3 | csin00240 | Pyrimidine metabolism | 0.0110 |
| 3 | csin00250 | Alanine, aspartate and glutamate metabolism | 0.0000 |
| 3 | csin00280 | Valine, leucine and isoleucine degradation | 0.0000 |
| 3 | csin00330 | Arginine and proline metabolism | 0.0001 |
| 3 | csin00410 | beta-Alanine metabolism | 0.0001 |
| 3 | csin00470 | D-Amino acid metabolism | 0.0408 |
| 3 | csin00511 | Other glycan degradation | 0.0394 |
| 3 | csin00561 | Glycerolipid metabolism | 0.0000 |
| 3 | csin00620 | Pyruvate metabolism | 0.0000 |
| 3 | csin00670 | One carbon pool by folate | 0.0000 |
| 3 | csin00740 | Riboflavin metabolism | 0.0000 |
| 3 | csin00970 | Aminoacyl-tRNA biosynthesis | 0.0000 |
| 3 | csin01200 | Carbon metabolism | 0.0000 |
| 3 | csin04148 | Efferocytosis | 0.0000 |
| 4 | csin00941 | Flavonoid biosynthesis | 0.0000 |
| 4 | csin00999 | Biosynthesis of various plant secondary metab... | 0.0001 |
| 5 | csin00030 | Pentose phosphate pathway | 0.0000 |
| 5 | csin00040 | Pentose and glucuronate interconversions | 0.0000 |
| 5 | csin00053 | Ascorbate and aldarate metabolism | 0.0000 |
| 5 | csin00250 | Alanine, aspartate and glutamate metabolism | 0.0000 |
| 5 | csin00270 | Cysteine and methionine metabolism | 0.0000 |
| 5 | csin00290 | Valine, leucine and isoleucine biosynthesis | 0.0000 |
| 5 | csin00330 | Arginine and proline metabolism | 0.0042 |
| 5 | csin00750 | Vitamin B6 metabolism | 0.0000 |
| 5 | csin01230 | Biosynthesis of amino acids | 0.0019 |
| 5 | csin04016 | MAPK signaling pathway | 0.0000 |
Table 2.
Structural enrichment analysis was performed on each of the clusters to potentially derive both chemical classes and biological functions related to the cluster trends.
Table 2.
Structural enrichment analysis was performed on each of the clusters to potentially derive both chemical classes and biological functions related to the cluster trends.
| Cluster | Classification | p-value | Adjusted p-value |
| 1 | Organic compounds | 0.000 | 0.002 |
| 1 | Organic acids and derivatives | 0.002 | 0.052 |
| 1 | O-glycosyl compounds | 0.003 | 0.056 |
| 1 | Carbohydrates and carbohydrate conjugates | 0.003 | 0.068 |
| 1 | Keto acids and derivatives | 0.003 | 0.072 |
| 1 | Glycosyl compounds | 0.004 | 0.078 |
| 1 | Organooxygen compounds | 0.010 | 0.224 |
| 1 | Organic oxygen compounds | 0.010 | 0.224 |
| 1 | Tricarboxylic acids and derivatives | 0.010 | 0.225 |
| 1 | Medium-chain keto acids and derivatives | 0.011 | 0.246 |
| 1 | Pentoses | 0.022 | 0.490 |
| 1 | Gamma-keto acids and derivatives | 0.022 | 0.490 |
| 1 | Carboxylic acids and derivatives | 0.025 | 0.554 |
| 1 | Alpha amino acids | 0.044 | 0.969 |
| 2 | Cyclic alcohols and derivatives | 0.005 | 0.126 |
| 2 | Cyclitols and derivatives | 0.005 | 0.126 |
| 2 | Quinic acids and derivatives | 0.005 | 0.126 |
| 2 | Alcohols and polyols | 0.005 | 0.126 |
| 2 | Organic compounds | 0.006 | 0.154 |
| 2 | Organooxygen compounds | 0.009 | 0.227 |
| 2 | Organic oxygen compounds | 0.009 | 0.227 |
| 2 | Sphingolipids | 0.011 | 0.286 |
| 2 | Long-chain ceramides | 0.011 | 0.286 |
| 2 | Ceramides | 0.011 | 0.286 |
| 2 | Non-metal oxoanionic compounds | 0.017 | 0.427 |
| 2 | Inorganic compounds | 0.017 | 0.427 |
| 2 | Non-metal phosphates | 0.017 | 0.427 |
| 2 | Homogeneous non-metal compounds | 0.017 | 0.427 |
| 2 | Cinnamic acids and derivatives | 0.040 | 0.986 |
| 2 | Coumaric acids and derivatives | 0.040 | 0.986 |
| 2 | Hydroxycinnamic acids and derivatives | 0.040 | 0.986 |
| 3 | Hydroxy acids and derivatives | 0.001 | 0.005 |
| 3 | Organic acids and derivatives | 0.006 | 0.057 |
| 3 | Aspartic acid and derivatives | 0.013 | 0.132 |
| 4 | No database hits | 0.001 | 0.009 |
| 5 | Amino acids and derivatives | 0.014 | 0.206 |
| 5 | Alpha amino acids and derivatives | 0.014 | 0.206 |
| 5 | Amino acids, peptides, and analogues | 0.014 | 0.206 |
| 5 | Hydroxy fatty acids | 0.019 | 0.280 |
| 5 | Aspartic acid and derivatives | 0.019 | 0.280 |
| 5 | Alpha amino acids | 0.025 | 0.372 |
| 5 | Fatty Acyls | 0.031 | 0.463 |
| 5 | Fatty acids and conjugates | 0.031 | 0.463 |
| 5 | Carboxylic acids and derivatives | 0.049 | 0.727 |
Disclaimer/Publisher’s Note: The statements, opinions and data contained in all publications are solely those of the individual author(s) and contributor(s) and not of MDPI and/or the editor(s). MDPI and/or the editor(s) disclaim responsibility for any injury to people or property resulting from any ideas, methods, instructions or products referred to in the content. |
© 2025 by the authors. Licensee MDPI, Basel, Switzerland. This article is an open access article distributed under the terms and conditions of the Creative Commons Attribution (CC BY) license (http://creativecommons.org/licenses/by/4.0/).
Copyright: This open access article is published under a Creative Commons CC BY 4.0 license, which permit the free download, distribution, and reuse, provided that the author and preprint are cited in any reuse.


