
Submitted:
18 December 2024
Posted:
18 December 2024
You are already at the latest version
Abstract
This paper examines the role of digital economy tools, including big data, mobile applications, e-commerce, and sharing economy platforms, in the sustainable development of tourism sector. The focus is on studying how the digital economy tools can contribute to more efficient and sustainable tourism services, to the service quality improvement, to reducing the negative environmental impact, and thus increase the availability of tourism resources in local destinations. On the example of successful use of digital technologies in Russian regions, the paper discusses the introduction of online platforms for booking services, the use of mobile applications for navigation and obtaining information about tourist sites, as well as the use of digital tools for predicting consumer preferences. Systematic approach to the analysis of tourism services digitalization, based on a set of technical and functional-digital indicators, allowed us to evaluate the impact of the digitalization level on the local destination sustainable development in the transition economy conditions. The proposed methodology for assessing and applying tourism services digitalization tools in Russian regions takes in account the transition economy specifics, and aims to promote more sustainable practices. The study will add to the existing literature by defining both technical and functional criteria for the implementation of digital technologies as tools for new business models creation in tourism, and development of tourism services digitalization model, based on assessment of regional digitalization level, to ensure the movement towards achieving sustainable development goals in local destinations.
Keywords:
tourism and hospitality industry
; digital economy
; sustainable development
; service quality
; im-provement
; clustering
; Russia
1. Introduction
Digital solutions are currently a key element in the development of tourism across all elements of the value chain [1]. For example, low-cost airlines make all corners of the world accessible, global transport platforms combine transport and accommodation services, sharing services take accommodation to a new level for budget-conscious consumers, and offer aggregators make it easy to quickly compare prices, conditions and service ratings with other consumers. Leveraging the beneficial contribution of tourism to achieving sustainable development goals and mitigating the negative impacts of the sector requires close cooperation and vital action from all stakeholders in the tourism sector [2]. Digital transformation has become a critical element for tourism enterprises to maintain a competitive advantage and achieve sustainable development [3]. This means not only the simple application of information technology, but also entails a comprehensive process of innovation and optimization [4].
Digital transformation rethinks travel concepts and leads to an increase in travel-related needs [5]. This revolution is associated with the creation of new products and services, as well as the introduction of a new culture, structure, methods, innovations and technologies [6]. Digital transformation creates value for the tourism sector through increased profitability and value migration from traditional companies to new players [7].
Although prior research has shown the importance of digitalization in tourism as a way to improve the resilience of tourism enterprises, to enhance customer value and to gain competitive advantages [8], the impact of digitalization on the local tourism destinations sustainability in transition economies is relatively under-researched. This research can add to filling this gap by exploring the current state of digitalization in the Russian tourism sector to identify the digital economy trends in the context of sustainable development. The underlying studies on industrial revolutions [9] and the post-capitalist development model [10], as well as studies stating the goals, indicators and principles of sustainable development [11] formed the theoretical basis of the research. The study will add to the existing literature by introducing:
1) a multi-level interpretation of the tourism services digitalization components, which allows to define both technical and functional criteria for the implementation of digital technologies as tools for new business models creation in tourism;
2) a systematic approach to the analysis of tourism services digitalization, based on a set of technical and functional-digital indicators, to assess the impact of the digitalization level on the local destination sustainable development in the specific conditions of a transition economy;
3) a tourism services digitalization model, based on assessment of regional digitalization level, to ensure the movement towards achieving sustainable development goals in local destinations;
4) a methodology for assessing and applying tourism services digitalization tools in Russian regions taking in account the transition economy specifics, and promoting more sustainable practices.
This paper is organized as follows. Firstly, a literature review to facilitate a holistic understanding of the sustainable tourism phenomenon, and digital transformation in tourism. Secondly, digital transformation in Russian tourism sector discussed. The next section details the research methodology, followed by the analysis of the data collected and discussion, and then to finish, the final section presents the conclusions and suggestions for future studies.
2. Literature Review
2.1. Sustainable Tourism
The concept of sustainable development can be interpreted in different ways [12], but at its core is an approach to development that seeks to balance different and often competing needs with an awareness of the environmental, social and economic constraints we face as a society [13]. Agenda 21 recognized tourism “as a model form of economic development that should improve the quality of life of the host community, provide a high quality of experience for the visitor, and maintain the quality of the environment on which both the host community and the visitor depend”. The economy, environment, and society are typically prioritized when discussing the basics of sustainable development [14,15].
There is sustainable development entails the responsible utilization of natural, cultural, and other tourist resources by the present generation to preserve these resources for the benefit of future generations [16]. At the same time, tourism growth in developing countries has led to a number of environmental and socioeconomic problems [17].
In contemporary conditions, the role of sustainability in fostering tourism destination competitiveness becomes increasingly crucial [18,19,20]. The implementation of sustainable development practices is now one of the foremost issues confronting policymakers and destination managers. [16] The sustainable tourism development management has to retain high satisfaction degree of tourists' needs, assure significant experience for consumers, increasing their consciousness under issues of sustainability, and propagating sustainable practices [3]. There is still concern about the potentially harmful effects of tourism on both local populations and the environment. Travelers tend to consume more water, food and energy, thus creating more waste than they do at home, which creates tension in many tourism destinations [21].
One of the main challenges in promoting sustainable development in the tourism industry is to ensure innovative development and the inflow of investments in digital transformation [22]. Another challenge is that travelers are not monolithic: they seek diverse experiences unique to their cultural, religious, educational, and lifestyle backgrounds. Therefore, destination managers and tourism actors in destinations have to develop different attractions that meet different needs and interests of target audiences but prevent the damage of natural, cultural, and other tourist resources. Moreover, there is a need to actively plan and upgrade existing resources [23], and this is much easier to achieve in case of using cluster approach [24].
Porter defines a cluster as a geographically close group of interconnected companies, suppliers, service providers and associated institutions, in a particular field, linked by analogy and complementarities [25]. He and his followers underline that clusters promote both competition and cooperation [26,27]. Competitors compete intensely to win and retain their customers, and this is an important source of cluster success and competitiveness [28,29]. At the same time, intensive inter-firm, inter-industry linkages of organizations, sharing common opportunities and treats, serve as a relevant source of resilience, especially in the face of uncertainty[30,31]. The following factors are the main ones contributing to clustering as a way to sustainable development: territory or cluster reputation, access to the local skilled labor market, state programs for territorial development, as well as a favorable socio-cultural environment, and the territory well-being [31].
The cluster model of sustainable local tourism development in our study will be based on the following methodological approaches to clustering processes modeling: the Porter Diamond Model [32]; the Sölvell-Williams network model for cluster development [33]; the Ketels-Protsiv institutional model for cluster development.
2.2. Digital Transformation in Tourism
Digitalization defined as “the manifold sociotechnical phenomena and processes of adopting and using these technologies in broader individual, organizational, and societal contexts”[34] is one of the main trends that radically changes society and business with the spread of modern technologies such as artificial intelligence, 3D printing, mobile networks, etc.[35]. With the emergence of these elaborated digital technologies, not only broad prospects for new approaches became obvious, but also the theoretical complexity has increased simultaneously [36].
It is widely recognized that the COVID-19 pandemic served as an accelerator of digitalization in tourism [37,38]. Although one should underline that implementation of digital technologies in tourism is not something new. Since the beginning of the 21st century, “growing numbers of tourism researchers are addressing the wide palette of issues that fall within the innovation headline and expanding the methodological scope”[39]. Many recent studies proved that the level of innovation in socio-cultural, natural, political, legal, and technological spheres determines sustainable tourism development [40,41,42,43].
Especially digital innovations are in the focus of tourism research [29,44,45]. The digitalization processes occurring in both developed and developing countries should help reduce uncertainty and increase predictability but also may lead to “an increase in exposure to cyber risks, a general complication of economic relationships, the development and introduction of innovative technologies to the market, and the formation of complex supply chains and value chains”[46]. Digital innovations in marketing and promotion of tourism goods and services serves as a precondition for the development of sustainable small- and medium-sized businesses [47,48].
In the context of the digital economy, a phenomenon initially considered by Francis Cairncross as The Death of Distances means that digital proximity allows economic actors to successfully cooperate in the digital space [49]. The advantage of the digital space for economic development is also due to the virtually unlimited density and complexity of network connections and relationships of economic actors [50,51]. Digital platforms and ecosystems are penetrating all areas of business and becoming a highly important factor of success [52,53,54]
Technological advances are driving revolution, progress and globalization in the tourism industry. Digital technologies offer a universal infrastructure for people and businesses to share information, collaborate and communicate [55,56]. Moreover, technology has become paramount in business development as it touches every aspect of tourism [57]. Various models of e-business have been developed, including electronic booking platforms; e-platforms that unite different enterprises in the tourism industry; tourism forums and virtual communities for connecting consumers of tourism services [58,59,60,61,62].
Digitalization and the use of new technologies have become key pillars necessary for tourism companies to improve their relationships with their customers. The opportunities that digital technologies open up in the tourism industry show two aspects: from the consumer point of view, and from the tourism services producer point of view. Consumers can decrease their efforts to search for a tourism product, can receive online consultations, evaluate and choose tourist destinations, and reduce the costs of using tourism services. On the other hand, digitalization increases the competitiveness of enterprises in the tourism services market. Through digitalization, tourism enterprises can achieve efficient resource integration, develop personalized service customization, and improve marketing, providing tourists with more convenient, comfortable, and enjoyable travel experiences [60,63,64,65,66].
At the same time, competition becomes more intensive, and companies have to keep up with digitalization to stay at the same level. In this situation, corporate social responsibility aspects can help improve the tourism business competitiveness [67,68]. Tourism enterprises and tourism destinations use corporate social responsibility as a strategic tool to create a favorable perception of stakeholders and customers.
2.3. Digital Tools in Tourism
Digital tools can be divided into low digitalization technologies and medium digitalization technologies. Low digitalization technologies include basic office software, specialized financial software, Internet for employees, e-mail, online data storage, video conferencing, online collaboration, Internet banking, websites, social networks, etc. Medium digitalization technologies include analytical tools such as Google Analytics, CRM systems, mobile applications, professional online networks, etc. (Table 1).
Artificial intelligence (AI) and the Internet of things (IoT) are at the forefront a transformative revolution driven by digital technologies, significantly influencing the sector by making tourism more accessible, personalized, and environmentally sustainable [69]. Deploying the IoT, defined as “an interconnected system based on approved protocols which exchange information among the devices operating via the internet [70], can be considered as a way to attract more visitors, and to provide better experiences to them [71]. IoT also has the potential for enhancing sustainable tourism making it possible for tourism providers and tourists to ensure a stronger alignment with key sustainable development goals. At the same time, the research conducted by Unrich illustrated that tourism actors mainly use IoT to provide clients with comfort, convenience, experiences, and meaning, but the sustainability dimensions are still only superficially integrated.
Blockchain is also a technology highly capable of supporting efforts to improve sustainability in tourism [21,72]. Blockchain, which is a distributed database that keeps a list of data records secured from tampering and alteration, can guarantee that the information is reliable and valid. It can provide for tourism businesses the ability to manage sales, finance and administration transactions, to support tourism supply chains and interactions with external stakeholders, including relations aimed at SDG achievement [73,74]. Goals achieved by using blockchain technology are enhancing tourism experience, rewarding sustainable behaviour, ensuring benefits for local communities, and reducing privacy concerns [75].
With cloud computing, Wi-Fi and international mobile data plans becoming more common, mobile travel apps have been identified as a niche with fast growing potential [76,77]. A growing number of tourists use their smartphones for travel purposes including access to real-time destination information, online booking and mobile payments [1,78]. Mobile phones with their technologies play the role of travel agencies, guides, tour operators, tourist maps, best restaurants, and are certainly necessary to ensure sustainability [79].
Virtual reality allows travelers to virtually immerse themselves, navigate, and interact with various senses [80,81]. This digital environment allows travelers to discover new places and destinations. The possibilities for virtual travel and visits using virtual reality are almost endless now [82]. Augmented reality refers to the addition of digital information to the real environment. Using AR/VR technologies, companies and tour operators can accompany tourists during their trip or visit, providing additional value without replacing the experience itself [83,84].
Social media plays an important role as a tool for information and interaction since it is extremely important for people to be socially connected [85].When assessing the cycle of technological development, one can conclude that the biggest changes occurred immediately after Web 2.0. Nowadays, tourist themselves are the ones creating the content on social media, as the ability to share content during these decades led to a paradigm shift in communication, where people often choose a destination influenced by the information they saw on social media. As the influence of social media grows, increasingly important marketing strategies are developed for specific target groups to offer relevant content. Thus, if tourism businesses want to be visible, they need to be on social media. The contribution of social networking sites to improving sustainable and responsible behavior of travelers can lead to promoting sustainable practices and making tourists “co-managers, co-designers and co-creators” of conscious tourism experiences” [86]. By monitoring activity in social media, it is possible to learn about the preferences and behaviors of clients at the stage of planning a tourist trip. “Acquiring such information can be used to create innovative solutions that will help the sustainability of tourism”[87].
The technologies described above are the most relevant at the stage of technological development of tourism 4.0. Solutions for processes, functionality, performance and experience can be realized thanks to digital technologies, devices and interfaces for tourists, respectively. As can be seen in Table 2, a certain digital technology with its tourist devices and interfaces provides useful solutions for processes, functions, operations and experience.
From the above, it follows that the essence of digitalization in tourism is the integration of digital technologies into all aspects of the tourism sector to meet the needs of tourists, on the one hand, and create new sources of income and value creation opportunities, on the other hand. All business operations occurring at the stage of digital development are affected. In addition to digital transformation operations, digitalization opens up opportunities for new business models in the tourism and recreation sector. The implementation of digital technologies in the tourism and recreation sector: artificial intelligence; mobile technologies; cloud services; augmented reality and virtual reality; big data; and social networks, contribute to the restoration of loyalty and the establishment of relationships with partners. Personalization and customization of services significantly increases the efficiency of business in tourism and recreation.
3. Digital Transformation in Russian Tourism Sector
The “Internet mobilization” has become an important trend in Russia over the past ten years. The share of Internet users in Russia has almost doubled in the past decade, from 2010 (49.0%) to 2021 (over 88.2%), most of them go online daily [88]. Historically, the average growth of Internet users1 share for Russia from 1990 to 2023 was 35.75 %2. Thanks to the lower cost of mobile Internet compared to cable and the increasing prevalence of gadgets, more than half (59.2%) of adult Russians could access the Internet outside the home or office using smartphones (compared to 37.6% in 2015). This percentage was even higher among young people living both in the city (more than 87%) and in rural areas (73%) [89]. More than three-quarters (88.21%) of Russian households had access to the Internet in 2021. In 2022, Internet users accounted 90.42% of the population percent, and the latest value from 2023 is 92.25 percent (Figure 1).
However, Russian regions show large disparities in the level of telecommunications and the use of computer information technologies. For example, the penetration of broadband Internet varies significantly, although the International Telecommunications Group emphasizes that this type of Internet connection is one of the most important elements of national infrastructure in the 21st century, along with transport, energy and water infrastructure.
There is a direct dependence of the population's integration into the digital economy, their use of new technologies and mastering digital skills on the age and place of residence. In 2019, 68% of Russians had access to the Internet in rural areas. However, 18.8% of them had never used the Internet, which is almost twice the number of non-users (9%) among city residents. Each tenth Russian citizen had never used the Internet (11.4%), primarily for subjective reasons: lack of interest, lack or relevant skills. 91% of the population who did not use the Internet were people over 50 years old. Though there was substantial overall improvement in 2020-2024, the proportion of elderly and rural residents is still the same. In order to evaluate the current level of digitalization in Russia, an integrated digitalization index was constructed based on the following indicators:
1) Digital mobility (DM), the growth rate of the cloud services market in Russia adopted as an assessment criterion.
2) Digital equality (DE), the share of Internet users in Russia (Figure 1) adopted as an assessment criterion.
3) Digital economy (DE), the growth rate of the e-commerce market in Russia adopted as an assessment criterion.
4) Digital interaction (DI), the growth rate of the data center market in Russia adopted as an assessment criterion.
After selecting the criteria for the four indicators, the criteria were standardized by calculating them all as a percentage for each criterion in 2018-2022. The private digitalization indicator was calculated using the following equation:
Иij = Xij / 100
where Иij is the private digitalization indicator.
Xij is the criterion percentage.
To find the integral digitalization index, the sum of the average private indicator of the four indicators was calculated.
Whenever the percentage exceeds 1%, the level of digitalization assessed as good.
To assess the digital mobility indicator, the growth rate of the cloud services market in Russia was taken as a criterion, as shown in Figure 2. One can see that Russia is seeing an increase in the size of the cloud services market in addition to acceptable growth rates in 2018-2022.
To calculate the private digitalization indicator, the following equation was used:
Иij = Xij / 100
Where Иij is the private digitalization indicator.
Xij is the criterion percentage.
To find the average value of the private digital mobility indicator, the arithmetic mean of the private digitalization indicator for 2018-2022 was calculated,as shown in Table 3.
To calculate the private digitalization indicator, the following equation will be used:
Иij = Xij / 100
Where Иij is the private digitalization indicator.
Xij is the criterion percentage.
To find the average private digital equality indicator, the arithmetic mean of the private digitalization indicator for 2018-2022 was calculated (Table 4).
To assess the digital economy indicator, the growth rate of the Russian e-commerce market was taken as a criterion (Figure 3).
To assess the digital economy indicator, the growth rate of the Russian e-commerce market was taken as a criterion (Figure 3).
To calculate the partial digitalization indicator, the following equation was used:
Иij = Xij / 100
Where Иij is the partial digitalization indicator.
Xij is the criterion percentage.
To find the average value of the private digital economy indicator, the arithmetic mean value of the private digitalization indicator for 2018-2022 was calculated (Table 5).
To assess the digital interaction indicator, the growth rate of the data center market in Russia was taken as a criterion (Figure 4).
To calculate the private digitalization indicator, the following equation will be used:
Иij = Xij / 100
Where Иij is the private digitalization indicator.
Xij is the criterion percentage.
To find the average value of the private digital interaction indicator, the arithmetic mean value of the private digitalization indicator for 2018-2022 was calculated (Table 6).
To obtain an integrated digitalization index, the sum of the average value of four indicators (digital mobility, digital equality, digital economy, digital interaction) was calculated.
It shows that the overall level of digitalization in Russia is 1.87%.
Judging by the above, there is good growth in the approved criteria for four indicators (cloud services market, percentage of Internet users, e-commerce market and data center market), which indicates a good level of digitalization in Russia, reflected in the level of tourism digitalization.
A good example of digitalization in tourism sector are Russian booking systems. The trend was especially noticeable during the 2014 crisis, when a series of large tour operators bankruptcies somehow undermined the authority of the offline sector, and the "be your own tour operator" principle taught Russian tourists to save on tour operator services. Currently, Russian booking systems include many offers and prices for a wide range of hotels, where tourists can compare prices and offers and choose the right option. According to the booking system b2b.ostrovok.ru, many digital projects were created specifically for hotels. For example, Property management systems (PMS) were implemented, which allow automating all cycles of hotel services and business operations, including maid service, synchronization with booking systems, and the formation of financial reports and statistics.
The most widely used cloud systems on the market are Opera and Fidelio from the world leader in their production Micros-Fidelio Corporation, as well as the Hospitality Management System (HMS) application system from Libra. In Russia, the Edelweiss system was developed. Small accommodation facilities can use small-format PMS instead of multifunctional expensive PMS, for example, based on Software as a service (SaaS) technologies. SaaS is a model that is not available on a computer but used through a browser or mobile application by subscription (as much as needed). Thus, the client pays for renting the software.
4. Prospects for the Tourism Services Sector Digitalization in Russia in the Context of Sustainable Development
The Russian Federation has included the concept of responsible tourism in the National Ecological Project and the long-term federal program. The process of developing sustainable tourism in Russia is mainly in the form of ecological and educational tourism popularization, which helps to form a conscious attitude of society to the nature, as well as through environmental volunteering. A number of factors affect the sustainable development of tourism in Russian regions, including the level of tourism potential and infrastructure development, public-private partnerships, and the unique ways in which tourists perceive their opportunities for safe and comfortable recreation [90].
To analyze the prospects for the development of tourism and recreational services in Russia, we relied on the main indicators adopted in the Strategy for the Development of Tourism in the Russian Federation until 2035 adopted in 2019. It aims at creating conditions for the formation and promotion of a "high-quality and competitive tourism product" in the tourism market, strengthening the social role of tourism and ensuring the availability of tourism services, recreation and health improvement for Russians.
The following indicators are adopted in the tourism development strategy:
1. The tourism industry gross added value share in the GDP of the Russian Federation (Figure 5).
2. The number of domestic tourist trips per capita of Russia.
3. Investments in fixed capital in the tourism sector.
Regarding the average number of employees in the tourism sector, according to government statistics, the growth rate here is increasing after 2020, as the growth rate in 2022 reached 109% compared to 2021. In 2023 this percentage increased by 5% compared to 2022 (Figure 6).
The state of the indicator that measures the tourism industry gross added value share in the GDP depends on a group of influencing factors, namely:
1. tourist flow;
2. average number of people employed in the tourism industry.
As for the flow of tourists, according to the Association of Tour Operators, the growth rate of domestic organized tourism in 2022 exceeded the growth rate of the market itself; in 2022, both independent and organized tourist flow increased significantly in a number of constituent entities of the Russian Federation (Table 7).
One should note that 60.7% of the domestic tourist flow is formed by 10 regions (Table 8).
As for the indicator of investment in fixed capital in the tourism sector, according to Rosstat, the growth rate of investment in fixed capital in the Russian tourism sector after 2020 is growing, the investment volume in 2023 reached 954.3 billion US dollars with a growth rate of 11% compared to 2022 (Figure 7).
A number of factors influence the growth of the fixed capital investment index in the Russian tourism sector. The most important factor is investment in digital technologies. The increase in investment in digital technologies in Russia has helped to stimulate investors to invest in the fixed capital of the Russian tourism sector.
Analysis shows that there is growth in the AI market, the data center market and the cloud services market. The market value has exceeded that before the Coronavirus pandemic, which indicates the state's interest in investing in digital technologies, especially AI, then big data, and then cloud services (Figure 8).
One of the most important factors that helped the digital technology market continue to grow, despite the difficult situation that the tourism and recreation services sector is experiencing due to the corona pandemic and Western sanctions, is the good level of digital technologies in Russia.
It is expected that by 2030 the tourism sector share of gross added value in the GDP of the Russian Federation will increase by 53% compared to the level 2023, since the growth rate for 2023 is adopted for all years and is 7.6% (Figure 9).
The number of domestic tourist trips per capita in Russia is expected to increase by 115% by 2030 compared to the 2023 level, the growth rate for 2023 being adopted for all years and is 16.48% (Figure 10).
By 2030, an increase in investments in fixed capital in the tourism sector expected by 77% compared to the level of 2023, since the growth rate for 2023 for all years is adopted and is 11% (Figure 11).
So, the integrated digitalization index in Russia, which amounted to 1.87% based on the analysis of indicators related to the Integrated Index (namely, digital mobility; digital equality; digital economy; digital interaction) showed increasing growth in 2018-2022. We can conclude that the level of tourism services digitalization is appropriate. One can assess the prospects for further digitalization of the tourism services in Russia as promising, based on the positive dynamics of three indicators: the share of gross added value of the tourism sector in the GDP of the Russian Federation; the number of domestic tourist trips per resident; the investments in fixed capital in the tourism sector.
4. Research Methodology
In the focus of our study was development of digital tools in tourism, all regions of the Russian Federation being subject of the research. The study consisted of four blocks.
It is widely accepted that the pace of regional socio-economic systems development is uneven, being the result of a number of subjective and objective factors impact [91,92]. In any single state, there may be territories at different levels of socio-economic development and even at different stages of civilizational transformation [93]. Therefore, to develop solutions for the optimal tourism digital infrastructure spatial distribution, it was appropriate to use statistical methods for assessing the differentiation of Russian regions through digital indicators of tourism infrastructure. The Rosstat data array characterizing the digital indicators of tourism infrastructure in the eight federal districts of the Russian Federation served as the empirical basis of the study; the latest available statistics was for 2018-2021.
To determine the level of the digital tourism infrastructure development, we used the hierarchical cluster analysis method [94] and the k-means method. The Euclidean distance acted as a measure of distance between objects; all indicators used with equal weight. The data processed in the Statistica program are interpreted using tables and figures.
To conduct cluster analysis based on the system of regional digital infrastructure key indicators, we divided them into two groups (Table 9).
5. Results and Discussion
The indicator values for federal districts determined by selecting three regions from each federal district. The ICT subsystem indicators and material indicators values of the federal districts averaged as shown in Table 10.
Average values of the indicator calculated for 2018-2021 by federal districts as shown in Table 11.
The average values of the indicators of the first and second groups by federal districts calculated as shown in Table 12.
Analysis of the dendrogram created using Ward's method suggests the presence of three clusters (Figure 12).

Table 12.
Average values of the indicators of the first and second groups by federal districts.
| Average group of ICT indicators subsystem | Average group of material indicators | |
| Central Federal District | 42.115 | 54.0875 |
| Northwestern Federal District | 42.735 | 51.4975 |
| Southern Federal District | 44.44 | 48.2375 |
| North Caucasian Federal District | 44.08 | 41.2475 |
| Volga Federal District | 40.78 | 52.9125 |
| Ural Federal District | 43.125 | 51.2825 |
| Siberian Federal District | 44.48 | 51.605 |
| Far Eastern Federal District | 45.12 | 51.9375 |
Table 12.
Composition of clusters created using Ward's method.
| No | Number of elements in a cluster | Composition of elements in a cluster |
| 1 | 6 | Central Federal District, Volga Federal District, Northwestern Federal District, Ural Federal District, Siberian Federal District, Far Eastern Federal District |
| 2 | 1 | Southern Federal District |
| 3 | 1 | North Caucasian Federal District |
The first cluster includes federal districts characterized by a high percentage of the ICT subsystem indicator group and the material indicator group. The distance between the first group and the other groups is maximum. The digital infrastructure indicators of the federal districts of the first group and the other federal districts differ significantly (Figure 13).
The second cluster includes federal districts characterized by an average ratio of the ICT subsystem indicator group and the material indicator group. This indicates an acceptable level of digital infrastructure indicators for the Federal District.
The third cluster includes federal districts characterized by a low percentage in the ICT subsystem indicator group and the material indicator group. These federal districts suffer from a low level of digital infrastructure indicators.
Next, we will perform clustering using the k-means method. This method requires a preliminary decision on the number of partitions. We will decide on the number of clusters equal to three (according to Ward's method).
Clustering using the k-means method allowed us to identify the following clusters (Table 13).
The first cluster includes federal districts characterized by a high percentage of the ICT subsystem indicator group and the material indicator group.
The second cluster includes federal districts characterized by an average ratio of the ICT subsystem indicator group and the material indicator group.
The third cluster includes federal districts characterized by a low percentage in the ICT subsystem indicator group and the material indicator group.
A comparison of Table 12 and Table 13 shows that the clusters partially repeat each other. For example, the composition of the third cluster elements is identical. The first cluster created by the k-means method is largely identical in composition to the first cluster created by the Ward method, but includes a smaller number of federal districts. The number of federal districts in the first cluster decreased according to the Ward method from 6 to 4 in the k-means method, and the number of federal districts in the second cluster according to the Ward method increased from 1 to 3 in the k-means method. As for the third cluster, it remains the same as in the two methods, which includes the North Caucasian Federal District, which is the federal district with the lowest percentage of indicators.
Thus, clustering using the Ward method and k-means allowed us to better differentiate the federal district by the group of the information and communication subsystem indicators and the group of material indicators, since the results for the two methods were similar.
Based on the above presented study, we developed a digitalization model for local tourism services (Figure 14).
Based on the analysis using the Integral Index of Regional Digital Infrastructure and cluster analysis of a group of regional digital infrastructure indicators, the main conclusions can be summarized as follows:
1. There is a digital differentiation of the cloud services indicator between the federal districts of the second group and the first group. As for the other indicators, they are almost identical.
2. There is a significant digital differentiation between the digital indicators of the third group districts, represented by the North Caucasian Federal District, and the previous groups.
3. The Human Development Index levels showed a decrease in all federal districts since 2020. The reason for the decline may be related to the corona pandemic and its impact on the Human Development Index, as well as the political situation in Russia.
Federal districts can be divided into three groups, the first group including federal districts with a high level of digitalization, the second - federal districts with an average level of digitalization, the third group - federal districts with a low level of digitalization. Therefore, it is necessary to develop a methodology for assessing and applying digitalization tools in the field of tourism for overcoming the problem of digital differentiation between federal districts.
The proposed methodology consists of a set of sequential steps (Figure 15):
1. Analysis.
1) Analysis of the opportunities and threats of the regional tourism environment. Overview and forecast of the tourism market.
- Global and regional tourist routes and projects;
- tourist visits to the region and destinations;
- the impact of competition on tourism;
- identification of primary and secondary markets, the main factors influencing tourist visits;
- determination of market goals;
- the level of use of household products by the local population;
- determination of the number, type and quality of living conditions of tourist facilities.
- Increasing local tourism products and tourist attractiveness based on available funds, determining channels and strategies for selling tourism products.
2) Analysis of the level of digitalization of the region.
Definition of priority projects for the digital transformation of tourism within the framework of the 2035 tourism development strategy. Within the framework of this strategy, the following priority projects for the digital transformation of the tourism industry should be integrated into digital geoinformation systems:
- Integration of official websites related to tourism with regional information resources and data placement;
- Introduction of a single electronic register of all accommodation facilities, sanitary and hygienic facilities and investment-intensive facilities in the tourism sector;
- Introduction of a system for identifying tour guides working in the tourism sector (automation of tour guide identification using QR code technology).
3) Search for solutions to current problems. Financial analysis.
- Changes and problems of the environment under the influence of tourism and recommendations for their mitigation; environmental protection, conservation programs, recommendations for reducing the impact of ecotourism projects on nature;
- Active investment policy of the state and increasing the investment attractiveness of regions, monitoring the investment situation, government spending on tourism, capital investments in tourism, export of tourism services, foreign direct investment, mutually beneficial cooperation with domestic private investors, financing of investment projects and encouraging initiatives.
2. Goal setting.
Defining the goals and objectives of regional tourism development in the digital economy. Budget planning.
The mission reflects the essence and state of the organizational system, defines the target task, and serves as the basis for elaborating strategic goals. If the mission expresses the essence of the organization's activities, then the specific basic situation in which the organization operates is determined by its goals. In other words, goals are a specific state of a particular characteristic of the organization, its necessary achievements and activities aimed at these achievements.
3. Developing strategies and goals.
Targeted program for the development of regional tourism.
In connection with the status of tourism as a strategic sector of the Russian economy, further improvement of the legislative and regulatory framework in the field of tourism, development of target programs to create favorable conditions for tourism, simplification of visa and registration procedures, improvement of passport and customs control, statistical accounting systems.
4. Strategy for digitalization of the region
- Accelerated development of tourist facilities in regions that meet the needs and demands of tourists: public catering, transport and logistics, information centers, road transport engineering and communications infrastructure, quantitative and qualitative improvement of accommodation facilities of roadside infrastructure along the main tourist routes, as well as the widespread attraction of foreign investment for these purposes.
- Existing and planned accommodation facilities and prospects (quantity, type, location and quality) and measures to improve it. Location of tourist facilities, territories, zones and transport; stages of development; models and programs determining tourist destinations and routes; plans for the promotion and information of tourism among the general population; distribution of powers between the public and private sectors; tourist information support and services.
5. Creating a digital tourism ecosystem. Defining digital tools for tourism development
- Development and implementation of a single tourism space; tourism marketplace;
- Using big data to study customer preferences;
- Developing chatbots using artificial intelligence;
- Using electronic vouchers and online cash registers;
- AR/VR technology;
- Developing tourism applications and landing pages;
- Blockchain technology;
- Internet of things;
- Promotion of services in social networks.
6. Planning and implementing tourism development projects in the digital environment.
- Development program, including cost estimates and performers;
- implementation measures and funding sources;
- tourism development norms and standards;
- technical control over the implementation of the plan and measures to improve it.
Thus, the scientific basis for strategic planning of regional tourism in the context of the digital economy is a multi-level system that allows for the effective organization, management and control of tourism, starting with the process of defining the goal and mission of tourism development.
Based on the developed assessment methodology and conditions for digitalization tools application in tourism in the Russian regions, we propose to create an ecosystem of a digital tourism platform for federal districts with a low level of digitalization. The high degree of competitive advantages of digital platforms is due to two characteristics. Firstly, digital platforms can be optimized simultaneously for integrated and specialized solutions. Secondly, issues of organizing a technological platform and its support can neutralize the influence of the geographical location factor for tourism industry participants.
The main objectives of the regional digital tourism platform development and implementation include:
1) expand access to high-speed broadband and other digital infrastructure for tourism enterprises and visitors in cities, regions and rural areas, tourism management, data exchange and analytics;
2) find human resources with the necessary qualifications, strengthening and developing human potential for effective participation in the new digital ecosystem;
3) support practical innovations and human potential development through the establishment of the Intelligent Tourism Laboratory to encourage dissemination, stimulate tourism business ecosystems and promote digital thinking;
4) create a digital strategy to define target indicators and key results of the tourism system digital transformation, starting from the North Caucasus Federal District;
5) form a big data-based database on key aspects of digitalization for tourism organizations. Targeted and detailed approaches to regulation, financing, investment and incentives should be based on an understanding of the difference between the needs of local digital enterprises and traditional tourism enterprises with low levels of digital penetration.
The digital platform will serve as the region's central data hub, providing information for business strategies and decision-making across the region's tourism value chain, providing tourists with information during their trip based on geolocation information, data analytics and artificial intelligence, as well as plotting routes to iconic places depending on the location of stay. The system has a built-in virtual assistant, which is controlled by artificial intelligence and is able to provide information on destinations by federal districts.
6. Conclusions
In accordance with the purpose and objectives of the study, obtained results allow us to make a number of conclusions.
The essence of digitalization in tourism lies in the integration of digital technologies into all aspects of the tourism sector to meet the needs of tourists, on the one hand, and to create new business models and new sources of income and creating value, on the other hand. The rationale for digitalization is the promising potential that the digital transformation process offers to tourism market actors. The opportunities that digital technologies open up in the tourism industry show two aspects, from consumer point of view, and from tourism services producer point of view. Consumers can minimize efforts to search for a tourism product due to faster and more direct access to offers, knowledge and conditions, as well as protection of their interests. They can receive online consultations, evaluate and select a tourism destination, reduce the costs of using tourism services, enrich their experiences, familiarize themselves with the specifics of a place and assess whether it meets their sustainability requirements. For market actors, digitalization opens up many new opportunities to raise competitiveness. At the same time, due to the use of digital technologies, competition is intensifying, and companies have to keep up with digitalization to stay at the same level.
The success of digitalization is mainly related to the speed of Internet penetration in a country; the more the Internet is available at the level of individuals and companies, the greater the chances of success. Externalities for businesses can be positive (benefits) or negative (costs). Corporate social responsibility is a concept that is becoming increasingly important for the tourism business and its stakeholders. Environmental, social and governance aspects of corporate social responsibility can help improve the economic efficiency of the tourism business. Environmental, social and governance issues are important for stakeholders and customers. Tourism enterprises use corporate social responsibility as a strategic tool to create a favorable perception of stakeholders and customers, while digitalization makes it possible to assess environmental, social and corporate governance risk factors and include them in the decision-making process.
A methodology for assessing and applying digitalization tools in tourism in the Russian regions has been developed which can be further adapted for use in other countries with developing economies. The authors proposed creating an ecosystem of a digital tourism platform for federal districts with a low digital level. The ecosystem development occurs due to the convergence of physical space and the digital system, interaction and implementation of data analytics and other digital technologies. The platform serves as a lever for optimizing the benefits of digital transformation. This is a fundamental shift in organizational thinking. It will help to encourage digital and physical convergence, and thus to achieve the goals of sustainable smart tourism.
Institutional Review Board Statement
Not applicable.
Informed Consent Statement
Not applicable.
Acknowledgments
The research is supported by the grant of the Russian Science Foundation No. 23-78-10042 "Methodology of multilevel integration of economic space and synchronization of innovation processes as a basis for sustainable development of Russian regions (based on the concept of innovative hypercluster)" https://rscf.ru/project/23-78-10042/.
Conflicts of Interest
The authors declare no potential conflict of interest.
| 1 | Internet users are individuals who have used the Internet (from any location) in the last 3 months. The Internet can be used via a computer, mobile phone, personal digital assistant, games machine, digital TV, etc. |
| 2 |
References
- Pencarelli, T. The digital revolution in the travel and tourism industry. Information Technology & Tourism. 2020, 22, 455–476. [Google Scholar] [CrossRef]
- Scheyvens, R.; Cheer, J. Tourism, the SDGs and partnerships. Journal of Sustainable Tourism. 2022, 30, 2271–2281. [Google Scholar] [CrossRef]
- Streimikiene, D.; Svagzdiene, B.; Jasinskas, E.; Simanavicius, A. Sustainable tourism development and competitiveness: The systematic literature review. Sustainable development. 2021, 29, 259–271. [Google Scholar] [CrossRef]
- Wang, M. Applying Internet information technology combined with deep learning to tourism collaborative recommendation system. 2020. [CrossRef]
- Hsu S. The Role of Technology in Transforming the Travel Experience. International Journal of Business Management and Visuals. 2021. 4(2). https://ijbmv.com/index.php/home/article/view/30.
- Giotis, G.; Papadionysiou, E. The role of managerial and technological innovations in the tourism industry: a review of the empirical literature. Sustainability. 2022, 14, 5182. [Google Scholar] [CrossRef]
- Morrison, A. Hospitality and travel marketing . Routledge. 2022, 5, 674. [Google Scholar] [CrossRef]
- Madzík, P.; Falát, L.; Copuš, L.; Valeri, M. Digital transformation in tourism: bibliometric literature review based on machine learning approach. European Journal of Innovation Management. 2023, 26, 177–205. [Google Scholar] [CrossRef]
- Rifkin, J. The biotech century: Harnessing the gene and remaking the world. Penguin. 1999.
- Rifkin, J. The age of access: The new culture of hypercapitalism. Where all of life is a paid for experience. J. P. Tarcher. 2001. [Google Scholar]
- Du Pisani, J. Sustaina development–historical roots of the concept. Environmental sciences. 2006, 3, 83–96. [Google Scholar] [CrossRef]
- McNeill, D. The concept of sustainable development. Development Studies and Political Ecology in a North South Perspective. 2004, 5, 26–46. [Google Scholar] [CrossRef]
- Hariram, N.; Mekha, K.; Suganthan, V.; Sudhakar, K. Sustainalism: An integrated socio-economic-environmental model to address sustainable development and sustainability. Sustainability. 2023, 15, 10682. [Google Scholar] [CrossRef]
- Bobylev, S.; Grigoryev, L. In search of the contours of the post-COVID Sustainable Development Goals: The case of BRICS. BRICS Journal of Economics. 2020, 1, 4–24. [Google Scholar] [CrossRef]
- De Lucia, C.; Pazienza, P.; Balena, P.; Caporale, D. Exploring local knowledge and socio-economic factors for touristic attractiveness and sustainability. International Journal of Tourism Research. 2020, 22.1, 81–99. [Google Scholar] [CrossRef]
- Fitri, A. Khusnul B., Susilowanto D., and Maulida P.R. Sustainable tourism performance based on tourist clusters: evidence from Madura, Indonesia. E3S Web of Conferences. 2024, (499), 01007. [CrossRef]
- Goffi, G.; Cucculelli, M.; Masiero, L. Fostering tourism destination competitiveness in developing countries: The role of sustainability. Journal of cleaner production. 2019, 209, 101–115. [Google Scholar] [CrossRef]
- Cucculelli, M.; Goffi, G. Does sustainability enhance tourism destination competitiveness? Evidence from Italian Destinations of Excellence. Journal of Cleaner Production. 2016, 111, 370–382. [Google Scholar] [CrossRef]
- Falatoonitoosi, E.; Schaffer, V.; Kerr, D. Does sustainable tourism development enhance destination prosperity? Journal of Hospitality & Tourism Research. 2022, 46.5: 1056-82. [CrossRef]
- Zhu, L.; Zhan, L.; Li, S. Is sustainable development reasonable for tourism destinations? An empirical study of the relationship between environmental competitiveness and tourism growth. Sustainable Development. 2021, 29.1, 66–78. [Google Scholar] [CrossRef]
- Erol, I.; Onder, I.; Tarik, D.; Oztel, A.; Cory, S.; Yorulmaz, A.S. Improving sustainability in the tourism industry through blockchain technology: Challenges and opportunities. Tourism Management. 2022, 93, 104628. [Google Scholar] [CrossRef]
- Novelli, M.; Schmitz, B.; Spencer, T. Networks, clusters and innovation in tourism: A UK experience. Tourism management. 2006. 27.6: 1141-52. [CrossRef]
- Azmi, E.; Rose, C.; Awang, R.A.; Abas, A. Innovative and competitive: A systematic literature review on new tourism destinations and products for tourism supply. Sustainability. 2023, 15, 1187. [Google Scholar] [CrossRef]
- Banerjee, A.V.; Duflo, E. Good economics for hard times. PublicAffairs. 2019. [Google Scholar]
- Porter, M. Location, competition, and economic development: Local clusters in a global economy. Economic development quarterly. 2000, 14.1, 15–34. [Google Scholar] [CrossRef]
- Porter, M.E. Clusters and the New Economics of Competition. Harvard Business Review. 1998, 76, 77–90. [Google Scholar]
- Shiposha, V. The role of clusters in modern global economy. Three Seas Economic Journal. 2020, 1.2, 67–70. [Google Scholar] [CrossRef] [PubMed]
- Ayele, L.; Singh, A. Tourism Value Chain, Quality Tourism Experience and Competitive Advantage: Evidence from Star-Rated Hotels in Ethiopia. Geo Journal of Tourism and Geosites. 2024, 54, 831–841. [Google Scholar] [CrossRef]
- Oye, N.D.; Okafor, C.I.; Kinjir, S. Sustaining tourism destination competitiveness using ICT in developing countries. International Journal of Computer and Information Technology. 2013, 2.1, 48–56. [Google Scholar] [CrossRef]
- Abdin, M.J.; Rahman, M.M. Model for cluster development. International Journal of Economics, Finance and Management Sciences. 2015, 3, 358–366. [Google Scholar] [CrossRef]
- Delgado M., Porter M. Clusters and the Great Recession. 2021. [CrossRef]
- Porter M. The Competitive Advantage of Nations. N.Y.: The Free Press. 1990.
- Sölvell, O.; Williams, M. Building the cluster commons: an evaluation of 12 cluster organizations in Sweden 2005-2012. 2013. Ivory Tower Publishers.
- Legner, C.; Eymann, T.; Hess, T.; Matt, C.; Böhmann, T.; Drews, P.; Mädche, A.; Urbach, N.; Ahlemann, F. Digitalization: opportunity and challenge for the business and information systems engineering community. Business & information systems engineering 2017, 59, 301–308. [Google Scholar] [CrossRef]
- Hanelt, A.; Bohnsack, R.; Marz, D.; Marante, C.A. A systematic review of the literature on digital transformation: Insights and implications for strategy and organizational change. Journal of Management Studies. 2021, 58.5, 1159–1197. [Google Scholar] [CrossRef]
- Frenzel, A.; Muench, J.; Bruckner, M.; Veit, D. Digitization or digitalization?–Toward an understanding of definitions, use and application in IS research. AMCIS 2021 Proceedings 18. 2021. URL: https://aisel.aisnet.org/amcis2021/adv_info_systems_general_track/adv_info_systems_general_track/18.
- Pricope, A.P.; Codruta, A.B. The Covid-19 Pandemic: An Accelerator of Digitalisation in Tourism. Bulletin of the Transilvania University of Brasov. Series V: Economic Sciences 2021, 19–26. [Google Scholar] [CrossRef]
- Sheresheva, M.Y.; Oborin, M.S. Coronavirus and tourism: is there light at the end of the tunnel? Population and Economics. 2022, 6.443-61. [CrossRef]
- Hjalager, A.M. A review of innovation research in tourism. Tourism management. 2010, 31.1, 1–12. [Google Scholar] [CrossRef]
- Gomezelj, D. A systematic review of research on innovation in hospitality and tourism. International journal of contemporary hospitality management. 2016, 28.3: 516-58. [CrossRef]
- Kuščer, K.; Mihalič, T.; Pechlaner, H. Innovation, sustainable tourism and environments in mountain destination development: a comparative analysis of Austria, Slovenia and Switzerland. Journal of Sustainable Tourism. 2017, 25, 489–504. [Google Scholar] [CrossRef]
- Sheresheva, M.Y.; Polukhina, A.N.; Oborin, M.S. Marketing issues of sustainable tourism development in Russian regions. Journal of Tourism, Heritage & Services Marketing. 2020, 6.1, 33–38. [Google Scholar] [CrossRef]
- Shodiyev, K. Scientific and practical aspects of sustainable development of tourism in an innovative economy. Miasto Przyszłości. 2022, 24, 307–311. [Google Scholar] [CrossRef]
- Gössling, S. Technology, ICT and tourism: from big data to the big picture. Journal of Sustainable Tourism. 2020, 29.5, 849–858. [Google Scholar] [CrossRef]
- Katsoni V., Spyriadis T. Cultural and tourism innovation in the digital era. Springer International Publishing. 2020. [CrossRef]
- Gurov, I. Digitalization and predictability in the BRICS countries: what can be learned from information about the dynamics of stock prices. BRICS Journal of Economics. 2024, 5, 69–82. [Google Scholar] [CrossRef]
- Marino, A.; Pariso, P. E-tourism: How ICTs help the local tourist district drive economic vitality. The case of Campania, Italy. International Journal of Innovation and Technology Management. 2021, 18.03, 2150009. [Google Scholar] [CrossRef]
- Sheresheva, M.; Efremova, M.; Valitova, L.; Polukhina, A.; Laptev, G. Russian tourism enterprises’ marketing innovations to meet the COVID-19 challenges. Sustainability. 2021, 13.7, 3756. [Google Scholar] [CrossRef]
- Cairncross, F. The Death of Distance: How the Communications Revolution Will Change Our Lives. Harvard, Business School Press, 2001. [Google Scholar]
- Koch, T.; Windsperger, J. Seeing through the network: Competitive advantage in the digital economy. Journal of Organization Design 2017, 6, 1–30. [Google Scholar] [CrossRef]
- Treivish, A.I. Unevenness and structural diversity of the economy’s spatial development as a scientific problem and Russian reality. Regional Research of Russia. 2020, (10): 143-55. [CrossRef]
- Cusumano, M.; Gawer, A.; Yoffie, D. The business of platforms: Strategy in the age of digital competition, innovation, and power. Vol. 320. New York: Harper Business. 2019. [CrossRef]
- Parker, G.; Van Alstyne, M.; Jiang, X. Platform ecosystems. MIS quarterly. 2017, 41.1, 255–266. [Google Scholar] [CrossRef]
- Sheresheva, M.; Savelyev, I.; Nadzharyan, N.; Kudryavtsev, A. Digital platforms in hospitality business. In. In The International Scientific and Practical Forum “Industry. Science. Competence. Integration”; Springer International Publishing: Cham, 2019; pp. 83–90. [Google Scholar]
- Law, R.; Chen, S. Developments and implications of tourism information technology: a horizon 2050 paper. Tourism Review. 2024. [Google Scholar] [CrossRef]
- Lee, P.; Hunter, W.; Chung, N. Smart tourism city: Developments and transformations. Sustainability. 2020, 12.10, 3958. [Google Scholar] [CrossRef]
- Molina-Collado, A.; Gómez-Rico, M.; Sigala, M.; Molina, M.V.; Evangelina, A.; Salinero, Y. Mapping tourism and hospitality research on information and communication technology: a bibliometric and scientific approach. Information Technology & Tourism. 2022, 24.2: 299-340. [CrossRef]
- Colladon, A.F.; Guardabascio, B.; Innarella, R. Using social network and semantic analysis to analyze online travel forums and forecast tourism demand. Decision Support Systems. 2009, 123, 113075. [Google Scholar] [CrossRef]
- Gal-Tzur, A.; Shirly, B.L.; Shiftan, Y. Using question & answer forums as a platform for improving transport-related information for tourists. Journal of Travel Research. 2020, 59.7, 1221–1237. [Google Scholar] [CrossRef]
- Erdem, A.; Şeker, F. Tourist experience and digital transformation. Handbook of research on digital communications, Internet of Things, and the future of cultural tourism. 2022. IGI Global: 103-120v. [CrossRef]
- Lam, P. Analysing the functions of online destination forums through a corpus-assisted discourse-analytic approach. Pragmatics and Society. 2021, 12.2, 243–265. [Google Scholar] [CrossRef]
- Verma, S.; Warrier, L.; Brajesh, B.; Mehta, S. Past, present, and future of virtual tourism-a literature review. International Journal of Information Management Data Insights. 2022, 2.2: 100085. [CrossRef]
- Hadjielias, E.; Christofi, M.; Christou, P.; Drotarova, M. Digitalization, agility, and customer value in tourism. Technological Forecasting and Social Change. 2022, 175: 121334. [CrossRef]
- Sabbioni, A.; Villano, T.; Corradi, A. An architecture for service integration to fully support novel personalized smart tourism offerings. Sensors. 2022, 22.4, 1619. [Google Scholar] [CrossRef] [PubMed]
- Tandafatu, N.K.; Ermilindac, L.; Darkel, Y.B. Digital Transformation in Tourism: Exploring the Impact of Technology on Travel Experiences. International Journal of Multidisciplinary Approach Sciences and Technologies. 2024, 1.1, 55–64. [Google Scholar] [CrossRef]
- Xia, W. Digital transformation of tourism industry and smart tourism recommendation algorithm based on 5G background. Mobile Information Systems. 2022, 2022.1, 4021706. [Google Scholar] [CrossRef]
- Madanaguli, A.; Shalini, S.; Alberto, F.; Dhir, A. Corporate social responsibility and sustainability in the tourism sector: A systematic literature review and future outlook. Sustainable Development. 2022, 30.3, 447–461. [Google Scholar] [CrossRef]
- Rodrigues, P.; Borges, A.P.; Vieira, E.P. 2021. Corporate social responsibility image and emotions for the competitiveness of tourism destinations. Journal of Place Management and Development. 2021, 14.2, 134–147. [Google Scholar] [CrossRef]
- Pannee, S.; Pothipassa, P. Integrating Generative AI and IoT for Sustainable Smart Tourism Destinations. Sustainability. 2024, 16.17, 7435. [Google Scholar] [CrossRef]
- Liang C., Bharanidharan S., Sami A., Karim A., Islam A., Mazdak Z., Kavianpour S.,N.B.Idris. Intrusion Detection System for the Internet of Things Based on Blockchain and Multi-Agent System. Electronics. 2020, 9: 1120. [CrossRef]
- Novera, C.N.; Zobayer, A.; Rafsanjany, K.; Peter, W.; Azad, M. Internet of Things (IoT) in smart tourism: a literature review. Spanish Journal of Marketing-ESIC. 2022, 26, 325–44. [Google Scholar] [CrossRef]
- Rejeb, A.; Rejeb, K. Blockchain technology in tourism: Applications and possibilities. World Scientific News. 2019, 137, 119–144. https://ssrn.com/abstract=3480457.
- Nam, K.; Christian, D.; Prakash, C.; Khan, M.S. Blockchain technology for smart city and smart tourism: latest trends and challenges. Asia Pacific Journal of Tourism Research. 2021, 26.4: 454-68. [CrossRef]
- Rashideh, W. Blockchain technology framework: Current and future perspectives for the tourism industry. Tourism Management. 2020, 80, 104125. [Google Scholar] [CrossRef]
- Tyan, I.; Mariemma, Y.I.; Guevara-Plaza, A. Blockchain technology for smart tourism destinations. Sustainability 2020, 12.22, 9715. [Google Scholar] [CrossRef]
- Çınar, K. Role of mobile technology for tourism development. The emerald handbook of ICT in tourism and hospitality. 2020, 273–288. [Google Scholar]
- Wang, G. Innovation and development of rural leisure tourism industry using mobile cloud IOT computing. Wireless Communications and Mobile Computing. 2021, 1, 6211063. [Google Scholar] [CrossRef]
- Srinivaasan, G.; Kabia, S.K. Role of Smartphones in Destination Promotion and Its Impact on Travel Experience. International Journal of Hospitality & Tourism Systems 2020, 13.1, 22. [Google Scholar]
- Soonthodu, S.; Wahab, I.N. Innovative technology uses in sustainable destination management in Asia. Handbook of technology application in tourism in Asia. 2022, 1203–1225. [Google Scholar] [CrossRef]
- Baran, Z.; Baran, H. The future of digital tourism alternatives in virtual reality." Handbook of Research on Digital communications, internet of things, and the future of cultural tourism. 2022, 58-84. [CrossRef]
- Jude, O.; Ukekwe, C. Tourism and virtual reality (VR) in developing nations. African Journal of Hospitality, Tourism and Leisure 2020, 9.2, 1–16. [Google Scholar]
- Srivastava, A.; Srivastava, N.; S Saha. Navigating the Metaverse: Opportunities and Challenges in Tourism." Service Innovations in Tourism: Metaverse, Immersive Technologies, and Digital Twin.2024,129-49. [CrossRef]
- Fan, X.; Xinyu, J.; Deng, N. Immersive technology: A meta-analysis of augmented/virtual reality applications and their impact on tourism experience." Tourism Management. 2022, 104534. [CrossRef]
- Stappung, Y.A.; Cartes, C.; Jego, J.; Reyes-Suárez, L.; Barriga, J.A.; Besoain, F. Developing 360 virtual tours for promoting tourism in natural parks in Chile. Sustainability. 2023, 15.22, 16043. [Google Scholar] [CrossRef]
- O’Day, E.B.; Heimberg, R.G. Social media use, social anxiety, and loneliness: A systematic review. Computers in Human Behavior Reports. 2021, 3, 100070. [Google Scholar] [CrossRef]
- Shen, S.; Sotiriadis, M.; Zhou, Q. Could smart tourists be sustainable and responsible as well? The contribution of social networking sites to improving their sustainable and responsible behavior." Sustainability. 2020, 12.4, 1470. [CrossRef]
- Beata, H.; Karasek, A.; Zdonek, I. Social media usage by different generations as a tool for sustainable tourism marketing in society 5.0 idea. Sustainability 2021, 13.3, 1018. [Google Scholar]
- Trofimova, I.M. Availability and use of the internet network by the population in the regions. Reforming Russia. 2023, 21, 384–406. [Google Scholar]
- Zemtsov, S.; Demidova, K.; Kichaev, D. Internet diffusion and interregional digital divide in Russia: trends, factors, and the influence of the pandemic. 2022, 14.4, 57-78. [CrossRef]
- Polukhina, A.; Sheresheva, M.; Napolskikh, D.; Lezhnin, V. Regional Tourism Ecosystem as a Tool for Sustainable Development during the Economic Crisis. Sustainability. 2024, 16.2, 884. [Google Scholar] [CrossRef]
- Guo, L.; Li, P.; Zhang, J.; Xiao, X.; Peng, H. Do socio-economic factors matter? A comprehensive evaluation of tourism eco-efficiency determinants in China based on the Geographical Detector Model. Journal of Environmental Management. 2022, 320, 115812. [Google Scholar] [CrossRef]
- Szirmai, A. The dynamics of socio-economic development: an introduction . Cambridge University Press. 2005. [Google Scholar] [CrossRef]
- Churski, P.; Herodowicz, T.; Konecka-Szydłowska, B.; Perdał, R. European regional development: Contemporary regional and local perspectives of socio-economic and socio-political changes. Springer Nature. 2021. [CrossRef]
- Ward, J. Hierarchical grouping to optimize an objective function. Journal of the American Statistical Association. 1963, 58, 236–244. [Google Scholar] [CrossRef]
Figure 1.
Internet users in Russia, % of the population. Source: https://www.theglobaleconomy.com/Russia/Internet_users/.
Figure 1.
Internet users in Russia, % of the population. Source: https://www.theglobaleconomy.com/Russia/Internet_users/.
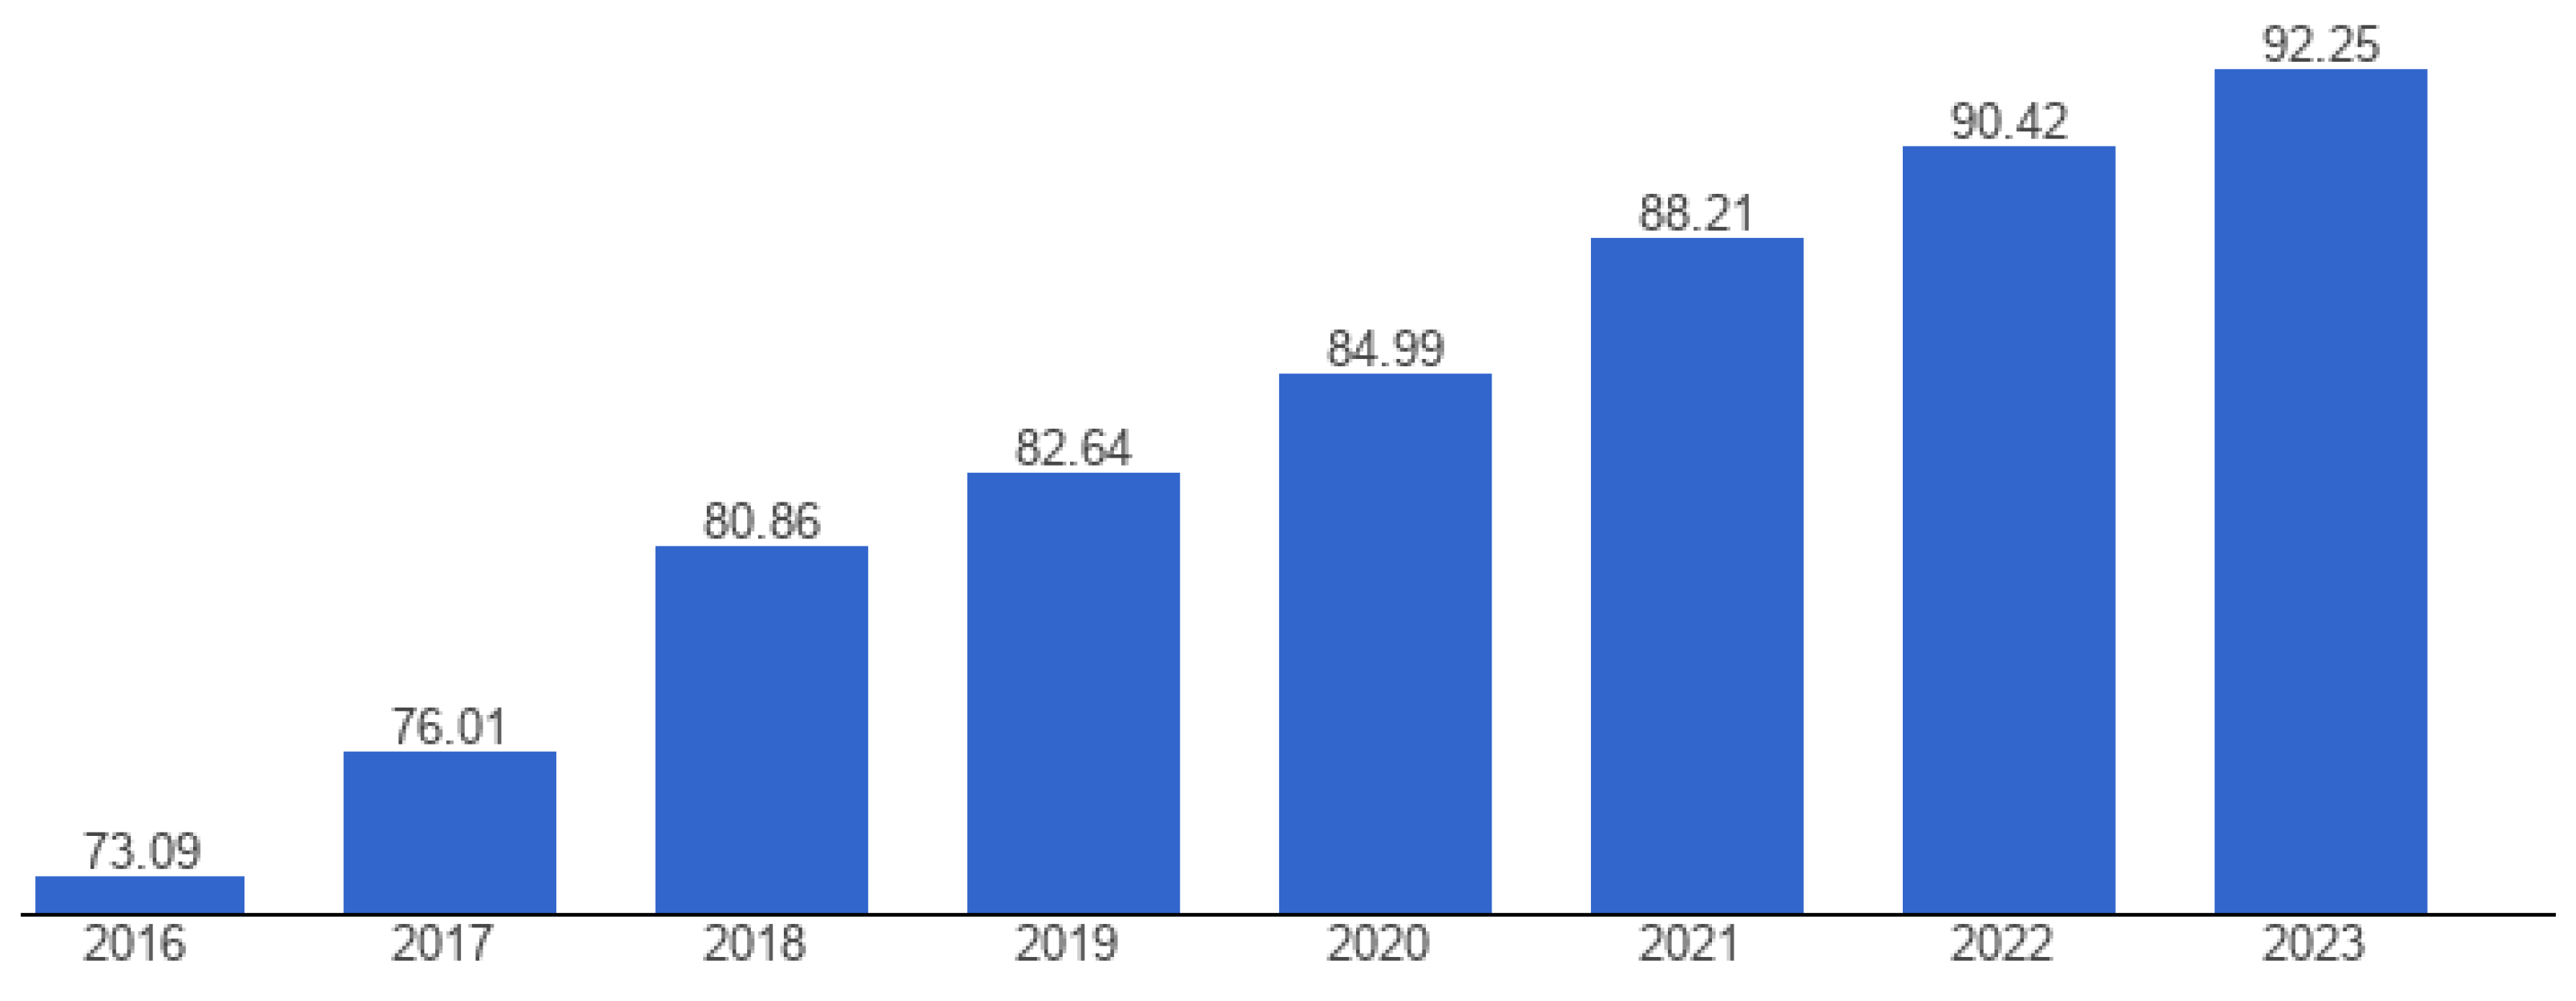
Figure 2.
The Russian cloud services market. Source: https://survey.iksconsulting.ru/page32257739.html.
Figure 2.
The Russian cloud services market. Source: https://survey.iksconsulting.ru/page32257739.html.
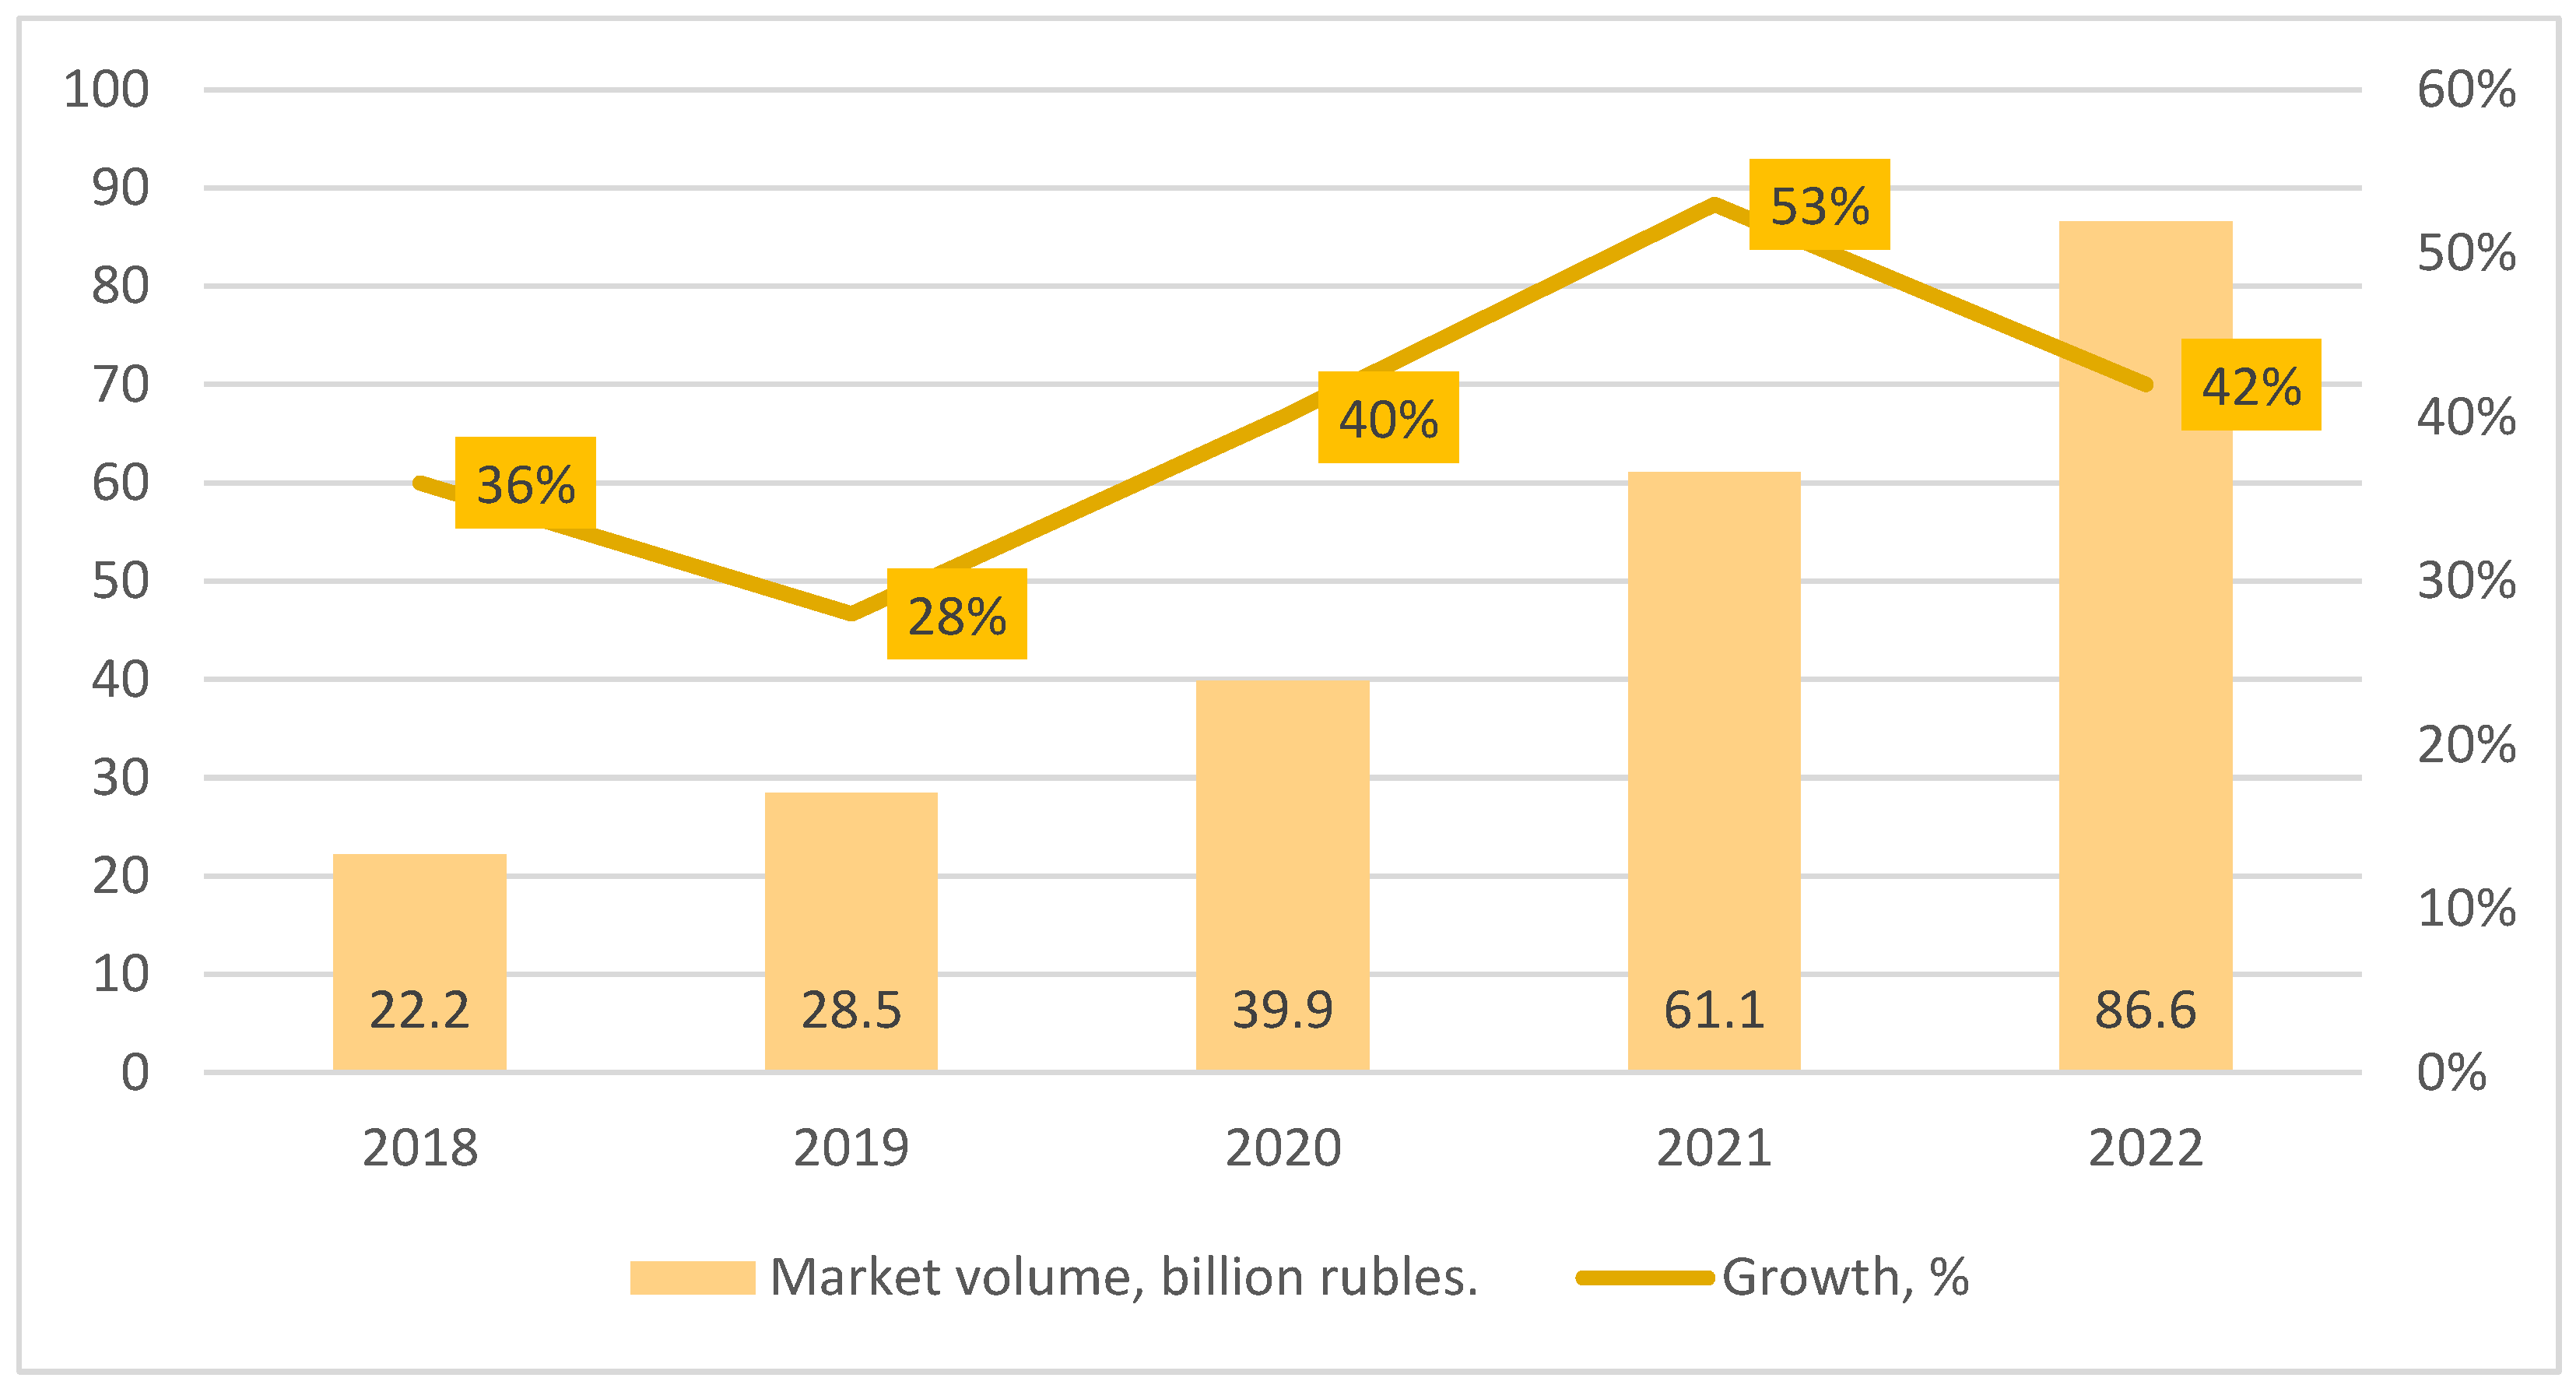
Figure 3.
The Russian e-commerce market. Source: https://tadviser.com/index.php/Article:Internet_trading_%28Russian_market%29.
Figure 3.
The Russian e-commerce market. Source: https://tadviser.com/index.php/Article:Internet_trading_%28Russian_market%29.
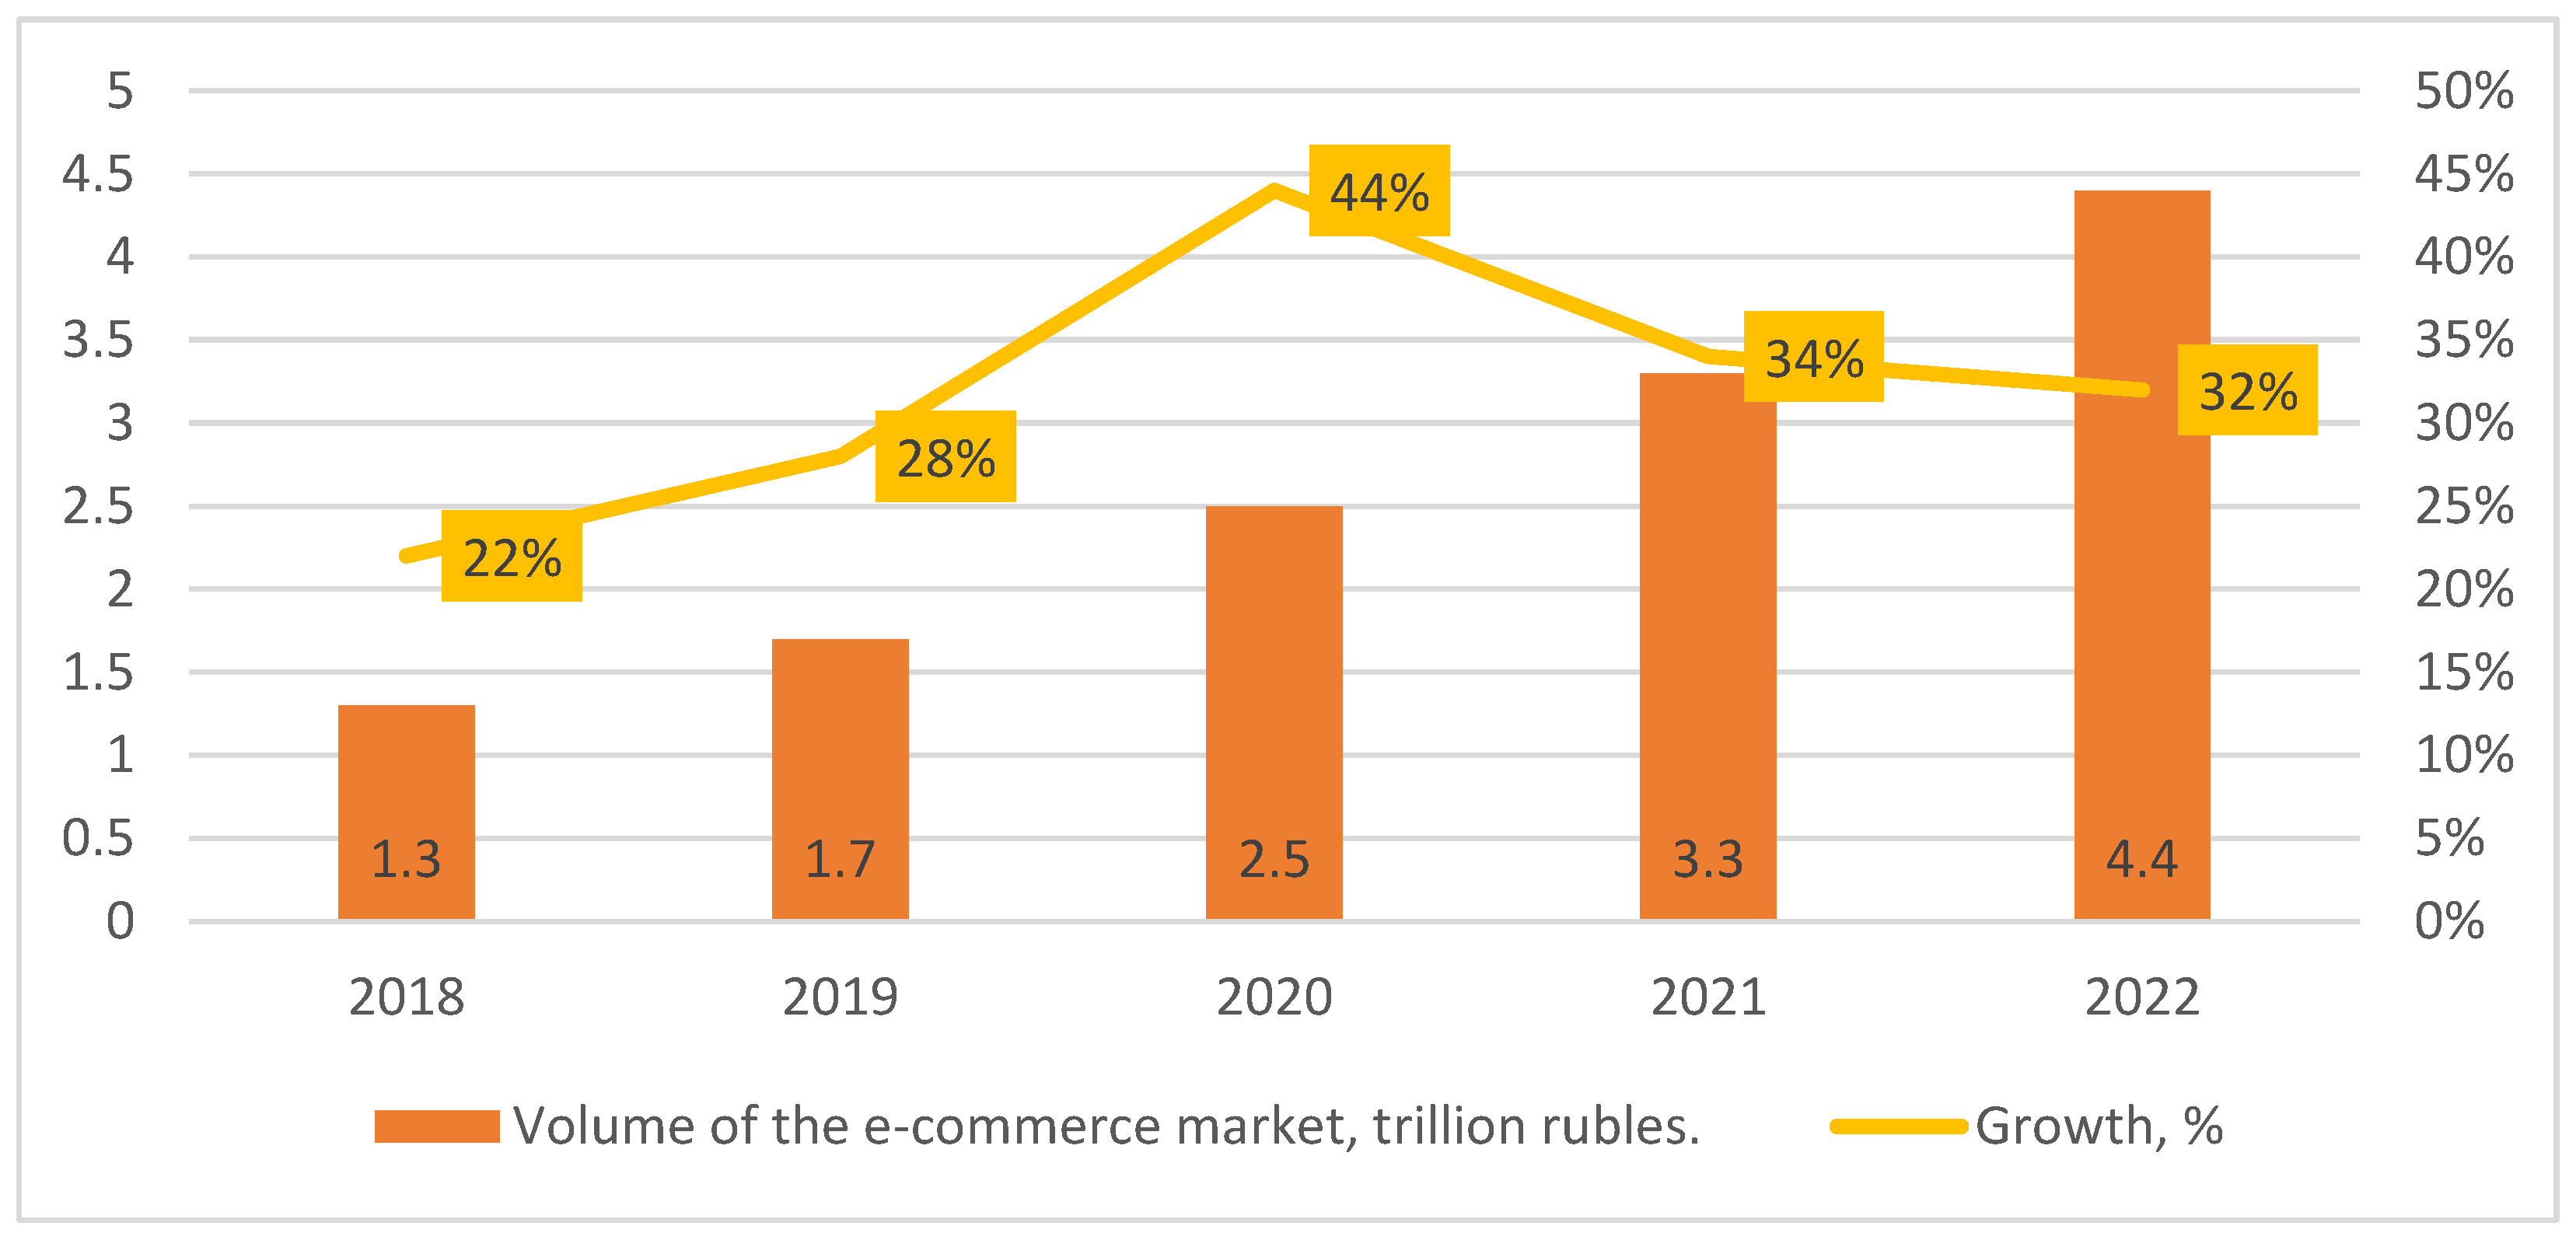
Figure 4.
The Russian data center market. Source: https://businesstat.ru/images/demo/data_centers_russia_demo_businesstat.pdf .
Figure 4.
The Russian data center market. Source: https://businesstat.ru/images/demo/data_centers_russia_demo_businesstat.pdf .
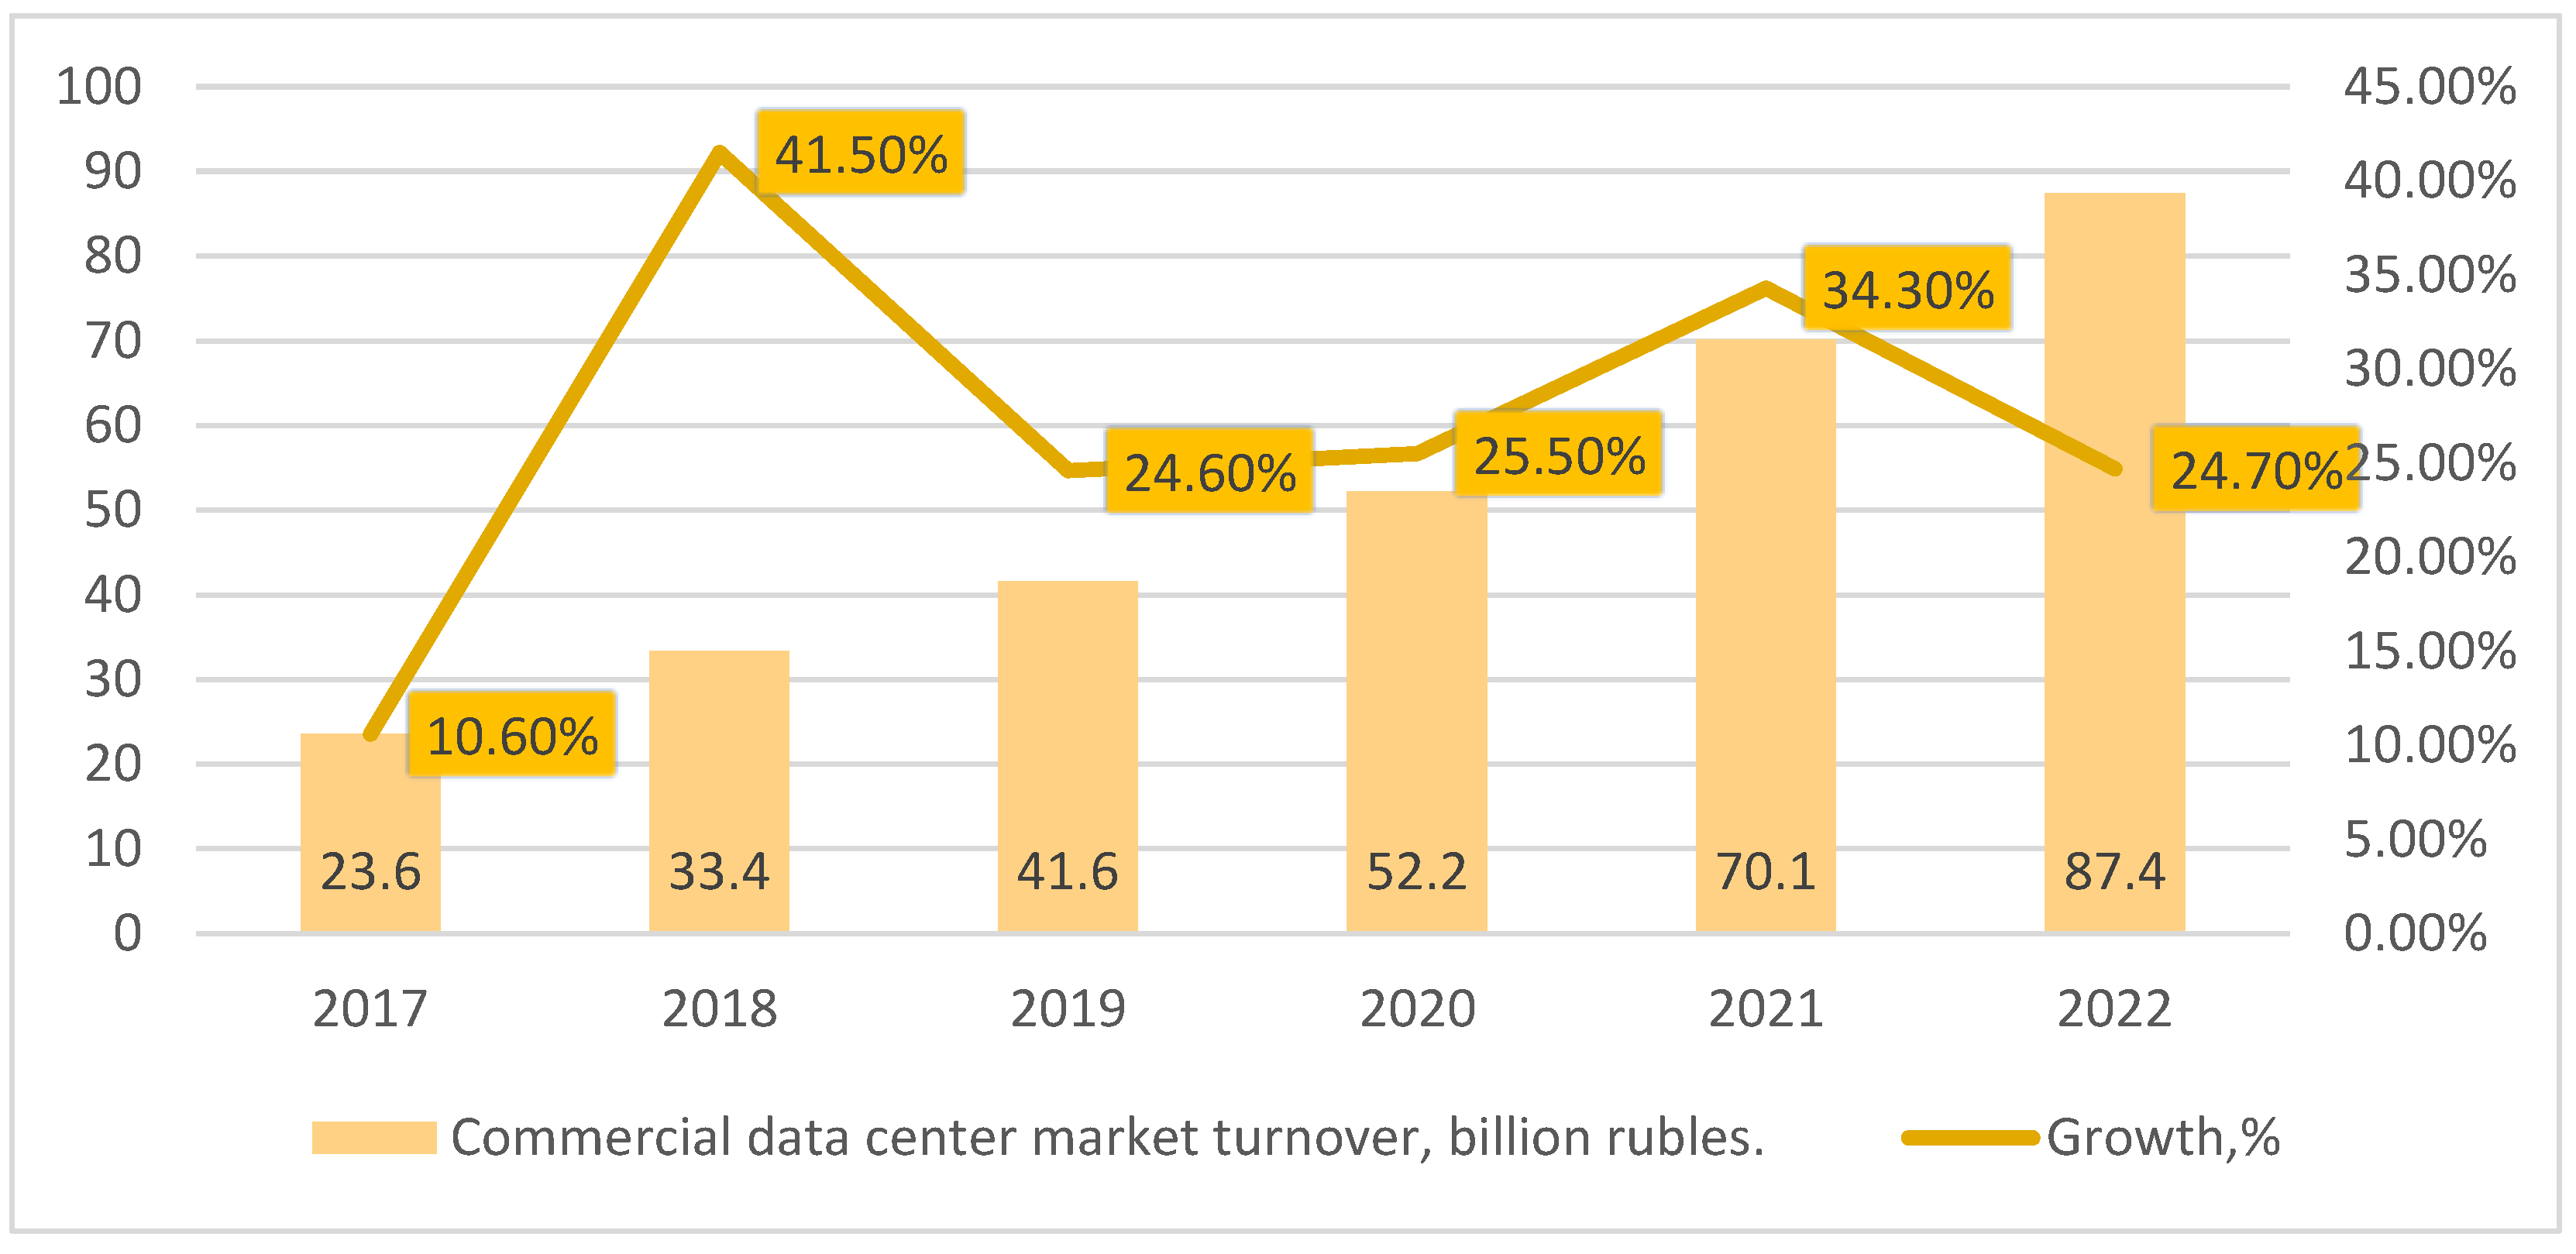
Figure 5.
The tourism industry gross added value share in the GDP of the Russian Federation, 2017-2023, %. Source: calculated based on the Rosstat data (https://rosstat.gov.ru/statistics/turizm).
Figure 5.
The tourism industry gross added value share in the GDP of the Russian Federation, 2017-2023, %. Source: calculated based on the Rosstat data (https://rosstat.gov.ru/statistics/turizm).
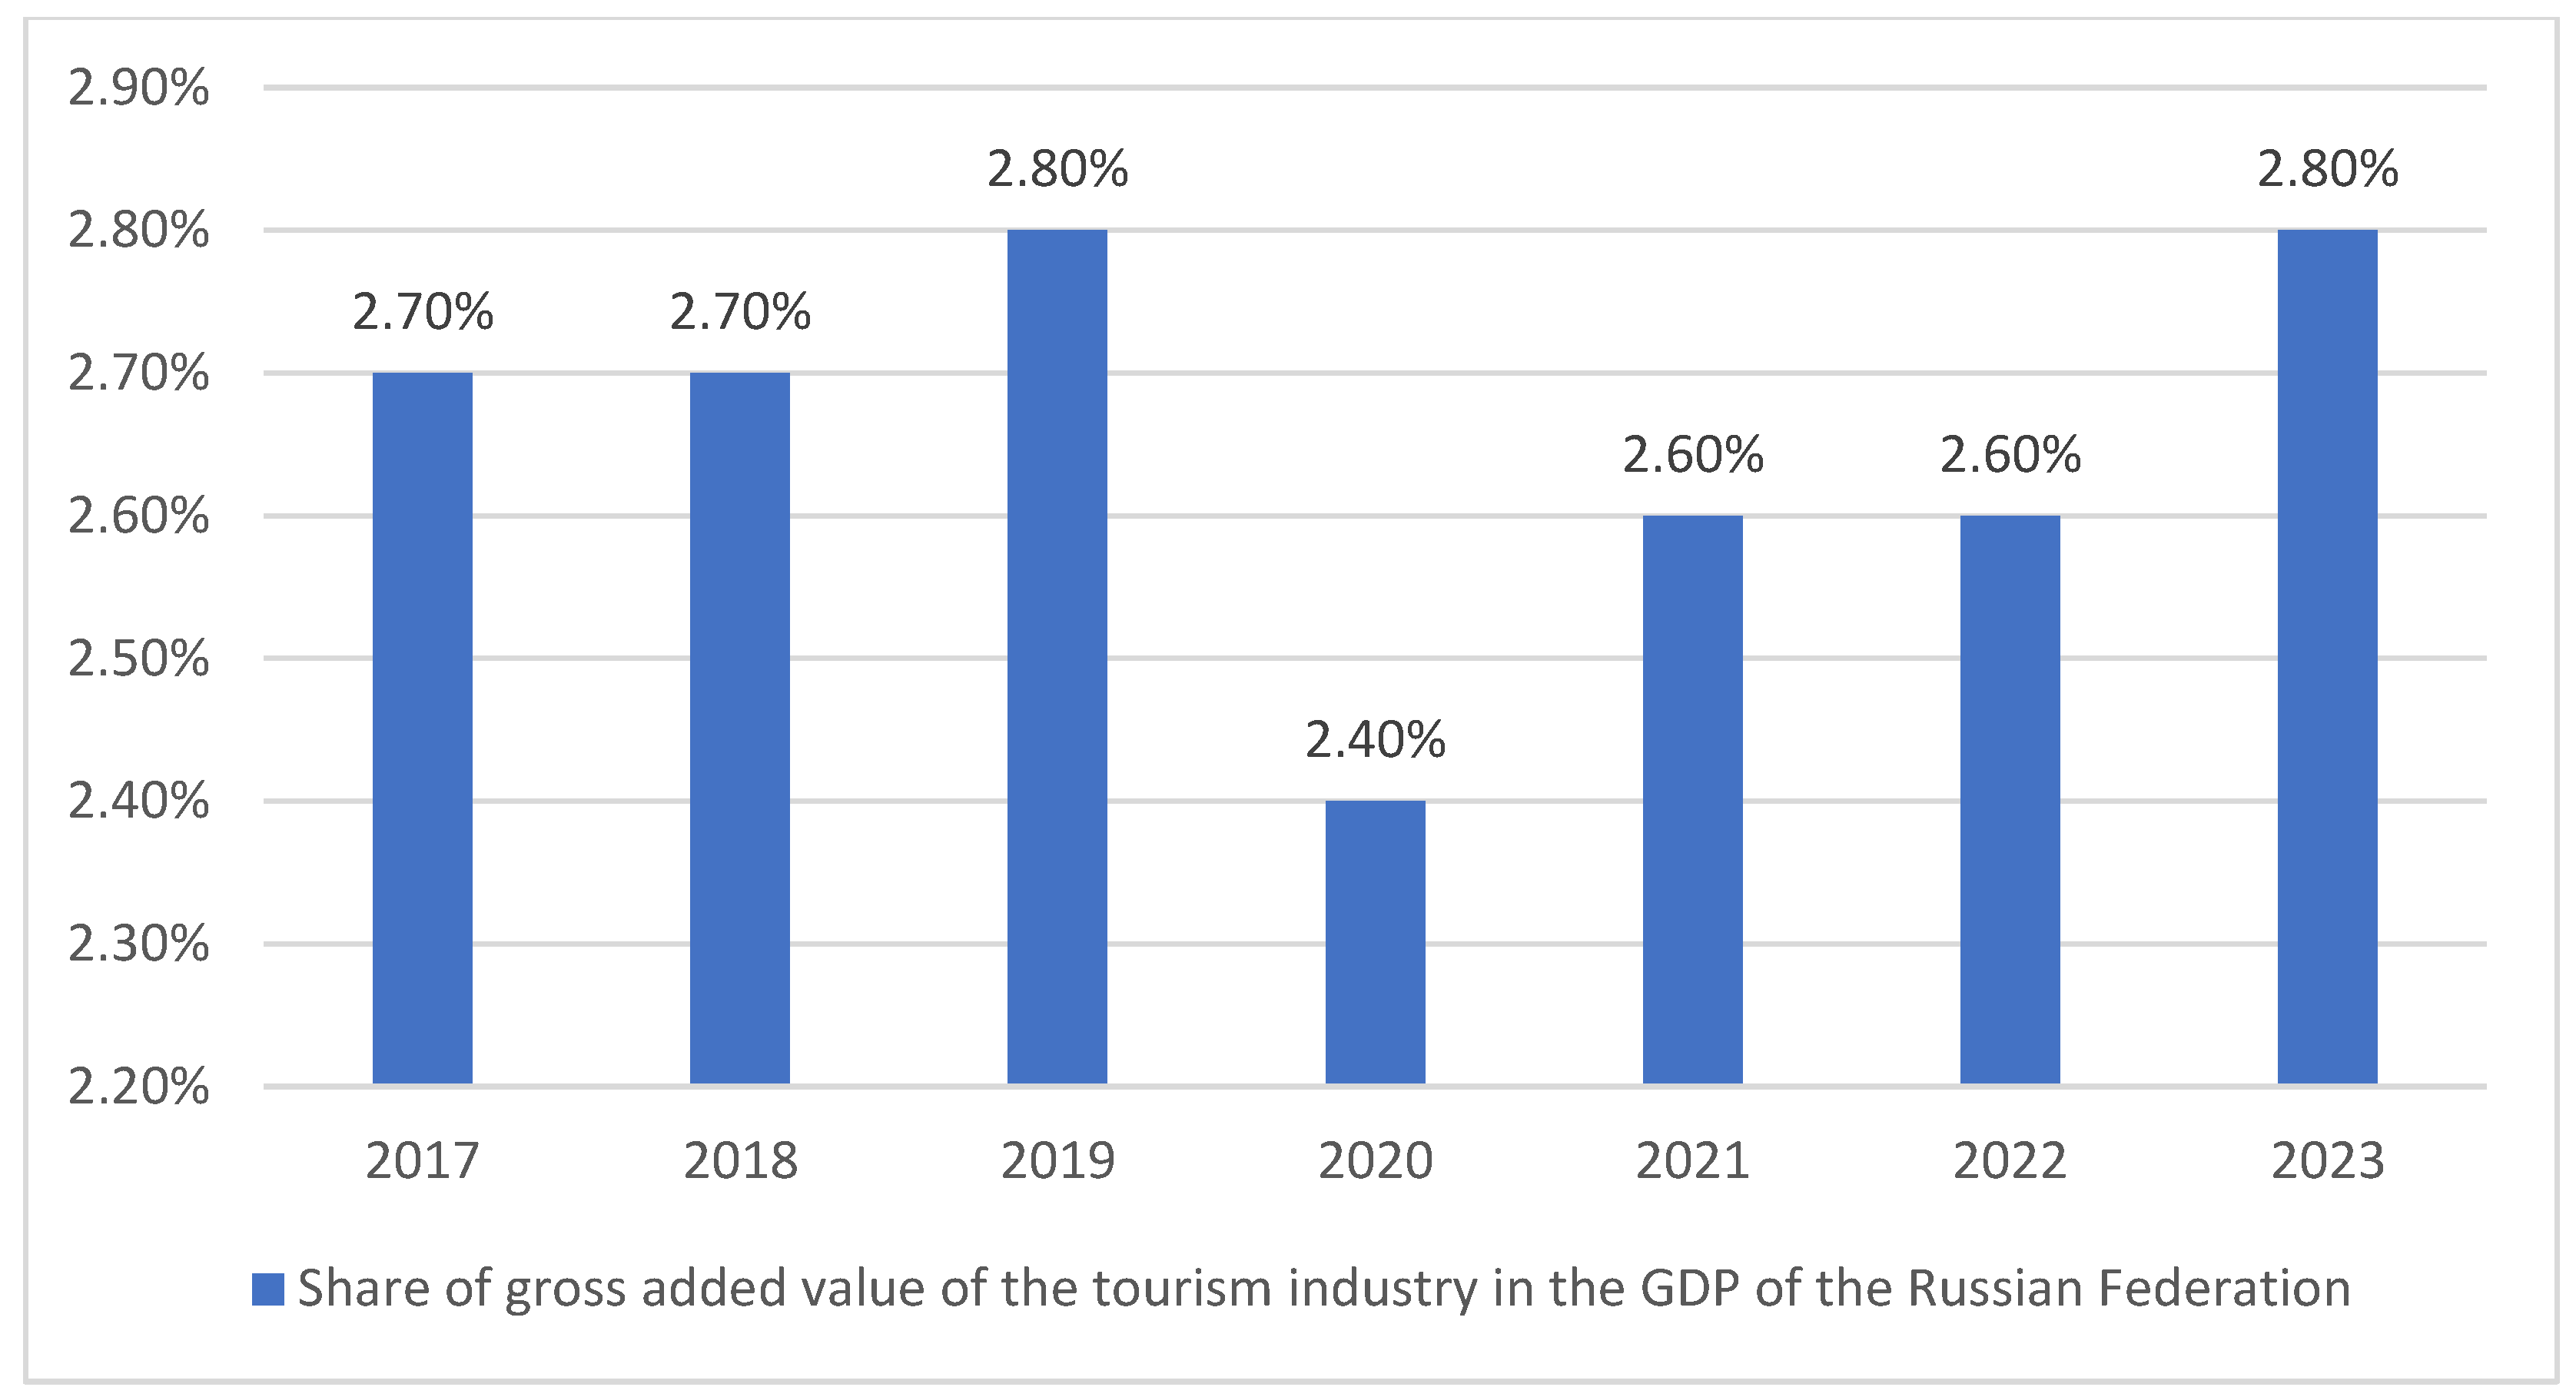
Figure 6.
Average number of employees in the Russian tourism industry, 2018- 2023, %. Source: calculated based on the Rosstat data (https://rosstat.gov.ru/statistics/turizm)
Figure 6.
Average number of employees in the Russian tourism industry, 2018- 2023, %. Source: calculated based on the Rosstat data (https://rosstat.gov.ru/statistics/turizm)
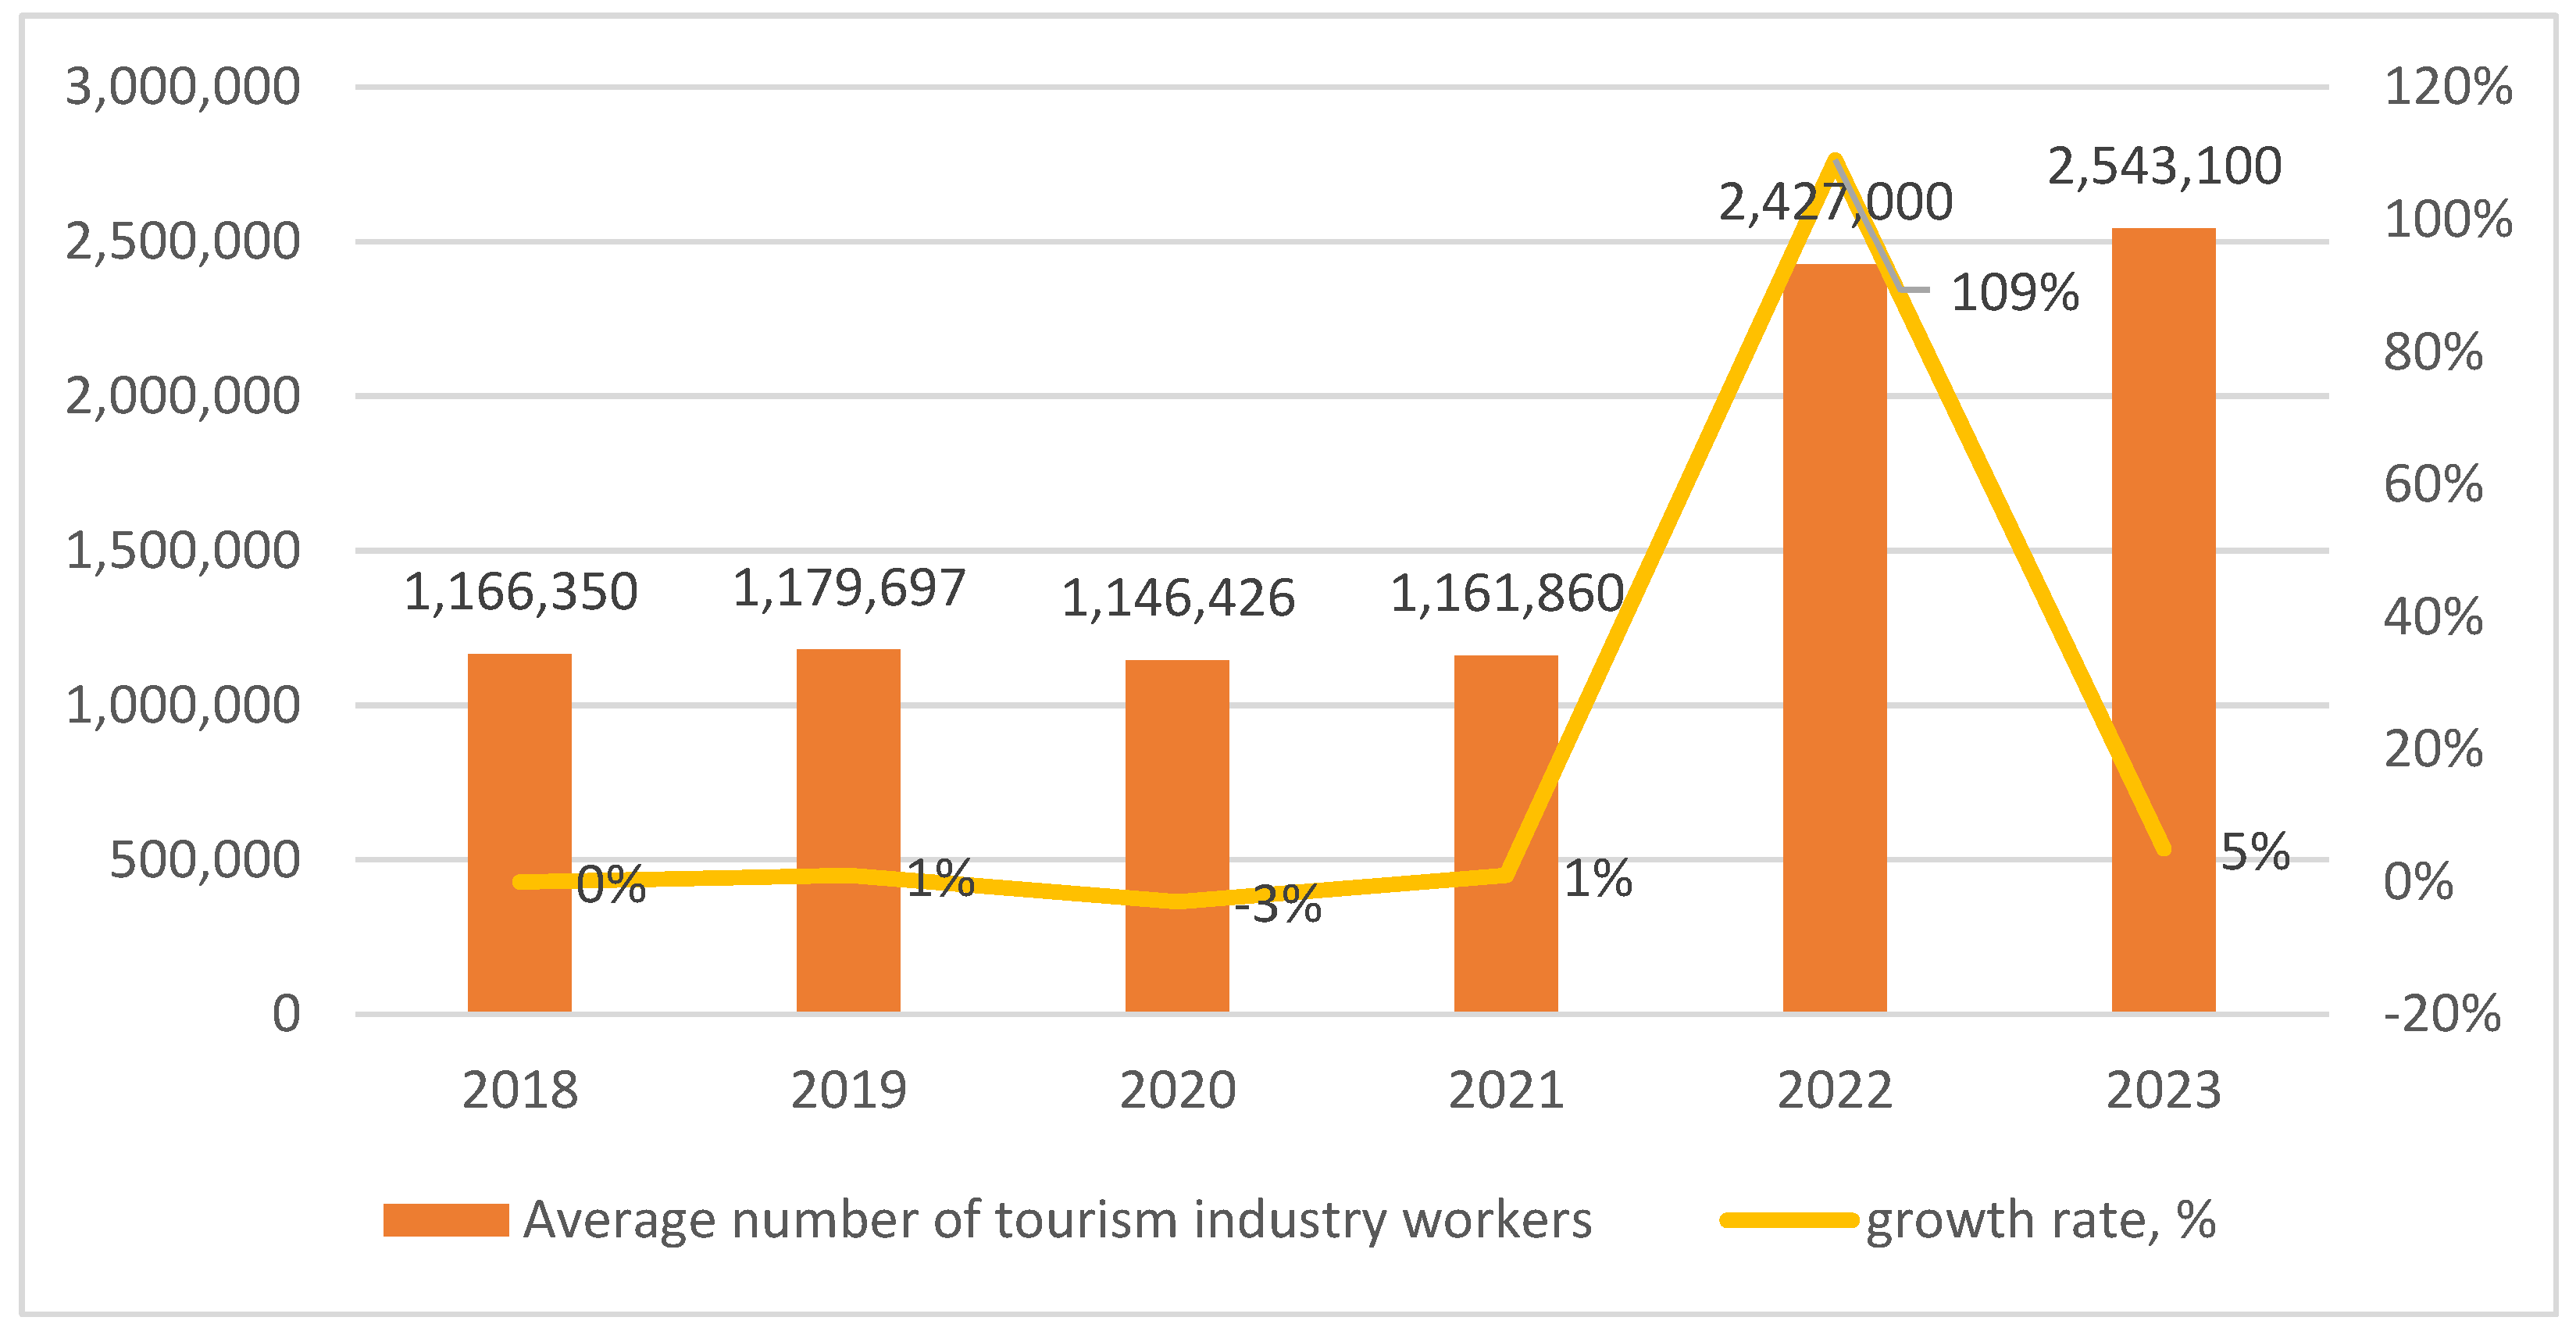
Figure 7.
Investments in fixed capital in the Russian tourism sector, billion US dollars. Source: based on the Rosstat data (https://rosstat.gov.ru/statistics/turizm).
Figure 7.
Investments in fixed capital in the Russian tourism sector, billion US dollars. Source: based on the Rosstat data (https://rosstat.gov.ru/statistics/turizm).
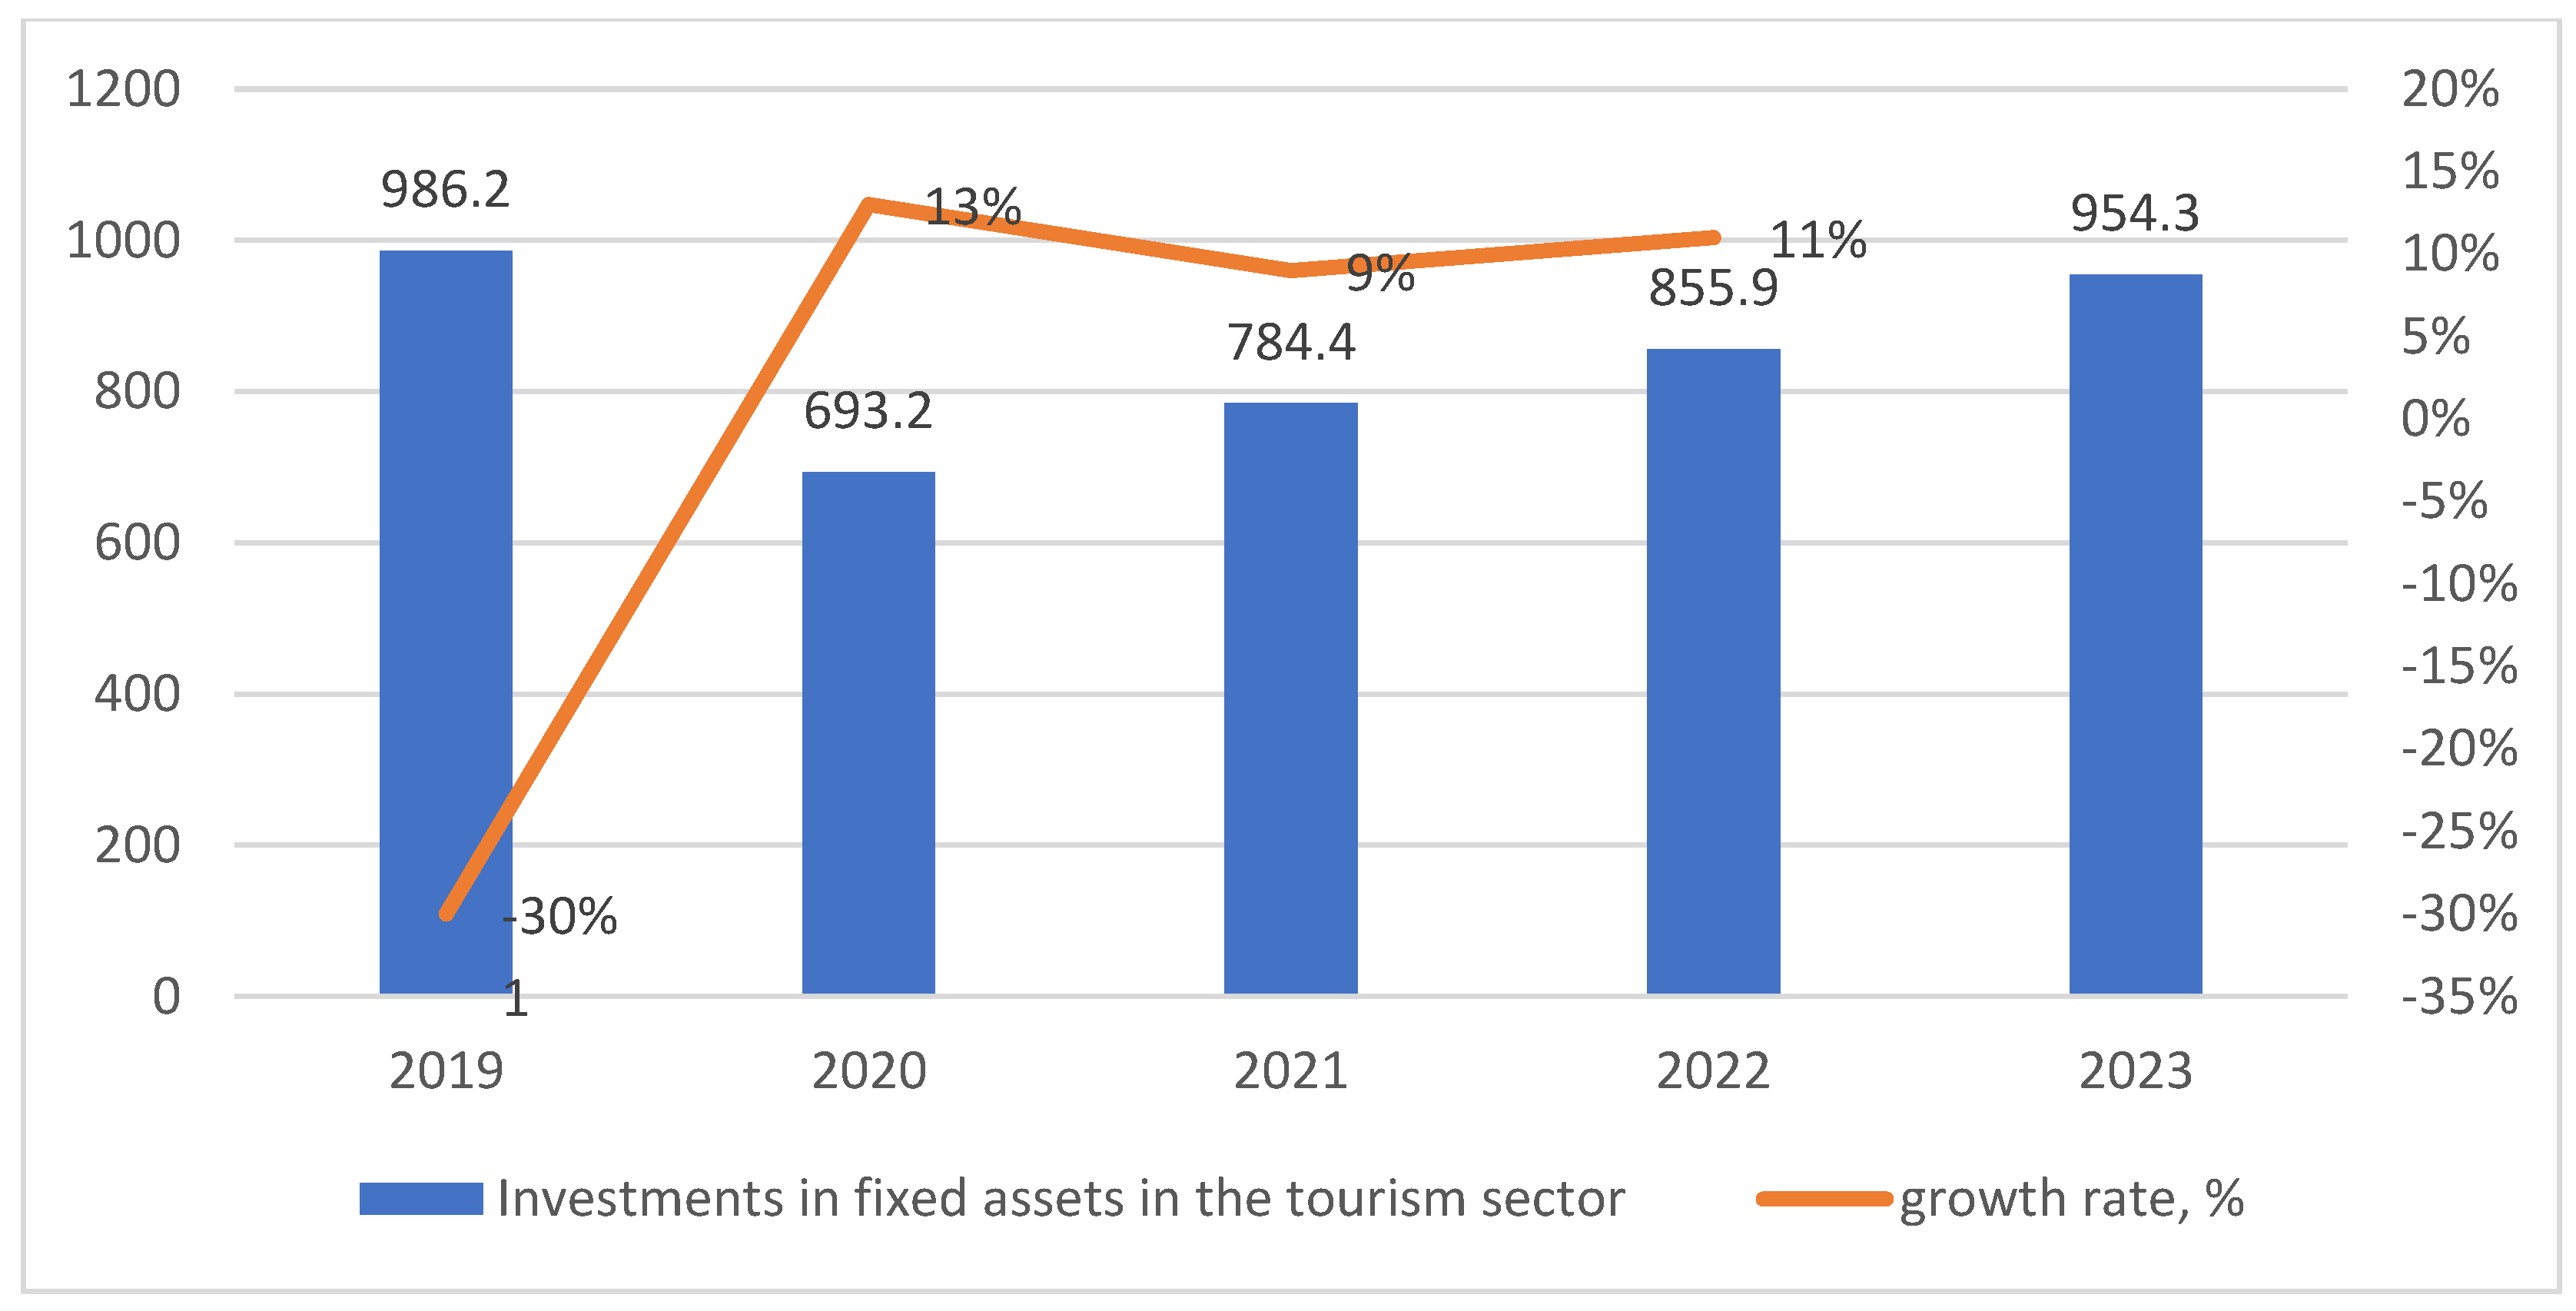
Figure 8.
Russian digital technology market, 2019-2022. Sources: Statistical Research Department, ICS Consulting, Businessstat.
Figure 8.
Russian digital technology market, 2019-2022. Sources: Statistical Research Department, ICS Consulting, Businessstat.
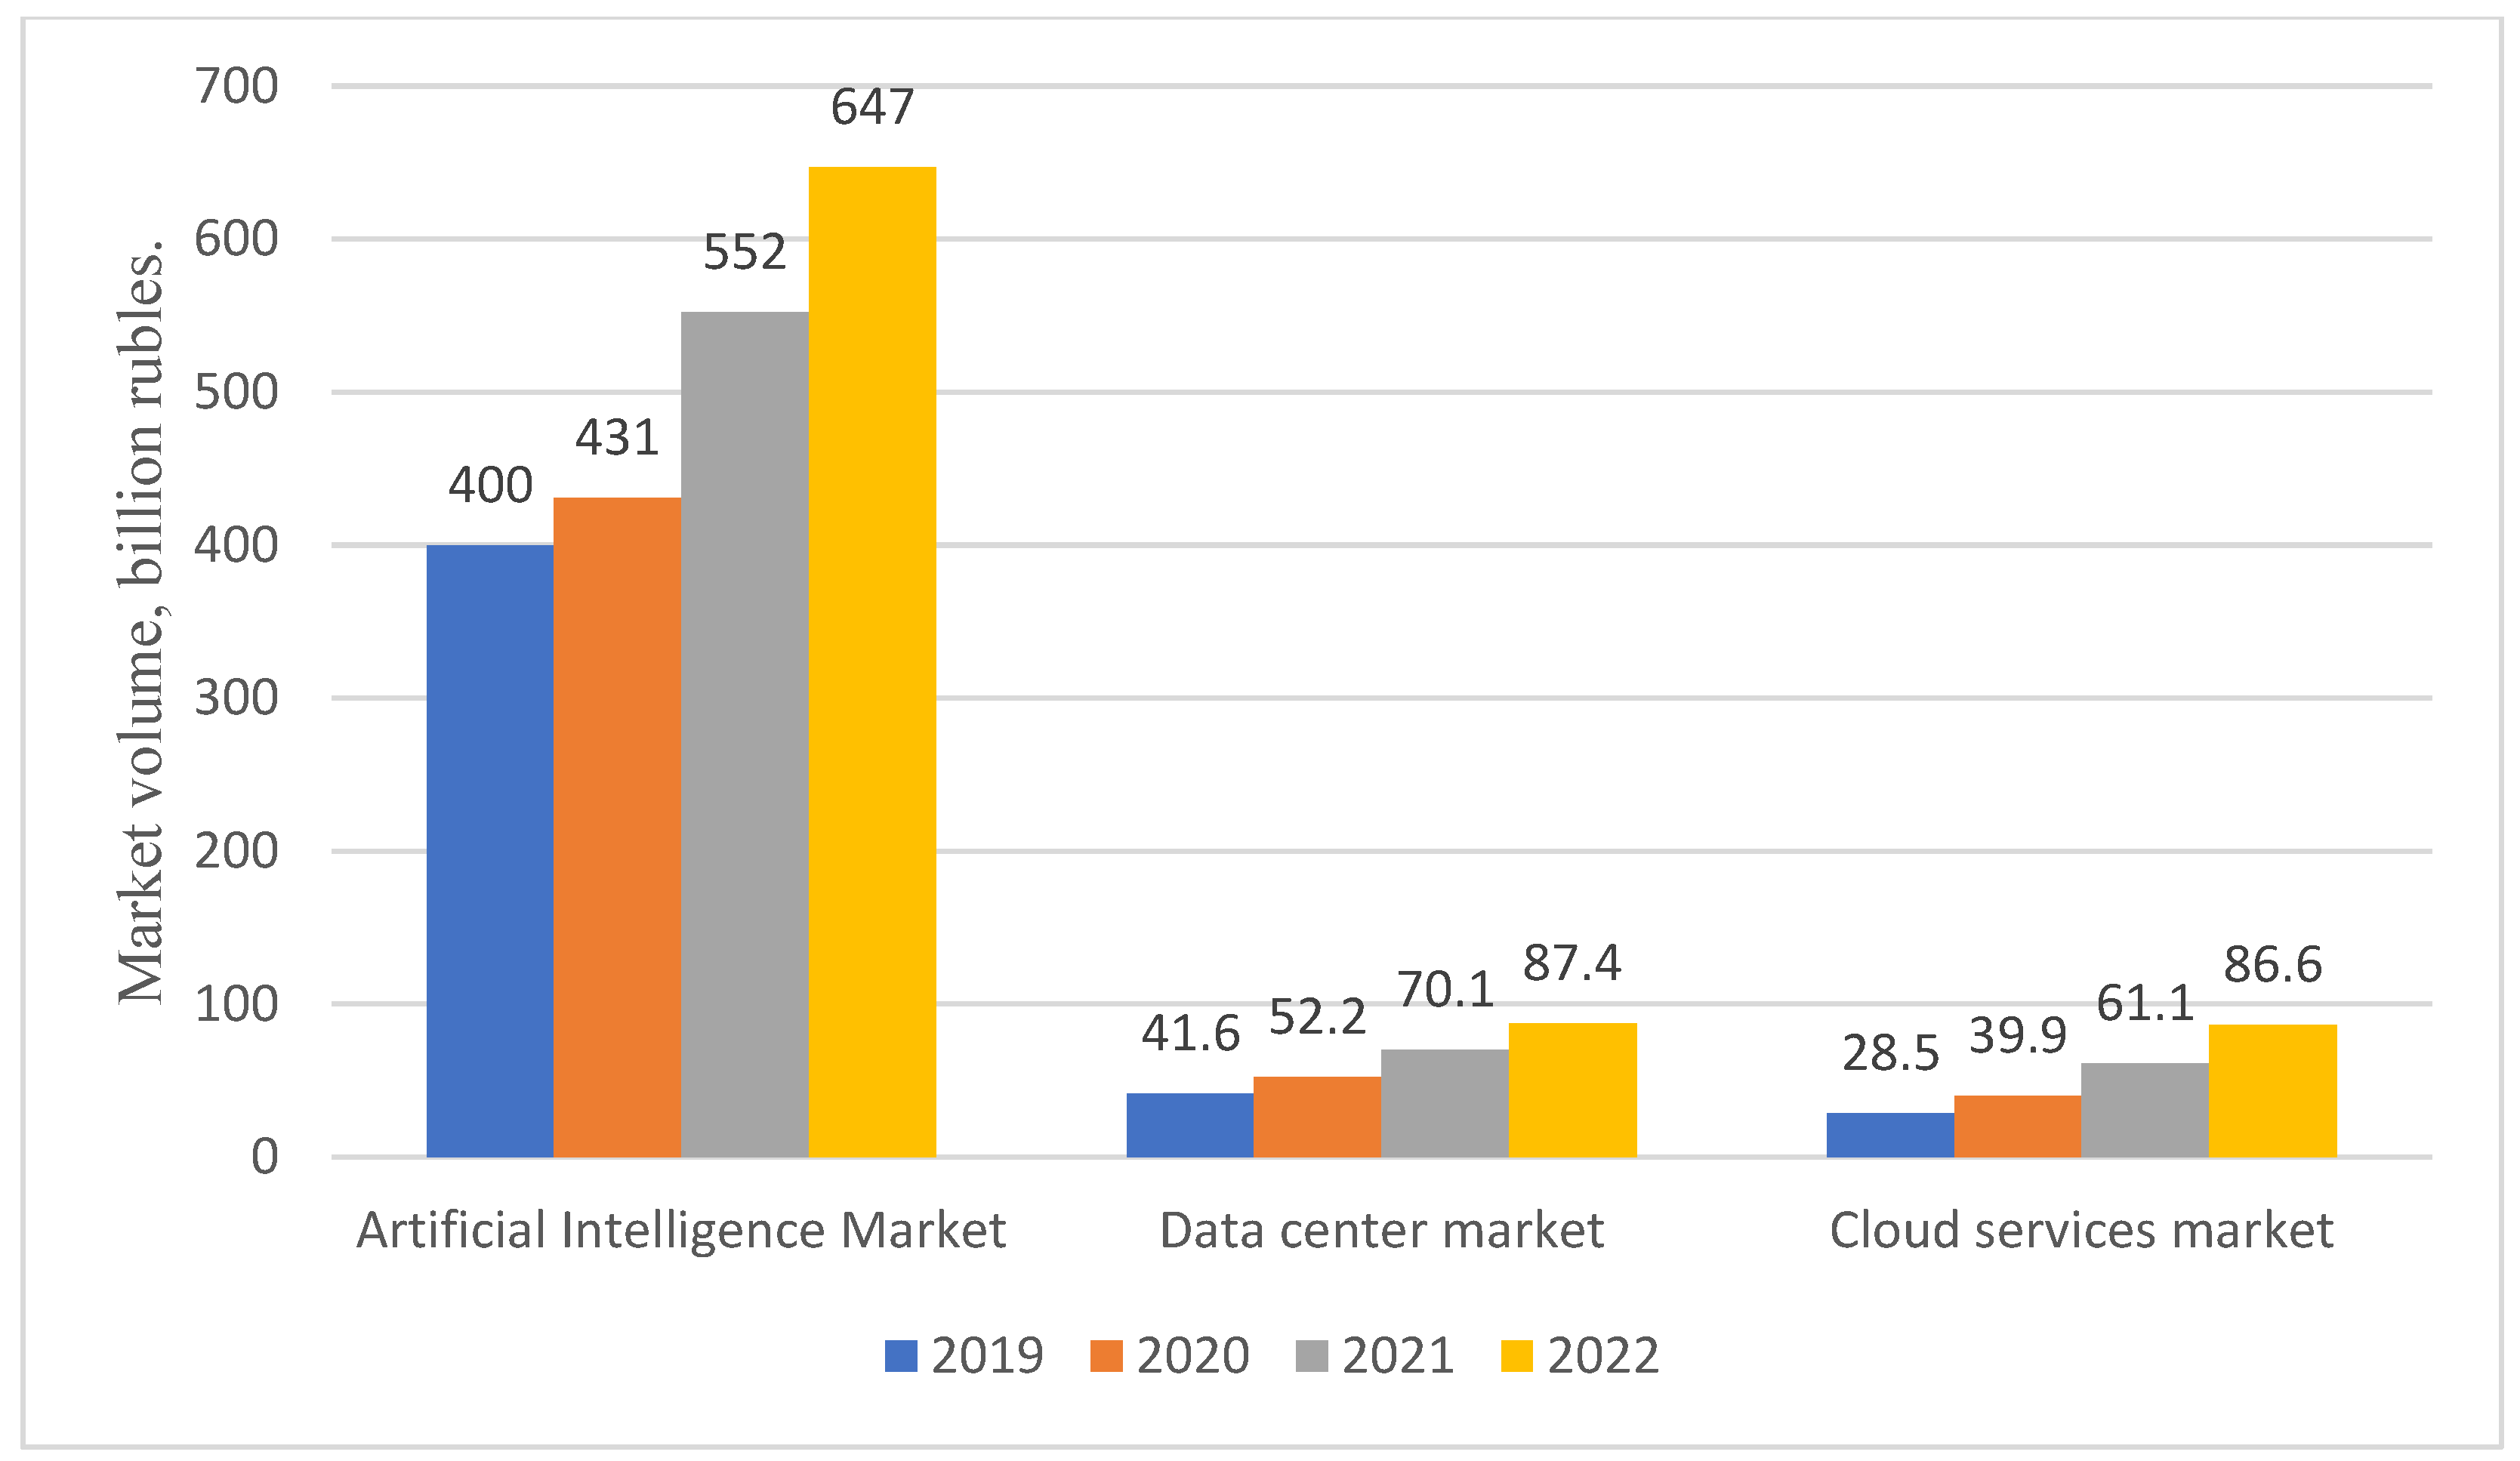
Figure 9.
Forecast of the share of gross added value of the tourism industry in Russia's GDP until 2030. Source: Statista Research Department
Figure 9.
Forecast of the share of gross added value of the tourism industry in Russia's GDP until 2030. Source: Statista Research Department
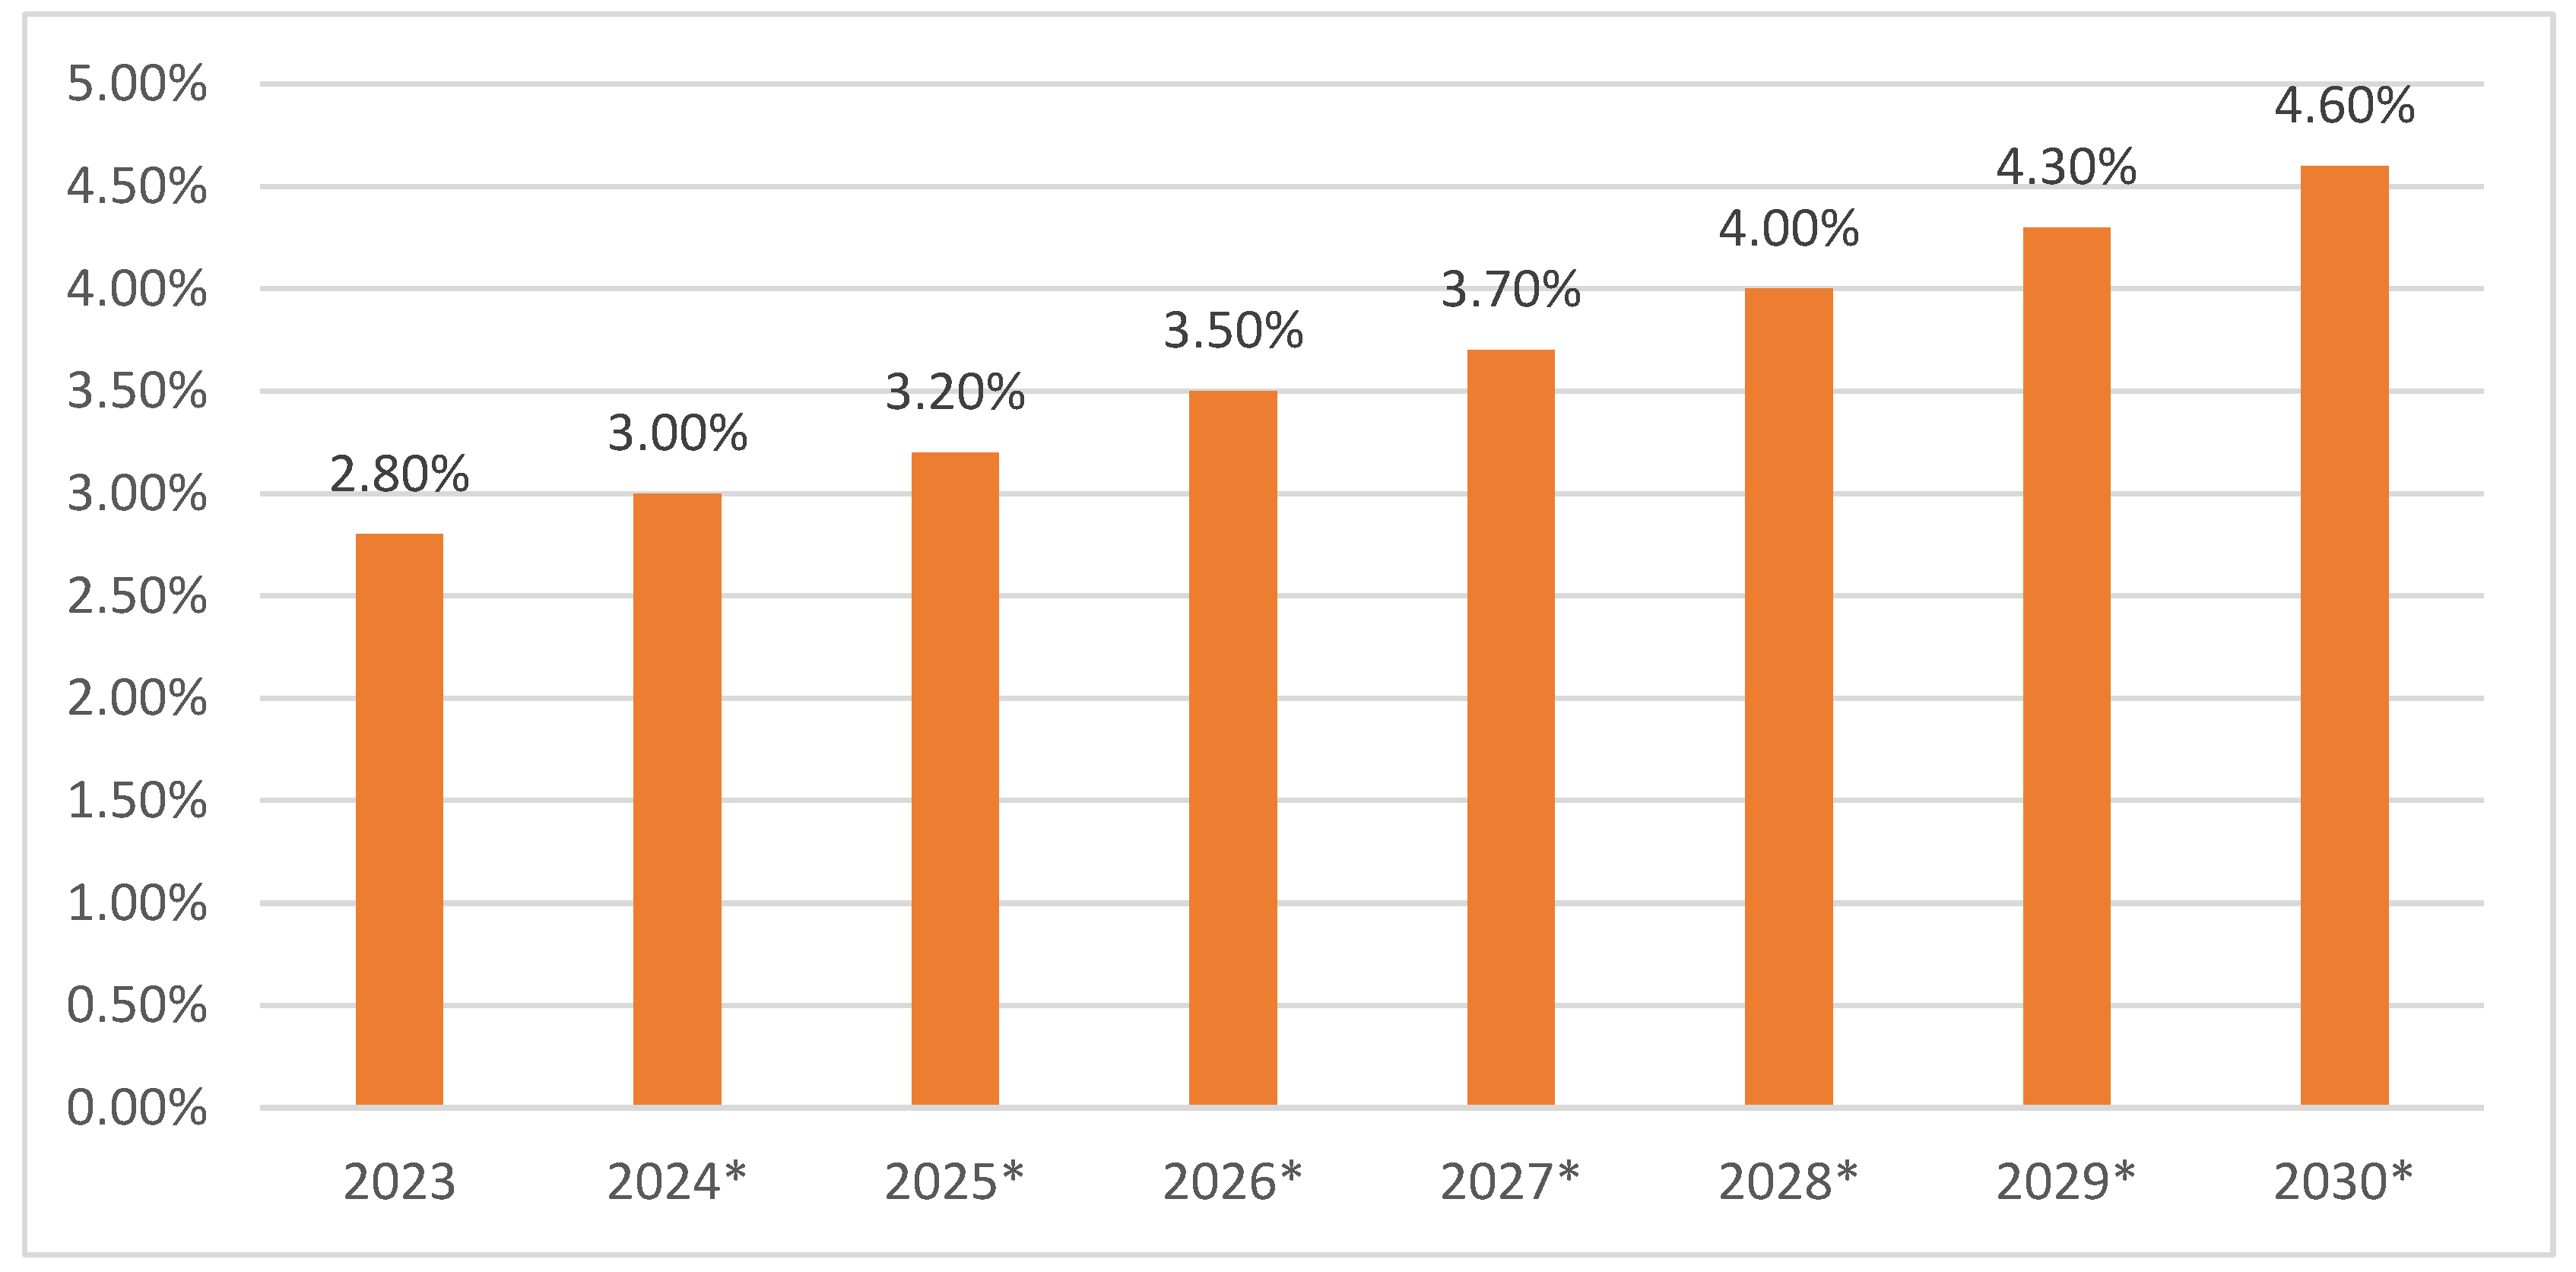
Figure 10.
Forecast of the indicator of the number of domestic tourist trips per capita in Russia until 2030. Million trips.
Figure 10.
Forecast of the indicator of the number of domestic tourist trips per capita in Russia until 2030. Million trips.
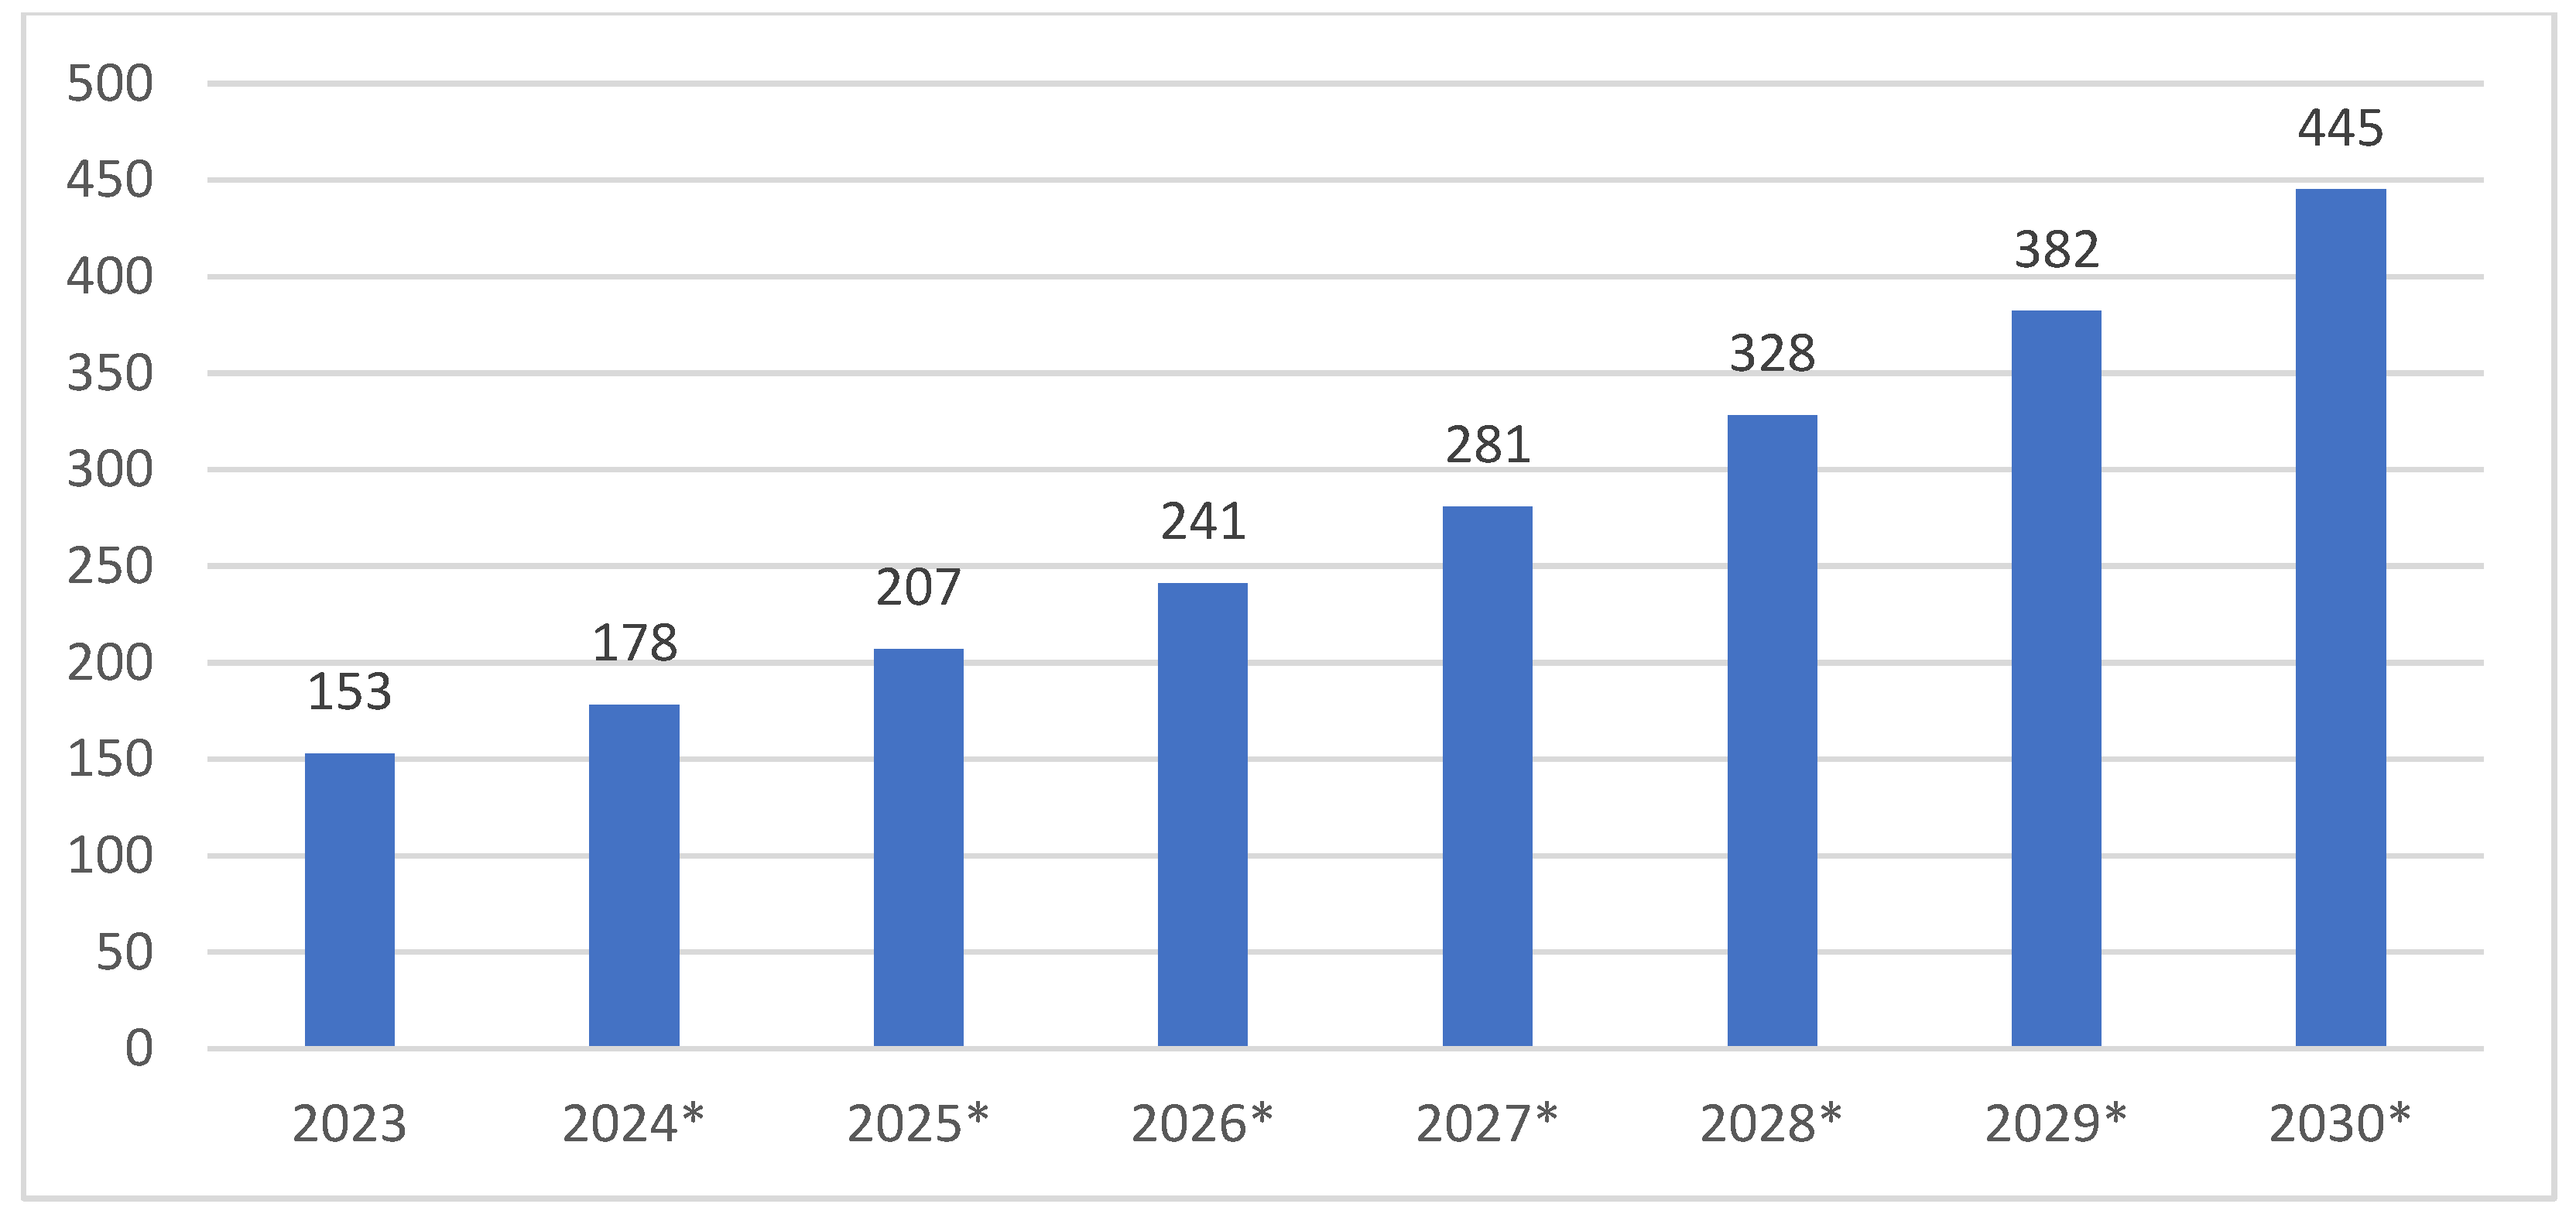
Figure 11.
Forecast of the investment rate in fixed capital in the Russian tourism sector up to 2030, USD billion.
Figure 11.
Forecast of the investment rate in fixed capital in the Russian tourism sector up to 2030, USD billion.
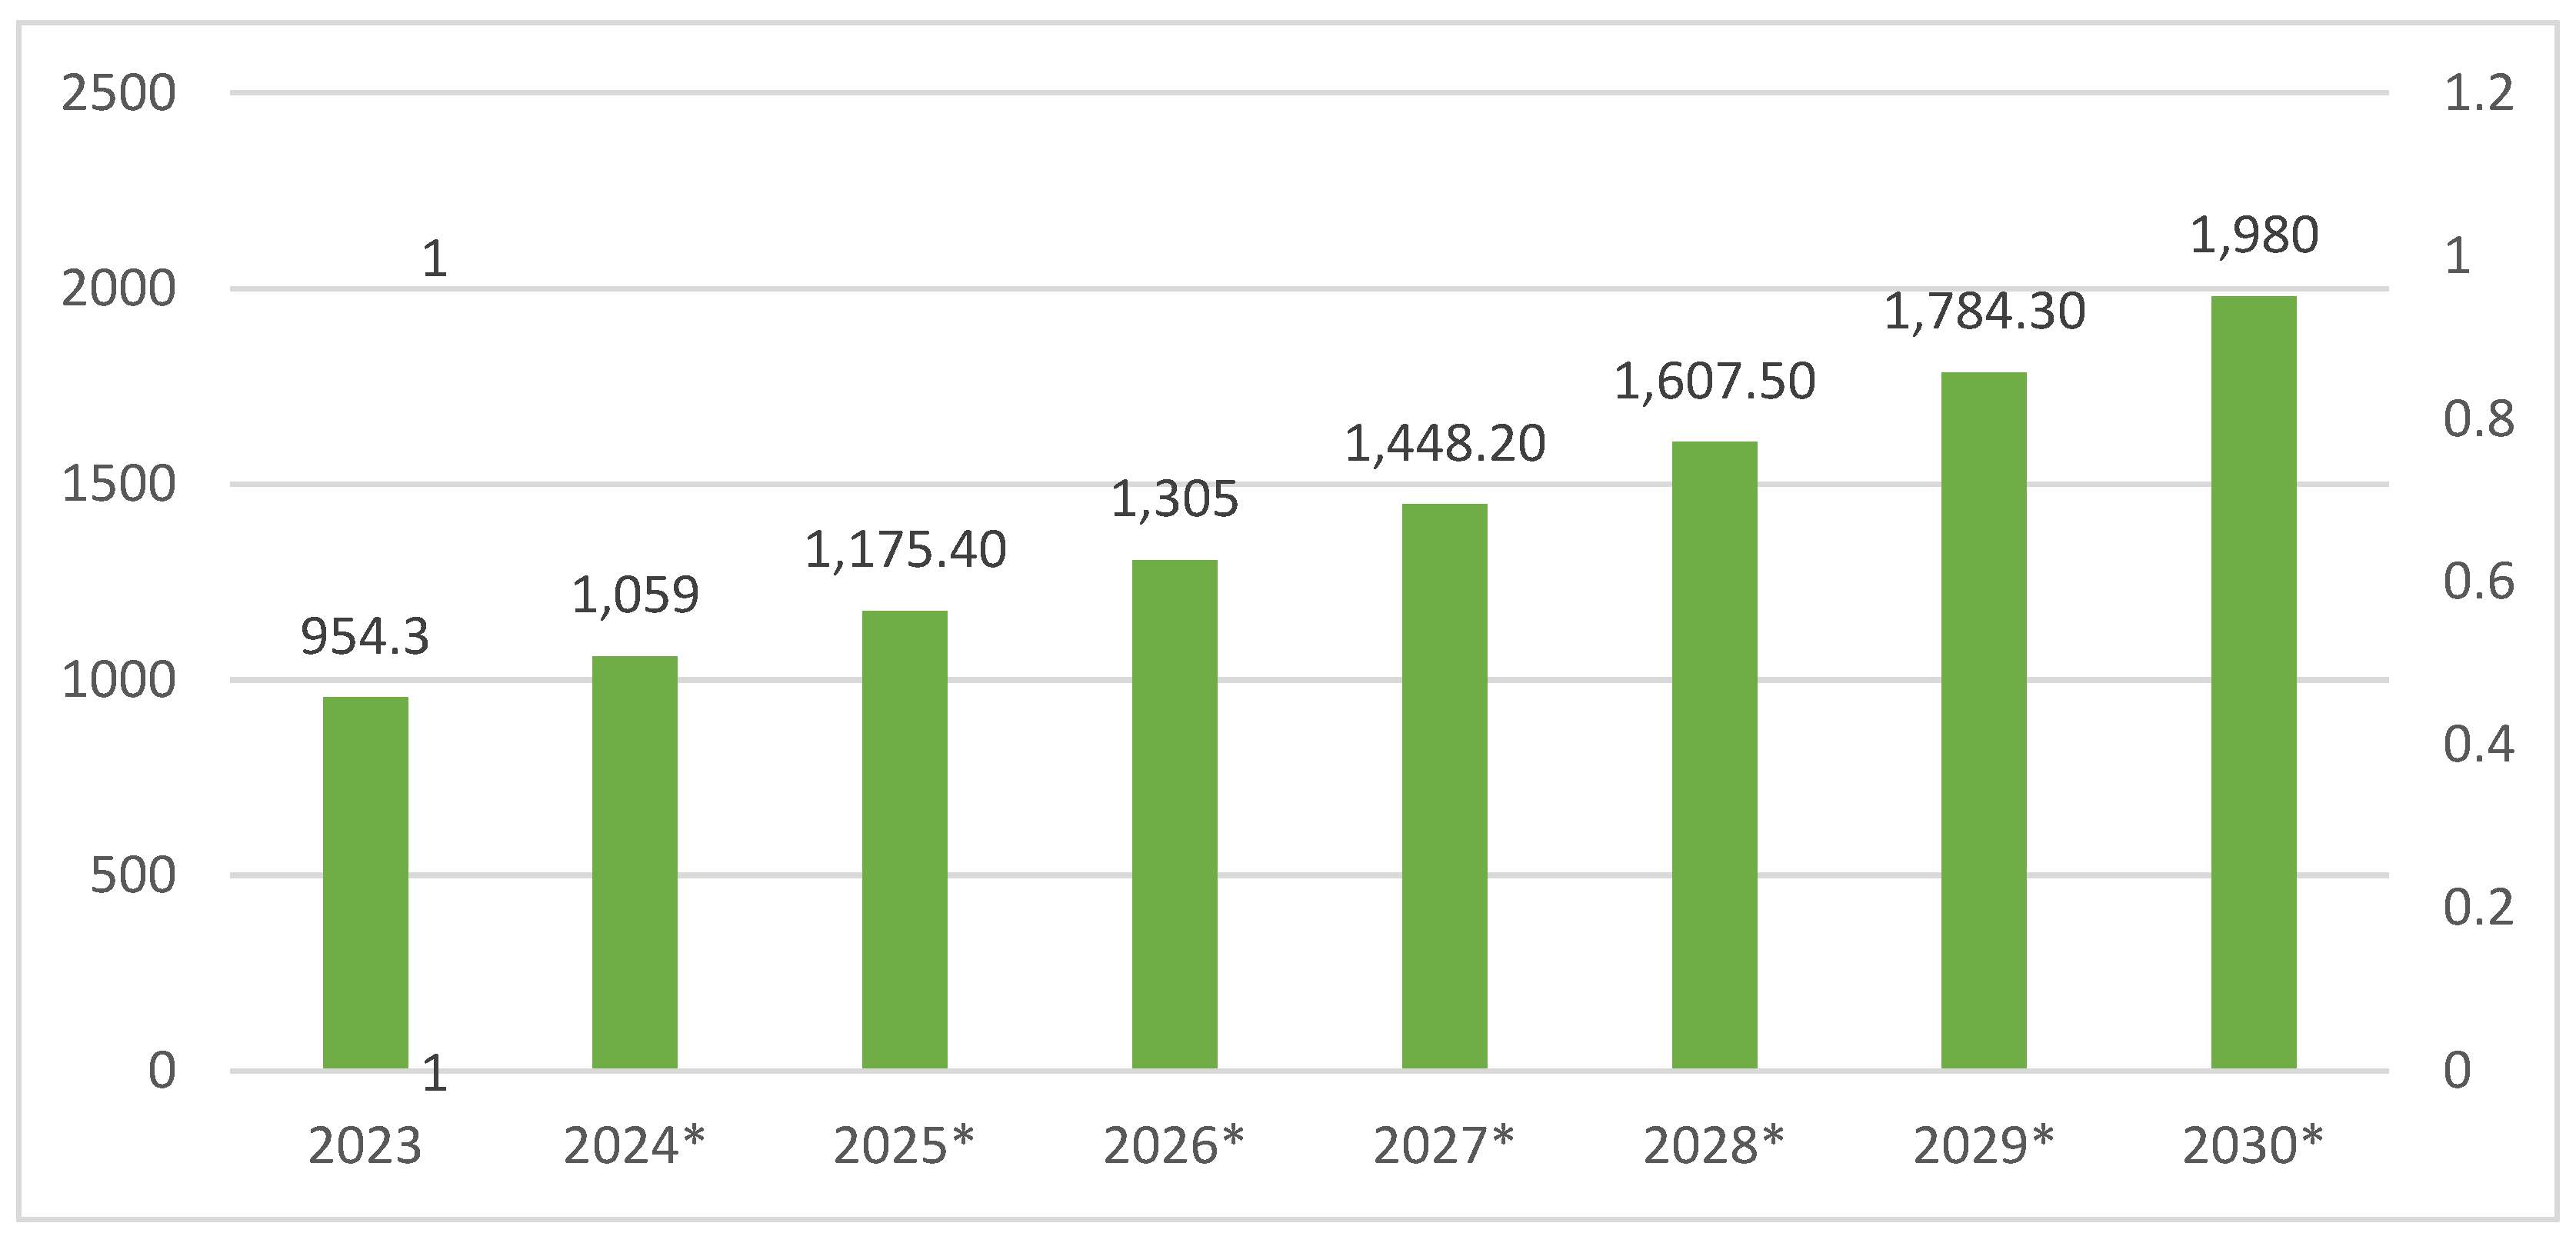
Figure 12.
Dendrogram by Ward's method, Euclidean distance.
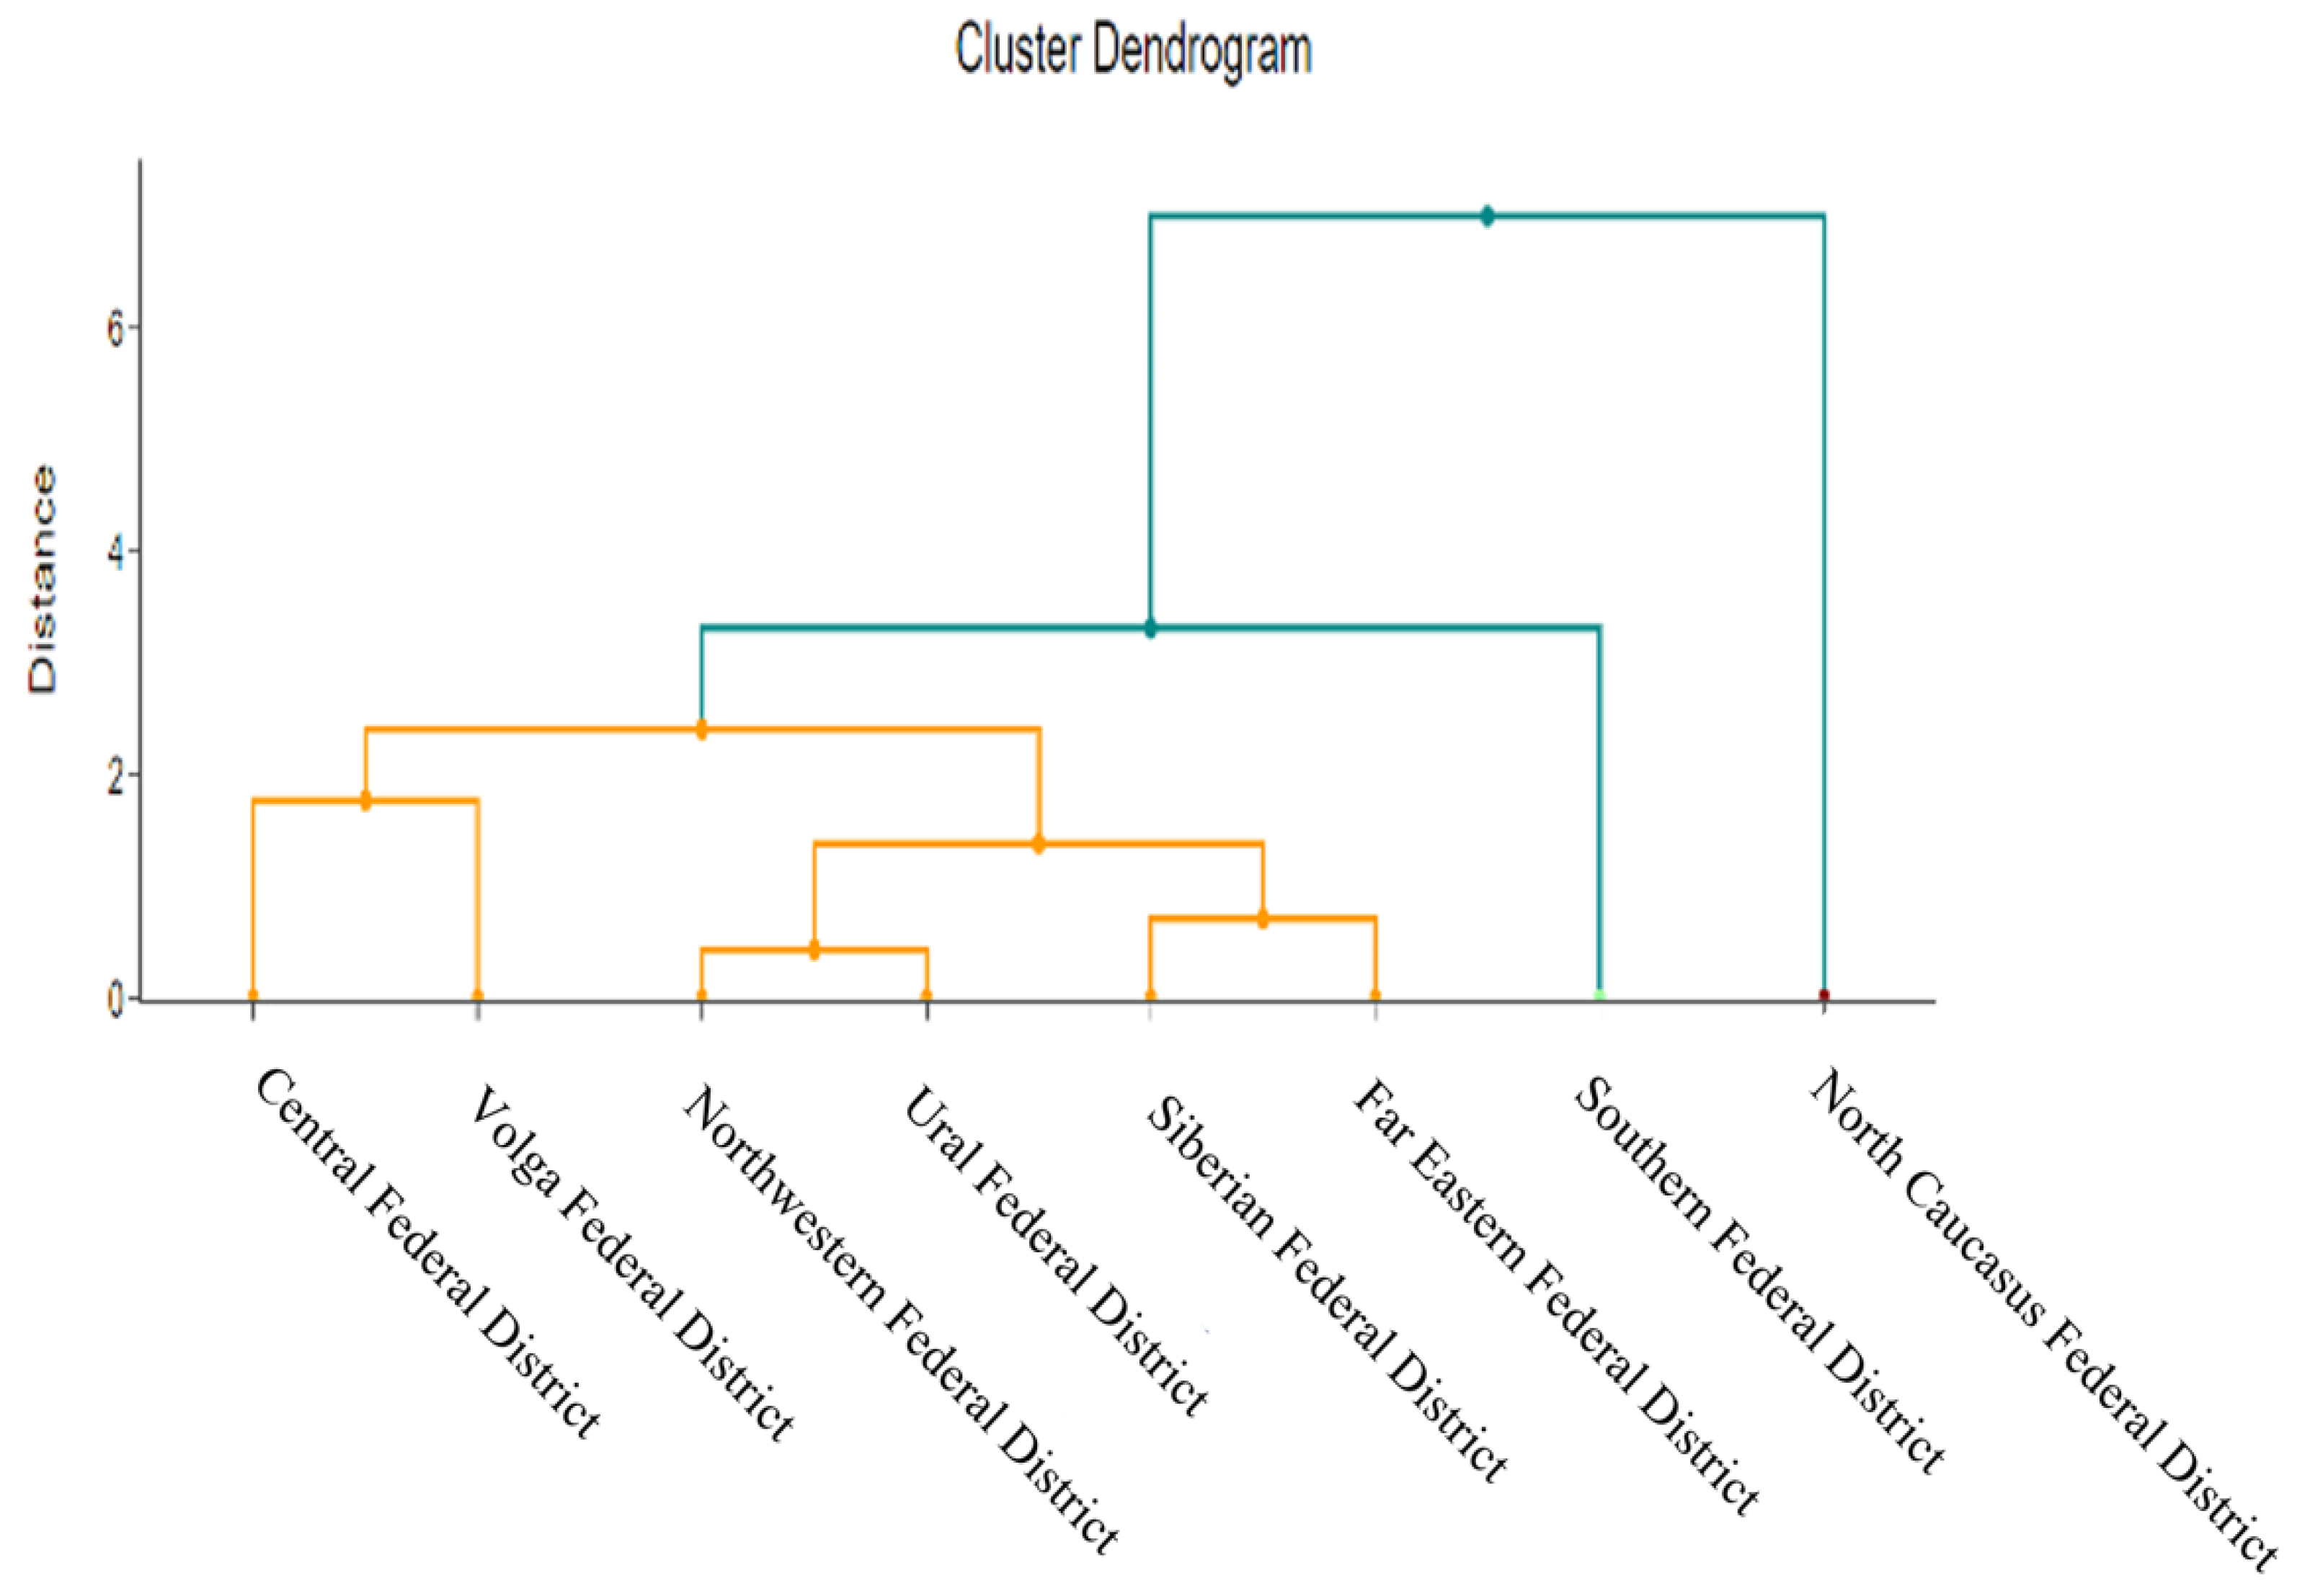
Figure 13.
k-means method for groups of indicators.
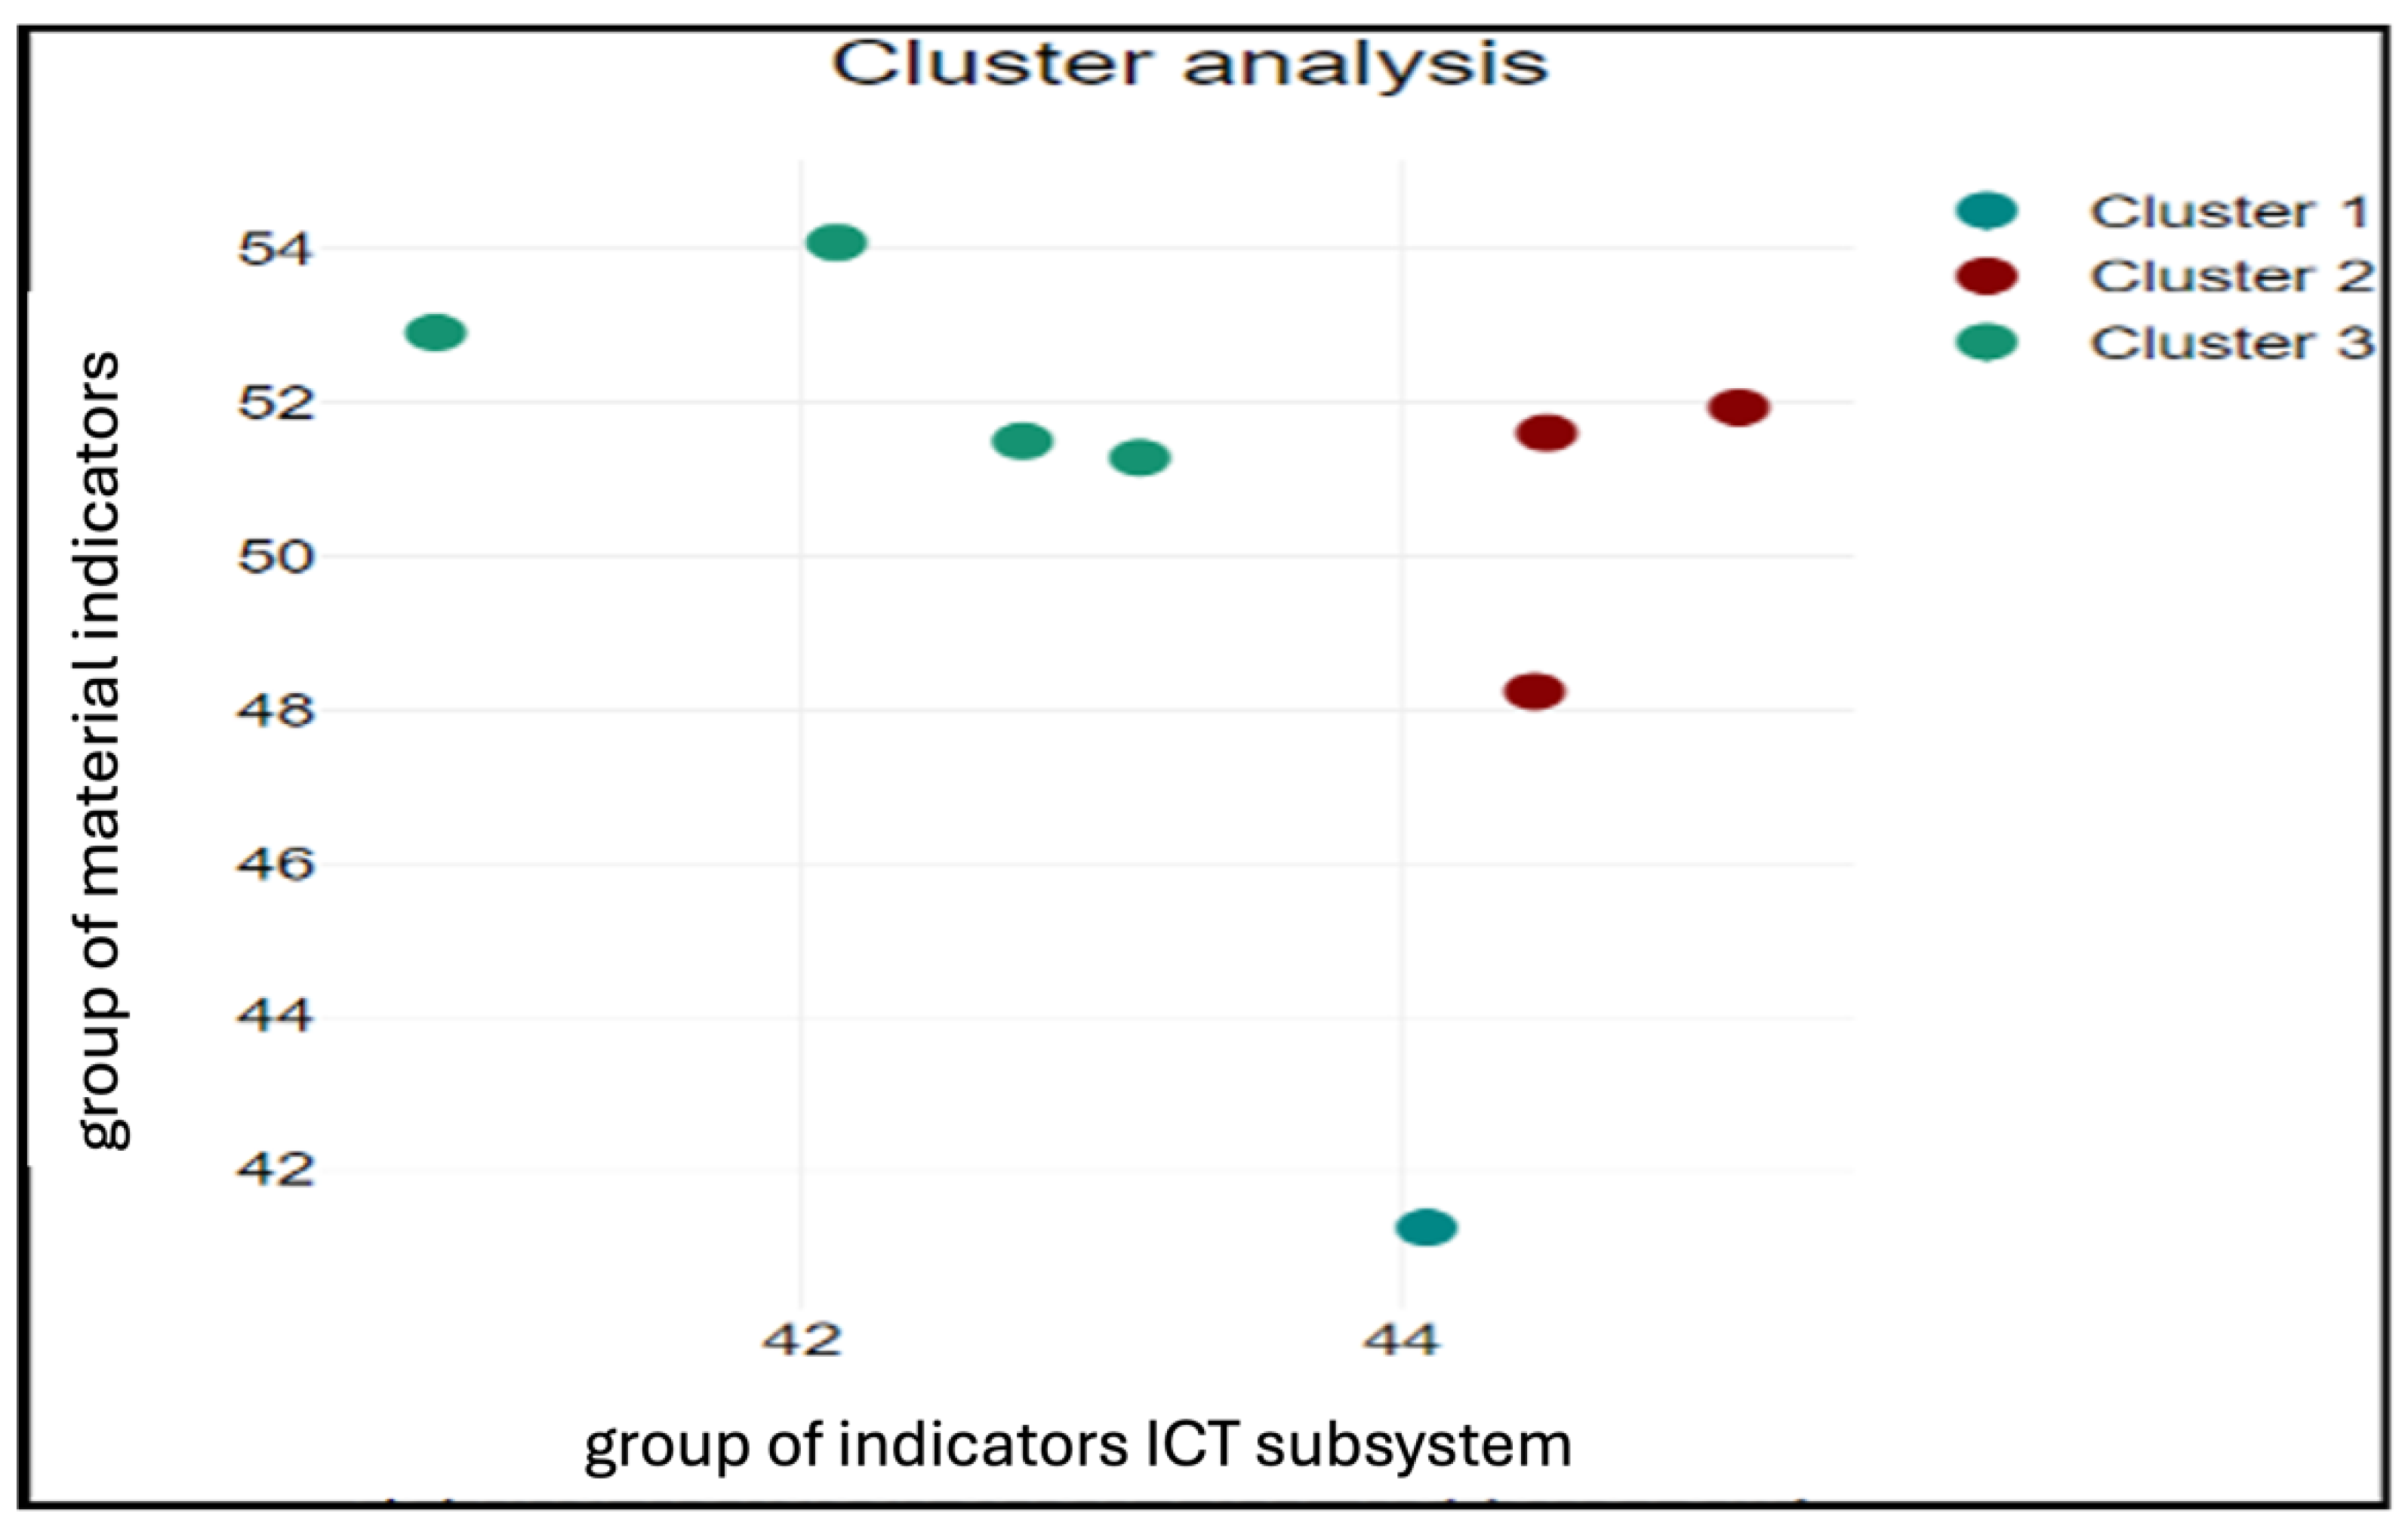
Figure 14.
The model of regional digital infrastructure indicators in tourism.
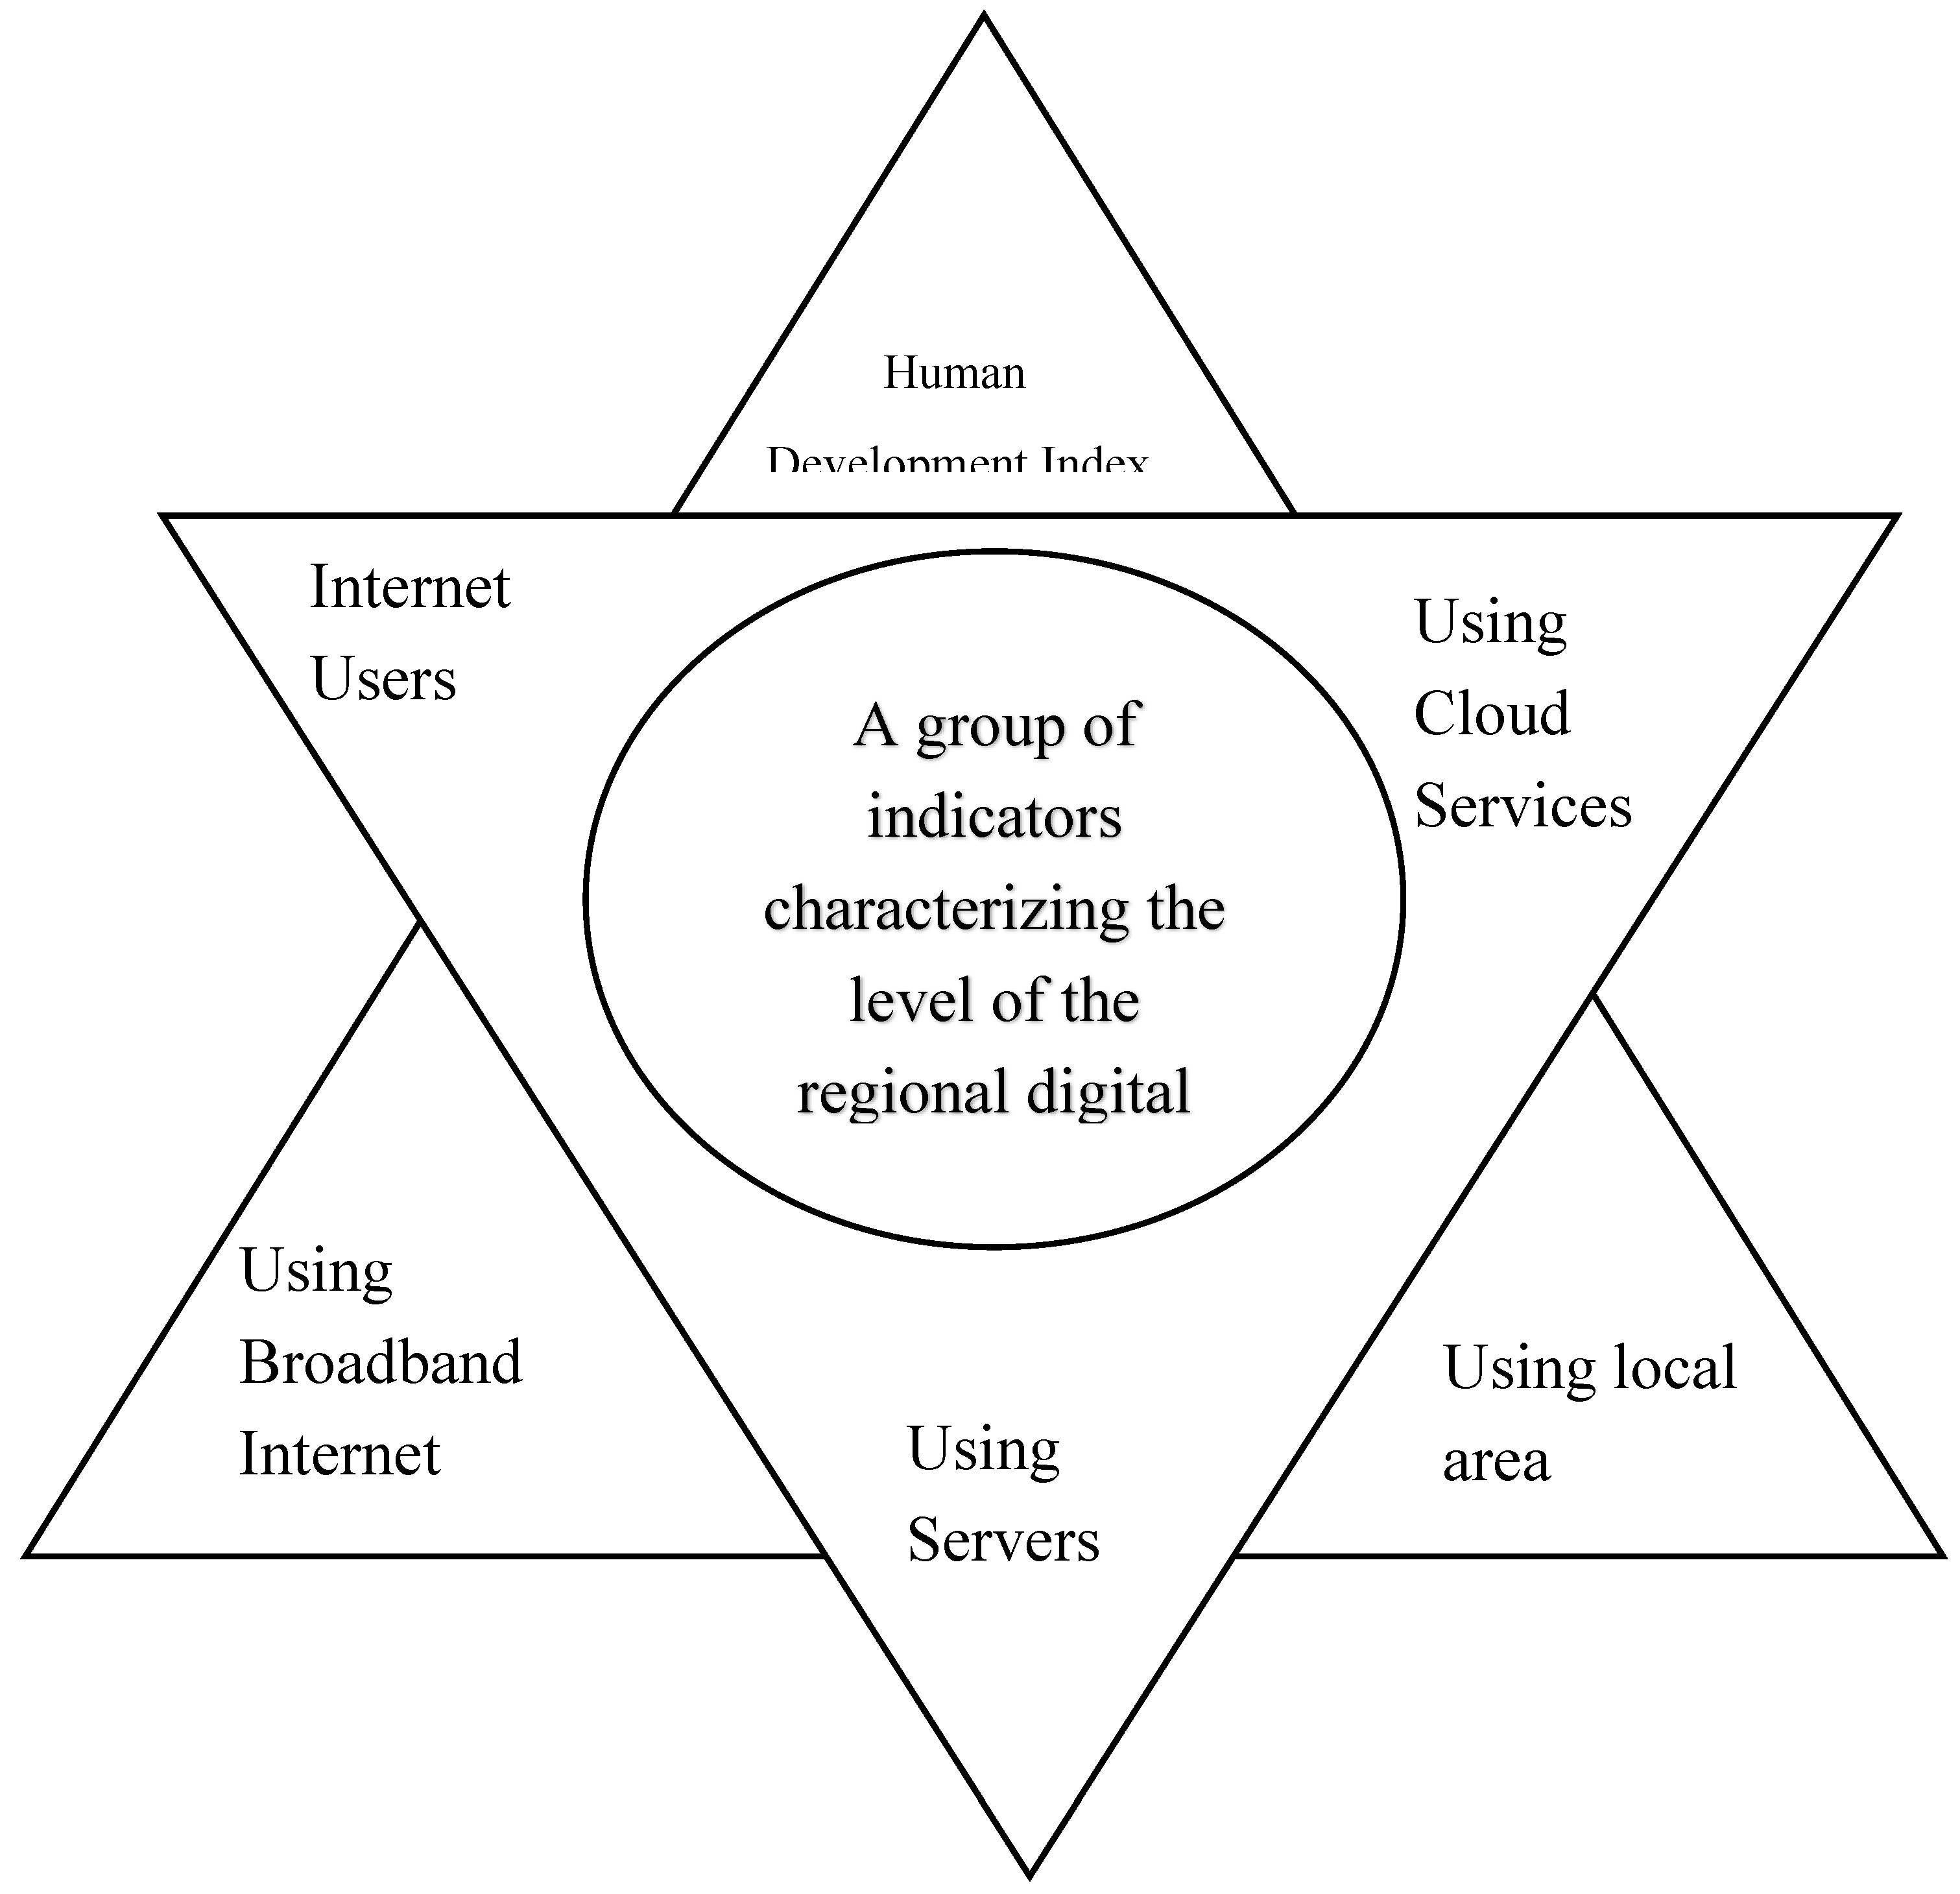
Figure 15.
The methodology for assessing and applying digitalization tools in the field of tourism.
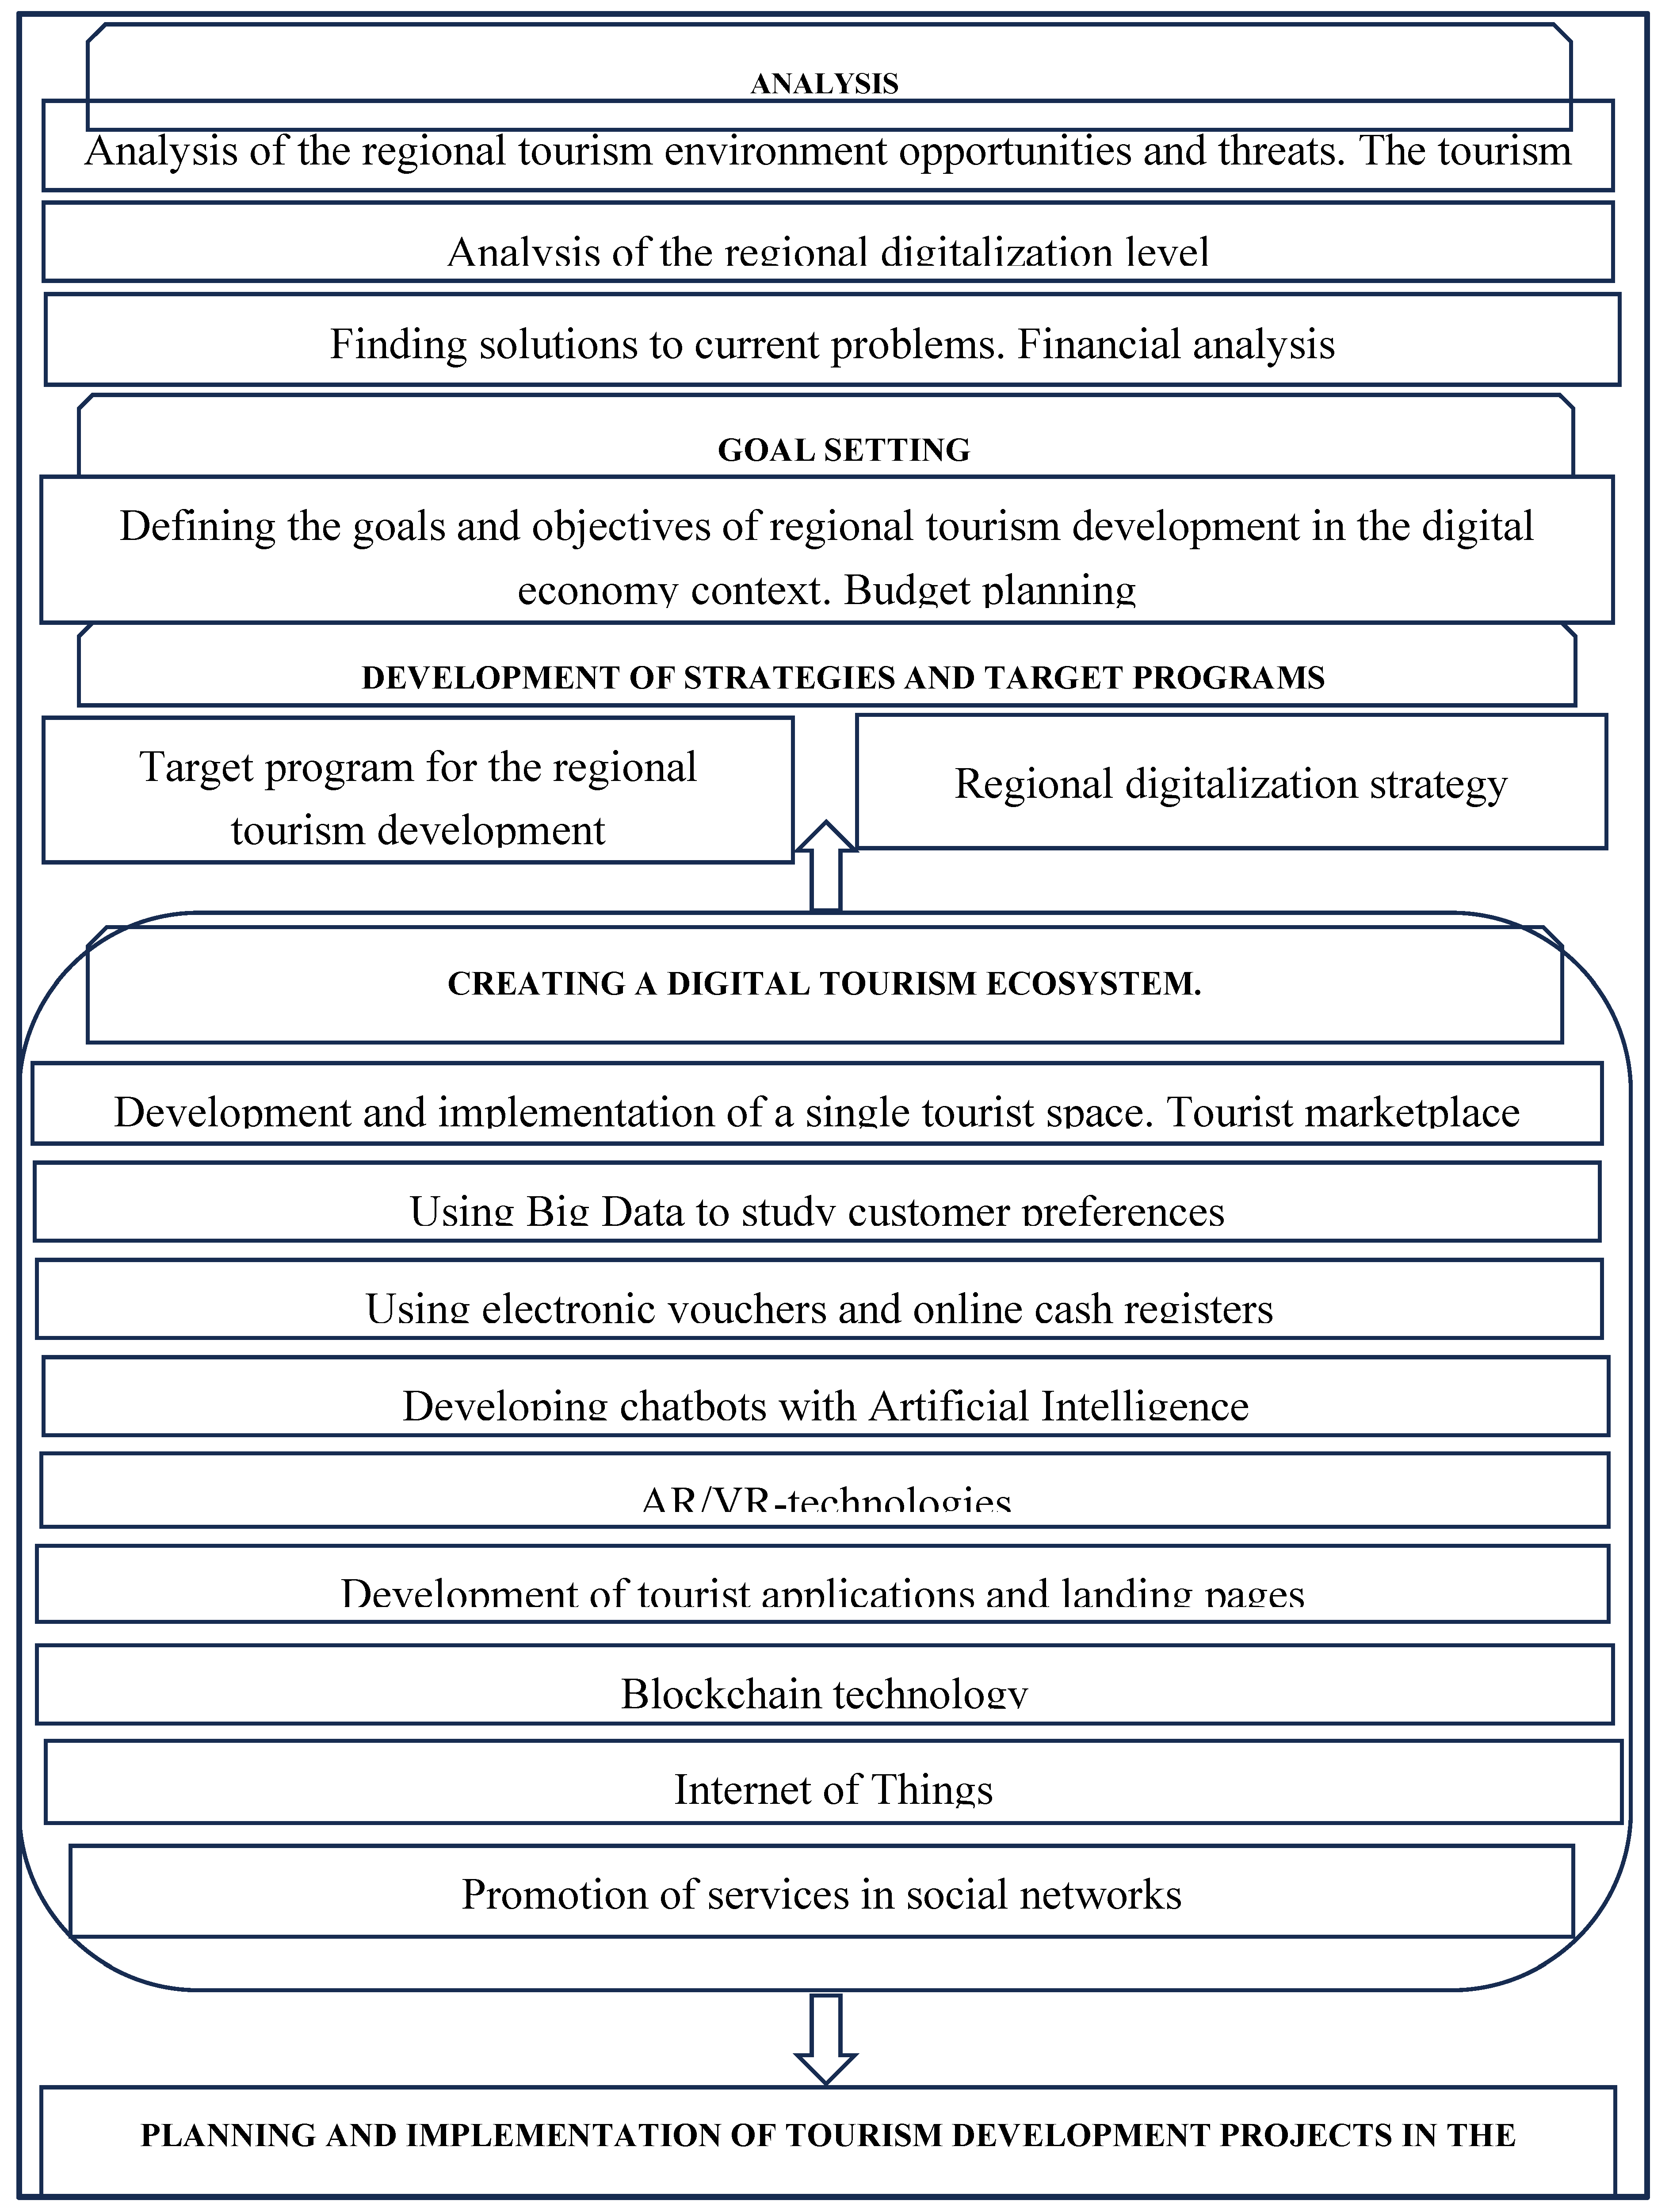
Table 1.
Empowering digital transformation in tourism.
| Web 0.0 Tourism 0.0 |
Web 1.0 Tourism 1.0 |
Web 2.0 Tourism 2.0 |
Web 3.0 Tourism 3.0 |
Web 4.0 Tourism 4.0 |
|---|---|---|---|---|
|
Processes that ensure the use of technology (reservation and distribution systems) Almost complete lack of interaction “firm-consumer” |
Millions of global users Home Pages Focus on enterprises Knowledge of HTML content Web portals Page views, click flow |
Billions of users Focus on community Sharing content XML, RSS Web applications Cost per click, ad click rate |
Multiple forms Consolidation of dynamic content Semantic Web User involvement |
Artificial intelligence (AI) Big data Internet of things (IoT) Blockchain technology (BCT) Cloud computing Virtual and augmented reality (VR and AR) High performance computing |
| Phone and fax still the main distance communication tools | Advertising Taxonomy | Word of mouth | Meonomia | The flow of life |
Source: compiled by authors.
Table 2.
Digital technologies in tourism.
| Digital Technology | Travel Devices & Interfaces | Solutions for Processes, Functions, Actions & Experiences |
|---|---|---|
| Artificial Intelligence (with Internet of Things) / Robotics | Personalized services on demand, service robots with various technological capabilities to provide information, cleaning, disinfection, room service, etc. They can be a digital guide, host, personal assistant, receptionist, porter, kitchen staff, etc. | Omnichannel marketing automation, booking facilitation, identity verification, travel facilitation, security, customer service, novelty, operational efficiency, navigation and orientation, travel and support experience, information search and evaluation. |
|
Mobile technologies / Cloud computing |
Mobile apps for tourism and travel with notifications and messaging features. These can be route generators, geo-tracking, weather/climate forecast, language translator, currency converter, online booking, mobile payments, reservations, ticketing system, geo-location services, etc. | Convenient access to destination information via mobile phone, the ability to communicate in real time. Experiences managed by consumer or tourism provider to make tourism services more convenient and reliable for customers, allowing travelers to be more spontaneous. |
| Augmented reality / Virtual reality | Virtual and augmented marketing and advertising materials, advertising, 3D environments, 360-degree programs, virtual tours, digital historical and cultural tours and events, natural landscape exploration, etc. | Visitors can experience and immerse themselves in a completely new and unique experience that creates a sense of real tourist places, replacing paper promotion and advertising materials |
| Big Data | Big data collection and analysis, large-scale data visualization, information security, privacy, big data platform, etc. | Customization and personalization of tourism product delivery and usage in content creation, resulting in increased consumer loyalty |
| Social Media | Social networks and virtual worlds: blogs, social networks (Facebook, Instagram), professional social networking sites (LinkedIn, ResearchGate), travel forums (LonelyPlanet), content communities (YouTube, Pinterest), rating services and portals (TripAdvisor, Booking) | Information source, personalized communication, content creation, interaction, less time to make travel decisions, convenience, flexibility in travel, quick and easy exchange of information, easy comparison, engagement, inspiration |
Source: compiled by authors.
Table 3.
Average value of the private digital mobility indicator.
| Digital mobility indicator | 2018 | 2019 | 2020 | 2021 | 2022 | Partial digitalization indicator | Average value of the indicator | ||||
| 2018 | 2019 | 2020 | 2021 | 2022 | |||||||
| Growth rate of the Russian cloud services market (%) | 36% | 28% | 40% | 53% | 42% | 0.36 | 0.28 | 0.4 | 0.53 | 0.42 |
0.398 |
Source: compiled by authors.
Table 4.
Average value of the private digital equality indicator.
| Digital equality indicator | 2018 | 2019 | 2020 | 2021 | 2022 | Private digitalization indicator | Average value of the indicator | ||||
| 2018 | 2019 | 2020 | 2021 | 2022 | |||||||
| The growth rate of Internet users share in Russia (%) | 80.86 % | 82.64 % | 84.99 % | 88.21 % | 90.42 % | 0.8086 | 0.8264 | 0.8499 | 0.8821 | 0.9042 |
0.85424 |
Source: compiled by authors.
Table 5.
Average value of the partial digital economy indicator.
| Digital economy indicator | 2018 | 2019 | 2020 | 2021 | 2022 | Private digitalization indicator | Average value of the indicator | ||||
| 2018 | 2019 | 2020 | 2021 | 2022 | |||||||
| The Russian e-commerce market growth rate (%) | 22% | 28% | 44% | 34% | 32% | 0.22 | 0.28 | 0.44 | 0.34 | 0.32 |
0.32 |
Table 6.
Average value of the private digital interaction indicator.
| Private digital interaction indicator | 2018 | 2019 | 2020 | 2021 | 2022 | Private digitalization indicator | Average value of the indicator | ||||
| 2018 | 2019 | 2020 | 2021 | 2022 | |||||||
| The Russian data center market growth rate (%) | 41.5% | 24.6% | 25.5% | 34.3% | 24.7% | 0.415 | 0.246 | 0.255 | 0.343 | 0.247 |
0.3012 |
Table 7.
Tourist flow in a number of Russian regions, 2021-2022.
| Region | Tourist flow, million people | Growth rate 2022/2021 | |
| 2021 | 2022 | ||
| Moscow Region | 14 | 22 | +57% |
| Moscow | 26,2 | 28 | +7% |
| Krasnodar Krai | 16,5 | 17 | +3% |
| Saint Petersburg | 6,1 | 8,1 | +32% |
| Kazan | 2,9 | 3,3 | +11% |
| Tyumen Region | 2,9 | 3,3 | +13% |
| Primorye | 2,8 | 3 | +7% |
| Stavropol Region | 1,25 | 1,5 | +20% |
| Altai Republic | 1,9 | 2,1 | +7% |
| Dagestan | 1 | 2 | +100% |
| Kaliningrad | 1,9 | 1,8 | -5% |
| Sverdlovsk Region | 1,6 | 1,8 | +12% |
| Tula Region | 1,3 | 1,52 | +16% |
| Irkutsk Region | 1,1 | 1,5 | +30% |
Source: based on the Rosstat data (https://rosstat.gov.ru/statistics/turizm).
Table 8.
Top 30 regions of Russia with the highest domestic tourist flow 9 months of 2023.
| Position | Region | Number of trips | Dynamics compared to 2022 |
|---|---|---|---|
| 1 | Krasnodar Krai | 16 468 251 | 1,1% |
| 2 | Moscow | 14 466 906 | 29,9% |
| 3 | Moscow Region | 14 244 986 | 6,1% |
| 4 | Leningrad Region | 12 991 834 | -4,8% |
| 5 | Saint Petersburg | 7 926 519 | 22,9% |
| 6 | Crimea | 5 186 208 | 43,2% |
| 7 | Tatarstan | 3 118 639 | -2,2% |
| 8 | Sverdlovsk Region | 3 018 512 | 58,8% |
| 9 | Stavropol Krai | 2 421 829 | 70,9% |
| 10 | Tyumen Region | 2 091 512 | 8,8% |
| 11 | Novosibirsk Region | 2 005 461 | 38,6% |
| 12 | Nizhny Novgorod Region | 1 827 301 | 16,8% |
| 13 | Bashkortostan | 1 815 639 | 30,7% |
| 14 | Krasnoyarsk Krai | 1 789 351 | 41,2% |
| 15 | Altai Krai | 1 754 667 | 33,0% |
| 16 | Yaroslavl Region | 1 733 399 | 17,1% |
| 17 | Primorsky Krai | 1 672 844 | 39,6% |
| 18 | Voronezh Region | 1 616 498 | 77,1% |
| 19 | Rostov Region | 1 500 280 | -8,0% |
| 20 | Samara Region | 1 445 199 | -12,4% |
| 21 | Chelyabinsk Region | 1 395 396 | 2,0% |
| 22 | Karelia | 1 263 685 | 159,1% |
| 23 | Novgorod Region | 1 259 018 | 43,4% |
| 24 | Tula Region | 1 145 834 | 78,11%; |
| 25 | Kaliningrad Region | 1 137 706 | 99,0% |
| 26 | Irkutsk Region | 1 100 732 | 66,3% |
| 27 | Volgograd Region | 1 028 837 | 9,6% |
| 28 | Khabarovsk Krai | 993 044 | 108,5% |
| 29 | Dagestan | 974 393 | 281,9% |
| 30 | Tver Region | 965 788 | -28,7% |
Source: calculated based on the Rosstat data (https://rosstat.gov.ru/statistics/turizm).
Table 9.
System of indicators characterizing the federal districts digital infrastructure.
| Group of indicators | № | Indicator | Measurement unit |
| Group of indicators characterizing the ICT subsystem | 1 | Human Development Index | % growth |
| 2 | Internet users | % of population | |
| Group of material indicators | 1 | Using broadband internet | % of organizations |
| 2 | Using servers | % of organizations | |
| 3 | Using local area networks | % of organizations | |
| 4 | Using cloud services | % of organizations |
Table 10.
Average values of ICT subsystem indicators and material indicators of federal districts.
| Human Development Index, % Growth | ||||||||
| 2018 | 2019 | 2020 | 2021 | |||||
| Central Federal District | -3.70 | 0.65 | -1.72 | -0.93 | ||||
| Northwestern Federal District | -2.67 | 0.54 | -1.72 | -0.93 | ||||
| Southern Federal District | -0.93 | 0.233 | -1.76 | -0.95 | ||||
| North Caucasian Federal District | -2.29 | 0.74 | -1.84 | -1 | ||||
| Volga Federal District | -2.73 | 0.73 | -1.74 | -0.94 | ||||
| Ural Federal District | -2.83 | 1.16 | -1.75 | -0.95 | ||||
| Siberian Federal District | 0.34 | 0.24 | -1.73 | -0.94 | ||||
| Far Eastern Federal District | 1.342 | 0.45 | -1.85 | -0.92 | ||||
| Internet users, % of population | ||||||||
| 2018 | 2019 | 2020 | 2021 | |||||
| Central Federal District | 78.46 | 80.1 | 80.66 | 85.16 | ||||
| Northwestern Federal District | 79.26 | 81.76 | 81.96 | 86.4 | ||||
| Southern Federal District | 82.53 | 80.66 | 85.46 | 89.83 | ||||
| North Caucasian Federal District | 81.53 | 82.33 | 86.2 | 89.16 | ||||
| Volga Federal District | 73.46 | 77.46 | 81.7 | 82.5 | ||||
| Ural Federal District | 80.76 | 81.26 | 84.43 | 87.2 | ||||
| Siberian Federal District | 77.36 | 81.63 | 83.53 | 89.9 | ||||
| Far Eastern Federal District | 82.43 | 83.4 | 88.83 | 91.16 | ||||
| Use of broadband Internet access, % of organizations | ||||||||
| 2018 | 2019 | 2020 | 2021 | |||||
| Central Federal District | 89.33 | 88.7 | 66.63 | 79.83 | ||||
| Northwestern Federal District | 89.23 | 88.76 | 62.03 | 76.3 | ||||
| Southern Federal District | 85.03 | 85.63 | 55.46 | 74.06 | ||||
| North Caucasian Federal District | 80.03 | 74.7 | 43.2 | 65.83 | ||||
| Volga Federal District | 89.83 | 89.3 | 61.36 | 78.06 | ||||
| Ural Federal District | 83.13 | 83.76 | 59.93 | 76 | ||||
| Siberian Federal District | 82.43 | 83.76 | 59.1 | 79.46 | ||||
| Far Eastern Federal District | 81.53 | 83.46 | 63.16 | 76.36 | ||||
| Use of servers, % of organizations | ||||||||
| 2018 | 2019 | 2020 | 2021 | |||||
| Central Federal District | 51.3 | 58.23 | 52.4 | 46.13 | ||||
| Northwestern Federal District | 57.3 | 59.36 | 51.56 | 44.3 | ||||
| Southern Federal District | 41.46 | 51 | 40.33 | 39.43 | ||||
| North Caucasian Federal District | 31.66 | 31.36 | 31.1 | 31.6 | ||||
| Volga Federal District | 49.8 | 56.83 | 48.43 | 43.63 | ||||
| Ural Federal District | 49.73 | 55.06 | 49.03 | 44.5 | ||||
| Siberian Federal District | 38.6 | 52.03 | 47.53 | 43.4 | ||||
| Far Eastern Federal District | 51.3 | 58.13 | 52.23 | 45.9 | ||||
| Use of local area networks, % of organizations | ||||||||
| 2018 | 2019 | 2020 | 2021 | |||||
| Central Federal District | 67.4 | 67 | 63.63 | 60.23 | ||||
| Northwestern Federal District | 61.96 | 62.6 | 55.03 | 54.53 | ||||
| Southern Federal District | 56.9 | 64.53 | 50.66 | 54.6 | ||||
| North Caucasian Federal District | 41.96 | 44.4 | 35.13 | 41.3 | ||||
| Volga Federal District | 67.73 | 66.8 | 58.13 | 57.83 | ||||
| Ural Federal District | 62 | 65.06 | 57.8 | 59.1 | ||||
| Siberian Federal District | 57.36 | 59.9 | 57.33 | 58.9 | ||||
| Far Eastern Federal District | 67 | 66.73 | 61.53 | 60.16 | ||||
| Use of cloud services, % of organizations | ||||||||
| 2018 | 2019 | 2020 | 2021 | |||||
| Central Federal District | 21.13 | 31.86 | 30.16 | 30.16 | ||||
| Northwestern Federal District | 22.66 | 33.4 | 31.06 | 30.86 | ||||
| Southern Federal District | 17.03 | 26.76 | 22.23 | 24.86 | ||||
| North Caucasian Federal District | 15.46 | 27.73 | 23.23 | 26.26 | ||||
| Volga Federal District | 19.73 | 34 | 31 | 32.13 | ||||
| Ural Federal District | 17.93 | 25.7 | 24.46 | 25.53 | ||||
| Siberian Federal District | 15.7 | 25.7 | 23.16 | 24.66 | ||||
| Far Eastern Federal District | 14.46 | 24.43 | 23.56 | 25.33 | ||||
Table 11.
Average values of indicators for 2018-2021 by federal districts.
| Group of ICT indicators subsystem | Group of material indicators | |||||
| Human Development Index, % Growth | Internet users, % of population | Use of broadband Internet access, % of organizations | Use of servers, % of organizations | Use of local area networks, % of organizations | Use of cloud services, % of organizations | |
| Central Federal District | -0.93 | 85.16 | 79.83 | 46.13 | 60.23 | 30.16 |
| Northwestern Federal District | -0.93 | 86.4 | 76.3 | 44.3 | 54.53 | 30.86 |
| Southern Federal District | -0.95 | 89.83 | 74.06 | 39.43 | 54.6 | 24.86 |
| North Caucasian Federal District | -1 | 89.16 | 65.83 | 31.6 | 41.3 | 26.26 |
| Volga Federal District | -0.94 | 82.5 | 78.06 | 43.63 | 57.83 | 32.13 |
| Ural Federal District | -0.95 | 87.2 | 76 | 44.5 | 59.1 | 25.53 |
| Siberian Federal District | -0.94 | 89.9 | 79.46 | 43.4 | 58.9 | 24.66 |
| Far Eastern Federal District | -0.92 | 91.16 | 76.36 | 45.9 | 60.16 | 25.33 |
Table 13.
Composition of clusters created using the k-means method.
| No | Number of elements in a cluster | Composition of elements in a cluster |
| 1 | 4 | Central Federal District, Volga Federal District, Northwestern Federal District, Ural Federal District, |
| 2 | 3 | Southern Federal District, Siberian Federal District, Far Eastern Federal District |
| 3 | 1 | North Caucasian Federal District |
Disclaimer/Publisher’s Note: The statements, opinions and data contained in all publications are solely those of the individual author(s) and contributor(s) and not of MDPI and/or the editor(s). MDPI and/or the editor(s) disclaim responsibility for any injury to people or property resulting from any ideas, methods, instructions or products referred to in the content. |
© 2024 by the authors. Licensee MDPI, Basel, Switzerland. This article is an open access article distributed under the terms and conditions of the Creative Commons Attribution (CC BY) license (http://creativecommons.org/licenses/by/4.0/).
Copyright: This open access article is published under a Creative Commons CC BY 4.0 license, which permit the free download, distribution, and reuse, provided that the author and preprint are cited in any reuse.


