
Submitted:
16 December 2024
Posted:
17 December 2024
You are already at the latest version
Abstract
This research work describes the synthesis of Ag-ZnO nanocomposites by combustion method using citrus clementina peels as an effective adsorbent material for removal of dyes. Water is an essential element for life. However, critical environmental issue of 20th century is water scarcity. Water has a wide-ranging effect on all aspects of human life, a serious hazard to public health and stability of food chain. Due to human activities the waste from our industrial, agricultural, and daily activities frequently pollutes the water. Therefore, there is an urgent need to develop cost effective and sustainable technologies for the removal of contaminants from waste water. The synthesized nanocomposites were characterized by (FTIR), UV Visible, (XRD) and (SEM). Then tested their potential toward efficient removal of Eosin Y and Congo-Red from waste water by using cost effective Adsorption method. Different parameters i.e., Dosage, Time, Concentration, pH and temperature have been studied. During Linear adsorption isotherm Langmuir and Temkin isotherms are best fitted on the adsorption of Dyes. Thermodynamic and kinetic studies have also done, while Pseudo 2nd order kinetic model showed better agreement as compared with other kinetic models. Thus synthesized Ag-ZnO Nanocomposites confirmed as excellent adsorbent material for waste water treatment.

Keywords:
1. Introduction
2. Material and Method
2.1. General
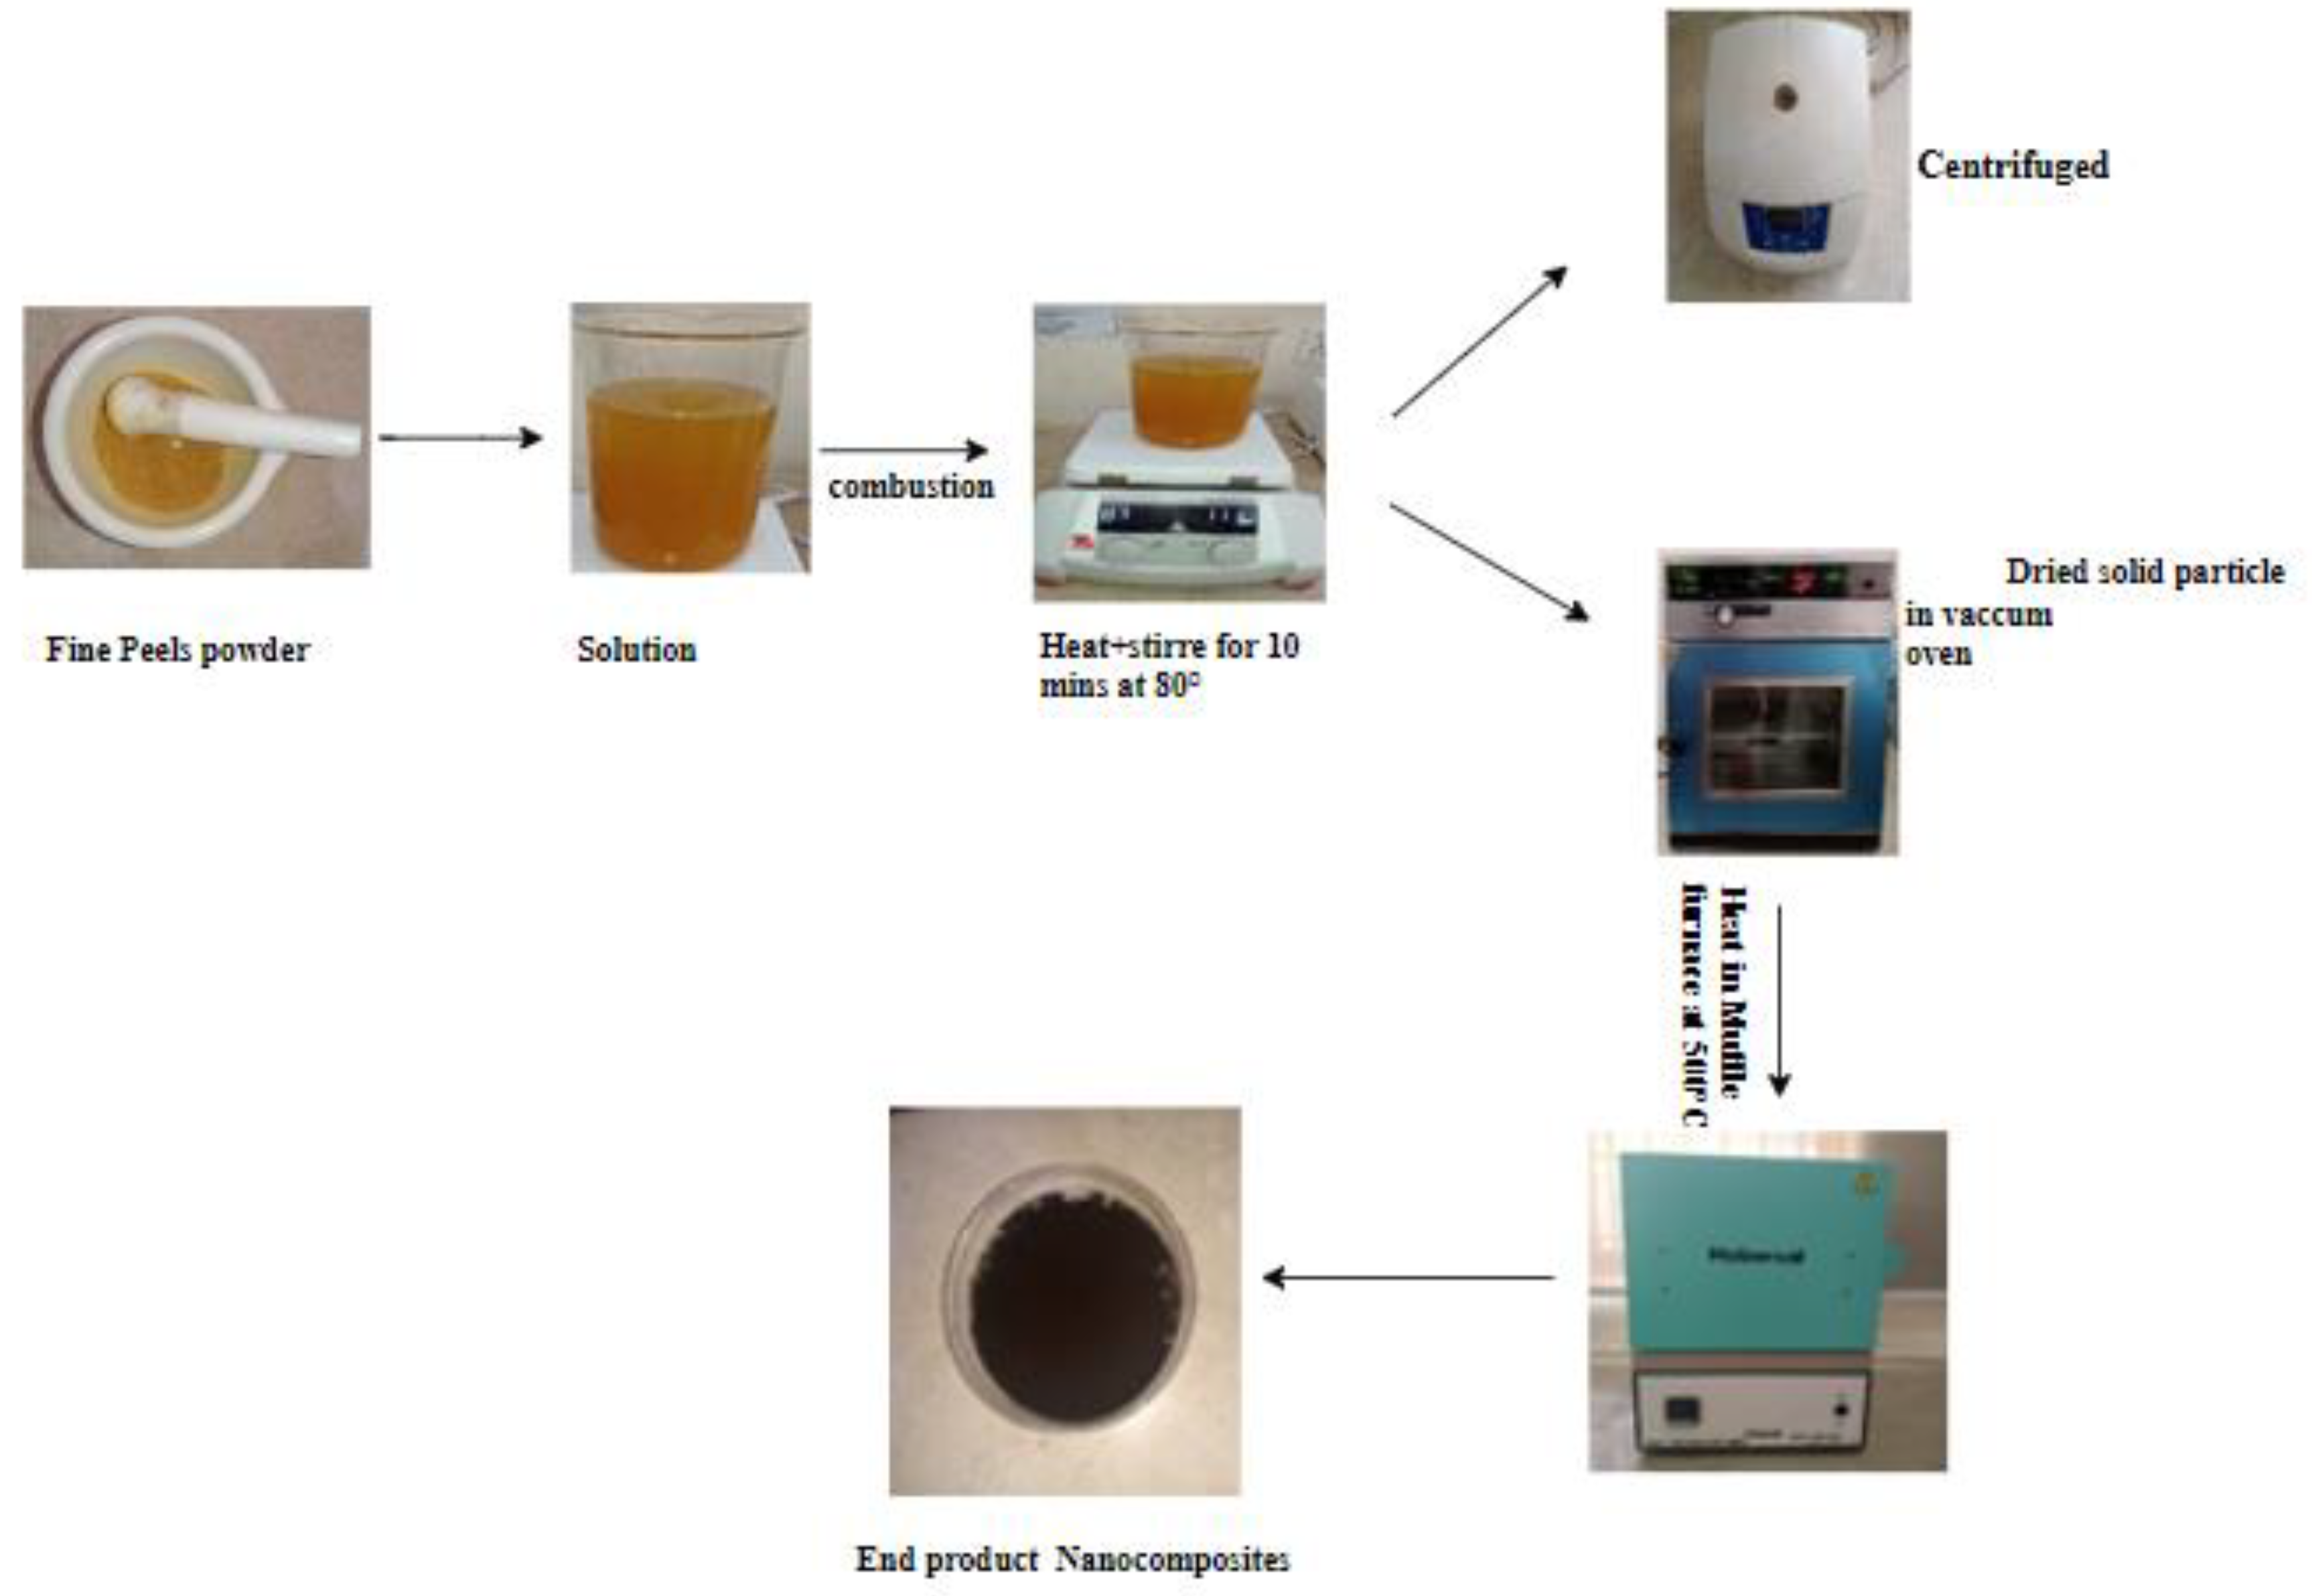
2.2. Synthesis of Nanocomposites
2.3. Characterization of NCs
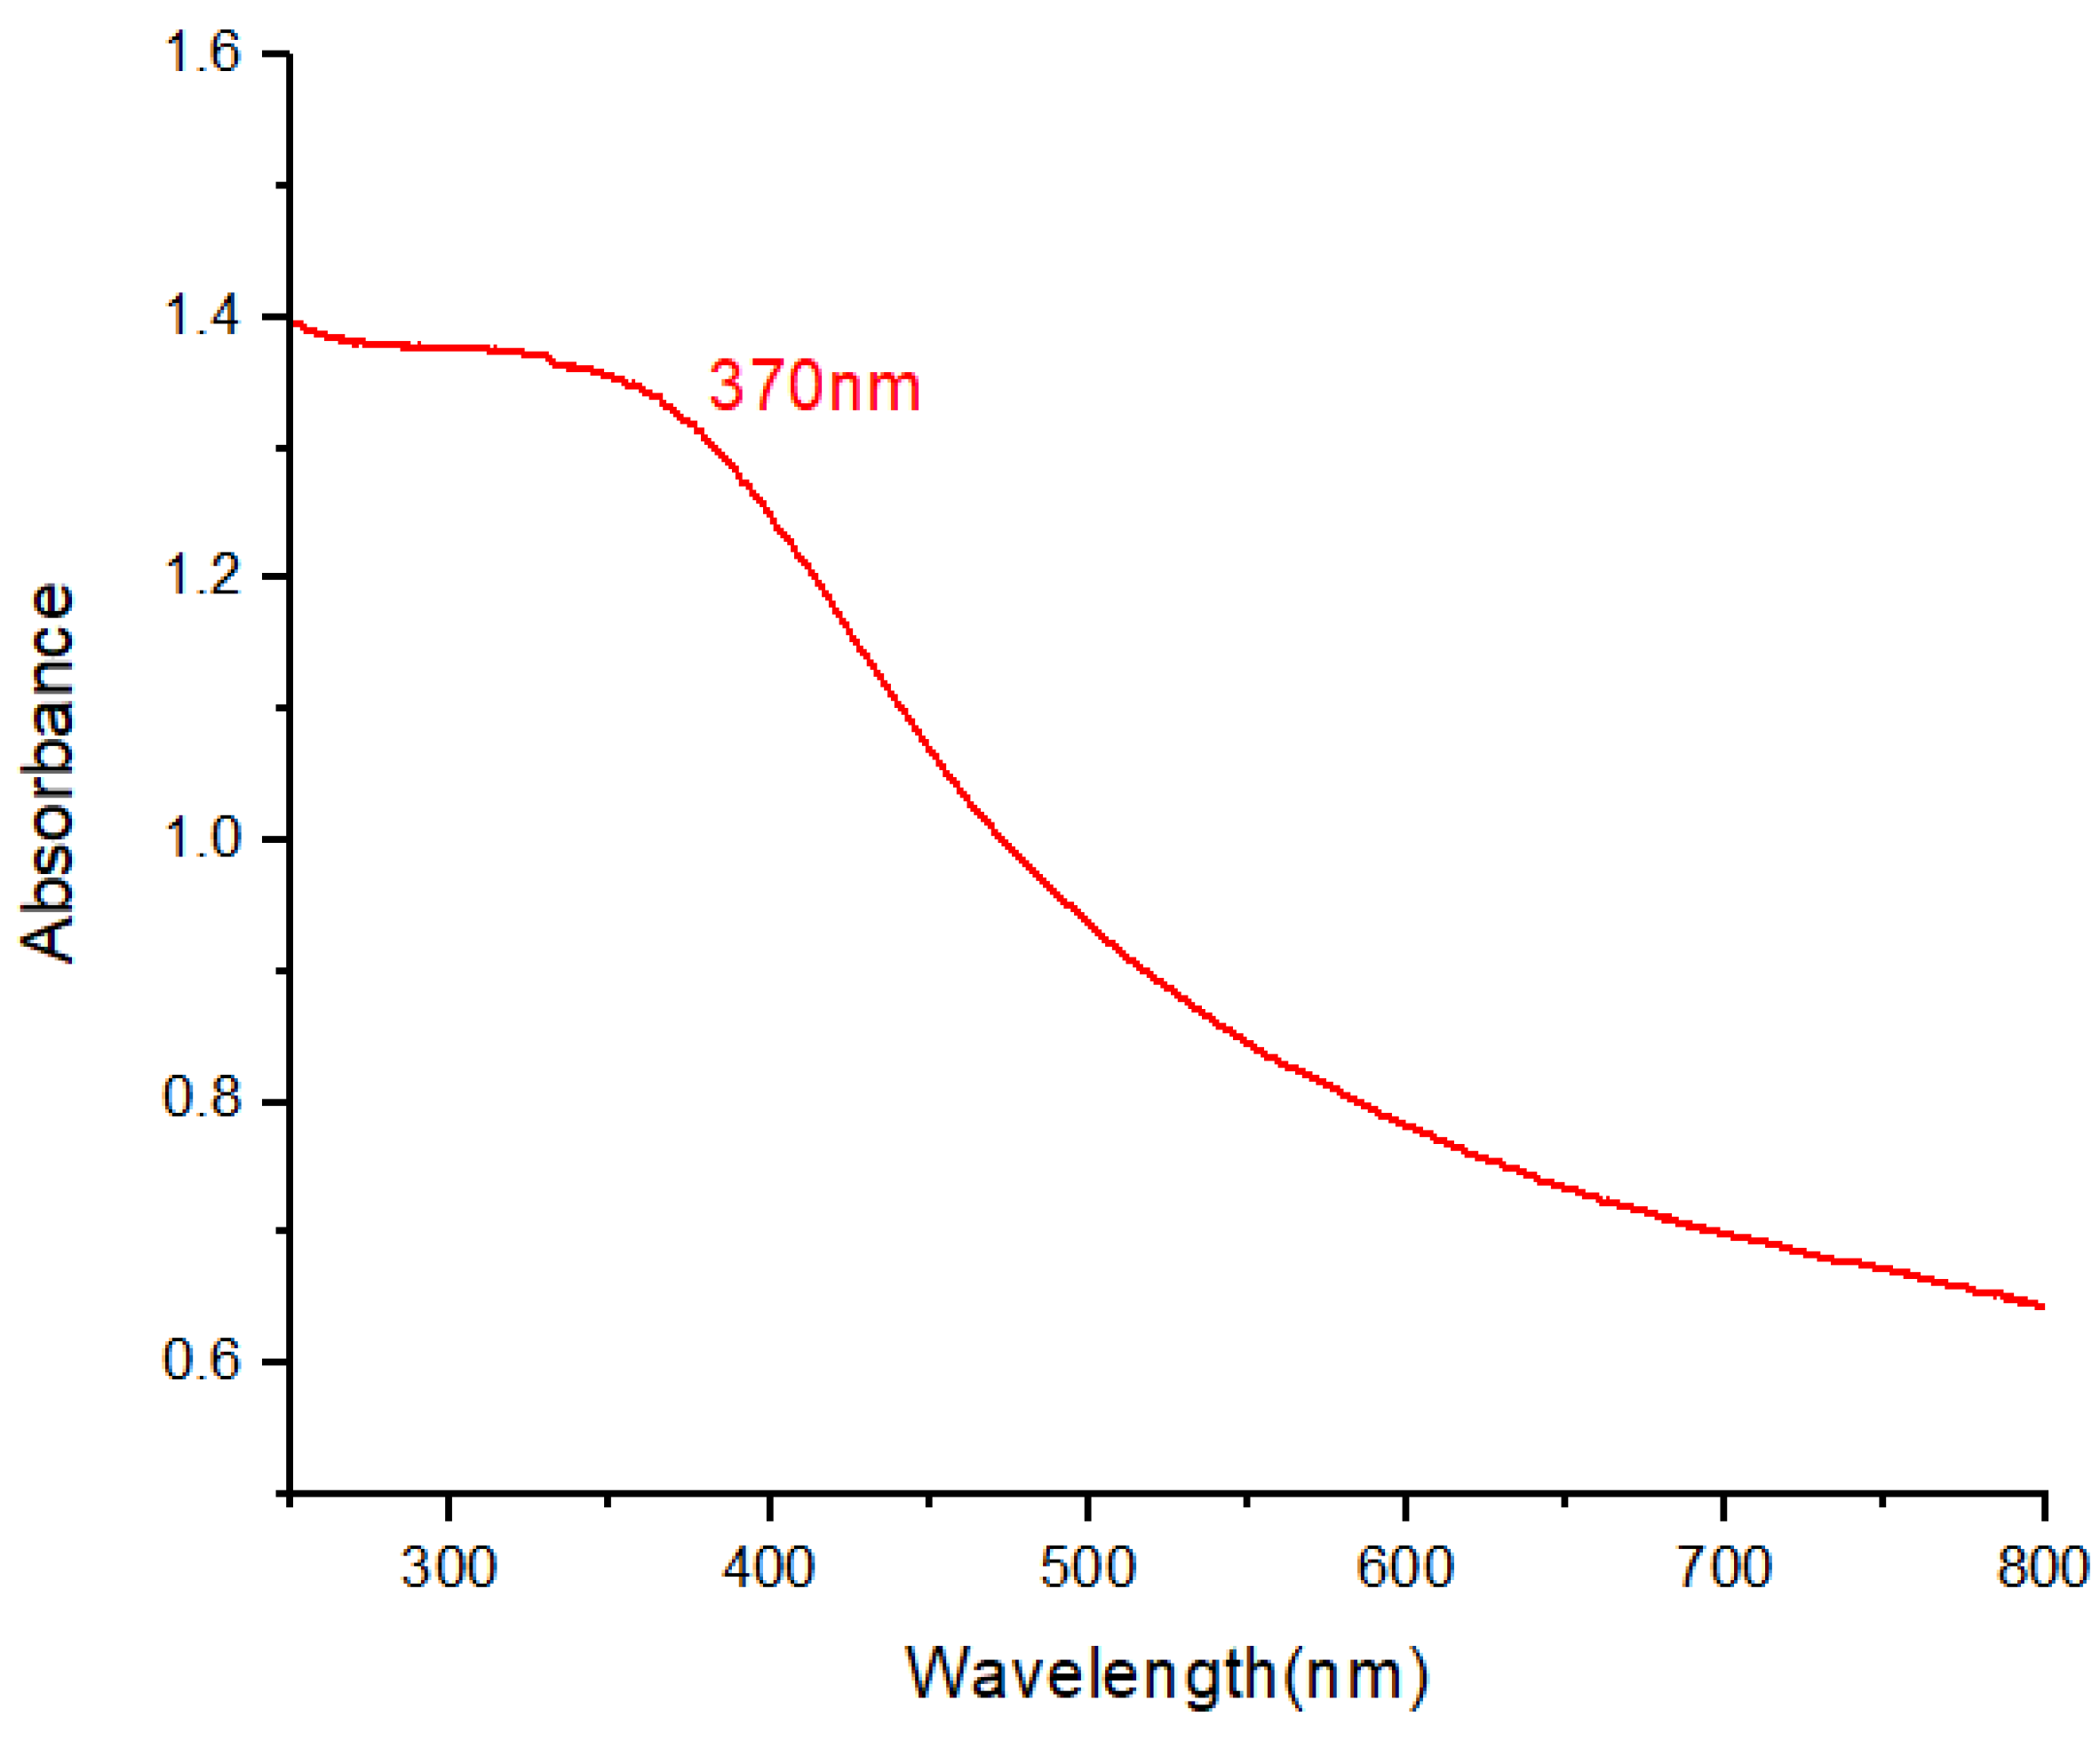
2.3.1. UV-Visible Spectroscopy
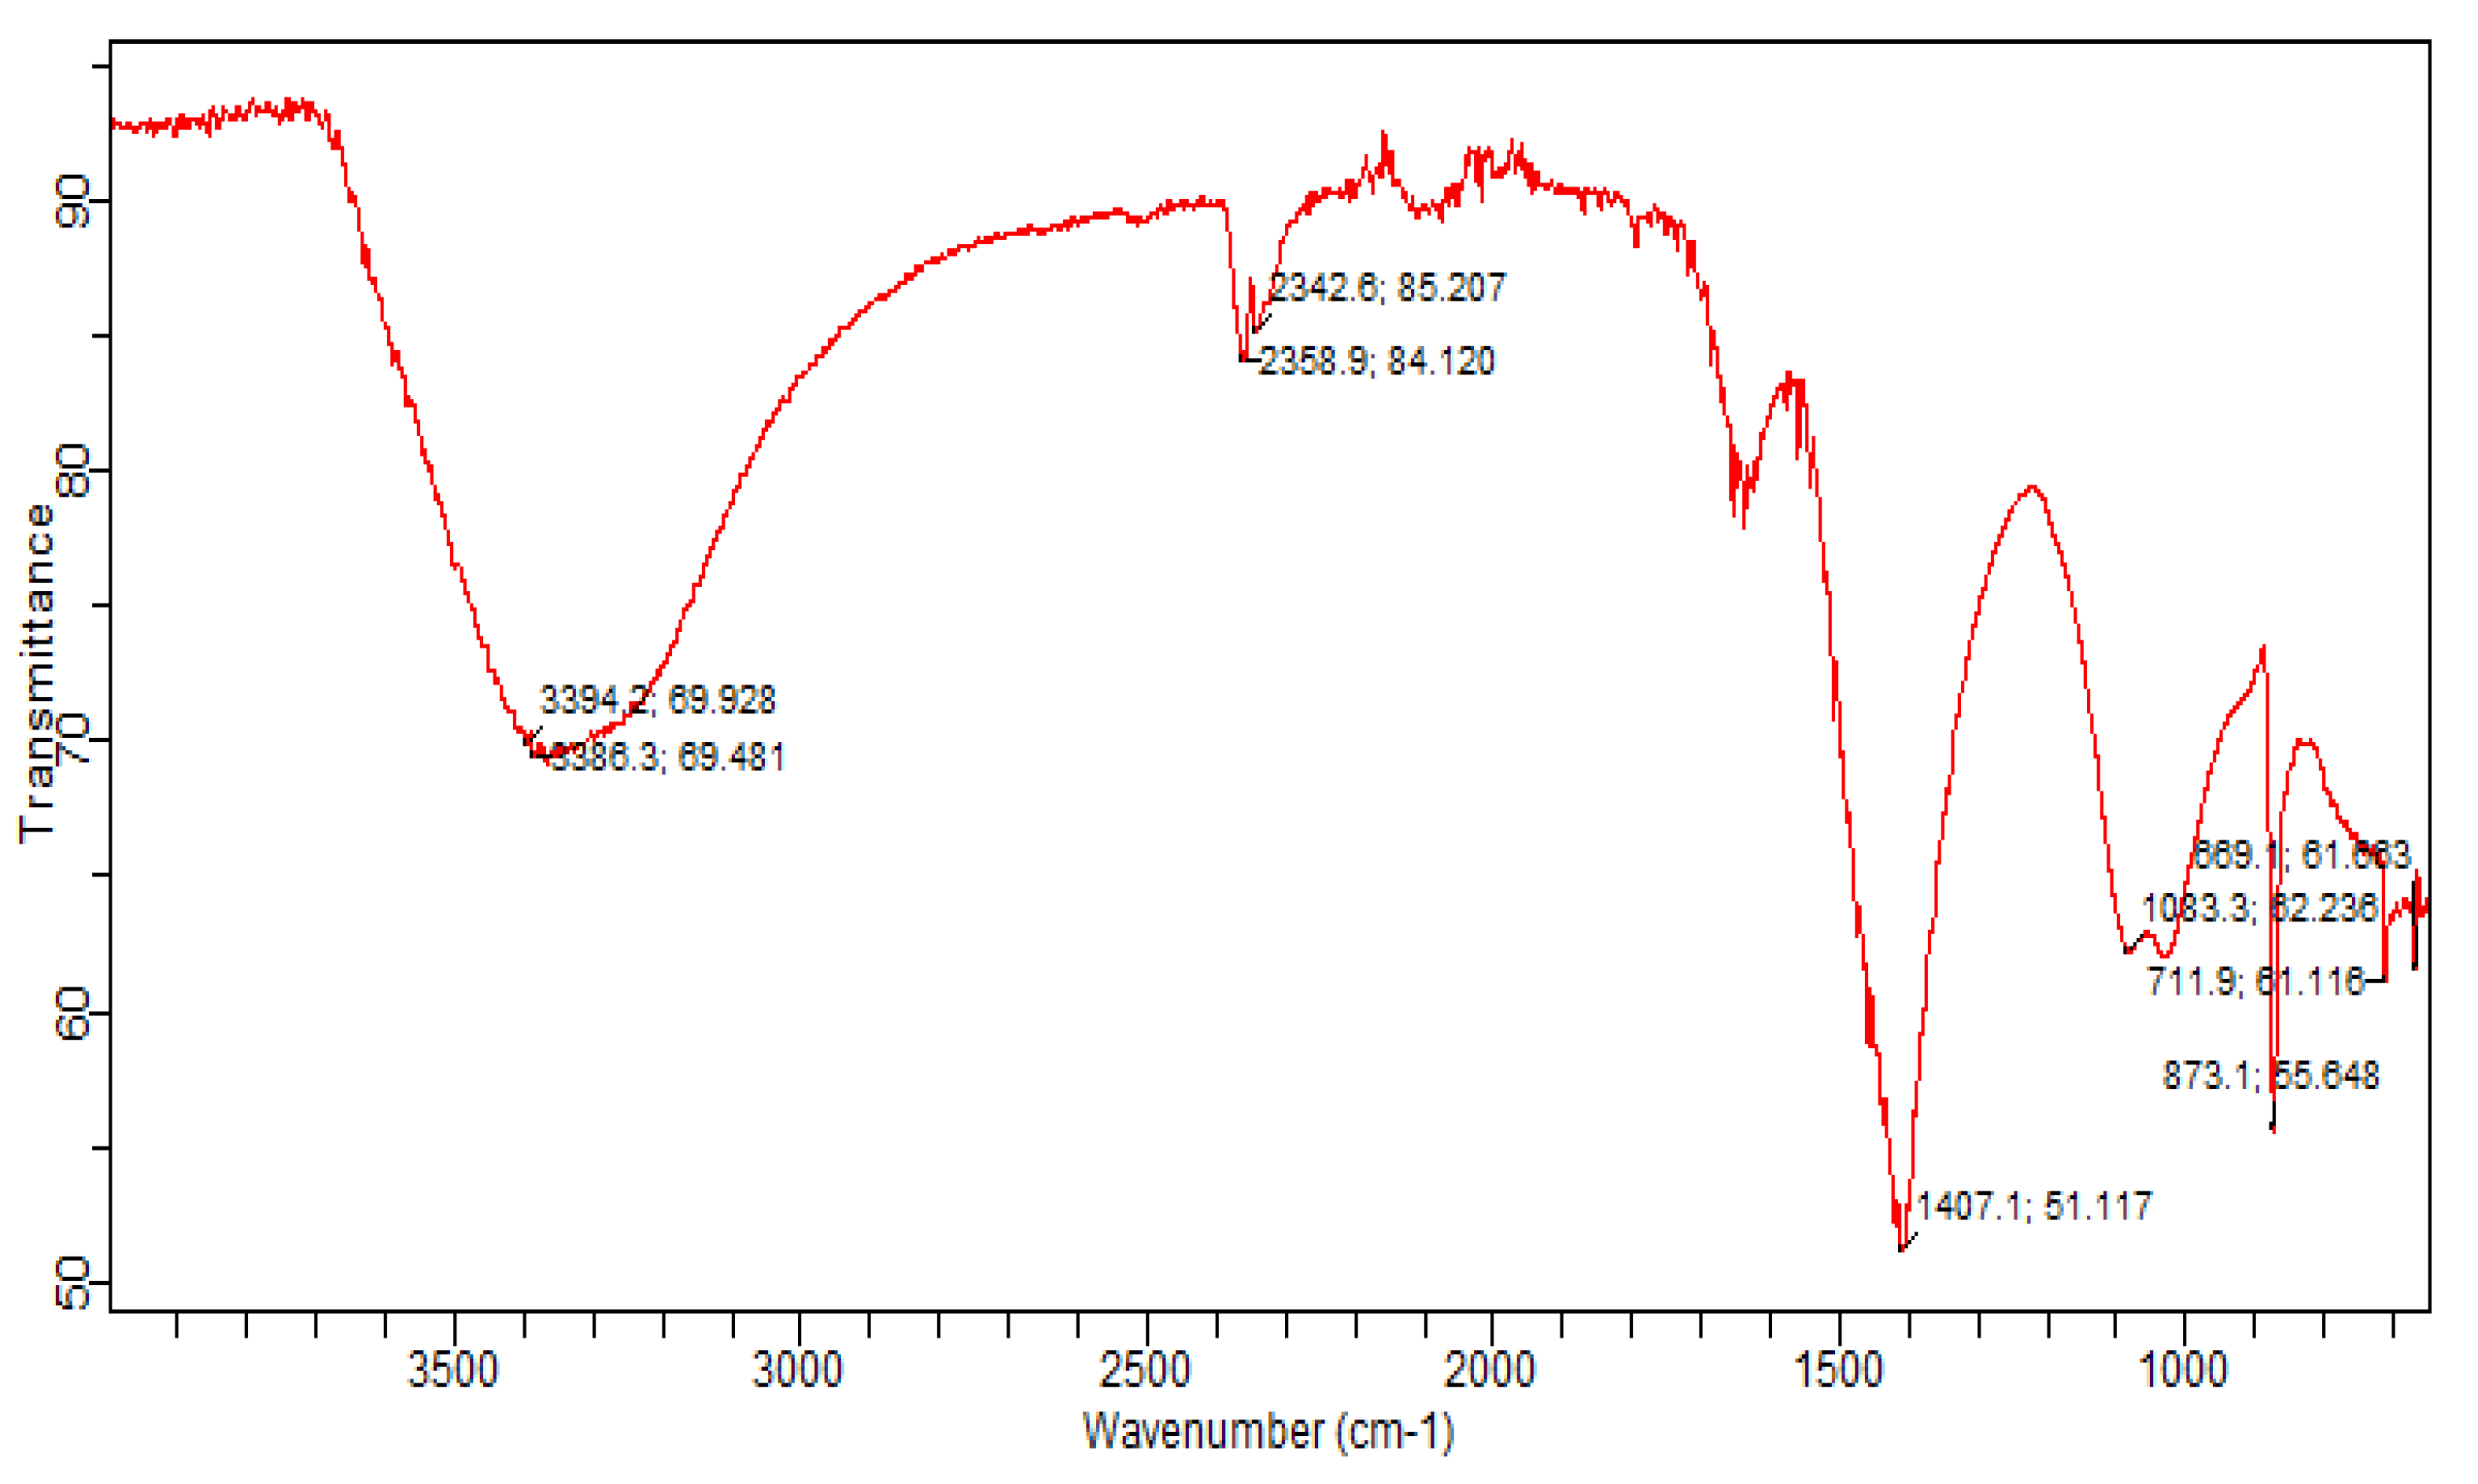
2.3.2. FTIR
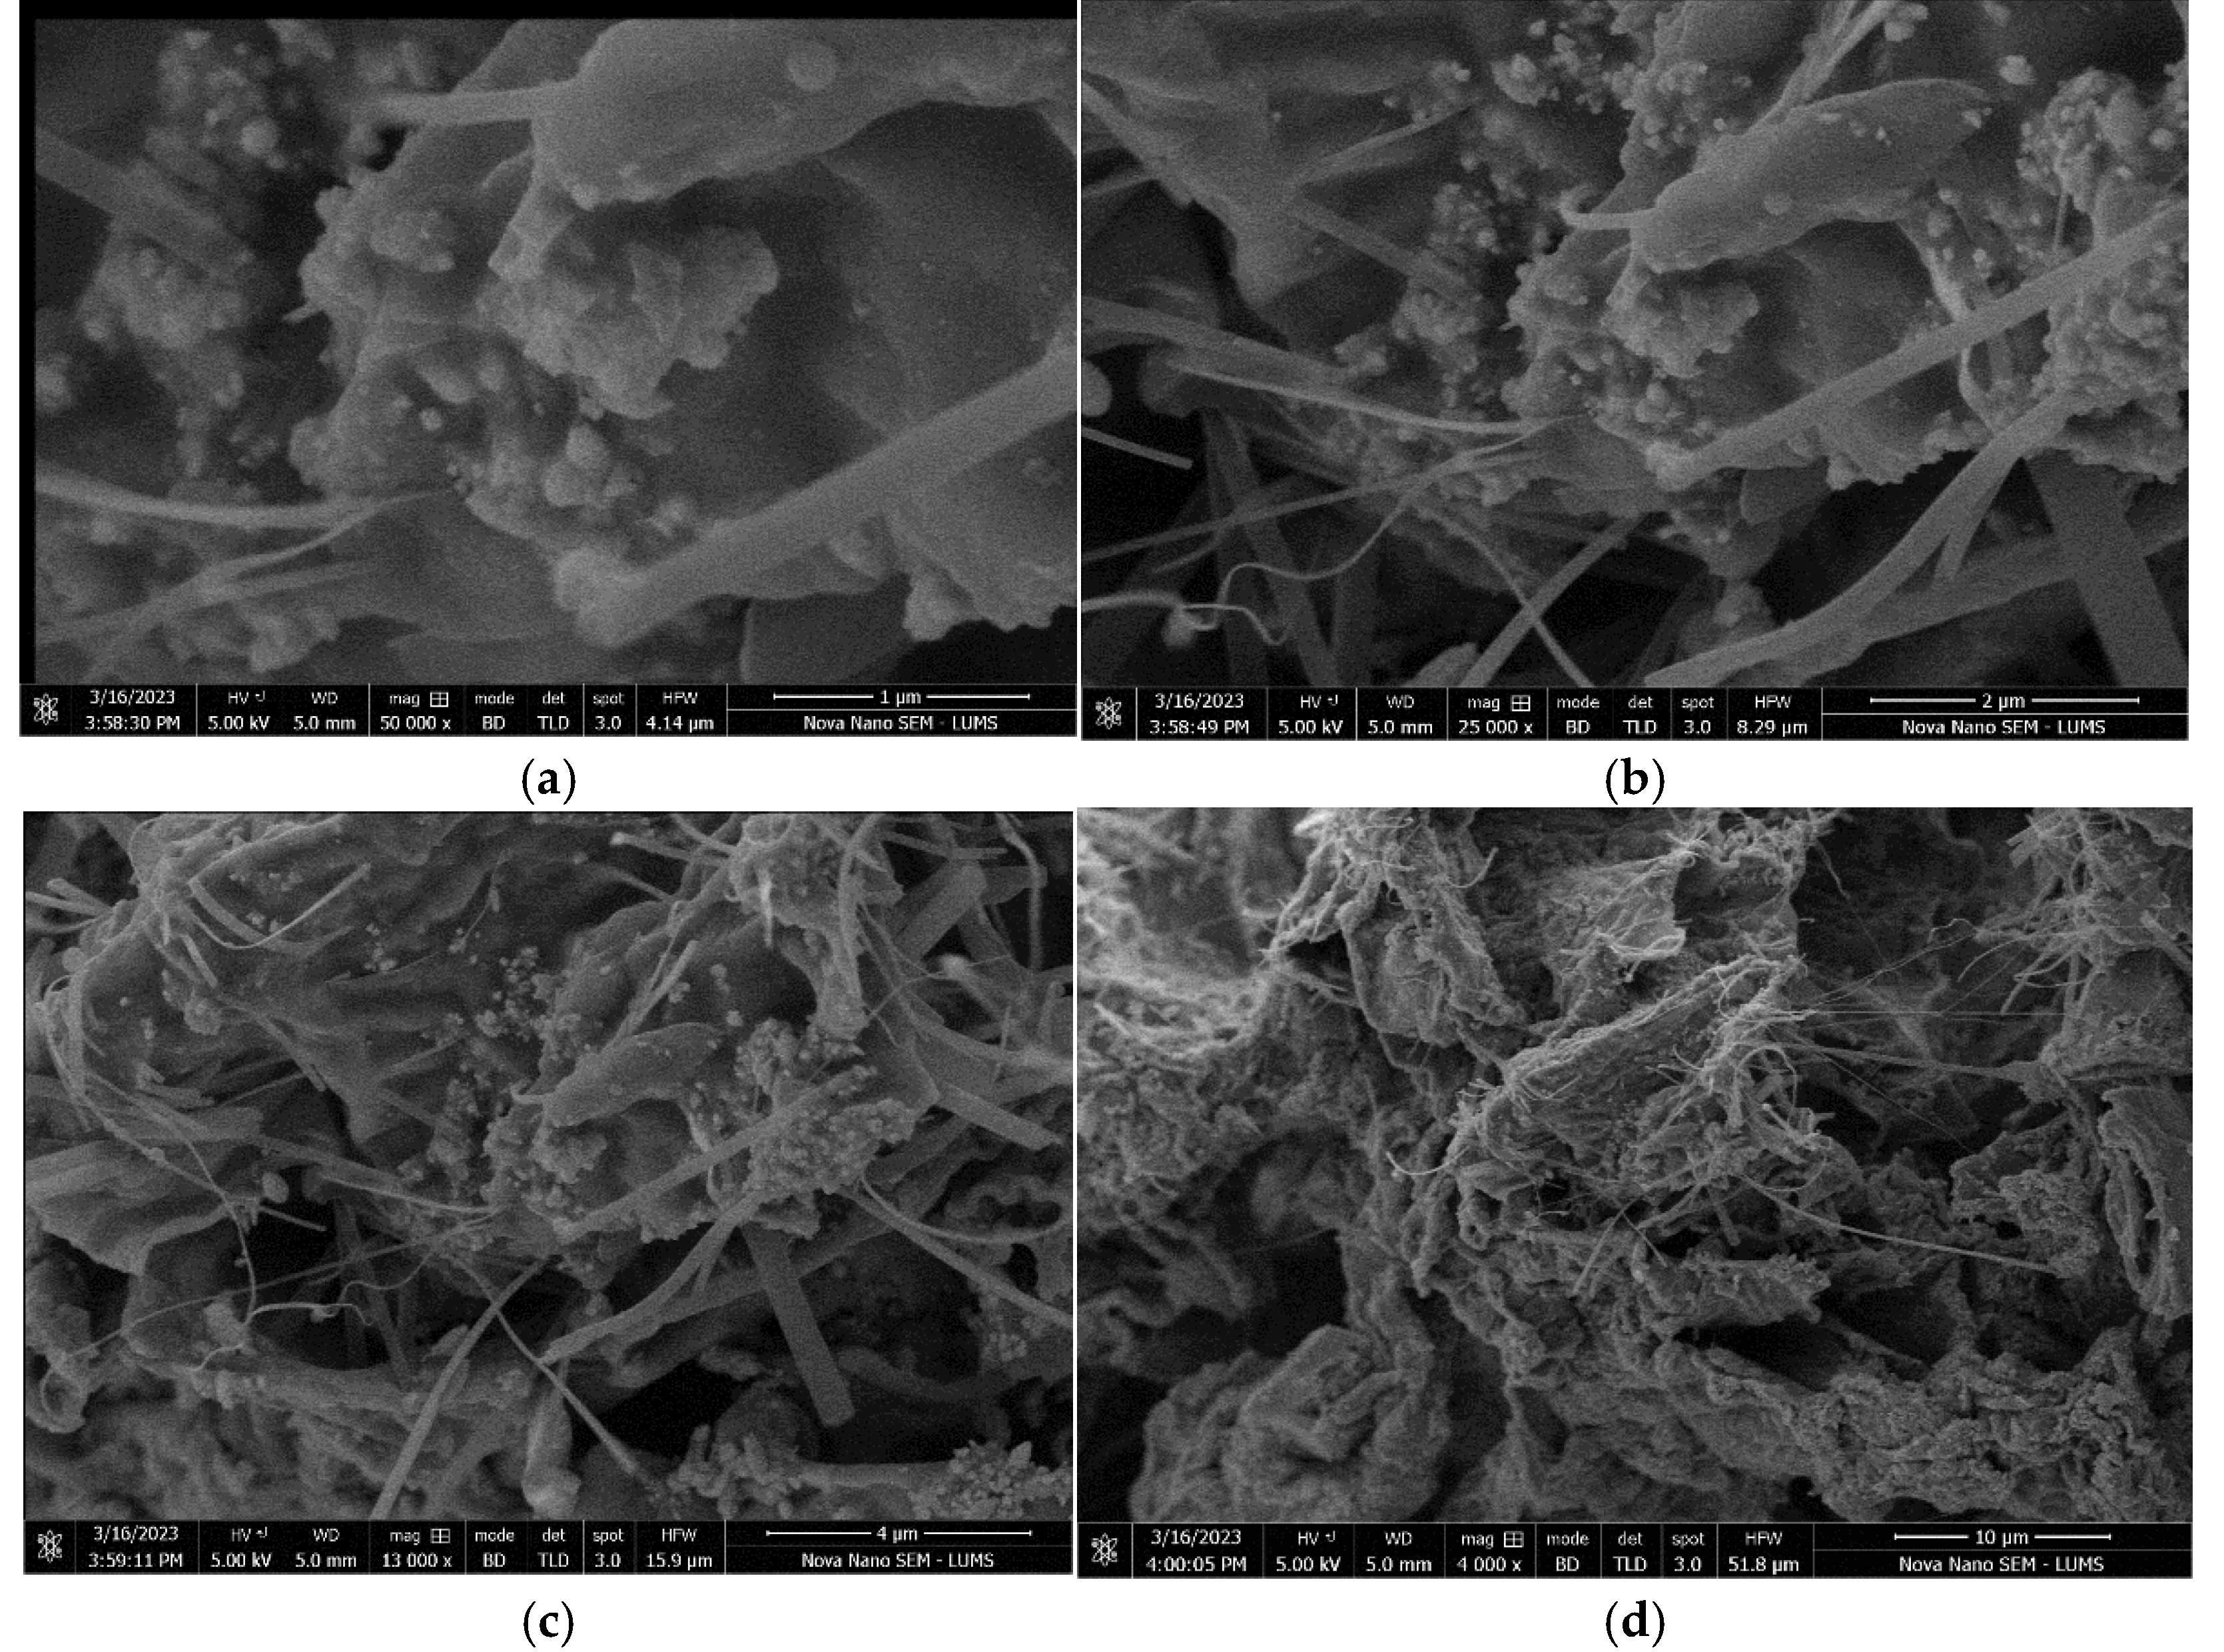
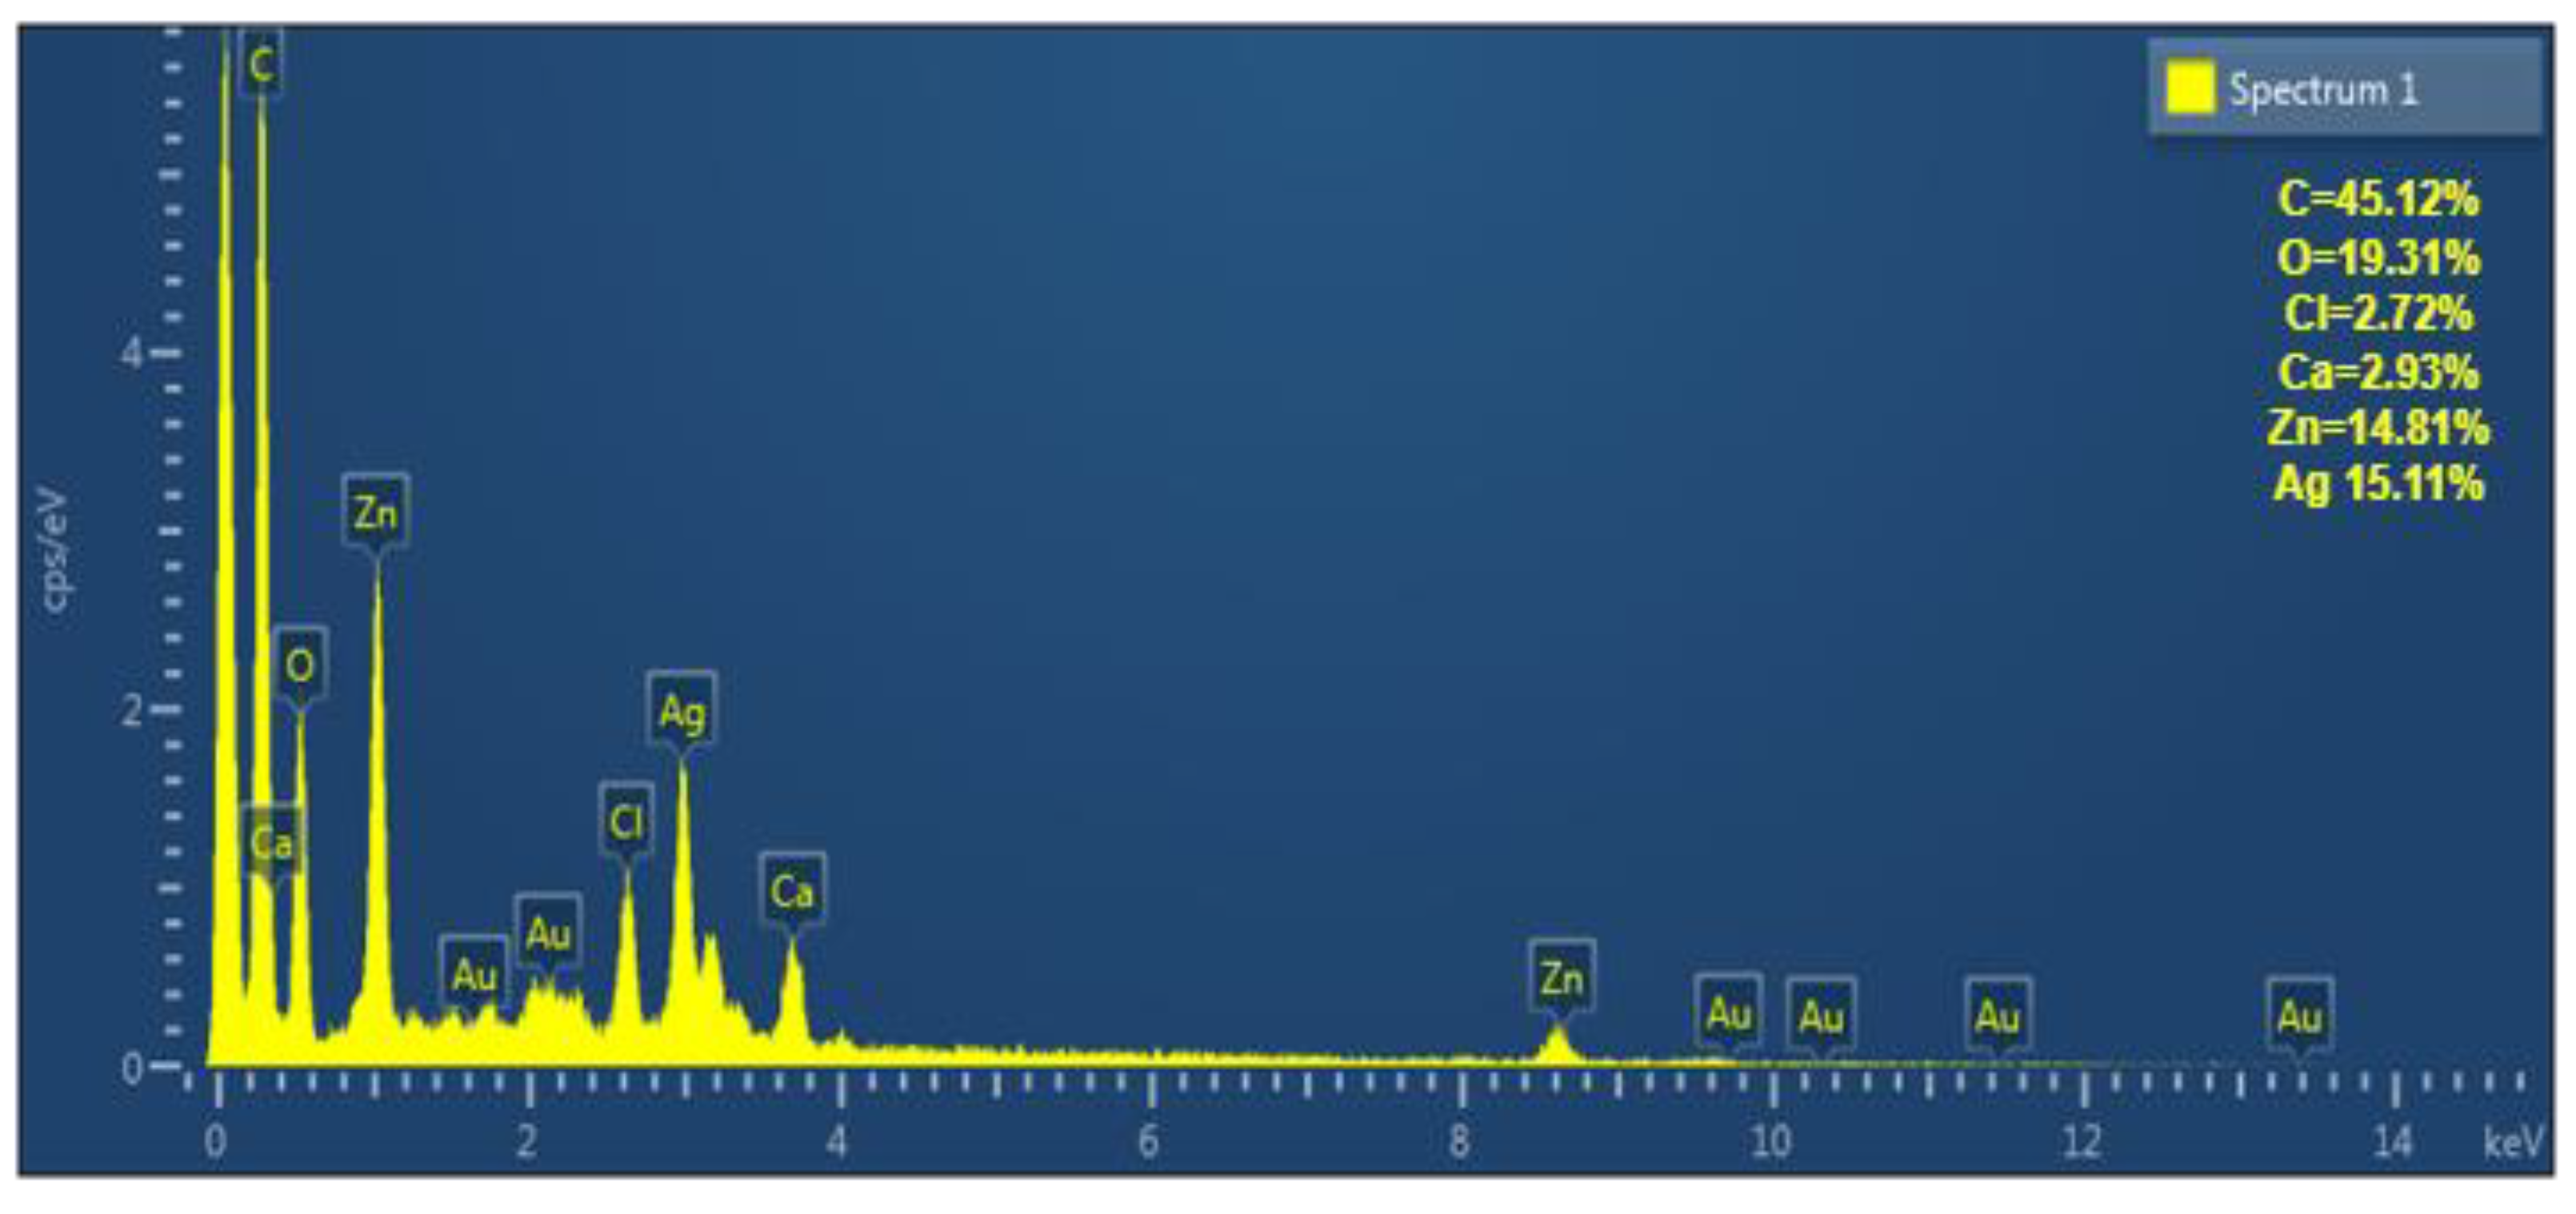
2.3.3. Scaning Electron Micoscope (SEM)
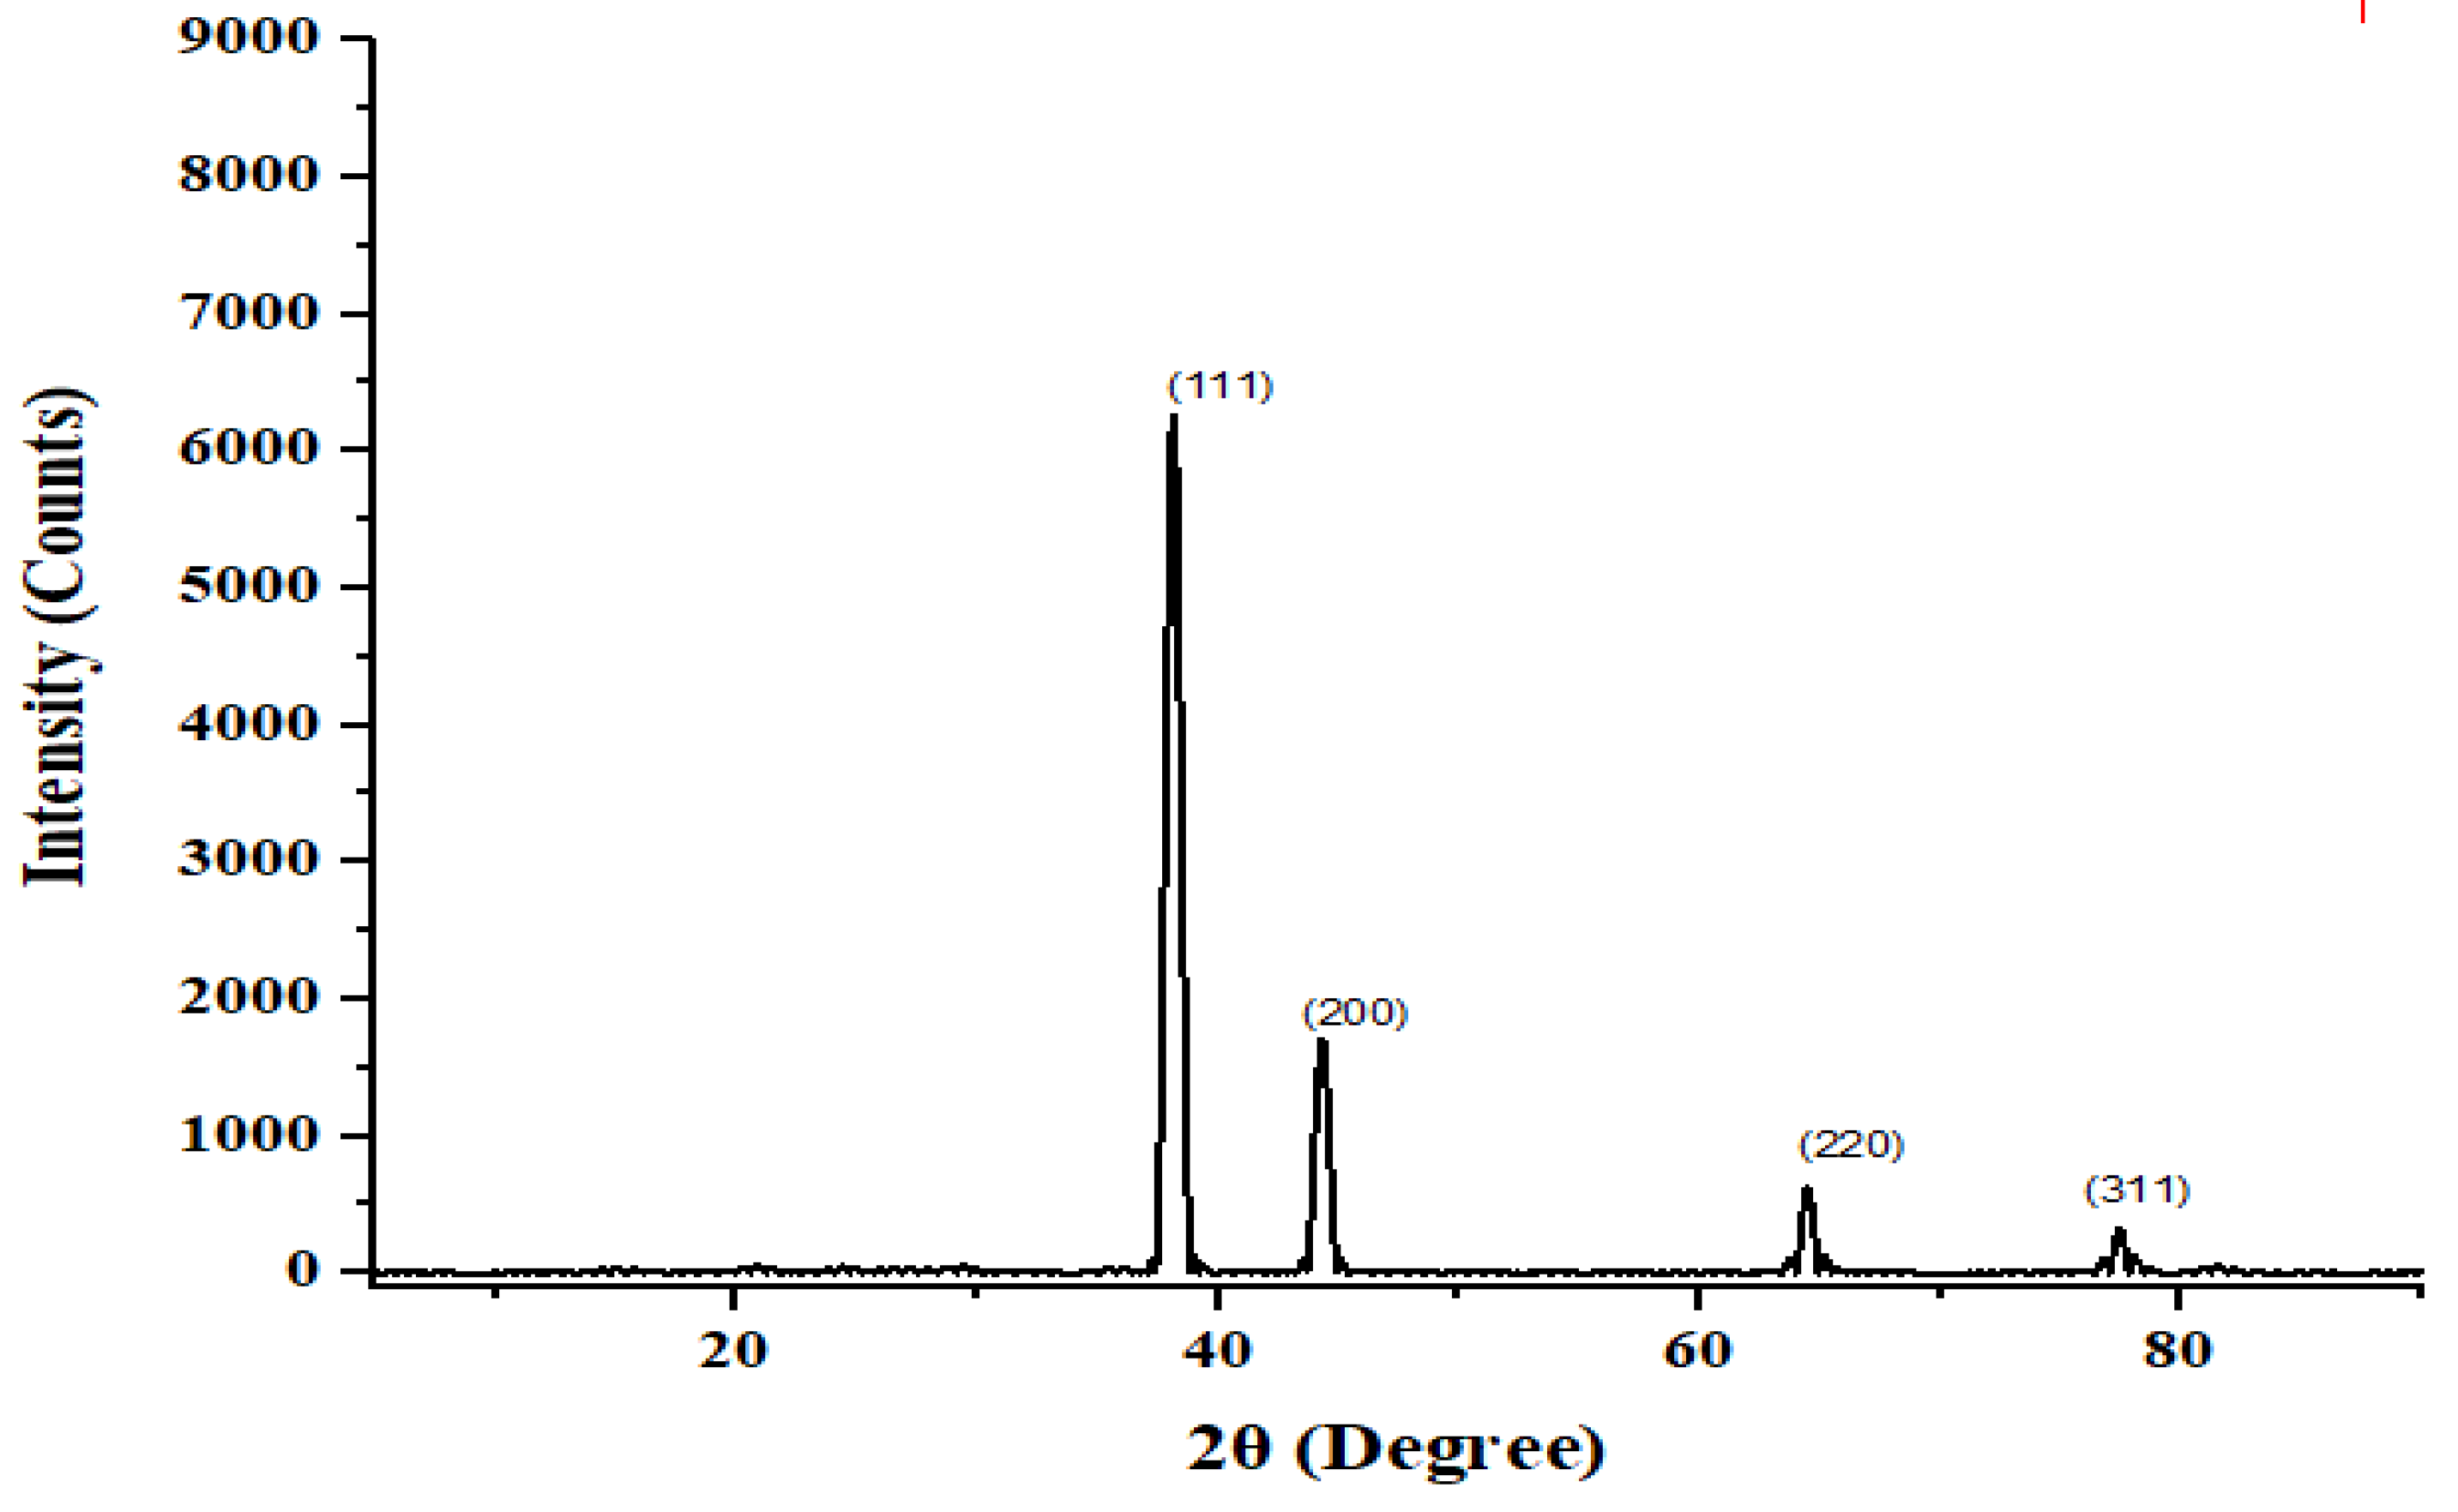
2.3.4. X-Ray Diffraction
2.3.5. Adsorption Studies
2.3.6. Kinetic Studies
2.3.7. Adsorption Isotherm
3. Results and Discussions
3.1. Optimization of Parameters for Dyes
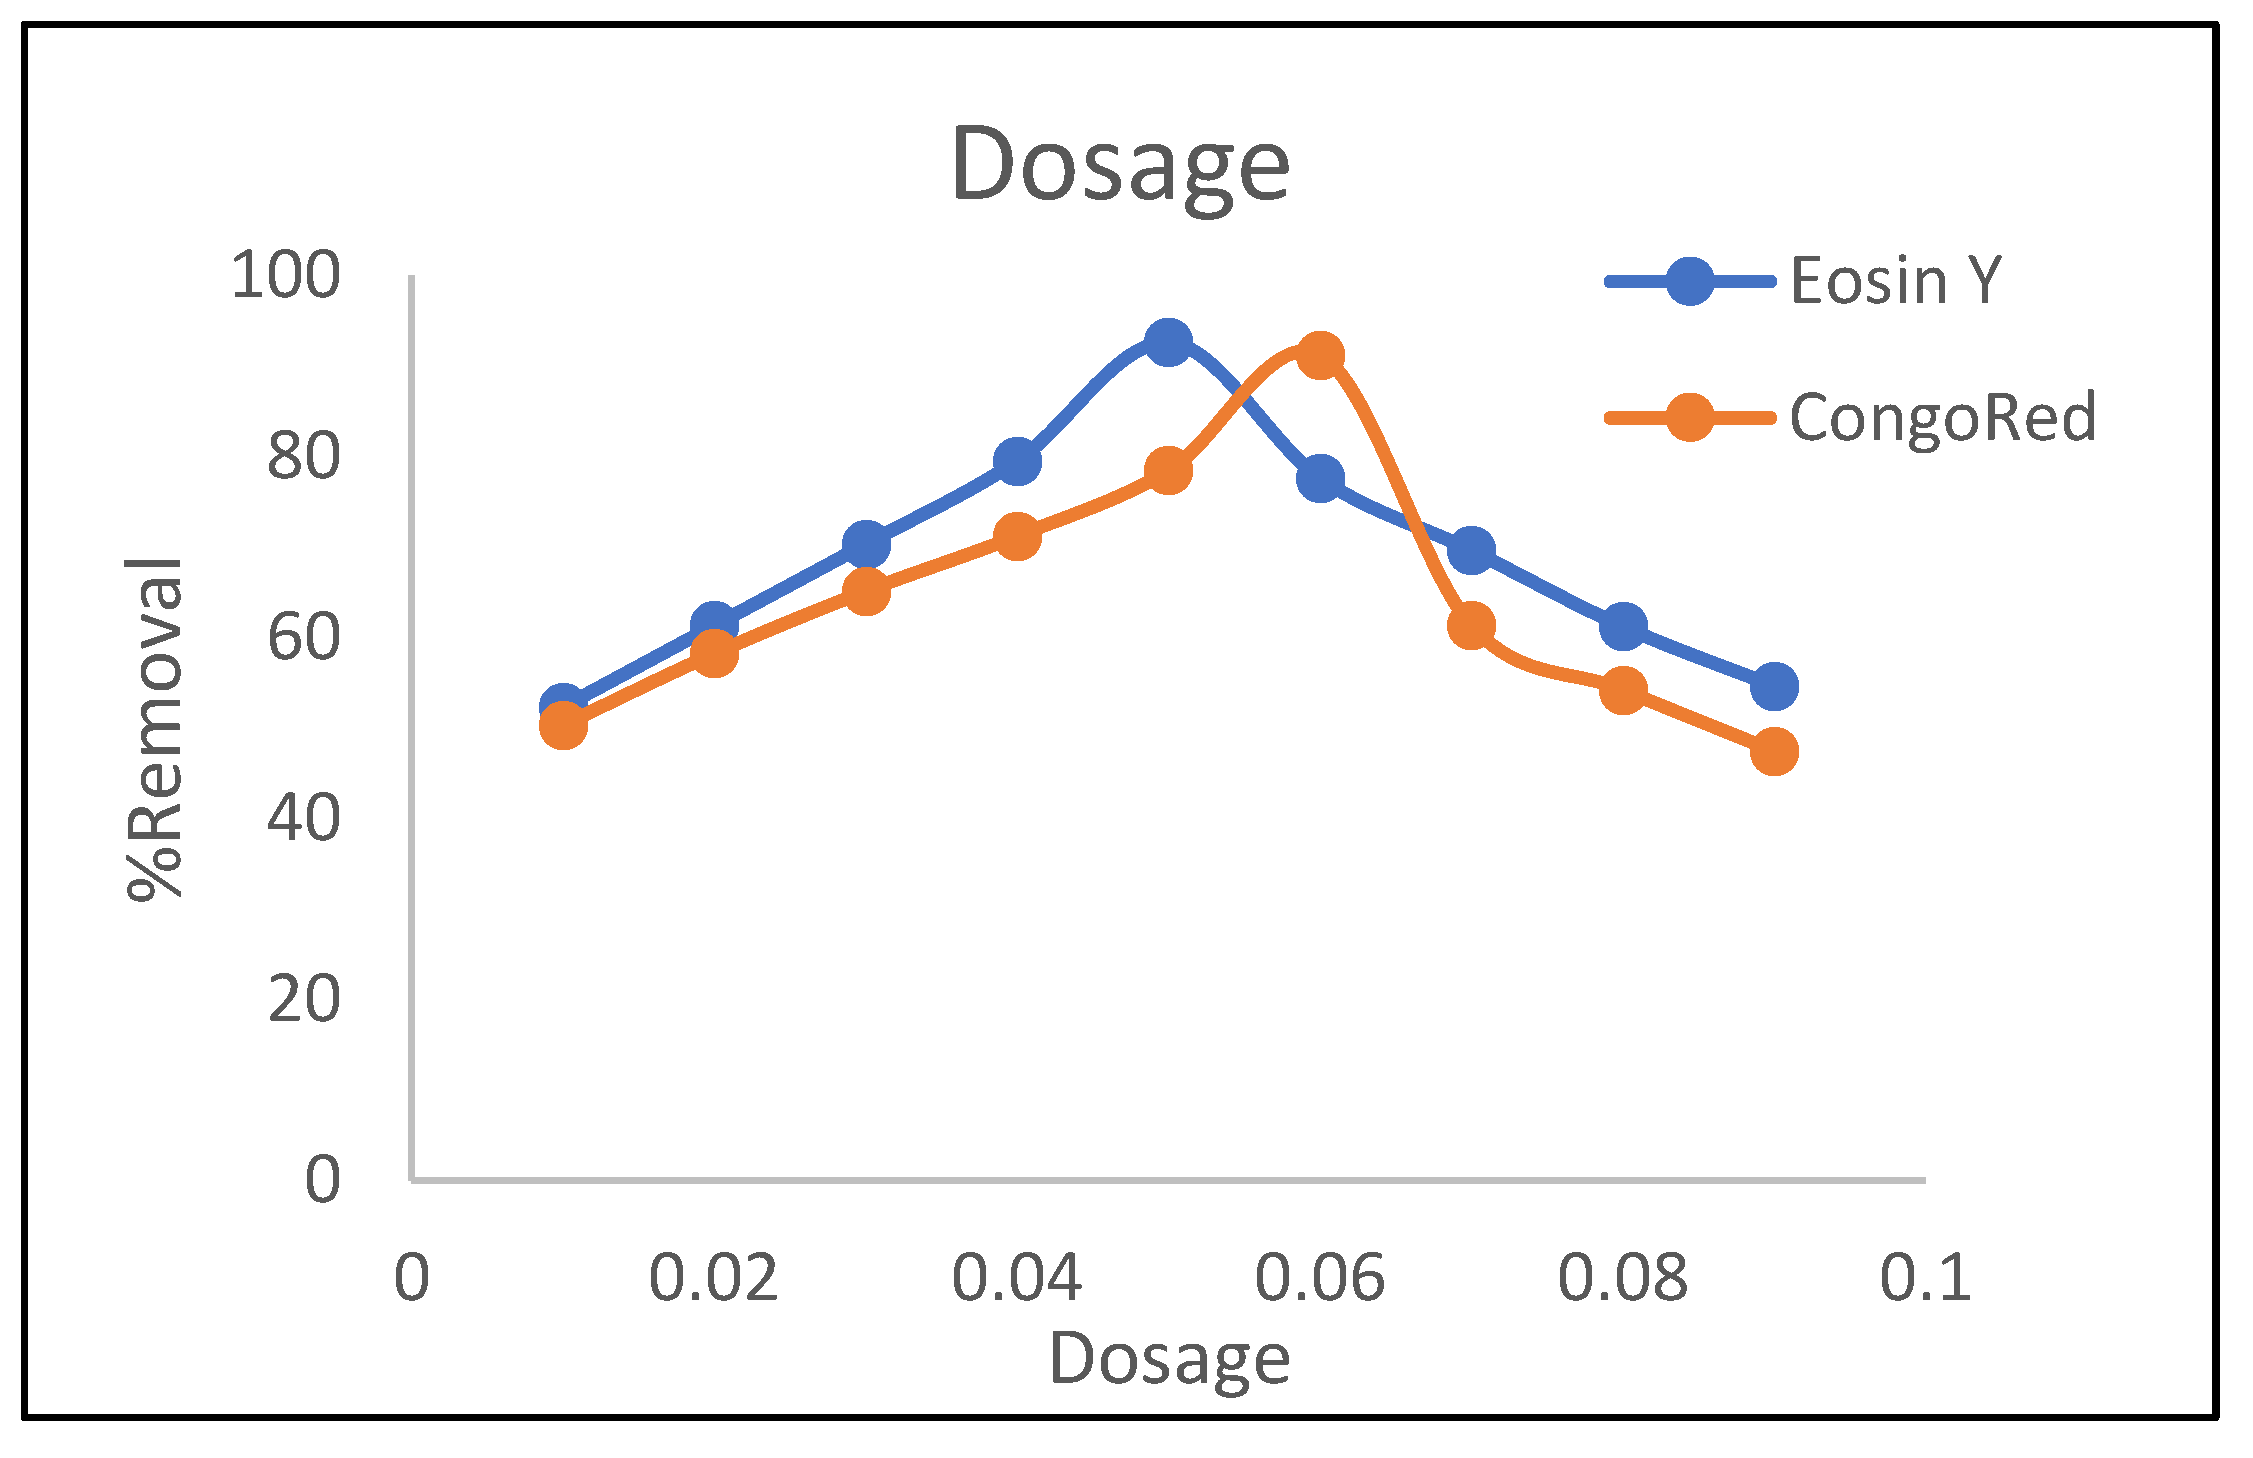
3.1.1. Dosage Effect
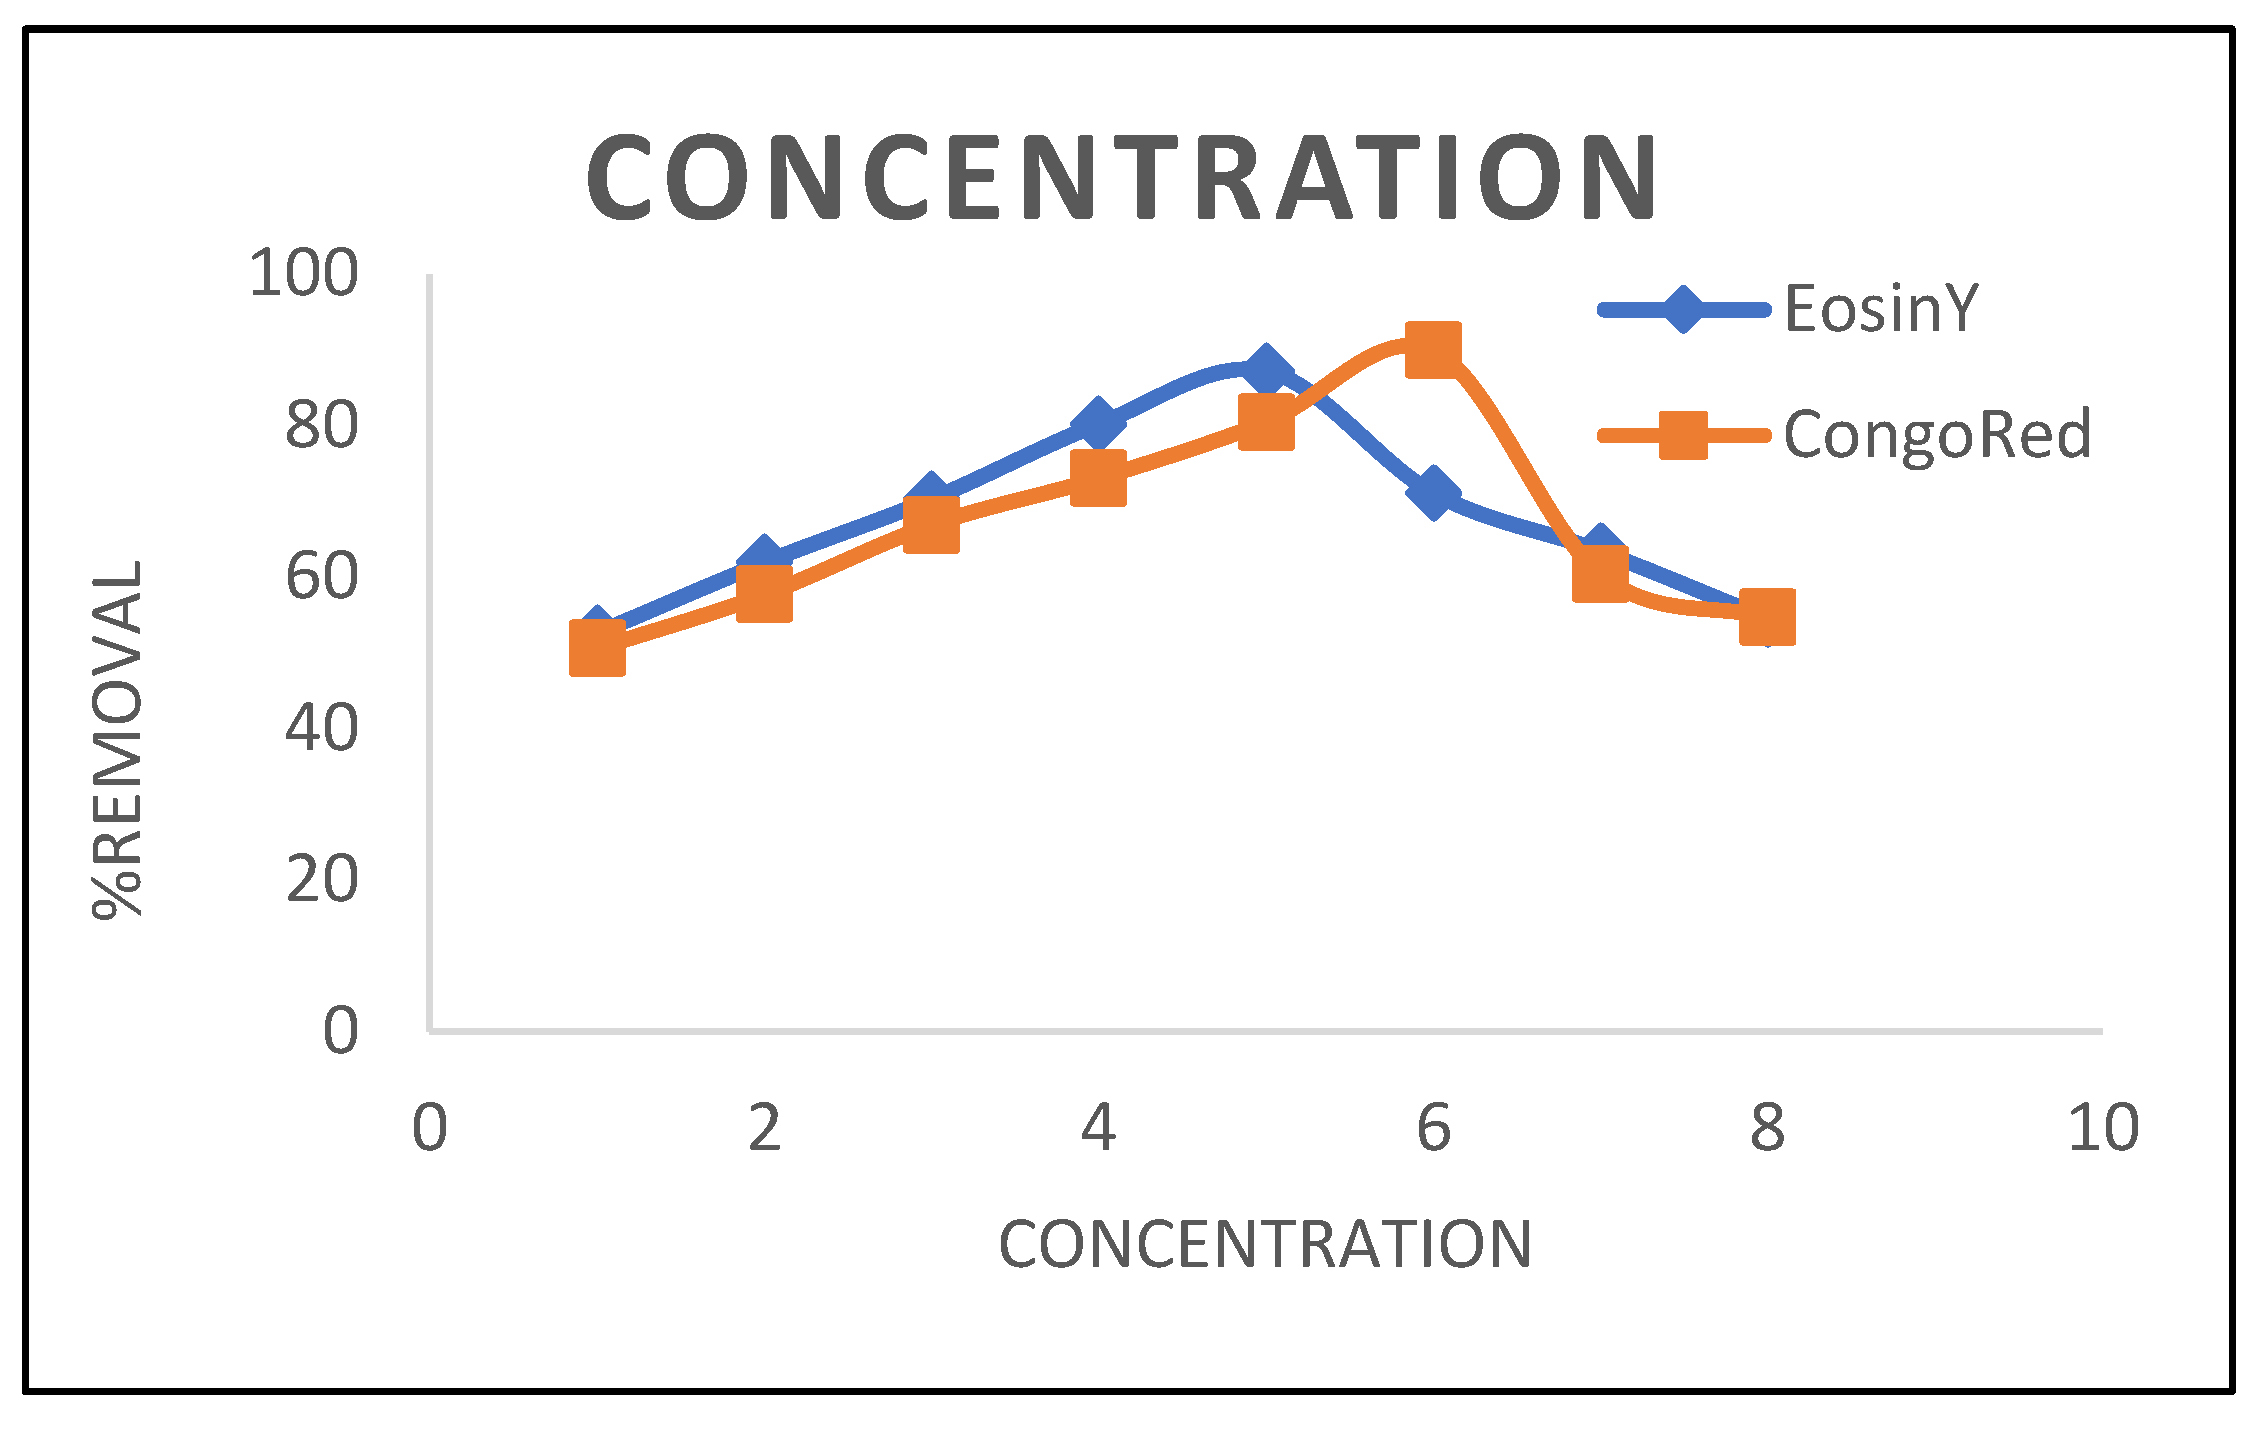
3.1.2. Concentration Effect
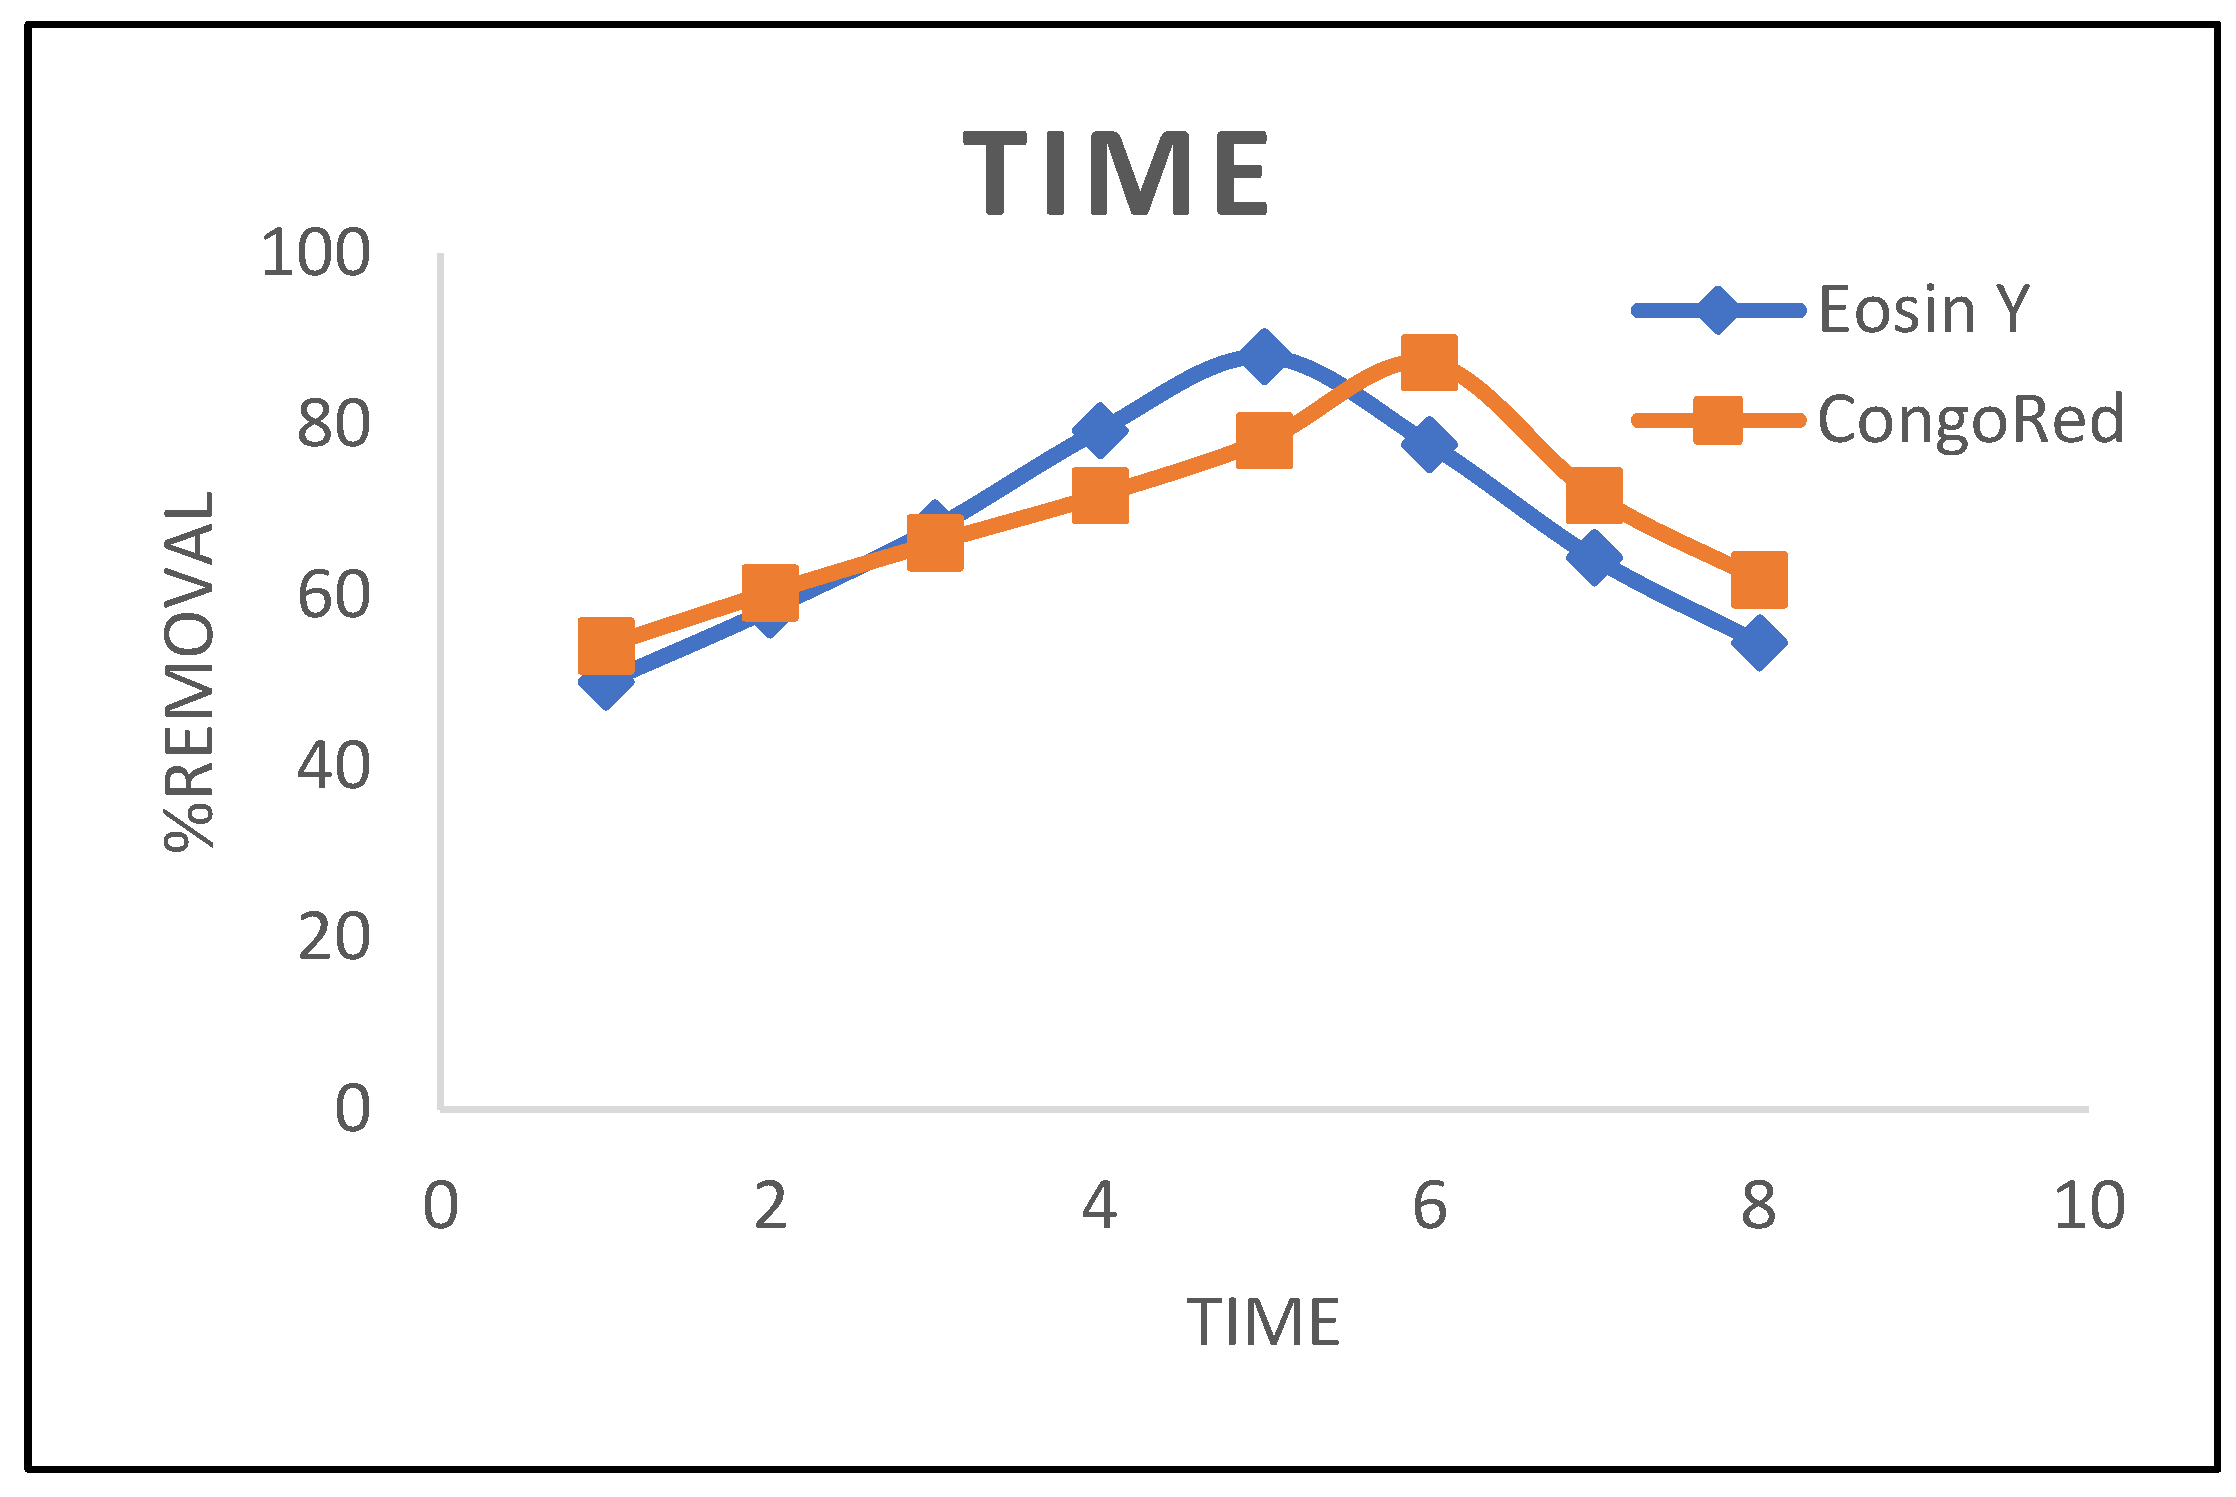
3.1.3. Time Effect
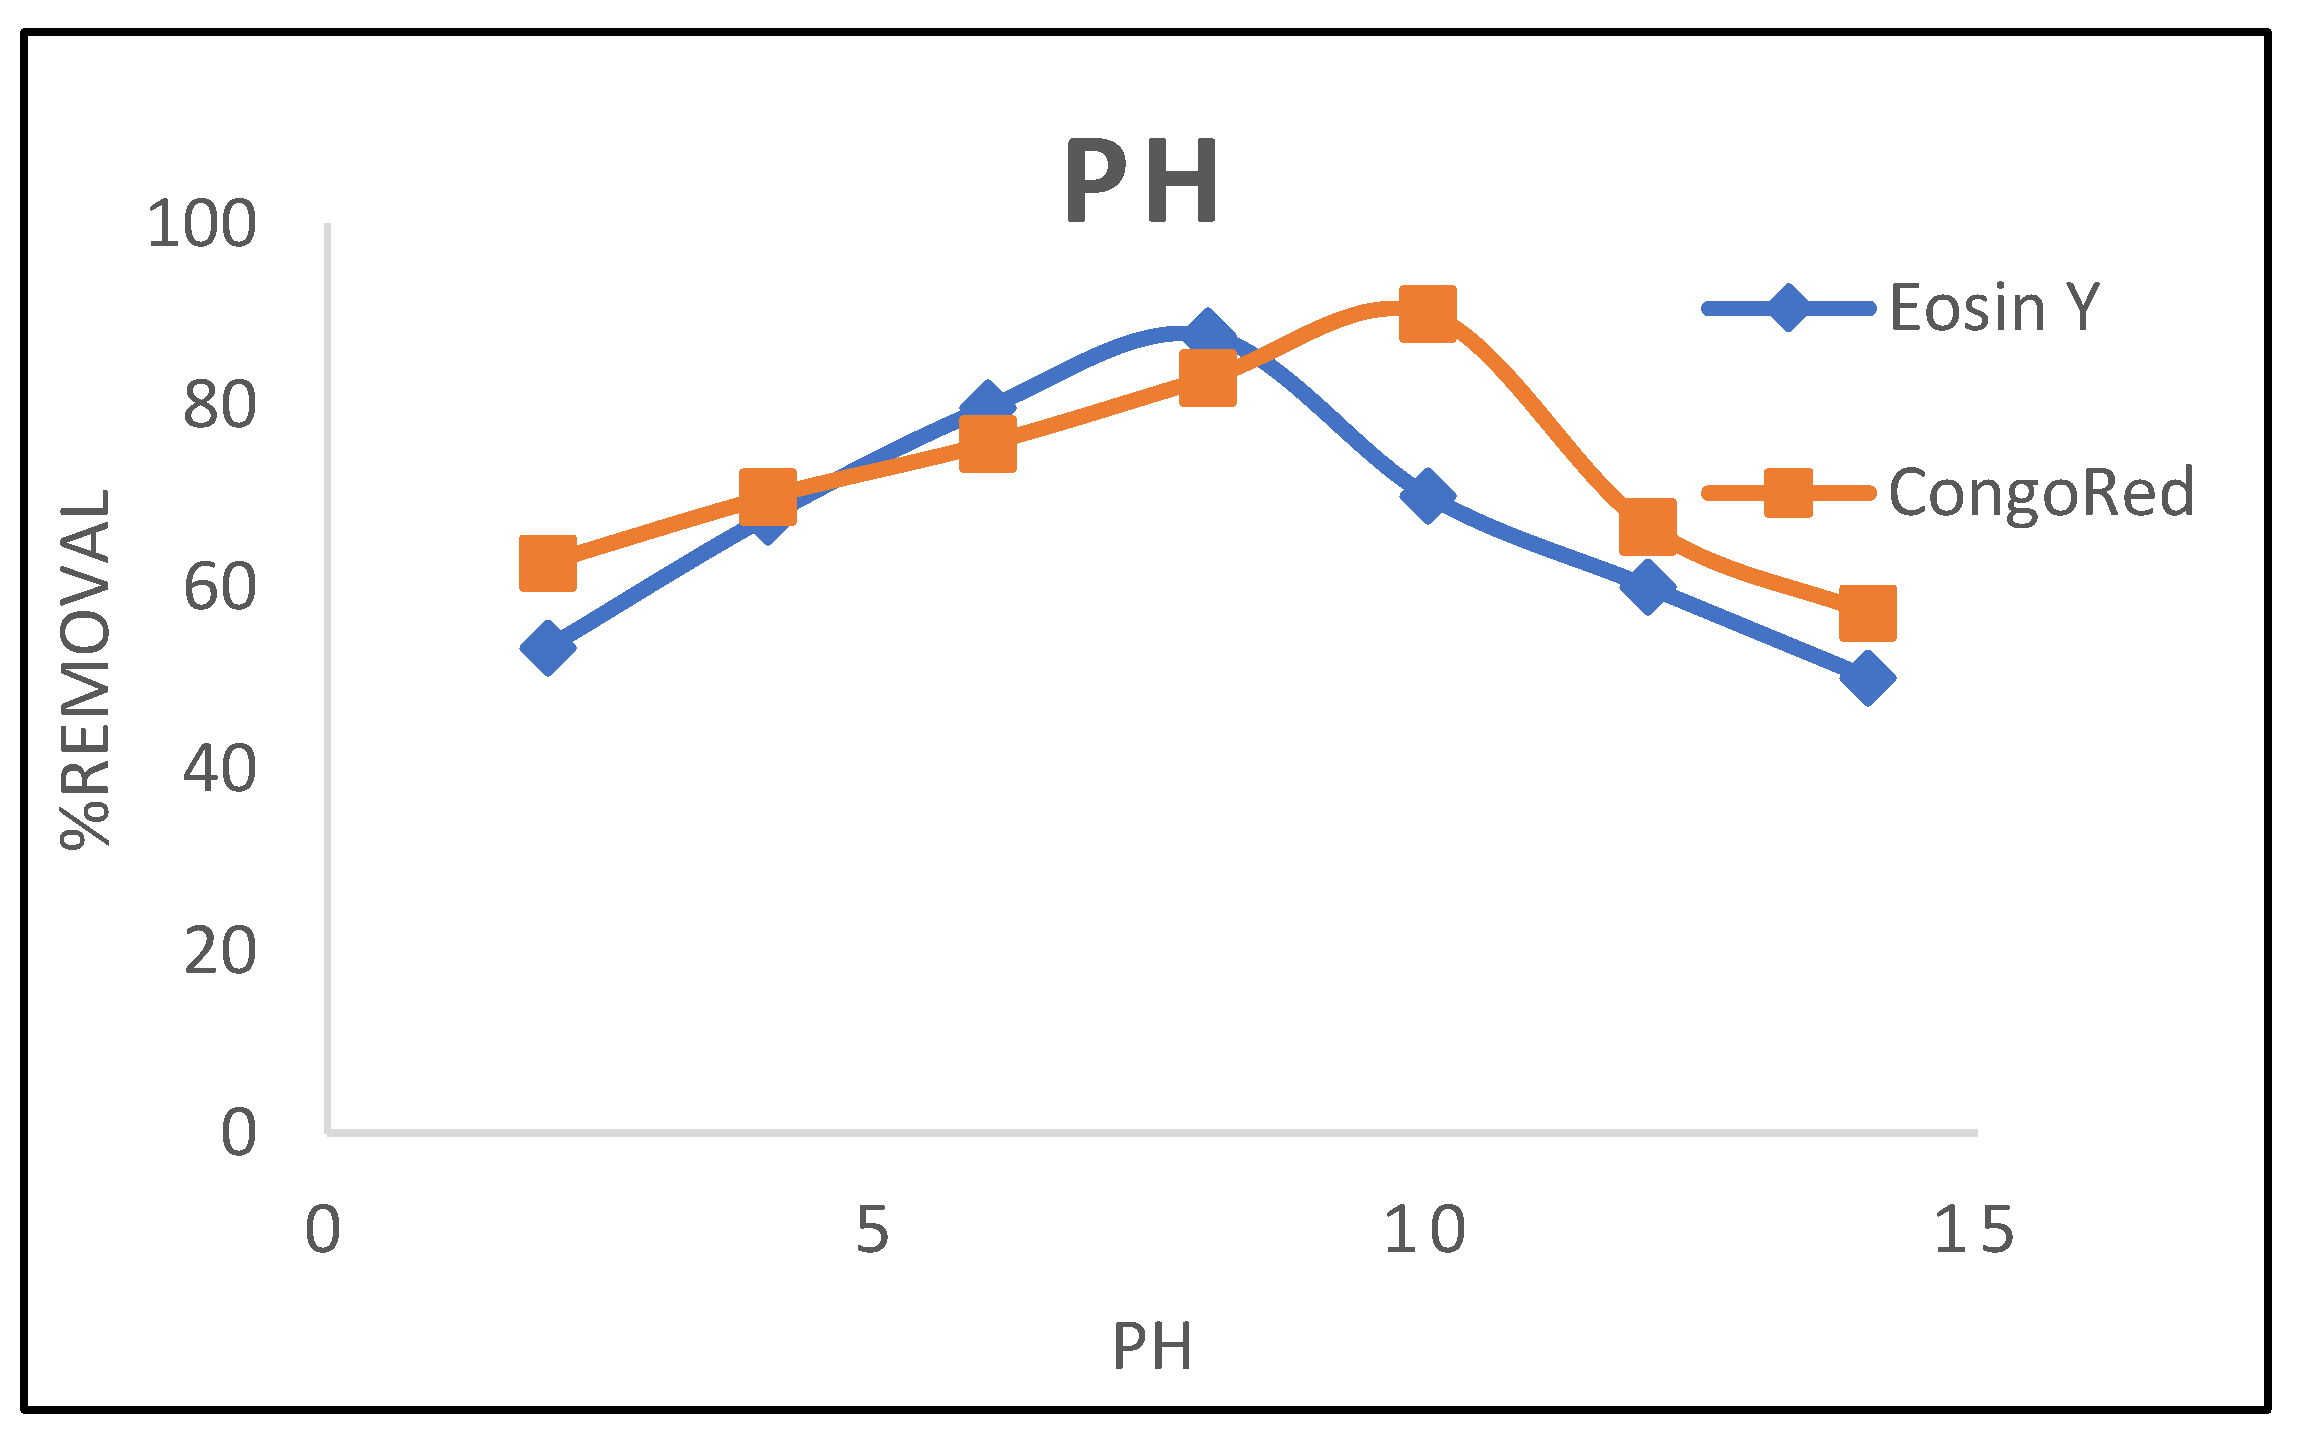
3.1.4. PH Effect
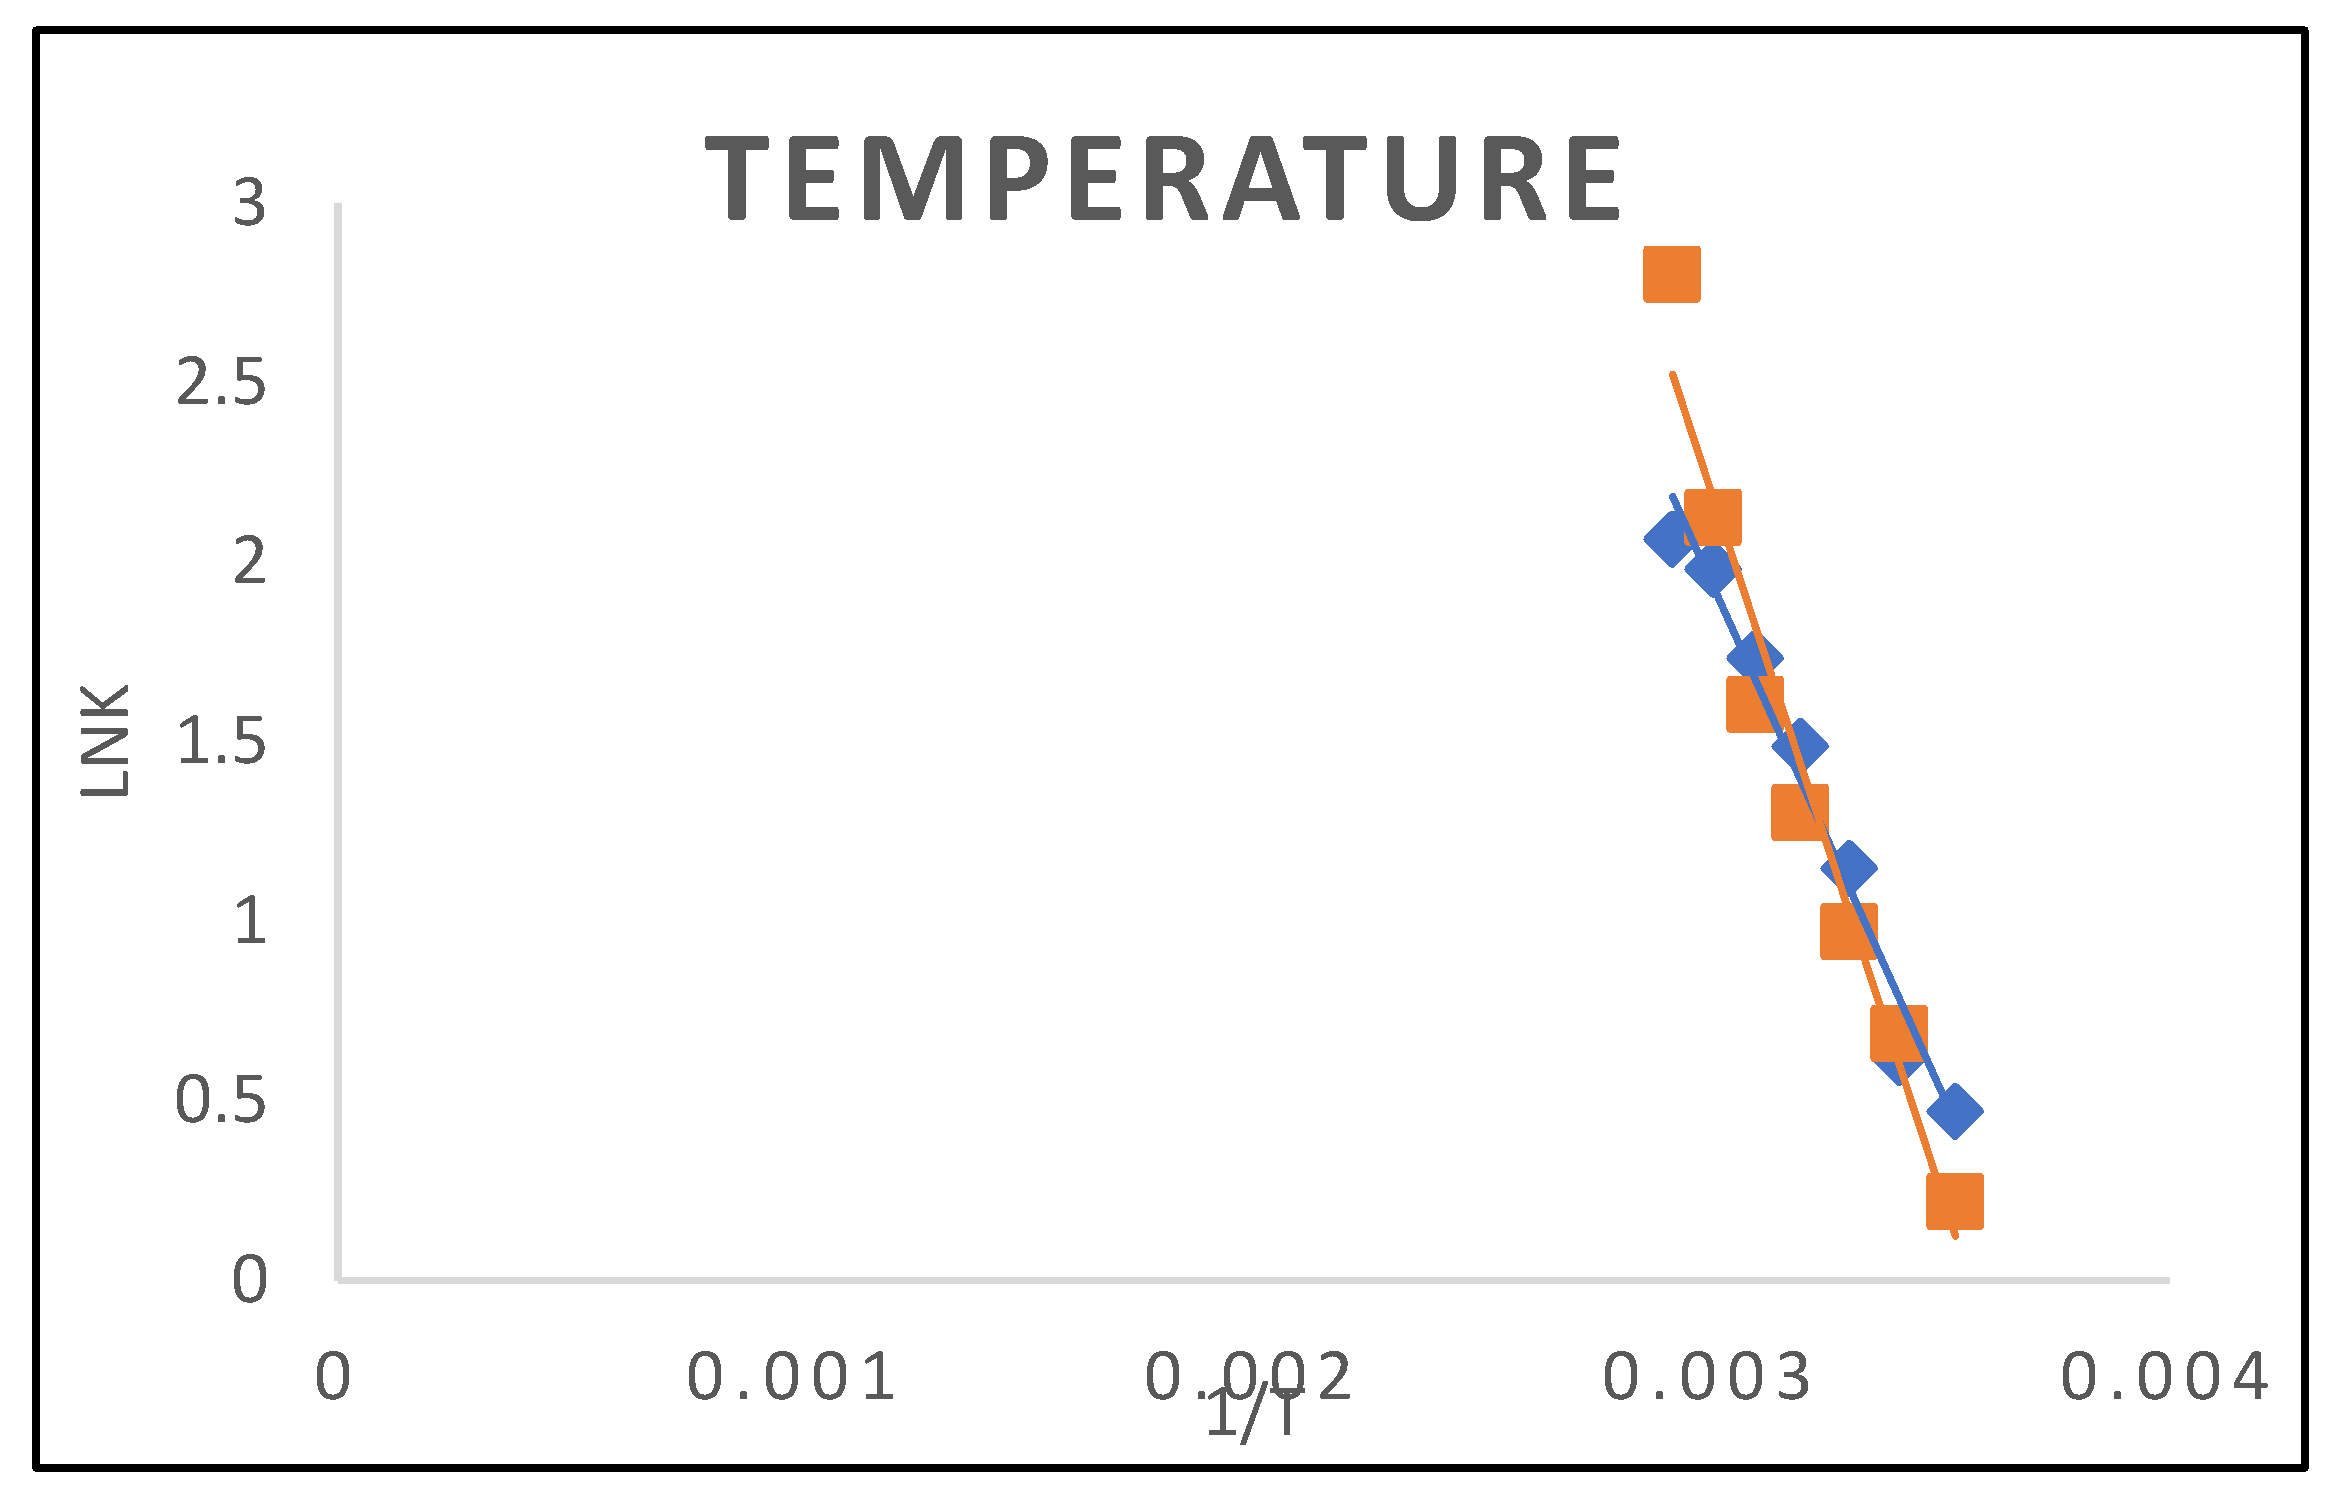
3.1.5. Temperature
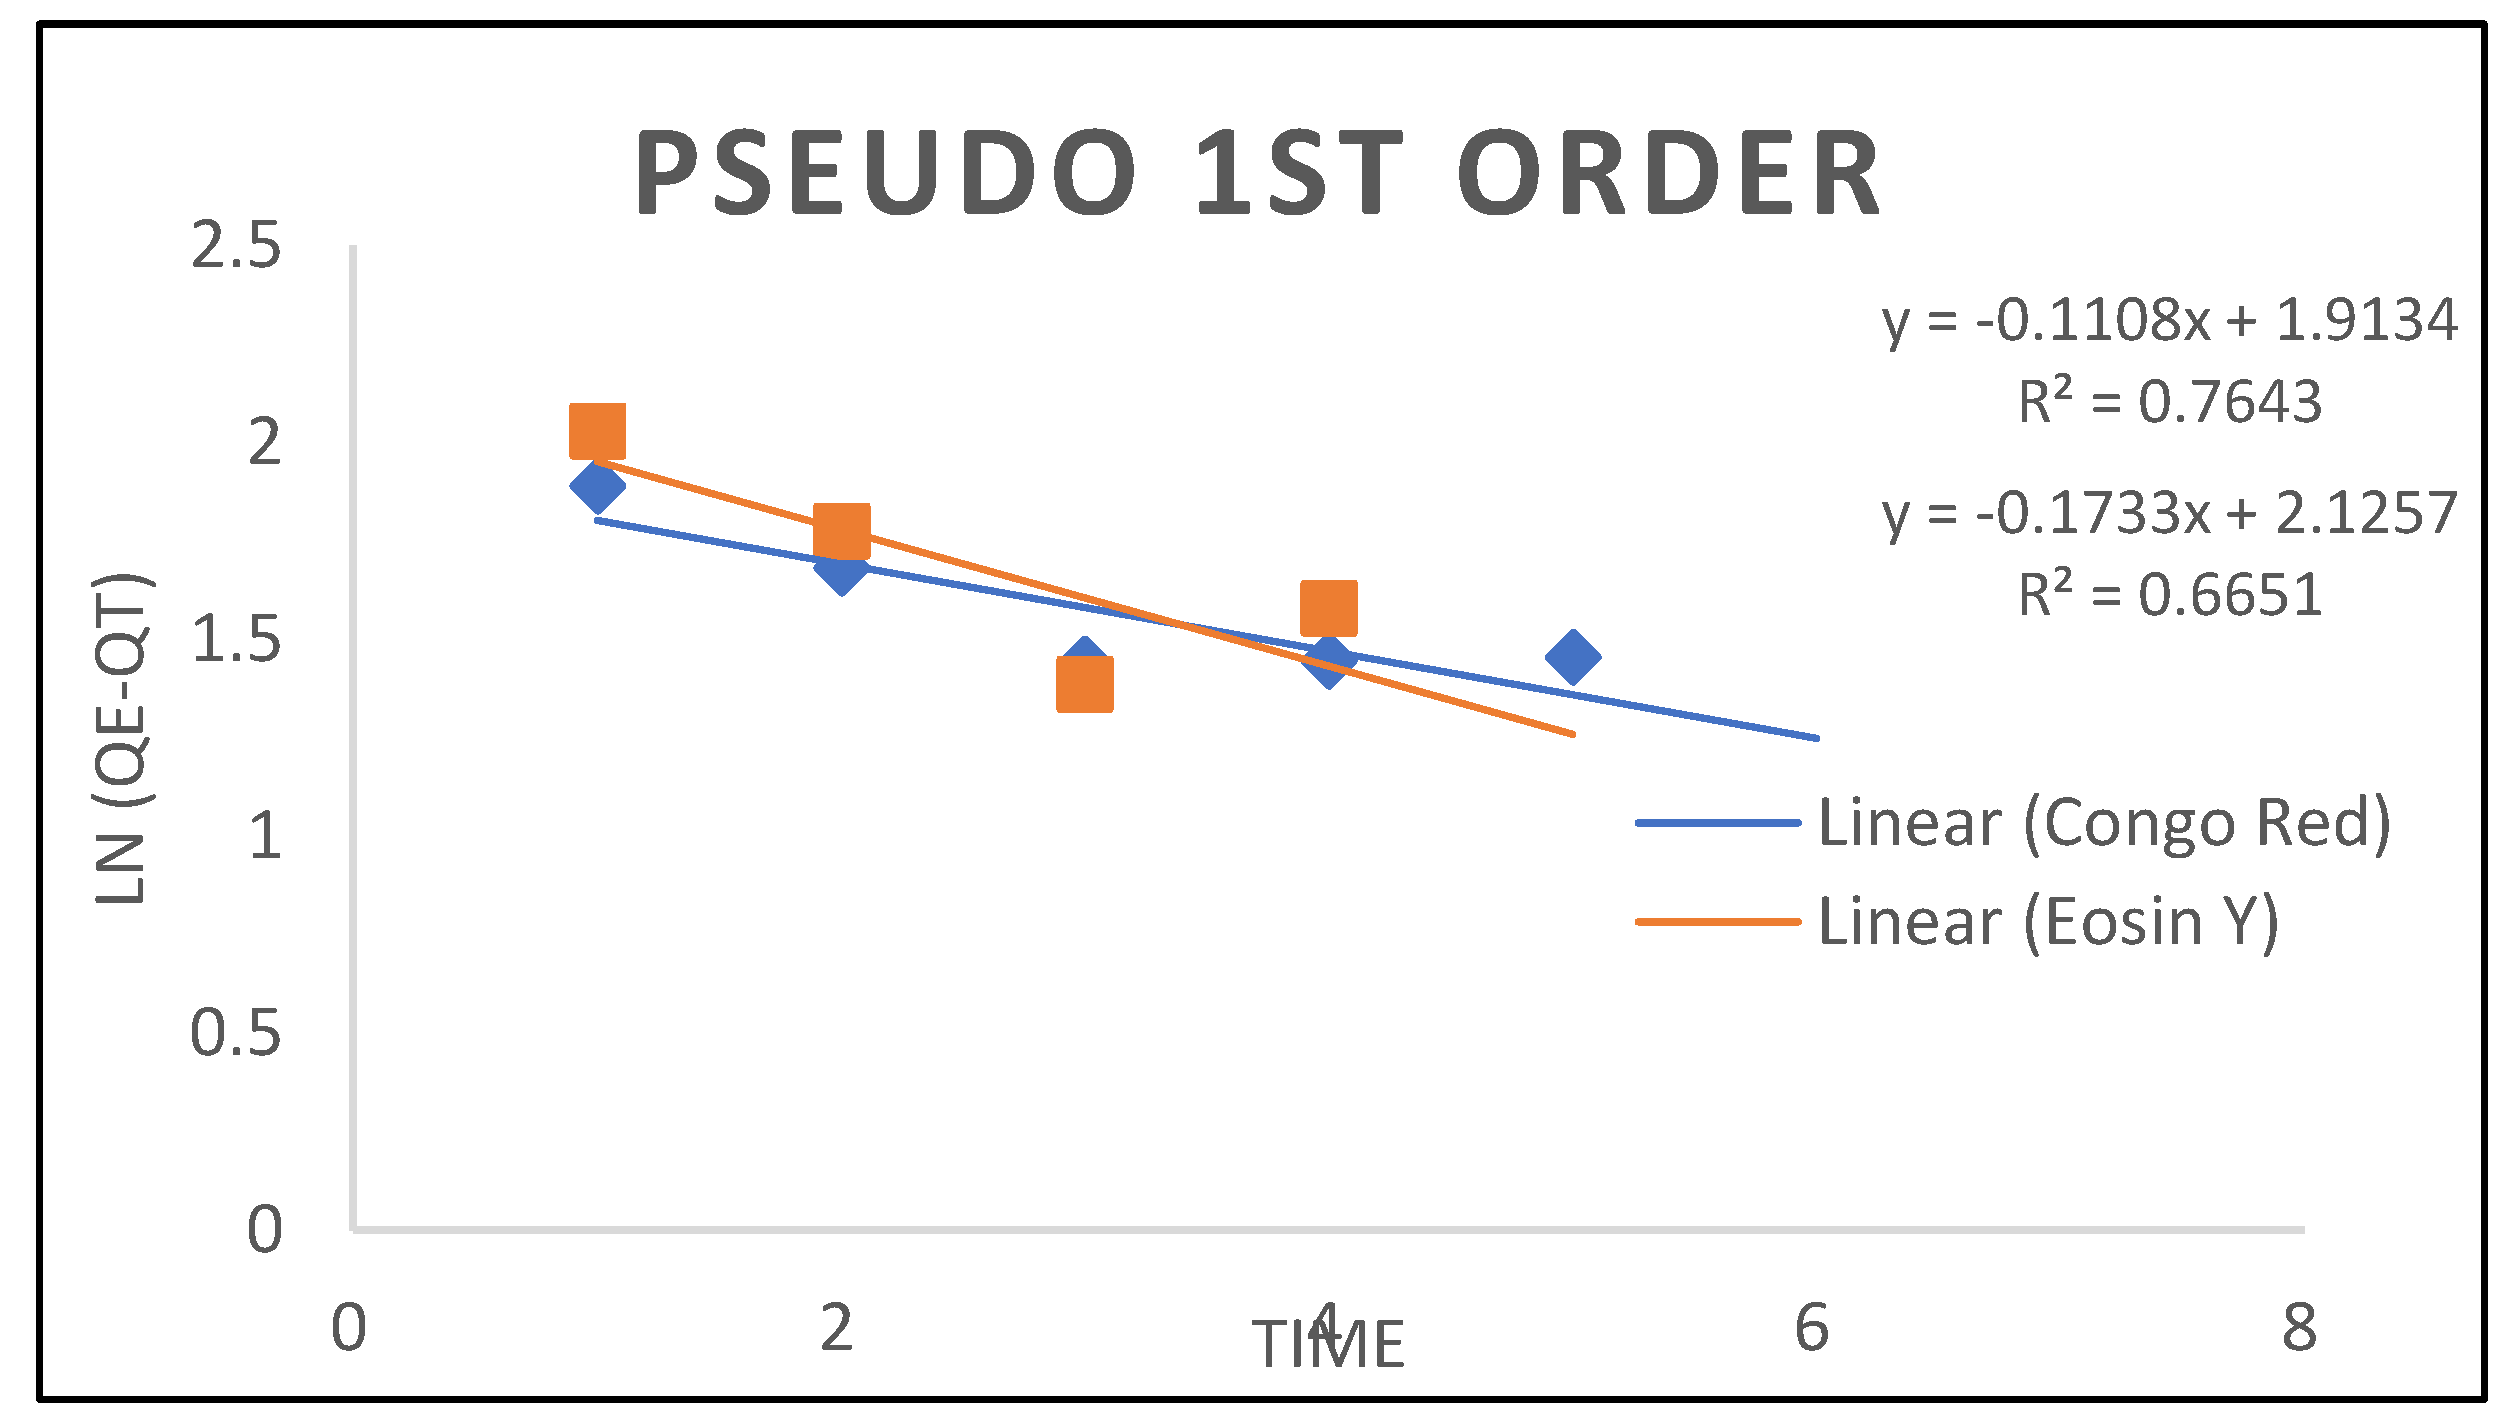
3.2. Kinetic Models
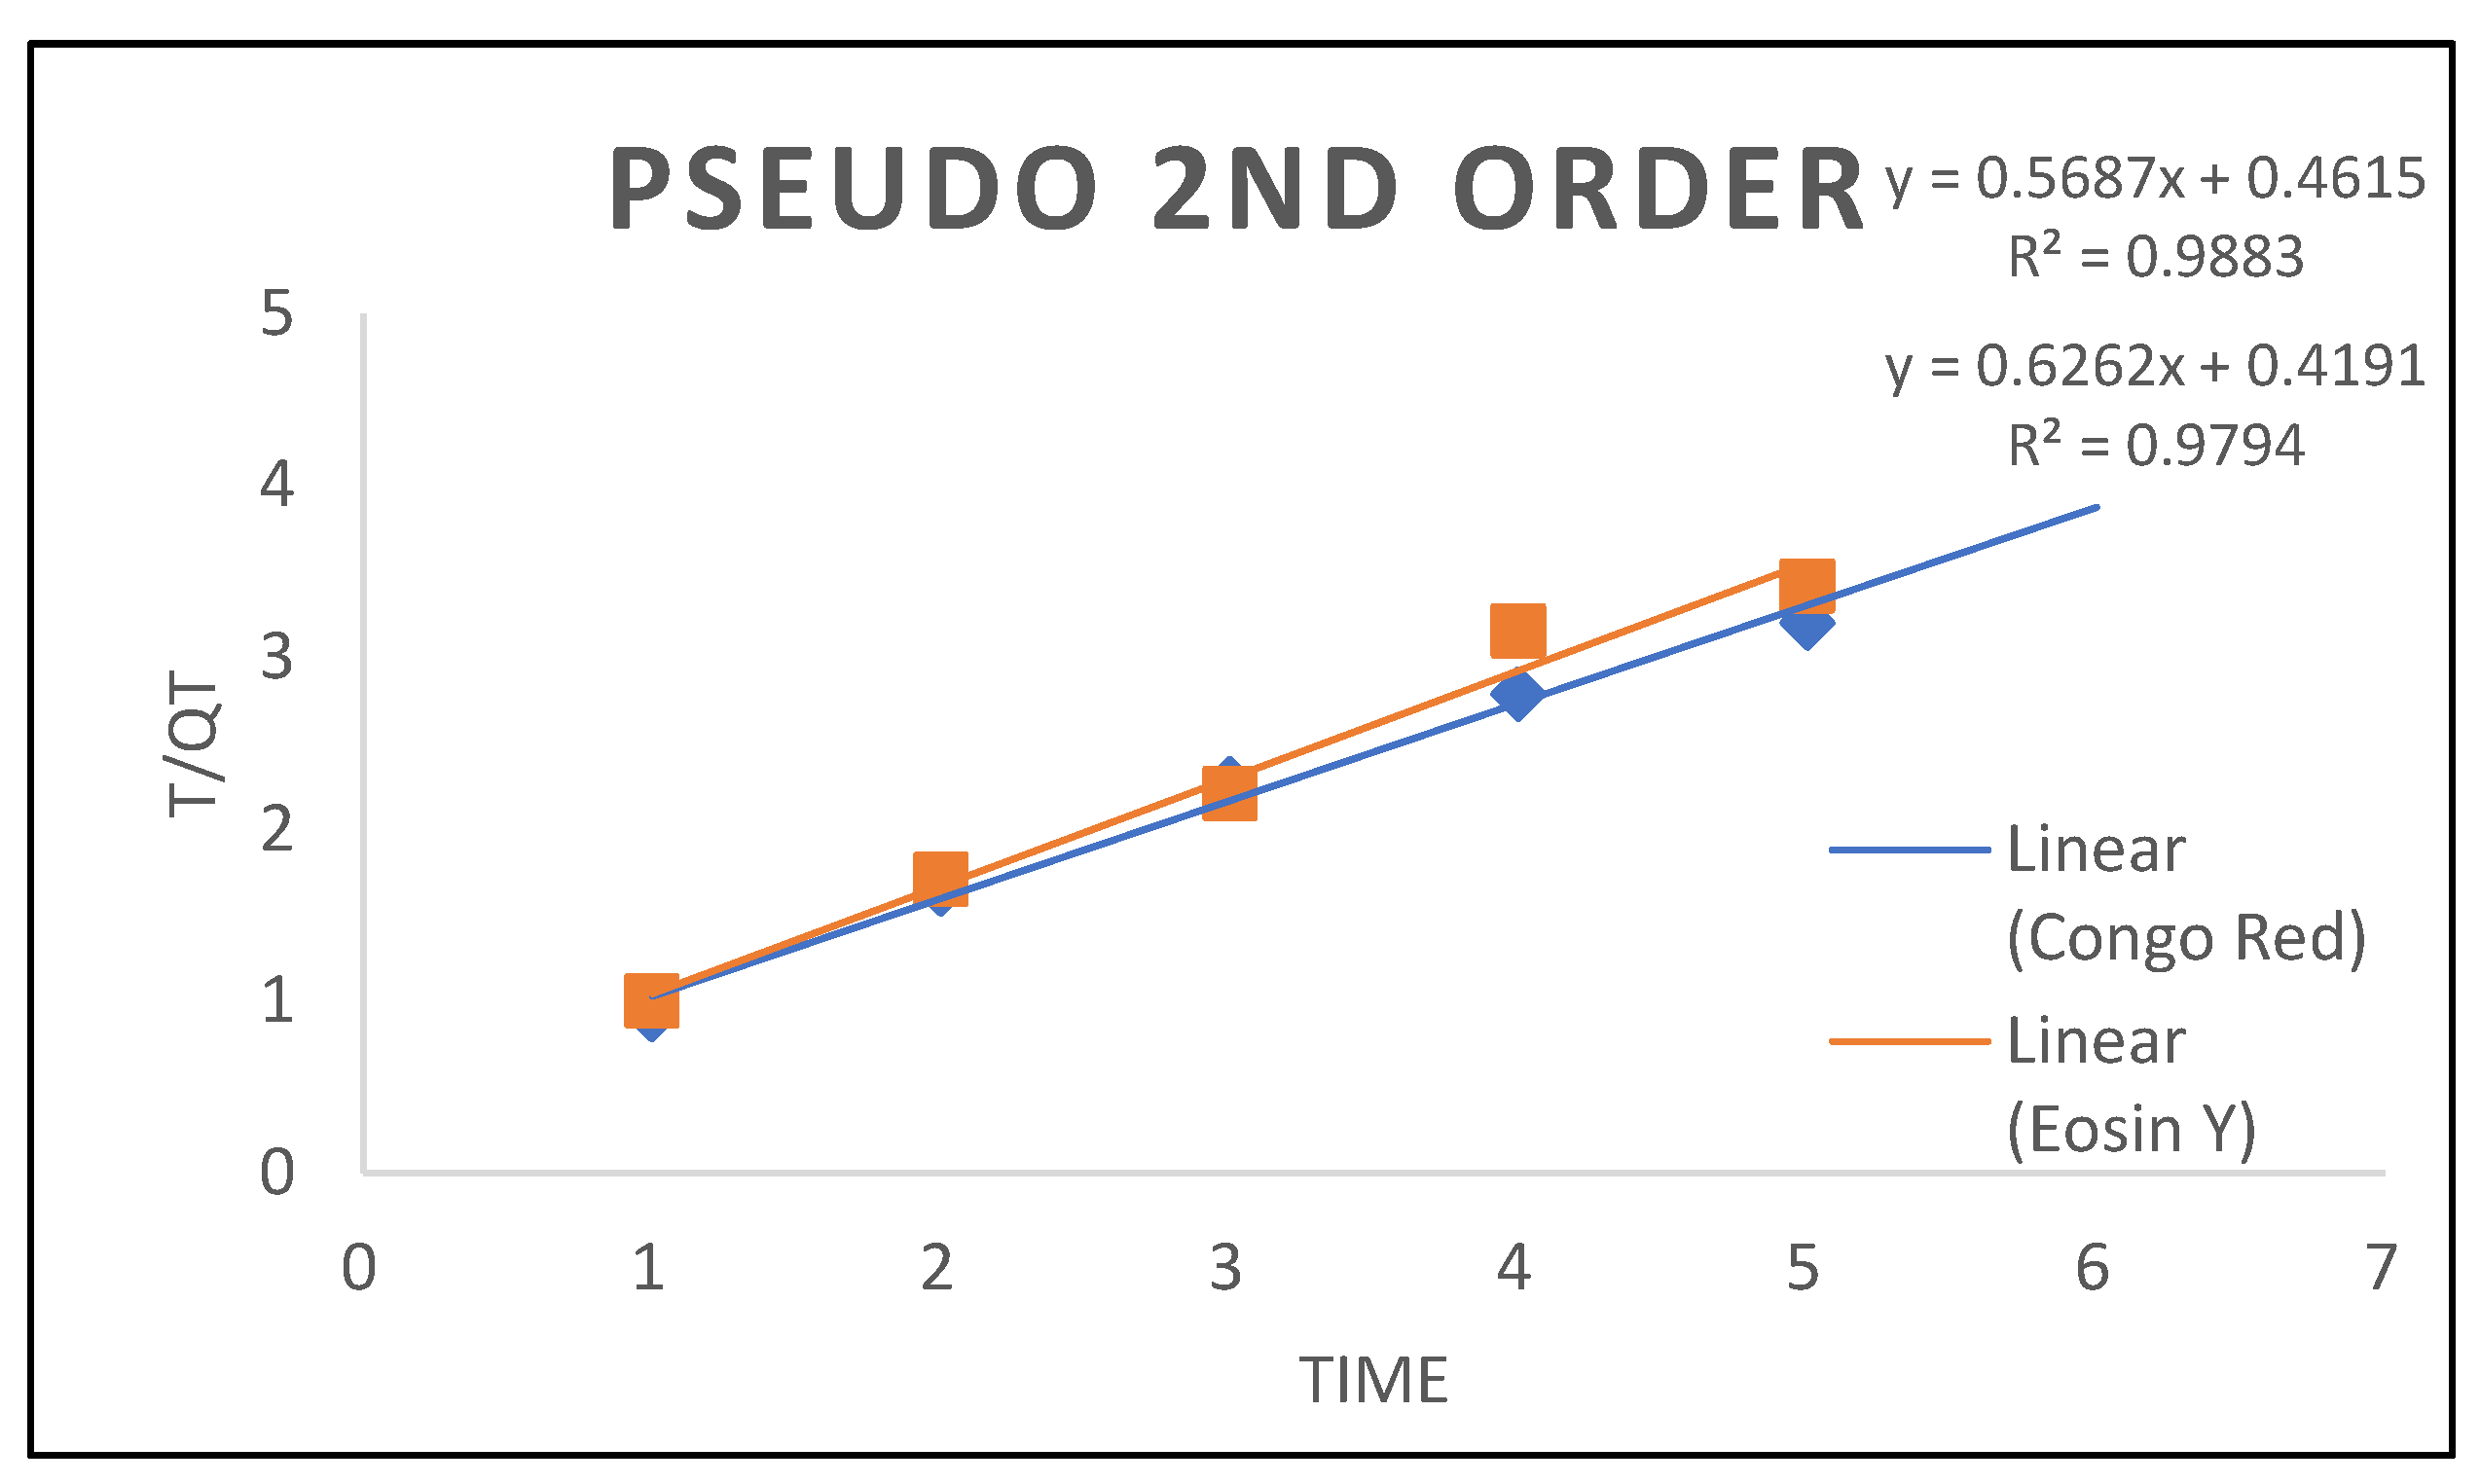

| Nanocomposites Pseudo Second Order |
||
|---|---|---|
| System | Eosin Y | Congo-Red |
| Qe( K²() R² |
15.969 0.9357 0.9794 |
17.583 0.7009 0.9884 |
| Pseudo First Order | ||
| Qe cal() K1 R² |
8.3787 -0.1733 0.6651 |
6.7760 -0.1108 0.76430 |
3.2.1. Adsorption of Thermodynamics
| Eosin Y | ||||
|---|---|---|---|---|
| Temperature | ΔG°,kl/mol | ΔH°,KJ/mol | ΔS°,J/mol.k | R² |
|
283 293 303 313 323 333 343 |
-8.7080 -9.0157 -9.3208 -9.6284 -9.9360 -10.243 -10.551 |
-0.00249 -0.00249 -0.00249 -0.00249 -0.00249 -0.00249 |
0.03076 0.03076 0.03076 0.03076 0.03076 0.03076 |
0.9756 0.9756 0.9756 0.9756 0.9756 0.9756 |
| Cono-Red | ||||
|
283 293 303 313 323 333 343 |
-8.4719 -8.7529 -9.0705 -0.9369 -9.6691 -9.9684 -10.267 |
-0.00166 -0.00166 -0.00166 -0.00166 -0.00166 -0.00166 -0.00166 |
0.02993 0.02993 0.02993 0.02993 0.02993 0.02993 0.02993 |
0.9636 0.9636 0.9636 0.9636 0.9636 0.9636 0.9636 |
3.2.2. Adsorption Isotherm
3.2.3. Langmuir Isotherm
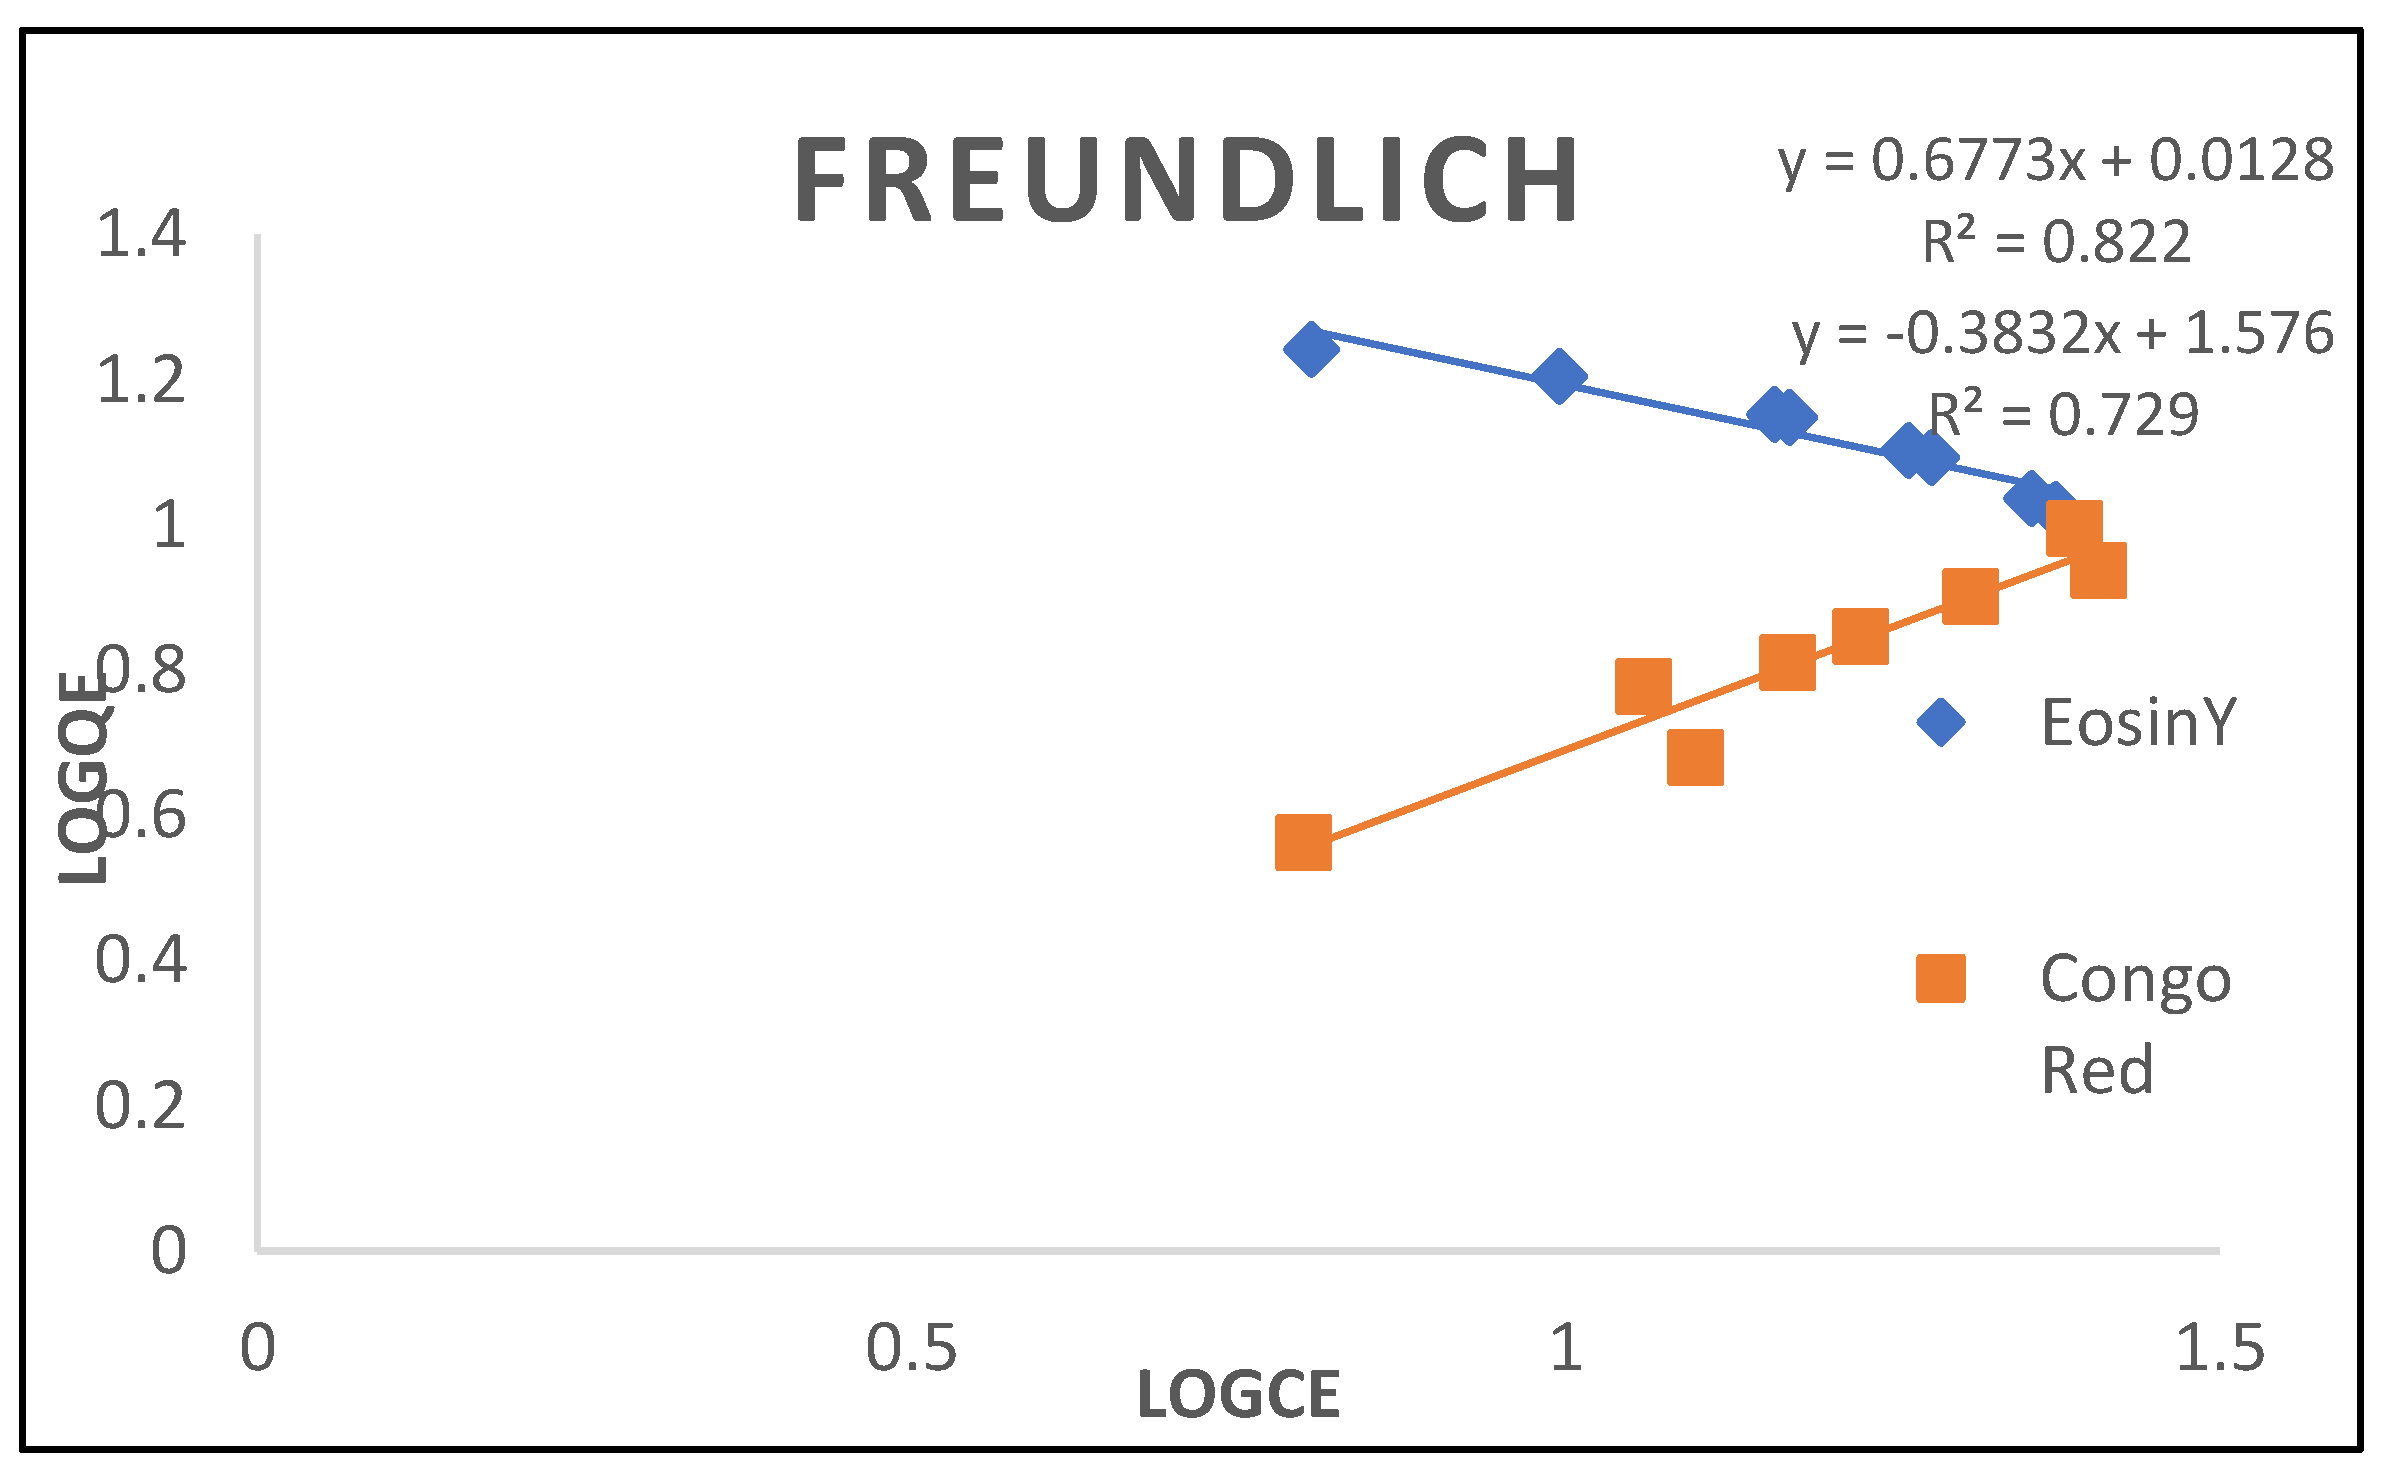
3.2.4. Frendlich Isotherm
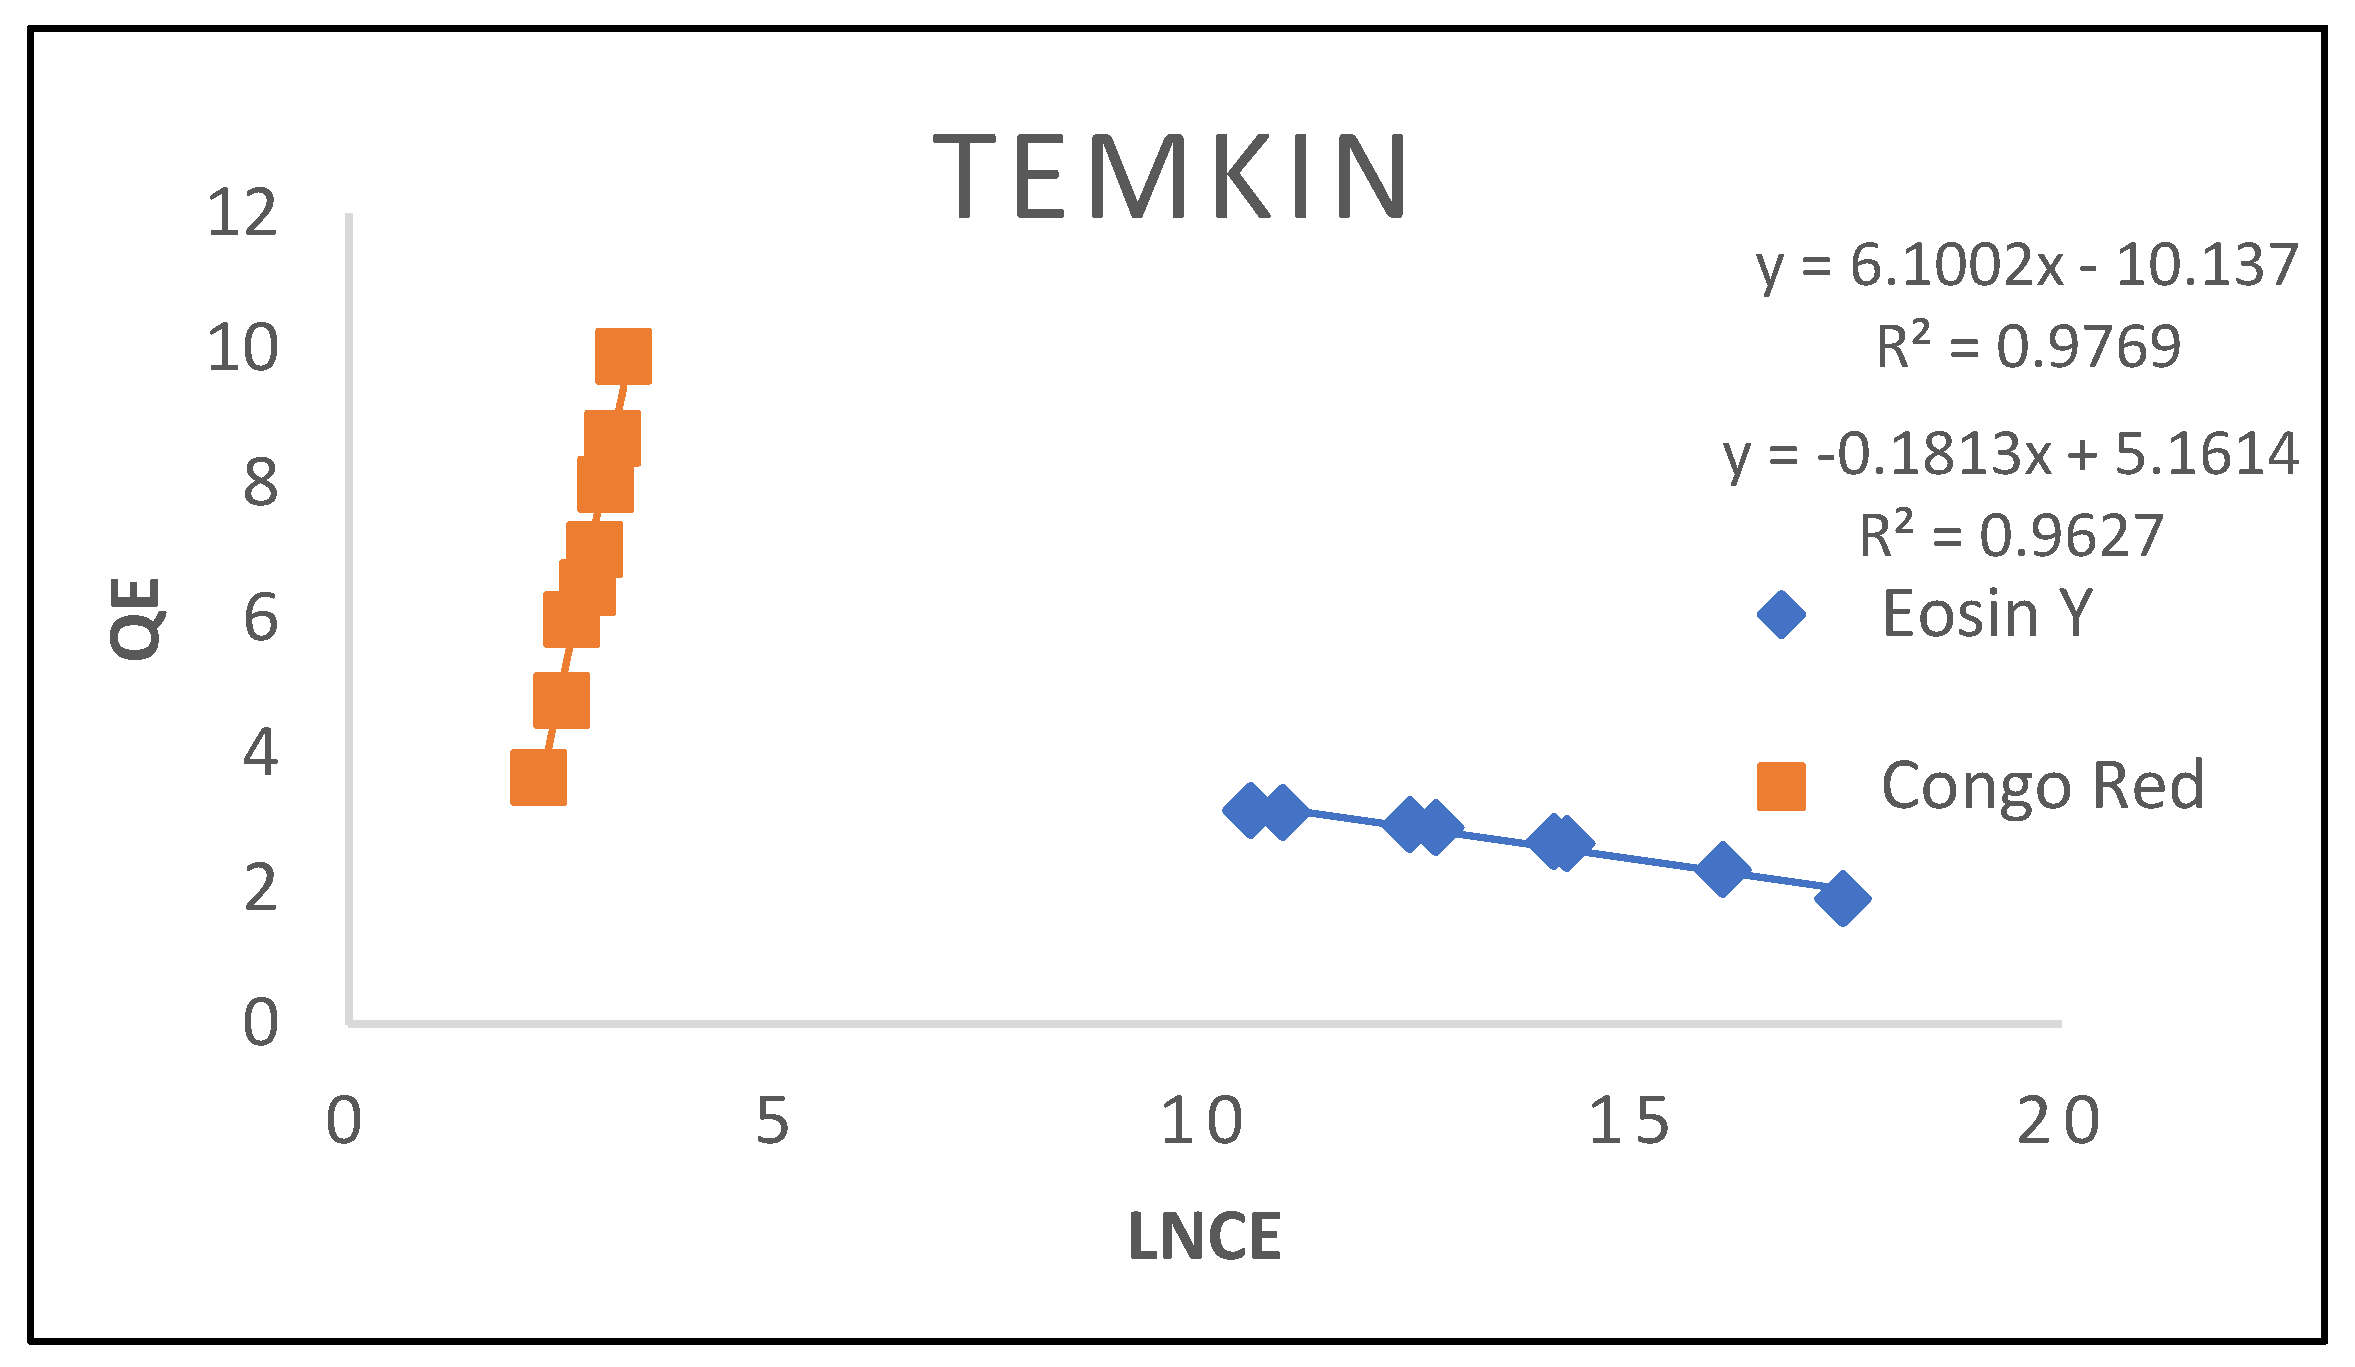
3.2.5. Temkin Isotherm
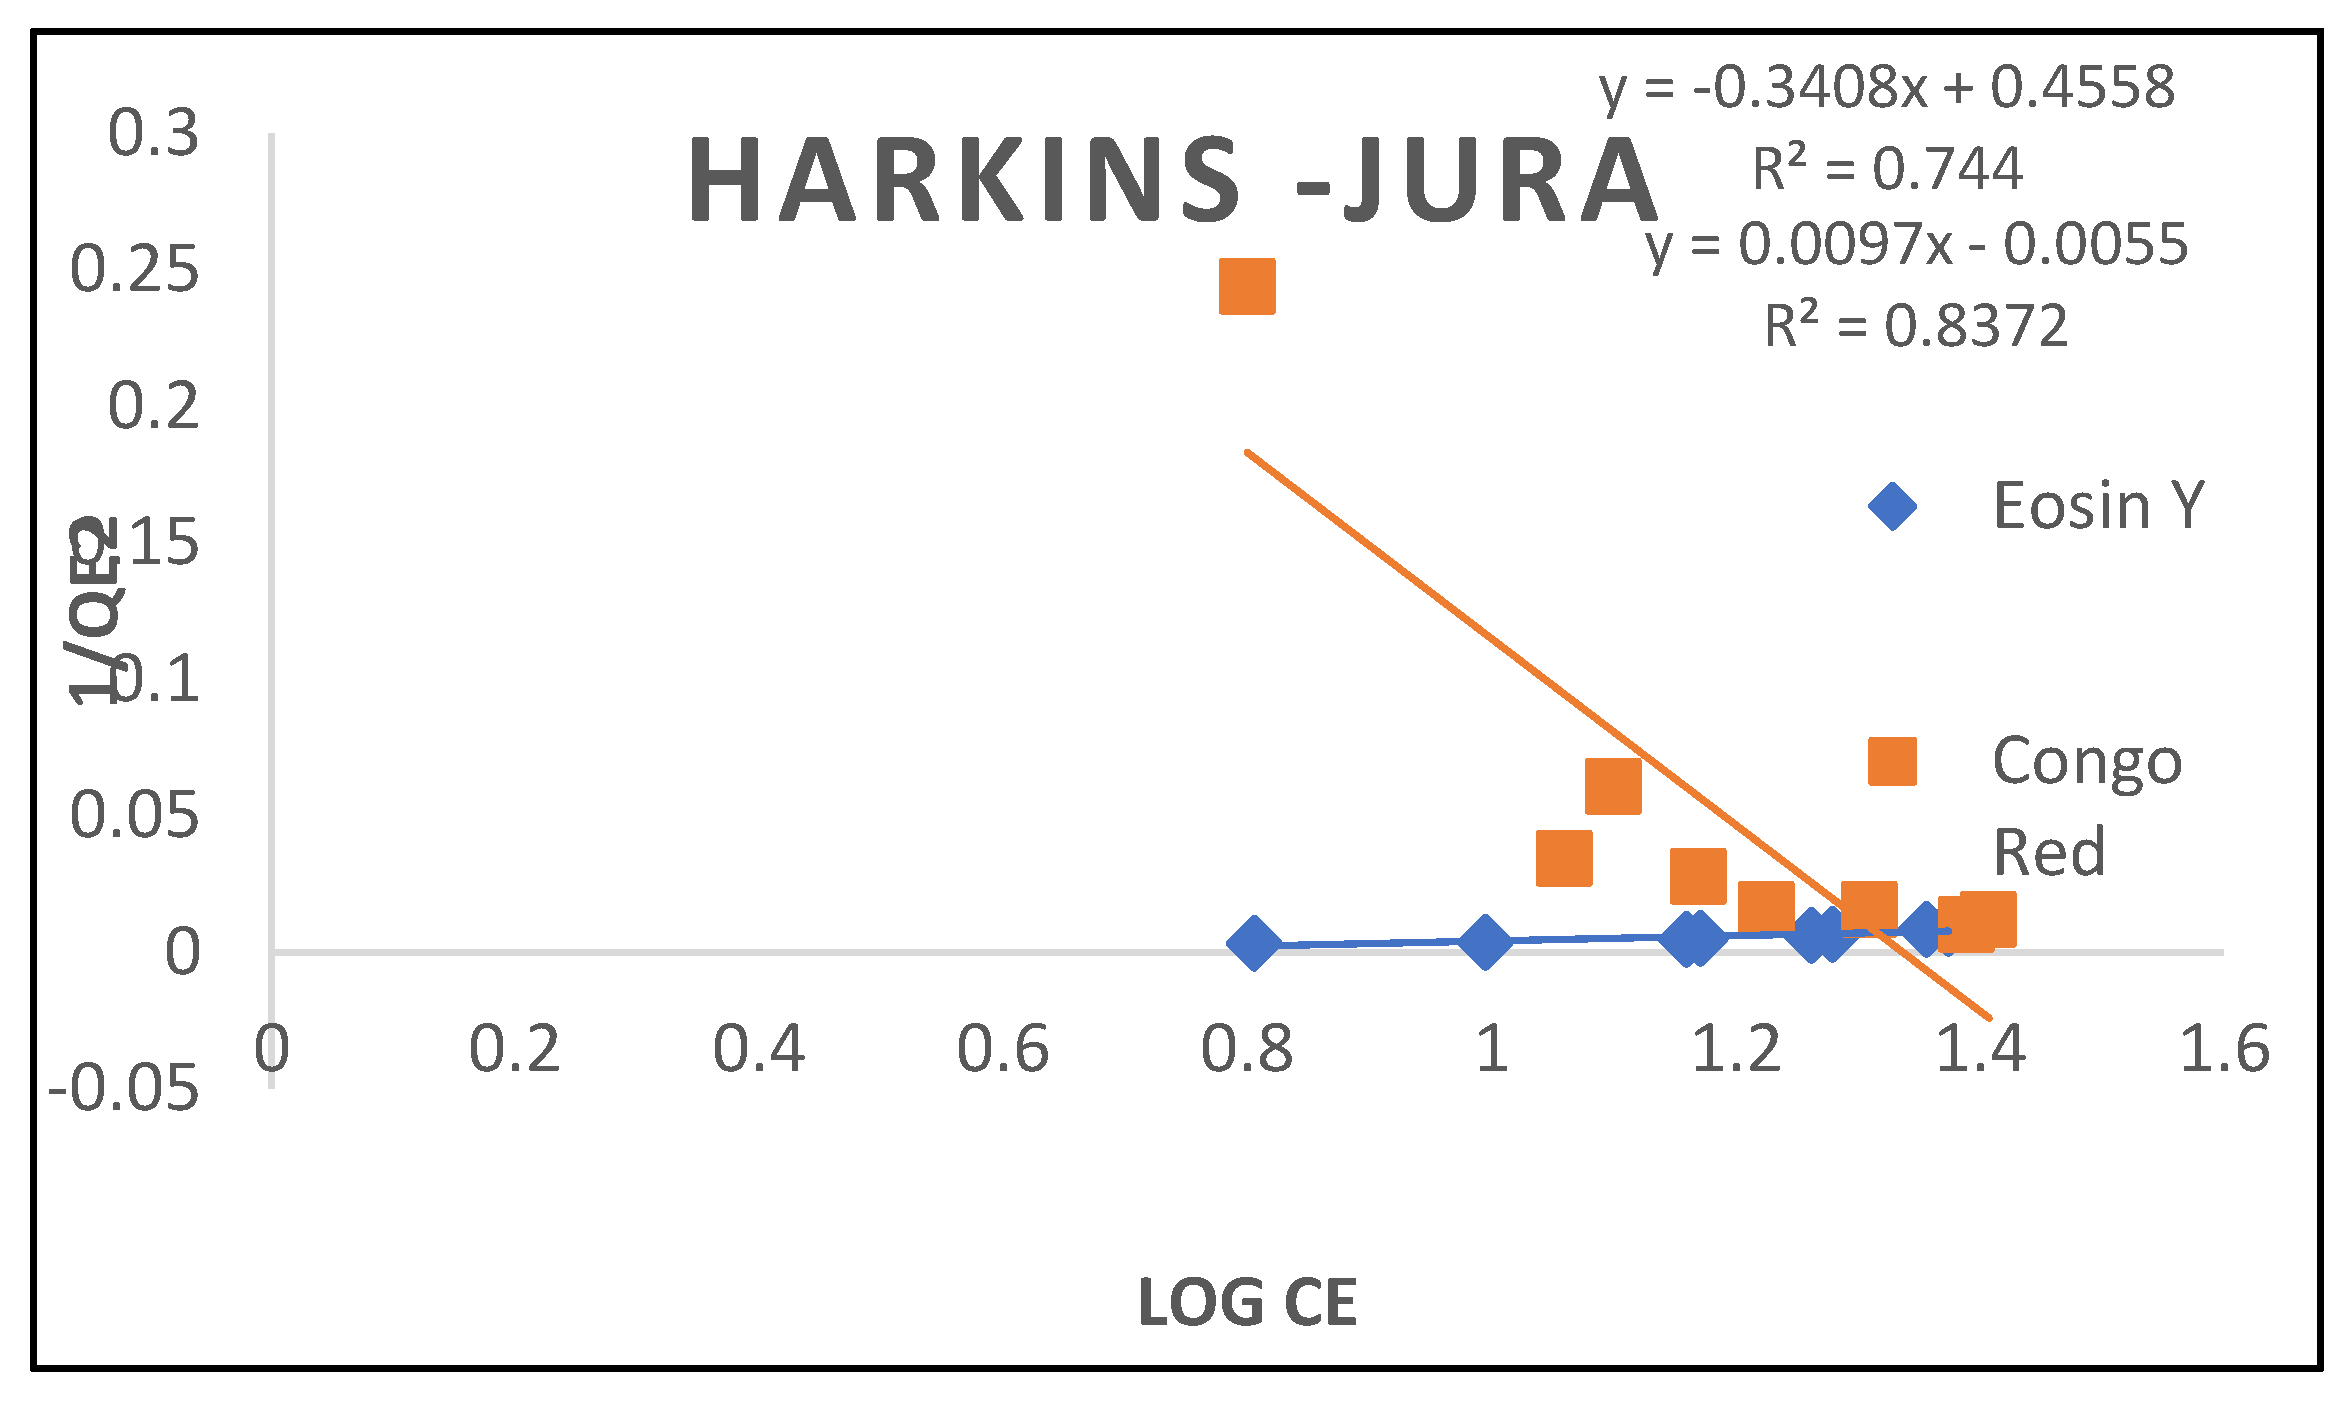
3.2.6. Harkins-Jura Isotherm
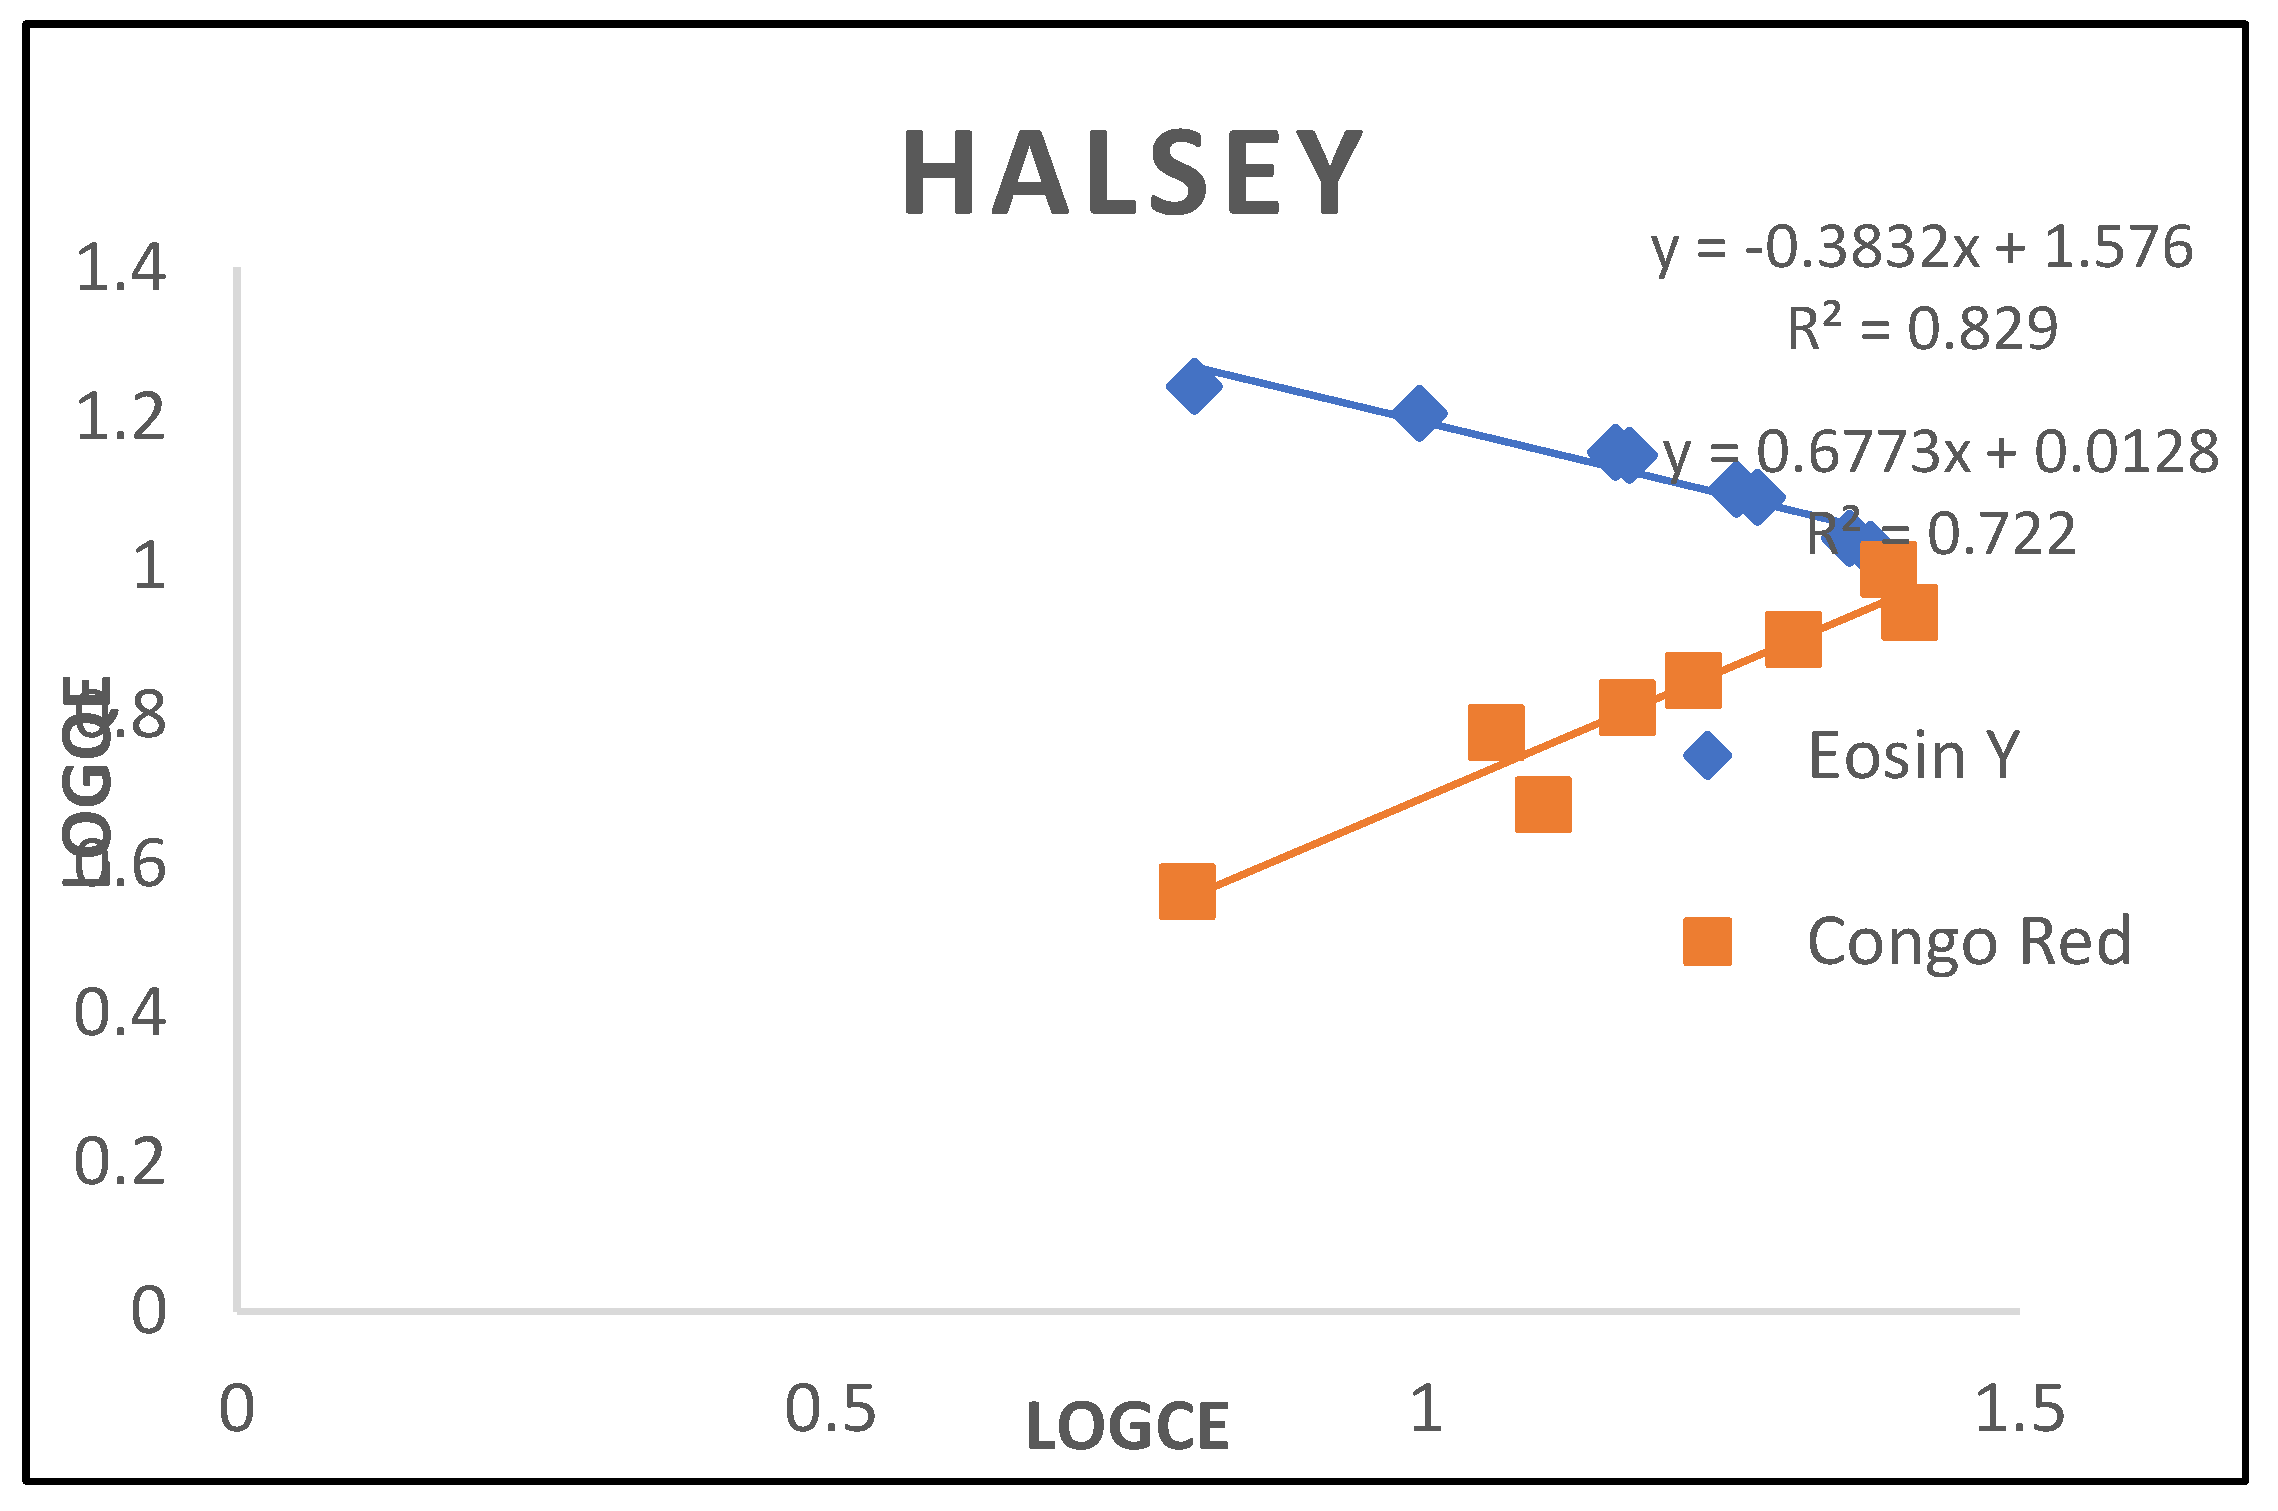
3.2.7. Halsey Isotherm
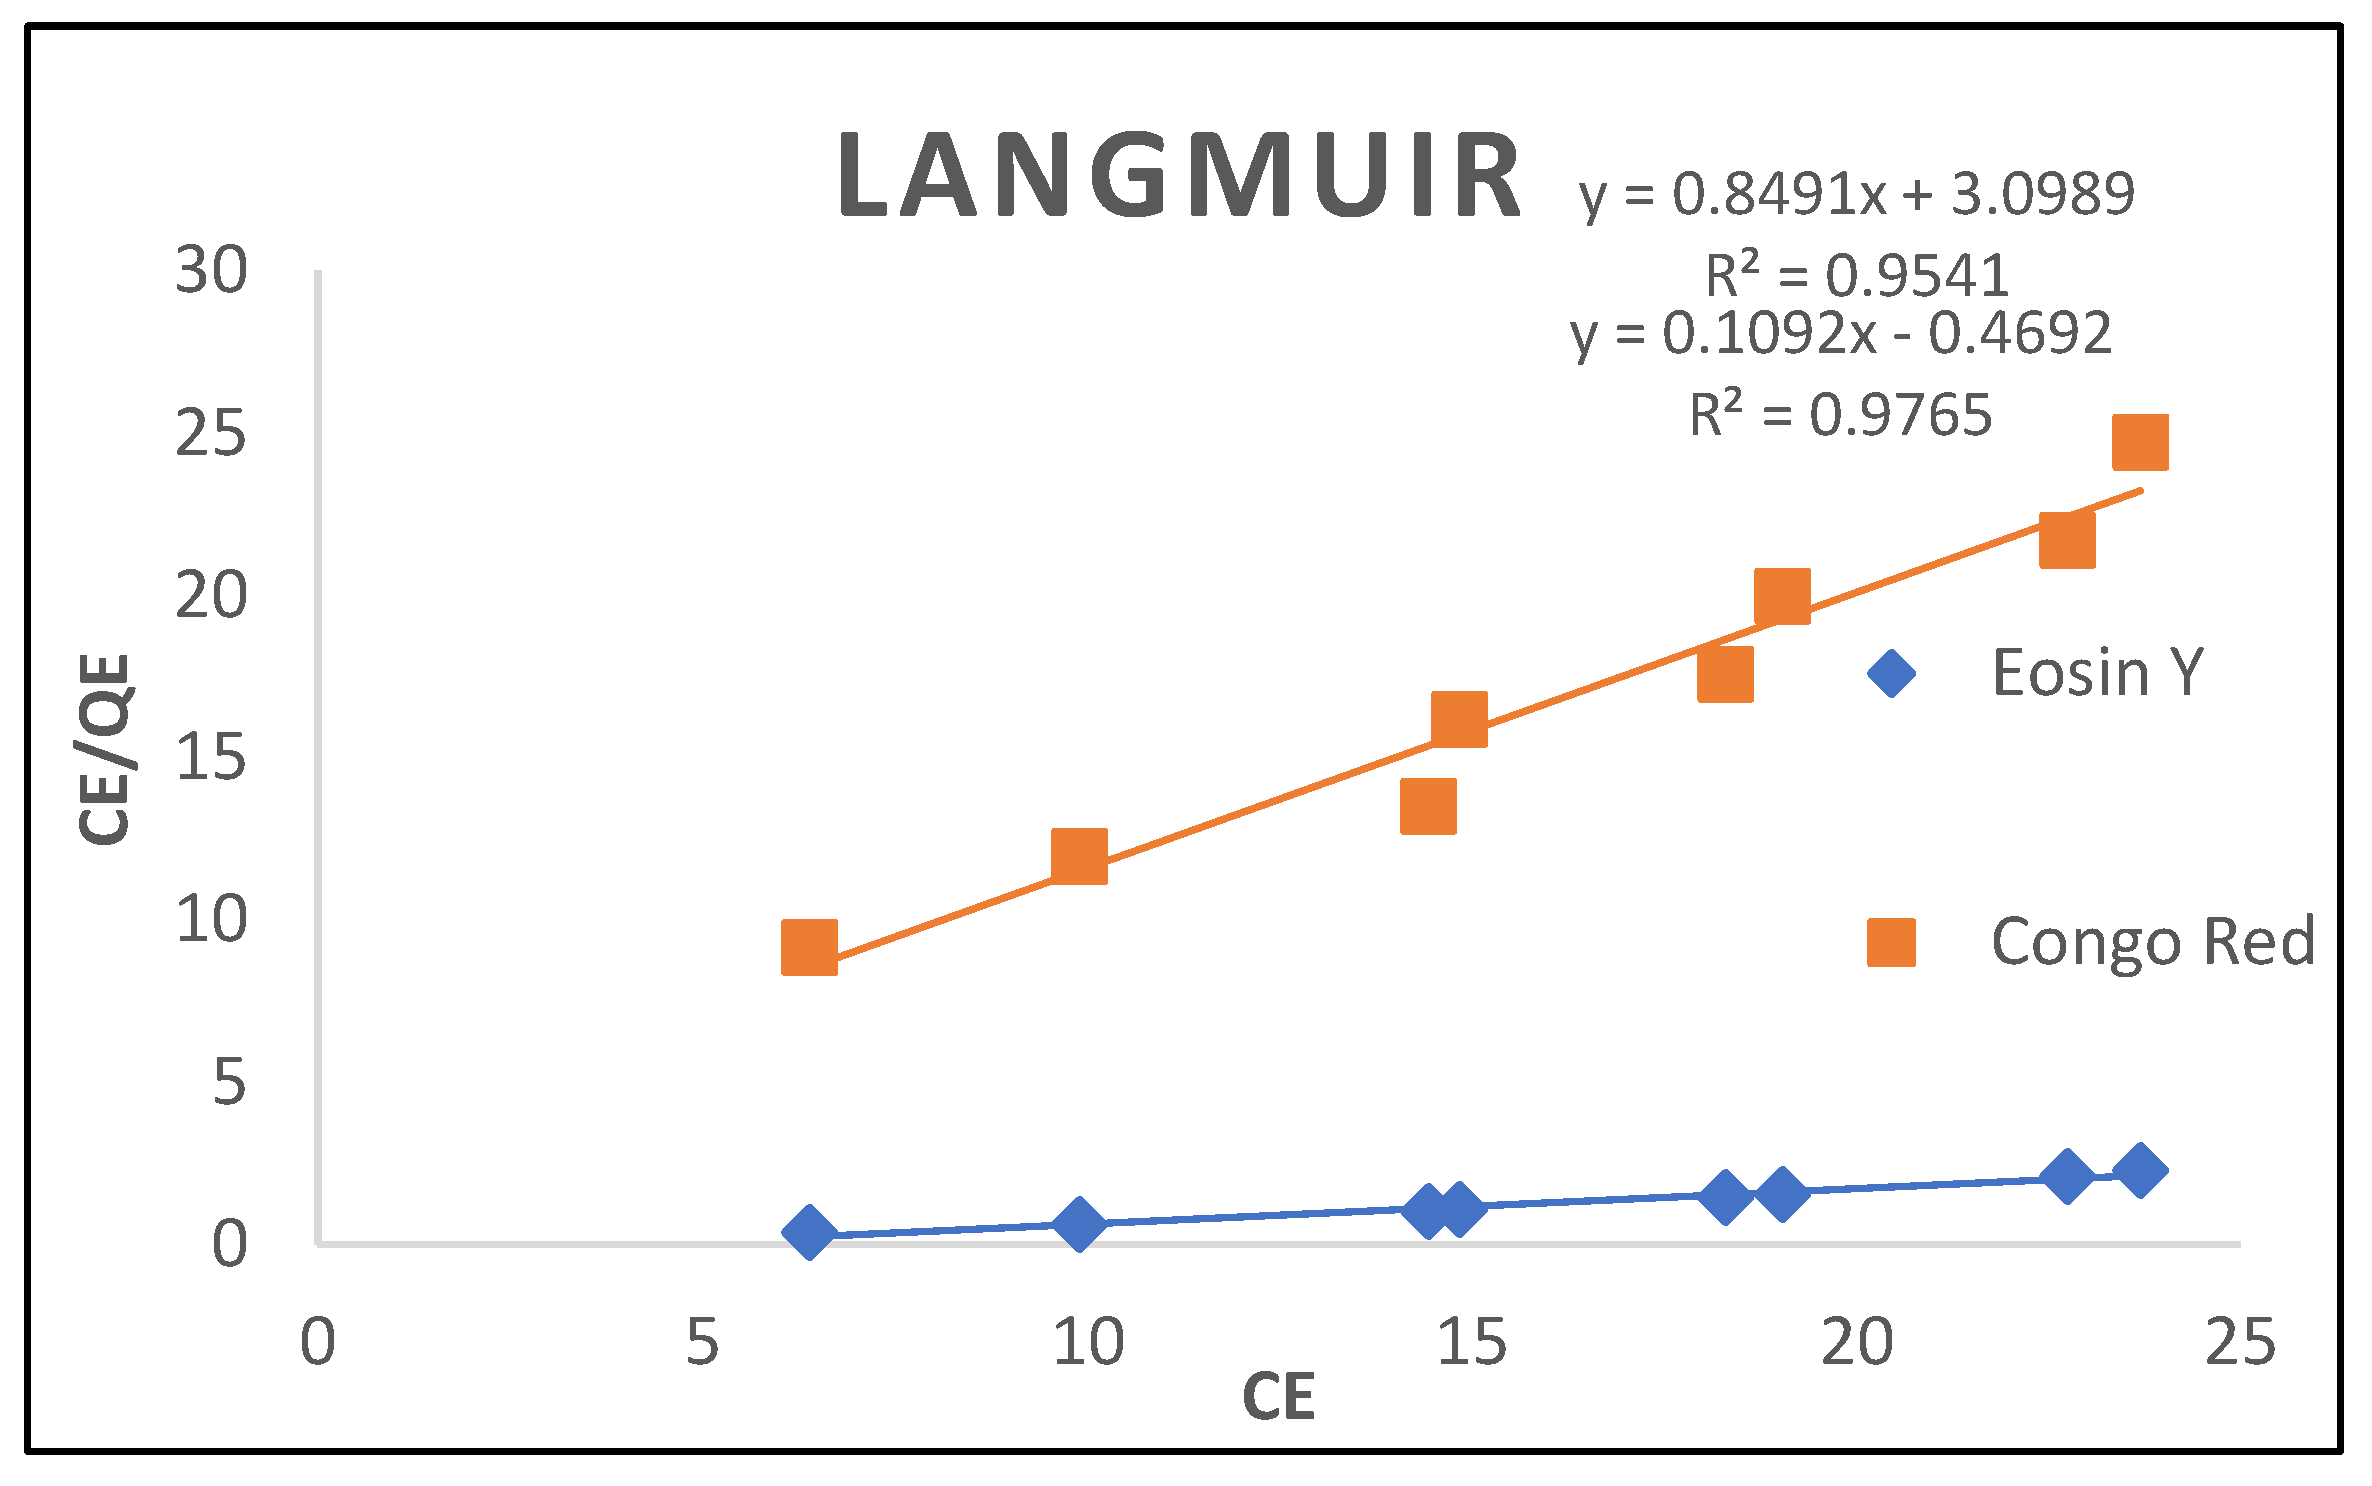
| System | Eosin Y | Congo-Red |
|---|---|---|
| Langmuir Isotherm | ||
| Qm(mg/g) Kl (L/mg) RL R2 |
14.3226 3.6509 0.01351 0.9541 |
13.0153 4.5440 0.0111 0.9765 |
| Frendlich | ||
| K (L/mg) N R2 |
0.0347 1.476 0.712 |
4.2840 -2.609 0.801 |
| Temkin | ||
| Β(mg/L) α(L/mg) R2 |
16.002 11.565 0.9769 |
15.183 12.48 0.9627 |
| Harkins-jura | ||
| B A R2 |
-1.338 -2.936 0.744 |
103.09 -0.567 0.872 |
| Halsey | ||
| Nh KH R2 |
-2.617 -1.4067 0.829 |
1.4764 0.0511 0.722 |
3.3. Regeneration Studies
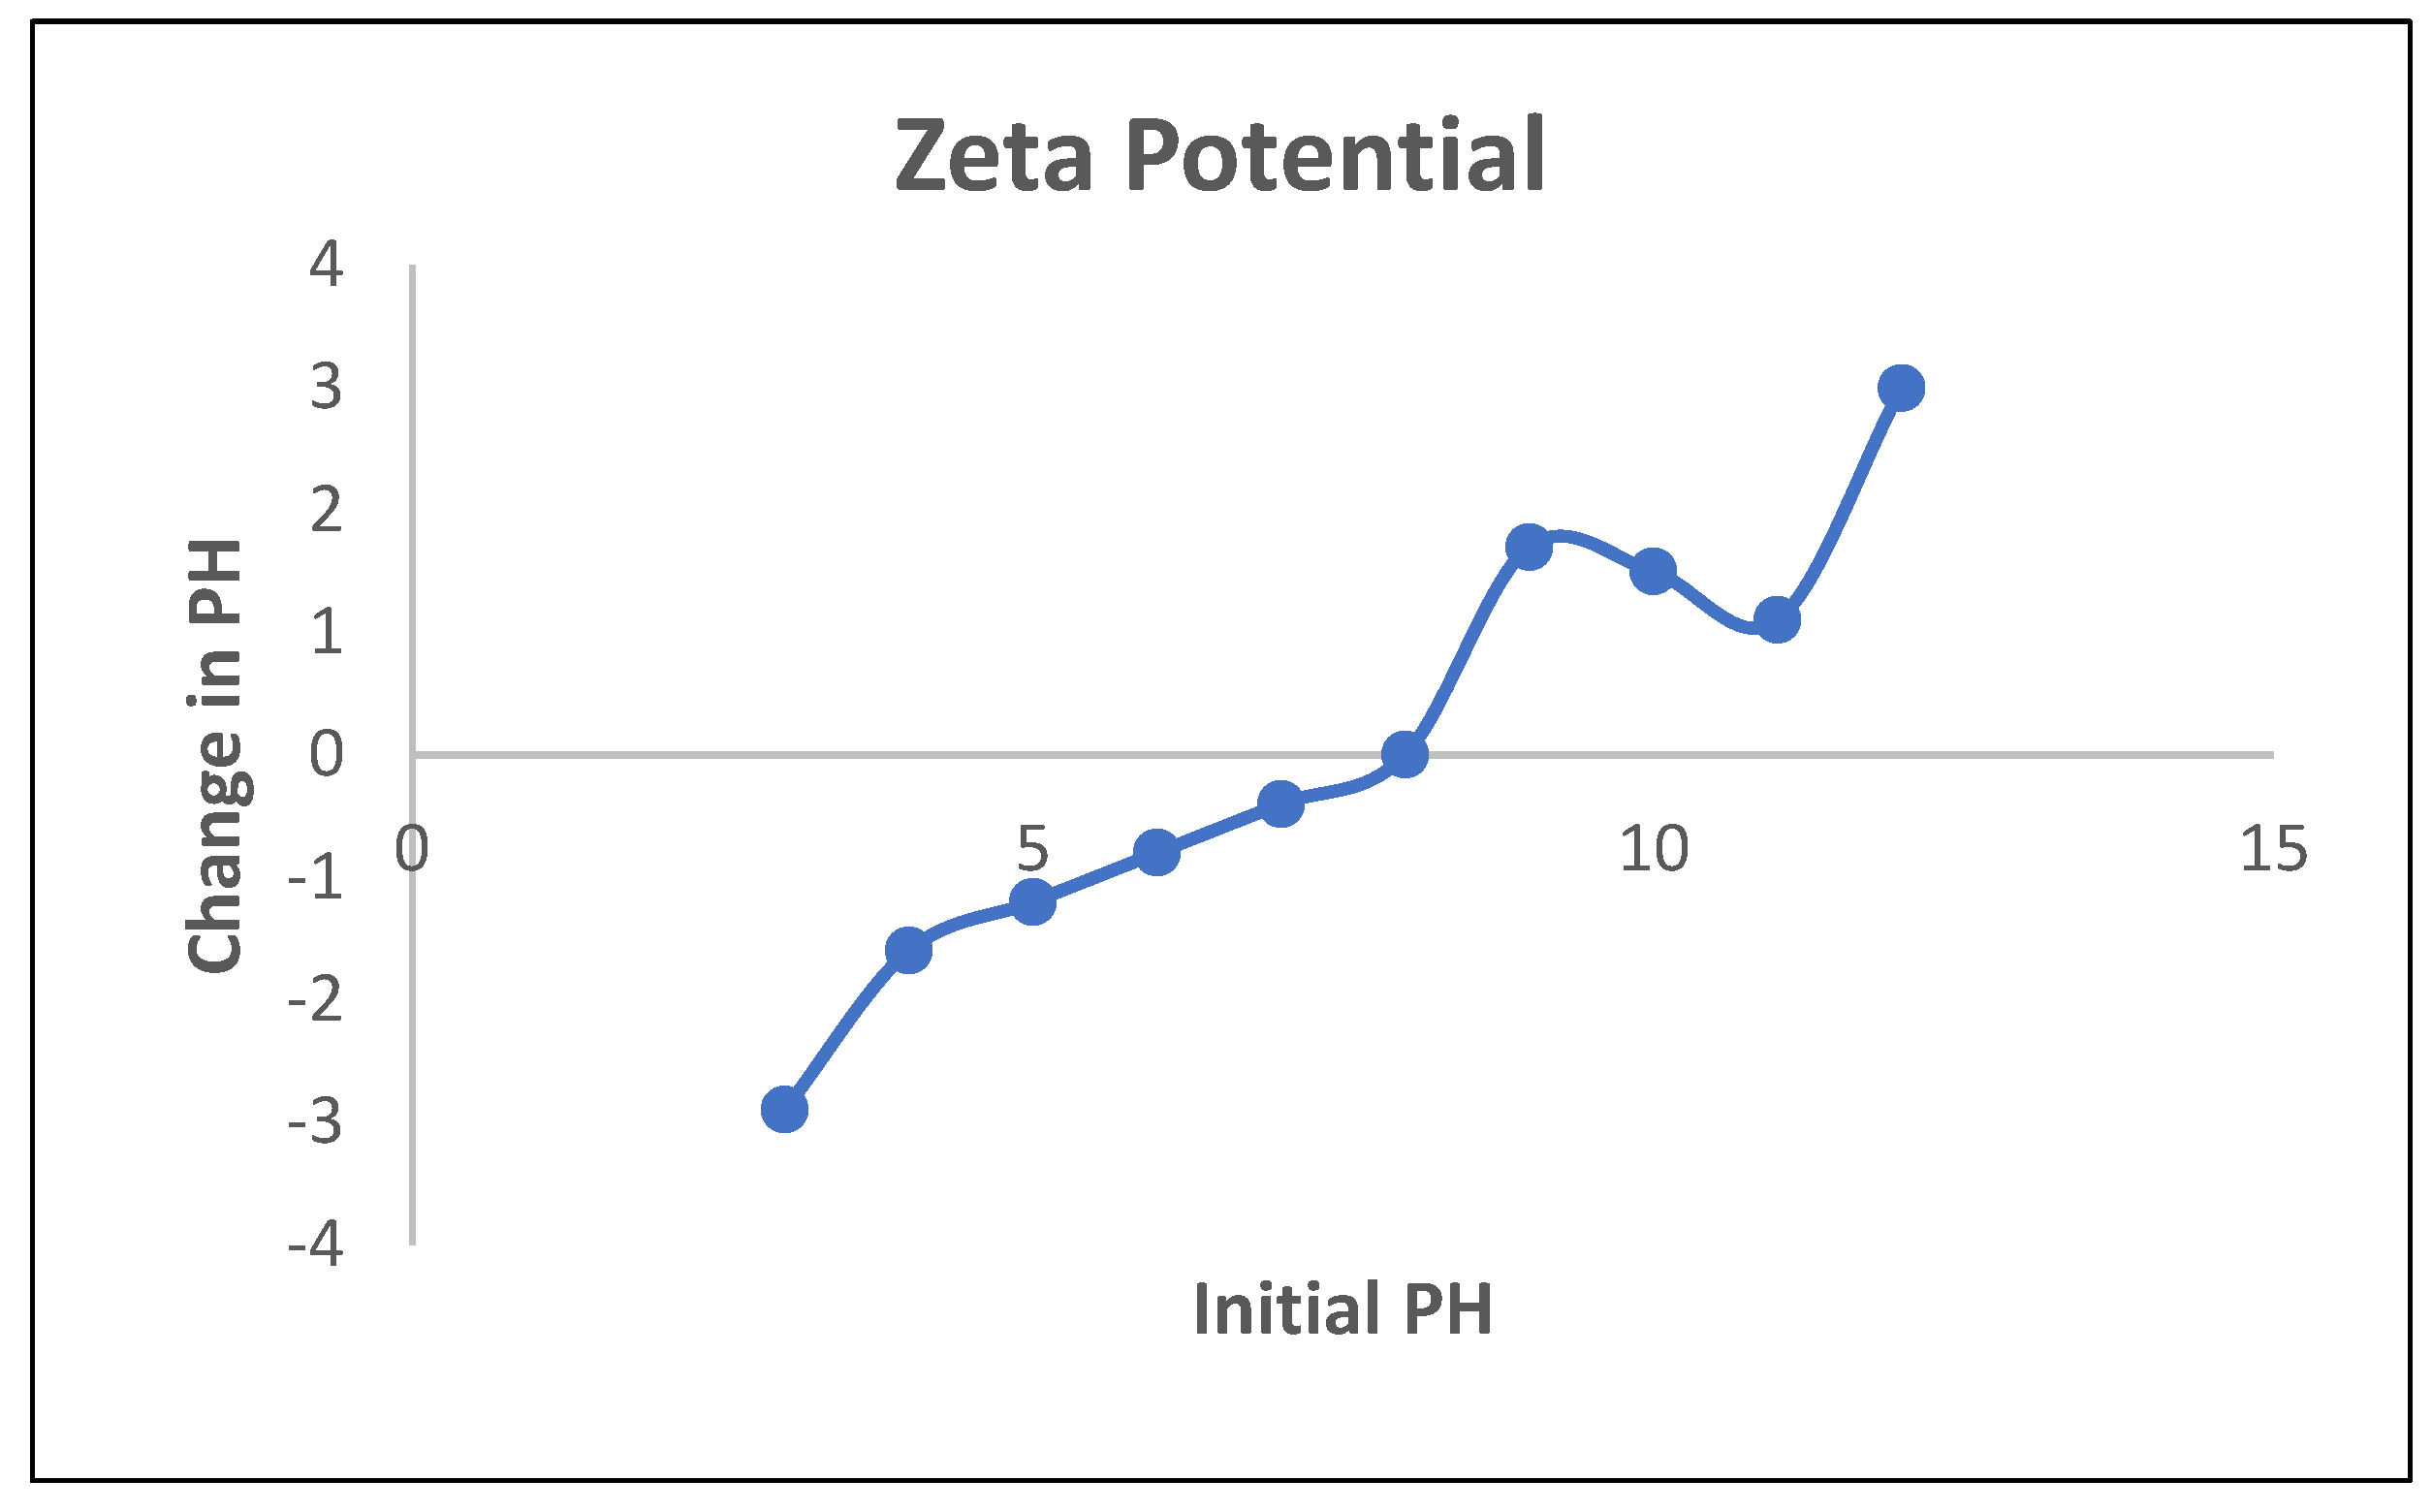
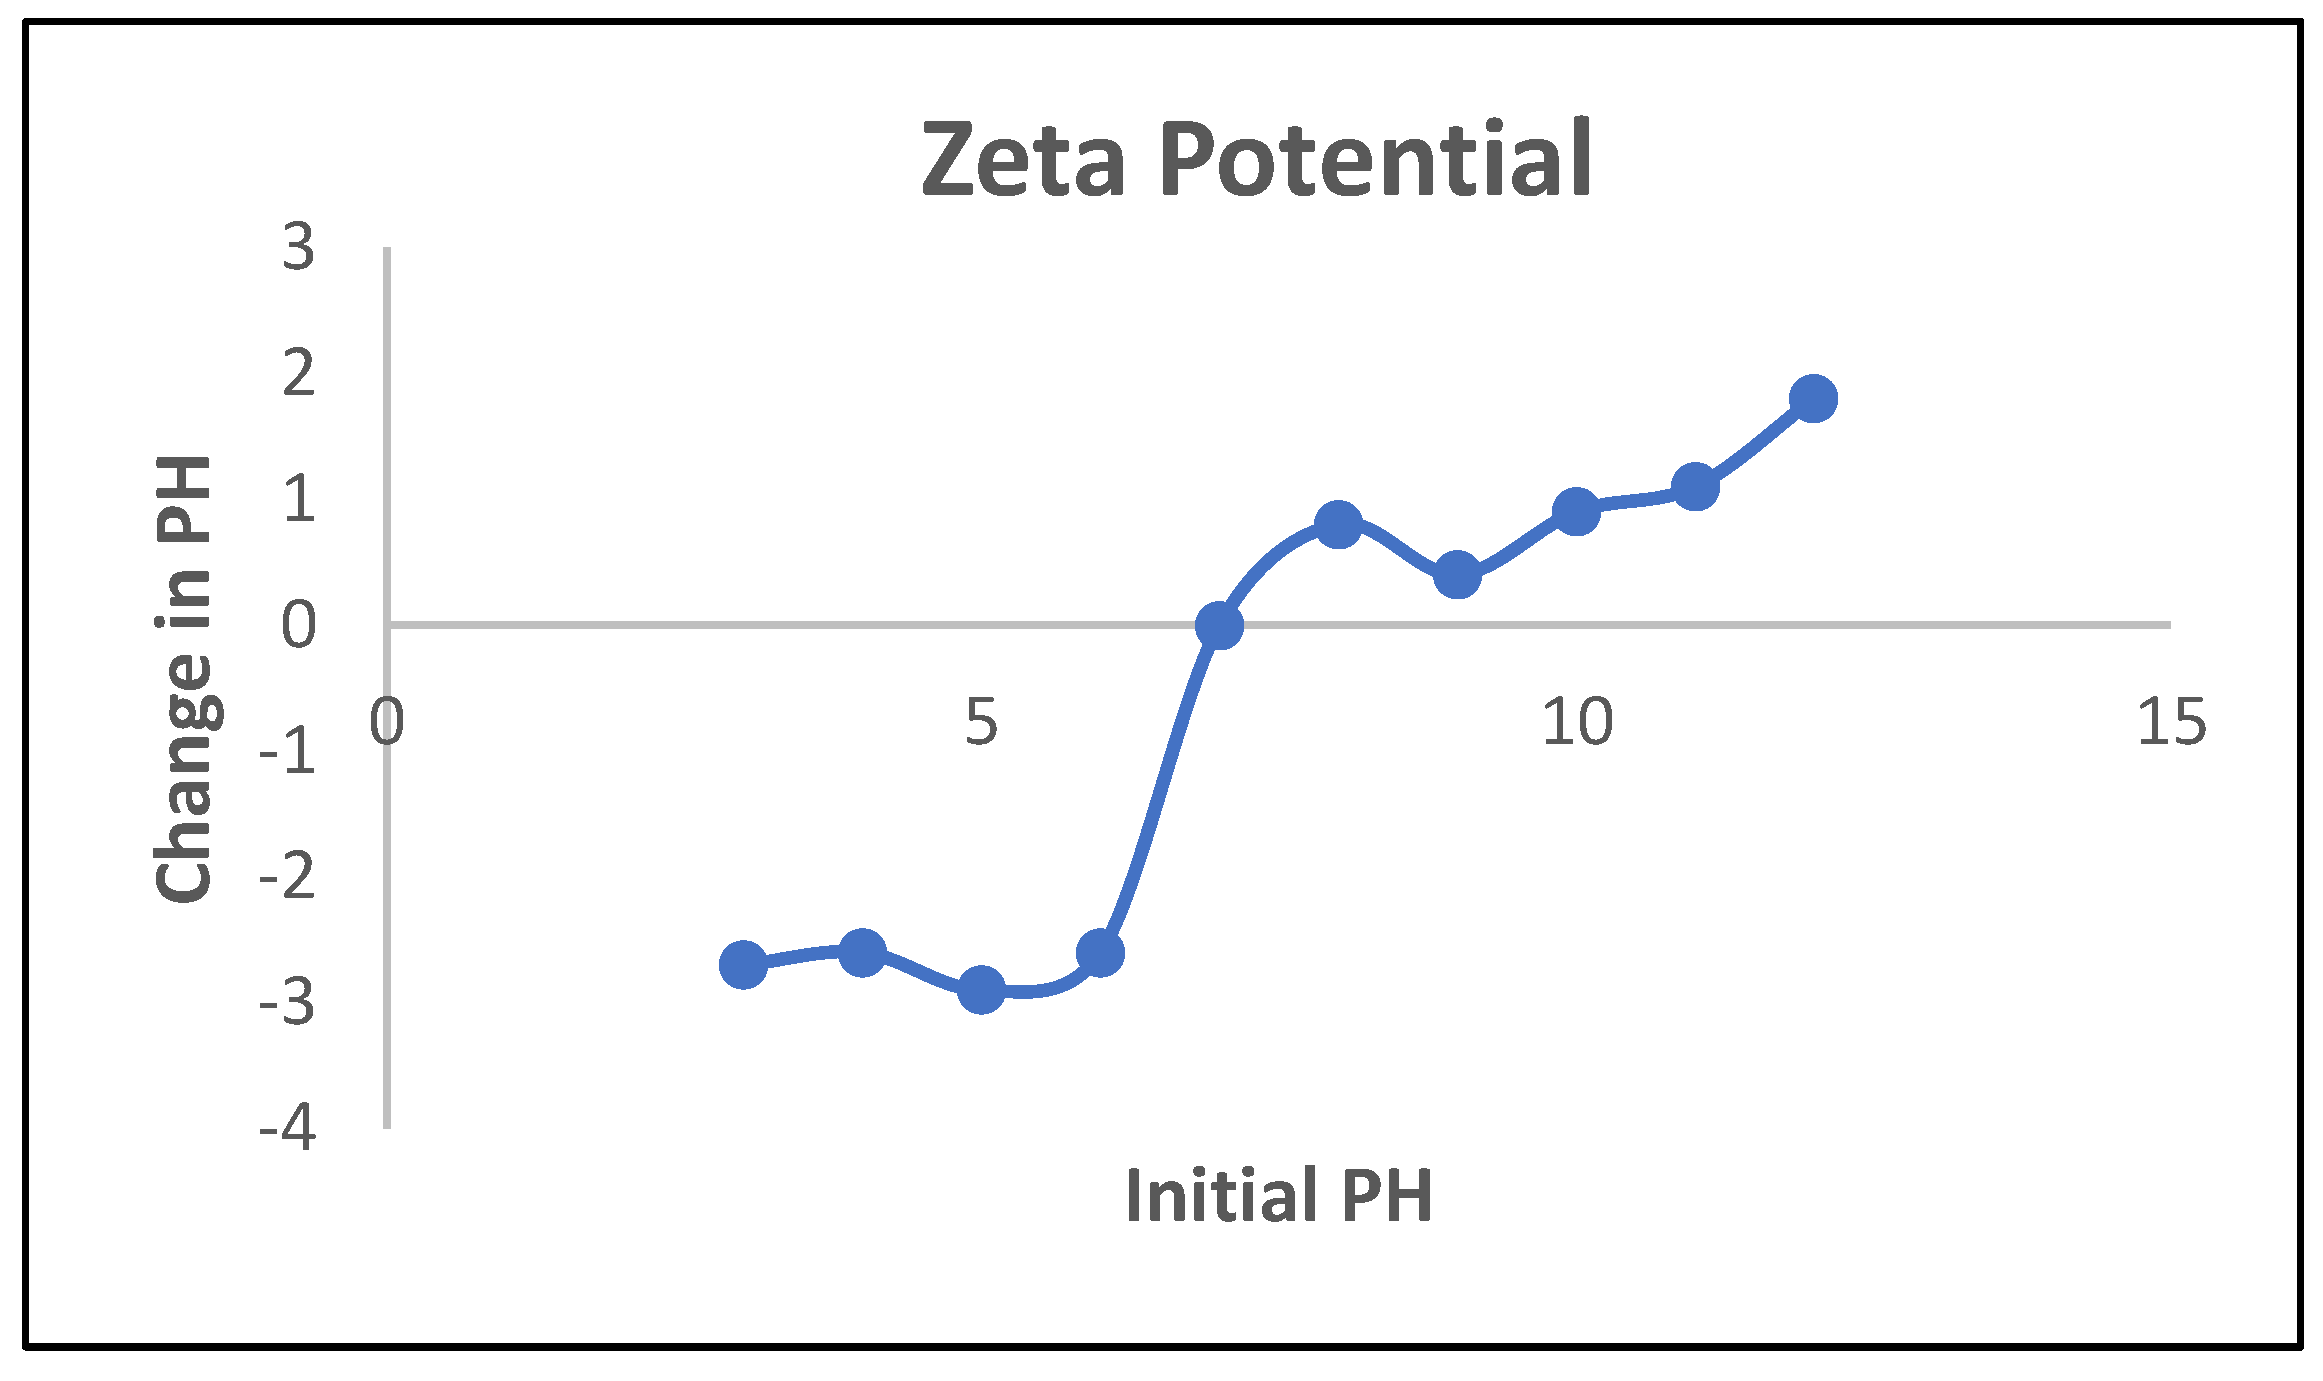
3.4. Point of Zero Charge (PZC) Determination
4. Conclusions
Funding
Conflicts of Interest
References
- Bhattacharya, D.; Gupta, R.K. Nanotechnology and Potential of Microorganisms. Crit. Rev. Biotechnol. 2005, 25, 199–204. [Google Scholar] [CrossRef]
- Logothetidis, S. , Nanomedicine: the medicine of tomorrow, in Nanomedicine and Nanobiotechnology. 2011, Springer. p. 1-26.
- Shao, G.N., H. Kim, and S. Imran, https://www.sciencedirect. com/science/article/abs/pii/S092633731500346X.2016.
- Naseem, T.; Waseem, M. A comprehensive review on the role of some important nanocomposites for antimicrobial and wastewater applications. Int. J. Environ. Sci. Technol. 2022, 19, 2221–2246. [Google Scholar] [CrossRef]
- Nasrollahzadeh, M. , et al., An introduction to nanotechnology, in Interface science and technology. 2019, Elsevier. p. 1-27.
- Molla, M.A.I. , et al., Fabrication of Ag-doped ZnO by mechanochemical combustion method and their application into photocatalytic Famotidine degradation. Journal of Environmental Science and Health, Part A 2019, 54, 914–923. [Google Scholar] [CrossRef]
- Shao, X.L. , et al., A study of the transition between the non-polar and bipolar resistance switching mechanisms in the TiN/TiO 2/Al memory. Nanoscale 2016, 8, 16455–16466. [Google Scholar] [CrossRef]
- Chaudhry, F.N. and M. Malik, Factors affecting water pollution: a review. J. Ecosyst. Ecography 2017, 7, 225–231. [Google Scholar]
- Singh, S.; Wasewar, K. L.; Kansal, S. K. Low-cost adsorbents for removal of inorganic impurities from wastewater. Inorganic pollutant.water 2020, 173–203. [Google Scholar] [CrossRef]
- Ali, I.; Gupta, V.K. Advances in water treatment by adsorption technology. Nat. Protoc. 2006, 1, 2661–2667. [Google Scholar] [CrossRef]
- Du, X.; Skachko, I.; Barker, A.; Andrei, E.Y. Approaching ballistic transport in suspended graphene. Nat. Nanotechnol. 2008, 3, 491–495. [Google Scholar] [CrossRef]
- Harja, M.; Buema, G.; Bucur, D. Recent advances in removal of Congo Red dye by adsorption using an industrial waste. Sci. Rep. 2022, 12, 6087. [Google Scholar] [CrossRef]
- Liu, Y.; Chen, Y.; Shi, Y.; Wan, D.; Chen, J.; Xiao, S. Adsorption of toxic dye Eosin Y from aqueous solution by clay/carbon composite derived from spent bleaching earth. Water Environ. Res. 2020, 93, 159–169. [Google Scholar] [CrossRef]
- Rashed, M.N. , Adsorption technique for the removal of organic pollutants from water and wastewater. Organic pollutants-monitoring, risk and treatment 2013, 7, 167–194. [Google Scholar]
- Rashid, R.; Shafiq, I.; Akhter, P.; Iqbal, M.J.; Hussain, M. A state-of-the-art review on wastewater treatment techniques: the effectiveness of adsorption method. Environ. Sci. Pollut. Res. 2021, 28, 9050–9066. [Google Scholar] [CrossRef]
- Zhang, Z.; Hu, B.; Zhuang, Q.; Wang, Y.; Luo, X.; Xie, Y.; Zhou, D. Green Synthesis of Fluorescent Nitrogen-Sulfur Co-Doped Carbon Dots from Scallion Leaves for Hemin Sensing. Anal. Lett. 2020, 53, 1704–1718. [Google Scholar] [CrossRef]
- Suresh, D.; Nethravathi, P.; Udayabhanu; Rajanaika, H. ; Nagabhushana, H.; Sharma, S. Green synthesis of multifunctional zinc oxide (ZnO) nanoparticles using Cassia fistula plant extract and their photodegradative, antioxidant and antibacterial activities. Mater. Sci. Semicond. Process. 2015, 31, 446–454. [Google Scholar] [CrossRef]
- Anuradha, C. and P. Raji, Citrus limon fruit juice-assisted biomimetic synthesis, characterization and antimicrobial activity of cobalt oxide (Co 3 O 4) nanoparticles. Applied Physics A 2021, 127, 1–9. [Google Scholar] [CrossRef]
- Zhu, J.; Chu, H.; Shen, J.; Wang, C.; Wei, Y. Green preparation of carbon dots from plum as a ratiometric fluorescent probe for detection of doxorubicin. Opt. Mater. 2021, 114. [Google Scholar] [CrossRef]
- Devi, G.K.; Kumar, P.S.; Kumar, K.S. Green synthesis of novel silver nanocomposite hydrogel based on sodium alginate as an efficient biosorbent for the dye wastewater treatment: prediction of isotherm and kinetic parameters. Desalination Water Treat. 2016, 57, 27686–27699. [Google Scholar] [CrossRef]
- Luque, P.A.; Soto-Robles, C.A.; Nava, O.; Gomez-Gutierrez, C.M.; Castro-Beltran, A.; Garrafa-Galvez, H.E.; Vilchis-Nestor, A.R.; Olivas, A. Green synthesis of zinc oxide nanoparticles using Citrus sinensis extract. J. Mater. Sci. Mater. Electron. 2018, 29, 9764–9770. [Google Scholar] [CrossRef]
- Mtavangu, S.G.; Machunda, R.L.; van der Bruggen, B.; Njau, K.N. In situ facile green synthesis of Ag–ZnO nanocomposites using Tetradenia riperia leaf extract and its antimicrobial efficacy on water disinfection. Sci. Rep. 2022, 12, 15359. [Google Scholar] [CrossRef] [PubMed]
- Grassi, M. , et al., Removal of emerging contaminants from water and wastewater by adsorption process. Emerging compounds removal from wastewater: natural and solar based treatments, 2012: p. 15-37.
- Du, W.L.; Xu, Z.R.; Han, X.Y.; Xu, Y.L.; Miao, Z.G. Preparation, characterization and adsorption properties of chitosan nanoparticles for eosin Y as a model anionic dye. J. Hazard. Mater. 2007, 153, 152–156. [Google Scholar] [CrossRef]
- Mittal, A.; Mittal, J.; Malviya, A.; Gupta, V. Adsorptive removal of hazardous anionic dye “Congo red” from wastewater using waste materials and recovery by desorption. J. Colloid Interface Sci. 2009, 340, 16–26. [Google Scholar] [CrossRef]
- Kalotra, S.; Mehta, R. Synthesis of polyaniline/clay nanocomposites by in situ polymerization and its application for the removal of Acid Green 25 dye from wastewater. Polym. Bull. 2020, 78, 2439–2463. [Google Scholar] [CrossRef]
- Anitha, T. Synthesis of nano-sized chitosan blended polyvinyl alcohol for the removal of Eosin Yellow dye from aqueous solution. J. Water Process. Eng. 2016, 13, 127–136. [CrossRef]
- Mahmood, K. , et al., Green synthesis of Ag@ CdO nanocomposite and their application towards brilliant green dye degradation from wastewater. Journal of Nanostructure in Chemistry 2021, 1–13. [Google Scholar]
- Guo, X.; Wang, J. A general kinetic model for adsorption: Theoretical analysis and modeling. Journal of Molecular Liquids 2019, 288, 111100. [Google Scholar] [CrossRef]
- Wang, J.; Guo, X. Adsorption isotherm models: Classification, physical meaning, application and solving method. Chemosphere 2020, 258, 127279. [Google Scholar] [CrossRef] [PubMed]
- Ayawei, N.; Ebelegi, A.N.; Wankasi, D. Modelling and Interpretation of Adsorption Isotherms. J. Chem. 2017, 2017, 3039817. [Google Scholar] [CrossRef]
- Alagumuthu, G., V. Veeraputhiran, and R. Venkataraman, Adsorption isotherms on fluoride removal: batch techniques. Arch. Appl. Sci. Res 2010, 2, 170–185. [Google Scholar]
- Kalam, S.; Abu-Khamsin, S.A.; Kamal, M.S.; Patil, S. Surfactant Adsorption Isotherms: A Review. ACS Omega 2021, 6, 32342–32348. [Google Scholar] [CrossRef]
- Liu, J.; Wang, X. Novel Silica-Based Hybrid Adsorbents: Lead(II) Adsorption Isotherms. Sci. World J. 2013, 2013, 1–6. [Google Scholar] [CrossRef] [PubMed]
Disclaimer/Publisher’s Note: The statements, opinions and data contained in all publications are solely those of the individual author(s) and contributor(s) and not of MDPI and/or the editor(s). MDPI and/or the editor(s) disclaim responsibility for any injury to people or property resulting from any ideas, methods, instructions or products referred to in the content. |
© 2024 by the authors. Licensee MDPI, Basel, Switzerland. This article is an open access article distributed under the terms and conditions of the Creative Commons Attribution (CC BY) license (http://creativecommons.org/licenses/by/4.0/).


