
Submitted:
12 December 2024
Posted:
13 December 2024
You are already at the latest version
Abstract
The aim of this study was to examine the hepatoprotective activity of multicomponent mixtures of natural origin in the BALB/C mice model with subacute liver failure (SALF) induced by the administration of toxin carbon tetrachloride (CCl4). The hepatoprotective activity of activated hydrolytic lignin (BP-Cx-1), humic acid peloids (HA) and isoflavones from kudzu, Pueraria lobata (IFL) roots was evaluated using mass spectrometry based omics technologies. MASS SPECTROMETRY BASED multi-OMICS analysis revealed new insight on the molecular mechanism of the hepatoprotective activity of multicomponent mixtures of natural origin. The significant differences were observed in proteome and metabolome profiles of urine and liver of BALB/c mice with SALF between control group with CCl4 administration, intact control, and groups receiving potential hepatoprotectors of natural origin (BP-Cx-1, HA, IFL). Proteomic and metabolomics analysis demonstrated that among samples IFL possessed the highest hepatoprotective potential, which correlated well with the relative effectiveness of the drugs recorded during in vitro studies. The results correlate with the relative effectiveness of the drugs recorded in previous in vitro and in vivo studies. Leading IFL activity may be attributed to a higher content of active polyphenolic components compared to heterogeneous HA and BP-Cx-1. Enrichment with active components by fractionation is a direction, which can be explored for developing hetepoprotective agent based on natural complex polyphenols

Keywords:
proteomics
; liver
; mice
; biomarkers
; mass spectrometry
INTRODUCTION
Natural origin complex mixtures and their derivatives possess a wide range of biological activity and, often, low toxicity, which makes them promising candidates for therapeutic applications. The pharmacological effects of nature-derived mixtures were demonstrated in numerous studies [1,2]. Antioxidant activity, which is inherent to polyphenolic compounds, is believed to be the leading mode of action of lignin-like compounds [3]. Polyphenols are promising biologically active compounds with antioxidant and anti-inflammatory properties [4,5]. Natural agents containing phenolic sub-structures demonstrated ability to inactivate free radicals such as superoxide anion [6]. Lignin-based products demonstrated antimutagenic and anticarcinogenic activity, that associated with their sorption capacity and antioxidant properties, in particular, a significant reduction in DNA strand breaks was shown in the DNA comet assay of hamster lung V79 cells and human colon Caco-2 cells exposed to N-methyl-N '-nitro-N-nitrosoguanidine [7]. Notably, the pharmacological effects of lignin derivatives are quite wide. They are considered as agents for the treatment of diabetes (lignosulfonic acid) [8], obesity (lignophenols) [9], HIV infection (lignosulfonic acid, lignin-carbohydrate complexes) [10], emphysema and as anticoagulants (sulfated low molecular weight lignins) [11], and as potential nano-drug delivery systems [12]. However, lignin-based products are characterized by a low bioavailability in animals due to its poor solubility in water [13]. Nowadays, hydrolytic lignin was suggested as an adsorbent for acute poisoning with drugs, alcohol, salts of heavy metals, alkaloids, dysentery, dysbacteriosis, dyspepsia, foodborne toxic infections, salmonellosis, intoxications associated with purulent inflammatory diseases, liver and renal failure, food and drug allergies and etc. [14,15]. Liquid-phase hydrolysis was used for preparing water-soluble lignin derivatives with higher bioavailability, resulting in the target water-soluble modification of lignin – BP-Cx-1 [3]. One of the fundamental differences between the BP-Cx-1 and other polyphenolic mixtures is the low degree of oxidation, high content of aromatic structures and the absence of nitrogen- and sulfur-containing components [3]. Humic substances (HS) and isoflavones are another class of complex mixtures with bioactive molecules of natural origin with potent antioxidant properties. HS comprise a large variety of compounds including lipids, tannins, carbohydrates and lignins and shows a wide spectrum of biological activity such as antiviral activity [15,16]. Previously it was shown that HS can inhibit class A β-Lactamase (TEM-1) [17]. Isoflavones are structurally similar to estradiol-17β and have molecular structures similar to animal estrogens, which can suppress immune cell excessive activation and delayed hypersensitivity [18]. Pharmacological activity of the abovementioned products can be attributed mostly to the presence of polyphenolic moieties. Nevertheless, their unique synergetic effects make natural mixtures promising reproducible candidates for drug development. The area of biomedical applications of natural origin complex mixtures and their derivatives remains actively growing. The mass-spectrometry (MS) based omics methods in particular high resolution MS techniques enable characterization of the wide multicomponent compositions of complex mixtures, identify potential bioactive natural drug compounds and molecular mechanisms of their action [19]. In our previous study active components were elucidated by the extraction of D-labeled BP-Cx-1 from mice livers followed by MS analysis and potential compounds with hepatoprotective properties were identified [20]. The penetration of particular components in liver tissue indicated the existence of bioactive pool of molecules in complex mixtures and the potential to use them to treat disorders, which lack of existing drugs, including liver damage.
Subacute liver failure (SALF) is a complication of acute hepatitis (AH) a rare disorder defined by the clinical progression of jaundice to hepatic encephalopathy in the absence of preexisting liver disease in fewer than 28 days [21]. SALF can be associated with seronegative hepatitis, drug-induced liver failure, autoimmune hepatitis, Budd-Chiari syndrome, and Wilson disease [22]. AH usually causes a high mortality risk or increased tendency to cirrhosis development[23]. SALF pathogenesis is unknown and its therapy is unsatisfactory[24]. Once the criteria for poor AH prognosis have been met, the only effective treatment will be an liver transplantation [21].
The aim of this study was to examine the hepatoprotective activity of multicomponent mixtures of natural origin in the BALB/C mice model with SALF induced by the toxin carbon tetrachloride (CCl4). The hepatoprotective activity of activated hydrolytic lignin (BP-Cx-1), humic acid peloids (HA) and isoflavones from kudzu, Pueraria lobata (IFL) roots was evaluated using mass spectrometry based omics technologies.
2. RESULTS AND DISCUSSION
2.1. Overview of the Study Pipeline
To examine the hepatoprotective activity of natural and nature-derived polyphenols, we developed the following methodology (Figure 1). In the first step, cell cytotoxicity and hepatoprotective activity of investigated mixtures were determined on HepG2 hepatocyte cell culture. Secondly, samples with a pronounced hepatoprotective effect were included for in vivo testing in a subacute liver failure model in BALB/C mice. In vivo study included collection of urine and liver tissues for proteome analysis with LC-MS, and non-target analysis of metabolites with ultra-high resolution mass spectrometry. Study included n samples, extracted from natural sources and one synthetic mixture reported in our previous work [20].
2.2. Determination of the Hepatoprotective Effect In Vitro
MTT colorimetric assay was conducted to determine the hepatoprotective effect of nature-derived polyphenols (%) on average in 2 repetitions. Cells were incubated in a therapeutic mode - with the addition of a hepatoprotector to the culture medium after incubation of hepatocytes with CCl4. Samples included: humic (HA) and fulvic acid (FA), LM (Legume musk), BP-Cx-1 and IFL. HA, IFL and BP-Cx-1 showed a pronounced hepatoprotective effect (Figure 2, Table S1) and were selected for further in vivo study. Cell viability was identified by measuring the optical density with a microplate reader at 630 nm. For all samples, the effective dose 50 (ED50) was calculated using linear-logarithmic interpolation using the AAT Bioquest online calculator: ED50 HA = 238.9997 μg/ml; ED50 BP-Cx- 1 = 236.9988 µg/ml; ED50 IFL = 87.1657 µg/ml (Figure S1).
2.3. Determination of the Hepatoprotective Effect In Vivo
The dynamics of body weight of mice in the model of subacute liver failure by CCl4 presented in the Table S2. Statistically significant differences in the body weight of animals in the experimental groups compared to the negative control group were revealed in the CCl4 group, as well as in the BP-Cx-1 group. On the 17th day after the first administration of CCl4, a significant decrease in body weight was observed in the CCl4 group to 20.01 ± 1.56 g (vs. 21.24 ± 1.47 g in the negative control group (p-value < 0.05). On 3, 7, 10, 14, 17, 21 days after the first administration of CCl4, the body weight in group CCl4 + BP-Cx-1 also decreased statistically significantly relative to the values of the negative control (p-value < 0.05). The data on the body weight dynamics of experimental animals indicate the presence of toxic effects in all groups where CCl4 was administered, which corresponds to literature data and data from previous experiments conducted at our base using CCl4 [25]. Also, significant changes compared to the CCl4 group were revealed in the CCl4 + BP-Cx-1 group on the 14th day. In connection with the data obtained on the dynamics of body weight of experimental animals, we can conclude that the weight gain was less pronounced in the CCl4 + BP-Cx-1 group.
The liver mass index in the negative control group (5.4±0.11) was significantly lower than in all CCl4 induced pathology groups except for the group IFL (5.6±0.07, p=0.7403) (Figure S2). Treatment with IFL significantly decreased the mass index of the liver in comparison with CCl4 group (6.0±0.09, p=0.02). HA and BP-Cx-1 treatment slightly decreased liver mass index without statistical significance (5.96±0,11, p=0,9997 and 5,83±0,13, p=0,7118, respectively).
All mice treated with CCl4 developed severe microvesicular hepatic steatosis. In this liver injury model, the steatosis index 4-fold increased by CCl4 as compared to negative control (1.93±0.22 and 0.46 ± 0.18, respectively, p=0,0002). IFL treatment showed a pronounced hepatoprotector activity significantly decreasing the steatosis index by 70% to 0.58 ± 0.23 (p=0,0008 vs CCl4, and p=0,8300 vs Control) (Figure 3). Steatosis index was lower than in CCl4 group in BP-Cx-1 group by 34% (1.27 ± 0.24, p=0,1574 vs CCl4, and p=0,0805 vs Control) and in HA group – by 11% (1.75±0.3, p=0,8300 vs CCl4, and p=0,0014 vs Control). Thus, macro and micro studies of the liver showed subacute liver failure development by CCl4 and hepatoprotective activity of selected agents. Moreover, results of in vitro and in vivo tests corroborated well with IFL demonstrating the highest activity.
2.4. Proteomic Analysis
Urine proteome Fraction Analysis
As the result of proteomic analysis of 20 urine pooled samples collected with metabolic cages 1882 protein groups were identified (FDR 1%) (Table S3). Evaluation of the proteomic composition in different groups was performed via hierarchical clustering based on the average levels of label-free quantification (LFQ) intensities. Semi-quantitative label-free proteomic analysis revealed 47 proteins (p-value < 0.01) which relative abundances were significantly changed in the CCl4 group with respect to the negative control (Table S4). Enrichment analysis was conducted via the GO database using the STRING software [26]. Proteins significantly changed in CCL4 group are involved in extracellular matrix organization (Comp, Ctsb, Vcam1, Spp1, Ceacam1, Ctsl), as well as in abnormal wound healing (Scpep1, Comp, Tgfbr1, Spp1, Ceacam1).
Multisample ANOVA analysis of BP-Cx-1 and CCL4 groups with respect to the negative control group resulted in 117 significantly changed protein groups. Proteins are participated in extracellular matrix organization (Cdh1, Icam2, Comp, Nid1, Ctsb, Plg, Vtn, Madcam1, Vcam1, Pcolce, F11r, Fn1, Efemp2, Spp1, Ceacam1, Cd47, Ctsd), abnormal vascular wound healing (Comp, Lrp1, Spp1, Ceacam1) and in innate immune system pathways (Gm2a, Icam2, Ctsb, Vtn, Npc2, Ly86, Plau, Clu, Cfb, Dpp7, Dsc1, Gns, Hp, Cfi, Ggh, Ceacam1, Ear1, Cd47, Creg1, Ctsd, Ear6, Rnaset2b, Psap, Mme).
Liver Proteome Fraction Analysis
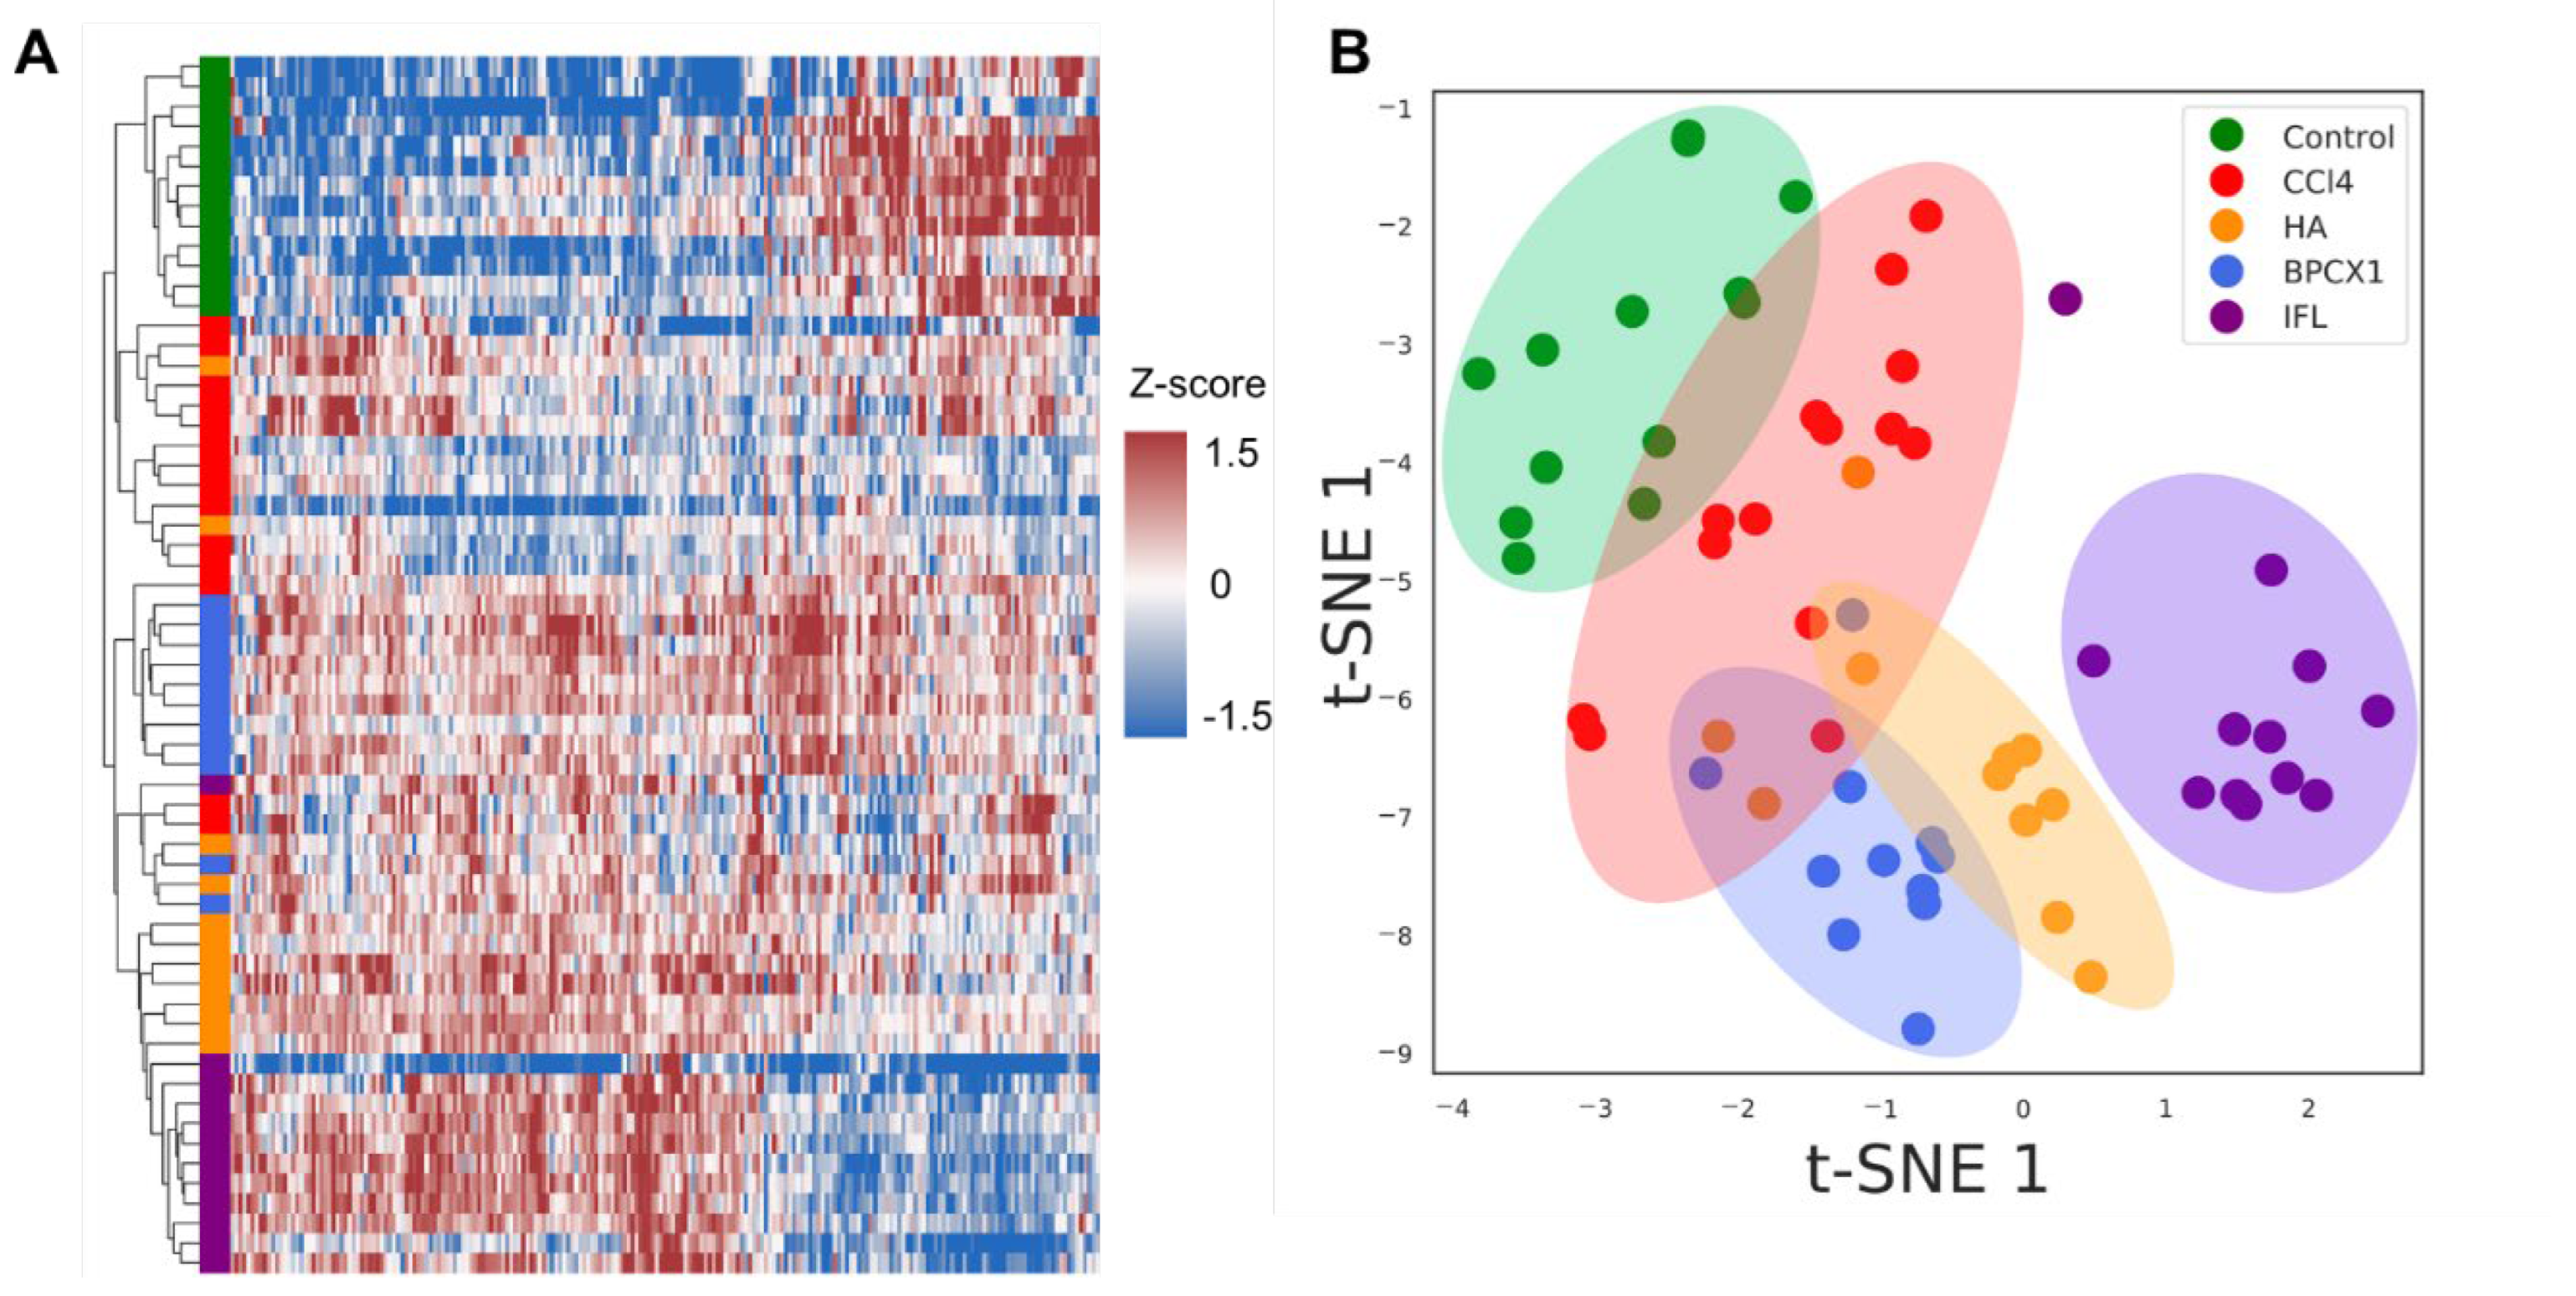
Liver tissues were collected on the 29th day. As the result of proteomic analysis of 62 extracts 4617 protein groups were identified (FDR 1%) (Table S5). Evaluation of the proteomic composition in different groups was performed via hierarchical clustering based on the average levels of label-free quantification (LFQ) intensities. ANOVA label-free proteomic analysis revealed 222 proteins (FDR < 0.01) which were significantly changed with respect to negative control (Table S6). T-SNE dimensionality reduction method shows the distribution of samples into major clusters (negative control, IFL, other groups) (Figure 4B). To assess the changes in the proteome composition between different treatment groups a Mann-Whitney test was performed. Proteomic composition of individual liver samples of BALB/c mice with subacute liver failure caused by CCl4 allowed us to reliably distinguish intact and IFL samples. Heat map analysis shows that negative control and IFL groups could be clearly distinguished by hierarchical clustering as well (Figure 4A).
Pairwise comparison revealed 101 proteins that were significantly (p-value < 0.5, abs (Cohen’s d-size) < 0.05) changed between the CCL4 and negative control groups (Table S7).
Figure 4.
A) Heat map of the significantly changed liver proteins (FDR <0.01) based on z-scores of the normalized LFQ values. The strength of the colors indicates the relative abundance of the protein in different groups. B) Clusterization by t-SNE of liver proteomic data for all 62 samples. Colored dots depict the liver samples: Control - green; CCL4- red; HA- orange; BPCX1 - blue; IFL – violet.
GO enrichment analysis revealed participation in regulation of cell death (21 protein), response on chemical stimulus (27 proteins), metabolic process (71 protein), in biosynthetic process (30 proteins) and etc.
2.5. Metabolomic Analysis
Molecular fingerprints of chloroform-methanol extracts from urine and liver samples were derived by HRMS analysis using FTICRMS.For each group the number of determined molecular formulae (MF) varied from 762 for HA group to 1246 MF for negative control (Figure S3). Molecular profiles of all experimental groups were characterized by significant differences (Figure S4). Only 350 MF were conservative, which was less than 50% of determined MF group-wise. Negative control, CCl4, HA, BP-Cx-1 and ISF groups contained 307, 112, 43m 119 and 82 unique MF groups, respectively. In addition, based constrained aromaticity index (AIcon) 31, 60, and 36 CHO-only MF were attributed to aromatic and condensed compounds for HA, BP-Cx-1 and ISF, respectively. Likely, these highly unsaturated CHO compounds derived directly from tissue penetration of hepatoprotective agents. Therefore, metabolite fraction also reflects the impact of administration of CCl4 or hepatoprotective agent. Based on intensity distribution, control group was distinct with higher similarity of all other groups (Figure S5).
3. DISCUSSION
Proteomic analysis revealed new insights on the molecular mechanism of the hepatoprotective activity of multicomponent mixtures of natural origin. The significant difference was observed in proteome profile of urine and liver of BALB/c mice with SALF between the negative control, CCl4 control, and receiving potential hepatoprotectors of natural origin (BP-Cx-1, Ha, IFL). Molecular fingerprinting of metabolites with FTICR MS corroborated with proteome results. PCA analysis demonstrated a clear cluster of control samples, while samples from other groups showed a mixed picture (Figure S3). Nevertheless, the ISF group demonstrated higher similarity to control group with cosine similarity of 0.75 which also supports the proteomic results.
Proteins that were significantly changed in urine during CCL4 administration are involved in extracellular matrix organization (Comp, Ctsb, Vcam1, Spp1, Ceacam1, Ctsl), as well as in abnormal wound healing (Scpep1, Comp, Tgfbr1, Spp1, Ceacam1). A significant decrease in the level of Osteopontin (SPP1) was observed in the CCl4 group. SSP1 is an extracellular matrix protein involved in immune system processes in particular type-1 immune responses through enhancing production of interferon-gamma, interleukin-10, interleukin-12 cytokine expression. [27]. Prominin-1 (PROM1) is another significantly increased protein involved in cell differentiation, proliferation and apoptosis [28]. In contrast, the level of Cartilage oligomeric matrix protein (COMP) was significantly increased, COMP is a suppressor of apoptosis by blocking the activation of caspase-3 and by inducing the IAP family of survival proteins [29]. Carcinoembryonic antigen-related cell adhesion molecule 1 (CEACAM1) - plays the role of a co-inhibitory receptor in the immune response, affects the action of insulin, and also functions as an activator of angiogenesis [30,31,32]. Such changes can be associated acute-phase response and release of proteins from the liver, which act as inflammatory mediators and scavengers during tissue repair. The decreasing of apoptotic and immune proteins in treatment groups can be related with restoration of the inflamed tissue back to a normal status.
The most pronounced changes were observed in the IFL group – 40 significantly changed proteins were measured with respect to the CCl4 and negative control groups. Those proteins were participated in regulation of apoptosis (Ctsb, Plg, Cxadr, Ltf, Thbs1), innate immune system processes (Ctsb, Vtn, Hexb, Plau, Ltf, Ceacam1, Ear1, Creg1, Ctsl), as well as organization of the extracellular matrix (Comp, Ctsb, Plg, Vtn, Vcam1, F11r, Thbs1, Fn1, Ceacam1, Col15a1, Ctsl). Cathepsin B (CTSB) protein level was increased after CCl4 administration and decreased after IFL treatment. CTSB is a thiol protease that is involved in intracellular protein and extracellular matrix degradation [33]. Plasmin (PLG) was another protein that decreased its level with respect to the CCL4 group. PLG acts as a proteolytic enzyme in a variety of processes including tissue remodeling and inflammation - in particular in neutrophil apoptosis, macrophage reprogramming, and efferocytosis [34].
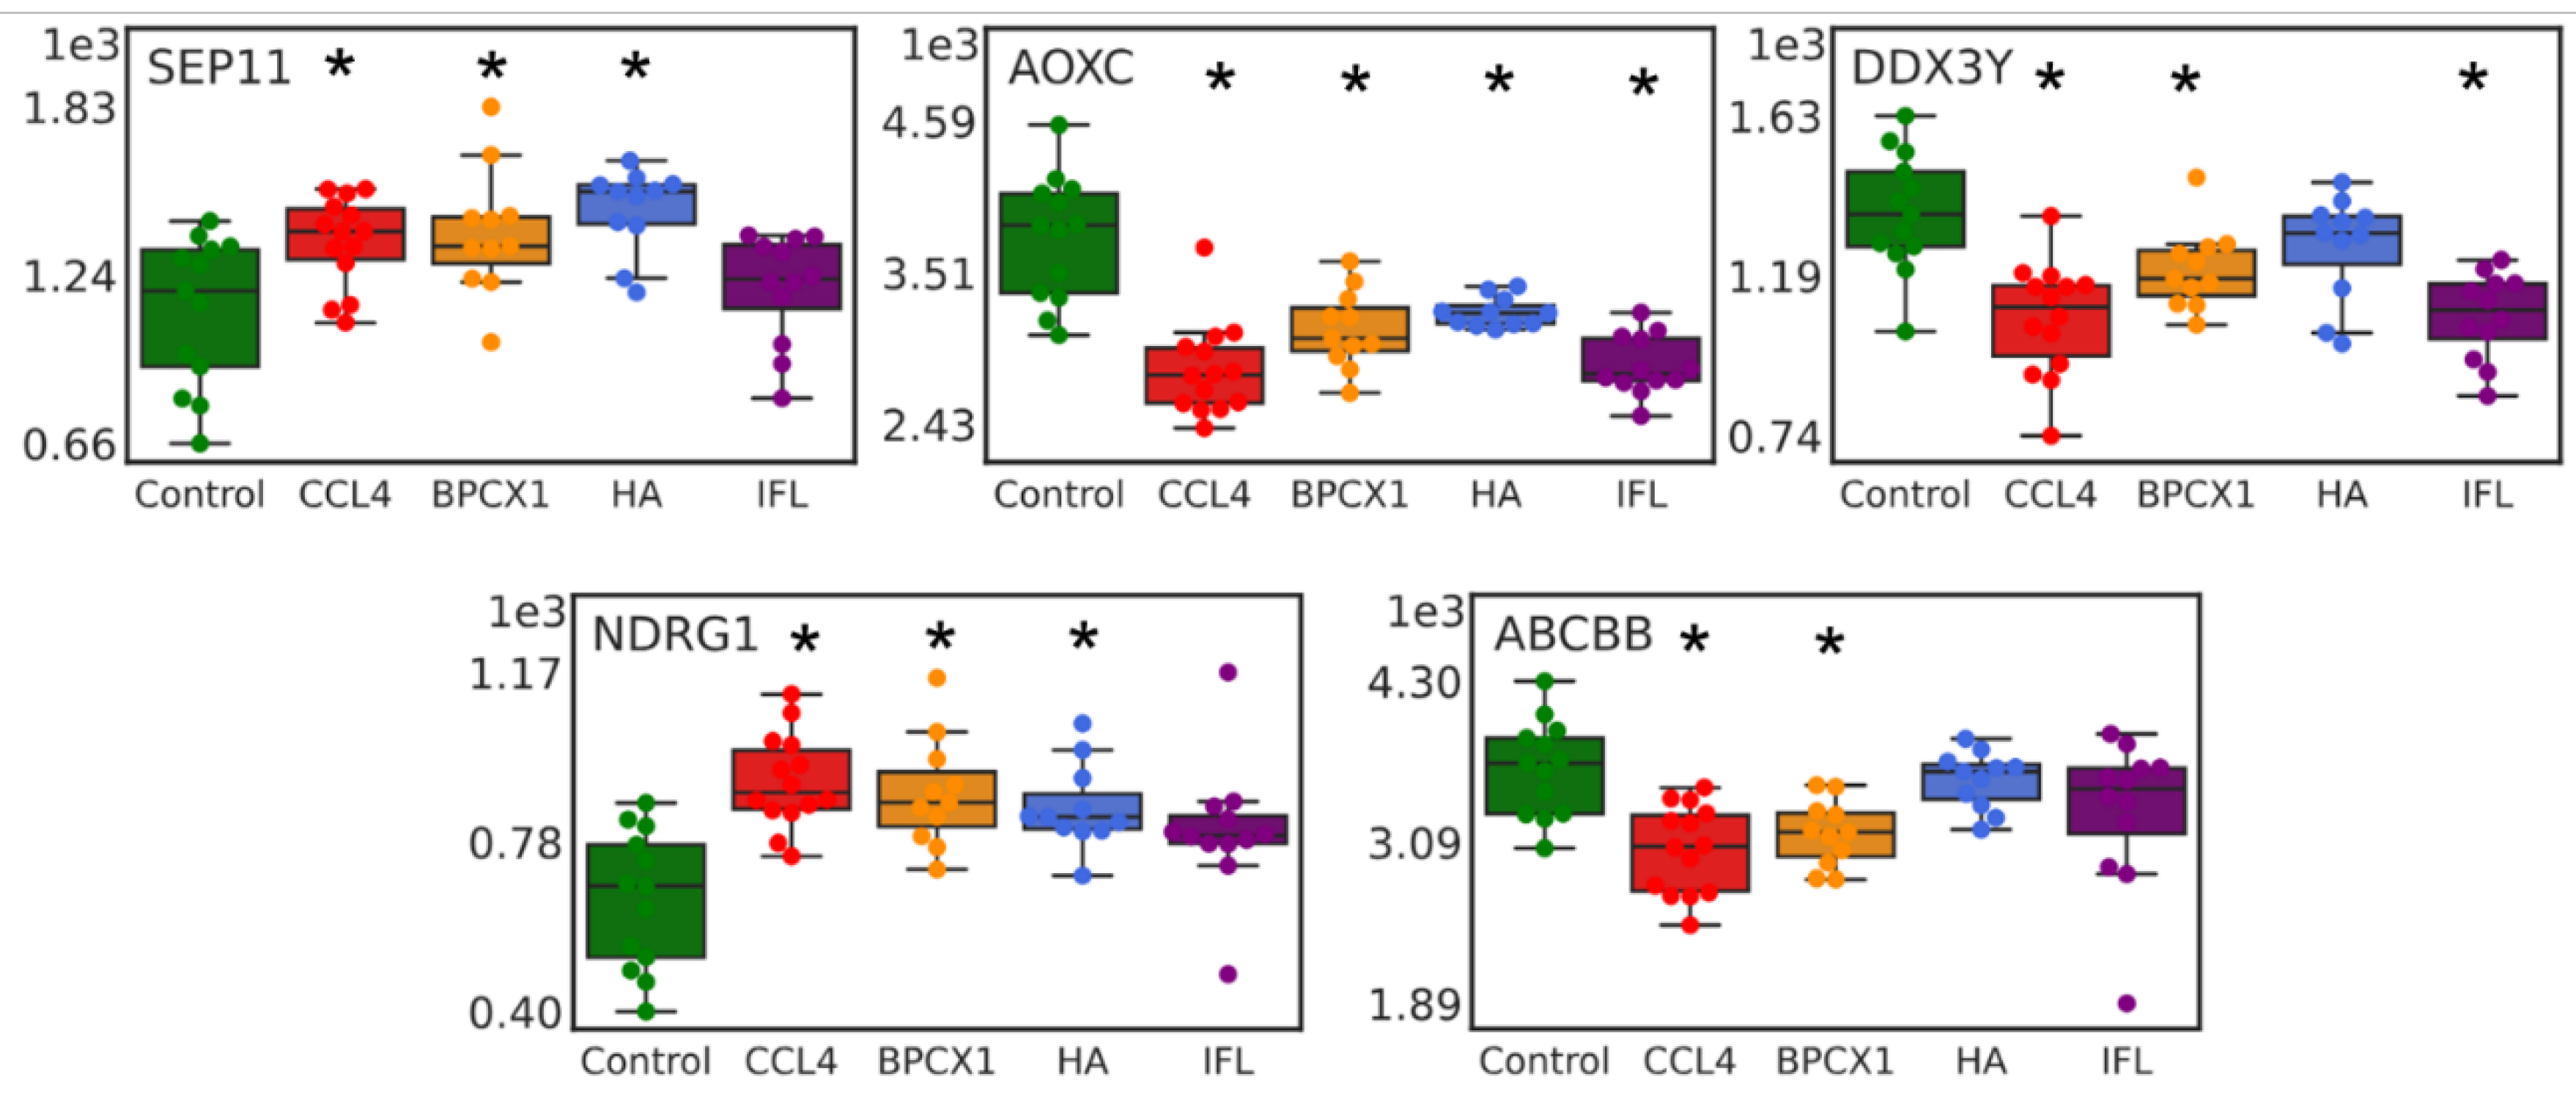
Among 101 significantly changed in mouse liver proteins, 5 proteins (AOXC, NDRG1, ABCBB, DDX3Y, SEP11) (Table S7) can be suggested as potential targets for drug intervention, based on their average concentration between the CCL4 and control groups (Figure 5). It is worth noting that NDRG1 is a stress-responsive protein involved in hormone responses, cell growth, and differentiation and acts as a tumor suppressor in many cell types. NDRG1 also participates in p53/TP53-mediated caspase activation and apoptosis [35]. Another important protein target is septin 11 (SEP11) which is involved in the regulation of reactive oxygen species homeostasis and mediates 27-hydroxycholesterol activation of endothelial inflammation via estrogen receptor alpha [36].
According to the results of a proteomic analysis the greatest hepatoprotective effect is exerted by the use of IFL, which correlates well with the relative effectiveness of the drugs recorded in vitro studies. The results correlate with the relative effectiveness of the drugs recorded in previous in vitro and in vivo studies and may be due to the lower molecular weight of the active isoflavonoids compared to the components of the polyphenolic drug BP-Cx-1.
4. MATERIALS AND METHODS
3.1. Animal Studies
All animal studies were carried out at the center for preclinical research of the Federal State Institution “National Medical Research Center of Oncology named after N.N. Petrov” of the Ministry of Health of Russian Federation in accordance with the Study Protocol and standard operating procedures.
The study cohort comprised 62 female BALB/C mice obtained from the Stolbovaya branch of FSBSI “Scientific Center for Biomedical Technologies of the Federal Medical and Biological Agency” of Russia. Before the start of the experiment animals underwent quarantine and adaptation for 17 days. Mice were housed at a room temperature of 20–23°C, relative air humidity of 54–58% and an air exchange rate of 8 volumes per hour. All animals received standard complete briquetted chow (Laboratorkorm, Russia) and filtered water ad libitum. Mice were examined daily by the veterinarian.
Experimental Design
Mice were randomized by weight and the following groups of animals were formed:
- Control – negative control – intraperitoneal injection of sunflower oil (0.2 ml/mouse) (n=13);
- Control CCl4 – positive control – intraperitoneal injection of CCl4 (1 ml/kg) diluted ten times in sunflower oil 2 times per week (6 injections in total) (n=14);
- CCl4 + Fraction of humic acids from low-mineralized silt sulfide mud (peloids) of lake Molochka (MRC “Sergievskie Mineral Waters” FMBA of Russia) (HA) –intraperitoneal injection of CCl4 (1 ml/kg) diluted ten times in sunflower oil 2 times per week (6 injections in total) + intragastric administration of HA (60 mg/kg) 3 times a week, for 4 weeks (n=12);
- CCl4 + BP-Cx-1 –intraperitoneal injection of CCl4 (1 ml/kg) diluted ten times in sunflower oil 2 times per week (6 injections in total) + intragastric administration of BP-Cx-1 (60 mg/kg) 3 times a week, for 4 weeks (n=11);
- CCl4 + isoflavones isolated from the root of Pueralia lobata (IFL) –intraperitoneal injection of CCl4 (1 ml/kg) diluted ten times in sunflower oil 2 times per week (6 injections in total) + intragastric administration of IFL (60 mg/kg) 3 times a week, for 4 weeks (n=12).
Body weighing was carried out twice a week during experiment and prior euthanasia.
Urine samples were collected using metabolic cages (Tecniplast, Italy) for 18 hours a day before euthanasia. Urine samples were transferred in Eppendorf tubes and kept frozen at-80.
Euthanasia by CO2 was carried out on the 29th day after the first administration of CCL4. All animals were autopsied. Liver was excised and weighted, mass index (percentage ratio of liver mass to body weight) was calculated. Liver samples were transferred in Eppendorf tubes, immediately frozen in liquid nitrogen and kept frozen at-80 for further analysis. The rest was histologically examined after routine histological preparation (dehydration, impregnation with paraffin, cutting into sections, staining with hematoxylin and eosin). Evaluation of liver steatosis was carried out microscopically in 10 fields (x200) per slide by a semi-quantitative method (in points): 0 – no changes, 1 – up to 30% of hepatocytes contain lipid vacuoles in the cytoplasm, 2 – 30–60% of cells are changed, 3 – more than 60% of cells are changed. Mean steatosis index was calculated per animal and onward per group.
3.3. MTT Colorimetric Assay
The MTT colorimetric assay was used to determine cell cytotoxicity and hepatoprotective activity of multicomponent mixtures of polyphenolic compounds on HepG2 hepatocyte cell culture. Cells were cultured in DMEM (PanEco company, Russia) supplemented with 10% fetal bovine serum (Thermo Fisher Scientific, USA), 2 mM L-glutamine (Thermo Fisher Scientific, USA), 100 U/ml penicillin (Sigma, Germany), and 100 μg/ml streptomycin (Sigma, Germany). Incubation was carried out at 37°C in 5% CO2. In order to determine hepatoprotective activity of multicomponent mixtures, HepG2 cells were incubated (5×10³ cells/well; 96-well plates, for 24-h) with 1 mmol CCl4 (LenReactiv, Russia) in 0.15% DMSO for inducing apoptosis [37]. After 24-h incubation cell cultures were washed twice with a PBS buffer. Next, potential hepatoprotectors were added at an initial concentration of each drug per well of 1 mg/ml with a dilution step of ½ and incubated for 24-h. Cell cultures were washed in a PBS buffer and 20 μl of MTT (Sigma, Germany) was added to each well and incubated for another 2 hours. After incubation medium was removed from the plates and 100 μl of DMSO was added to each well to dissolve the formed formazan crystals. Cell viability was identified by measuring the optical density with an ELISA reader (Tecan Infinite M200 PRO, Switzerland) at 630 nm.
3.4. Proteomic Analysis
Urine Samples Preparation
Urine samples were denatured and reduced by incubation with 8 M urea, 0.1 M dithiothreitol and 100 mM Tris × HCl (pH 8.0, +37 °C, 30 min). Next, the proteins were alkylated by a 30-min incubation in the dark with 55 mM iodoacetamide. Protein concentration was measured via
Bradford method. For trypsinolysis, the samples were diluted with 100 mM Tris × HCl (pH 8.0) until <1 M urea; L-(tosylamido-2-phenyl) ethyl chloromethyl ketone (TPCK)-treated trypsin (Worthington) was added at a 25:1 (protein:enzyme, w/w) ratio; and the samples were incubated for 16 h at 37 °C. The reaction was quenched by acidifying the samples with formic acid (FA) to a final concentration of 1.0% (pH ≤ 2). The resulting peptides were purified by solid-phase extraction on C18 cartridges (Oasis, Waters, USA), then lyophilized and dissolved for analysis in 0.1% formic acid.
Liver Samples Preparation
Liver tissue (10-20 mg) was ground into a fine powder in liquid nitrogen. Cell lysis was conducted by adding 50 mM Tris-HCl pH 8.0.150 m M NaCl, 0.1% SDS, 0.5% Na deoxycholate, 1% NP-40 lysis buffer containing a cocktail of protease inhibitors (Roche). Tissues were incubated for 30 minutes and sonicated in an ultrasonic bath twice for 3 minutes. Samples were centrifuged at 40C at 10000 g for 10 min, the supernatant was collected, and the sediment was re-extracted with denaturing buffer (8 M urea, 2 M thiourea, 50 mM Tris-HCl pH8.0, 0.5% NP-40). The supernatant was collected and pooled after the centrifugation at 40C at 10000g for 10 minutes. Protein concentration was measured by the Bradford method. 100 μg of protein was taken and precipitated with ice-cold acetone. Samples were denatured and reduced by incubation with 8 M urea, 0.1 M dithiothreitol and 100 mM Tris × HCl (pH 8.0, +37 °C, 30 min). Next, the proteins were alkylated by a 30-min incubation in the dark with 20 mM iodoacetamide. For trypsinolysis, the samples were diluted with 100 mM Tris × HCl (pH 8.0) until <1 M urea; L-(tosylamido-2-phenyl) ethyl chloromethyl ketone (TPCK)-treated trypsin (Worthington) was added at a 25:1 (protein:enzyme, w/w) ratio; and the samples were incubated for 16 h at 37 °C. The reaction was quenched by acidifying the samples with formic acid (FA) to a final concentration of 1.0% (pH ≤ 2). The resulting peptides were purified by solid-phase extraction on C18 cartridges (Oasis, Waters, USA), then lyophilized and dissolved for analysis in 0.1% formic acid.
LC-MS/MS Analysis
Urine tryptic peptide fractions were analyzed on a nano-HPLC (high-performance liquid chromatography) Dionex Ultimate 3000 system (Thermo Fisher Scientific, USA) coupled to a timsTOF Pro (Bruker Daltonics, USA) mass spectrometer. HPLC separation was carried out using a packed emitter column (C18, 25 cm × 75 μm 1.6 μm) (Ion Optics, Parkville, Australia), with gradient elution. Mobile phase A was 0.1% formic acid in water; mobile phase B was 0.1% formic acid in acetonitrile. LC separations were performed at a flow of 400 nL/min using a 40 min linear gradient from 2% to 37% solvent B, followed by an LC column wash step (12 min isocratic with 90% solvent B) and equilibration (15 min, isocratic, with 2% solvent B). The MS data were acquired using the ddaPASEF method. Electrospray source (ESI) settings were as follows: capillary voltage 1500 V, dry gas flow - 3.0 L/min at a temperature of 180⁰C. The MS and MS/MS spectra were acquired from 100 to 1700 m, an ion mobility range of 0.6–1.6 1/K0 (V s/cm2). The ion mobility was scanned from 0.6 to 1.6 Vs/cm2. The ramp time was set to 100 ms. The collision energy was ramped linearly as a function of the mobility from 59 eV at 1/K0 = 1.6 Vs/cm2 to 20 eV at 1/K0 = 0.6 Vs/cm2.
Tissue tryptic peptide LC separations were performed at a flow of 400 nL/min using a 90 min linear gradient from 2% to 37% solvent B, followed by an LC column wash step (10 min isocratic with 90% solvent B) and equilibration (15 min, isocratic, with 2% solvent B). The MS data were acquired using the diaPASEF method. Electrospray source (ESI) settings were as follows: capillary voltage 1400 V, dry gas flow - 3.0 L/min at a temperature of 180⁰C. The MS and MS/MS spectra were acquired from 100 to 1700 m, an ion mobility range of 0.6–1.6 1/K0 (V s/cm2). The ion mobility was scanned from 0.6 to 1.6 Vs/cm2. The ramp time was set to 100 ms. The collision energy was ramped linearly as a function of the mobility from 59 eV at 1/K0 = 1.6 Vs/cm2 to 20 eV at 1/K0 = 0.6 Vs/cm2.
Data Analysis
The obtained LC-MS/MS data were analyzed using PEAKS Studio 11 software (BSI, North Waterloo, ON, Canada), using the following parameters: parent ion mass measurement error – 20 ppm; fragment mass error - 0.05 Da. An unspecific restriction search for peptides 6 – 45 amino acids long was conducted across UniprotKB Mus Musculus database with carbamidomethylation (C), oxidation (M) as possible modifications. FDR thresholds were set to 0.1% at the PSM level and 1% at the protein group level, with the requirement of at least one unique and one significant peptide identification. Peaks library (.tsv) for diaPASEF date search was generated by ddaPASEF acquisition of mouse liver pooled samples.
The statistical analysis and data visualization were performed by Python (3.7.3) with the following packages: SciPy [38], Seaborn [39], Matplotlib [40] and Pandas [41]. Significant differences in protein concentrations in the mouse groups were estimated using the Mann–Whitney U-test. We considered concentration values to be statistically significant if the p-value was less than 0.05 and the absolute value of Cohen's d effect size was greater than 0.5. Heat-map hierarchical clustering and principal component analysis (PCA) with t-distributed stochastic neighbor embedding (t-SNE) were used for preliminary estimation of the differences between studied groups and particular samples. For visualizing the clustering of mice in a single group, we used the UMAP dimensionality reduction algorithm [42]. For Lasso regression, the Scikit-Learn [43] package was used, and all data were preprocessed with z-scoring. The default value was chosen for the parameter C, and all possible pairwise comparisons were conducted between all groups. Training was performed on the entire dataset.
3.5. Metabolomic Analysis
Extraction of Metabolites
For metabolites analysis a chloroform-methanol extraction method was used [44]. Samples were mixed with chloroform-methanol (1:2) mixture and incubated for 30 minutes with constant stirring, after that samples were sonicated twice in an ultrasonic bath. Next, water and chloroform were added up to ratio 1/2/0.8 and centrifuged at 3000 rpm. Upper water-methanol phase was evaporated via centrifugal vacuum evaporator and purified using PPL cartridges. Metabolites were eluted with acidic methanol (0.5% FA/MeOH) and evaporated.
FTICR MS Analysis
Mass spectrometric analysis of metabolites was carried out using a FT-ICR MS Apex Ultra device (Bruker Daltonics), with harmonized cell equipped with a 7 T superconducting magnet and electrospray (ESI) ionization source. All mass spectra were acquired in negative ionization mode by direct infusion at flow rate 90 mL/h. The electrospray source (ESI) settings were as follows: capillary voltage - 3500 V, dry gas flow -3 (N2) l/min at a temperature of 200⁰C. Measurements were carried out in the mass/charge (m/z) range from 200 to 1000. Spectra were acquired at 150,000 resolutions (at m/z 400), with 250 scans accumulated for each spectrum.
Data Analysis
Raw FTICR MS data were treated using open-source software and lab-written Python scripts. Visualization of data has been performed with Python library Matplotlib [40]. Statistical analysis has been performed with Python libraries NumPy, Pandas and Seaborn. All *.raw files were converted to *.mzML format using msconvert with continuous wavelet transform algorithm to extract peaks with S/N >3 [45]. Peak lists were extracted using Python script based on pyteomics library [46]. Formulae assignment for all samples was conducted with python script based on open-source NOMspectra python library [47] with a denoising step adapted from Zielinski et al [48]. using the following constraints: O/C ratio ≤ 1, 0.3 < H/C ratio < 2.5; element counts [1 < C ≤ 60, 2< H ≤ 100, 0 < O ≤ 60, N ≤ 3, S ≤ 1]; z = -1 and mass accuracy window <1 ppm after build-in internal calibration based on the construction of the probability density of assignments [49].
On the next step molecular assignments which presented in at least three sample of each group were concatenated in a new group-representative table giving aggregated data. This step aimed to decrease the uncertainty of qualitative comparison raised from the unknown mass balance. Further statistical analysis and evaluation was conducted similar to proteomic data.
Supplementary Materials
Information is available on Preprints.org.
Author Contributions
Conceptualization, Alexander Brzhozovskiy, Alexander Zherebker and Elena Fedoros; Data curation, Alexander Brzhozovskiy, Maria Yurova, Yuri Zhernov, Oxana Kovaleva and Dmitry Abroskin; Formal analysis, Savva Semenov, Alexander Zherebker, Yuri Zhernov and Elena Fedoros; Funding acquisition, Evgeniy Nikolaev; Investigation, Alexander Brzhozovskiy, Anna Bugrova, Maria Yurova, Yuri Zhernov and Dmitry Abroskin; Methodology, Alexander Zherebker, Anna Bugrova, Oxana Kovaleva and Stepan Kruglov; Project administration, Alexander Brzhozovskiy, Alexander Zherebker and Elena Fedoros; Resources, Yuri Zhernov, Elena Fedoros, Alexey Kononikhin and Evgeniy Nikolaev; Software, Savva Semenov; Supervision, Alexander Zherebker and Elena Fedoros; Validation, Savva Semenov; Writing – original draft, Alexander Brzhozovskiy, Anna Bugrova, Maria Yurova, Yuri Zhernov and Alexey Kononikhin; Writing – review & editing, Alexander Brzhozovskiy, Alexander Zherebker, Maria Yurova, Alexey Kononikhin and Evgeniy Nikolaev.
Funding
The work was carried out within the framework of the Russian Science Foundation grant No. 22-75-10140 dated (07/28/2022).
Institutional Review Board Statement
Approval from the ethics committee of the Federal State Institution “National Medical Research Center of Oncology named after N.N. Petrov” of the Ministry of Health of Russian Federation (protocol № 7 from 20.04.2023) was obtained prior to all animal-related studies. All in vivo experiments were carried out in accordance with international regulations (Directive 2010/63/EU of the European Parliament and of the Council of 22 September 2010 on the protection of animals used for scientific purposes).
Data Availability Statement
Data are contained within the Supplementary Materials.
Conflicts of Interest
The authors declare no conflicts of interest.
References
- Slamenová, D.; Kosíková, B.; Lábaj, J.; Ruzeková, L. Oxidative/Antioxidative Effects of Different Lignin Preparations on DNA in Hamster V79 Cells. Neoplasma 2000, 47, 349–353. [Google Scholar]
- Yoshikawa, T.; Yagi, T.; Shinohara, S.; Fukunaga, T.; Nakasaka, Y.; Tago, T.; Masuda, T. Production of Phenols from Lignin via Depolymerization and Catalytic Cracking. Fuel Process. Technol. 2013, 108, 69–75. [Google Scholar] [CrossRef]
- Fedoros, E.I.; Orlov, A.A.; Zherebker, A.; Gubareva, E.A.; Maydin, M.A.; Konstantinov, A.I.; Krasnov, K.A.; Karapetian, R.N.; Izotova, E.I.; Pigarev, S.E.; et al. Novel Water-Soluble Lignin Derivative BP-Cx-1: Identification of Components and Screening of Potential Targets in Silico and in Vitro. Oncotarget 2018, 9, 18578–18593. [Google Scholar] [CrossRef] [PubMed]
- Coccia, A.; Mosca, L.; Puca, R.; Mangino, G.; Rossi, A.; Lendaro, E. Extra-Virgin Olive Oil Phenols Block Cell Cycle Progression and Modulate Chemotherapeutic Toxicity in Bladder Cancer Cells. Oncol. Rep. 2016, 36, 3095–3104. [Google Scholar] [CrossRef] [PubMed]
- Impellizzeri, J.; Lin, J. A Simple High-Performance Liquid Chromatography Method for the Determination of Throat-Burning Oleocanthal with Probated Antiinflammatory Activity in Extra Virgin Olive Oils. J. Agric. Food Chem. 2006, 54, 3204–3208. [Google Scholar] [CrossRef] [PubMed]
- Espinoza-Acosta, J.L.; Torres-Chávez, P.I.; Ramírez-Wong, B.; López-Saiz, C.M.; Montaño-Leyva, B. Antioxidant, Antimicrobial, and Antimutagenic Properties of Technical Lignins and Their Applications. BioResources 2016, 11, 5452–5481. [Google Scholar] [CrossRef]
- Lábaj, J.; Slamenová, D.; Kosikova, B. Reduction of Genotoxic Effects of the Carcinogen N-Methyl-N’-Nitro-N-Nitrosoguanidine by Dietary Lignin in Mammalian Cells Cultured in Vitro. Nutr. Cancer 2003, 47, 95–103. [Google Scholar] [CrossRef]
- Barapatre, A.; Meena, A.S.; Mekala, S.; Das, A.; Jha, H. In Vitro Evaluation of Antioxidant and Cytotoxic Activities of Lignin Fractions Extracted from Acacia Nilotica. Int. J. Biol. Macromol. 2016, 86, 443–453. [Google Scholar] [CrossRef]
- Sato, S.; Mukai, Y.; Tokuoka, Y.; Mikame, K.; Funaoka, M.; Fujita, S. Effect of Lignin-Derived Lignophenols on Hepatic Lipid Metabolism in Rats Fed a High-Fat Diet. Environ. Toxicol. Pharmacol. 2012, 34, 228–234. [Google Scholar] [CrossRef] [PubMed]
- Andrei, G.; Lisco, A.; Vanpouille, C.; Introini, A.; Balestra, E.; van den Oord, J.; Cihlar, T.; Perno, C.-F.; Snoeck, R.; Margolis, L.; et al. Topical Tenofovir, a Microbicide Effective against HIV, Inhibits Herpes Simplex Virus-2 Replication. Cell Host Microbe 2011, 10, 379–389. [Google Scholar] [CrossRef] [PubMed]
- Saluja, B.; Thakkar, J.N.; Li, H.; Desai, U.R.; Sakagami, M. Novel Low Molecular Weight Lignins as Potential Anti-Emphysema Agents: In Vitro Triple Inhibitory Activity against Elastase, Oxidation and Inflammation. Pulm. Pharmacol. Ther. 2013, 26, 296–304. [Google Scholar] [CrossRef]
- Vinardell, M.P.; Mitjans, M. Lignins and Their Derivatives with Beneficial Effects on Human Health. Int. J. Mol. Sci. 2017, 18. [Google Scholar] [CrossRef] [PubMed]
- Zherebker, A.Y.; Rukhovich, G.D.; Kharybin, O.N.; Fedoros, E.I.; Perminova, I. V; Nikolaev, E.N. Fourier Transform Ion Cyclotron Resonance Mass Spectrometry for the Analysis of Molecular Composition and Batch-to-Batch Consistency of Plant-Derived Polyphenolic Ligands Developed for Biomedical Application. Rapid Commun. Mass Spectrom. 2020, 34, e8850. [Google Scholar] [CrossRef] [PubMed]
- Björklund, L.; Larsson, S.; Jönsson, L.J.; Reimann, E.; Nilvebrant, N.-O. Treatment with Lignin Residue: A Novel Method for Detoxification of Lignocellulose Hydrolysates. Appl. Biochem. Biotechnol. 2002, 98–100, 563–575. [Google Scholar] [CrossRef]
- Vengerovskiĭ, A.I.; Golovina, E.L.; Burkova, V.N.; Saratikov, A.S. Enteric sorbents potentiate hepatoprotective effect of eplir in experimental toxic hepatitis. Eksp. Klin. Farmakol. 2001, 64, 46–48. [Google Scholar]
- Nebbioso, A.; Piccolo, A. Basis of a Humeomics Science: Chemical Fractionation and Molecular Characterization of Humic Biosuprastructures. Biomacromolecules 2011, 12, 1187–1199. [Google Scholar] [CrossRef] [PubMed]
- Zhernov, Y. V; Konstantinov, A.I.; Zherebker, A.; Nikolaev, E.; Orlov, A.; Savinykh, M.I.; Kornilaeva, G. V; Karamov, E. V; Perminova, I. V Antiviral Activity of Natural Humic Substances and Shilajit Materials against HIV-1: Relation to Structure. Environ. Res. 2021, 193, 110312. [Google Scholar] [CrossRef] [PubMed]
- Shen, N.; Wang, T.; Gan, Q.; Liu, S.; Wang, L.; Jin, B. Plant Flavonoids: Classification, Distribution, Biosynthesis, and Antioxidant Activity. Food Chem. 2022, 383, 132531. [Google Scholar] [CrossRef] [PubMed]
- Dueñas, M.E.; Peltier-Heap, R.E.; Leveridge, M.; Annan, R.S.; Büttner, F.H.; Trost, M. Advances in High-Throughput Mass Spectrometry in Drug Discovery. EMBO Mol. Med. 2023, 15, e14850. [Google Scholar] [CrossRef] [PubMed]
- Orlov, A.; Semenov, S.; Rukhovich, G.; Sarycheva, A.; Kovaleva, O.; Semenov, A.; Ermakova, E.; Gubareva, E.; Bugrova, A.E.; Kononikhin, A.; et al. Hepatoprotective Activity of Lignin-Derived Polyphenols Dereplicated Using High-Resolution Mass Spectrometry, In Vivo Experiments, and Deep Learning. Int. J. Mol. Sci. 2022, 23. [Google Scholar] [CrossRef] [PubMed]
- Joseph, M.; Cross, T.J.S. Amyloidosis and Subacute Liver Failure. Gastroenterol. Hepatol. (N. Y). 2012, 8, 208–211. [Google Scholar]
- O’Grady, J.G. Acute Liver Failure. Postgrad. Med. J. 2005, 81, 148–154. [Google Scholar] [CrossRef]
- Tandon, B.N.; Joshi, Y.K.; Krishnamurthy, L.; Tandon, H.D. Subacute Hepatic Failure; Is It a Distinct Entity? J. Clin. Gastroenterol. 1982, 4, 343-346,362-364. [Google Scholar] [CrossRef] [PubMed]
- Shrestha, S.M.; Shrestha, S. Subacute Hepatic Failure : Its Possible Pathogenesis. 2012, 2, 41–46.
- Scholten, D.; Trebicka, J.; Liedtke, C.; Weiskirchen, R. The Carbon Tetrachloride Model in Mice. Lab. Anim. 2015, 49, 4–11. [Google Scholar] [CrossRef]
- Mering, C. von; Huynen, M.; Jaeggi, D.; Schmidt, S.; Bork, P.; Snel, B. STRING: A Database of Predicted Functional Associations between Proteins. Nucleic Acids Res. 2003, 31, 258–261. [Google Scholar] [CrossRef]
- Ashkar, S.; Weber, G.F.; Panoutsakopoulou, V.; Sanchirico, M.E.; Jansson, M.; Zawaideh, S.; Rittling, S.R.; Denhardt, D.T.; Glimcher, M.J.; Cantor, H. Eta-1 (Osteopontin): An Early Component of Type-1 (Cell-Mediated) Immunity. Science 2000, 287, 860–864. [Google Scholar] [CrossRef] [PubMed]
- Zacchigna, S.; Oh, H.; Wilsch-Bräuninger, M.; Missol-Kolka, E.; Jászai, J.; Jansen, S.; Tanimoto, N.; Tonagel, F.; Seeliger, M.; Huttner, W.B.; et al. Loss of the Cholesterol-Binding Protein Prominin-1/CD133 Causes Disk Dysmorphogenesis and Photoreceptor Degeneration. J. Neurosci. Off. J. Soc. Neurosci. 2009, 29, 2297–2308. [Google Scholar] [CrossRef]
- Li, C.; Wang, N.; Schäffer, A.A.; Liu, X.; Zhao, Z.; Elliott, G.; Garrett, L.; Choi, N.T.; Wang, Y.; Wang, Y.; et al. Mutations in COMP Cause Familial Carpal Tunnel Syndrome. Nat. Commun. 2020, 11, 3642. [Google Scholar] [CrossRef] [PubMed]
- DeAngelis, A.M.; Heinrich, G.; Dai, T.; Bowman, T.A.; Patel, P.R.; Lee, S.J.; Hong, E.-G.; Jung, D.Y.; Assmann, A.; Kulkarni, R.N.; et al. Carcinoembryonic Antigen-Related Cell Adhesion Molecule 1: A Link between Insulin and Lipid Metabolism. Diabetes 2008, 57, 2296–2303. [Google Scholar] [CrossRef]
- Hosomi, S.; Chen, Z.; Baker, K.; Chen, L.; Huang, Y.-H.; Olszak, T.; Zeissig, S.; Wang, J.H.; Mandelboim, O.; Beauchemin, N.; et al. CEACAM1 on Activated NK Cells Inhibits NKG2D-Mediated Cytolytic Function and Signaling. Eur. J. Immunol. 2013, 43, 2473–2483. [Google Scholar] [CrossRef]
- Lu, R.; Pan, H.; Shively, J.E. CEACAM1 Negatively Regulates IL-1β Production in LPS Activated Neutrophils by Recruiting SHP-1 to a SYK-TLR4-CEACAM1 Complex. PLoS Pathog. 2012, 8, e1002597. [Google Scholar] [CrossRef] [PubMed]
- Friedrichs, B.; Tepel, C.; Reinheckel, T.; Deussing, J.; von Figura, K.; Herzog, V.; Peters, C.; Saftig, P.; Brix, K. Thyroid Functions of Mouse Cathepsins B, K, and L. J. Clin. Invest. 2003, 111, 1733–1745. [Google Scholar] [CrossRef] [PubMed]
- Sugimoto, M.A.; Ribeiro, A.L.C.; Costa, B.R.C.; Vago, J.P.; Lima, K.M.; Carneiro, F.S.; Ortiz, M.M.O.; Lima, G.L.N.; Carmo, A.A.F.; Rocha, R.M.; et al. Plasmin and Plasminogen Induce Macrophage Reprogramming and Regulate Key Steps of Inflammation Resolution via Annexin A1. Blood 2017, 129, 2896–2907. [Google Scholar] [CrossRef]
- Croessmann, S.; Wong, H.Y.; Zabransky, D.J.; Chu, D.; Mendonca, J.; Sharma, A.; Mohseni, M.; Rosen, D.M.; Scharpf, R.B.; Cidado, J.; et al. NDRG1 Links P53 with Proliferation-Mediated Centrosome Homeostasis and Genome Stability. Proc. Natl. Acad. Sci. U. S. A. 2015, 112, 11583–11588. [Google Scholar] [CrossRef] [PubMed]
- Yu, L.; Xu, L.; Chu, H.; Peng, J.; Sacharidou, A.; Hsieh, H.-H.; Weinstock, A.; Khan, S.; Ma, L.; Durán, J.G.B.; et al. Macrophage-to-Endothelial Cell Crosstalk by the Cholesterol Metabolite 27HC Promotes Atherosclerosis in Male Mice. Nat. Commun. 2023, 14, 4101. [Google Scholar] [CrossRef]
- Li, F.; Yang, Y.; Yang, L.; Wang, K.; Zhang, X.; Zong, Y.; Ding, Y.; Wang, C.; Zhang, L.; Ji, G. Resveratrol Alleviates FFA and CCl4 Induced Apoptosis in HepG2 Cells via Restoring Endoplasmic Reticulum Stress. Oncotarget 2017, 8, 43799–43809. [Google Scholar] [CrossRef] [PubMed]
- Virtanen, P.; Gommers, R.; Oliphant, T.E.; Haberland, M.; Reddy, T.; Cournapeau, D.; Burovski, E.; Peterson, P.; Weckesser, W.; Bright, J.; et al. SciPy 1.0: Fundamental Algorithms for Scientific Computing in Python. Nat. Methods 2020, 17, 261–272. [Google Scholar] [CrossRef] [PubMed]
- Waskom, M. Seaborn: Statistical Data Visualization. J. Open Source Softw. 2021, 6, 3021. [Google Scholar] [CrossRef]
- Hunter, J.D. Matplotlib: A 2D Graphics Environment. Comput. Sci. Eng. 2007, 9, 90–95. [Google Scholar] [CrossRef]
- McKinney, W. Data Structures for Statistical Computing in Python. Proc. 9th Python Sci. Conf. 2010, 1, 56–61. [Google Scholar] [CrossRef]
- McInnes, L.; Healy, J.; Melville, J. UMAP: Uniform Manifold Approximation and Projection for Dimension Reduction. 2018.
- Pedregosa, F.; Varoquaux, G.; Gramfort, A.; Michel, V.; Thirion, B. Scikit-Learn: Machine Learning in Python. J. ofMachine Learn. Res. 2011, 12, 2825–2830. [Google Scholar] [CrossRef]
- Daugherty, C.E.; Lento, H.G. Chloroform-Methanol Extraction Method for Determination of Fat in Foods: Collaborative Study. J. Assoc. Off. Anal. Chem. 1983, 66, 927–932. [Google Scholar] [CrossRef] [PubMed]
- Kessner, D.; Chambers, M.; Burke, R.; Agus, D.; Mallick, P. ProteoWizard: Open Source Software for Rapid Proteomics Tools Development. Bioinformatics 2008, 24, 2534–2536. [Google Scholar] [CrossRef] [PubMed]
- Goloborodko, A.A.; Levitsky, L.I.; Ivanov, M. V; Gorshkov, M. V Pyteomics--a Python Framework for Exploratory Data Analysis and Rapid Software Prototyping in Proteomics. J. Am. Soc. Mass Spectrom. 2013, 24, 301–304. [Google Scholar] [CrossRef] [PubMed]
- Volikov, A.; Rukhovich, G.; Perminova, I. V NOMspectra: An Open-Source Python Package for Processing High Resolution Mass Spectrometry Data on Natural Organic Matter. J. Am. Soc. Mass Spectrom. 2023, 34, 1524–1527. [Google Scholar] [CrossRef]
- Zielinski, A.T.; Kourtchev, I.; Bortolini, C.; Fuller, S.J.; Giorio, C.; Popoola, O.A.M.; Bogialli, S.; Tapparo, A.; Jones, R.L.; Kalberer, M. A New Processing Scheme for Ultra-High Resolution Direct Infusion Mass Spectrometry Data. Atmos. Environ. 2018, 178, 129–139. [Google Scholar] [CrossRef]
- Kozhinov, A.N.; Zhurov, K.O.; Tsybin, Y.O. Iterative Method for Mass Spectra Recalibration via Empirical Estimation of the Mass Calibration Function for Fourier Transform Mass Spectrometry-Based Petroleomics. Anal. Chem. 2013, 85, 6437–6445. [Google Scholar] [CrossRef]
Figure 1.
The study pipeline used in this work. (А) The MTT colorimetric assay was used to determine cell cytotoxicity and hepatoprotective activity of multicomponent mixtures of polyphenolic compounds on HepG2 hepatocyte cell culture. (B) In 62 female BALB/C mice subacute liver failure was modeled by CCl4 i.p. injections (1ml/kg, x6) and various polyphenolic substances were intragastrically administered for 28 days. Liver and urine samples were collected and analyzed using LC-MS method to reveal the alterations in protein and metabolite composition.
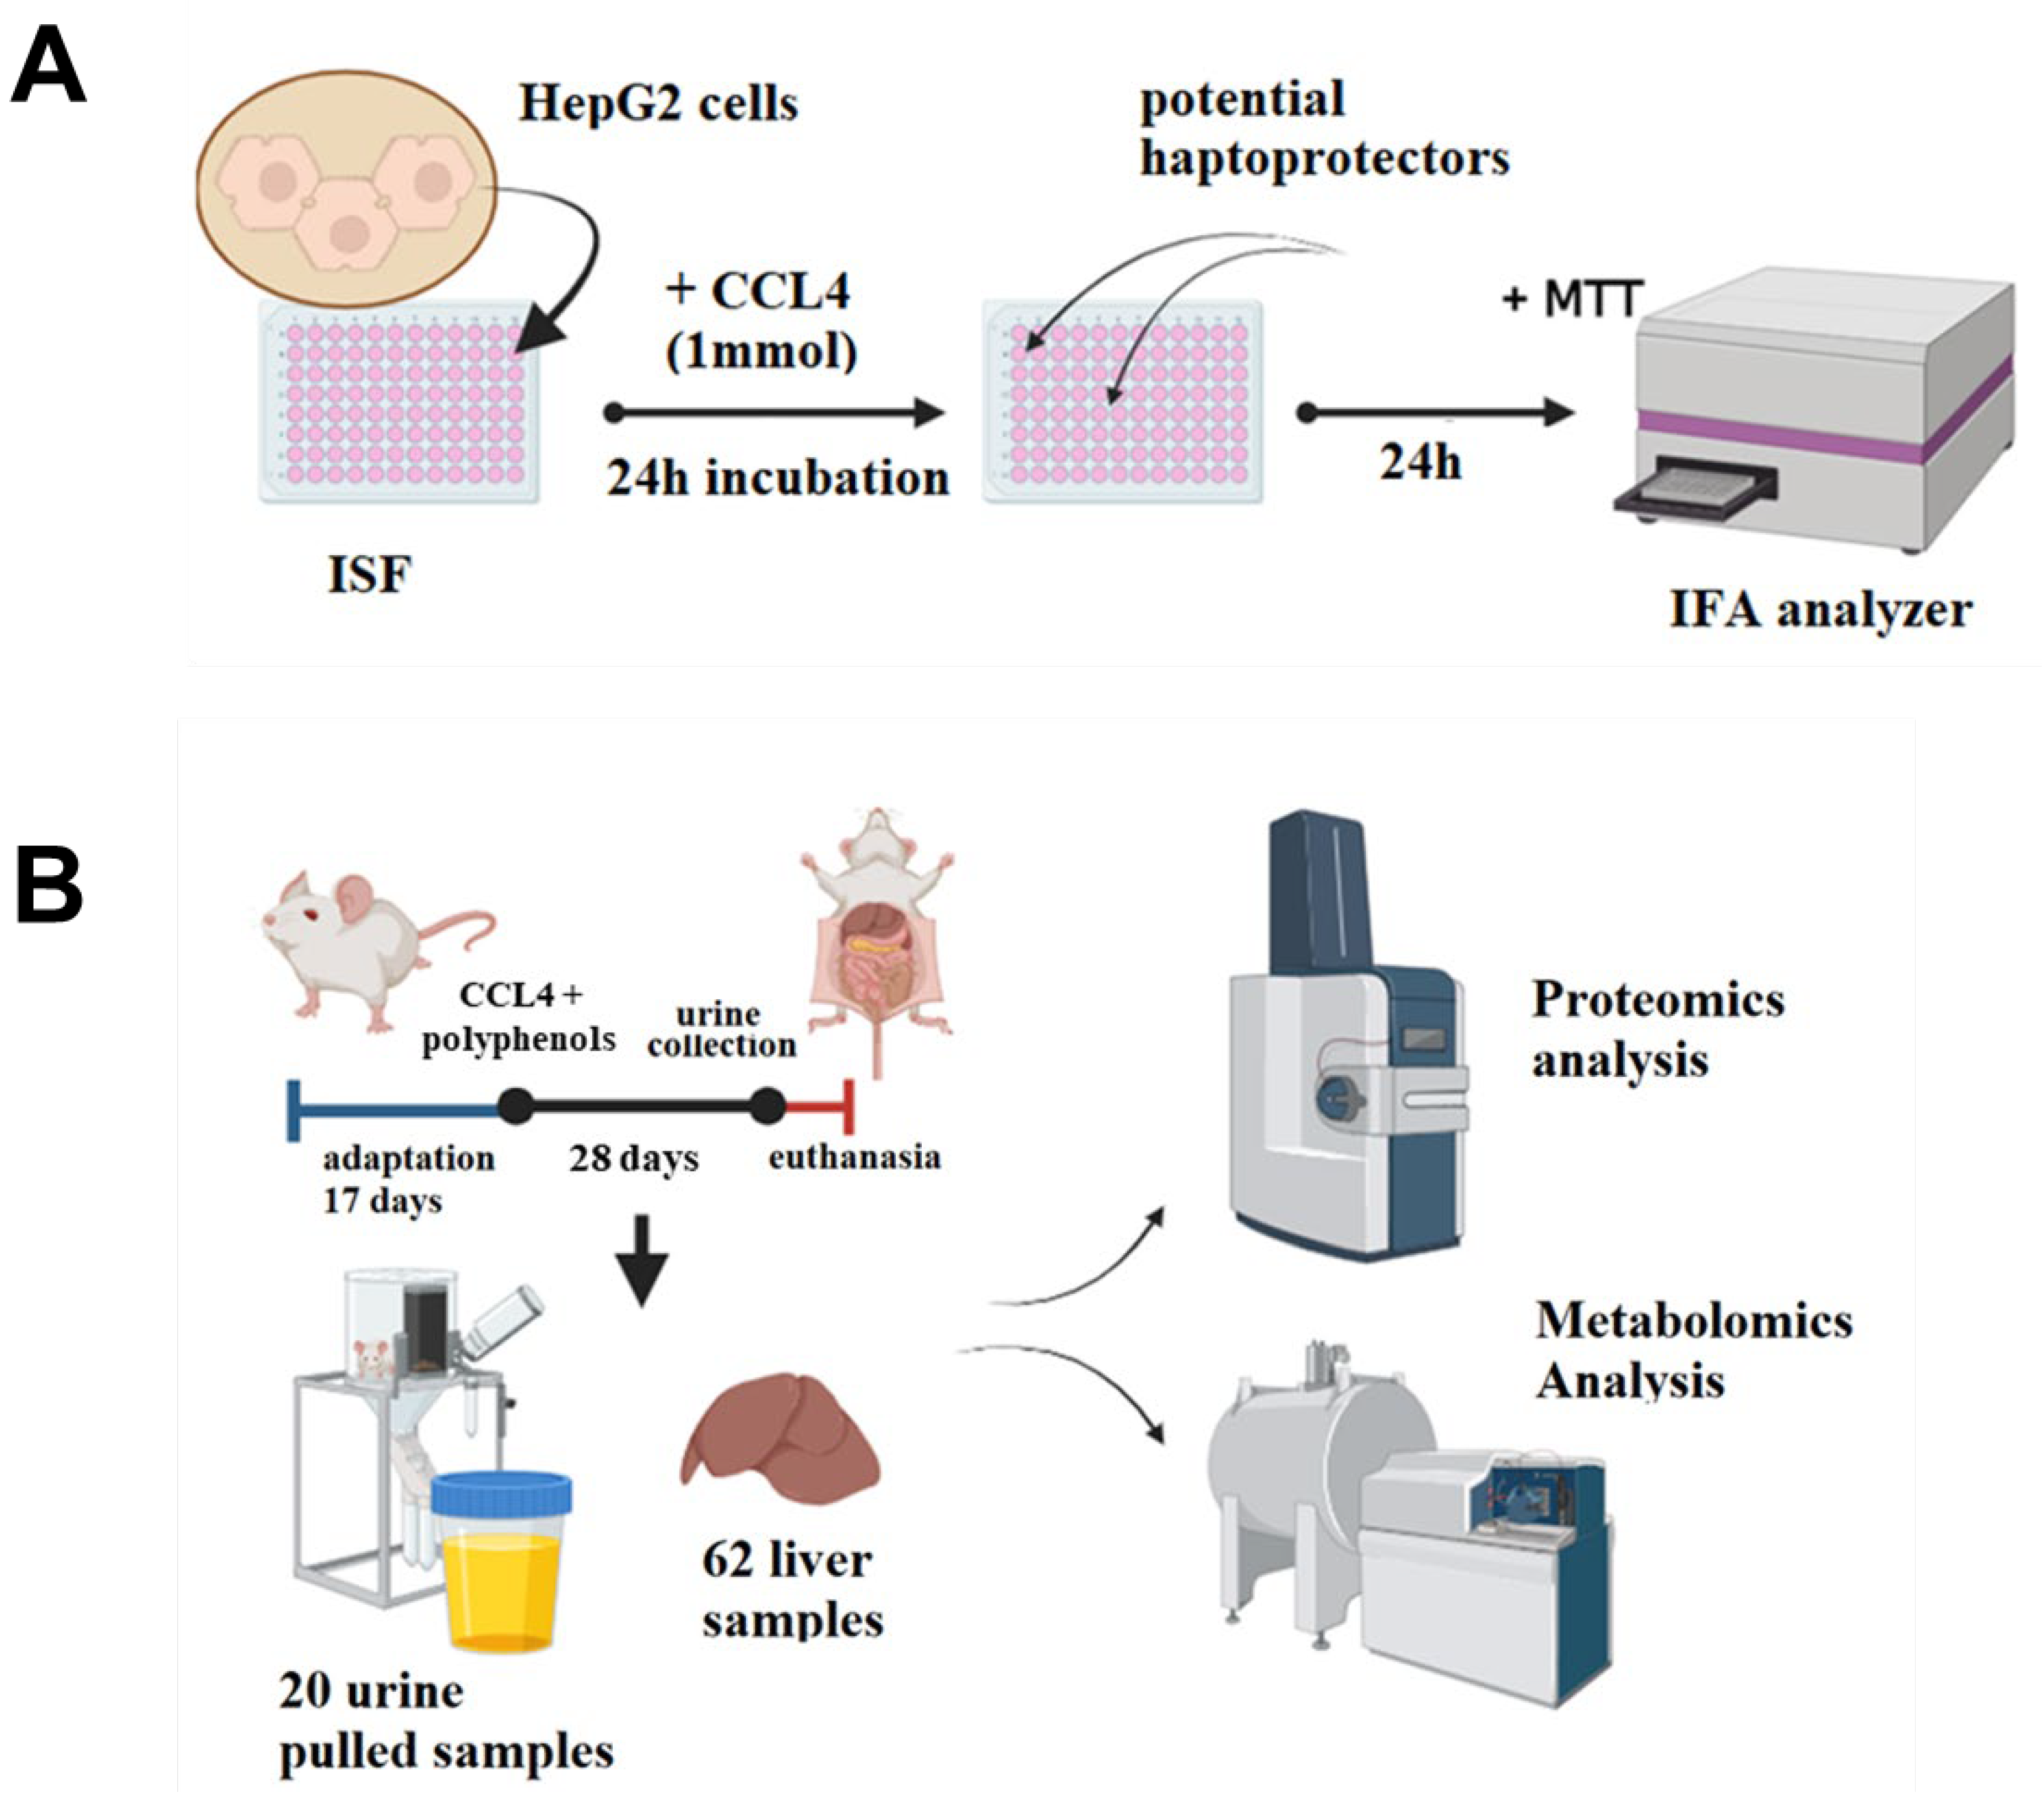
Figure 2.
MTT colorimetric assay results. Cell viability (%) of HepG2 cells was plotted against the concentration (mg/mL) of potential hepatoprotective agents.
Figure 2.
MTT colorimetric assay results. Cell viability (%) of HepG2 cells was plotted against the concentration (mg/mL) of potential hepatoprotective agents.
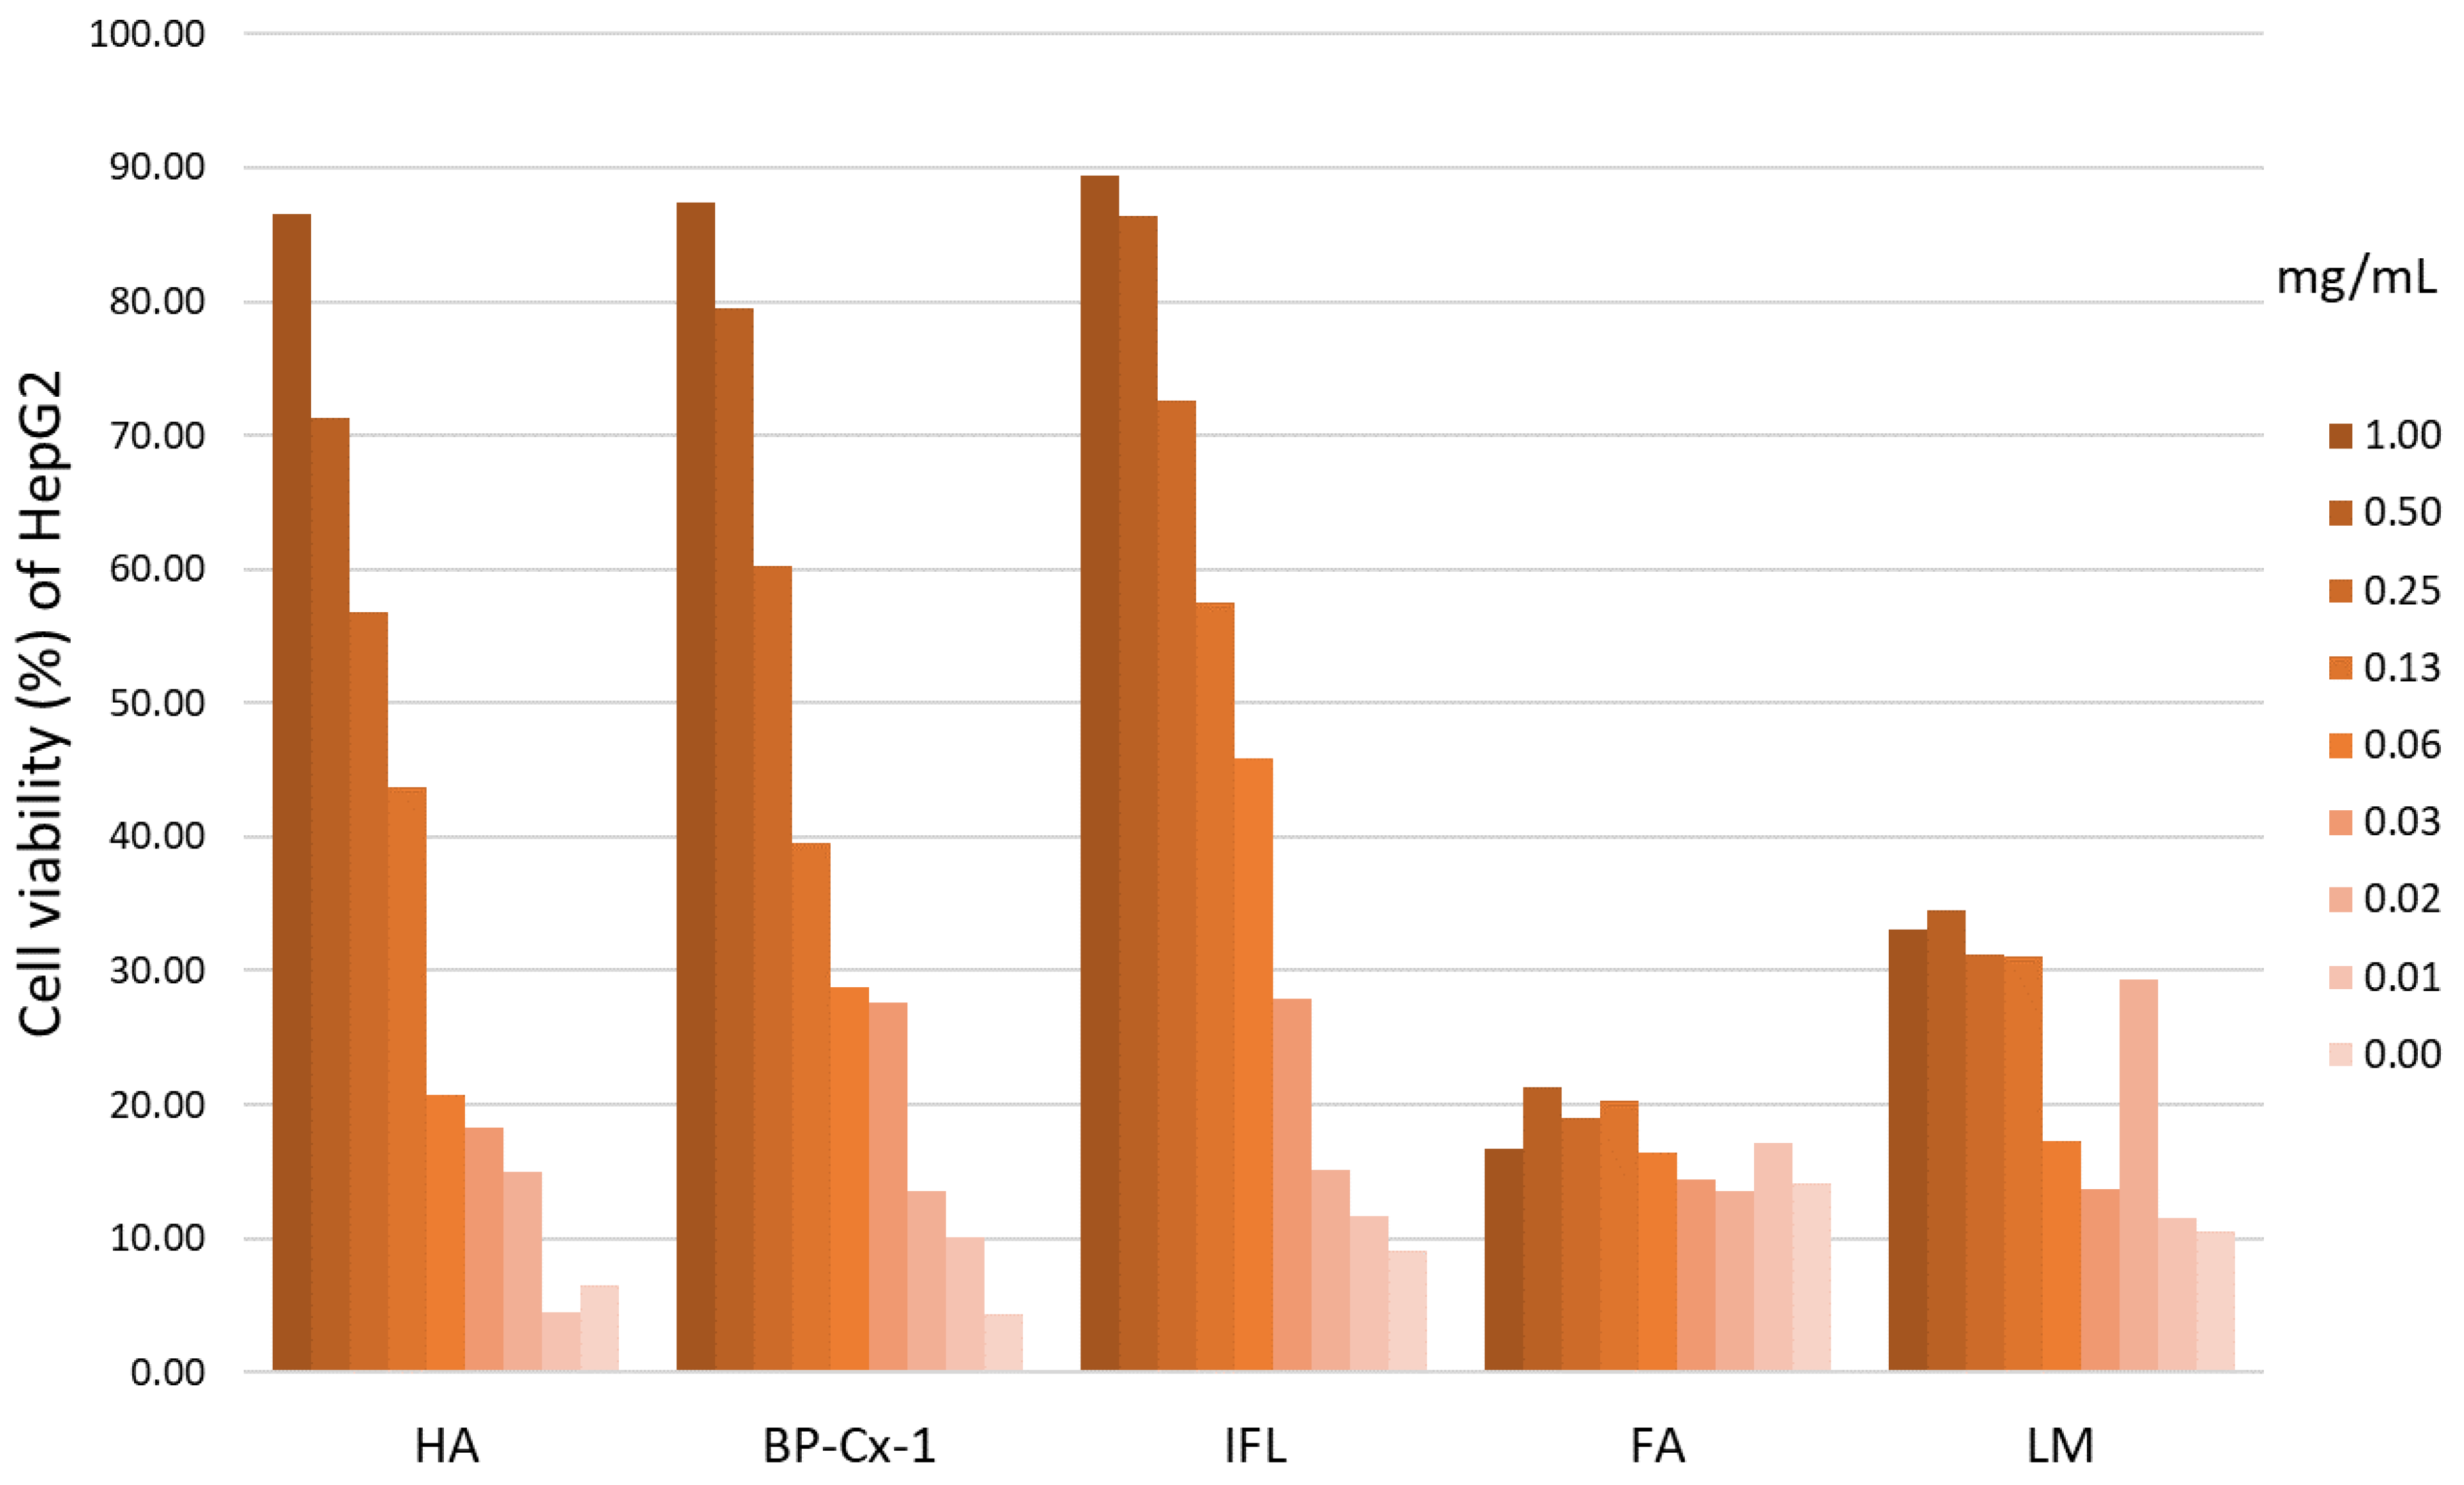
Figure 3.
Data on evaluation of hepatoprotective activity of naturally derived compounds in the model of CCl4 liver toxicity in BALB/C mice. Mass index of the liver (percentage ratio of liver mass to body weight) (A), steatosis index(B), and micro photos of histological slides of the liver x200 (C). Data A, B are M±SE. Differences are statistically significant with the Control group: *** - p<0,001, ** - p<0,01, * - p<0,05; with CCl4 group: ### - p<0,001, # - p<0,05.
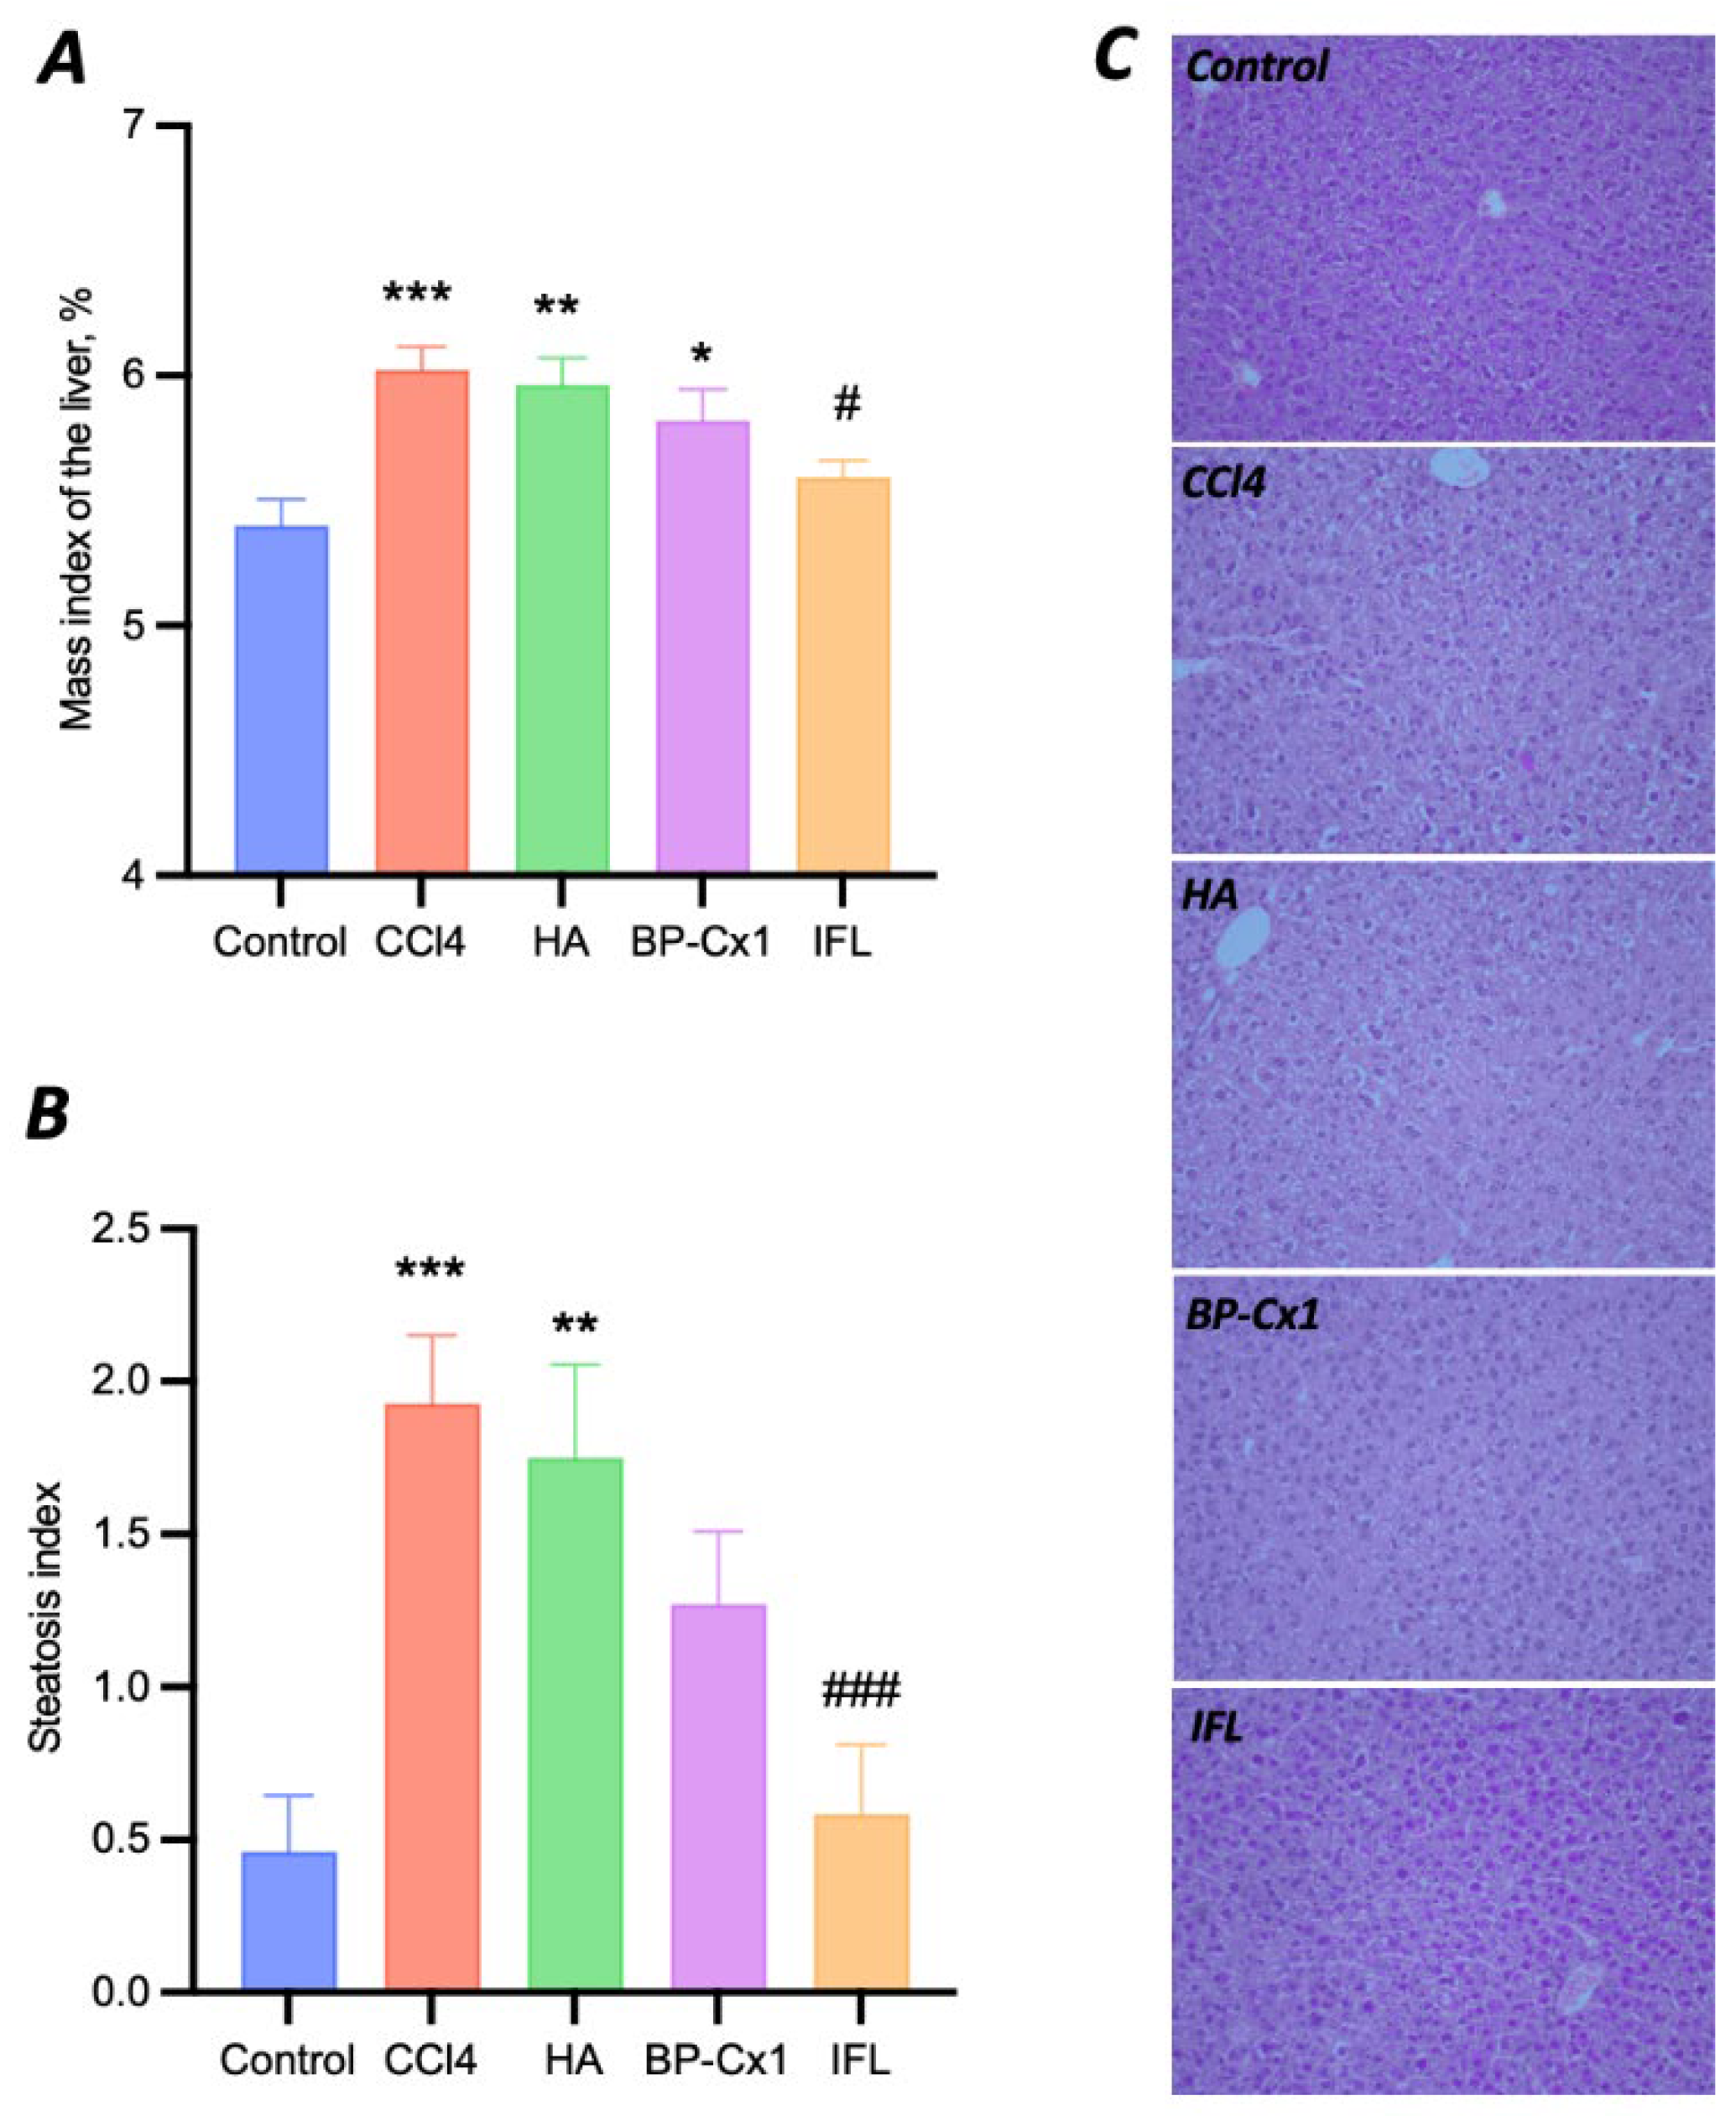
Figure 5.
Boxplots for 5 significantly changed proteins (AOXC, NDRG1, ABCBB, DDX3Y, SEP11) suggested as potential targets for drug intervention.
Figure 5.
Boxplots for 5 significantly changed proteins (AOXC, NDRG1, ABCBB, DDX3Y, SEP11) suggested as potential targets for drug intervention.
Disclaimer/Publisher’s Note: The statements, opinions and data contained in all publications are solely those of the individual author(s) and contributor(s) and not of MDPI and/or the editor(s). MDPI and/or the editor(s) disclaim responsibility for any injury to people or property resulting from any ideas, methods, instructions or products referred to in the content. |
© 2024 by the authors. Licensee MDPI, Basel, Switzerland. This article is an open access article distributed under the terms and conditions of the Creative Commons Attribution (CC BY) license (https://creativecommons.org/licenses/by/4.0/).
Copyright: This open access article is published under a Creative Commons CC BY 4.0 license, which permit the free download, distribution, and reuse, provided that the author and preprint are cited in any reuse.


