
Submitted:
09 December 2024
Posted:
10 December 2024
You are already at the latest version
Abstract
Multi-stage hydraulic fracturing is a key technology adopted in the energy industry to make shale gas and shale oil fields profitable. Post-frac fluid soaking before putting wells into production has been found essential for enhancing well productivity. Finding the optimum time to terminate the fluid-soaking process is an open problem to solve. Post-frac shut-in pressure data from six wells in two shale gas fields were investigated in this study based on Pressure Transient Analysis (PTA) to reveal fluid-soaking performance. It was found that pressure derivative data become scattering after 1 day of well shut in. The overall trend of pressure derivative data after the first day of well shut-in should reflect the effectiveness of fluid-soaking. Two wells exhibited flat (zero-slope) pressure derivatives within one week of fluid-soaking, indicating adequate time of fluid-soaking. Four wells exhibited increasing pressure derivatives within one week of fluid-soaking, indicating inadequate time of fluid-soaking. This observation is consistent with reported well’s Estimated Ultimate Recovery (EUR). This study presents a new approach to assessment of post-frac fluid-soaking performance with real-time shut-in pressure data.
Keywords:
shale gas/oil
; post-fracturing
; fluid soaking
; well productivity
; test analysis
1. Introduction
It is generally recognized that post-fracturing fluid soaking can improve productivity of multi-fractured shale gas and oil wells. The mechanism of fluid-soaking for improving well productivity is believed to be the imbibition of hydraulic fracturing fluid into the shale, causing micro-cracks of the shale that increases formation permeability (Shaibu, 2021). While some shale gas/oil wells undergone month-long shut-in times to allow adequate water soaking achieved productivity improvement significantly, some other wells were killed by the long-time soaking process (Ghanbari and Dehghanpour, 2016). Among many investigators, Makhanov et al. (2013), Gupta et al. (2017), and Zolfaghari et al. (2017) investigated the spontaneous water imbibition in shale formations in laboratory scale. Their work concluded that water imbibition occurred due to the preferential adsorption of water molecules by clay particles. Factors affecting the rate of water imbibition include type and concentration of salts and surfactants in the water and fluid viscosity. The numerical simulation work done by Fakcharoenphol et al.’s (2013) suggested that the spontaneous imbibition during fluid soaking can improve early gas production but have negligible effects on long-term productivity. As the fluid imbibition progresses, the clayey minerals inside the shale and at the surfaces of cracks begin to swell and partially plug the shale pore and the induced cracks. The fluid imbibition in one hand can promote formation of cracks in shale, it can also reduce permeabilities of shale matrix and the conductivity of cracks due to clay-swelling in the other hand. This effect should reduce the effectiveness of longtime fluid soaking for well productivity improvement. Although tons of literature have demonstrated the negative effect of clay-swelling on fluid transfer in porous media, it is extremely difficult, if not impossible, to quantitatively describe the time-dependent flow resistance to fluid flow in real cracks. An in-depth review of the latest research on capillary behavior in shale gas/oil reservoirs was given by Cai et al. (2023), which highlights the challenges in modeling spontaneous imbibition processes due to the intricate imbibition mechanisms.
Because there is lack of analytical means of predicting the optimum fluid-soaking time for achieving the maximal well productivity, it is worthy to find other ways to evaluate the effectiveness of fluid-soaking and identify the optimal fluid-soaking time. Recently, pressure fall-off data during post-frac fluid soaking are available for some multi-fractured shale gas wells. Pressure transient analysis (PTA) method was proposed in this study to fill the gap. Pressure fall-off data collected from six shale gas wells in the southwestern region of China were analyzed. Result of data analysis allowed to gain some insight into the effectiveness of fluid soaking.
2. Method Description
Pressure-transient analysis is employed in this investigation for assessment of fluid-soaking processes. Traditionally the PTA examines pressure data collected from well tests to reveal unknown reservoir properties such as permeability, near-well formation damage, fracture properties, reservoir geometry and boundaries, etc. PTA reveals these property values based on flow regime identification and data interpretations. Log-log diagnostic plot approach is normally used for identification of flow regimes. This approach plots pressure differential and its derivative in log-log scale. Depending on test type (flow test, pressure buildup test, and fall-off test), the pressure differential is defined differently. For flow tests, the differential is defined as the initial reservoir pressure minus the time-dependent flowing bottom hole pressure. For pressure buildup tests, the pressure differential is defined as the time-dependent shut-in bottom hole pressure minus the last flowing bottom hole pressure recorded right before well shutting-in. For pressure fall-off tests, the pressure differential is defined as the initial shut-in pressure minus the time-dependent shut-in pressure, or pressure drop. The post-frac fluid soaking periods are considered as pressure fall-off tests. The pressure drop used in this study is defined as
where p0 is the initial well shut-in pressure and (t) is the shut-in pressure at the shut-in time t, both in MPa. The pressure derivative used in this study is defined as
In conventional oil and gas reservoirs, for non-fractured horizontal wells, the cross-plots of pressure differential data and its numerical derivative allows for identification of wellbore storage, vertical radial flow, pseudo-linear flow, and pseudo-radial flow based on early time unit slope, early time zero-slope, half-slope, and late-time zero-slope in the pressure derivative curve. Late-time sharp increases in both pressure differential data and its derivative data indicate pseudo-steady flow in closed systems with no-flow boundaries. Late-time zero-slope in pressure differential data and sharp-dropping slope (approaching negative infinity) in its derivative data indicates steady flow in closed systems with constant pressure boundaries.
In shale gas formations/reservoirs, theoretically the cross-plots of pressure differential data and its derivative data should infer additional fluid transport mechanisms such as gas desorption. Lewis and Hughes’ (2008) work showed a match of analytical models to the real pressure differential data by tuning some model parameters. Due to the ultralow permeability of shale, transient regimes have been observed across the entire life of well (Ozkan et al., 2010). Cheng’s (2011) PTA on a hydraulically fractured horizontal shale gas well considered characteristics of shale formations and the conductivity of hydraulic fractures, cluster spacing, and enhanced permeability of stimulated zones. Lee et al. (2013) generated some type curves for multi-fractured shale gas reservoirs. Their mathematical model considered the effects of dual porosity, Klinkenberg effect, desorption, non-Darcy flow, and skin effect. Their type curves show fluid flow from natural fractures in the near-wellbore region, from the matrix in the near wellbore into the natural fracture, the equilibrium pressure of the matrix and natural fracture in the near-wellbore region, and a flow region comprising of vertical radial flow, semi-radial flow, bilinear flow, linear flow, pseudo-radial flow, and boundary-dominated flow. It is clear from their type curves that long desorption is required for rich adsorbed gas to flow from the matrix surface to the natural fracture before the degree of fracture can be observed. However, the desorption period was not seen from the real data analyses presented by Lewis and Hughes (2008) and Lee et al. (2013). The valley signature for the desorption period was not observed by Zeng et al. (2018) either. Afagwu et al. (2020) pointed out that the non-Darcy, fracture spacing, and skin effects cannot be analyzed with the Lee et al.’s (2013) curve because the pressure-derivative plot shows the same valley signature irrespective of changes in these parameters.
Based on the experimental studies conducted by Zou et al. (2018) and Shaibu (2021), we believe that the net pressure, which is defined as the fracture fluid pressure minus the minimum formation stress, creates the same additional compressive stress inside the shale layers. Due to the different values of Young’s modulus of shale layers, the same additional stress will create different strain values in different layers. As a result, the shale layers will deform for different amounts, creating different displacements at the fracture face. This should create shear failure, or cracks, at the interfaces of shale layers.
It is logical to assume that the layer cracks grow with fluid soaking time. Figure 1 depicts top views of anticipated two adjacent vertical fractures with cracks at early and late soaking time. Figure 2 shows side views of the two adjacent vertical fractures with cracks. It is expected that the cracks at the mid-height are longer than cracks at the fracture tips due the high level of formation at the mid-height. Without knowing the true profile of the crack front, an elliptic profile is assumed in this study. Fluid flowing to the cracked region is assumed to follow a radial pattern.
The well shut-in time for post-frac fluid-soaking usually lasts for only a few days or a few weeks at most. Therefore, the shut-in pressure data gathered from multi-fractured shale gas/oil wells are not adequate for obtaining properties of reservoir/fracture in the regions away from the wellbores. However, because PTA captures the fluid flow condition (transmissibility) at the front of pressure waive propagation, it is possible to make assessment of fluid-soaking performance around the hydraulic fractures. Such a procedure is exercised in case studies that follow.
3. Case Studies
Six shale gas wells completed between 2021 and 2023 with multi-fracturing technology in a shale gas field in a southwestern region of China were studied in this project. These well are from L2 and D2 areas. Wells from the L2 area include L2-7-1, L2-9-1, L2-9-2, L2-9-3, and L2-9-4. Well D2-1-1 is from the D2 area.
3.1. Well L2-7-1
Well L2-7-1 is one of the horizontal wells drilled from platform L2-7. It was completed in the August of 2021. Other horizontal wells drilled from the same platform are Well L2-7-2, Well L2-7-3, Well L2-7-4, and Well L2-7-5. However, the post-frac soaking pressure was measured for well L2-7-1 only. Figure 3 presents pressure drop data and its numerical derivative. The sharp increases in pressure differential and its numerical derivative before 0.2 day should reflect either wellbore storage (after-flow) effect or the fluid flow in fractures in the near-wellbore region as evidenced by the near unit-slope of the derivative data trend. The decline in the pressure derivative between 0.2 day and 2 days may be due to the flow from the matrix in the near wellbore region into the fractures. The numerical derivative data trend reaches a low value of 1.2 MPa at 2 days. After 2 days, the derivative data becomes scattering, not allowing for identification of any flow regimes, but it has a rough trend of going up, implying that the reservoir transmissibility is getting lower away from the wellbore region. This may be an indication of inadequate fluid soaking time. The owner of the well reported well’s Estimated Ultimate Recovery (EUR) of about 5.4x10⁶ m3, which is lower than the EUR of other wells drilled in the same platform (10.4x10⁶ m3 to 12.2x10⁶ m3).
3.2. ell L2-9-1
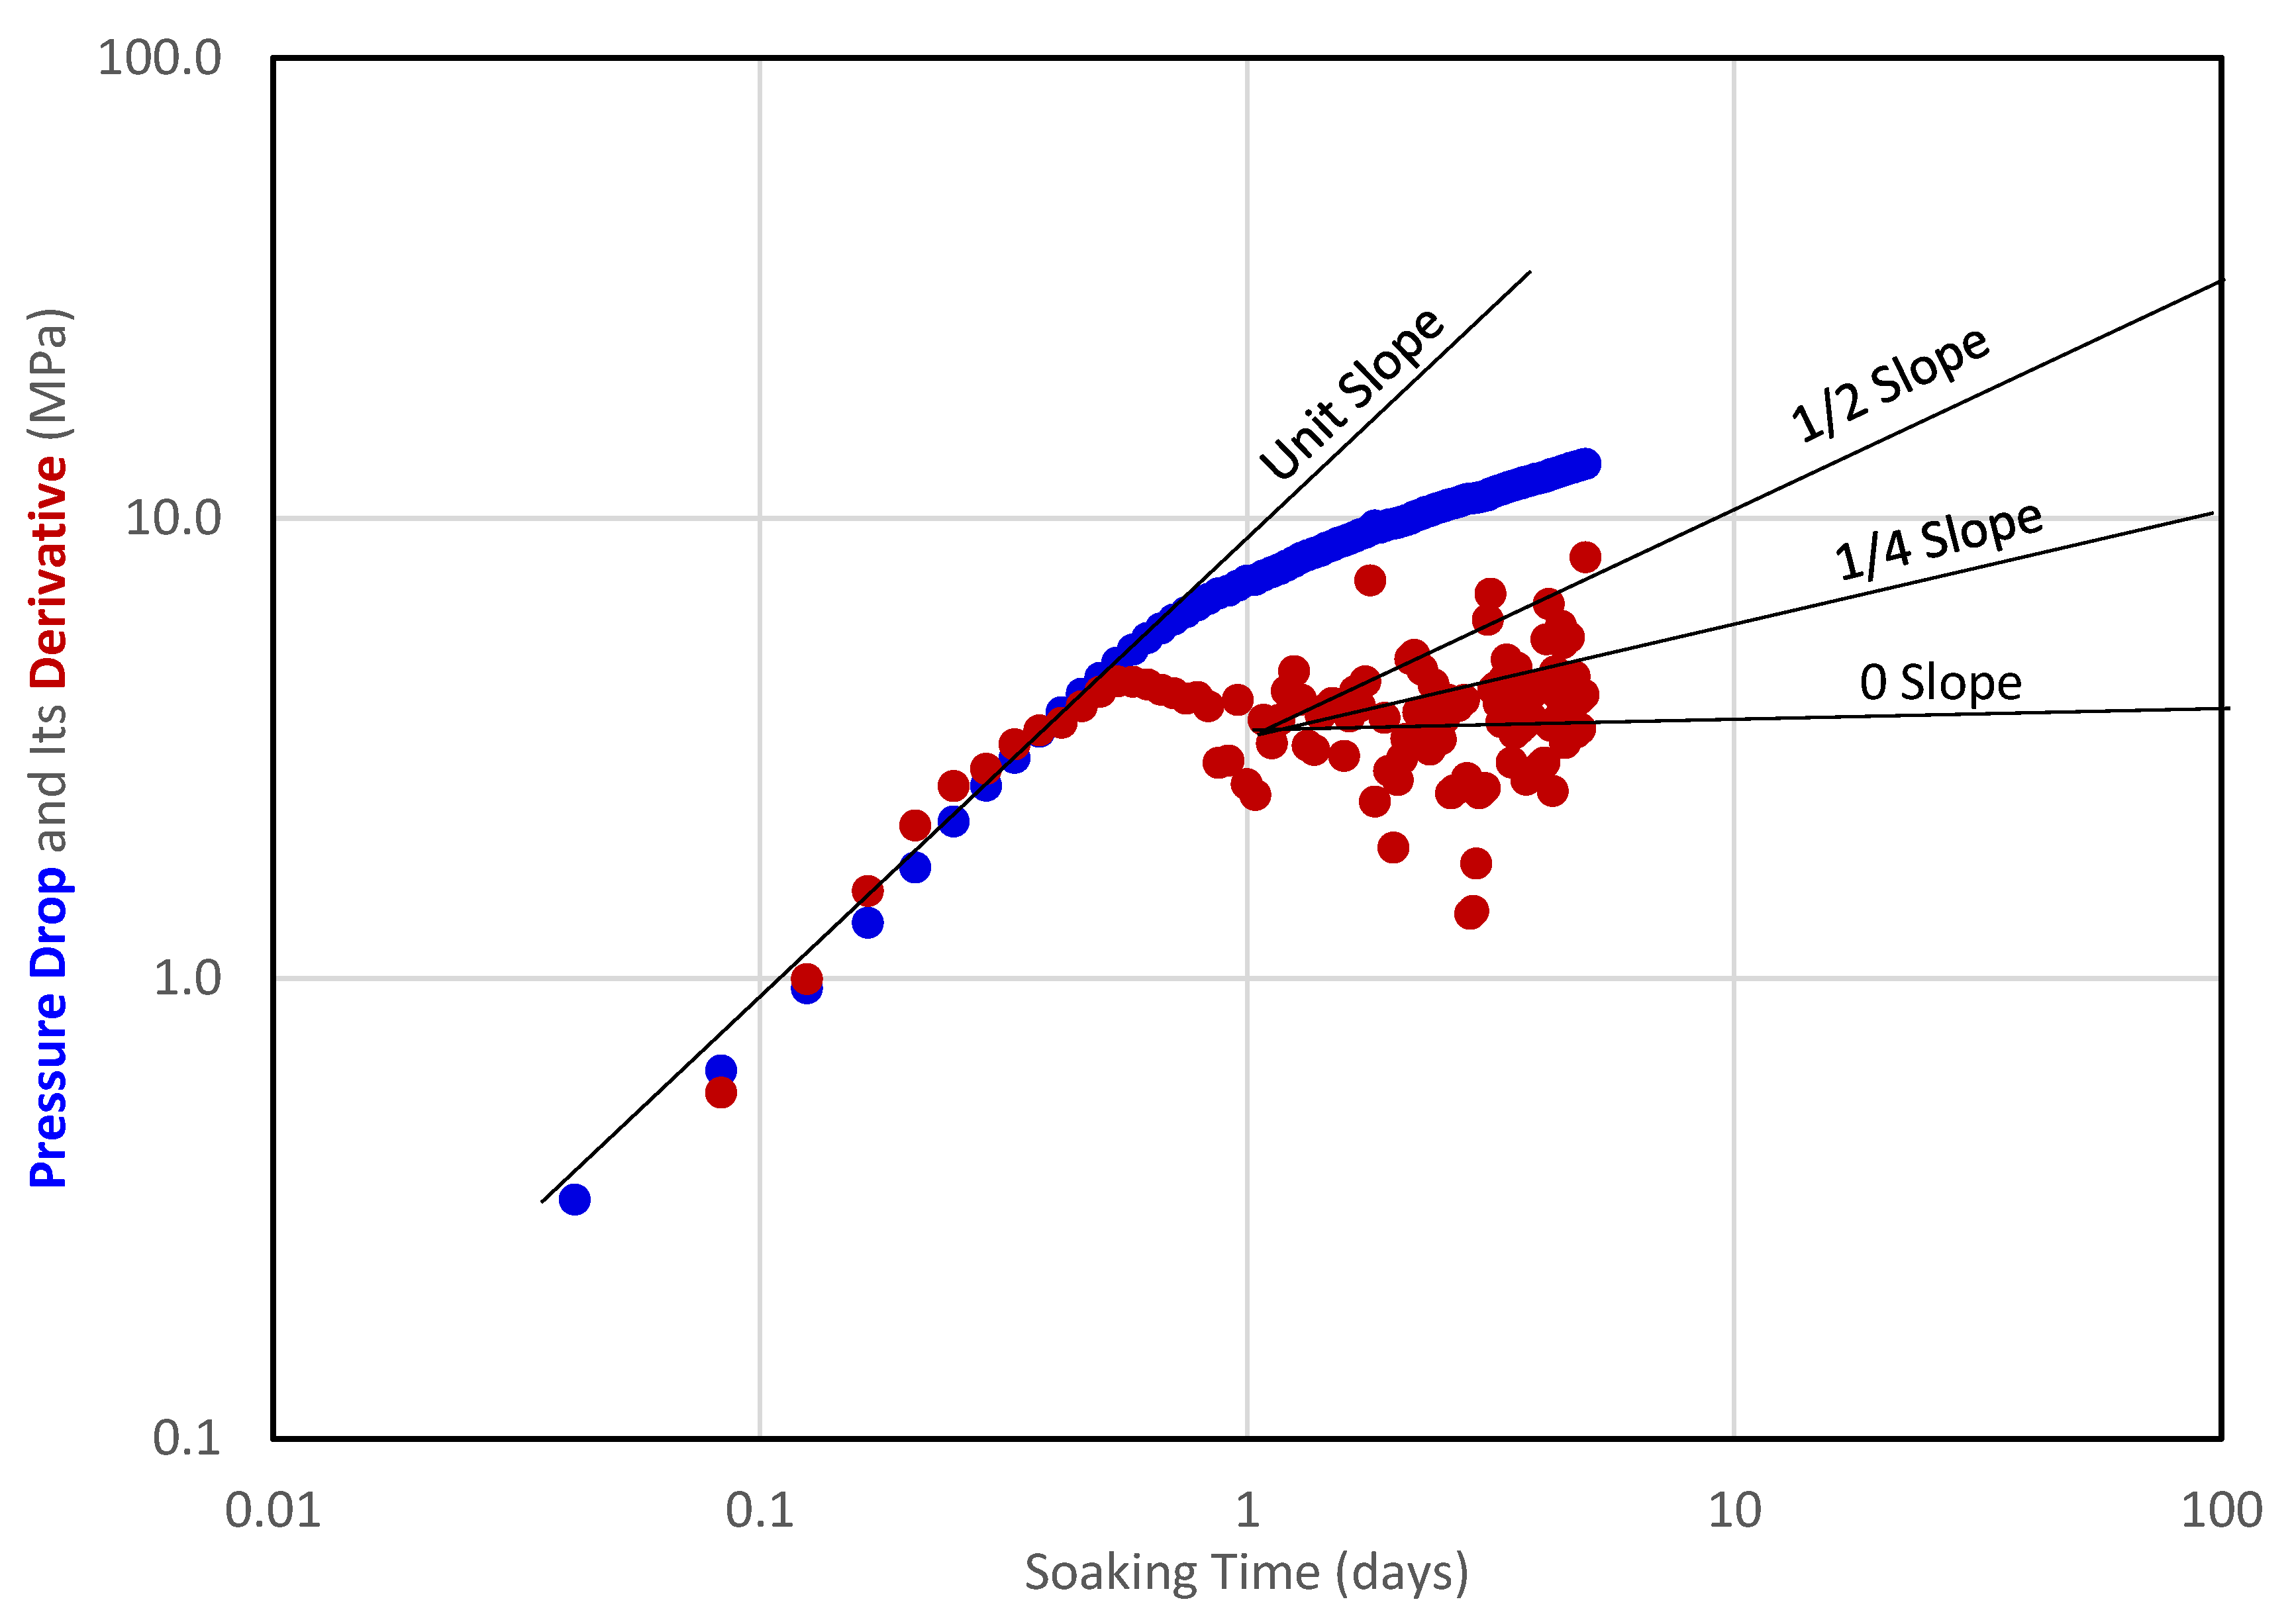
Well L2-9-1 is the first horizontal well drilled from platform L2-9. It was completed in the September of 2021. Figure 4 presents pressure drop data and its numerical derivative. The early time data reflect neither wellbore storage effect nor the fluid flow in fractures in the near-wellbore region because no unit-slope of data trend is shown. The decline in the pressure derivative between 0.1 day and 1 day may be due to the flow from the matrix in the near wellbore region into fracture. The numerical pressure derivative data trend reaches a low value of 0.9 MPa at the end of the first day. This low value of pressure derivative reflects a high value of reservoir transmissibility in the near wellbore region. After the first day, the pressure derivative data become scattering, but it has a rough trend with a zero-slope, implying that the reservoir transmissibility is getting stable away from the wellbore region. This may be an indication of adequate fluid soaking time. The owner of the well did not report well’s EUR. It is expected that this well should have a higher EUR compared to Well L2-7-1 because of the higher reservoir transmissibility near the wellbore and stable transmissibility away from the wellbore region.
3.3. Well L2-9-2
Well L2-9-2 is the second horizontal well drilled from the platform L2-9. It was completed in the October of 2023. Figure 5 presents pressure drop data and its numerical derivative. The early time data trends with a half-slope support neither wellbore storage effect nor fluid flow in fractures in the near-wellbore region because. The decline in the pressure derivative between 0.4 day and 1 day may be due to the flow from the matrix in the near wellbore region into fracture. The numerical pressure derivative data trend reaches a value of 1.6 MPa at the end of the first day. This relatively high value of pressure derivative reflects a relatively low value of reservoir transmissibility in the near wellbore region. After the first day, the pressure dropped 5 times due to on-purpose pressure bleed-offs or leaks, which distorted the pressure derivative data trend, but the derivative data still form an overall increasing trend, implying that the reservoir transmissibility is getting lower away from the wellbore region. This may be an indication of inadequate fluid soaking time. The owner of the well did not report well’s EUR. It is expected that this well should have a lower EUR compared to Well L2-9-1 because of the lower reservoir transmissibility near the wellbore and decreasing transmissibility away from the wellbore region.
3.4. Well L2-9-3
Well L2-9-3 is the third horizontal well drilled from the platform L2-9. It was completed in the October of 2023. Figure 6 presents pressure drop data and its numerical derivative. The early time data reflects either wellbore storage effect or fluid flow in natural fractures in the near-wellbore region because unit-slope of data trend is shown. The decline in the pressure derivative between 0.4 day and 1 day may be due to the flow from the matrix in the near wellbore region into the fractures. The numerical pressure derivative data trend reaches a value of 2 MPa at the end of the first day. This relatively high value of pressure derivative reflects a relatively low value of reservoir transmissibility in the near wellbore region. After the first day, the pressure dropped 2 times due to on-purpose pressure bleed-offs or leaks, which distorted the pressure derivative data trend, but the derivative data still form an overall increasing trend, implying that the reservoir transmissibility is getting lower away from the wellbore region. This may be an indication of inadequate fluid soaking time. The owner of the well did not report well’s EUR. It is expected that this well should have a lower EUR compared to Well L2-9-1 because of the lower reservoir transmissibility near the wellbore and decreasing transmissibility away from the wellbore region.
3.5. Well L2-9-4
Well L2-9-4 is the fourth horizontal well drilled from the platform L2-9. It was completed in the October of 2023. Figure 7 presents pressure drop data and its numerical derivative. The early time data reflects either wellbore storage effect or fluid flow in fractures in the near-wellbore region because unit-slope of data trend is found. The decline in the pressure derivative between 0.5 day and 1 day may be due to the flow from the matrix in the near wellbore region into the fractures. The numerical pressure derivative data trend reaches a value of 4 MPa at the end of the first day. This high value of pressure derivative reflects a low value of reservoir transmissibility in the near wellbore region due to ineffective fracturing. After the first day, the derivative data becomes scattering and forms an overall stable trend with a zero-slope, implying that the reservoir transmissibility is not getting lower away from the wellbore region. This may be an indication of adequate fluid soaking time. The owner of the well did not report well’s EUR. It is expected that this well should have a lower EUR compared to Well L2-9-1 because of the lower reservoir transmissibility near the wellbore in spite of the stable transmissibility away from the wellbore region.
3.6. Well D2-1-1
Well D2-1-1 is one of the horizontal wells drilled from platform D2-1. It was completed in the June of 2023. Other horizontal wells drilled from the same platform are Well D2-1-2, Well D2-1-3, Well D2-1-4, and Well D2-1-5. However, the post-frac soaking pressure was measured for well D2-1-1 only. Figure 8 presents pressure drop data and its numerical derivative. The early time data reflects neither wellbore storage effect nor fluid flow in fractures in the near-wellbore region because no unit-slope of data trend is identified. The decline in the pressure derivative between 0.2 day and 0.3 day may be due to the flow from the matrix in the near wellbore region into short fractures. The numerical derivative data trend reaches a low value of 1.2 MPa at 0.3 day, indicating high transmissibility near the wellbore. From 0.3 day to 1 day, derivative increases from 1.2 to 4 MPa, indicating a decreasing trend of reservoir transmissibility in the equilibrium pressure of the matrix and natural fracture in the near-wellbore region. The derivative data become scattering after 1 day, not allowing for drawing a clear trend with a specific slope, but it has a rough trend of slowly going up, implying that the reservoir transmissibility is getting even lower away from the wellbore region. This may be an indication of inadequate fluid soaking time. The owner of the well reported well’s EUR of 10.9x10⁶ m3. Post-frac fluid soaking was not run on other wells in the platform. The owner reported these wells’ EUR from 10.4x10⁶ m3 to 11.0x10⁶ m3.
4. Discussion
According to Lee et al.’s (2013) theory, the effects of dual porosity, Klinkenberg effect, desorption, non-Darcy flow, and skin effect are identifiable based on type curve matching. Their theory is not fully supported by the shut-in pressure data obtained from the post-frac fluid-soaking periods of the 6 wells in this study. The early time data from 3 of the 6 wells allows for identification the fluid flow in the fractures in the near-wellbore region because unit-slopes of data trends are found. The flow from the matrix in the near wellbore region into fractures are identified in all the 6 wells. The regime of equilibrium pressure of the matrix and natural fracture in the near-wellbore region is identified from 1 well only. In general, the pressure derivative data become scattering after 1 day of well shut in. The overall trend of pressure derivative data after the 1 day of well shut-in should reflect the effectiveness of fluid-soaking.
5. Conclusions
Post-frac shut-in pressure data from six wells in three platforms in two shale gas fields in the southwestern region of China were investigated in this study based on Pressure Transient Analysis (PTA). The analysis allows for drawing the following conclusions.
- The early time data from 3 wells identified fluid flow in fractures in the near-wellbore region. The flow from the matrix in the near wellbore region into fractures are identified in all the 6 wells, indicating that all these wells were indeed fractured.
- The regime of equilibrium pressure of the matrix and fracture in the near-wellbore region is identified from well D2-1-1 only. This can be attributed to the long fractures created in this well.
- In general, the pressure derivative data become scattering after 1 day of well shut in. The overall trend of pressure derivative data after the first day of well shut-in should reflect the effectiveness of fluid-soaking. This observation seems to be consistent with reported well’s Estimated Ultimate Recovery (EUR).
- Only 2 wells exhibited flat (zero-slope) pressure derivatives within one week of fluid-soaking, indicating adequate time of soaking. The fluid-soaking time for the other 4 wells are considered inadequate.
Acknowledgments
The authors express their gratitude to the University of Louisia at Lafayette for its support to this research.
References
- Afagwu, C., Abubakar, I., Kalam, S., Al-Afnan, S.F., and Awotunde, A.A. 2020. Pressure-transient analysis in shale gas reservoirs: A review. Journal of Natural Gas Science and Engineering 78 (2020) 103319. http://www.elsevier.
- Cai, J., Sun, S., and Wang, H. 2023. Current Advances in Capillarity: Theories and Applications. Capillarity. [CrossRef]
- Cheng, Y. 2011. Pressure Transient Characteristics of Hydraulically Fractured Horizontal Shale Gas Wells. Paper SPE 147603 presented at the SPE Eastern Regional Meeting, Columbus, Ohio, USA, August 2011. [CrossRef]
- Fakcharoenphol, P. , Torcuk, M., Bertoncello, A., and Kazemi, H. 2013. Managing shut-in time to enhance gas flow rate in hydraulic fractured shale reservoirs: a simulation study. Paper SPE 166098. [CrossRef]
- Ghanbari, E. and Dehghanpour, H. 2016. The Fate of Fracturing Water: A Field and Simulation Study. Fuel. [CrossRef]
- Gupta, A. , Xu, M. , Dehghanpour, H. et al. 2017. Experimental Investigation for Microscale Stimulation of Shales By Water Imbibition During the Shut-in Periods. Paper presented at the SPE Unconventional Resources Conference, Calgary, Alberta, Canada, 15–16 February. [CrossRef]
- Lee, Jun, Sung, Kim, Hong, Tae, Lee, Kun Sang, 2013. Type curves for pressure transient analysis of horizontal wells in shale gas reservoirs. In: Proc., SPE Middle East Oil and Gas Show and Conference.
- Lewis, Hughes, 2008. Production data analysis of shale gas reservoirs. Proceedings - SPE Annual Technical Conference and Exhibition.
- Makhanov, K. , Dehghanpour, H., Kuru, E. 2013. Measuring liquid uptake of organic shales: A workflow to estimate water loss during shut-in periods. Paper SPE 167157 Presented at the SPE Unconventional Resources Conference Canada, Alberta, Canada, 5-. 7 November.
- Shaibu, R. 2021. Fracture Conductivity, hydro-cracking, and Proppant Embedment of Tuscaloosa Marine Shale Formation Cores, PhD thesis, University of Louisiana at Lafayette, Louisiana, 2001.
- Ozkan, E. , Raghavan, R., Apaydin, O., et al., 2010. Modeling of fluid transfer from shale matrix to fracture network. SPE Annual Technical Conference and Exhibition 4, 3314–3331. [CrossRef]
- Zeng, Y. , Wang, Q., Ning, Z., Sun, H., 2018. A Mathematical Pressure Transient Analysis Model for Multiple Fractured Horizontal Wells in Shale Gas Reservoirs. Geofluids, 2018.
- Zolfaghari, A. , Dehghanpour, H., and Holyk, J. 2017. Water Sorption Behaviour of Gas Shales: I. Role of Clays. Int J Coal Geol. [CrossRef]
- Zou, Y. , Li, N., Ma, X. et al. 2018.
- Fractures in a Layered Tight Sandstone Formation. J Nat Gas Sci Eng. [CrossRef]
Figure 1.
Top views of two anticipated fractures with lateral cracks.Figure 2. Plan view of two anticipated fracture trends with layer cracks.
Figure 1.
Top views of two anticipated fractures with lateral cracks.Figure 2. Plan view of two anticipated fracture trends with layer cracks.
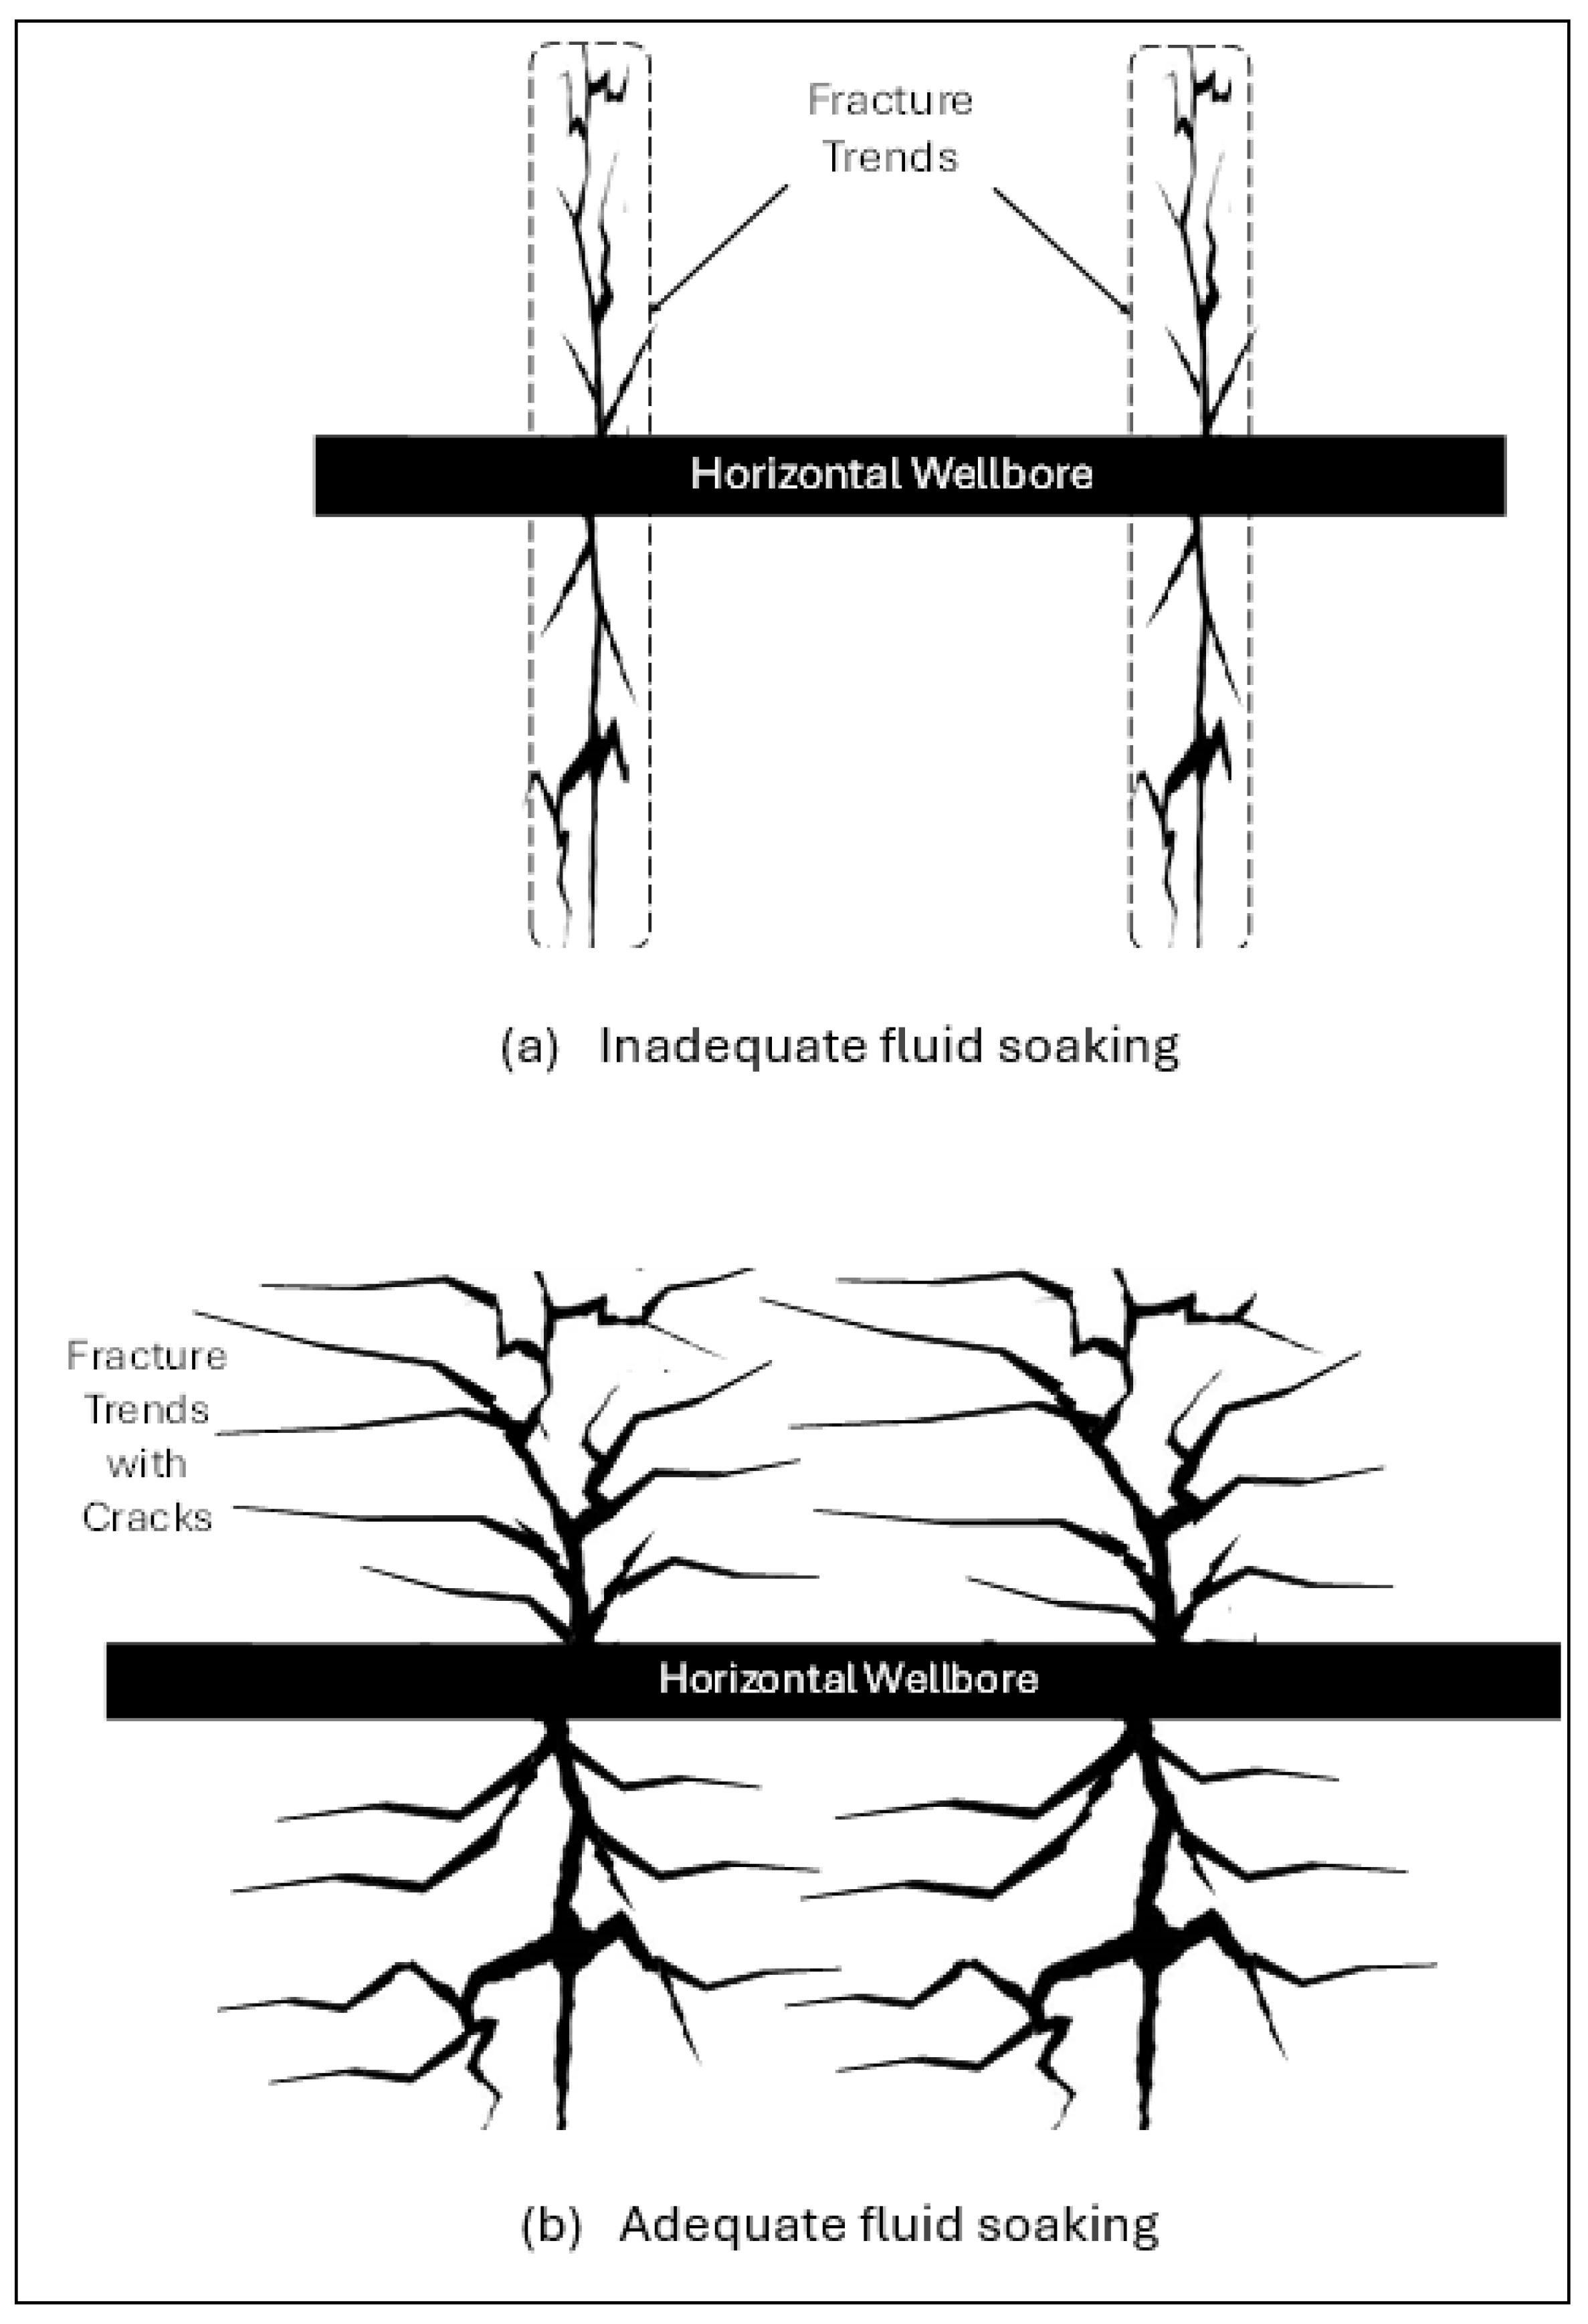
Figure 3.
Pressure drop data and its numerical derivative for Well L2-7-1.
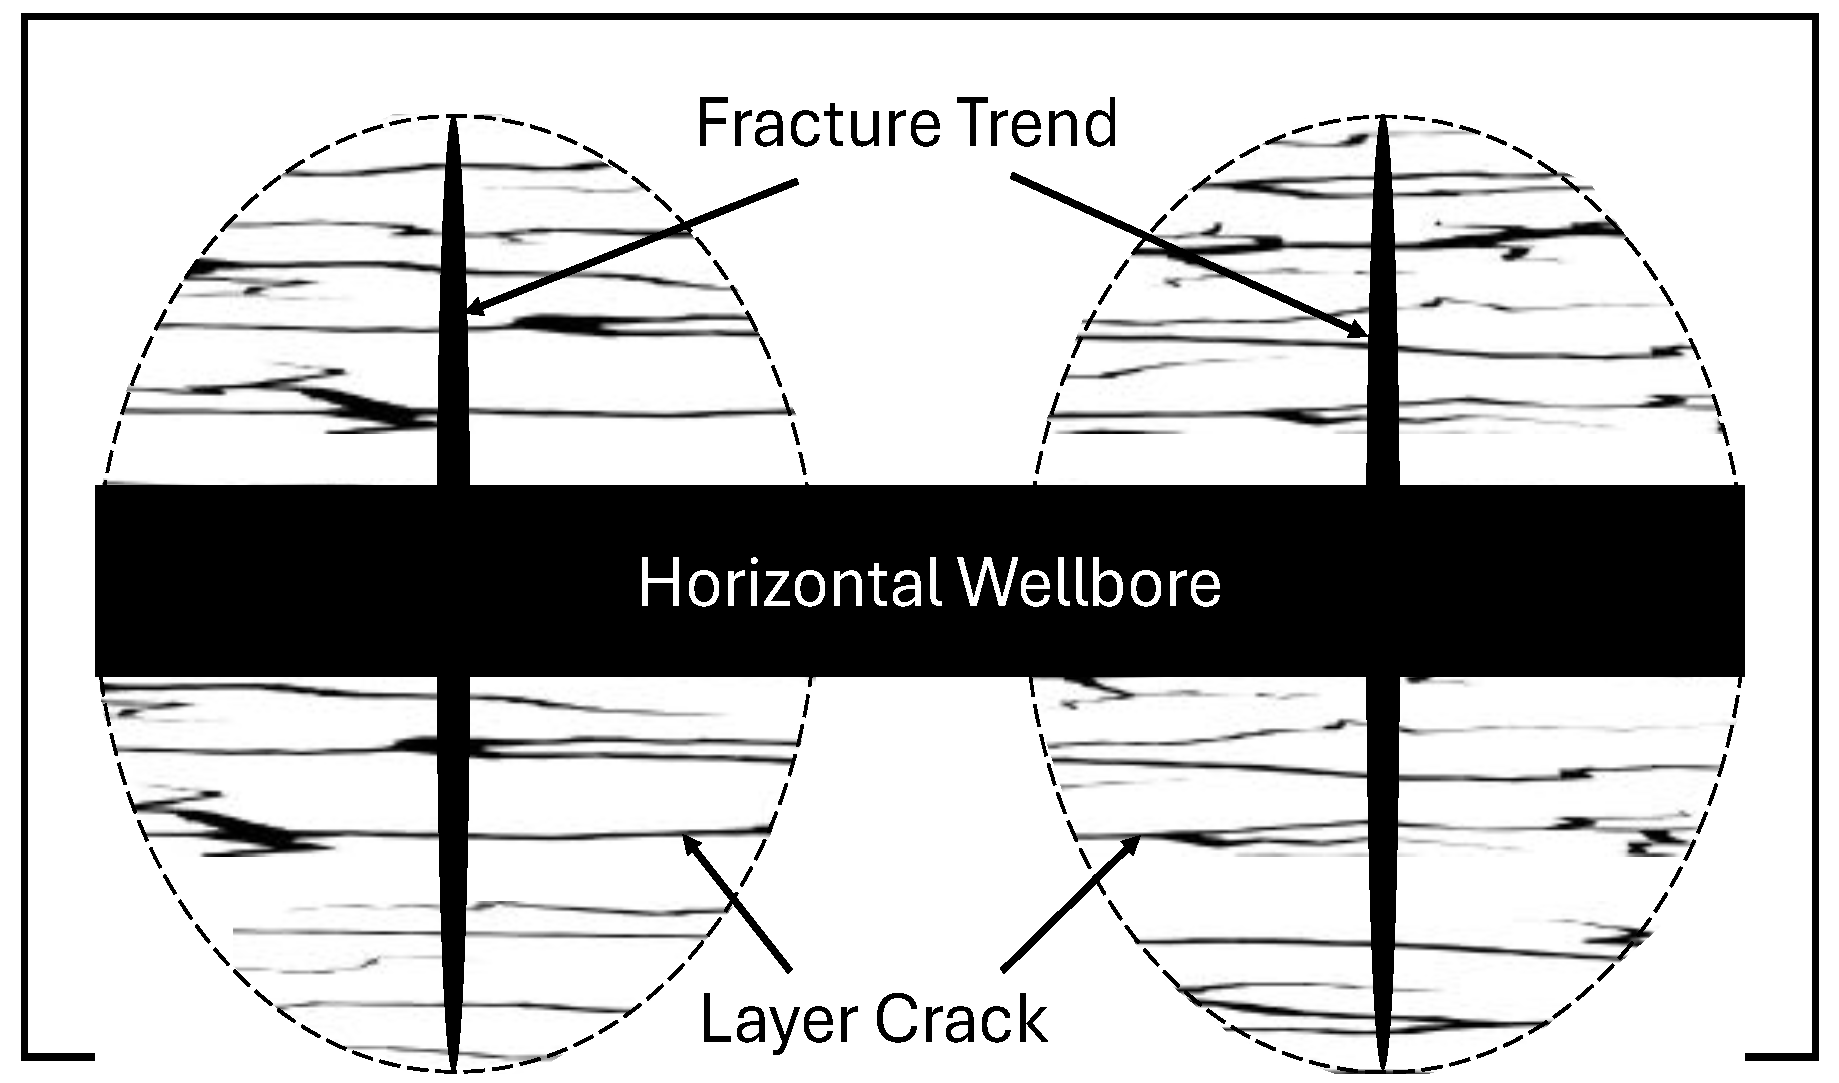
Figure 4.
Pressure drop data and its numerical derivative for Well L2-9-1.
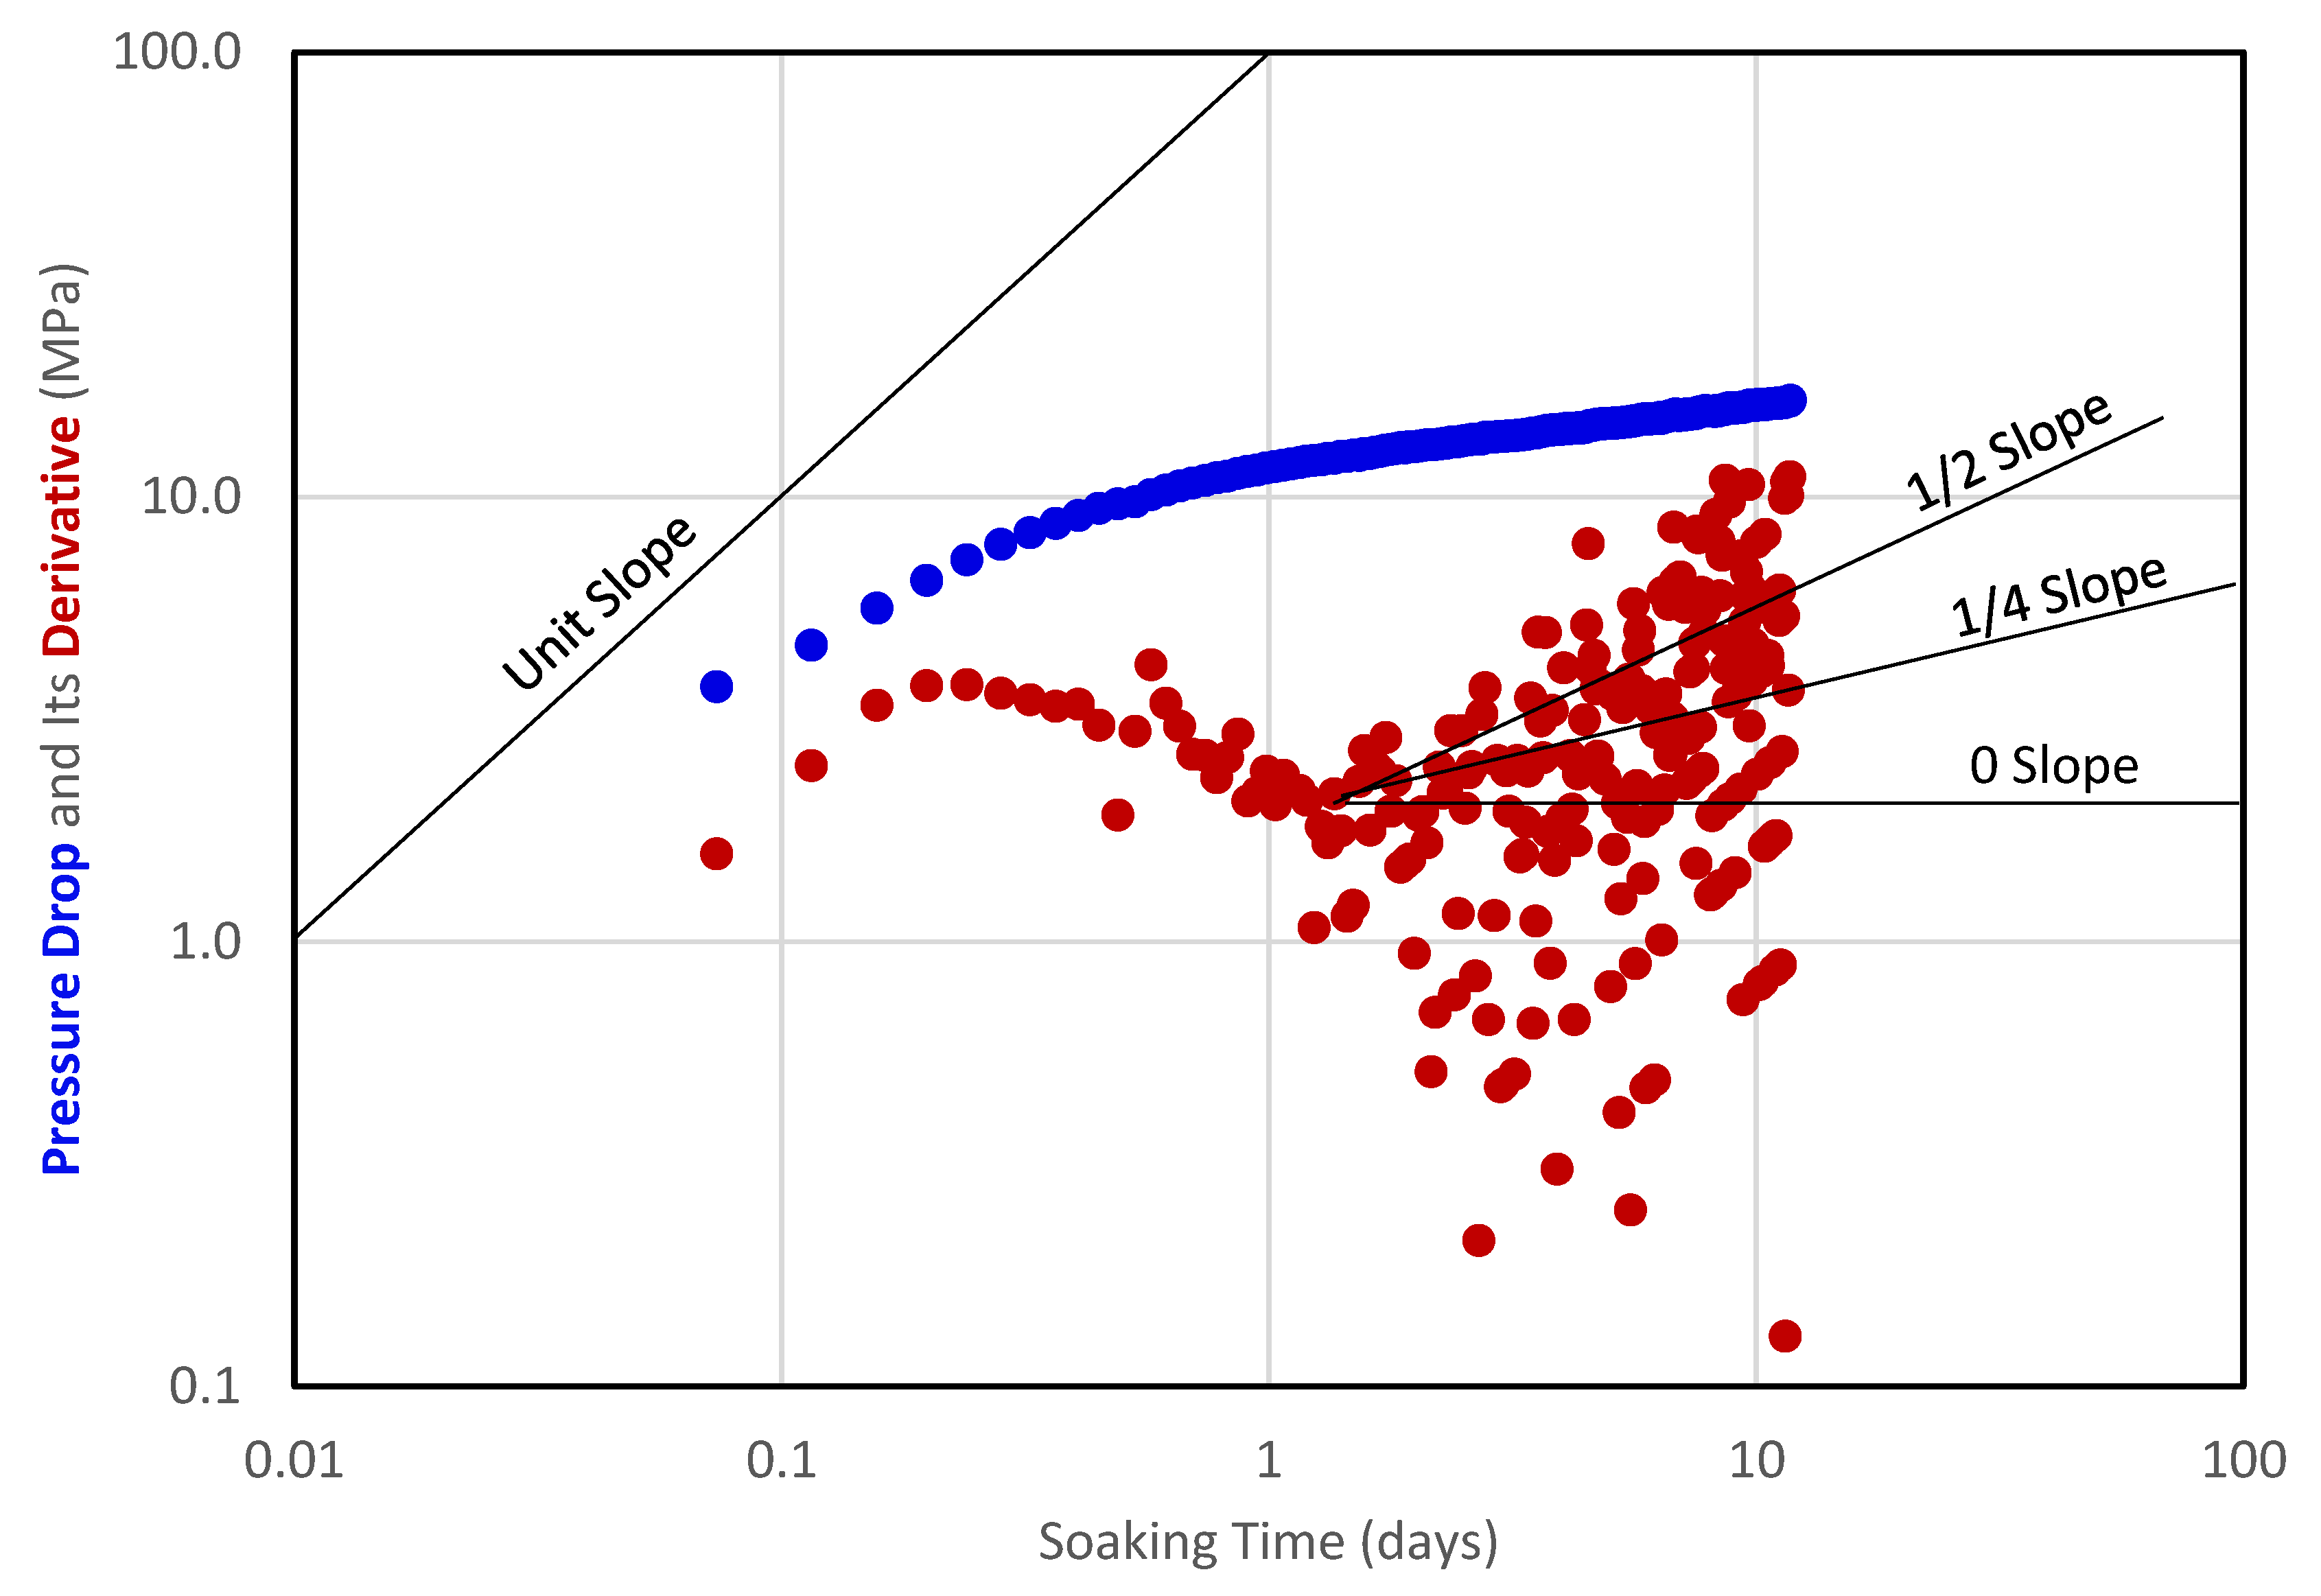
Figure 5.
Pressure drop data and its numerical derivative for Well L2-9-2.
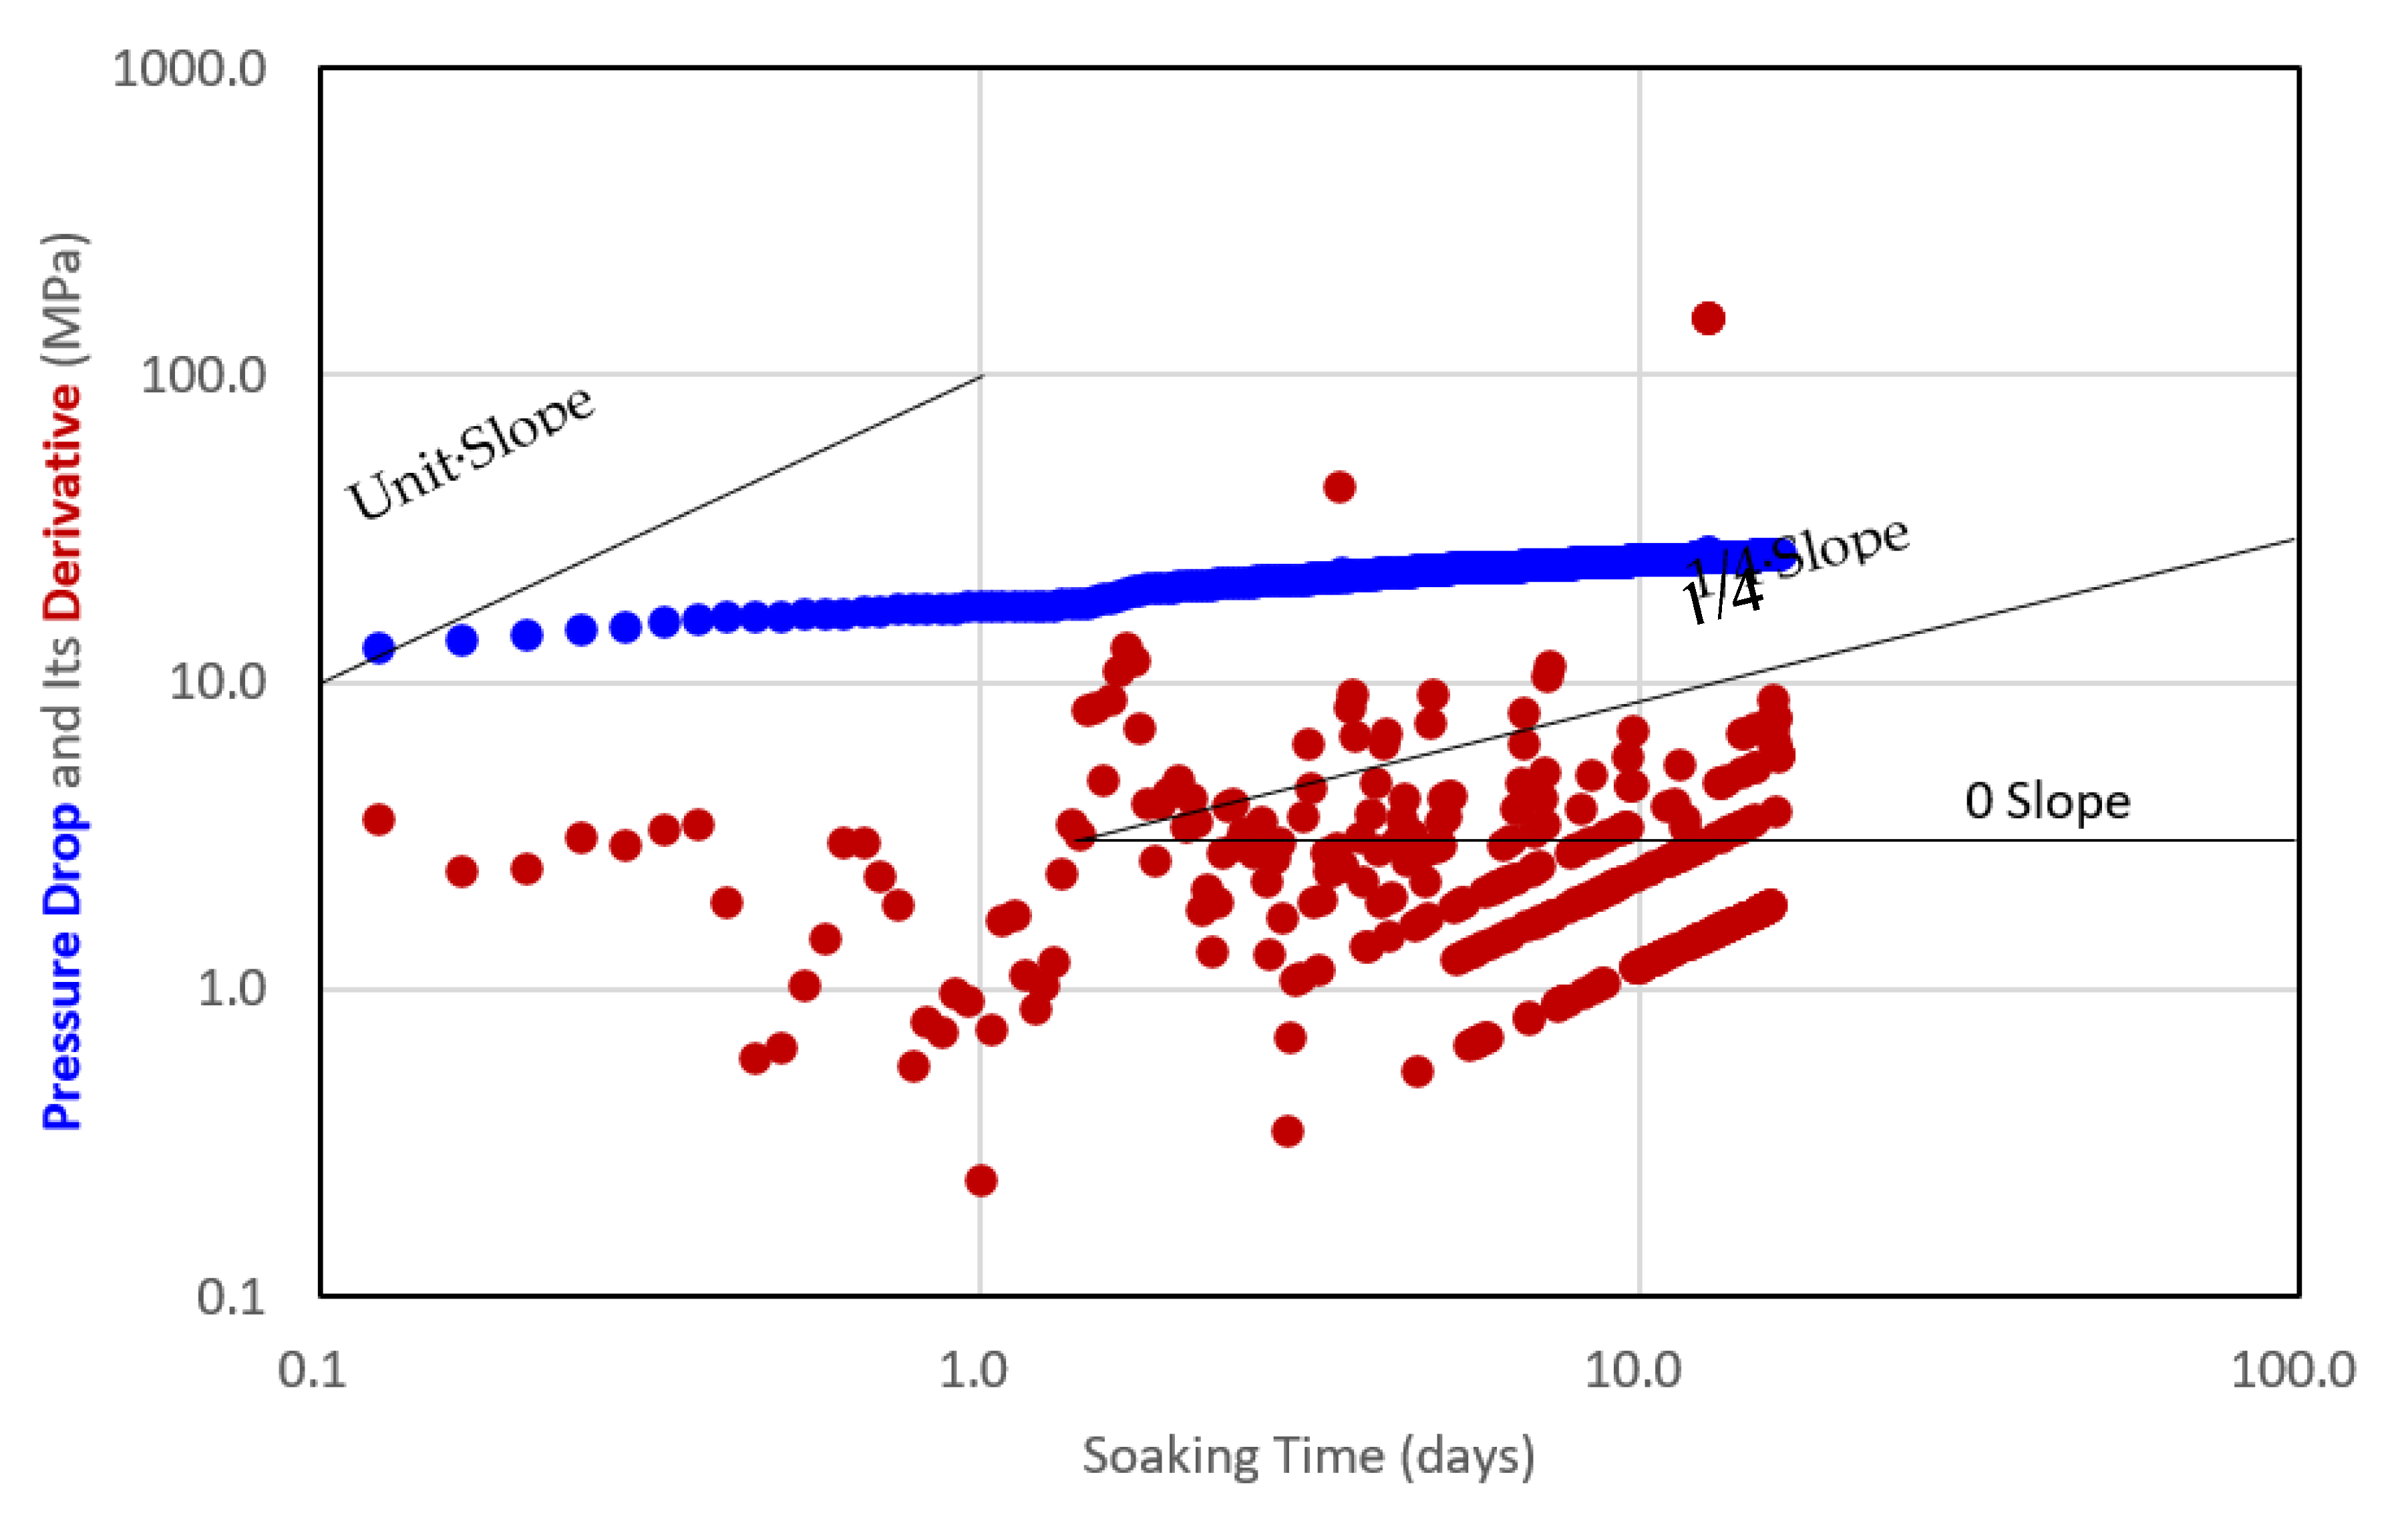
Figure 6.
Pressure drop data and its numerical derivative for Well L2-9-3.
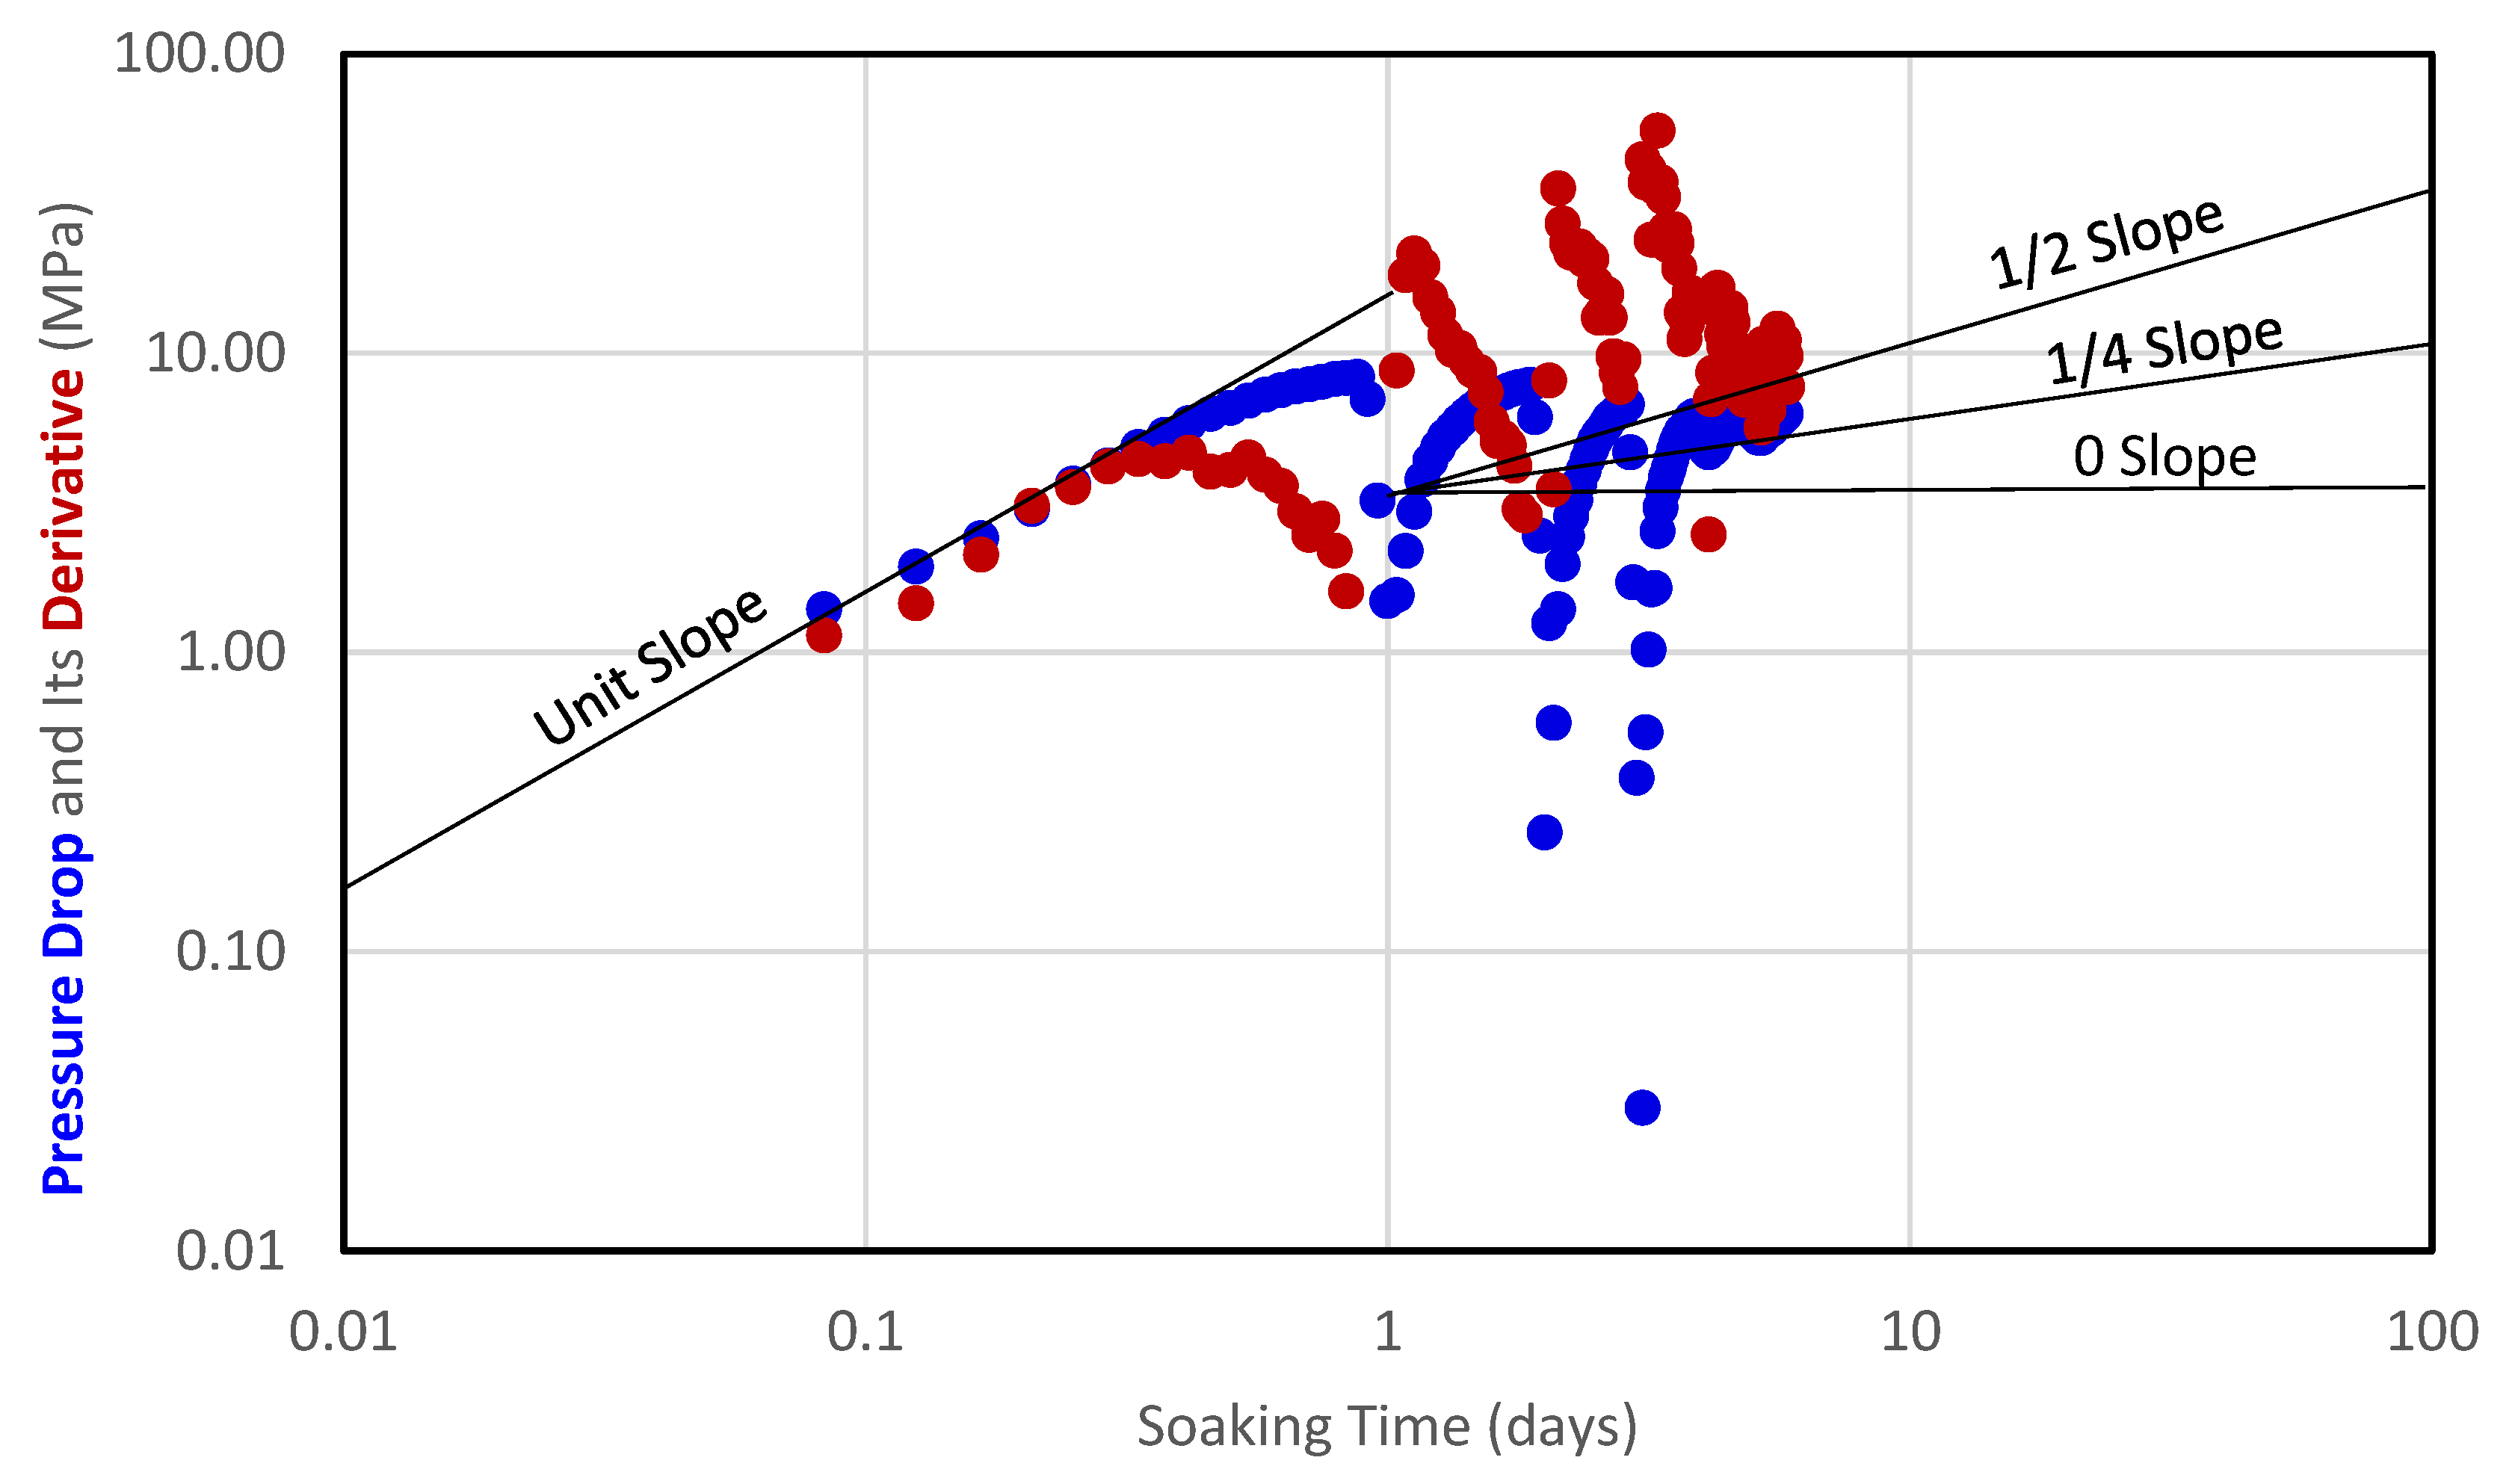
Figure 7.
Pressure drop data and its numerical derivative for Well L2-9-4.
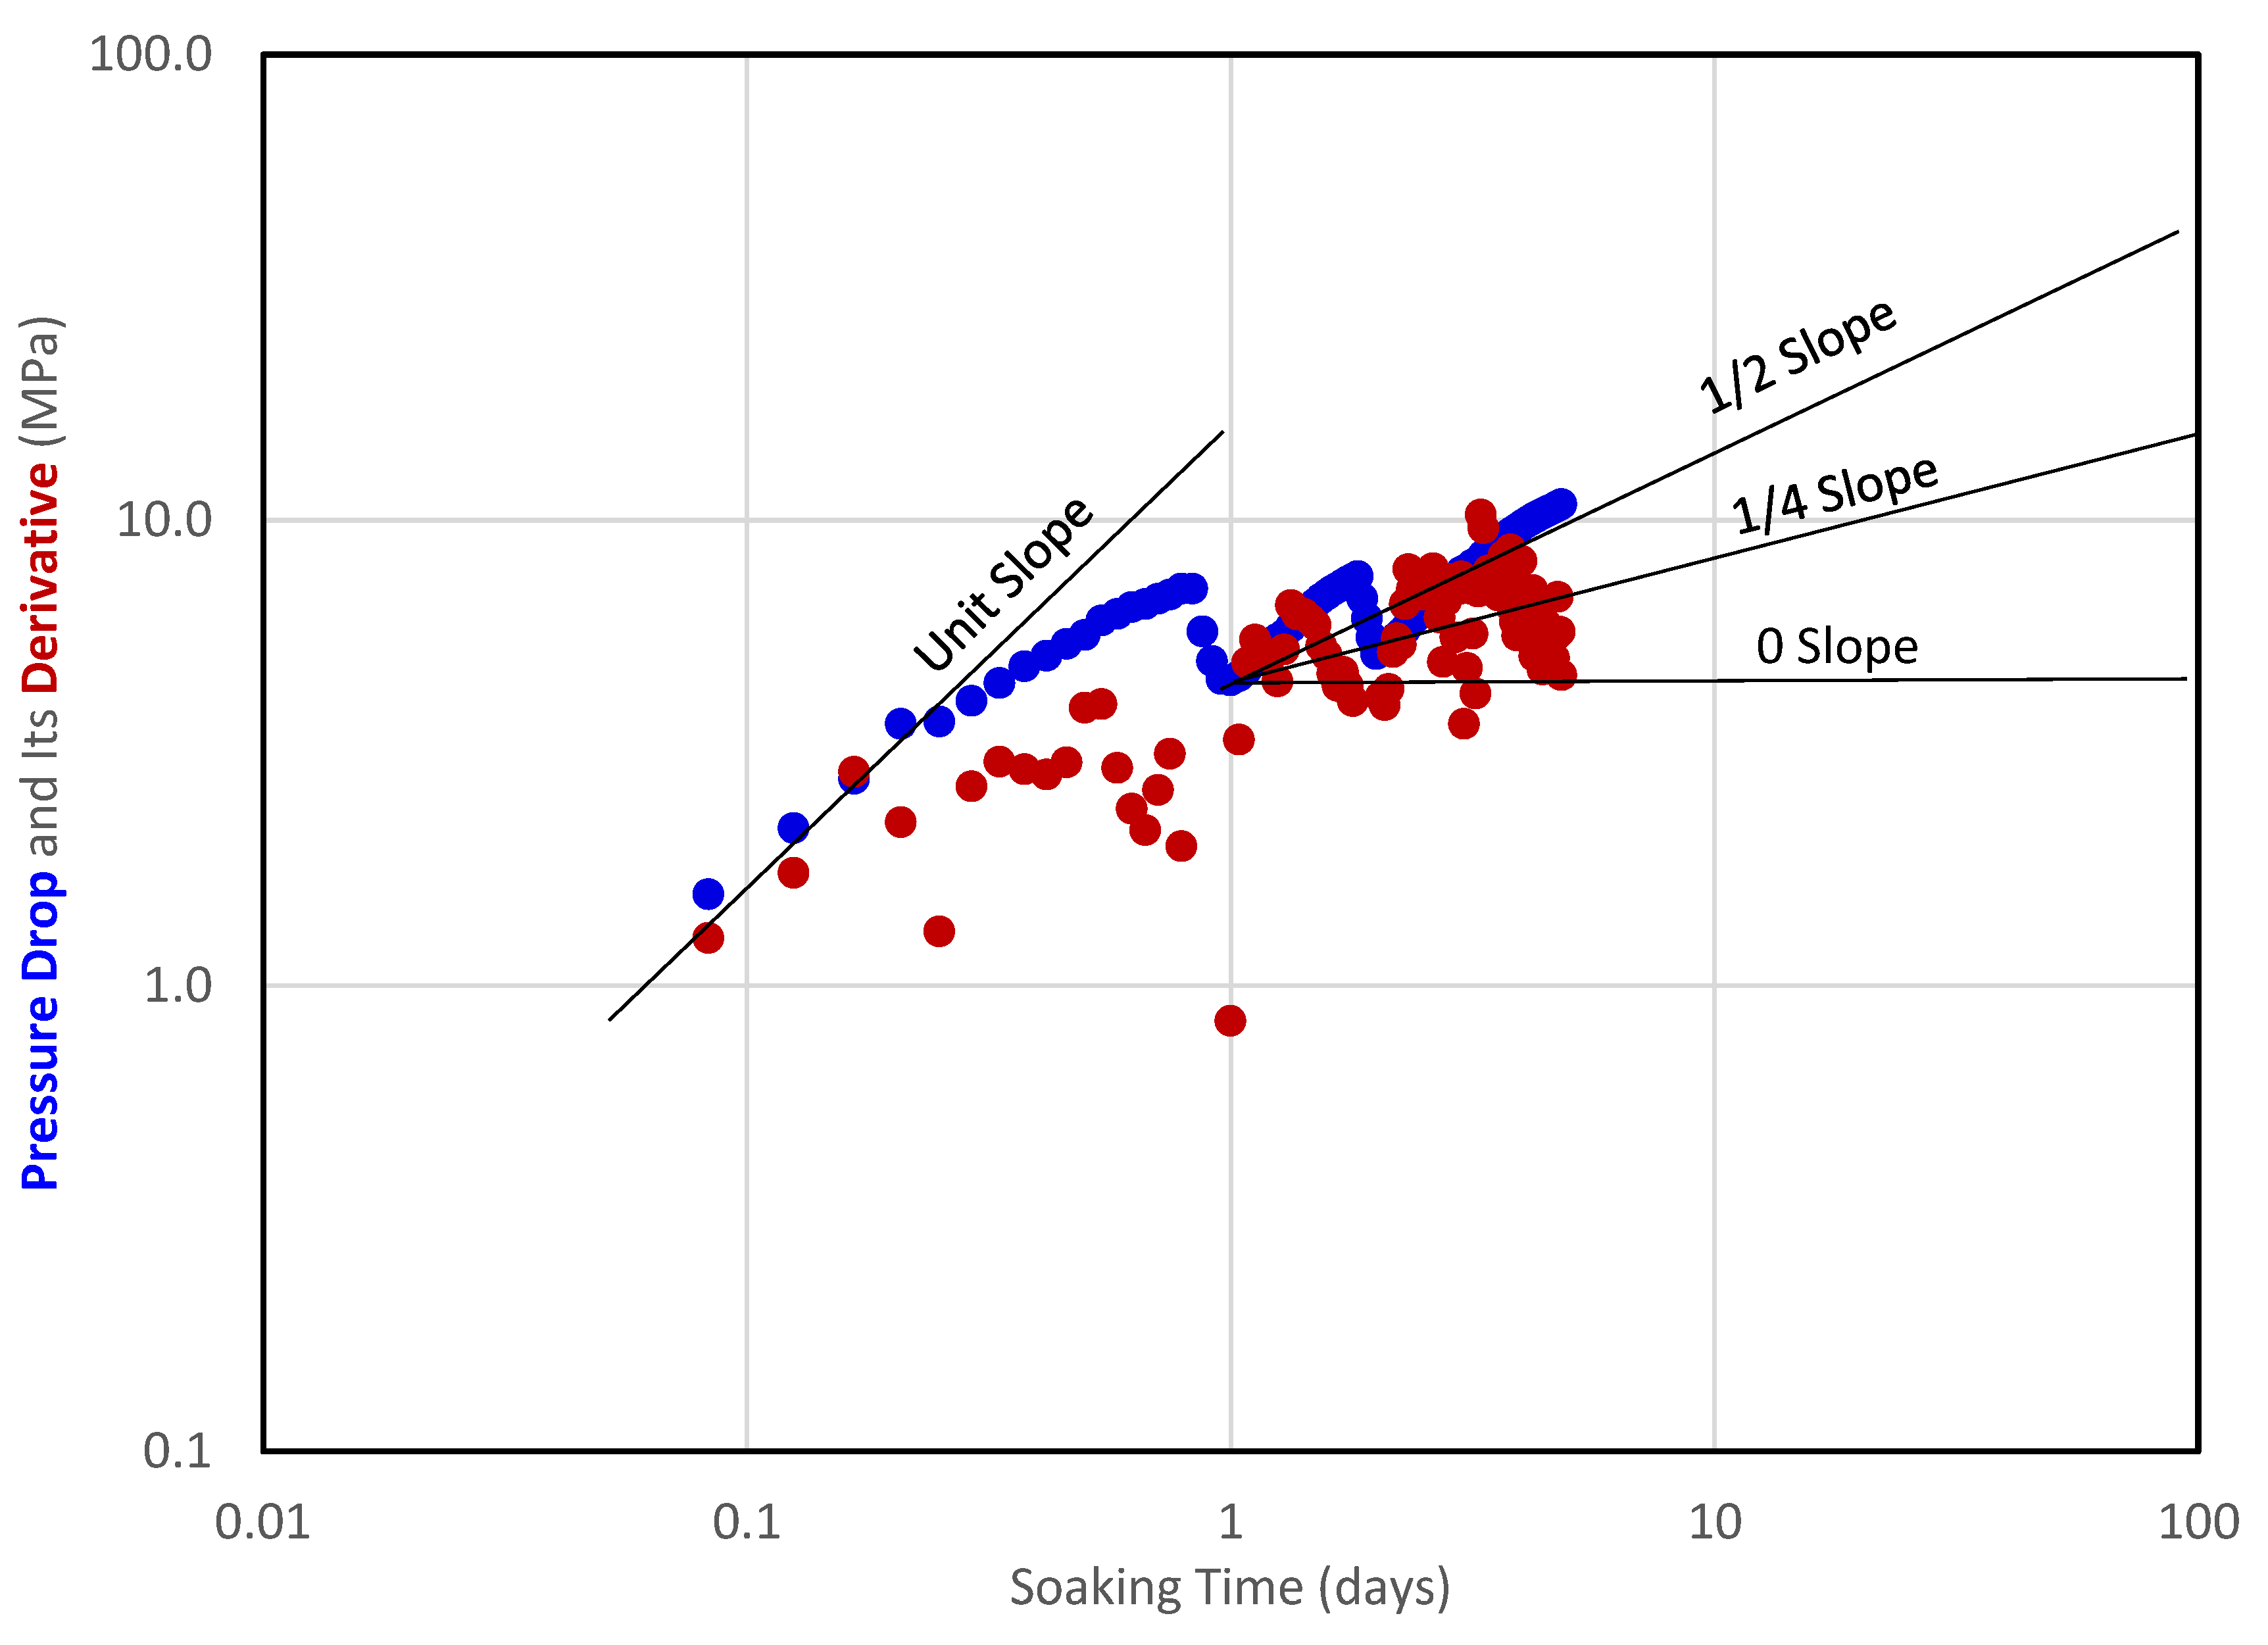
Figure 8.
Pressure drop data and its numerical derivative for Well D2-1-1.
Disclaimer/Publisher’s Note: The statements, opinions and data contained in all publications are solely those of the individual author(s) and contributor(s) and not of MDPI and/or the editor(s). MDPI and/or the editor(s) disclaim responsibility for any injury to people or property resulting from any ideas, methods, instructions or products referred to in the content. |
© 2024 by the authors. Licensee MDPI, Basel, Switzerland. This article is an open access article distributed under the terms and conditions of the Creative Commons Attribution (CC BY) license (http://creativecommons.org/licenses/by/4.0/).
Copyright: This open access article is published under a Creative Commons CC BY 4.0 license, which permit the free download, distribution, and reuse, provided that the author and preprint are cited in any reuse.


