
Submitted:
03 December 2024
Posted:
04 December 2024
You are already at the latest version
Abstract
This study presents an integrated strategy to optimize biofuel production from Chlorella sorokiniana (CSO) and Chlorella vulgaris (CVU) by combining salt-induced stress and thermal pre-treatment. The microalgae were cultivated in anaerobic digestate effluent (ADE) under stress and non-stress conditions to evaluate nutrient availability's impact on biomass composition. Salt stress significantly enhanced lipid accumulation, with CVU exhibiting a 51.6% increase. Thermal pretreatment of biomass at 90°C for 10 hours achieved the highest methane yield (481 mL CH₄/g VS), with CVU outperforming CSO. Milder pretreatment conditions (40°C for 4 hours) were more energy-efficient for CSO, achieving a yield of 2.67%. Fatty acid profiles demonstrated species-specific biodiesel properties, with CSO rich in oleic acid (33.47%) offering enhanced oxidative stability and cold flow performance, while CVU showed a higher polyunsaturated fatty acid content. This research highlights the economic viability of using ADE as a low-cost cultivation medium and the potential for scalable thermal pretreatments. Future research should focus on reducing energy demands of pretreatment processes and exploring alternative stress induction methods to further enhance biofuel yields. These findings offer valuable insights for tailoring cultivation and processing strategies to maximize lipid and methane production, supporting sustainable and economically viable dual biofuel production systems.
Keywords:
microalgae (MA)
; nutrient removal
; anaerobic digestion effluent (ADE)
; biodiesel
; C. Sorokiniana
; C. Vulgaris
; biogas potential
1. Introduction
The pursuit of renewable and sustainable energy sources has accelerated research into microalgae as promising biofuel feedstocks. Species such as Chlorella vulgaris (CVU) and Chlorella sorokiniana (CSO), are valued for their rapid growth rates, adaptability to diverse environments (e.g., wastewater), and nutrient-dense composition, making them ideal candidates for bioenergy applications [1,2,3]. Besides biofuel production, microalgae offer significant environmental benefits, including reduced competition for land with food crops and bioremediation capabilities in wastewater treatment [2]. However, the efficient conversion of microalgal biomass into biofuels is hindered by the robust cell wall structures of microalgae, containing complex polysaccharides and polymers such as cellulose, hemicellulose, and sporopollenin-like materials [4,5]. This structural resilience, while beneficial for the organism’s survival, restricts microbial degradation and nutrient accessibility, which are critical for biofuel recovery. Overcoming these barriers requires specific pretreatment strategies to enhance solubilization of cell wall components, thereby improving intracellular nutrient access and maximizing methane and biodiesel yields [6].
Factors such as the biochemical composition of microalgal biomass, pretreatment techniques, microbial inoculum type, and substrate-to-inoculum (S/I) ratio play pivotal roles in determining BMP (Biochemical Methane Potential) outcomes in anaerobic digestion (AD). High protein and lipid contents in microalgae typically enhance methane production, but a low carbon-to-nitrogen (C/N) ratio, common in microalgal biomass due to high nitrogen content, can lead to ammonia production that inhibits methanogenic activity. Co-digestion with carbon-rich substrates, such as food or agricultural waste, has proven effective for balancing the C/N ratio, thereby improving both methane yield and AD stability [7,8].
Pretreatment of microalgal biomass is crucial to improving BMP by increasing microbial accessibility to resilient cell wall components. Enzymatic pretreatments targeting specific polymers, such as cellulase for cellulose and xylanase for hemicellulose, have shown promise, enhancing methane yields by up to 15% [9,10]. However, while mechanical and thermal pretreatments can also increase methane production, their high energy requirements often limit practical application [11,12].
Moreover, selecting the appropriate microbial inoculum is essential for optimizing BMP. Anaerobic inocula, specifically adapted for microalgal biomass degradation, demonstrates improved BMP efficiency. Thermophilic conditions combined with inocula enriched with Clostridia and hydrogenotrophic methanogens can enhance hydrolytic and methanogenic activity, reducing the need for energy-intensive pretreatments and emphasizing the importance of microbial adaptation for effective BMP [10,13].
A range of pretreatment methods, including thermal, chemical, enzymatic, and acid-thermal techniques, have been evaluated to optimize microalgal biomass for biofuel production. Thermal pretreatment at elevated temperatures is particularly effective, breaking down complex cell wall components and releasing carbohydrates, leading to increases in methane production by up to 108% under optimal conditions [12,14]. However, thermal pretreatment alone may not fully disrupt cell walls in more resilient microalgae species, prompting the use of supplementary chemical agents. For example, combining thermal pretreatment with acidic or alkaline conditions selectively targets macromolecules like proteins or carbohydrates, facilitating their degradation and increasing the availability of fermentable sugars [7,15]. Acid-thermal pretreatment, which involves dilute sulfuric acid at high temperatures, is effective in solubilizing carbohydrates, crucial for maximizing methane yields in anaerobic digestion and enhancing hydrogen production through fermentation pathways [14]. Conversely, alkaline-thermal pretreatment improves protein solubilization and mitigates ammonia buildup during AD, preventing microbial inhibition and enhancing methane output [15]. Optimized pretreatment conditions can increase digestibility by up to 50% for CVU and by 21-27% for Scenedesmus sp., despite the latter’s more resilient cell wall structure [7].
Innovative physical methods such as cold atmospheric-pressure plasma (CAPP) have recently shown potential for enhancing lipid productivity and biodiesel yields. This method uses ionized gas to create reactive species that penetrate the cell wall, increasing lipid extraction efficiency without producing harmful residues. CAPP pretreatment is an environmentally sustainable alternative to traditional chemical methods, aligning with regulatory standards and supporting large-scale biodiesel production with minimal ecological impact. Given its non-mutagenic nature, CAPP is particularly suitable for applications in closed-loop cultivation systems, where preserving microalgal genetic integrity is essential [16].
Finally, optimizing pretreatment processes based on specific microalgal characteristics, desired biofuel type and economic constraints is critical. While intensive thermal and chemical pretreatments enhance biofuel yield, they require substantial energy, potentially offsetting biofuel gains [12,17]. Recent studies suggest that alternative, lower-energy methods such as enzymatic or CAPP treatments, as well as hybrid approaches combining thermal and non-thermal techniques, may reduce energy demands while achieving high biofuel yields [16,17].
This study evaluates the bioenergy potential of CSO and CVU cultivated in anaerobic digestate effluent (ADE) through a combined approach of stress induction and thermal pretreatment to enhance both lipid accumulation for biodiesel and methane production for biogas. Specifically, this paper presents findings on (1) the effects of salt stress induction as a stressor to promote lipid storage in both species, (2) the differential impact of ADE concentrations on biochemical composition (lipids, proteins, and carbohydrates) across species, and (3) the influence of various thermal pretreatment conditions on BMP. By analyzing biomass composition, fatty acid methyl ester (FAME) profiles, and biogas yields alongside energy balance assessments, this research underscores the effectiveness of integrating stress and pretreatment strategies. The results reveal significant species-specific responses, particularly in terms of lipid and methane yield optimization, emphasizing the necessity of tailored strategies for maximizing biofuel outputs depending on the target biofuel type and Chlorella species.
2. Materials and Methods
2.1. Microalgae Strains and Culture Condition
CSO and CVU were used in the study. CSO was isolated from anaerobic digestate effluent (ADE) from BIOGAS LAGADA S.A. and identified morphologically using a Zeiss Axio Imager Z2 microscope. Genetic identification, based on PCR amplification and sequencing of 18S rRNA and rbcL genes, confirmed its close relation to CSO with 99% identity via GenBank database comparison. The CVU strain was obtained from the MicroAlgae Culture Collection (TAU-MAC). Both strains were maintained in BG-11 medium, containing nutrients in the following concentrations: (g/L) NaNO₃ (1.5), K₂HPO₄·3H₂O (0.04), MgSO₄·7H₂O (0.075), CaCl₂·2H₂O (0.036), citric acid (0.006), ammonium ferric citrate (0.006), Na₂EDTA (0.001), and Na₂CO₃ (0.02); and (mg/L) H₃BO₃ (2.86), MnCl₂·4H₂O (1.81), ZnCl₂ (0.222), Na₂MoO₄·2H₂O (0.391), CoCl₂·6H₂O (0.05), and CuSO₄·5H₂O (0.079). All nutrient solutions and glassware were autoclaved at 121 °C for 20 minutes to ensure sterility during the early growth stages. Methods were performed as described by Psachoulia et al [18].
2.2. Microalgae Cultivation in a Photobioreactor
2.2.1. Photobioreactor (PBR) Setup and Operation
A 50 L tubular photobioreactor (PBR) was designed and constructed from Schott glass tubes (Schott AG, Mainz, Germany) for microalgae cultivation under artificial lighting. The system comprises eight straight tubes, each 1.4 m in length and 61 mm in internal diameter, interconnected by seven J-bend joints. The total illuminated surface area was optimized to ensure uniform light distribution to the culture medium, with illumination provided by cool white LED strips (6000 K, 11 W/m) delivering 7000 lux under a 16:8 h light/dark photoperiod. Circulation within the PBR is achieved using a Blau Reef Motion 8KDC pump (Blau Aquaristic, Barcelona, Spain), which provides a maximum flow rate of 8000 L/h and ensures efficient mixing, maintaining turbulent flow conditions (Re > 3000) for optimal light penetration and nutrient distribution. Carbon dioxide is supplied at a controlled rate of 85 mL/min to support microalgal growth. The reactor is equipped with online monitoring sensors for pH, dissolved oxygen (DO), and temperature, with data logged via a programmable logic controller (PLC). Temperature is maintained at 25°C throughout the experiments. Prior to experiments, the reactor is sterilized with 12% NaClO to ensure aseptic conditions. The system's modularity, glass construction, and compact design provide durability, ease of sterilization, and optimal conditions for high biomass productivity in controlled laboratory settings.
2.1.2. Inoculum Preparation
Prior to photobioreactor inoculation, algae strains were cultured in Erlenmeyer flasks (170 mL BG-11 medium, initial OD₆₀₀nm ≈ 0.35) under controlled conditions. The cultures were grown in a shaking incubator (GFL 3031, GFL Gesellschaft für Labortechnik mbH, Burgwedel, Germany) at 110 rpm and 25°C, with a continuous supply of atmospheric air at 250 mL/min, passed through 0.2 µm filters. Additionally, 2.5 mL/min of CO₂ was supplied using precision flowmeters (FL-3845G-HVR, Omega Engineering, Norwalk, CT, USA). Illumination was provided by cool white LED strips (6000 K, 11 W/m) delivering 1200 lux on a 16-hour light/8-hour dark cycle. After 18 days, the harvested biomass was concentrated and used to inoculate the photobioreactor (10% v/v inoculum, achieving an initial cell density of ~4.5 x 10⁶ cells/mL) [18].
2.2.3. Nutrient Media Preparation and Composition
Approximately 30 L of ADE was collected in a plastic tank from the output stream of a 1 MW biogas production facility (BIOGAS LAGADA S.A.) processing livestock waste. Samples were transported to the laboratory and immediately centrifuged (5000 x g, 10 min) and filtered (Whatman Inc., 150 mm diameter, Grade 1, 11 µm pore size). Nutrient concentrations (N-NH4, N-NO3, TN, P-PO4, and COD) were determined using standard HACH cuvette tests and a UV-Vis spectrophotometer (DR 3900, HACH, Loveland, CO, USA). Digestate elemental analysis was performed via an Agilent 7850 ICP-MS, an Inductively Coupled Plasma Mass Spectrometer (Agilent Technologies, Santa Clara, CA, USA). To mitigate ammonia nitrogen inhibition, ADE was diluted to 3% and 5% (v/v) with distilled water, as recommended by Collos and Harrison [19]. BG-11 medium was prepared as a control, and the nutrient compositions of the media are summarized in Table 1.
2.1.4. Salt Stress Treatment
Salt stress was induced in CVU and CSO cultures grown in 5% ADE to enhance lipid accumulation. On the 8th day of cultivation, sodium chloride (NaCl) was added to the cultures to reach a final concentration of 0.2 M (11.7 g/L), a level shown to promote lipid biosynthesis while maintaining cell viability [20,21,22,23]. A pre-dissolved NaCl solution was uniformly mixed into the medium, and electrical conductivity (EC) was measured using a portable conductivity meter (HACH HQ40d) to confirm the target value of approximately 20 dS/m. Cultures were sampled daily for 7 days to monitor key physiological and biochemical parameters, including optical density (OD600), dry cell weight (DCW), chlorophyll degradation, and lipid content. Therefore, to raise the EC of 1 liter of 5% ADE (3.15 dS/m) to 20 dS/m, 10.78 g of NaCl were diluted into the medium to induce the stress to initialize the lipid accumulation in the Chlorella species.
2.1.5. Biomass Harvesting
Microalgae biomass from the photobioreactor was harvested using a 0.4 µm ultrafiltration membrane (Kubota) placed in a 5 L PMMA tank connected to the reactor. A peristaltic pump (Shenghen LabV1) filtered the liquid through the membrane, concentrating the biomass in the tank.
2.3. Microalgae Growth Determination
Microalgae growth in photobioreactor was monitored through optical density (OD) and dry cell weight (DCW) [18]. Optical density (OD) measurements were performed at 600 nm using a UV-visible spectrophotometer (DR 3900, HACH, Loveland, CO, USA), with appropriate sample dilutions for accurate readings. Biomass concentration, expressed as DCW, was determined by filtering 5 mL of culture through pre-weighed glass microfiber filters (Whatman 934-AH, pore size 1.2 μm), drying the filters at 50°C overnight, and re-weighing them. The DCW was calculated using the formula:
where:
DCW (mg/L) = (mT - mA) x 1000 / Vδ (L)
- mT: Mass of the filter after drying (g).
- mA: Mass of the filter before filtration (g).
- Vδ: Volume of the filtered sample (L).
2.4. Thermal Pretreatment
To evaluate the effect of heat pretreatment on enhancing BMP, CSO and SVU were subjected to different temperature-time combinations at 40°C and 90°C with exposure durations of 4 and 10 hours for each temperature. Heating was conducted in a water bath placed on a hot plate (PV 200, FALC Instruments, Treviglio, Italy) equipped with magnetic stirring to ensure uniform heat distribution and consistent temperature throughout the biomass suspension. After pre-treatment, the biomass was cooled to room temperature and stored at 4°C until further use [12,24].
2.5. Biomass Composition Analysis
2.5.1. Pigment Determination
Pigments were analyzed in samples collected at the end of each experiment following established protocols by Wellburn and Henriques et al. [25,26]. A 2 mL culture sample was centrifuged at 7000×g for 10 minutes, and the pellet was washed three times with distilled water. Methanol (99.8%, 2 mL) was added to the pellet, vortexed, and incubated in the dark at room temperature for 20 minutes. Absorbance was measured at 470, 652, and 665 nm using a UV-visible spectrophotometer (DR 3900, HACH, Loveland, CO, USA). The concentrations of chlorophyll a, chlorophyll b, and carotenoids were calculated using the following equations:
Chlorophyll a (Chla) = 16.72 × A665 - 9.16 × A652
Chlorophyll b (Chlb) = 34.09 × A652 - 15.28 × A665
They are presented as Total Chlorophyll Content
Carotenoids = ((1000 × A470) - (1.63 × Chla) - (104.96 × Chlb)) / 221
Harvested biomass was centrifuged, washed with distilled water, and stored at −20°C before lyophilization for further analysis.
2.5.2. Protein Determination
Protein content was extracted from 2 mg of freeze-dried biomass using 9.6 mL of 0.5 M NaOH solution containing 5% methanol (v/v) and 0.4 mL of 0.05 M phosphate buffer [27]. The mixture was subjected to sonication in an ice bath for 10 minutes at 50% of the sonicator's maximum amplitude to ensure cell lysis and protein release. An additional 5 mL of NaOH solution (0.5 M, 5% v/v MeOH) was added, and the sample was heated to 100°C for 30 minutes under continuous stirring. Protein content was quantified using a Micro-BCA kit (Thermo Scientific, Waltham, MA, USA) and a microplate spectrophotometer (Mindray MR-96A, microplate reader, Mindray Medical International Ltd, Shenzhen, Guangdong, China). A calibration curve was generated using Bovine Serum Albumin (BSA) as the standard.
2.5.3. Carbohydrate Determination
2 mg of lyophilized algal biomass was treated with 1 mL of 2.5 M HCl and incubated at 100°C for 3 hours under continuous stirring to hydrolyze polysaccharides, oligosaccharides, and disaccharides into monosaccharides. The hydrolyzed solution was neutralized with 2.5 M NaOH and centrifuged. Carbohydrate content was measured using the phenol-sulfuric acid method, where samples were treated with 1 mL of 1% (w/v) phenol solution and 5 mL of 96% (w/w) sulfuric acid. Absorbance was measured at 483 nm (Lamda 35, Perkin Elmer, Akron, OH, USA) [28]. A D-glucose calibration curve was used to calculate carbohydrate concentration, expressed as glucose equivalents.
2.5.4. Lipid Determination
Lipid content was quantified using the Bligh and Dyer extraction method [29]. Lyophilized algal biomass (5 mg) was treated with a solvent mixture of methanol, chloroform, and distilled water (2:1:0.8 v/v). The suspension was sonicated in an ice bath for 20 minutes at 50% amplitude (Vibra Cell VC-505, Sonics & Materials, Newtown, CT, USA). After centrifugation, the solvent was collected. The extraction was repeated three times to maximize lipid recovery. Subsequently, 3 mL chloroform, 3 mL methanol, and 2.7 mL distilled water (2:2:1.8 v/v) were added to the solvent phase. The lower phase, containing lipids, was separated, dried at 45°C overnight, and weighed using a precision microbalance (XP 105, Mettler Toledo, Greifensee, Switzerland) to determine the total lipid content.
2.5.5. Fatty Acid Profile Analysis
Fatty acid contents were determined by gas chromatography (GC-FID) using a Shimadzu GC-2010 Plus High-End Gas Chromatograph (Shimadzu Europa GmbH, Duisburg, Germany) equipped with a Flame Ionization Detector (FID) after lipid extraction by the Soxhlet procedure [30]. The extracted fatty acids were trans-esterified in a methanolic potassium hydroxide solution, and the FAME samples were analyzed. A Supelco SP2560 column (100 m × 0.25 mm × 0.20 μm; Merck KGaA, Darmstadt, Germany) was used for separation. Helium (grade 99.999%) was employed as the carrier gas at a flow rate of 2 mL/min. The injection volume was 1 μL with a split ratio of 1:20, and the injector and detector temperatures were set at 250 °C. The temperature program was as follows: initial oven temperature at 110 °C (7 min), increasing at 3 °C/min to 190 °C (2 min), followed by a first step at 0.5 °C/min to 205 °C, a second at 5 °C/min to 230 °C (5 min), and a final step at 5 °C/min to 240 °C, held for 5 min. The total run time was 82.67 min. Results were identified using GC solution software by comparing certified reference material’s (CRM47885, Supelco® 37 Component FAME Mix, Sigma Aldrich) retention time peaks with the r.t. peaks of samples. Fatty acid values, including SFA, MUFA, and PUFA, were expressed as weight percentages (% of total FAs).
2.5.6. Volatile Solids (VS) Analysis
Initially, the sample was dried and weighed in a pre-dried and pre-weighed dish. The dish with the sample was then ignited in a muffle furnace at 550°C for 4 hours. After ignition, the dish was cooled in a desiccator to room temperature and weighed again. The difference in weight before and after ignition represented the volatile solids content. This method was based on the Fixed and Volatile Solids Ignited at 550°C protocol according to APHA 2540-E [31].
2.6. Biochemical Methane Potential (BMP) Test
The biochemical methane potential was determined using a Bioprocess Gas Endeavour AMPTS® III system (S/N: 1100-2100-5100-1235; BPC Instruments (Haining) Co. Ltd., Haining, China) following Bioprocess Control protocols. The system consisted of fifteen 500 mL Duran Schott bottles (400 mL working volume, 100 mL headspace) submerged in a thermostatic water bath. Biogas production was measured volumetrically via a water displacement method using a graduated cylinder connected to the bottle headspace via a gas outlet. Teflon caps sealed each bottle.
The substrate quantity added to each bottle was calculated using the following equation:
Where:
- mi: Mass of inoculum (g)
- mtot: Total mass in the bottle (400 g)
-
VSs: Volatile solids in the substrate
- VSi: Volatile solids in the inoculum
- ISR: Inoculum-to-substrate ratio, defined as:
This ratio followed the guidelines provided by the manufacturer [32].
Bioreactors containing both inoculum and substrate (samples) and inoculum only (blanks) were purged with nitrogen gas for 2 minutes to establish anaerobic conditions. The bioreactors were then incubated in a thermostatic water bath at a mesophilic temperature (40°C) for 30 days. Biogas production was monitored daily.
Biochemical methane potential (BMP) is defined as the volume of methane produced per unit amount of organic substrate material added to the reactor and can be expressed by the following equation:
where:
VS: Accumulated volume of biomethane from the reactor containing the sample (substrate and inoculum).
VI: Volume of biomethane produced by the inoculum present in the sample bottle.
mVS,SS: Amount of organic material (substrate) contained in the sample bottle.
This equation quantifies the efficiency of methane production from the added organic substrate material under the given experimental conditions.
2.7. Energy Output (kJ) Based on the Biogas Production Potential
The energy output (EE) was calculated using the formula:
E(kJ)=BMP (L CH4/g VS)×VS (g)×Methane Energy Content (kJ/L)
Values for BMP and VS were derived from experimental data, while methane energy content was taken as 35.8 kJ/L.
2.8. Statistical Analysis
Descriptive statistics, including mean, median, standard deviation, and relative standard deviation, were calculated using Minitab v22 and MS Excel. Statistical analysis focused on the 15-day culture data, where lipid accumulation peaked in CSO. ANOVA was performed to evaluate the effects of treatments, species, and cultivation conditions, with prior checks for normality using the Shapiro-Wilk test and variance homogeneity using Levene’s test. Fisher’s LSD test, widely used in microalgae studies, was applied for its sensitivity in identifying treatment effects without complex adjustments for multiple comparisons [33]. Z-normalization was employed to standardize data across experiments, minimizing variability caused by extraneous factors and enhancing the detection of biological signals. This method, commonly applied in high-throughput studies such as RNA-seq and microarray analyses, has been demonstrated to improve comparative analysis accuracy and biological interpretation [34,35].
3. Results and Discussion
3.1. Optical Density and Biomass Production
The growth of CSO and CVU was evaluated across different media, including a standard medium (BG11) and anaerobic digestate effluent (ADE) at varying concentrations and under stress conditions, to assess the influence of nutrient availability and stress on microalgal growth (Table 2, Figure 1). Optical density (OD) measurements, a proxy for biomass concentration, revealed significant differences between species and across media, as determined by ANOVA and Fisher's LSD post-hoc test. CSO consistently displayed significantly higher OD values than CVU across all tested conditions (BG11, ADE3, ADE5_nostress, ADE5_stress), signifying a faster growth rate for CSO under all investigated conditions. This difference might stem from inherent genetic variations influencing metabolic efficiencies, nutrient uptake, or cellular division mechanisms. Alternatively, it could reflect varying tolerances to specific growth conditions, such as nutrient availability or stress, impacting their resource assimilation and biomass production. Both species achieved their highest ODs in BG11, demonstrating optimal growth in this nutrient-replete medium [36]. This underscores the importance of nutrient availability for rapid microalgal growth, with BG11 providing a balanced supply of essential nutrients. Cultivation in ADE3 resulted in lower ODs than BG11, suggesting suboptimal growth possibly due to an incomplete nutrient profile or the presence of inhibitors in ADE [37,38]. The ADE5 treatments, particularly under stress (ADE5_stress), further diminished ODs, indicating the detrimental effect of increased ADE concentration and stress, potentially induced by nutrient limitation [39]. The higher ADE concentration in ADE5 likely amplified the stress response, resulting in the lowest OD values. The difference between ADE5_nostress and ADE5_stress indicates the effectiveness of the experimental stress induction in impacting microalgal growth. CSO’s consistently higher ODs suggest a greater tolerance to the potentially stressful conditions of ADE [40] implying its suitability for large-scale cultivation in wastewater for bioremediation and biomass production [41]. These findings underscore the importance of optimizing media composition and stress levels for maximizing microalgal growth in ADE [42,43]. Dry cell weight (DCW) data further substantiated these findings (Table 2, Figure 1). Similar to the OD data, CSO demonstrated significantly higher DCW than CVU in all media, suggesting a consistently faster growth rate and better adaptability to variations in the growth conditions, similar to observations in other microalgal wastewater studies [44]. Both species attained peak biomass in BG11 indicating the validity of the experimental setup. emphasizing its ideal nutrient composition for growth [36]. The growth rates observed in BG11 are comparable to those reported for Chlorella species in other studies [45,46,47]. Culturing in ADE3 led to reduced biomass for both species, albeit with CSO showing higher tolerance. The ADE5 treatments, particularly under stress, caused further declines, emphasizing the negative consequences of increased ADE concentration and stress on growth [39,48].The stress factor significantly impacted DCW, potentially due to nutrient limitations in the richer media or stress-induced metabolic changes. Both species exhibited higher biomass in ADE3 compared to stressed ADE5, highlighting the importance of optimizing nutrient levels and minimizing stress for growth maximization. These results, along with findings from studies on Chlorella in wastewater treatment [49,50,51,52], indicate the potential of CSO for ADE cultivation but underscore the need for optimized nutrient levels and stress minimization for high biomass yields.
Chlorophyll content analysis, reflecting photosynthetic activity, revealed CSO consistently exhibited higher chlorophyll a concentrations than CVU [50], suggesting greater photosynthetic capacity (Table 2, Figure 1). Both species had peak chlorophyll a in BG11, emphasizing its support for optimal photosynthetic activity. Lower chlorophyll content in ADE3 and ADE5, particularly under stress, points to the detrimental effects of suboptimal nutrient conditions and stress on photosynthetic processes [53]. CSO’s superior chlorophyll levels support its suitability for ADE cultivation, but also emphasize the need for optimizing ADE conditions to enhance photosynthetic efficiency. Carotenoid content analysis showed a distinct pattern. While BG11 supported high carotenoid levels in both species [54], there was no significant interspecies difference, suggesting similar carotenoid biosynthesis potential. ADE3 and ADE5 treatments led to decreased carotenoid content, especially in CVU, demonstrating the influence of ADE and stress on pigment production [37,55]. Notably, CSO consistently had higher carotenoid levels than CVU, especially in ADE5, showcasing its tolerance to ADE and stress [40,56,57]. These observations, along with existing knowledge on stress effects on pigment production [58], suggest CSO’s potential for carotenoid production in ADE, necessitating further optimization studies.
3.2. Protein Accumulation
Analyzing protein content in CVU and CSO cultivated in BG11, ADE3 (3% anaerobic digestate effluent), ADE5_stress (5% ADE with stress), and ADE5_nostress reveals distinct accumulation patterns influenced by species and environmental factors (Table 3, Figure 2). In BG11, CSO had higher protein content (35.67%) than CVU (39.40%), potentially reflecting inherent differences in protein synthesis capacity, with CSO possibly adapted to utilizing organic nitrogen from digestate [59]. In ADE3, both species showed increased protein content (CSO at 39.80%, CVU at 35.33%), suggesting ADE's complex nutrient profile stimulates protein synthesis, though more pronounced in CSO, possibly indicating better organic nitrogen utilization [60]. Under ADE5_stress, both species experienced significant protein reduction (CVU to 13.00%, CSO to 31.63%), attributed to stress-induced redirection of resources towards lipid accumulation, a survival strategy under nitrogen starvation [39,49,61]. However, CSO maintained higher protein content, suggesting greater stress resilience. In ADE5_nostress, CVU protein slightly increased (29.70%), nearing BG11 levels, while CSO slightly decreased (28.83%), indicating complex interactions between species, nutrient availability, and potential ADE inhibitors at higher concentrations. CSO's consistently higher protein content in ADE suggests better protein biosynthesis capacity and ADE nutrient utilization. Observed differences may relate to variations in genetic background, metabolic pathways, and adaptations to nutrient environments. ADE composition (nitrogen sources, growth promoters/inhibitors), stress induction, and microalgae-bacteria interactions also contribute. Comparing these results with literature reveals interesting points. The highest observed protein content (39.80% in CSO in ADE3) is lower than some reported values (e.g. 65.2% in C. pyrenoidosa by Safafar et al. [54], possibly due to strain variations, wastewater composition, or cultivation differences. CVU protein content in BG11 aligns with literature [59]. The protein reduction in stressed CVU aligns with the trend of nitrogen starvation promoting lipid accumulation over protein synthesis [49,61]. This study provides insights into protein accumulation dynamics under different ADE conditions and stress, emphasizing species-specific responses and the importance of optimized cultivation strategies for targeted protein or lipid production.
3.3. Carbohydrates Accumulation
Analyzing carbohydrate content in CVU and CSO cultivated in BG11, ADE3 (3% anaerobic digestate effluent), ADE5_stress (5% ADE with stress), and ADE5_nostress (5% ADE without stress) reveals distinct accumulation patterns influenced by species-specific metabolism and environment (Table 3, Figure 2). These variations reflect the balance between carbon allocation for carbohydrate storage, lipid biosynthesis, and protein synthesis, modulated by nutrient availability and stress. In BG11, CSO exhibited higher carbohydrate content (31.7%) than CVU (29.8%), suggesting inherent metabolic variations, potentially prioritizing carbohydrate storage under nutrient-rich conditions [62]. In ADE3, CVU carbohydrate content increased (12.1%), surpassing CSO which decreased (19.2%), suggesting differential ADE nutrient utilization, possibly due to varied organic carbon assimilation efficiency or inhibitory compounds [63,64]. Under ADE5_stress, CVU carbohydrate content decreased (20.4%), potentially prioritizing lipid accumulation under stress [65,66,67,68],while CSO remained relatively stable (15.4%), possibly demonstrating stress resilience [62]. In ADE5_nostress, both species' carbohydrate content increased (CSO to 32.6% and CVU to 19.8%), indicating higher ADE concentrations without stress favor carbohydrate accumulation due to increased organic carbon [69,70].
These species-specific responses to ADE and stress underscore the importance of tailored cultivation strategies. Cell dilution during a two-stage process, coupled with stress from high light intensity and nitrogen limitation, can significantly enhance carbohydrate productivity, reaching impressive levels for biofuel feedstock production [70]. However, other nutrient limitations like phosphorus and sulfur might not improve productivity despite increasing carbohydrate content. Polyploid cell formation under stress, observed through flow cytometry, correlates with higher carbohydrate accumulation, potentially linking nutrient limitation and light stress to cell cycle regulation and carbon allocation [71]. These findings align with existing research highlighting nitrogen limitation as a driver of carbohydrate accumulation [66,72,73]. Comparing the results with similar studies on different species [74,75] suggests that species-specific responses and interactions with other environmental factors play a crucial role. Differences in carbohydrate accumulation patterns are likely due to genetic and metabolic pathway variations [76], species adaptations to nutrient environments, ADE composition (nutrients and inhibitory compounds), stress induction method such as nitrogen starvation, and microalgae-bacteria interactions in ADE [77]. This necessitates strain selection and growth condition optimization, including ADE concentration, stress induction, and nutrient balance, for targeted carbohydrate or lipid production. This integrated analysis helps tailor cultivation strategies, maximizing desired bioproduct yields from microalgae for a sustainable bioeconomy.
3.4. Lipids Accumulation
Analyzing lipid production in CVU and CSO cultivated in BG11, ADE3 (3% anaerobic digestate effluent), ADE5_stress (5% ADE with stress), and ADE5_nostress reveals a complex interplay between species-specific metabolism and environmental factors (Table 3, Figure 2). In BG11, both species showed similar lipid contents (16.4%), suggesting comparable lipid biosynthesis capacities under optimal nutrient conditions [78]. However, in ADE3, CVU exhibited a marked increase in lipid content (37.5%), demonstrating ADE's stimulatory effect on lipid biosynthesis, likely due to its rich organic carbon and nutrient profile [79,80]. CSO also showed increased lipid content in ADE3 (24.1%), but less pronounced than CVU, possibly due to inherent metabolic differences and adaptations to nutrient environments. Increasing ADE concentration to 5% without stress (ADE5_nostress) slightly decreased lipid content in CVU (34.9%), suggesting potential inhibitory effects of higher ADE concentrations in the absence of stress [63], possibly due to accumulated inhibitory compounds or a suboptimal nutrient balance. In contrast, CSO in ADE5_nostress accumulated 22% lipids, still lower than CVU. Under ADE5_stress, CVU lipid content increased dramatically (51.6%), highlighting stress-induced such like salt stress redirection of metabolic flux towards lipid accumulation as a survival mechanism [67,78]. CSO showed a moderate increase under stress (36.7%), significantly lower than CVU, potentially reflecting a different stress response or adaptation to the ADE environment [62,64], possibly prioritizing other survival mechanisms [81]. These interspecies differences likely arise from variations in genetic background, metabolic pathways, adaptation to different nutrient environments, ADE composition, stress induction methods, and microalgae-bacteria interactions. CVU might possess more efficient lipid biosynthesis pathways or a stronger response to salt-induced stress. CSO's adaptation to digestate might lead to a less pronounced stress response. These observations align with literature highlighting nitrogen starvation as a key trigger for lipid accumulation [67,78], while acknowledging species-specific tolerances and adaptations to stress [81].
Additionally, ADE's composition, including organic carbon and nutrient levels, along with the presence of potential inhibitory compounds, can further influence lipid accumulation [63,80]. The findings emphasize the potential of ADE, particularly under stress, for enhancing lipid production in Chlorella while underscoring the importance of strain selection and optimized growth conditions (ADE concentration, stress induction, nutrient balance) for maximizing lipid yields and developing efficient microalgae-based biofuel systems. Future research should explore the underlying molecular mechanisms driving these variations, including investigating the metabolic pathways involved in lipid biosynthesis, stress responses, and the impact of ADE's complex composition, including microalgae-bacteria interactions. This will enable tailoring cultivation strategies to maximize lipid production based on both species and intended biofuel applications. Further exploration into how factors like growth phase influence lipid content, particularly within nitrogen-limited ADE media, combined with exploring effective lipid extraction and purification strategies, is also important [82,83]. These combined approaches will optimize cost-effective and environmentally sustainable strategies for producing biofuels from microalgae cultivated in ADE, contributing to broader sustainable energy initiatives.
3.5. Fatty Acid Methyl Ester (FAME) Profiles
Analyzing the fatty acid methyl ester (FAME) profiles of CSO (Figure 3) and CVU (Figure 4) cultivated in 5% anaerobic digestate effluent (ADE5), without induced stress, reveals insights into their lipid composition and biodiesel production potential. FAME analysis reveals variations in fatty acid profiles reflecting the influence of growth medium on fatty acid biosynthesis, impacting biodiesel quality.
In ADE5 without stress, CSO showed a higher percentage of palmitic acid methyl ester (C16:0), a saturated fatty acid (SFA), at 29.13% compared to CVU at 17.27%. Palmitic acid contributes to biodiesel stability but can increase viscosity and cloud point (Knothe 2008). CSO had lower palmitoleic acid methyl ester (C16:1) (7.17%) than CVU (5.00%). Both had relatively low stearic acid methyl ester (C18:0) percentages. CSO had significantly higher oleic acid methyl ester (C18:1) (33.47%) than CVU (28.67%). Oleic acid is desirable in biodiesel for oxidative stability and cold flow [84,85]. Conversely, CVU had higher linoleic acid methyl ester (C18:2) (19.07%) than CSO (11.80%). Linoleic acid, while beneficial for cold flow, can negatively affect oxidative stability. CSO had lower linolenic acid methyl ester (C18:3) (3.57%) than CVU (12.67%). Overall, CSO had a higher SFA proportion (31.63%) than CVU (20.43%), mainly due to higher palmitic acid. CVU showed a higher polyunsaturated fatty acid (PUFA) proportion (31.73%) than CSO (15.37%), primarily due to higher linoleic and linolenic acid levels. Both had comparable monounsaturated fatty acid (MUFA) proportions, with CSO slightly higher (40.63% vs. 33.67%), mainly due to the higher oleic acid, contributing to favorable biodiesel properties. These differences suggest ADE5 influences fatty acid biosynthesis pathways, likely due to its complex nutrient environment compared to standard media [37].
The higher SFA content in CSO might enhance membrane stability or energy storage, while higher PUFAs in CVU could relate to membrane fluidity or stress response [86]. Comparing these findings with studies on other Chlorella species grown under different conditions [87,88] highlights variations in FAME profiles, emphasizing the influence of cultivation conditions (e.g., heterotrophic vs. photoautotrophic) and species-specific metabolism on fatty acid biosynthesis [49,87]. The observed FAME profiles impact biodiesel properties. Higher SFAs in CSO suggest increased biodiesel stability but potentially higher viscosity and cloud point. Higher PUFAs in CVU could improve cold flow but compromise oxidative stability, possibly necessitating antioxidants. The higher oleic acid in CSO benefits both stability and cold flow. Further analysis is needed to determine if the biodiesel produced meets standards like EN 14214 or ASTM D6751 [85]. Optimizing FAME composition could involve exploring different extraction methods [89], manipulating growth conditions [49,87], and potentially genetic modification. Further research into the mechanisms by which ADE5 influences fatty acid biosynthesis, including gene expression analysis and nutrient component impact, and exploring interactions within the ADE5 microbial community, would enable tailored lipid composition for optimal biodiesel production.
3.6. BMP: Influence of Anaerobic Digestate Effluent and Stress
Analyzing the biochemical methane potential (BMP) of CVU and CSO cultivated in different media—BG11 (control), ADE3 (3% anaerobic digestate effluent), ADE5_stress (5% ADE with stress), and ADE5_no stress (5% ADE without stress)—reveals distinct patterns influenced by species, nutrient availability, and stress responses (Table 4). BMP, a key indicator of bioenergy potential, reflects the interplay between biomass biochemical composition (carbohydrate, protein, and lipid content) and anaerobic digestion efficiency.
In BG11, CVU showed a slightly higher BMP (414.47 mL CH4g VS) than CSO (407.10 mL CH4g VS), suggesting similar methane production potential under optimal conditions, potentially due to subtle differences in biochemical composition impacting biodegradability. This aligns with previous research on Chlorella species’ biogas potential, with methane yields ranging from 140 to 360 dm³/kg VS [90]. In ADE3, both species exhibited a decrease in BMP (CVU at 408.07 mL CH4/g VS and CSO at 399.27 mL CH4/g VS), suggesting that even low ADE concentrations might introduce inhibitory compounds or negatively alter biomass composition, potentially through ammonia or heavy metal inhibition [91], or changes in substrate degradability due to the shift from defined to complex organic media. A stark contrast emerged under ADE5_stress: CVU BMP increased substantially to 432.80 mL CH4g VS (highest among all treatments), while CSO BMP decreased to 418.33 mL CH4g VS. This species-specific stress response highlights its impact on bioenergy potential. The increased BMP in stressed CVU could be due to stress-induced lipid accumulation [39,92], enhancing methane yield, whereas CSO may prioritize different survival mechanisms over lipid accumulation under stress. In ADE5_no stress, both CVU (409.17 mL CH4g VS) and CSO (407.90 mL CH4/g VS) maintained BMPs similar to BG11, indicating that higher ADE concentration without stress doesn't significantly affect bioenergy potential. The slight decrease in CVU might be due to potential inhibitor accumulation or less favorable composition at higher ADE concentrations, while CSO appears less sensitive to higher ADE without stress. These species-specific BMP differences under varying ADE conditions and stress could stem from distinct genetic backgrounds influencing biochemical composition, varying metabolic stress responses (particularly lipid accumulation under salt stress), ADE composition (inhibitory compounds and nutrient availability), and microalgae-microbial community interactions in ADE impacting anaerobic digestion. The fatty acid methyl ester (FAME) profiles provide further insights into the influence of ADE5 on Chlorella lipid composition, linking it to both BMP and potential biodiesel properties. CSO in ADE5_no stress showed higher saturated fatty acids (SFAs) (31.63%) than CVU (20.43%), primarily due to higher palmitic acid (C16:0), impacting biodiesel stability and cold flow properties [85]. CVU exhibited higher polyunsaturated fatty acids (PUFAs) (31.73%) than CSO (15.37%), mainly from higher linoleic (C18:2) and linolenic (C18:3) acids, improving cold flow but potentially compromising oxidative stability [84]. Both species had comparable MUFAs, with CSO having slightly more oleic acid (C18:1), benefiting both oxidative stability and cold flow. Optimizing FAME composition might involve varying extraction methods [89] or manipulating growth conditions [49,93]. Further biodiesel characterization is crucial to check compliance with standards like EN 14214 or ASTM D6751 [85]. Overall, this combined analysis offers valuable insights into the BMP and FAME profiles of CVU and CSO under different conditions, highlighting the influence of ADE and stress on both methane production and fatty acid composition. These findings emphasize the need for tailored cultivation strategies and pretreatment methods, considering both biogas and biodiesel production potential. Further research should explore the genetic and metabolic mechanisms underpinning the observed differences, including specific responses to ADE and stress, impacting biochemical pathways. This will contribute to developing more efficient and sustainable biofuel production strategies using Chlorella. Exploring methods to enhance methane production, like enzymatic hydrolysis [14] or thermal pretreatments [94], is crucial. Optimizing cultivation parameters and characterizing the anaerobic microbial communities involved can further refine microalgae-based biofuel production. Investigating interactions between microalgae and bacteria in ADE during cultivation, and their impact on BMP and FAME profiles, could lead to optimized algal-bacterial systems for wastewater treatment and biofuel generation. This holistic approach combining biomass growth, BMP, FAME analysis, and consideration of existing literature offers a comprehensive view, paving the way for sustainable biofuel strategies utilizing Chlorella species.
3.7. Impact of Thermal Pretreatment and Energy Efficiency of Thermal Pretreatment for Enhanced Methane Production
Figures 5a and 5b present the Biochemical Methane Potential (BMP) of CSO and CVU under varying thermal pretreatment conditions and an untreated control, measured over 30 days. For CSO, pretreatment at 90°C for 4 and 10 hours (90_4 and 90_10) and 40°C for 10 hours (40_10) enhanced methane production compared to the control, with the highest BMP observed in the 90_10 condition. CVU showed a different trend, with 40°C pretreatments (40_4 and 40_10) resulting in lower BMP than the control. However, 90°C pretreatments (90_4 and 90_10) substantially increased methane production, with 90_10 yielding the highest BMP. This suggests that higher temperatures and longer durations are more effective for enhancing methane production, particularly in CVU, while CSO may also benefit from milder conditions. Both species displayed increased BMP during the initial days of the process, with gradual stabilization observed toward the end, indicating similar digestion patterns despite differences in the effects of pretreatment.
Thermal pretreatment significantly influences both biochemical methane potential (BMP) and the energy efficiency of anaerobic digestion using Chlorella biomass. Applying thermal pretreatment at various temperature-time combinations alters the biomass structure, impacting subsequent methane production and the overall energy balance. Table 5 presents BMP and energy efficiency data for CSO and CVU subjected to different pretreatment conditions (40_4, 40_10, 90_4, and 90_10), compared to the untreated control. For CSO, BMP generally increased with increasing temperature and pretreatment time. Pretreatment at 40°C (40_4) resulted in a BMP of 407 mL CH4/g VS, similar to the control (407 mL CH4/g VS). Extending the pretreatment time to 10 hours (40_10) significantly enhanced BMP to 472 mL CH4/g VS, indicating that longer exposure to mild heat can improve biomass digestibility. At 90°C, the 4-hour treatment (90_4) yielded 425 mL CH4/g VS, and a longer duration of 10 hours (90_10) further increased BMP to 448 mL CH4/g VS, higher than the BMP obtained with the lower temperature pretreatments. This suggests that higher temperatures promote more effective cell wall disruption and release of intracellular substrates, although the magnitude of BMP enhancement might plateau with extended pretreatment durations. However, increased pretreatment severity comes at an energetic cost, reflected in the energy efficiency values. The 40_4 pretreatment, with the lowest energy input, exhibited the highest energy efficiency (2.67%). As the temperature and duration increased, the energy efficiency decreased, with the 90_10 pretreatment displaying the lowest value (0.49%). This trade-off between BMP and energy efficiency highlights the importance of optimizing pretreatment parameters to maximize methane yield while minimizing energy expenditure. CVU exhibited a different response pattern. Pretreatments at 40°C (40_4 and 40_10) resulted in BMP values of 380 and 387 mL CH4/g VS, respectively, showing less BMP improvement compared to CSO and less than control (415 mL CH4/g VS). However, 90°C pretreatments significantly enhanced methane production, reaching 474 mL CH4/g VS (90_4) and 481 mL CH4/g VS (90_10), indicating greater cell disruption and release of intracellular substrates. This species showed greater BMP improvement than CSO, highlighting the highest methane production achieved through the BMP experiment. Similar to CSO, energy efficiency decreased as the severity of pretreatment for CVU increased. While 40_4 had the highest energy efficiency (2.54%), likely due to low energy input, the 90_10 pretreatment showed the lowest energy efficiency (0.55%). These species-specific variations in BMP and energy efficiency indicate the importance of optimizing pretreatment conditions for each species to maximize methane yield and minimize energy input. While milder conditions (40_4) might be energetically favorable for CSO, more severe treatments (90_10) benefit CVU despite higher energy demands. This aligns with literature suggesting that algal species display diverse susceptibilities to thermal pretreatment, influencing their methane production potential and energy requirements for cell disruption [94,95]. The biochemical composition of each species and its alteration due to pretreatment also plays a role in impacting methane yield [96]. The interaction between microalgae and the microbial community during cultivation can further influence biomass digestibility and response to thermal treatment, affecting methane production during AD [97]. Integrating energy efficiency analysis alongside BMP assessment is crucial for selecting sustainable biogas production strategies. This combined approach considers the economic and environmental viability of microalgae-based biogas production by evaluating both methane yield and the energy balance of the process. The observed trade-offs between BMP and energy efficiency across different species and pretreatments suggest that a balanced approach is essential for maximizing bioenergy production from microalgae. Further research on characterizing the structural and biochemical changes due to thermal treatment, and their influence on microbial communities during AD [91], is crucial for optimizing pretreatment conditions that maximize both methane output and energy efficiency. By considering both the potential methane yield and energy efficiency of different thermal pretreatments, we can develop more sustainable and cost-effective biogas production strategies utilizing Chlorella.
3.7. Economic Feasibility and Scalability of Implementation in Industrial Biofuel Production Plans
The combined use of salt-induced stress and thermal pretreatment optimizes biofuel outputs from Cultivating Chlorella species significantly enhancing lipid accumulation and methane yields. Economically, the approach capitalizes on cost-effective substrates such as ADE, reducing dependency on synthetic nutrients and integrating waste valorization into the production process including waste heat from the cogeneration of heat and power units (CHP) in typical biogas plants. This aligns with circular economy principles, contributing to sustainability. However, scalability challenges arise in maintaining consistent stress conditions and achieving energy-efficient thermal pretreatment. While thermal pretreatment at higher temperatures boosts methane yields, energy inputs may offset gains if not optimized. The energy efficiency of milder treatments demonstrates potential but requires balancing against biofuel outputs. Industrial adoption would benefit from modular photobioreactor designs and tailored stress and pretreatment protocols suited for specific strains like CVU or CSO. Species-specific lipid and biodiesel profiles further necessitate targeted strategies to meet industrial quality standards. Investments in pilot-scale testing, energy modeling, and integration with existing wastewater facilities will determine economic viability. This method offers a scalable framework for industrial biofuel systems with advancements in pretreatment technologies and energy efficiency optimization. Lifecycle assessments are needed to comprehensively evaluate economic and environmental impacts, considering factors such as land use, water footprint, and greenhouse gas emissions. Ultimately, market demand for both biodiesel and biogas will strongly influence the economic feasibility of large-scale implementation.
4. Conclusions
The study investigated the combined effects of salt-induced stress and thermal pretreatment on biofuel production from Chlorella sorokiniana and Chlorella vulgaris cultivated in anaerobic digestate effluent (ADE). Results revealed distinct species-specific responses to the treatments, highlighting the importance of tailored strategies for maximizing biofuel output. Salt stress significantly increased lipid content in C. vulgaris by up to 51.6%, positioning it as a promising candidate for biodiesel production. Conversely, C. sorokiniana exhibited higher protein levels and a superior biodiesel quality profile due to its enriched oleic acid content. Thermal pretreatment further enhanced methane yields for biogas production, with a maximum achieved at 90°C for 10 hours. However, milder thermal conditions proved more energy-efficient, particularly for C. sorokiniana, suggesting a potential trade-off between methane yield and energy input. The utilization of ADE as a growth medium offers economic and environmental advantages by incorporating a low-cost nutrient source and promoting waste valorization, aligning with circular economy principles. The study's findings suggest that integrating ADE and scalable thermal treatments could reduce production costs and the environmental impact of biofuel industries. While this research demonstrates a promising approach to enhance biofuel production, further investigations are needed to address the energy demands of thermal pretreatment and evaluate the long-term effects of ADE variability on microalgal growth and biofuel yields. Future research could investigate the molecular pathways driving species-specific stress responses, explore hybrid pretreatment methods combining thermal and enzymatic approaches, optimize reactor designs for large-scale cultivation, and conduct lifecycle assessments to fully evaluate the sustainability of this integrated biofuel production strategy. This study demonstrates that tailored cultivation and pretreatment strategies can significantly enhance biofuel outputs from Chlorella species, paving the way for sustainable and economically viable industrial applications.
Author Contributions
Conceptualization, T.S.; methodology, T.S. and P.S.; software, T.S., P.S. and T.K.; validation, T.S. and S.G.; formal analysis, T.S. and S.G.; investigation, T.S., S.G., and P.S.; resources, T.S.; data curation, T.S. and S.G.; writing—original draft preparation, T.S. and S.G.; writing—review and editing, T.S., S.G., P.F., P.S. and T.K.; visualisation, T.S. and S.G.; supervision, T.S., T.K. and P.S.; project administration, T.S.; funding acquisition, T.S. All authors have read and agreed to the published version of the manuscript.
Funding
This research was co-funded by the European Union’s Horizon Europe Innovation Action HORIZON-CL5-2022-D3-02 (Sustainable, secure and competitive energy supply), under the “Accelerating the sustainable production of advanced biofuels and RFNBOs - from feedstock to end-use” (FUELPHORIA) project (Grant Agreement No. 101118286). Views and opinions expressed are however those of the author(s) only and do not necessarily reflect those of the European Union or CINEA. Neither the European Union nor CINEA can be held responsible for them.
Data Availability Statement
The data presented in this study are available, upon request, from the corresponding author.
Acknowledgments
The authors wish to acknowledge operational manager Apostolos Polychrous of Biogas Lagada S.A. for the industrial tests and the provision of appropriate quantities of digestate. The authors also wish to acknowledge all staff members of Qlab P.C. for their individual roles that contributed to the implementation of this study, thank you Georgios Samiotis, Matthaios Panou, Vassiliki Tsioni, and Panagiotis Pantazis.
Conflicts of Interest
The authors declare no conflict of interest.
References
- Mendez, L.; Mahdy, A.; Ballesteros, M.; González-Fernández, C. Methane production of thermally pretreated Chlorella vulgaris and Scenedesmus sp. biomass at increasing biomass loads. Appl. Energy 2014, 129, 238–242. [Google Scholar] [CrossRef]
- Mendez, L.; Mahdy, A.; Ballesteros, M.; González-Fernández, C. Biomethane production using fresh and thermally pretreated Chlorella vulgaris biomass: A comparison of batch and semi-continuous feeding mode. Ecol. Eng. 2015, 84, 273–277. [Google Scholar] [CrossRef]
- Rahman, Q.M.; Zhang, B.; Wang, L.; Shahbazi, A. A combined pretreatment, fermentation and ethanol-assisted liquefaction process for production of biofuel from Chlorella sp. Fuel 2019, 257, 116026. [Google Scholar] [CrossRef]
- Marsolek, M.D.; Kendall, E.; Thompson, P.L.; Shuman, T.R. Thermal pretreatment of algae for anaerobic digestion. Bioresour. Technol. 2014, 151, 373–377. [Google Scholar] [CrossRef] [PubMed]
- Bohutskyi, P.; Betenbaugh, M.J.; Bouwer, E.J. The effects of alternative pretreatment strategies on anaerobic digestion and methane production from different algal strains. Bioresour. Technol. 2014, 155, 366–372. [Google Scholar] [CrossRef] [PubMed]
- Giang, T.T.; Lunprom, S.; Liao, Q.; Reungsang, A.; Salakkam, A. Improvement of hydrogen production from Chlorella sp. biomass by acid-thermal pretreatment. PeerJ 2019, 7, e6637. [Google Scholar] [CrossRef] [PubMed]
- Zhen, G.; Lu, X.; Kobayashi, T.; Kumar, G.; Xu, K. Anaerobic co-digestion on improving methane production from mixed microalgae ( Scenedesmus sp., Chlorella sp.) and food waste: Kinetic modeling and synergistic impact evaluation. Chem. Eng. J. 2016, 299, 332–341. [Google Scholar] [CrossRef]
- Passos, F.; Hom-Diaz, A.; Blanquez, P.; Vicent, T.; Ferrer, I. Improving biogas production from microalgae by enzymatic pretreatment. Bioresour. Technol. 2016, 199, 347–351. [Google Scholar] [CrossRef]
- Córdova, O.; Passos, F.; Chamy, R. Enzymatic Pretreatment of Microalgae: Cell Wall Disruption, Biomass Solubilisation and Methane Yield Increase. Appl. Biochem. Biotechnol. 2019, 189, 787–797. [Google Scholar] [CrossRef] [PubMed]
- Gonzalez-Fernandez, C.; Barreiro-Vescovo, S.; De Godos, I.; Fernandez, M.; Zouhayr, A.; Ballesteros, M. Biochemical methane potential of microalgae biomass using different microbial inocula. Biotechnol. Biofuels 2018, 11, 184. [Google Scholar] [CrossRef]
- Cho, S.; Park, S.; Seon, J.; Yu, J.; Lee, T. Evaluation of thermal, ultrasonic and alkali pretreatments on mixed-microalgal biomass to enhance anaerobic methane production. Bioresour. Technol. 2013, 143, 330–336. [Google Scholar] [CrossRef]
- Wang, M.; Lee, E.; Dilbeck, M.P.; Liebelt, M.; Zhang, Q.; Ergas, S.J. Thermal pretreatment of microalgae for biomethane production: experimental studies, kinetics and energy analysis. J. Chem. Technol. Biotechnol. 2017, 92, 399–407. [Google Scholar] [CrossRef]
- Almarashi, J.Q.M.; El-Zohary, S.E.; Ellabban, M.A.; Abomohra, A.E.-F. Enhancement of lipid production and energy recovery from the green microalga Chlorella vulgaris by inoculum pretreatment with low-dose cold atmospheric pressure plasma (CAPP). Energy Convers. Manag. 2020, 204, 112314. [Google Scholar] [CrossRef]
- Mahdy, A.; Mendez, L.; Ballesteros, M.; González-Fernández, C. Autohydrolysis and alkaline pretreatment effect on Chlorella vulgaris and Scenedesmus sp. methane production. Energy 2014, 78, 48–52. [Google Scholar] [CrossRef]
- Mahdy, A.; Ballesteros, M.; González-Fernández, C. Enzymatic pretreatment of Chlorella vulgaris for biogas production: Influence of urban wastewater as a sole nutrient source on macromolecular profile and biocatalyst efficiency. Bioresour. Technol. 2016, 199, 319–325. [Google Scholar] [CrossRef]
- Lizzul, A.M.; Hellier, P.; Purton, S.; Baganz, F.; Ladommatos, N.; Campos, L. Combined remediation and lipid production using Chlorella sorokiniana grown on wastewater and exhaust gases. Bioresour. Technol. 2014, 151, 12–18. [Google Scholar] [CrossRef]
- Juntila, D.J.; Bautista, M.A.; Monotilla, W. Biomass and lipid production of a local isolate Chlorella sorokiniana under mixotrophic growth conditions. Bioresour. Technol. 2015, 191, 395–398. [Google Scholar] [CrossRef] [PubMed]
- Psachoulia, P.; Schortsianiti, S.-N.; Lortou, U.; Gkelis, S.; Chatzidoukas, C.; Samaras, P. Assessment of Nutrients Recovery Capacity and Biomass Growth of Four Microalgae Species in Anaerobic Digestion Effluent. Water 2022, 14, 221. [Google Scholar] [CrossRef]
- Collos, Y.; Harrison, P.J. Acclimation and toxicity of high ammonium concentrations to unicellular algae. Mar. Pollut. Bull. 2014, 80, 8–23. [Google Scholar] [CrossRef]
- Li, H.; Tan, J.; Mu, Y.; Gao, J. Lipid accumulation of Chlorella sp. TLD6B from the Taklimakan Desert under salt stress. PeerJ 2021, 9, e11525. [Google Scholar] [CrossRef] [PubMed]
- Zhang, L.; Pei, H.; Chen, S.; Jiang, L.; Hou, Q.; Yang, Z.; Yu, Z. Salinity-induced cellular cross-talk in carbon partitioning reveals starch-to-lipid biosynthesis switching in low-starch freshwater algae. Bioresour. Technol. 2018, 250, 449–456. [Google Scholar] [CrossRef]
- Srivastava, G.; Nishchal; Goud, V.V. Salinity induced lipid production in microalgae and cluster analysis (ICCB 16-BR_047). Bioresour. Technol. 2017, 242, 244–252. [CrossRef]
- Wang, T.; Ge, H.; Liu, T.; Tian, X.; Wang, Z.; Guo, M.; Chu, J.; Zhuang, Y. Salt stress induced lipid accumulation in heterotrophic culture cells of Chlorella protothecoides : Mechanisms based on the multi-level analysis of oxidative response, key enzyme activity and biochemical alteration. J. Biotechnol. 2016, 228, 18–27. [Google Scholar] [CrossRef]
- Wu, H.; Li, J.; Yang, H.; Liao, Q.; Fu, Q.; Liu, Z. Hydrothermal treatment of Chlorella sp.: Influence on biochemical methane potential, microbial function and biochemical metabolism. Bioresour. Technol. 2019, 289, 121746. [Google Scholar] [CrossRef] [PubMed]
- Wellburn, A.R. The Spectral Determination of Chlorophylls a and b, as well as Total Carotenoids, Using Various Solvents with Spectrophotometers of Different Resolution. J. Plant Physiol. 1994, 144, 307–313. [Google Scholar] [CrossRef]
- Henriques, M.; Silva, A.; Rocha, J. Extraction and quantification of pigments from a marine microalga: a simple and reproducible method. 2007.
- Schwenzfeier, A.; Wierenga, P.A.; Gruppen, H. Isolation and characterization of soluble protein from the green microalgae Tetraselmis sp. Bioresour. Technol. 2011, 102, 9121–9127. [Google Scholar] [CrossRef] [PubMed]
- DuBois, Michel.; Gilles, K.A.; Hamilton, J.K.; Rebers, P.A.; Smith, Fred. Colorimetric Method for Determination of Sugars and Related Substances. Anal. Chem. 1956, 28, 350–356. [CrossRef]
- Bligh, E.G.; Dyer, W.J. A rapid method of total lipid extraction and purification. Can. J. Biochem. Physiol. 1959, 37, 911–917. [Google Scholar] [CrossRef] [PubMed]
- Guihéneuf, F.; Schmid, M.; Stengel, D.B. Lipids and Fatty Acids in Algae: Extraction, Fractionation into Lipid Classes, and Analysis by Gas Chromatography Coupled with Flame Ionization Detector (GC-FID). In Natural Products From Marine Algae; Stengel, D.B., Connan, S., Eds.; Methods in Molecular Biology; Springer New York: New York, NY, 2015; Vol. 1308, pp. 173–190 ISBN 978-1-4939-2683-1. [CrossRef]
- Lipps, W.; Baxter, T.; Braun-Howland, E. Standard Methods Committee of the American Public Health Association, American Water Works Association, and Water Environment Federation. 2540 Solids. In Standard Methods for the Examination of Water and Wastewater; 23rd ed.; Washington DC: APHA Press, 2018.
- Weik, M. Computer Science and Communications Dictionary; 1 edition.; Springer, 2000; ISBN 978-0-7923-8425-0.
- Haji Abolhasani, M.; Safavi, M.; Goodarzi, M.T.; Kassaee, S.M.; Azin, M. Statistical optimization of medium with response surface methodology for biomass production of a local Iranian microalgae Picochlorum sp. RCC486. Adv. Res. Microb. Metab. Technol. 2018, 1. [Google Scholar] [CrossRef]
- Cheadle, C.; Vawter, M.P.; Freed, W.J.; Becker, K.G. Analysis of Microarray Data Using Z Score Transformation. J. Mol. Diagn. 2003, 5, 73–81. [Google Scholar] [CrossRef] [PubMed]
- Wang, B. A Zipf-plot based normalization method for high-throughput RNA-seq data. PLOS ONE 2020, 15, e0230594. [Google Scholar] [CrossRef] [PubMed]
- Markou, G.; Nerantzis, E. Microalgae for high-value compounds and biofuels production: A review with focus on cultivation under stress conditions. Biotechnol. Adv. 2013, 31, 1532–1542. [Google Scholar] [CrossRef] [PubMed]
- Juneja, A.; Ceballos, R.; Murthy, G. Effects of Environmental Factors and Nutrient Availability on the Biochemical Composition of Algae for Biofuels Production: A Review. Energies 2013, 6, 4607–4638. [Google Scholar] [CrossRef]
- Wang, Y.; Guo, W.; Yen, H.-W.; Ho, S.-H.; Lo, Y.-C.; Cheng, C.-L.; Ren, N.; Chang, J.-S. Cultivation of Chlorella vulgaris JSC-6 with swine wastewater for simultaneous nutrient/COD removal and carbohydrate production. Bioresour. Technol. 2015, 198, 619–625. [Google Scholar] [CrossRef] [PubMed]
- Illman, A.M.; Scragg, A.H.; Shales, S.W. Increase in Chlorella strains calorific values when grown in low nitrogen medium. Enzyme Microb. Technol. 2000, 27, 631–635. [Google Scholar] [CrossRef]
- Shriwastav, A.; Gupta, S.K.; Ansari, F.A.; Rawat, I.; Bux, F. Adaptability of growth and nutrient uptake potential of Chlorella sorokiniana with variable nutrient loading. Bioresour. Technol. 2014, 174, 60–66. [Google Scholar] [CrossRef]
- Posadas, E.; Morales, M. del M.; Gomez, C.; Acién, F.G.; Muñoz, R. Influence of pH and CO2 source on the performance of microalgae-based secondary domestic wastewater treatment in outdoors pilot raceways. Chem. Eng. J. 2015, 265, 239–248. [Google Scholar] [CrossRef]
- Brennan, L.; Owende, P. Biofuels from microalgae—A review of technologies for production, processing, and extractions of biofuels and co-products. Renew. Sustain. Energy Rev. 2010, 14, 557–577. [Google Scholar] [CrossRef]
- Chisti, Y. Biodiesel from microalgae. Biotechnol. Adv. 2007, 25, 294–306. [Google Scholar] [CrossRef]
- Bohutskyi, P.; Kligerman, D.C.; Byers, N.; Nasr, L.K.; Cua, C.; Chow, S.; Su, C.; Tang, Y.; Betenbaugh, M.J.; Bouwer, E.J. Effects of inoculum size, light intensity, and dose of anaerobic digestion centrate on growth and productivity of Chlorella and Scenedesmus microalgae and their poly-culture in primary and secondary wastewater. Algal Res. 2016, 19, 278–290. [Google Scholar] [CrossRef]
- Qiao, H.; Wang, G.; Zhang, X. Isolation and Characterization of Chlorella Sorokiniana Gxnn01 (chlorophyta) with the Properties of Heterotrophic and Microaerobic Growth. J. Phycol. 2009, 45, 1153–1162. [Google Scholar] [CrossRef]
- Li, Y.X.; Zhao, F.J.; Yu, D.D. Effect of nitrogen limitation on cell growth, lipid accumulation and gene expression in Chlorella sorokiniana. Braz. Arch. Biol. Technol. 2015, 58, 462–467. [Google Scholar] [CrossRef]
- Chen, X.; Yang, Y.; Lu, Q.; Sun, X.; Wang, S.; Li, Q.; Wei, X.; Wang, Y. The influence of light intensity and organic content on cultivation of Chlorella vulgaris in sludge extracts diluted with BG11. Aquac. Int. 2021, 29, 2131–2144. [Google Scholar] [CrossRef]
- Liska, A.J.; Shevchenko, A.; Pick, U.; Katz, A. Enhanced Photosynthesis and Redox Energy Production Contribute to Salinity Tolerance in Dunaliella as Revealed by Homology-Based Proteomics. Plant Physiol. 2004, 136, 2806–2817. [Google Scholar] [CrossRef] [PubMed]
- Feng, P.; Deng, Z.; Fan, L.; Hu, Z. Lipid accumulation and growth characteristics of Chlorella zofingiensis under different nitrate and phosphate concentrations. J. Biosci. Bioeng. 2012, 114, 405–410. [Google Scholar] [CrossRef]
- Li, T.; Zheng, Y.; Yu, L.; Chen, S. High productivity cultivation of a heat-resistant microalga Chlorella sorokiniana for biofuel production. Bioresour. Technol. 2013, 131, 60–67. [Google Scholar] [CrossRef]
- Cheng, J.; Xu, J.; Huang, Y.; Li, Y.; Zhou, J.; Cen, K. Growth optimisation of microalga mutant at high CO2 concentration to purify undiluted anaerobic digestion effluent of swine manure. Bioresour. Technol. 2015, 177, 240–246. [Google Scholar] [CrossRef] [PubMed]
- Park, J.; Jin, H.-F.; Lim, B.-R.; Park, K.-Y.; Lee, K. Ammonia removal from anaerobic digestion effluent of livestock waste using green alga Scenedesmus sp. Bioresour. Technol. 2010, 101, 8649–8657. [Google Scholar] [CrossRef] [PubMed]
- Abiusi, F.; Wijffels, R.H.; Janssen, M. Doubling of Microalgae Productivity by Oxygen Balanced Mixotrophy. ACS Sustain. Chem. Eng. 2020, 8, 6065–6074. [Google Scholar] [CrossRef]
- Safafar, H.; Uldall Nørregaard, P.; Ljubic, A.; Møller, P.; Løvstad Holdt, S.; Jacobsen, C. Enhancement of Protein and Pigment Content in Two Chlorella Species Cultivated on Industrial Process Water. J. Mar. Sci. Eng. 2016, 4, 84. [Google Scholar] [CrossRef]
- Del Campo, J.A.; Moreno, J.; Rodrı́guez, H.; Angeles Vargas, M.; Rivas, J.; Guerrero, M.G. Carotenoid content of chlorophycean microalgae: factors determining lutein accumulation in Muriellopsis sp. (Chlorophyta). J. Biotechnol. 2000, 76, 51–59. [Google Scholar] [CrossRef] [PubMed]
- Pancha, I.; Chokshi, K.; Maurya, R.; Trivedi, K.; Patidar, S.K.; Ghosh, A.; Mishra, S. Salinity induced oxidative stress enhanced biofuel production potential of microalgae Scenedesmus sp. CCNM 1077. Bioresour. Technol. 2015, 189, 341–348. [Google Scholar] [CrossRef]
- Shi, X.-M.; Liu, H.-J.; Zhang, X.-W.; Chen, F. Production of biomass and lutein by Chlorella protothecoides at various glucose concentrations in heterotrophic cultures. Process Biochem. 1999, 34, 341–347. [Google Scholar] [CrossRef]
- Solovchenko, A.; Lukyanov, A.; Solovchenko, O.; Didi-Cohen, S.; Boussiba, S.; Khozin-Goldberg, I. Interactive effects of salinity, high light, and nitrogen starvation on fatty acid and carotenoid profiles in Nannochloropsis oceanica CCALA 804. Eur. J. Lipid Sci. Technol. 2014, 116, 635–644. [Google Scholar] [CrossRef]
- Becker, E.W. Micro-algae as a source of protein. Biotechnol. Adv. 2007, 25, 207–210. [Google Scholar] [CrossRef]
- Wang, L.; Li, Y.; Chen, P.; Min, M.; Chen, Y.; Zhu, J.; Ruan, R.R. Anaerobic digested dairy manure as a nutrient supplement for cultivation of oil-rich green microalgae Chlorella sp. Bioresour. Technol. 2010, 101, 2623–2628. [Google Scholar] [CrossRef]
- Griffiths, M.J.; Harrison, S.T.L. Lipid productivity as a key characteristic for choosing algal species for biodiesel production. J. Appl. Phycol. 2009, 21, 493–507. [Google Scholar] [CrossRef]
- Ziganshina, E.E.; Bulynina, S.S.; Ziganshin, A.M. Growth Characteristics of Chlorella sorokiniana in a Photobioreactor during the Utilization of Different Forms of Nitrogen at Various Temperatures. Plants 2022, 11, 1086. [Google Scholar] [CrossRef] [PubMed]
- Koutra, E.; Mastropetros, S.G.; Ali, S.S.; Tsigkou, K.; Kornaros, M. Assessing the potential of Chlorella vulgaris for valorization of liquid digestates from agro-industrial and municipal organic wastes in a biorefinery approach. J. Clean. Prod. 2021, 280, 124352. [Google Scholar] [CrossRef]
- Mastropetros, S.G.; Koutra, E.; Amouri, M.; Aziza, M.; Ali, S.S.; Kornaros, M. Comparative Assessment of Nitrogen Concentration Effect on Microalgal Growth and Biochemical Characteristics of Two Chlorella Strains Cultivated in Digestate. Mar. Drugs 2022, 20, 415. [Google Scholar] [CrossRef] [PubMed]
- Sharma, K.K.; Schuhmann, H.; Schenk, P.M. High Lipid Induction in Microalgae for Biodiesel Production. Energies 2012, 5, 1532–1553. [Google Scholar] [CrossRef]
- Ho, S.-H.; Huang, S.-W.; Chen, C.-Y.; Hasunuma, T.; Kondo, A.; Chang, J.-S. Characterization and optimization of carbohydrate production from an indigenous microalga Chlorella vulgaris FSP-E. Bioresour. Technol. 2013, 135, 157–165. [Google Scholar] [CrossRef] [PubMed]
- Ho, S.-H.; Chen, C.-Y.; Chang, J.-S. Effect of light intensity and nitrogen starvation on CO2 fixation and lipid/carbohydrate production of an indigenous microalga Scenedesmus obliquus CNW-N. Bioresour. Technol. 2012, 113, 244–252. [Google Scholar] [CrossRef] [PubMed]
- Chia, M.A.; Lombardi, A.T.; da Graça Gama Melão, M.; Parrish, C.C. Combined nitrogen limitation and cadmium stress stimulate total carbohydrates, lipids, protein and amino acid accumulation in Chlorella vulgaris (Trebouxiophyceae). Aquat. Toxicol. 2015, 160, 87–95. [Google Scholar] [CrossRef] [PubMed]
- Choix, F.J.; de-Bashan, L.E.; Bashan, Y. Enhanced accumulation of starch and total carbohydrates in alginate-immobilized Chlorella spp. induced by Azospirillum brasilense: II. Heterotrophic conditions. Enzyme Microb. Technol. 2012, 51, 300–309. [Google Scholar] [CrossRef] [PubMed]
- Cheng, D.; Li, D.; Yuan, Y.; Zhou, L.; Li, X.; Wu, T.; Wang, L.; Zhao, Q.; Wei, W.; Sun, Y. Improving carbohydrate and starch accumulation in Chlorella sp. AE10 by a novel two-stage process with cell dilution. Biotechnol. Biofuels 2017, 10, 75. [Google Scholar] [CrossRef] [PubMed]
- Yuan, Y.; Liu, H.; Li, X.; Qi, W.; Cheng, D.; Tang, T.; Zhao, Q.; Wei, W.; Sun, Y. Enhancing Carbohydrate Productivity of Chlorella sp. AE10 in Semi-continuous Cultivation and Unraveling the Mechanism by Flow Cytometry. Appl. Biochem. Biotechnol. 2018, 185, 419–433. [Google Scholar] [CrossRef] [PubMed]
- Ji, M.-K.; Yun, H.-S.; Park, S.; Lee, H.; Park, Y.-T.; Bae, S.; Ham, J.; Choi, J. Effect of food wastewater on biomass production by a green microalga Scenedesmus obliquus for bioenergy generation. Bioresour. Technol. 2015, 179, 624–628. [Google Scholar] [CrossRef] [PubMed]
- Markou, G.; Angelidaki, I.; Georgakakis, D. Microalgal carbohydrates: an overview of the factors influencing carbohydrates production, and of main bioconversion technologies for production of biofuels. Appl. Microbiol. Biotechnol. 2012, 96, 631–645. [Google Scholar] [CrossRef]
- Aikawa, S.; Izumi, Y.; Matsuda, F.; Hasunuma, T.; Chang, J.-S.; Kondo, A. Synergistic enhancement of glycogen production in Arthrospira platensis by optimization of light intensity and nitrate supply. Bioresour. Technol. 2012, 108, 211–215. [Google Scholar] [CrossRef]
- Yao, C.; Ai, J.; Cao, X.; Xue, S.; Zhang, W. Enhancing starch production of a marine green microalga Tetraselmis subcordiformis through nutrient limitation. Bioresour. Technol. 2012, 118, 438–444. [Google Scholar] [CrossRef] [PubMed]
- Roth, M.S.; Cokus, S.J.; Gallaher, S.D.; Walter, A.; Lopez, D.; Erickson, E.; Endelman, B.; Westcott, D.; Larabell, C.A.; Merchant, S.S.; et al. Chromosome-level genome assembly and transcriptome of the green alga Chromochloris zofingiensis illuminates astaxanthin production. Proc. Natl. Acad. Sci. 2017, 114. [Google Scholar] [CrossRef]
- Wirth, R.; Pap, B.; Böjti, T.; Shetty, P.; Lakatos, G.; Bagi, Z.; Kovács, K.L.; Maróti, G. Chlorella vulgaris and Its Phycosphere in Wastewater: Microalgae-Bacteria Interactions During Nutrient Removal. Front. Bioeng. Biotechnol. 2020, 8. [Google Scholar] [CrossRef]
- Tale, M.P.; Devi Singh, R.; Kapadnis, B.P.; Ghosh, S.B. Effect of gamma irradiation on lipid accumulation and expression of regulatory genes involved in lipid biosynthesis in Chlorella sp. J. Appl. Phycol. 2018, 30, 277–286. [Google Scholar] [CrossRef]
- Xia, A.; Murphy, J.D. Microalgal Cultivation in Treating Liquid Digestate from Biogas Systems. Trends Biotechnol. 2016, 34, 264–275. [Google Scholar] [CrossRef] [PubMed]
- Nwoba, E.G.; Mickan, B.S.; Moheimani, N.R. Chlorella sp. growth under batch and fed-batch conditions with effluent recycling when treating the effluent of food waste anaerobic digestate. J. Appl. Phycol. 2019, 31, 3545–3556. [Google Scholar] [CrossRef]
- Zhu, L.; Yan, C.; Li, Z. Microalgal cultivation with biogas slurry for biofuel production. Bioresour. Technol. 2016, 220, 629–636. [Google Scholar] [CrossRef]
- Ayre, J.M.; Moheimani, N.R.; Borowitzka, M.A. Growth of microalgae on undiluted anaerobic digestate of piggery effluent with high ammonium concentrations. Algal Res. 2017, 24, 218–226. [Google Scholar] [CrossRef]
- Bjornsson, W.J.; Nicol, R.W.; Dickinson, K.E.; McGinn, P.J. Anaerobic digestates are useful nutrient sources for microalgae cultivation: functional coupling of energy and biomass production. J. Appl. Phycol. 2013, 25, 1523–1528. [Google Scholar] [CrossRef]
- Knothe, G. Improving biodiesel fuel properties by modifying fatty ester composition. Energy Environ. Sci. 2009, 2, 759–766. [Google Scholar] [CrossRef]
- Knothe, G. “Designer” Biodiesel: Optimizing Fatty Ester Composition to Improve Fuel Properties. Energy Fuels 2008, 22, 1358–1364. [Google Scholar] [CrossRef]
- Miao, X.; Wu, Q. Biodiesel production from heterotrophic microalgal oil. Bioresour. Technol. 2006, 97, 841–846. [Google Scholar] [CrossRef] [PubMed]
- Liu, J.; Huang, J.; Sun, Z.; Zhong, Y.; Jiang, Y.; Chen, F. Differential lipid and fatty acid profiles of photoautotrophic and heterotrophic Chlorella zofingiensis: Assessment of algal oils for biodiesel production. Bioresour. Technol. 2011, 102, 106–110. [Google Scholar] [CrossRef] [PubMed]
- Talebi, A.F.; Mohtashami, S.K.; Tabatabaei, M.; Tohidfar, M.; Bagheri, A.; Zeinalabedini, M.; Hadavand Mirzaei, H.; Mirzajanzadeh, M.; Malekzadeh Shafaroudi, S.; Bakhtiari, S. Fatty acids profiling: A selective criterion for screening microalgae strains for biodiesel production. Algal Res. 2013, 2, 258–267. [Google Scholar] [CrossRef]
- Menegazzo, M.L.; Ulusoy-Erol, H.B.; Hestekin, C.N.; Hestekin, J.A.; Fonseca, G.G. Evaluation of the yield, productivity, and composition of fatty acids methyl esters (FAME) obtained from the lipidic fractions extracted from Chlorella sorokiniana by using ultrasound and agitation combined with solvents. Biofuels 2022, 13, 519–526. [Google Scholar] [CrossRef]
- Wang, M.; Sahu, A.K.; Rusten, B.; Park, C. Anaerobic co-digestion of microalgae Chlorella sp. and waste activated sludge. Bioresour. Technol. 2013, 142, 585–590. [Google Scholar] [CrossRef]
- González-Fernández, C.; Sialve, B.; Bernet, N.; Steyer, J.P. Thermal pretreatment to improve methane production of Scenedesmus biomass. Biomass Bioenergy 2012, 40, 105–111. [Google Scholar] [CrossRef]
- Sialve, B.; Bernet, N.; Bernard, O. Anaerobic digestion of microalgae as a necessary step to make microalgal biodiesel sustainable. Biotechnol. Adv. 2009, 27, 409–416. [Google Scholar] [CrossRef]
- Rosenberg, J.N.; Kobayashi, N.; Barnes, A.; Noel, E.A.; Betenbaugh, M.J.; Oyler, G.A. Comparative Analyses of Three Chlorella Species in Response to Light and Sugar Reveal Distinctive Lipid Accumulation Patterns in the Microalga C. sorokiniana. PLoS ONE 2014, 9, e92460. [Google Scholar] [CrossRef] [PubMed]
- Mendez, L.; Mahdy, A.; Timmers, R.A.; Ballesteros, M.; González-Fernández, C. Enhancing methane production of Chlorella vulgaris via thermochemical pretreatments. Bioresour. Technol. 2013, 149, 136–141. [Google Scholar] [CrossRef] [PubMed]
- Passos, F.; Ferrer, I. Influence of hydrothermal pretreatment on microalgal biomass anaerobic digestion and bioenergy production. Water Res. 2015, 68, 364–373. [Google Scholar] [CrossRef]
- Williams, P.J. le B.; Laurens, L.M.L. Microalgae as biodiesel & biomass feedstocks: Review & analysis of the biochemistry, energetics & economics. Energy Environ. Sci. 2010, 3, 554–590. [Google Scholar]
- Ramanan, R.; Kim, B.-H.; Cho, D.-H.; Oh, H.-M.; Kim, H.-S. Algae–bacteria interactions: Evolution, ecology and emerging applications. Biotechnol. Adv. 2016, 34, 14–29. [Google Scholar] [CrossRef] [PubMed]
Figure 1.
Comparison of growth and pigment production parameters in C. sorokiniana and C. vulgaris under different culture conditions (BG11, ADE3, ADE5_stress, and ADE5_nostress) over 18 days. The data show optical density at 600 nm for (a) C. sorokiniana and (b) C. vulgaris, dry cell weight (g/L) for (c) C. sorokiniana and (d) C. vulgaris, chlorophyll content (% of dry biomass) for (e) C. sorokiniana and (f) C. vulgaris, and carotenoid content (% of dry biomass) for (g) C. sorokiniana and (h) C. vulgaris. Error bars represent the standard error of triplicate measurements.
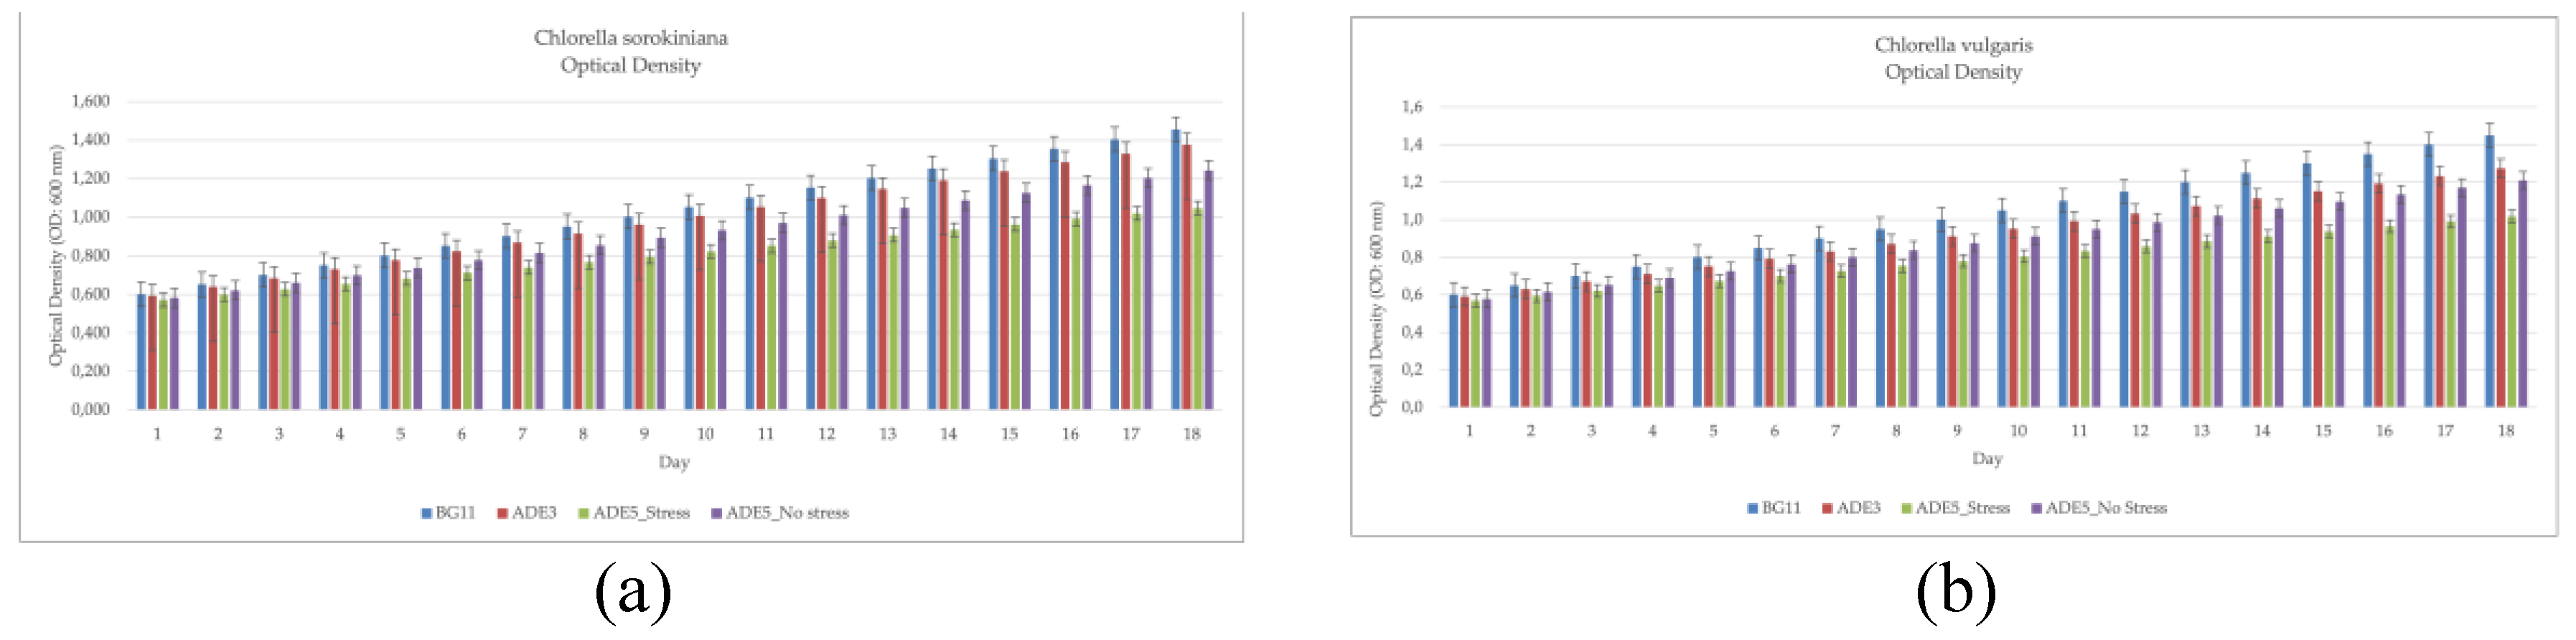
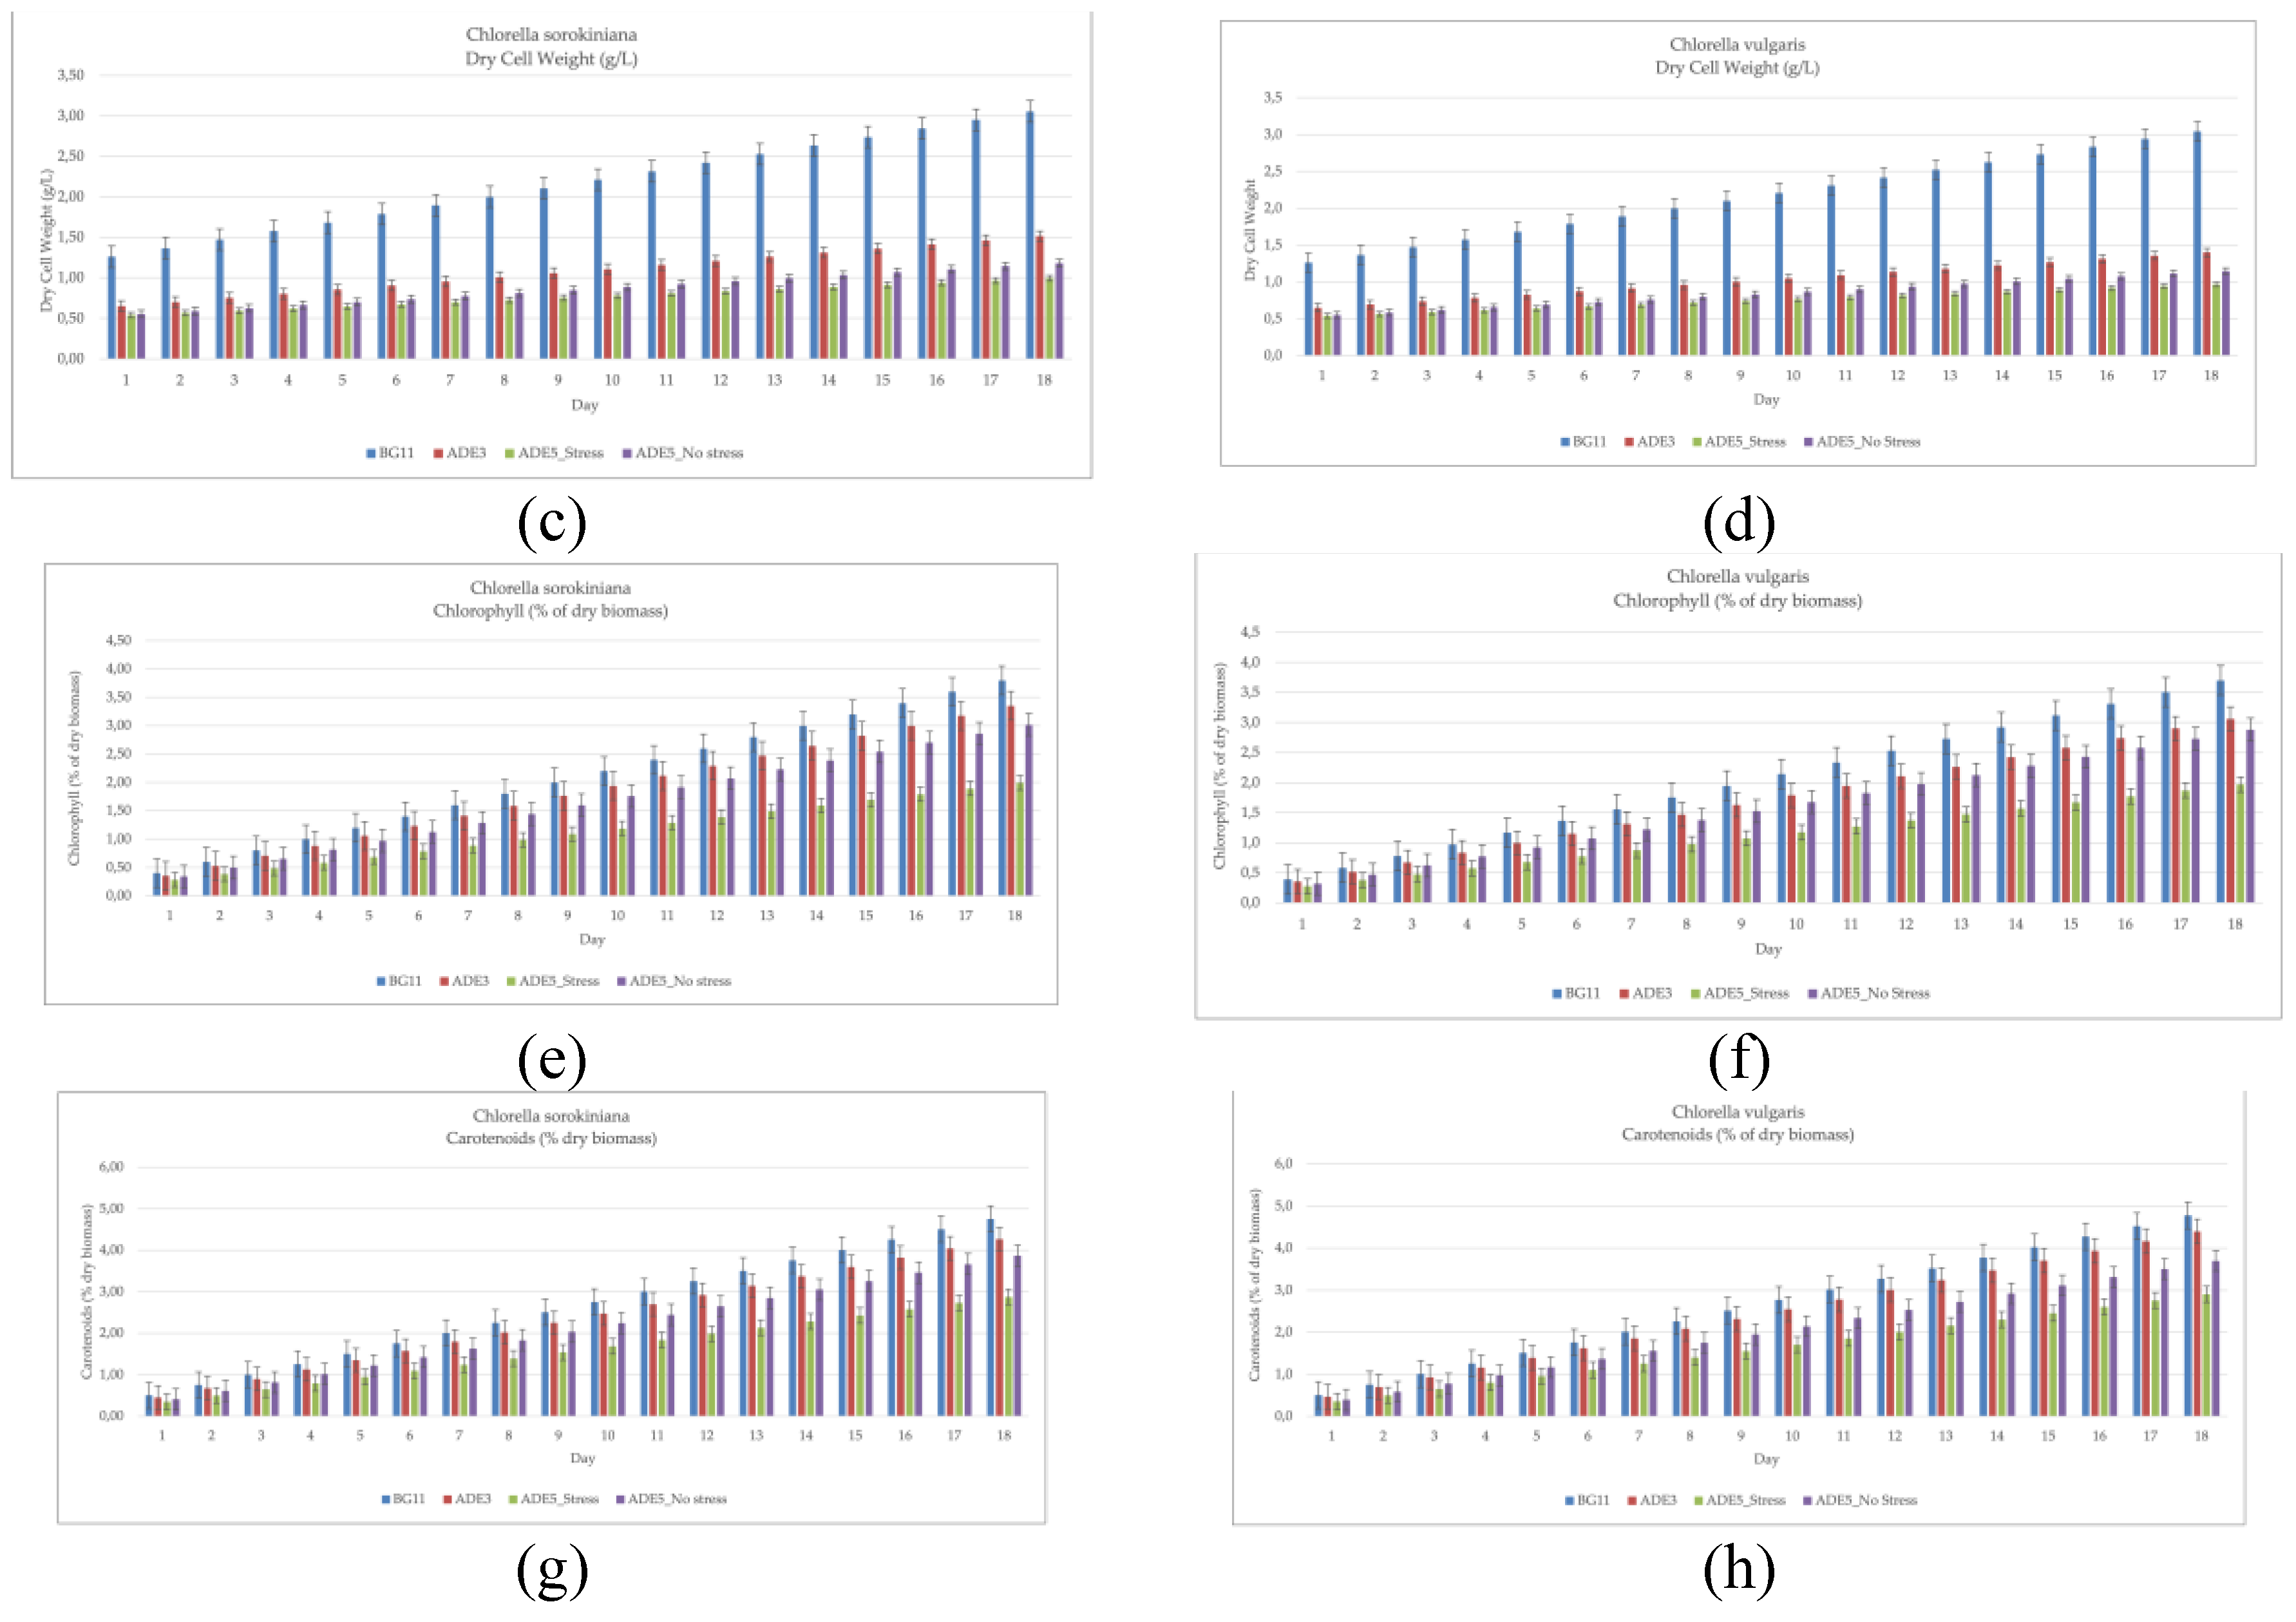
Figure 2.
Protein accumulation (%) in (a) C. sorokiniana and (b) C. vulgaris, Carbohydrates accumulation (%) in (c) C. sorokiniana and (d) C. vulgaris, Lipids accumulation (%) in (e) C. sorokiniana and (f) C. vulgaris cultivated in different media (BG11, ADE3, ADE5_stress, ADE5_nostress) over 18 days. Error bars represent standard error of triplicate measurements.
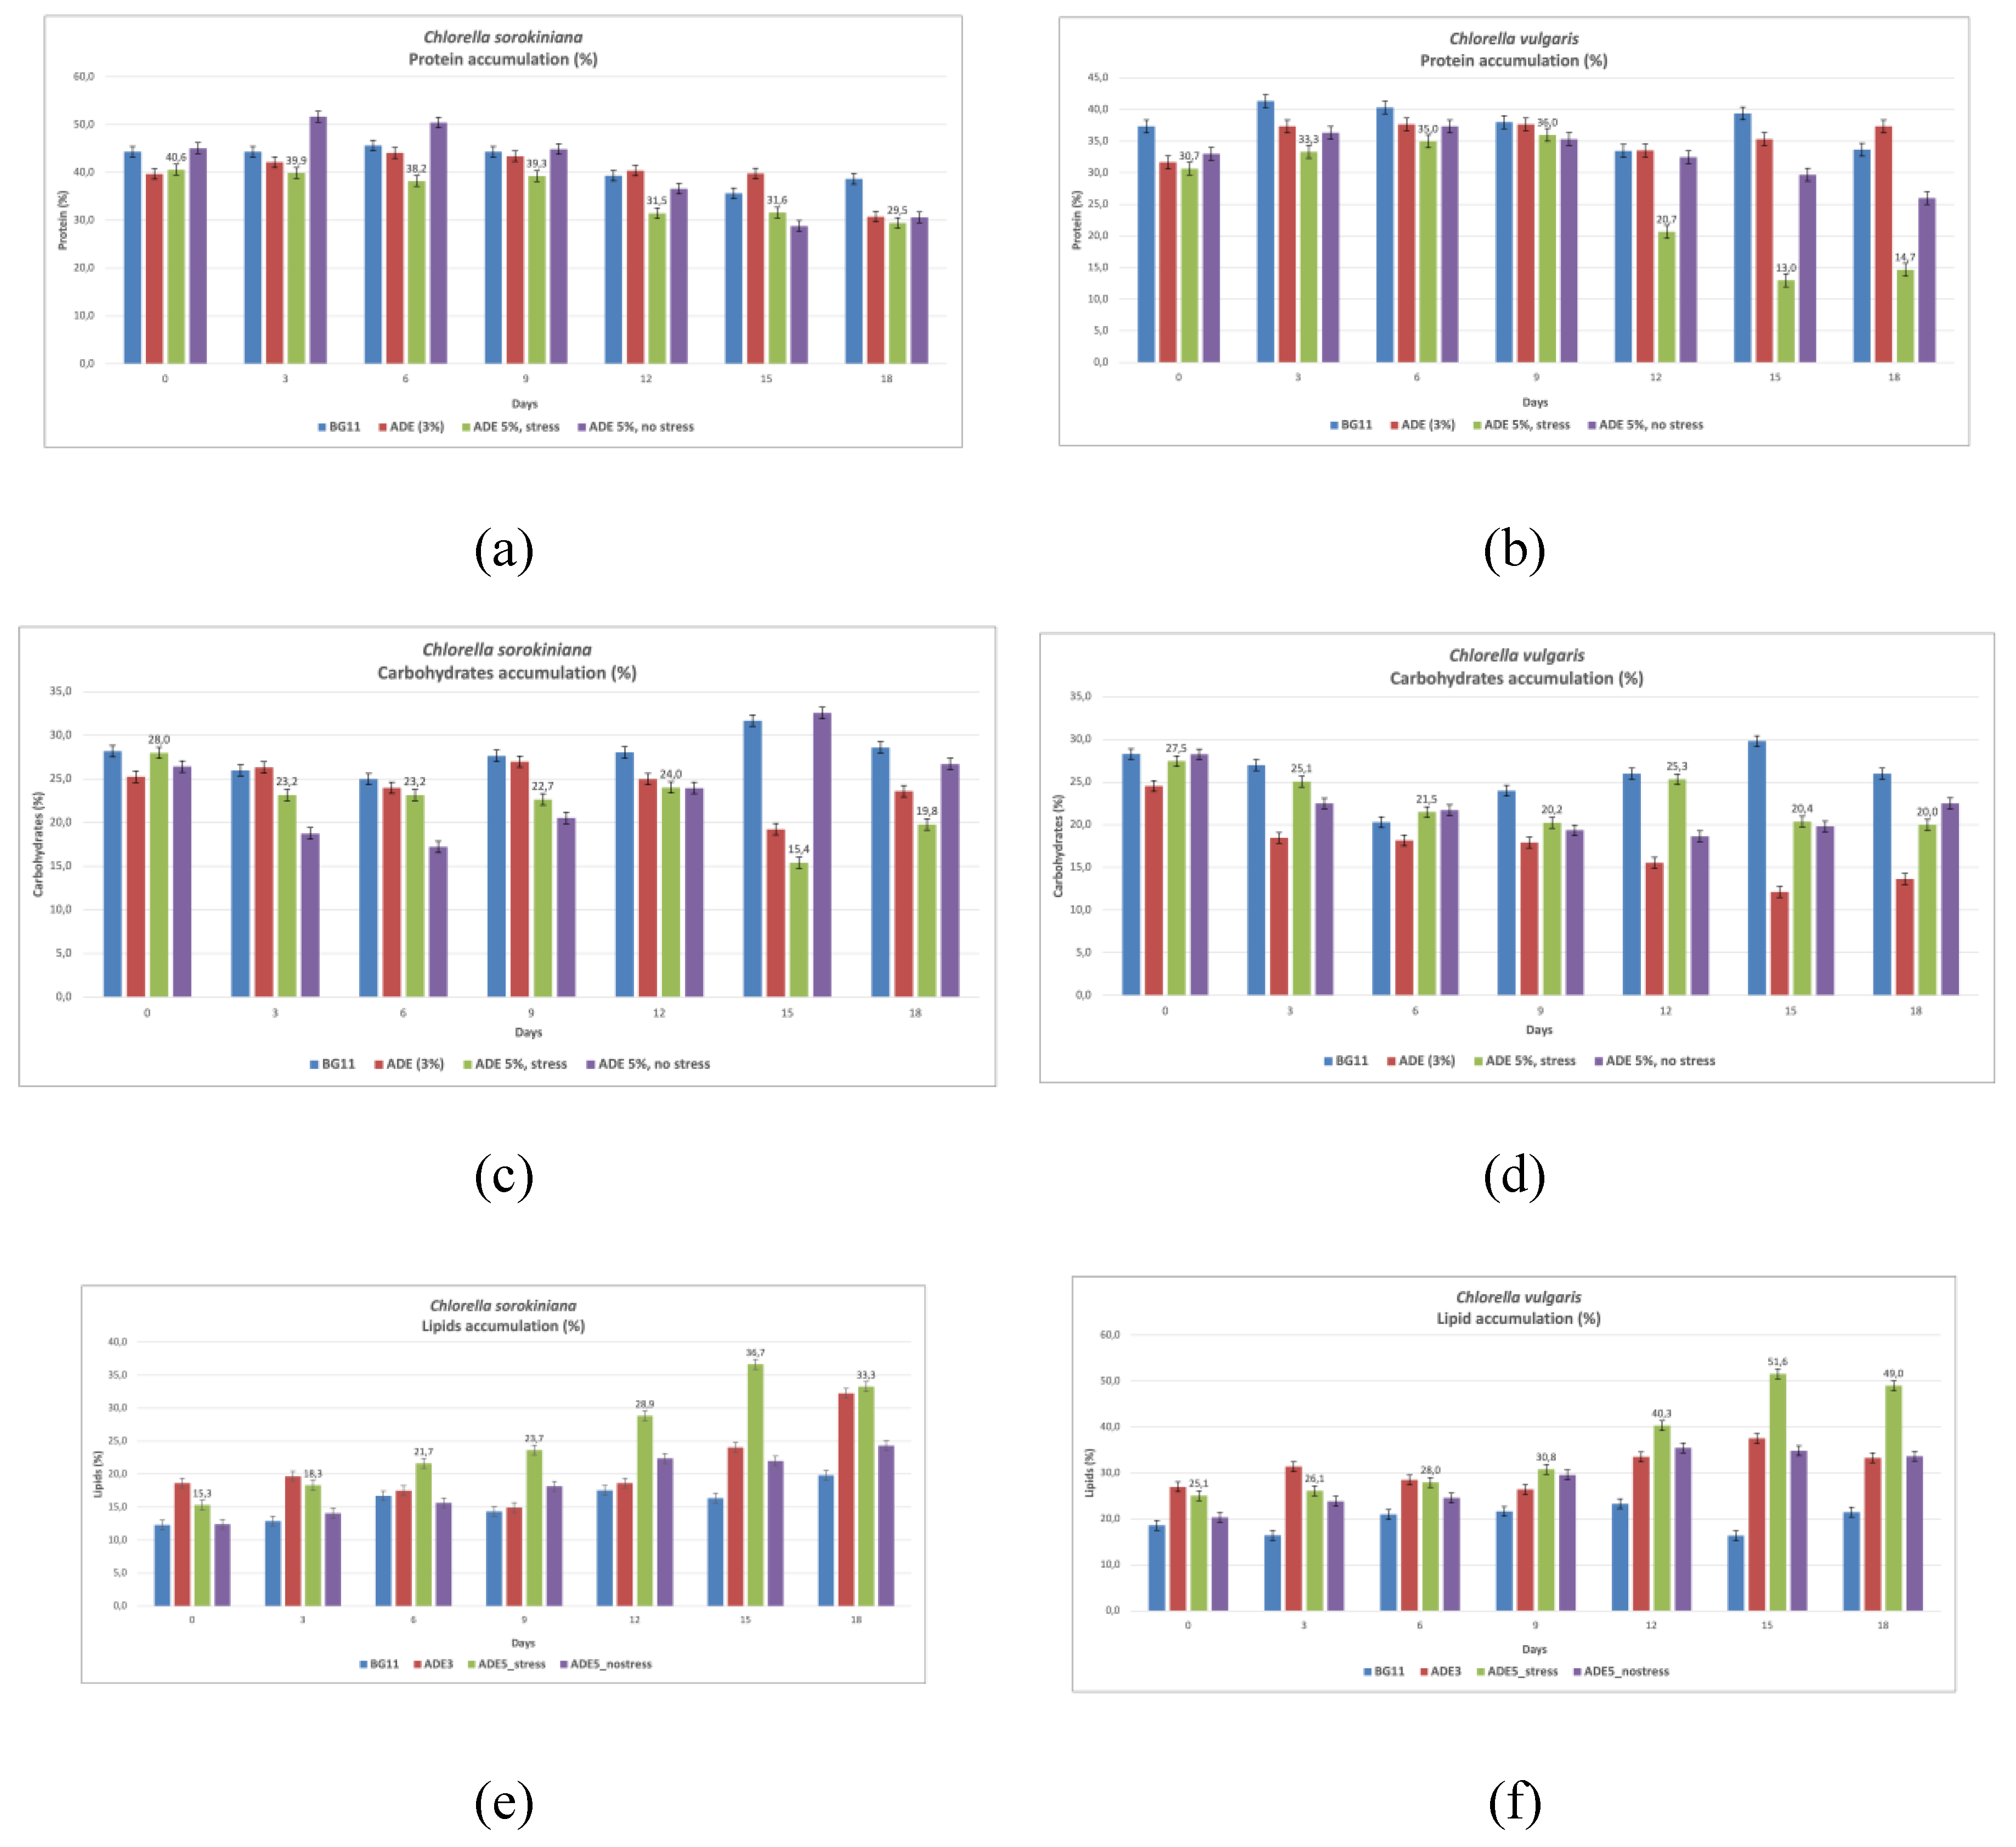
Figure 3.
Fatty Acid Methyl Esters (FAMEs) profile of C. sorokiniana cultivated in 5% ADE. Values represent the percentage composition of each fatty acid methyl ester. Error bars represent standard error of triplicate measurements.
Figure 3.
Fatty Acid Methyl Esters (FAMEs) profile of C. sorokiniana cultivated in 5% ADE. Values represent the percentage composition of each fatty acid methyl ester. Error bars represent standard error of triplicate measurements.
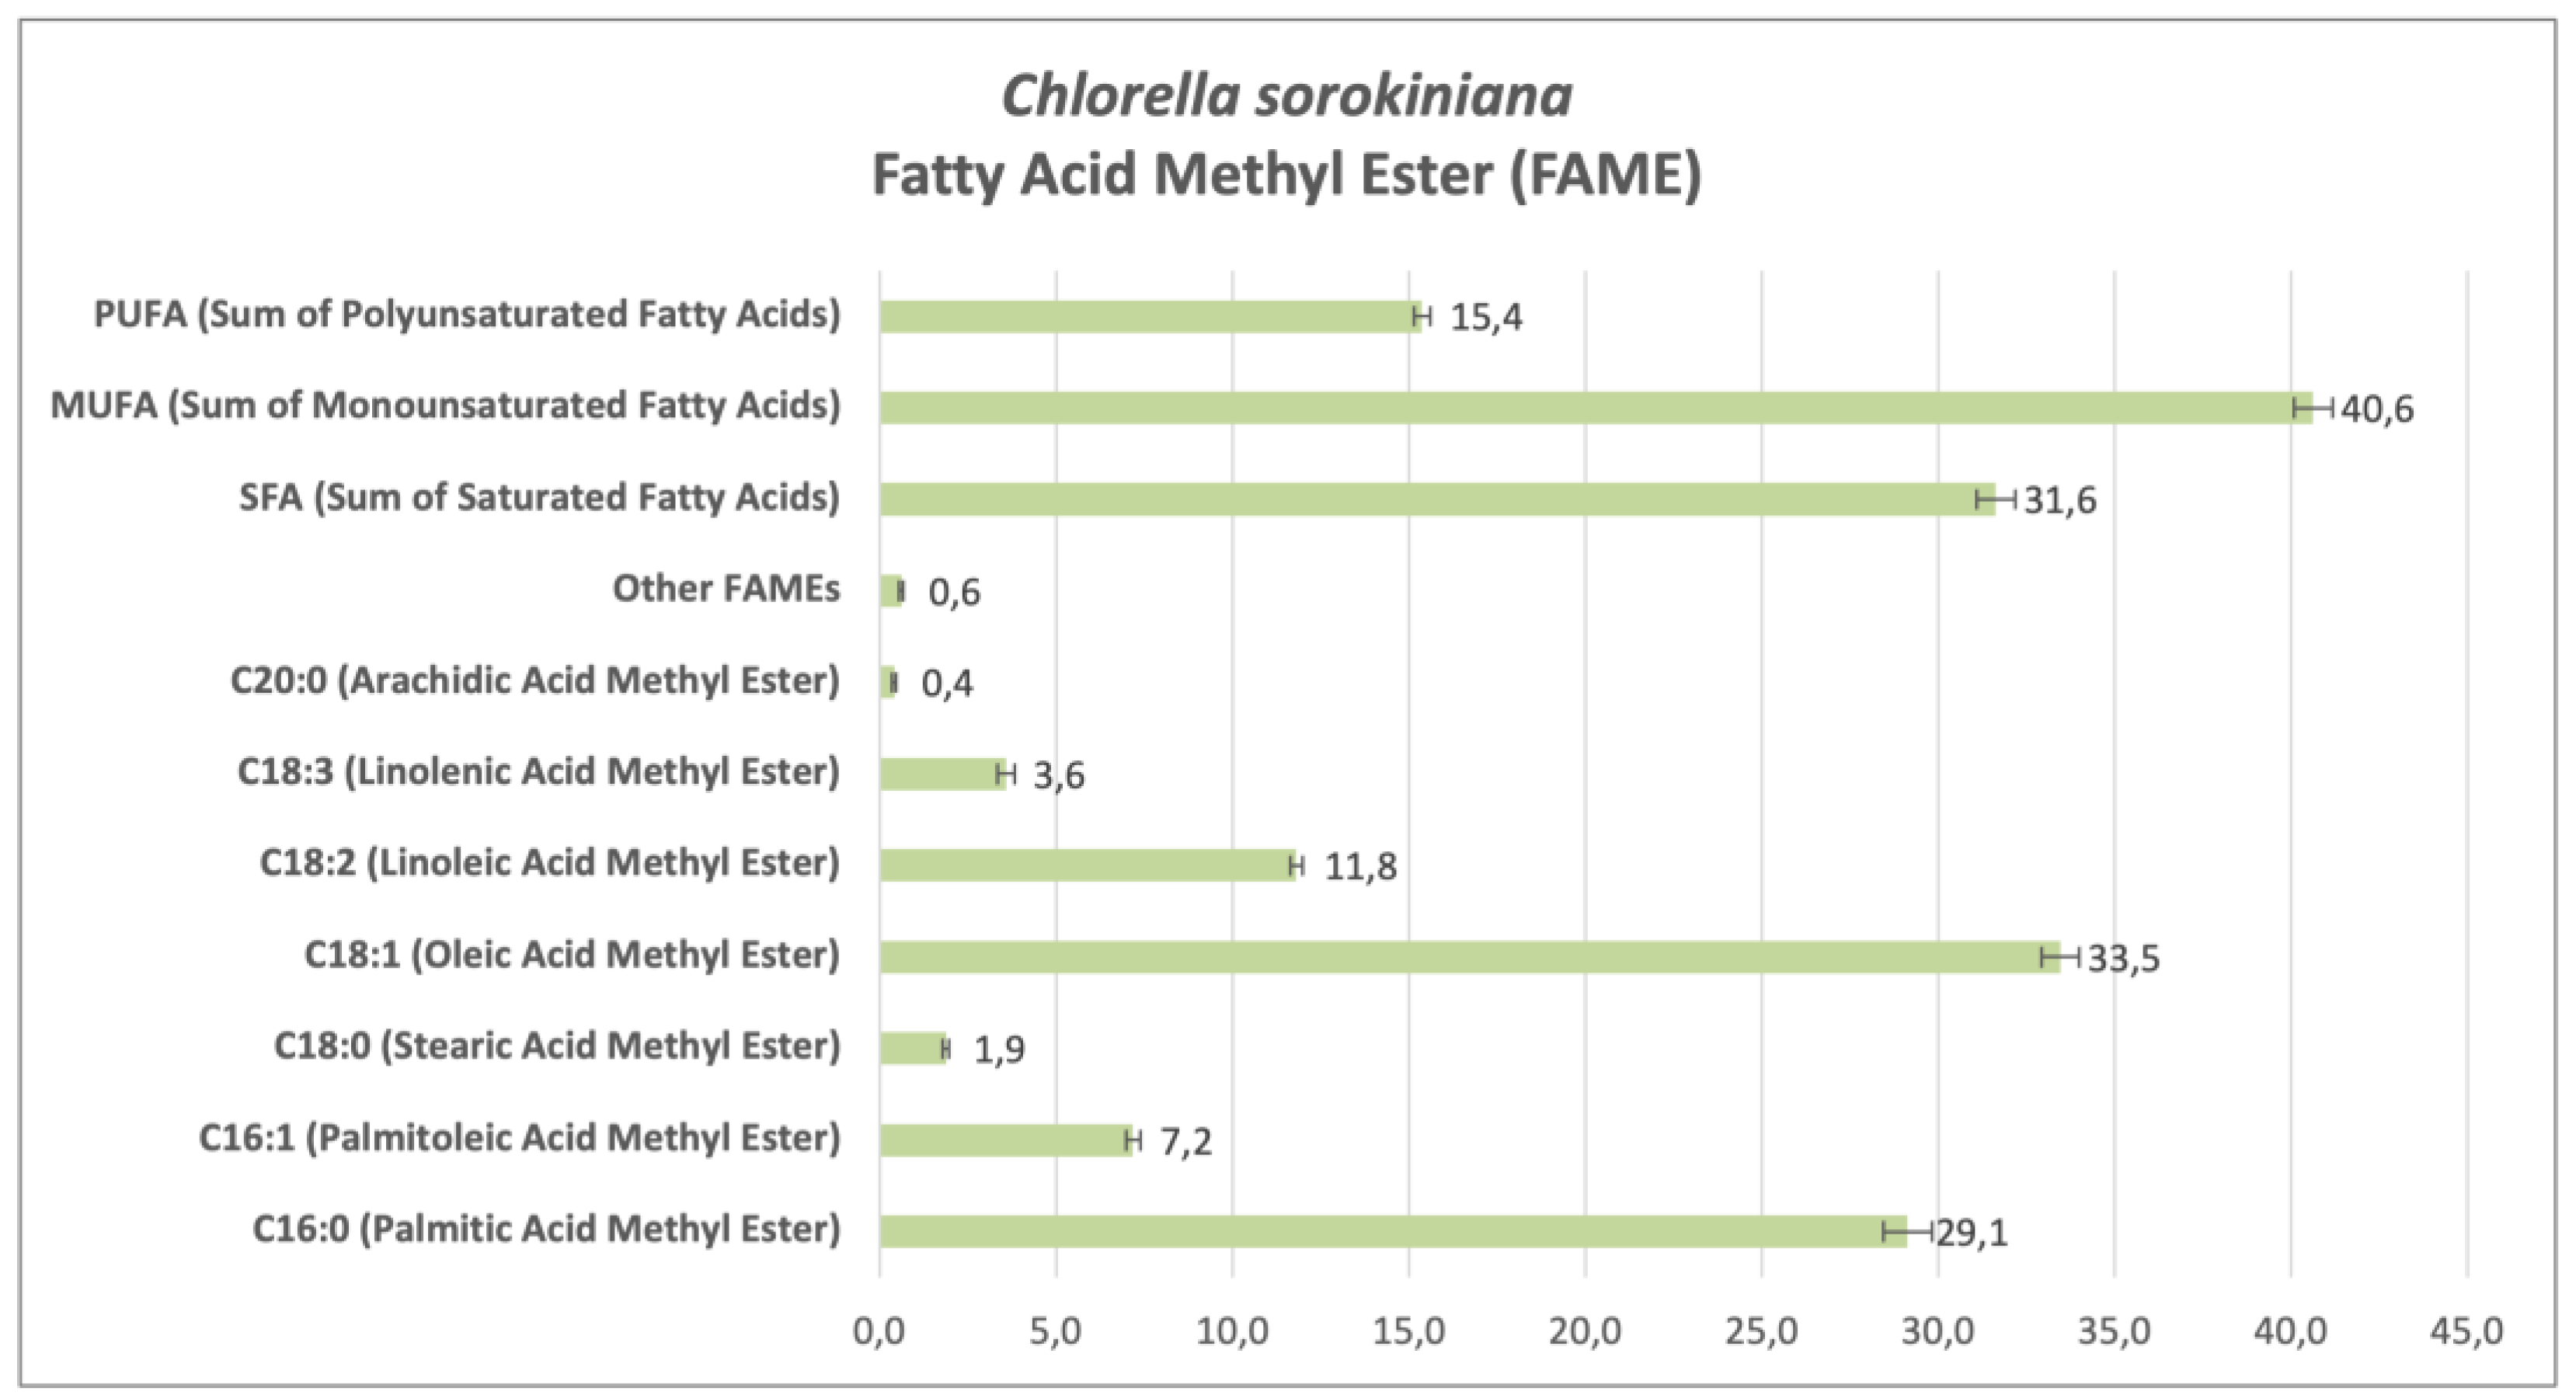
Figure 4.
Fatty Acid Methyl Esters (FAMEs) profile of C. vulgaris cultivated in 5% ADE. Values represent the percentage composition of each fatty acid methyl ester. Error bars represent standard error of triplicate measurements.
Figure 4.
Fatty Acid Methyl Esters (FAMEs) profile of C. vulgaris cultivated in 5% ADE. Values represent the percentage composition of each fatty acid methyl ester. Error bars represent standard error of triplicate measurements.
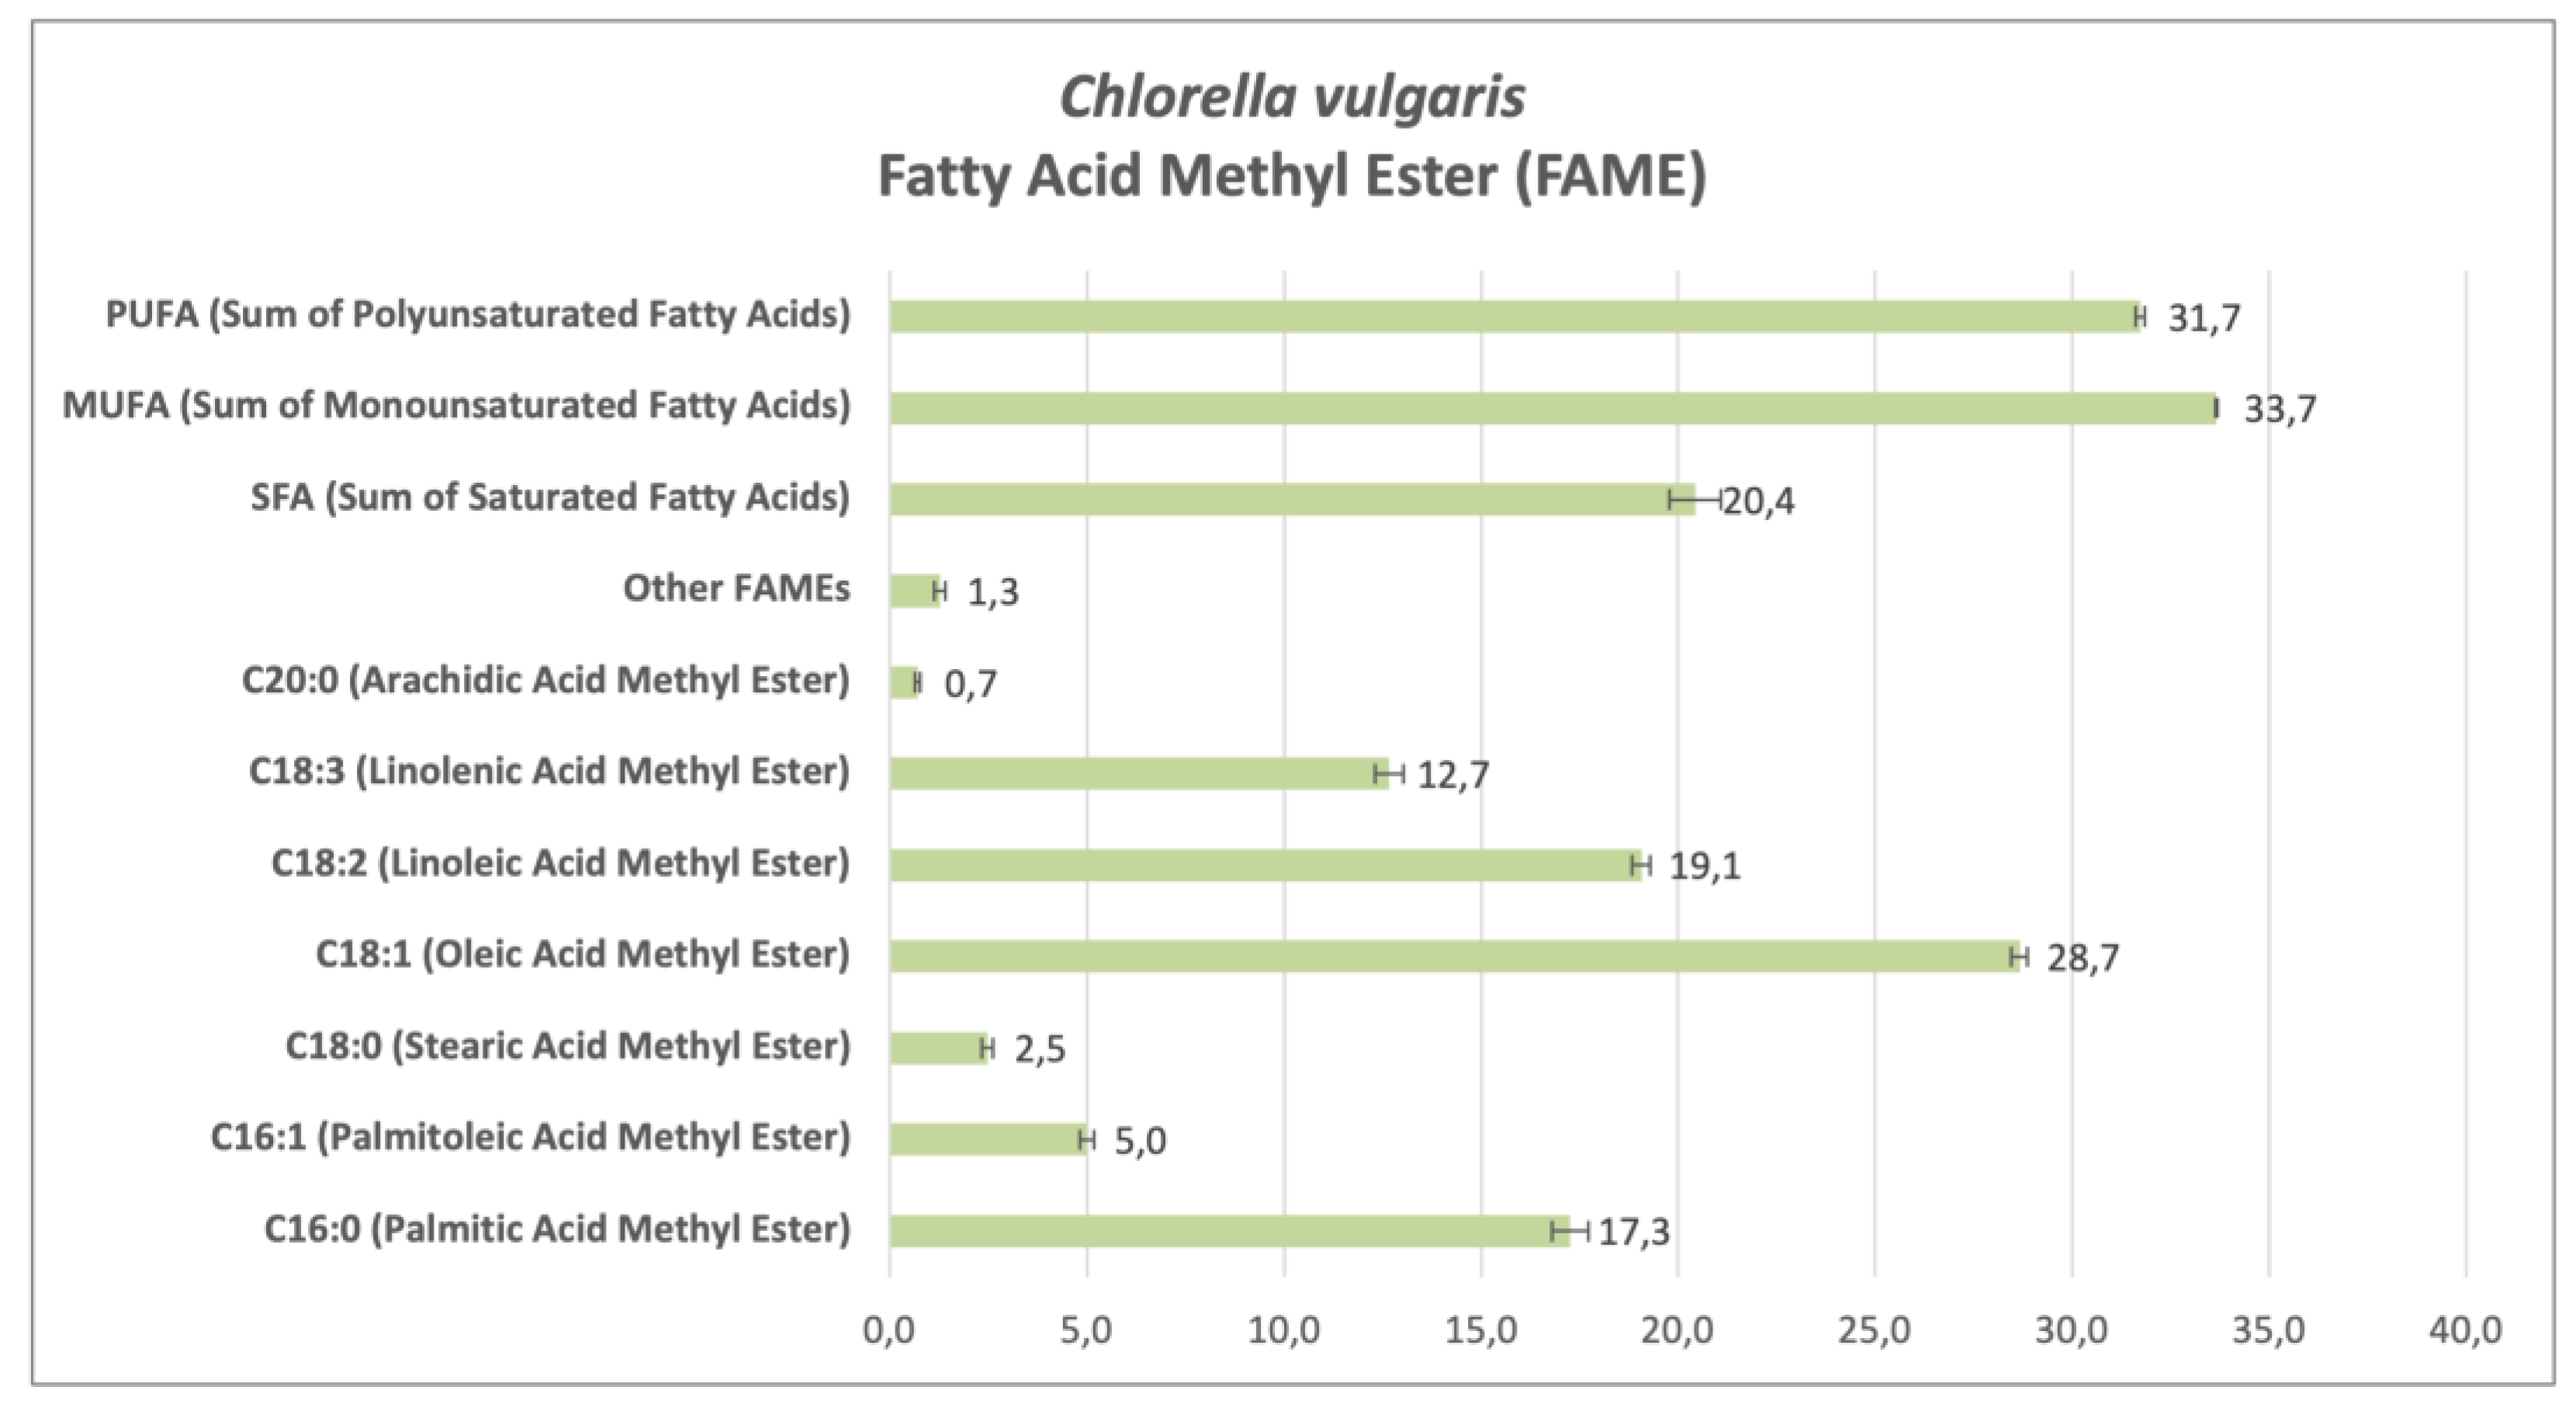
Figure 5.
Cumulative biogas yield over 30 days for various treatments in (a) Chlorella sorokiniana and (b) Chlorella vulgaris. Control and thermal pre-treatments at 40°C and 90°C for 4 and 10 hours.
Figure 5.
Cumulative biogas yield over 30 days for various treatments in (a) Chlorella sorokiniana and (b) Chlorella vulgaris. Control and thermal pre-treatments at 40°C and 90°C for 4 and 10 hours.
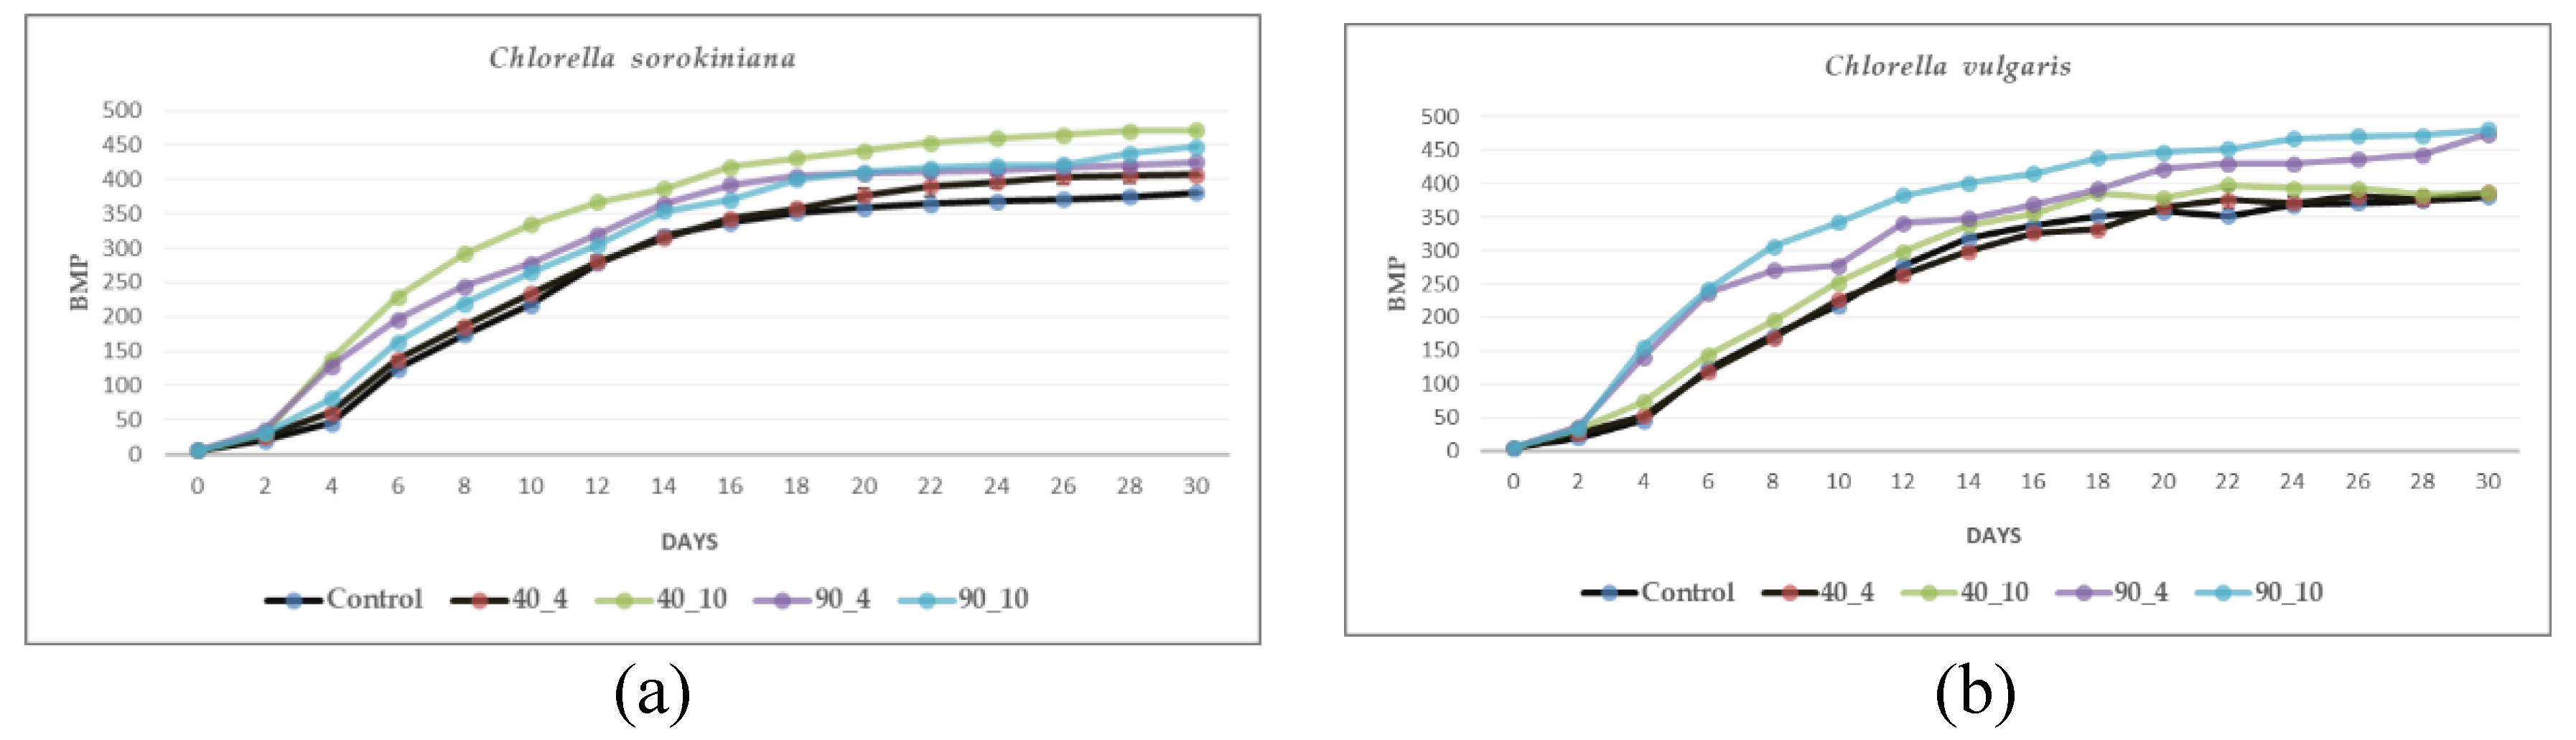

Table 1.
Nutrient Media Composition.
| Composition (mg/L) | ADE | 3% ADE | 5% ADE | BG-11 |
|---|---|---|---|---|
| N-NH₄ | 3536 ± 36 | 107 ± 1.08 | 175.4 ± 1.8 | n.d.1 |
| N-NO₃ | 92 ± 8.1 | 2.77 ± 0.24 | 4.6 ± 0.41 | 247.84 |
| TN | 3920 ± 66 | 117.6 ± 1.98 | 195 ± 3.3 | 247.84 |
| P | 81.4 ± 5.8 | 2.1 ± 0.17 | 4.2 ± 0.29 | 5.50 |
| Organic N | 292 ± 21.9 | 7.83 ± 0.68 | 15 ± 1.1 | n.d. |
| COD | 24,200 ± 153 | 726 ± 4.59 | 1210 ± 7.65 | n.d. |
| Ca | 369 ± 3.1 | 11.07 ± 0.09 | 18.45 ± 0.16 | 9.81 |
| Fe | 54 ± 1.4 | 1.62 ± 0.04 | 2.71 ± 0.07 | 1.28 |
| Mg | 225 ± 5.3 | 6.75 ± 0.16 | 11.25 ± 0.27 | 6.98 |
| Mn | 6.33 ± 0.35 | 0.19 ± 0.01 | 0.32 ± 0.02 | 0.50 |
| Na | 1884.6 ± 4.5 | 56.54 ± 0.14 | 94.23 ± 0.23 | 212.28 |
| Cl | 1633.6 ± 5.9 | 49.01 ± 0.18 | 81.68 ± 0.3 | 18.02 |
| K | 3161 ± 2.7 | 94.83 ± 0.08 | 158.05 ± 0.14 | 13.70 |
| Cu | 2 ± 0.03 | 0.06 ± 0.00 | 0.10 ± 0.00 | 0.02 |
| EC | 49.7 dS/m | 2.17 dS/m | 3.15 dS/m | n.a.2 |
| pH | 8.3 | 8.0 | 8.1 | 7.1 |
1 n.d. = not detected, 2 n.a. = not available.
Table 2.
Mean values of optical density (OD600), dry cell weight (DCW), chlorophyll content, and carotenoid content of CSO and CVU under different cultivation conditions.
Table 2.
Mean values of optical density (OD600), dry cell weight (DCW), chlorophyll content, and carotenoid content of CSO and CVU under different cultivation conditions.
| Cultivation conditions | OD600 | DCW (g/L) | Chlorophyll (μg/L) | Carotenoids (μg/L) |
|---|---|---|---|---|
| CSO BG11 | 1.30 a 1 | 2.74 a | 3.20 a | 4.01 a |
| CSO ADE3 | 1.24 b | 1.36 b | 2.82 b | 3.60 b |
| CSO ADE5_stress | 0.96 e | 0.92 e | 2.55 cd | 2.43 d |
| CSO ADE5_nostress | 1.13 cd | 1.07 d | 2.43 d | 3.26 c |
| CVU BG11 | 1.30 a | 2.73 a | 3.12 a | 4.02 a |
| CVU ADE3 | 1.15 c | 1.27 c | 2.58 c | 3.70 b |
| CVU ADE5_stress | 0.94 e | 0.89 e | 1.67 e | 3.11 c |
| CVU ADE5_nostress | 1.10 d | 1.04 d | 1.69 e | 2.45 d |
| Mean | 1.14 | 1.50 | 2.51 | 3.32 |
| LSD 2 | 0.04 | 0.07 | 0.13 | 0.18 |
1 Mean values with significant differences indicated by distinct letters (p < 0.05) according to LSD test. 2 LSD = Least Significant Differences value at (p < 0.05).
Table 3.
Mean values of proteins, carbohydrates, and lipids content of Chlorella sorokiniana and Chlorella vulgaris under different cultivation conditions.
Table 3.
Mean values of proteins, carbohydrates, and lipids content of Chlorella sorokiniana and Chlorella vulgaris under different cultivation conditions.
| Cultivation conditions | Proteins (%) | Carbohydrates (%) | Lipids (%) |
|---|---|---|---|
| CSO BG11 | 35.67 ab 1 | 31.70 a | 16.37 e |
| CSO ADE3 | 39.80 a | 19.25 b | 24.07 d |
| CSO ADE5_stress | 31.63 bc | 15.40 bc | 36.67 bc |
| CSO ADE5_nostress | 28.83 c | 32.57 a | 22.00 d |
| CVU BG11 | 39.40 a | 29.82 a | 16.37 e |
| CVU ADE3 | 35.33 ab | 12.13 c | 37.53 b |
| CVU ADE5_stress | 13.00 d | 20.37 b | 51.57 a |
| CVU ADE5_nostress | 29.70 bc | 19.81 b | 34.87 c |
| Mean | 31.67 | 22.63 | 29.93 |
| LSD 2 | 6.00 | 6.27 | 2.08 |
1 Mean values with significant differences indicated by distinct letters (p < 0.05) according to LSD test. 2 LSD = Least Significant Differences value at (p < 0.05).
Table 4.
Biogas production (mL(biogas)/gVS) of Chlorella sorokiniana and Chlorella vulgaris under different cultivation conditions.
Table 4.
Biogas production (mL(biogas)/gVS) of Chlorella sorokiniana and Chlorella vulgaris under different cultivation conditions.
| Cultivation conditions | mL(biogas)/gVS |
|---|---|
| CSO BG11 | 407.1 c 1 |
| CSO ADE3 | 399.3 d |
| CSO ADE5_stress | 418.3 b |
| CSO ADE5_nostress | 407.9 c |
| CVU BG11 | 414.5 b |
| CVU ADE3 | 408.1 c |
| CVU ADE5_stress | 432.8 a |
| CVU ADE5_nostress | 409.2 c |
| Means | 412.1 |
| LSD 2 | 4.8 |
1 Means values with significant differences indicated by distinct letters (p < 0.05) according to LSD test. 2 LSD = Least Significant Differences value at (p < 0.05).
Table 5.
Methane production and Energy Efficiency of CSO and CVU under different thermal pretreatment conditions.
Table 5.
Methane production and Energy Efficiency of CSO and CVU under different thermal pretreatment conditions.
| Cultivation conditions | BMP (mL biogas/gVS) |
Energy Efficiency (%) |
|---|---|---|
| CSO 40_4 | 407 e 1 | 2.67 a 2 |
| CSO 40_10 | 472 b | 1.24 c |
| CSO 90_4 | 425 d | 0.93 f |
| CSO 90_10 | 448 c | 0.49 h |
| CVU 40_4 | 380 f | 2.54 b |
| CVU 40_10 | 387 f | 1.01 e |
| CVU 90_4 | 474 b | 1.03 d |
| CVU 90_10 | 481 a | 0.55 g |
| Means | 434 | 1.31 |
| LSD 3 | - | 0.01 |
1 Means values with significant differences indicated by distinct letters (p < 0.05) according to LSD after Z-Normalization. 2 Means values with significant differences indicated by distinct letters (p < 0.05) according to LSD. 3 LSD = Least Significant Differences value at (p < 0.05).
Disclaimer/Publisher’s Note: The statements, opinions and data contained in all publications are solely those of the individual author(s) and contributor(s) and not of MDPI and/or the editor(s). MDPI and/or the editor(s) disclaim responsibility for any injury to people or property resulting from any ideas, methods, instructions or products referred to in the content. |
© 2024 by the authors. Licensee MDPI, Basel, Switzerland. This article is an open access article distributed under the terms and conditions of the Creative Commons Attribution (CC BY) license (http://creativecommons.org/licenses/by/4.0/).
Copyright: This open access article is published under a Creative Commons CC BY 4.0 license, which permit the free download, distribution, and reuse, provided that the author and preprint are cited in any reuse.


