
Submitted:
18 November 2024
Posted:
20 November 2024
You are already at the latest version
Abstract
The concentration of endocrine disruptor compounds (EDC) in wastewater is increasing, posing significant risks to living organisms. This study concerns the simultaneous degradation of a variety of EDCs from wastewater, including methylparaben (MeP), propylparaben (PrP), butylparaben (BuP), benzophenone (BP), bisphenol A (BPA) and estrone (E), in the presence of the microalgae Scenedesmus sp. or Chlorella vulgaris. The potential for abiotic removal of these EDCs and the underlying degradation mechanisms were also studied. The presence of microalgae significantly enhanced the degradation of parabens, achieving complete removal within 7 days, primarily through the mechanism of biodegradation. BPA removal was also improved by microalgae, reaching 82% and 90% within 7 days with Scenedesmus sp. and C. vulgaris, respectively. BP degradation was predominantly abiotic, accomplishing 95% removal in 7 days. E degradation was mainly abiotic, achieving approximately 40% within 7 days, with a notable contribution from a biodegradation mechanism in the later stages, accounting for 27% and 40% of the final total removal in the presence of Scenedesmus sp. and C. vulgaris, respectively. This study provides insights into the mechanism of EDC degradation by microalgae, highlighting the potential of Scenedesmus sp. and C. vulgaris for removing a mixture of EDCs from wastewater.
Keywords:
microalgae
; endocrine disruptor
; nutrients
; wastewater treatment
1. Introduction
Endocrine disruptor compounds (EDC) are organic chemicals that interfere with the proper functionality of the endocrine system, causing adverse health effects in organisms and their population [1]. This group of compounds is highly heterogeneous and can be classified in natural or synthetic EDCs. On the one hand, natural EDCs can contain some heavy metals or substances, like phytoestrogens and cyanotoxins, derived from living beings such as plants or bacteria [2]. On the other hand, synthetic EDCs are artificial compounds mostly used for industrial or agricultural purposes, such as pesticides, personal care products (PCPs) or plasticisers [3]. Nowadays, synthetic EDCs, including parabens, benzophenone and its derivatives, bisphenol A, and estrone, are the most common endocrine disruptors due to their extensive production and use [4]. Methylparaben (MeP), propylparaben (PrP), and butylparaben (BuP) belong to p-hydroxybenzoic acid (PHBA) alkyl esters derivates. Parabens are used as preservatives in food, pharmaceuticals, and PCPs due to their antibacterial and antifungal properties [5]. Benzophenone (BP) and its derivatives are the most used UV filters for sunscreen products, skin creams, cosmetics, hair sprays, body lotions, hair dyes, shampoos, and other PCPs [6]. Bisphenol A (BPA) is a diphenylmethane derivative, an organic synthetic compound used as an additive in producing polycarbonate plastics and epoxy resins [7]. Finally, estrone (E) is a naturally occurring hormone belonging to the estrogen family. It is principally produced by the ovaries, adipose tissue, fibroblasts, skin, placenta, and brain [8]. The increasing consumption of hormones from contraceptive drugs and hormonal therapy for postmenopausal women is related to elevated levels of estrone in wastewater [9].
It is known that several adverse effects on human health are associated with these synthetic EDCs. For instance, they may increase the proliferation of specific cancer cells [10], disrupt thyroid hormone concentrations, including thyroxine and triiodothyronine [11], and higher urinary levels of these chemicals have been positively correlated with diseases such as diabetes mellitus in adults [12], obesity in children and adolescents [13] or osteoarthritis [14]. Additionally, they may contribute to processes such as feminisation and reproductive dysfunction [15].
Synthetic EDCs are widely distributed throughout the environment, with the highest concentration in water, but also present in air, soil, sludge, and sediments [16,17,18,19,20]. For example, unsubstituted BP was detected in concentrations between 200 and 713 ng/L in two different rivers in Shanghai [6] or BPA can be found within a range of 46.4 and 986 ng/L in different domestic wastewater treatment plants (WWTPs) in Korea [21]. The principal sources of surface water contamination are industrial and urban sewage discharge effluents [22] with conventional WWTPs being inefficient in removing EDCs [23]. For this purpose, various processes have been investigated for removing these EDCs, including adsorption by activated carbon, chemical advanced oxidation, chemical precipitation, or ozonation [24]. However, these treatments have drawbacks, such as low efficiencies when applied to real wastewater or high operational costs [25]. In this context, microalgae provide a promising solution for EDC elimination.
Microalgae are photosynthetic, free-floating microorganisms capable of forming filaments and colonies. They exhibit a remarkable ability to adapt to extreme ecological habitats. Through cellular activities, microalgae convert light and carbon dioxide (CO2) into various specialised chemicals, including carbohydrates, proteins, lipids, vitamins, and pigments [26]. Compared to previous processes, microalgae-based removal of EDCs offers distinct advantages, including the ability to fix CO2 [27] and nutrient removal from contaminated water [28]. Moreover, the grown biomass can be further processed for other uses, such as energy production [29]. The removal of EDCs using photosynthetic microorganisms can be driven through four main mechanisms: bioadsorption, bioaccumulation, biodegradation, and photodegradation [30]. The existing literature includes several examples demonstrating the effectiveness of microalgae in removing EDCs. For instance, Scenedesmus obliquus and C. vulgaris have been shown to achieve removal rates of 99% for BPA, 87% for E, and 100% for both MeP and PrP within 7 days [31]. Additionally, S. obliquus biodegraded 96.66 and 74.38% of 0.5 and 2 mg BP-3/L, respectively, in 10 days [32]. Other studies have evaluated the elimination of EDCs using a consortium with different microalgae and cyanobacteria, such as Anabaena cylindrica, Chlorococcus, Spirulina platensis, Chlorella, Scenedesmus quadricauda, and Anabaena sp., achieving approximately 80% removal within 6 days in an algae pond system [33]. Furthermore, Chlamydomonas mexicana and C. vulgaris can biodegrade 40% of BPA in 10 days [34]. However, all these studies primarily focus on eliminating one or two specific compounds or micropollutants within the same family, often with similar chemical structures. Consequently, there is still a lack of research on the simultaneous removal of mixtures of EDCs from different families using these microorganisms. Thus, the novelty of this work is aligned with this challenge, aiming to provide new insights into the removal and fate of these pollutants using microalgae-based processes.
In this context, C. vulgaris and Scenedesmus sp. were cultivated to simultaneously remove EDCs (MeP, PrP, BuP, BP, BPA, and E) and nutrients from wastewater. The study included the determination of the main degradation pathways of each EDC (abiotic, bioadsorption, bioaccumulation, and biodegradation).
2. Materials and Methods
2.1. Chemical and reagents
MeP (CAS Number 99-76-3), PrP (CAS Number 94-13-3), BuP (CAS Number 94-26-8), BP (CAS Number 119-61-9), BPA (CAS Number 80-05-7) and E (CAS Number 53-16-7, purity ≥99%) were purchased from Sigma–Aldrich (St Louis, MO, USA). Methanol LC-MS grade and acetonitrile HPLC grade were acquired from Scharlau (Barcelona, Spain). Mili-Q and distilled water were produced in Autwomatic plus 1+2 (Wasserlab. Barbatáin, Spain). Salts (NaCl, CaCl2, MgSO4·7H2O, KH2PO4, and NH4Cl) used in synthetic wastewater (SWW) preparation were acquired from Sigma-Aldrich (St Louis, MO, USA). Stock solutions for each EDC were prepared in methanol (1000 mg/L) and stored in darkness in the refrigerator at 4°C. More diluted solutions of 100 and 10 ppm containing all contaminants were prepared in SWW from stock solutions and kept also refrigerated.
2.2. Experiments
EDCs biodegradation was evaluated in the presence of microalgae, light, and aeration (LOM). On the other hand, abiotic removal of EDCs was assessed through control experiments conducted using light (L), aeration (O), and their combination (LO). All experiments were performed in 50 ml batch reactors, with a working volume of 48 mL, over 7 days.
2.2.1. LOM experiments
C. vulgaris and Scenedesmus sp. were the selected microalgae species, and the inoculums were acquired from the strain collection of Banco Español de Algas (Las Palmas de Gran Canarias, Spain). The SWW used for microalgae cultivation was prepared according to [35]: 7 mg NaCl, 4 mg CaCl2, 2 mg MgSO4·7H2O, 15 mg KH2PO4, 115.6 mg NH4Cl per liter of deionized water. Reactors in LOM experiments were loaded with a combination of SWW and microalgae inoculum to achieve an initial biomass concentration of 0.1 g/L. Every reactor was additionally spiked with one ppm of each EDC stock solution. Control experiments without contaminants were also performed. Before reaching cultures, all experiments were developed under continuous aeration using air pumps and air filtering using 0.45 µm nylon membranes (Agilent Technologies. Santa Clara, CA, USA). Reactors were additionally irradiated using 12 V LED strips, offering an irradiance of 108 µmol·foton·m-2·s-1. The photoperiod was established as 12 hours of light followed by 12 hours of darkness. Biomass growth was monitored daily. Dry cell weight (DCW) was determined by filtering 12 mL of microalgae culture through a pre-weighed nylon membrane (GVS. Bologna, Italy) and drying it at 56°C for one week. The dried filters were weighed, and DCW was calculated using weight balance. Additionally, pH was measured daily using a pH meter (XS Instruments. Modena, Italy).
2.2.2. Abiotic experiments
Reactors for L, O, and LO experiments were filled with SWW and spiked with 4.8 mL of 10 ppm stock solution. Experiments L and LO were carried out under light exposure, following the procedure used for LOM runs. Conversely, O experiments were conducted under dark conditions with reactors wrapped with aluminium foil and kept without light. O and LO experiments were conducted under the same aeration conditions as LOM assays.
2.3. Supernatant analysis
The concentration of EDCs in the supernatant was analysed daily for all samples using high-performance liquid chromatography (HPLC) (Agilent Technologies) equipped with a DAD detector (Agilent Technologies, model 1260 DAD WR) and an Ascentis Express C18 column (100 mm x 4.6 mm, 5 µm. Supelco, Merck. Darmstadt, Germany). The mobile phase consisted of acetonitrile (with 0.1% formic acid) and water in a ratio of 30:70 for MeP and 40:60 for the rest of EDCs detection. The flow rate was set to 1 mL/min. Detection wavelengths were established at 254 nm for parabens and BP and 210 nm for BPA and E. The signal-to-noise method was used to determine the limit of detection (LOD) and limit of quantification (LOQ). A signal-noise (S/N) ratio of three was adopted for LOD determination, and an S/N ratio of ten was selected for LOQ [36]. Results are shown in Supplementary Material (Table S1).
2.3.1. LOM experiments
Samples from LOM experiments were centrifuged at 3500 rpm for 20 minutes. The supernatant was separated from the microalga cell pellets and filtered using a 0.45 μm nylon membrane. Samples were concentrated with solid-phase extraction (SPE), using 500 mg Extrabond C18 cartridges (Scharlau. Barcelona, Spain), sequentially preconditioned with methanol and water. Analytes were finally eluted with 2 mL of methanol, and 10 µL of the eluent was injected for the HPLC analysis previously mentioned. The concentration of ammonia and phosphates were determined with 100683 and 100798 Spectroquant commercial kits, respectively (Merck. Darmstadt, Germany).
2.3.2. Abiotic experiments
Supernatants from L, O, and LO experiments were filtered through a 0.45 µm nylon membrane, and subsequently, EDCs were extracted and analysed by HPLC, as described for LOM experiments.
2.4. Mass balance
A comprehensive study on the removal mechanisms of EDCs by microalgae was conducted to assess the contribution of bioadsorption, bioaccumulation, and biodegradation pathways. The biodegradation percentage of each EDC can be calculated as:
Where At is the initial amount of each EDC added to the medium (μg at day 0). Ar is the amount of EDC in the supernatant in the LOM experiments. Ad is the amount of EDC adsorbed on the microalgal cell wall. This was calculated by harvesting microalga cells from supernatant in LOM experiments, washing with 1 mL of water, and centrifuging at 3500 rpm for 20 minutes (model 5810, Eppendorf. Hamburg, Germany). The washing water was discarded, and cell pellets were resuspended in 1 mL of methanol. Finally, the pellets were sonicated for 15 minutes (37 kHz, 820 W) with an Elmasonic P bath (Elma Schmidbauer. Singen, Germany) to release EDCs adsorbed on the cell wall. Then, the mixture was centrifuged again, and the adsorbed fraction was quantified, measuring EDC concentration in the solution by HPLC. Finally, Ac is the amount of EDC bioaccumulated inside the microalgal cells. To determine this value, 1 mL of methanol was added to the cell pellet after centrifugation, and the solution was kept under stirring at 900 rpm overnight. To ensure the cell wall lysis, samples were sonicated for 1 hour and then centrifuged at 3500 rpm for 20 min. The concentration of EDCs bioaccumulated by microalgae was determined from the resulting supernatant using HPLC. Finally, Aa is the amount of EDC removed by abiotic mechanisms. The results of the supernatant analysis in the LO experiments were used to estimate the removal fraction of EDCs by abiotic processes.
The kinetic constants for MeP, PrP, BuP, BP, BPA and E removal were also calculated for O, LO and LOM experiments using a pseudo-first order model as follows:
Where C0 is the initial concentration (ppb) of each pollutant at day 0, Ct is the EDC concentration (ppb) at time t, k is the removal rate constant (h-1), and t is the reaction time (h).
3. Results and discussions
3.1. Microalgae growth in the presence of EDCs
Scenedesmus sp. and C. vulgaris were grown separately in the presence (doped) or absence (control) of EDCs mix for 7 days in SWW (LOM experiments), and DCW was evaluated. Figure 1 (a) shows how both microalgae species can grow in culture media with ammonia as a nitrogen source. C. vulgaris demonstrated superior adaptation to SWW compared to Scenedesmus sp., resulting in an algal density of 0.55 and 0.67 g/L within 7 days for control and doped samples, respectively, whereas Scenedesmus sp. reached only 0.34 g/L and 0.29 g/L. C. vulgaris prefers ammonia as the optimal nitrogen source, even when both ammonia and nitrate are present in the culture media [37]. In contrast, Scenedesmus sp. exhibits lower algal density when ammonium is used as a nitrogen source, compared to nitrate or urea [38]. Similar growth for both species was observed in the absence and presence of EDCs. A paired samples t-test revealed that the presence of EDCs did not significantly impact microalgae growth (p-value > 0.05), except on day 1 for both species and day 7 for C. vulgaris (p-value < 0.05), where EDCs presence enhanced growth. This fact has also been reported in previous studies, suggesting that microalgae growth is not negatively affected by the presence of EDCs. Instead, microalgae may adapt to low doses of these compounds in culture media, potentially enhancing their growth. For instance, the microalgae Tetraselmis sp. demonstrated adaptation to EDCs in the culture media with one ppm of BPA and other EDCs, showing no adverse effects on cell growth [39]. Additionally, the growth of C. vulgaris could be enhanced in the presence of MeP concentrations ranging from 1 to 5 ppm [40].
As observed in Figure 1 (b), the pH of Scenedesmus sp. culture in the presence of EDCs continuously decays up to a pH value of approximately four after seven days. These acid conditions can be attributed to the release of H+ when ammonia is the nitrogen source [41]. The optimal pH range for Scenedesmus sp. is between 8.5 and 6.5, achieved on day 3 (Figure 1 (b)), which coincides with a decrease in biomass growth, as shown in Figure 1 (a) [42]. Other authors observed this fact, suggesting that the reduction in pH has an inhibitory effect on Scenedesmus sp. growth. This inhibition is primarily due to acidic conditions acting as enzyme photosynthesis inhibitors. Consequently, the disruption of photosystem II reactions results in a lower algal cell density [43].
The optimal pH for C. vulgaris ranged between 6.0 and 9.0 [44]. Figure 1 (b) shows a slight acidification trend for C. vulgaris culture up to a pH of 7. The highest growth rates were observed from day 4 to day 7, as depicted in Figure 1 (a). This increase in algal growth led to elevated algal photosynthetic activity. Some studies suggest that higher photosynthesis rates can lead to a rise in pH, thus preventing the acidification of the culture media [45]. This phenomenon, therefore, is observed in the growth of C. vulgaris in the presence of EDCs and explains the high growth rate achieved with this microalga.
3.2. Nutrient removal
Figure 2 shows ammonia and phosphate removal by Scenedesmus sp. (a) and C. vulgaris (b) in the presence of EDCs for 7 days (LOM experiments). Figure 2 (a) exhibits a complete phosphate depletion within 4 days of Scenedesmus sp. cultivation. Still, only 32% of ammonia was removed in 7 days. This low ammonia removal efficiency is associated with this microalga-limited growth. Thus, the simultaneous complete removal of phosphate restricts ammonia consumption, which has also been reported in previous studies. For example, Scenedesmus sp. LX1 completely removes (100%) of total phosphorus (TP) regardless of the N/P ratio, while the removal of total nitrogen (TN) strongly depends on that nutrient ratio [46]. A similar trend was observed when Scenedesmus sp. was cultivated under phosphorous-starved conditions. In this study, complete phosphorus depletion occurred within 11 days, but nitrogen removal remained negligible until that point [47].
Figure 2 (b) shows complete ammonia and phosphate removal in 7 days by C. vulgaris. This result agrees well with other reports in the literature. In this sense, C. sorokiniana completely depleted both ammonia and phosphorus in 7 days when the initial nitrogen concentration ranged from 20 to 40 mg N/L [48]. In addition, C. vulgaris cultivated in different anaerobic digestion effluents exhibited nearly 100% removal of ammonia and phosphates within 10 days, with an initial ammonia concentration of 40 mg N/L [49]. The total nutrient removal achieved during the cultivation of C. vulgaris in the presence of EDCs provides promising insights for the future development of WWTPs biological treatments based on microalgae.
3.3. EDCs removal
The influence of light, oxygen, and the presence of microalgae on EDC removal rates was studied for each contaminant. As shown in Figure 3 (a), (b), and (c), parabens do not exhibit a representative abiotic degradation (LO and O experiments). However, the presence of microalgae enhanced removal rates for these compounds, resulting in complete elimination within 7 days for both microalga species, exhibiting excellent performance to degrade these contaminants. These results agree with those observed by other authors. In this sense, high MeP degradation efficiency using C. vulgaris was reported, achieving the removal of 1 ppm of MeP within 2 days [40]. Furthermore, complete removal of MeP and PrP, starting at 47.4 and 3.8 ng/L, respectively, was achieved within 7 days using C. reinhardtii, S. obliquus, C. pyrenoidosa, and C. vulgaris, separately [31].
Regarding BP degradation, similar high removal efficiencies were observed regardless of the type of experiment, as shown in Figure 3 (d). Thus, the efficiencies of BP removal in the LOM experiments on day 7 were 86% and 62% for Scenedesmus sp. and C. vulgaris, respectively, slightly lower than the ones obtained in the O and LO experiments (91% and 95%, respectively). These results suggest that the primary degradation pathway for this compound was most likely abiotic. No differences in removal rates were observed When comparing O and LO experiments. Therefore, light does not significantly affect the elimination of BP, reaching only 20% of removal within 7 days, as demonstrated in the Supplementary Material Section (Figure S1), which presents the results of the L experiments.
Consequently, BP degradation may involve oxidation due to the presence of oxygen. Previous studies propose that the principal reactive oxygen species (ROS) involved in the photo-transformation of BP–3 are hydroxyl radicals (OH·) and superoxide radicals (·O2) [50]. In addition, other research hypothesised that BP may be degraded naturally when it is present in water at low concentration [51].
BPA degradation is shown in Figure 3 (e). This contaminant was removed in abiotic conditions (O and LO experiments) by 20%, which agrees with the results previously reported [34]. In addition, the photodegradation (L experiment) of BPA is negligible, as depicted in Figure S1 (Supplementary Material). Conversely, Scenedesmus sp. and C. vulgaris (LOM experiments) enhance BPA elimination up to 82% and 90% within 7 days, respectively. These results are aligned with previous studies, such as the removal rate of 96% for BPA within 90 hours using a consortium of Chlorophyceae class microalgae and cyanobacteria, using a starting initial BPA concentration of 10 ppb [52]. On the other hand, Li et al. (2009) reported a degradation of BPA nearly 92% within 16 days using Stephanodiscus hantzschii in a medium containing one ppm of this contaminant [53].
When analysing E removal, similar degradation values to those obtained for BPA were obtained (by 20%) in abiotic conditions (O and LO experiments) during the first three days, as depicted in Figure 3 (f). However, abiotic degradation became more significant from day 4 to 7. As shown in Figure S1 (Supplementary Material), light was not a significant factor in E removal. The potential synergistic effects between these pollutants were studied since BP and E were the only compounds that exhibited abiotic degradation. For this purpose, LO experiments were conducted without BP and E, keeping the operating conditions and the rest of the ECDs. Results indicated that E did not undergo abiotic degradation under LO conditions without B (Supplementary Material, Figure S2 (b)). However, BP exhibited a similar degradation trend in the culture media with or without E, with the degradation rate being even higher in the presence of E at day 7 (95% compared to 60%, respectively) (Supplementary Material, Figure S2 (a)). These findings suggest a positive synergistic effect on the degradation of BP and E when both compounds are present in the mixture. On the other hand, when C. vulgaris was included, a dramatic increase in removal efficiency was observed from day 4 to day 7, achieving a reduction of E by 83% within 7 days (Figure 3(f)).
Conversely, the presence of Scenedesmus sp. did not increase the percentage of E removed (70% in 7 days) compared to O experiments, but it was higher than in the LO experiments. During their growth, algae can produce algal extracellular organic matter (AEOM), mainly composed of biopolymers such as polysaccharides and proteinaceous substances. AEOM may promote the photochemical production of short-lived radicals, including excited triplet state dissolved organic matter (3DOM*), singlet oxygen (1O2), and OH·, which can contribute to the degradation processes of pollutants [54]. Previous studies suggest that C. vulgaris produces more AEOM than Scenedesmus quadricauda, potentially leading to more efficient photocatalytic degradation of estrogens [55]. Consequently, the high E removal values achieved with C. vulgaris from day 4 to 7 (Figure 3 (f)) coincide with the fastest growth rate during the exponential phase for this species (Figure 1 (a)), a period characterised by the highest metabolic activity in which AEOM release increases [54].
The differences in AEOM release could explain the variation in final E removal between C. vulgaris and Scenedesmus sp. These removal results are aligned with previous research. For instance, a 79% reduction in E concentration was reported using Haematococcus pluvialis, Selenastrum capricornutum, and Scenedesmus quadricauda individually over 10 days [56]. Additionally, an overall E removal of 91% for S. obliquus and 52% for C. vulgaris in 5 days was demonstrated [57]. In this study, Scenedesmus achieved a higher removal efficiency compared to C. vulgaris, which contrasts with our findings. This discrepancy could be attributed to differences in cultivation methods and the composition of the synthetic wastewater used. For instance, they employed a continuous cultivation mode, where reactors were fed daily, providing a more stable environment and consistent nutrient supply, potentially enhancing the performance of Scenedesmus over C. vulgaris.
Finally, the final removal percentages obtained for both microalgae after 7 days are presented in Table 1 and compared with previous literature. As explained previously, comparing these results with others reported in the literature is difficult due to the considerable influence of culture conditions, such as the presence of aeration and the composition of the culture media.
Regarding parabens, complete removal was achieved for both microalgae. These removal percentages are within the range described by other authors. As previously mentioned, 100% elimination of MeP and PrP using different microalgae species was reported [31]. Additionally, a PrP removal rate of approximately 89% was achieved from an initial concentration of 300 ng PrP/L, using an anoxic-aerobic photobioreactor with a consortium of Tetradesmus obliquus, C. vulgaris, Pseudanabaena sp., Scenedesmus sp., and Nitzscha sp. [58]. However, these studies employed lower initial concentrations than those reported in our work. When higher concentrations of parabens were studied, only 33% and 14% of MeP removal were obtained using C. vulgaris at initial concentrations of 0.8 and 8.0 mg MeP/L, respectively [59]. Given the scarcity of literature on BP microalgae removal, our results will be compared with those for similar molecules such as BP-3 or BP-4. In all cases, the removal values obtained in our study are superior to those reported in previous research. S. obliquus removed 23.3–28.5% of BP-3 after 10 days of cultivation, ranging from 0.1 to 3 mg BP-3/L [32]. A maximum BP-3 removal of 58.4% was achieved at an initial concentration of 0.01 μg BP-3/L using the green alga Chlamydomonas reinhardtii within 10 days, decreasing efficiency at higher pollutant concentration [60]. A removal rate of 14% at 1 mg BP-4/L was reported also using C. vulgaris [61]. The final BPA removal rates presented in Table 1 are higher than those reported by previous authors. Removal rates of 20.0%, 46.4%, 42.9%, and 43.0% were achieved using Chlorella pyrenoidosa after 120 h of culture with BPA concentrations of 2.0, 4.0, 6.0 and 8.0 mg BPA/L [62]. Microalgae C. mexicana and C. vulgaris achieved 39% and 28% removal, respectively, in a medium containing 1 mg BPA/L within 10 days [34]. Finally, the results of E removal are consistent with the previously shown literature. S. obliquus and C. vulgaris removed 91% and 52% of E, respectively [57], and other studies found E removal rates higher than 80% [56]. In summary, the results reported in our work are very promising and demonstrate the potential of using Scenedesmus sp. and C. vulgaris to simultaneously remove a variety of EDCs from wastewater, achieving ECD removal percentages, in general, higher than those reported in the literature.
To quantify degradation rates for each contaminant, kinetic constants were calculated from the above removal curves, assuming a pseudo-first-order model in all cases, according to equation (2). The values obtained (Table 2) indicate that the degradation rate is significantly higher when using microalgae compared to abiotic conditions, with C. vulgaris being superior to Scenedesmus sp. for parabens removal. For BP, the highest degradation rates were achieved under abiotic conditions, as explained above, reinforcing the hypothesis that the primary degradation pathway for this contaminant is driven in these conditions. Regarding BPA degradation, Table 2 shows that the rate constant values are higher when microalgae are present. This, along with the high removal efficiency values mentioned earlier, suggests the suitability of these species to degrade this compound. Finally, in the case of E removal, the rate constants were similar, obtaining higher values in the presence of microalgae.
3.4. Mass balance
Figure 4, Figure 5, Figure 6 and Figure 7 depict the contribution of the different removal mechanisms (abiotic, biosorption, bioaccumulation, and biodegradation) for the studied contaminants within 7 days. The results were calculated using equation (1) and expressed as the amount of contaminant removed with respect to its initial concentration for each experiment.
The primary removal mechanism for parabens in both species is biodegradation (Figure 4 (a), (b), (c), (d) and (f)). However, Scenedesmus sp. also showed a low percentage of biosorption and bioaccumulation of MeP (Figure 4 (a)) and PrP (Figure 4 (c)). The adsorbed fraction exhibited a consistent trend for these compounds, initially increasing from day 1 to day 3 (from 0.43 to 1.71% for MeP and from 0.57 to 1.44% for PrP), and subsequently decreasing until day 7, reaching less than 0.11% for MeP and 0.64% for PrP. On the other hand, the bioaccumulated fraction of MeP increased during the initial days from 0.04-0.11% to 0.88% but showed an almost complete reduction (<0.11%) by day 7. Conversely, the bioaccumulated fraction of PrP showed an upward trend from day 1 to day 7, increasing from less than 0.005% to 0.58%. These results suggest that MeP and PrP presented a slow diffusion into the cells, and probably MeP underwent biodegradation by intracellular enzymes. The adsorbed and bioaccumulated fractions for BuP (Figure 4 (e)) were negligible, accounting for less than 0.08% of the total contaminant concentration removed. The concentrations detected in both measurements were below the LOD.
The absence of parabens adsorbed by this species can be observed by analysing paraben removal results for C. vulgaris. In this sense, previous studies reported that MeP biosorption on this species is negligible due to the hydrophobicity of its cell wall [59]. This fact agrees with our results, which showed adsorbed fractions lower than 0.05% for MeP and PrP and ranged between 0.53 and 0.11% for BuP. Furthermore, the contribution of the bioaccumulation pathway to the removal of the studied parabens was also negligible. When EDCs are present inside microalgae cells, an oxidative stress defence mechanism may be triggered, leading to the formation of ROS in organelles. According to the literature, no excess ROS formation was observed during the growth of C. vulgaris in the presence of 0.8 mg MeP/L over 7 days, reinforcing the theory that parabens do not diffuse into the cells of this species [59]. Thus, biodegradation appeared as the main pathway for parabens degradation in C. vulgaris.
BP exhibited a remarkable abiotic degradation pathway (Figure 5 (a) and (b)). As previously explained, no significant differences were observed between removal efficiency in LO experiments (abiotic conditions) for BP regardless of the microalgae used, obtaining a p-value > 0.05 in both cases. Besides, BP showed low adsorption onto the cell wall, being this fraction higher when using C. vulgaris (Figure 5 (b)) compared to Scenedesmus sp. (Figure 5 (a)). As can be observed in Figure 5 (a) and Figure 5 (b), the contribution of the bioaccumulation pathway was negligible for both microalgae species. In the case of Scenedesmus sp., values ranging between 0.09 and 0.52% (concentrations between LQD and LOD) were obtained from day 1 to day 7. A similar trend was observed for C. vulgaris, ranging bioaccumulation percentages of BP between less than 0.12% (concentrations below the LOD) and 0.53% from day 1 to 7, respectively. Comparing the obtained results with previous studies on unsubstituted BP is challenging due to the scarcity of such studies. The most similar compounds found in the literature are BP-3 and BP-4. In this way, Lee et al. (2020) achieved 97% biodegradation of 0.5 ppm of BP-3 within 10 days using S. obliquus, and approximately 3% attributed to abiotic removal [32]. Similarly, Huang et al. (2018) found negligible BP-4 adsorption and absorption onto C. vulgaris strains, with the concentration decreasing solely due to biodegradation, achieving 14% at one mgBP-4/L within 13 days [61]. The lower abiotic degradation observed in the literature compared to our research is attributed to differences in cultivation conditions. Specifically, their cultures were maintained only with agitation, without aeration, leading to the absence of oxygen-derived ROS in the culture medium, which promotes BP removal.
The main removal pathway for BPA using Scenedesmus sp. is biodegradation (Figure 6 (a)). Adsorption accounted for less than 1% of total removal during the two first days, decreasing to less than 0.06%. Additionally, BPA was not detected inside the cell, indicating that the bioaccumulated fraction was negligible, remaining below 0.06% (under LOD). Biosorption and bioaccumulation mainly contributed to BPA removal using C. vulgaris (Figure 6(b)). Both pathways were similar during the first three days, with bioaccumulation becoming predominant from day 4 onwards. These results agree with other authors, such as Ben Ouada et al. (2018), who reported abiotic removal of BPA by 19%, with the fraction removed by accumulation, adsorption, and biodegradation by 1.3%, 11.6%, and 40%, respectively, within 5 days using the alkaliphilic Chlorophyta Picocystis with an initial concentration of 25 mg BPA/L [63]. -Similarly, abiotic removal values of BPA by 15.0% were found, observing biodegradation pathway contribution by 25% using C. mexicana and C. vulgaris, respectively, at the end of the 10-day experiment with initial concentrations of 1 mg BPA/L [34].
As can be observed in Figure 7 (a) and (b), abiotic degradation and biodegradation are the main pathways to remove E. Comparing Scenedesmus sp. (Figure 7 (a)) and C. vulgaris (Figure 7 (b)), it can be observed that in the case of the former, E removal is carried out at earlier stages than in the latter. In contrast, C. vulgaris only presented a biodegradation contribution on the last day. As previously explained, C. vulgaris potentially releases AEOM at the end of the exponential growth phase, which promotes E degradation. Comparing our results is challenging because E is one of the least studied estrogens in this context, with limited previous research studies available. Additionally, among the existing studies, E is often examined as a degradation product of 17β-estradiol. For example, Ruksrithong and Phattarapattamawong (2019) found that adsorption accounted for 10% of total E removal using S. obliquus and C. vulgaris, identifying biodegradation as the primary removal mechanism for both species. The biodegradation of E by S. obliquus was 77%, whereas C. vulgaris degraded only 38% within 5 days [57]. As explained earlier, these results are only partially aligned with ours, primarily due to differences in cultivation.
4. Conclusions
Scenedemus sp. and C. vulgaris were used to remove various EDCs. The total removal ratios of parabens (MeP, PrP, and BuP) were higher in the presence of both microalgae, achieving a 100% removal within one or two days. Abiotic removal was not significant in this process, with biodegradation being the primary mechanism, while adsorption and bioaccumulation were negligible. BP and E exhibited high abiotic degradation, likely induced by derived oxygen ROS. However, the biodegradation pathway contributed significantly to E removal for both Scenedesmus sp. and C. vulgaris, achieving final degradation rates of 67% and 83%, respectively. Biodegradation was the primary degradation pathway for BPA combined with adsorption. The contribution of the latter pathway was higher in the case of C. vulgaris than in Scenedesmus sp., with final degradation percentages of 90% and 82%, respectively. Overall, the promising results obtained in this work are of interest in the field, as they demonstrate the suitability of Scenedesmus sp. and C. vulgaris for EDC removal. This was proven not only for a specific family of these contaminants but for a variety of them with different characteristics simultaneously, showing the potential application of these microalgae for EDC removal from wastewater. Besides, the findings reported in this work on the routes implied in EDC removal can be a benchmark for further studies on the metabolic pathways driven by microalgae in these processes. Finally, the results of this research can have future implications in using microalgae for wastewater treatment, serving as a starting point for scaling up these processes.
Supplementary Materials
The following supporting information can be downloaded at the website of this paper posted on Preprints.org. Table S1: Analytical parameters obtained for EDCs with HPLC-DAD for suspended fraction. LOD and LOQ; Figure S1: L experiment EDCs removal for MeP (black square), PrP (red circle), BuP (blue triangle), BP (green down triangle), BPA (purple diamond), and E (orange cross). Error bars represent ± standard error of the mean (n=3); Figure S2: BP removal (a) and E removal (b) for LO experiment (red triangle) and LO without E and BP (blue diamond). Error bars represent ± standard error of the mean (n=3).
Author Contributions
conceptualisation, JJE, GV and LFB; formal analysis, NG; funding acquisition, JJE, GV and LFB; investigation, NG; methodology, NG, RR, GV, JJE and LFB; supervision, JJE and LFB; writing—original draft preparation, NG and RR; writing—review and editing, RR, GV, JJE and LFB. All authors have read and agreed to the published version of the manuscript.
Funding
This research was funded by the Ministry of Science and Innovation, co-financed by European Social and Regional Development Funds (PID2020-114943RB-I00), the Community of Madrid, and the European Structural Funds (IND2020/AMB-17480) and RENUWAL network (320RT0005) financed by the CYTED Program.
Institutional Review Board Statement
Not applicable.
Informed Consent Statement
Not applicable.
Data Availability Statement
The original contributions presented in the study are included in the article; further inquiries can be directed to the corresponding author.
Acknowledgements
Not applicable.
Conflicts of Interest
The authors declare no conflicts of interest.
References
- Ahmed, M.B.; Zhou, J.L.; Ngo, H.H.; Guo, W.; Thomaidis, N.S.; Xu, J. Progress in the Biological and Chemical Treatment Technologies for Emerging Contaminant Removal from Wastewater: A Critical Review. J Hazard Mater 2017, 323, 274–298. [Google Scholar] [CrossRef]
- Virtuoso, S.; Raggi, C.; Maugliani, A.; Baldi, F.; Gentili, D.; Narciso, L. Toxicological Effects of Naturally Occurring Endocrine Disruptors on Various Human Health Targets: A Rapid Review. Toxics 2024, 12, 256. [Google Scholar] [CrossRef] [PubMed]
- Casals-Casas, C.; Desvergne, B. Endocrine Disruptors: From Endocrine to Metabolic Disruption. Annu Rev Physiol 2011, 73, 135–162. [Google Scholar] [CrossRef] [PubMed]
- Nowak, K.; Jabłońska, E.; Ratajczak-Wrona, W. Immunomodulatory Effects of Synthetic Endocrine Disrupting Chemicals on the Development and Functions of Human Immune Cells. Environ Int 2019, 125, 350–364. [Google Scholar] [CrossRef] [PubMed]
- Bolujoko, N.B.; Unuabonah, E.I.; Alfred, M.O.; Ogunlaja, A.; Ogunlaja, O.O.; Omorogie, M.O.; Olukanni, O.D. Toxicity and Removal of Parabens from Water: A Critical Review. Sci Total Environ 2021, 792, 148092. [Google Scholar] [CrossRef]
- Wu, M. hong; Li, J.; Xu, G.; Ma, L. dan; Li, J. jun; Li, J. song; Tang, L. Pollution Patterns and Underlying Relationships of Benzophenone-Type UV-Filters in Wastewater Treatment Plants and Their Receiving Surface Water. Ecotoxicol Environ Saf 2018, 152, 98–103. [Google Scholar] [CrossRef]
- Ohore, O.E.; Songhe, Z. Endocrine Disrupting Effects of Bisphenol A Exposure and Recent Advances on Its Removal by Water Treatment Systems. A Review. Sci Afr 2019, 5, e00135. [Google Scholar] [CrossRef]
- Barboza, L.S.; Sánchez, P.S.V.; Gil, S.A.A. Removal of Estrone in Water and Wastewater by Photocatalysis: A Systematic Review. Prod Limpia 2019, 14, 18–32. [Google Scholar] [CrossRef]
- Wu, C.C.; Shields, J.N.; Akemann, C.; Meyer, D.N.; Connell, M.; Baker, B.B.; Pitts, D.K.; Baker, T.R. The Phenotypic and Transcriptomic Effects of Developmental Exposure to Nanomolar Levels of Estrone and Bisphenol A in Zebrafish. Sci Total Environ 2021, 757, 143736. [Google Scholar] [CrossRef]
- Nowak, K.; Ratajczak-Wrona, W.; Górska, M.; Jabłońska, E. Parabens and Their Effects on the Endocrine System. Mol Cell Endocrinol 2018, 474, 238–251. [Google Scholar] [CrossRef]
- Koeppe, E.S.; Ferguson, K.K.; Colacino, J.A.; Meeker, J.D. Relationship between Urinary Triclosan and Paraben Concentrations and Serum Thyroid Measures in NHANES 2007-2008. Sci Total Environ 2013, 445–446, 299–305. [Google Scholar] [CrossRef] [PubMed]
- Ahmadkhaniha, R.; Mansouri, M.; Yunesian, M.; Omidfar, K.; Jeddi, M.Z.; Larijani, B.; Mesdaghinia, A.; Rastkari, N. Association of Urinary Bisphenol a Concentration with Type-2 Diabetes Mellitus. J Environ Health Sci Eng 2014, 12, 1–6. [Google Scholar] [CrossRef] [PubMed]
- Trasande, L.; Attina, T.M.; Blustein, J. Association between Urinary Bisphenol A Concentration and Obesity Prevalence in Children and Adolescents. JAMA 2012, 308, 1113–1121. [Google Scholar] [CrossRef] [PubMed]
- Li, Y.; Zhu, J.; Fan, J.; Cai, S.; Fan, C.; Zhong, Y.; Sun, L. Associations of Urinary Levels of Phenols and Parabens with Osteoarthritis among US Adults in NHANES 2005–2014. Ecotoxicol Environ Saf 2020, 192, 110293. [Google Scholar] [CrossRef] [PubMed]
- Silori, R.; Kumar, M.; Madhab Mahapatra, D.; Biswas, P.; Prakash Vellanki, B.; Mahlknecht, J.; Mohammad Tauseef, S.; Barcelo, D. Prevalence of Endocrine Disrupting Chemicals in the Urban Wastewater Treatment Systems of Dehradun, India: Daunting Presence of Estrone. Environ Res 2023, 235, 116673. [Google Scholar] [CrossRef] [PubMed]
- Błedzka, D.; Gromadzińska, J.; Wasowicz, W. Parabens. From Environmental Studies to Human Health. Environ Int 2014, 67, 27–42. [Google Scholar] [CrossRef]
- Gültekin, I.; Ince, N.H. Synthetic Endocrine Disruptors in the Environment and Water Remediation by Advanced Oxidation Processes. J Environ Manage 2007, 85, 816–832. [Google Scholar] [CrossRef]
- Servos, M.R.; Bennie, D.T.; Burnison, B.K.; Jurkovic, A.; McInnis, R.; Neheli, T.; Schnell, A.; Seto, P.; Smyth, S.A.; Ternes, T.A. Distribution of Estrogens, 17β-Estradiol and Estrone, in Canadian Municipal Wastewater Treatment Plants. Sci Total Environ 2005, 336, 155–170. [Google Scholar] [CrossRef]
- Singh, V.; Suthar, S. Occurrence, Seasonal Variation, Mass Loading and Fate of Pharmaceuticals and Personal Care Products (PPCPs) in Sewage Treatment Plants in Cities of Upper Ganges Bank, India. J Water Process Eng 2021, 44, 102399. [Google Scholar] [CrossRef]
- Yamazaki, E.; Yamashita, N.; Taniyasu, S.; Lam, J.; Lam, P.K.S.; Moon, H.B.; Jeong, Y.; Kannan, P.; Achyuthan, H.; Munuswamy, N.; et al. Bisphenol A and Other Bisphenol Analogues Including BPS and BPF in Surface Water Samples from Japan, China, Korea and India. Ecotoxicol Environ Saf 2015, 122, 565–572. [Google Scholar] [CrossRef]
- Lee, S.; Liao, C.; Song, G.J.; Ra, K.; Kannan, K.; Moon, H.B. Emission of Bisphenol Analogues Including Bisphenol A and Bisphenol F from Wastewater Treatment Plants in Korea. Chemosphere 2015, 119, 1000–1006. [Google Scholar] [CrossRef] [PubMed]
- Metcalfe, C.D.; Bayen, S.; Desrosiers, M.; Muñoz, G.; Sauvé, S.; Yargeau, V. An Introduction to the Sources, Fate, Occurrence and Effects of Endocrine Disrupting Chemicals Released into the Environment. Environ Res 2022, 207, 112658. [Google Scholar] [CrossRef] [PubMed]
- Al Sharabati, M.; Abokwiek, R.; Al-Othman, A.; Tawalbeh, M.; Karaman, C.; Orooji, Y.; Karimi, F. Biodegradable Polymers and Their Nano-Composites for the Removal of Endocrine-Disrupting Chemicals (EDCs) from Wastewater: A Review. Environ Res 2021, 202, 111694. [Google Scholar] [CrossRef] [PubMed]
- Azizi, D.; Arif, A.; Blair, D.; Dionne, J.; Filion, Y.; Ouarda, Y.; Pazmino, A.G.; Pulicharla, R.; Rilstone, V.; Tiwari, B.; et al. A Comprehensive Review on Current Technologies for Removal of Endocrine Disrupting Chemicals from Wastewaters. Environ Res 2022, 207, 112196. [Google Scholar] [CrossRef]
- Sutherland, D.L.; Ralph, P.J. Microalgal Bioremediation of Emerging Contaminants - Opportunities and Challenges. Water Res 2019, 164, 114921. [Google Scholar] [CrossRef]
- Oncel, S.S. Microalgae for a Macroenergy World. Renew Sustain Energy Rev 2013, 26, 241–264. [Google Scholar] [CrossRef]
- Tripathi, S.; Choudhary, S.; Meena, A.; Poluri, K.M. Carbon Capture, Storage, and Usage with Microalgae: A Review. Environ Chem Lett 2023, 21, 2085–2128. [Google Scholar] [CrossRef]
- Vazirzadeh, A.; Jafarifard, K.; Ajdari, A.; Chisti, Y. Removal of Nitrate and Phosphate from Simulated Agricultural Runoff Water by Chlorella vulgaris. Sci Total Environ 2022, 802, 149988. [Google Scholar] [CrossRef]
- Zabed, H.M.; Akter, S.; Yun, J.; Zhang, G.; Zhang, Y.; Qi, X. Biogas from Microalgae: Technologies, Challenges and Opportunities. Renew Sustain Energy Rev 2020, 117, 109503. [Google Scholar] [CrossRef]
- Narindri Rara Winayu, B.; Chu, F.J.; Sutopo, C.C.Y.; Chu, H. Bioprospecting Photosynthetic Microorganisms for the Removal of Endocrine Disruptor Compounds. World J Microbiol Biotechnol 2024, 40, 120. [Google Scholar] [CrossRef]
- Zhou, G.J.; Ying, G.G.; Liu, S.; Zhou, L.J.; Chen, Z.F.; Peng, F.Q. Simultaneous Removal of Inorganic and Organic Compounds in Wastewater by Freshwater Green Microalgae. Environ Sci Process Impacts 2014, 16, 2018–2027. [Google Scholar] [CrossRef] [PubMed]
- Lee, S.H.; Xiong, J.Q.; Ru, S.; Patil, S.M.; Kurade, M.B.; Govindwar, S.P.; Oh, S.E.; Jeon, B.H. Toxicity of Benzophenone-3 and Its Biodegradation in a Freshwater Microalga Scenedesmus Obliquus. J Hazard Mater 2020, 389, 122149. [Google Scholar] [CrossRef] [PubMed]
- Shi, W.; Wang, L.; Rousseau, D.P.L.; Lens, P.N.L. Removal of Estrone, 17α-Ethinylestradiol, and 17ß-Estradiol in Algae and Duckweed-Based Wastewater Treatment Systems. Environ Sci Pollut Res 2010, 17, 824–833. [Google Scholar] [CrossRef] [PubMed]
- Ji, M.K.; Kabra, A.N.; Choi, J.; Hwang, J.H.; Kim, J.R.; Abou-Shanab, R.A.I.; Oh, Y.K.; Jeon, B.H. Biodegradation of Bisphenol A by the Freshwater Microalgae Chlamydomonas mexicana and Chlorella vulgaris. Ecol Eng 2014, 73, 260–269. [Google Scholar] [CrossRef]
- Robles-Heredia, J.C.; Sacramento-Rivero, J.C.; Ruiz-Marín, A.; Baz-Rodríguez, S.; Canedo-López, Y.; Narváez-García, A. Evaluation of Cell Growth, Nitrogen Removal and Lipid Production by Chlorella vulgaris to Different Conditions of Aireation in Two Types of Annular Photobioreactors. Rev Mex Ing Quim 2016, 15, 361–377. [Google Scholar] [CrossRef]
- Shrivastava, A.; Gupta, V. Methods for the Determination of Limit of Detection and Limit of Quantitation of the Analytical Methods. Chron Young Sci 2011, 2, 21–25. [Google Scholar] [CrossRef]
- Ru, I.T.K.; Sung, Y.Y.; Jusoh, M.; Wahid, M.E.A.; Nagappan, T. Chlorella vulgaris: A Perspective on Its Potential for Combining High Biomass with High Value Bioproducts. Appl Phycol 2020, 1, 2–11. [Google Scholar] [CrossRef]
- Xin, L.; Hong-ying, H.; Ke, G.; Jia, Y. Growth and Nutrient Removal Properties of a Freshwater Microalga Scenedesmus sp. LX1 under Different Kinds of Nitrogen Sources. Ecol Eng 2010, 36, 379–381. [Google Scholar] [CrossRef]
- Yang, Q.; Xu, W.; Luan, T.; Pan, T.; Yang, L.; Lin, L. Comparative Responses of Cell Growth and Related Extracellular Polymeric Substances in Tetraselmis sp. to Nonylphenol, Bisphenol A and 17α-Ethinylestradiol. Environ Pollut 2021, 274, 116605. [Google Scholar] [CrossRef]
- Chang, X.; He, Y.; Song, L.; Ding, J.; Ren, S.; Lv, M.; Chen, L. Methylparaben Toxicity and Its Removal by Microalgae Chlorella vulgaris and Phaeodactylum tricornutum. J Hazard Mater 2023, 454, 131528. [Google Scholar] [CrossRef]
- Goldman, J.C.; Dennett, M.R.; Riley, C.B. Effect of Nitrogen-mediated Changes in Alkalinity on pH Control and CO2 Supply in Intensive Microalgal Cultures. Biotechnol Bioeng 1982, 24, 619–631. [Google Scholar] [CrossRef] [PubMed]
- Vinod, R. Maraskolhe Carbon Sequestration Potential of Scenedesmus Species (Microalgae) under the Fresh Water Ecosystem. Afr J Agr Res 2012, 7, 2818–2823. [Google Scholar] [CrossRef]
- Bakuei, N.; Amini, G.; Najafpour, G.D.; Jahanshahi, M.; Mohammadi, M. Optimal Cultivation of Scenedesmus sp. Microalgae in a Bubble Column Photobioreactor. Indian J Chem Technol 2015, 22, 20–25. [Google Scholar] [CrossRef]
- Makareviciene, Prof.Dr.V.; Andrulevičiūtė, V.; Skorupskaitė, V.; Kasperovičienė, J. Cultivation of Microalgae Chlorella sp. and Scenedesmus sp. as a Potentional Biofuel Feedstock. Environ Res Eng Manag 2011, 57, 21–27. [CrossRef]
- García, J.; Green, B.F.; Lundquist, T.; Mujeriego, R.; Hernández-Mariné, M.; Oswald, W.J. Long Term Diurnal Variations in Contaminant Removal in High Rate Ponds Treating Urban Wastewater. Bioresour Technol 2006, 97, 1709–1715. [Google Scholar] [CrossRef]
- Xin, L.; Hong-ying, H.; Ke, G.; Ying-xue, S. Effects of Different Nitrogen and Phosphorus Concentrations on the Growth, Nutrient Uptake, and Lipid Accumulation of a Freshwater Microalga Scenedesmus sp. Bioresour Technol 2010, 101, 5494–5500. [Google Scholar] [CrossRef]
- Wu, Y.H.; Yu, Y.; Li, X.; Hu, H.Y.; Su, Z.F. Biomass Production of a Scenedesmus sp. under Phosphorous-Starvation Cultivation Condition. Bioresour Technol 2012, 112, 193–198. [Google Scholar] [CrossRef]
- Kim, S.; Lee, Y.; Hwang, S.J. Removal of Nitrogen and Phosphorus by Chlorella sorokiniana Cultured Heterotrophically in Ammonia and Nitrate. Int Biodeterior Biodegradation 2013, 85, 511–516. [Google Scholar] [CrossRef]
- Dȩbowski, M.; Rusanowska, P.; Zieliński, M.; Dudek, M.; Romanowska-Duda, Z. Biomass Production and Nutrient Removal by Chlorella vulgaris from Anaerobic Digestion Effluents. Energies (Basel) 2018, 11, 1654. [Google Scholar] [CrossRef]
- Wang, N.; He, L.; Sun, X.; Li, X.; Li, M. The Transformation of Benzophenone-3 in Natural Waters and AOPs: The Roles of Reactive Oxygen Species and Potential Environmental Risks of Products. J Hazard Mater 2022, 427, 127941. [Google Scholar] [CrossRef]
- Chen, D.Y.; Guo, X.F.; Wang, H.; Zhang, H.S. The Natural Degradation of Benzophenone at Low Concentration in Aquatic Environments. Water Sci Technol 2015, 72, 503–509. [Google Scholar] [CrossRef] [PubMed]
- Abargues, M.R.; Ferrer, J.; Bouzas, A.; Seco, A. Removal and Fate of Endocrine Disruptors Chemicals under Lab-Scale Postreatment Stage. Removal Assessment Using Light, Oxygen and Microalgae. Bioresour Technol 2013, 149, 142–148. [Google Scholar] [CrossRef] [PubMed]
- Li, R.; Chen, G.Z.; Tam, N.F.Y.; Luan, T.G.; Shin, P.K.S.; Cheung, S.G.; Liu, Y. Toxicity of Bisphenol A and Its Bioaccumulation and Removal by a Marine Microalga Stephanodiscus hantzschii. Ecotoxicol Environ Saf 2009, 72, 321–328. [Google Scholar] [CrossRef] [PubMed]
- Tenorio, R.; Fedders, A.C.; Strathmann, T.J.; Guest, J.S. Impact of Growth Phases on Photochemically Produced Reactive Species in the Extracellular Matrix of Algal Cultivation Systems. Environ Sci (Camb) 2017, 3, 1095–1108. [Google Scholar] [CrossRef]
- Wu, P.H.; Yeh, H.Y.; Chou, P.H.; Hsiao, W.W.; Yu, C.P. Algal Extracellular Organic Matter Mediated Photocatalytic Degradation of Estrogens. Ecotoxicol Environ Saf 2021, 209, 111818. [Google Scholar] [CrossRef]
- Wang, Y.; Sun, Q.; Li, Y.; Wang, H.; Wu, K.; Yu, C.P. Biotransformation of Estrone, 17β-Estradiol and 17α-Ethynylestradiol by Four Species of Microalgae. Ecotoxicol Environ Saf 2019, 180, 723–732. [Google Scholar] [CrossRef]
- Ruksrithong, C.; Phattarapattamawong, S. Removals of Estrone and 17β-Estradiol by Microalgae Cultivation: Kinetics and Removal Mechanisms. Environ Technol (U. K.) 2019, 40, 163–170. [Google Scholar] [CrossRef]
- Ruas, G.; López-Serna, R.; Scarcelli, P.G.; Serejo, M.L.; Boncz, M.Á.; Muñoz, R. Influence of the Hydraulic Retention Time on the Removal of Emerging Contaminants in an Anoxic-Aerobic Algal-Bacterial Photobioreactor Coupled with Anaerobic Digestion. Sci Total Environ 2022, 827, 154262. [Google Scholar] [CrossRef]
- Vale, F.; Sousa, C.A.; Sousa, H.; Santos, L.; Simões, M. Impact of Parabens on Microalgae Bioremediation of Wastewaters: A Mechanistic Study. Chem Eng J 2022, 442, 136374. [Google Scholar] [CrossRef]
- Mao, F.; He, Y.; Kushmaro, A.; Gin, K.Y.H. Effects of Benzophenone-3 on the Green Alga Chlamydomonas reinhardtii and the Cyanobacterium Microcystis Aeruginosa. Aquat Toxicol 2017, 193, 1–8. [Google Scholar] [CrossRef]
- Huang, Y.; Luo, L.; Ma, X.Y.; Wang, X.C. Effect of Elevated Benzophenone-4 (BP4) Concentration on Chlorella vulgaris Growth and Cellular Metabolisms. Environ Sci Pollut Res 2018, 25, 32549–32561. [Google Scholar] [CrossRef] [PubMed]
- Fu, W.; Li, X.; Yang, Y.; Song, D. Enhanced Degradation of Bisphenol A: Influence of Optimization of Removal, Kinetic Model Studies, Application of Machine Learning and Microalgae-Bacteria Consortia. Sci Total Environ 2023, 858, 159876. [Google Scholar] [CrossRef] [PubMed]
- Ben Ouada, S.; Ben Ali, R.; Leboulanger, C.; Ben Ouada, H.; Sayadi, S. Effect of Bisphenol A on the Extremophilic Microalgal Strain Picocystis sp. (Chlorophyta) and Its High BPA Removal Ability. Ecotoxicol Environ Saf 2018, 158, 1–8. [Google Scholar] [CrossRef] [PubMed]
Figure 1.
(a) Growth curves during 7 days for Scenedesmus sp. in the presence (doped – solid green circle) or absence (control – open green circle) of EDCs and C. vulgaris in the presence (doped – solid orange square) or absence (control – open orange square) of EDCs. (b) pH curves over 7 days for doped Scenedesmus sp. (circle, dash green line) and C. vulgaris (square, dash orange line). Error bars represent ± standard error of the mean (n=3).
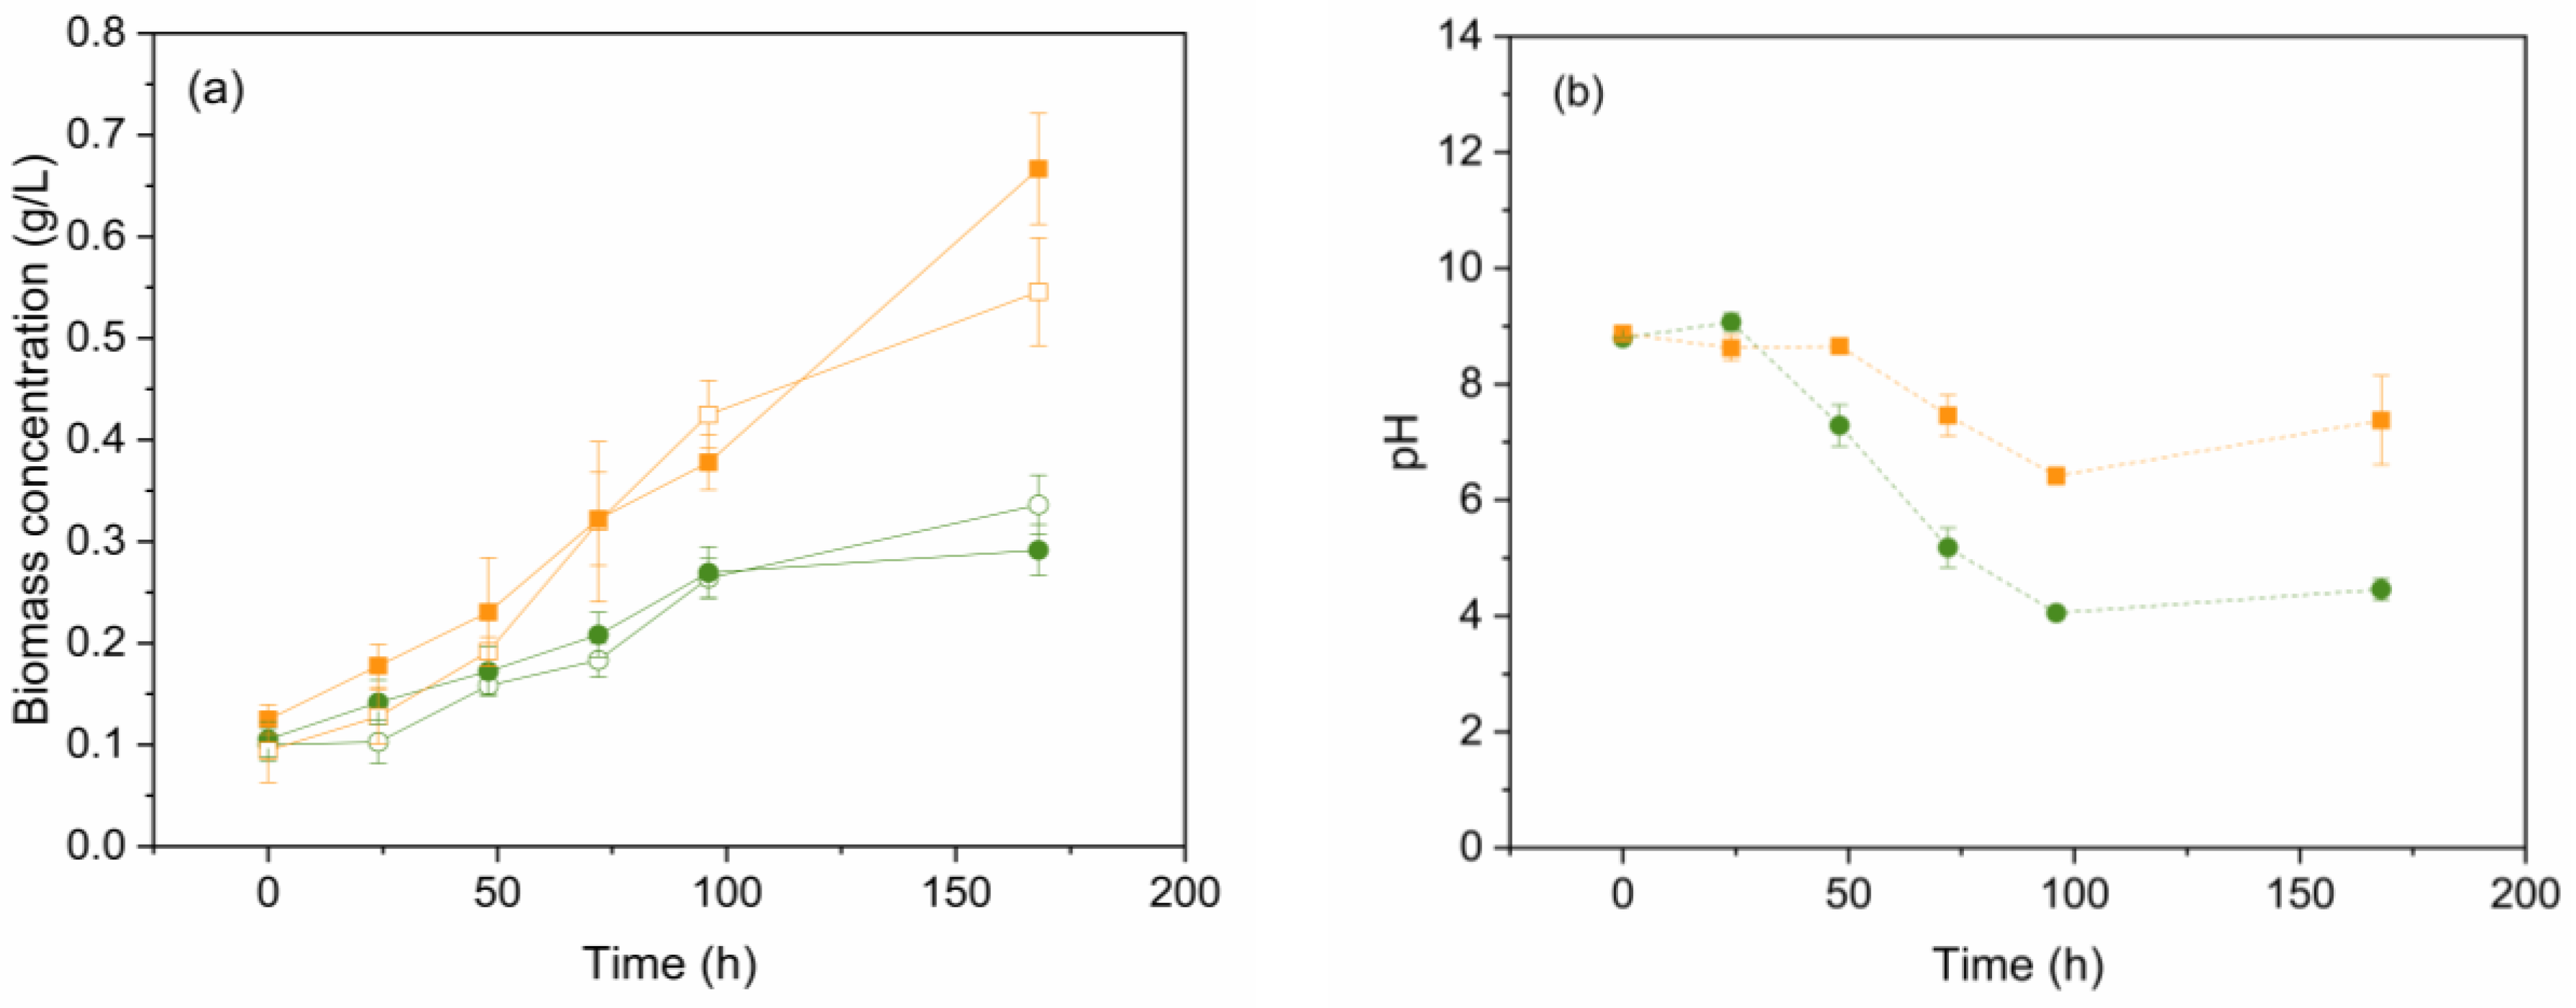
Figure 2.
Phosphate (brown cross) and ammonia (blue diamond) removal by (a) Scenedesmus sp. and (b) C. vulgaris in the presence of EDCs. Error bars represent ± standard error of the mean (n=3).
Figure 2.
Phosphate (brown cross) and ammonia (blue diamond) removal by (a) Scenedesmus sp. and (b) C. vulgaris in the presence of EDCs. Error bars represent ± standard error of the mean (n=3).
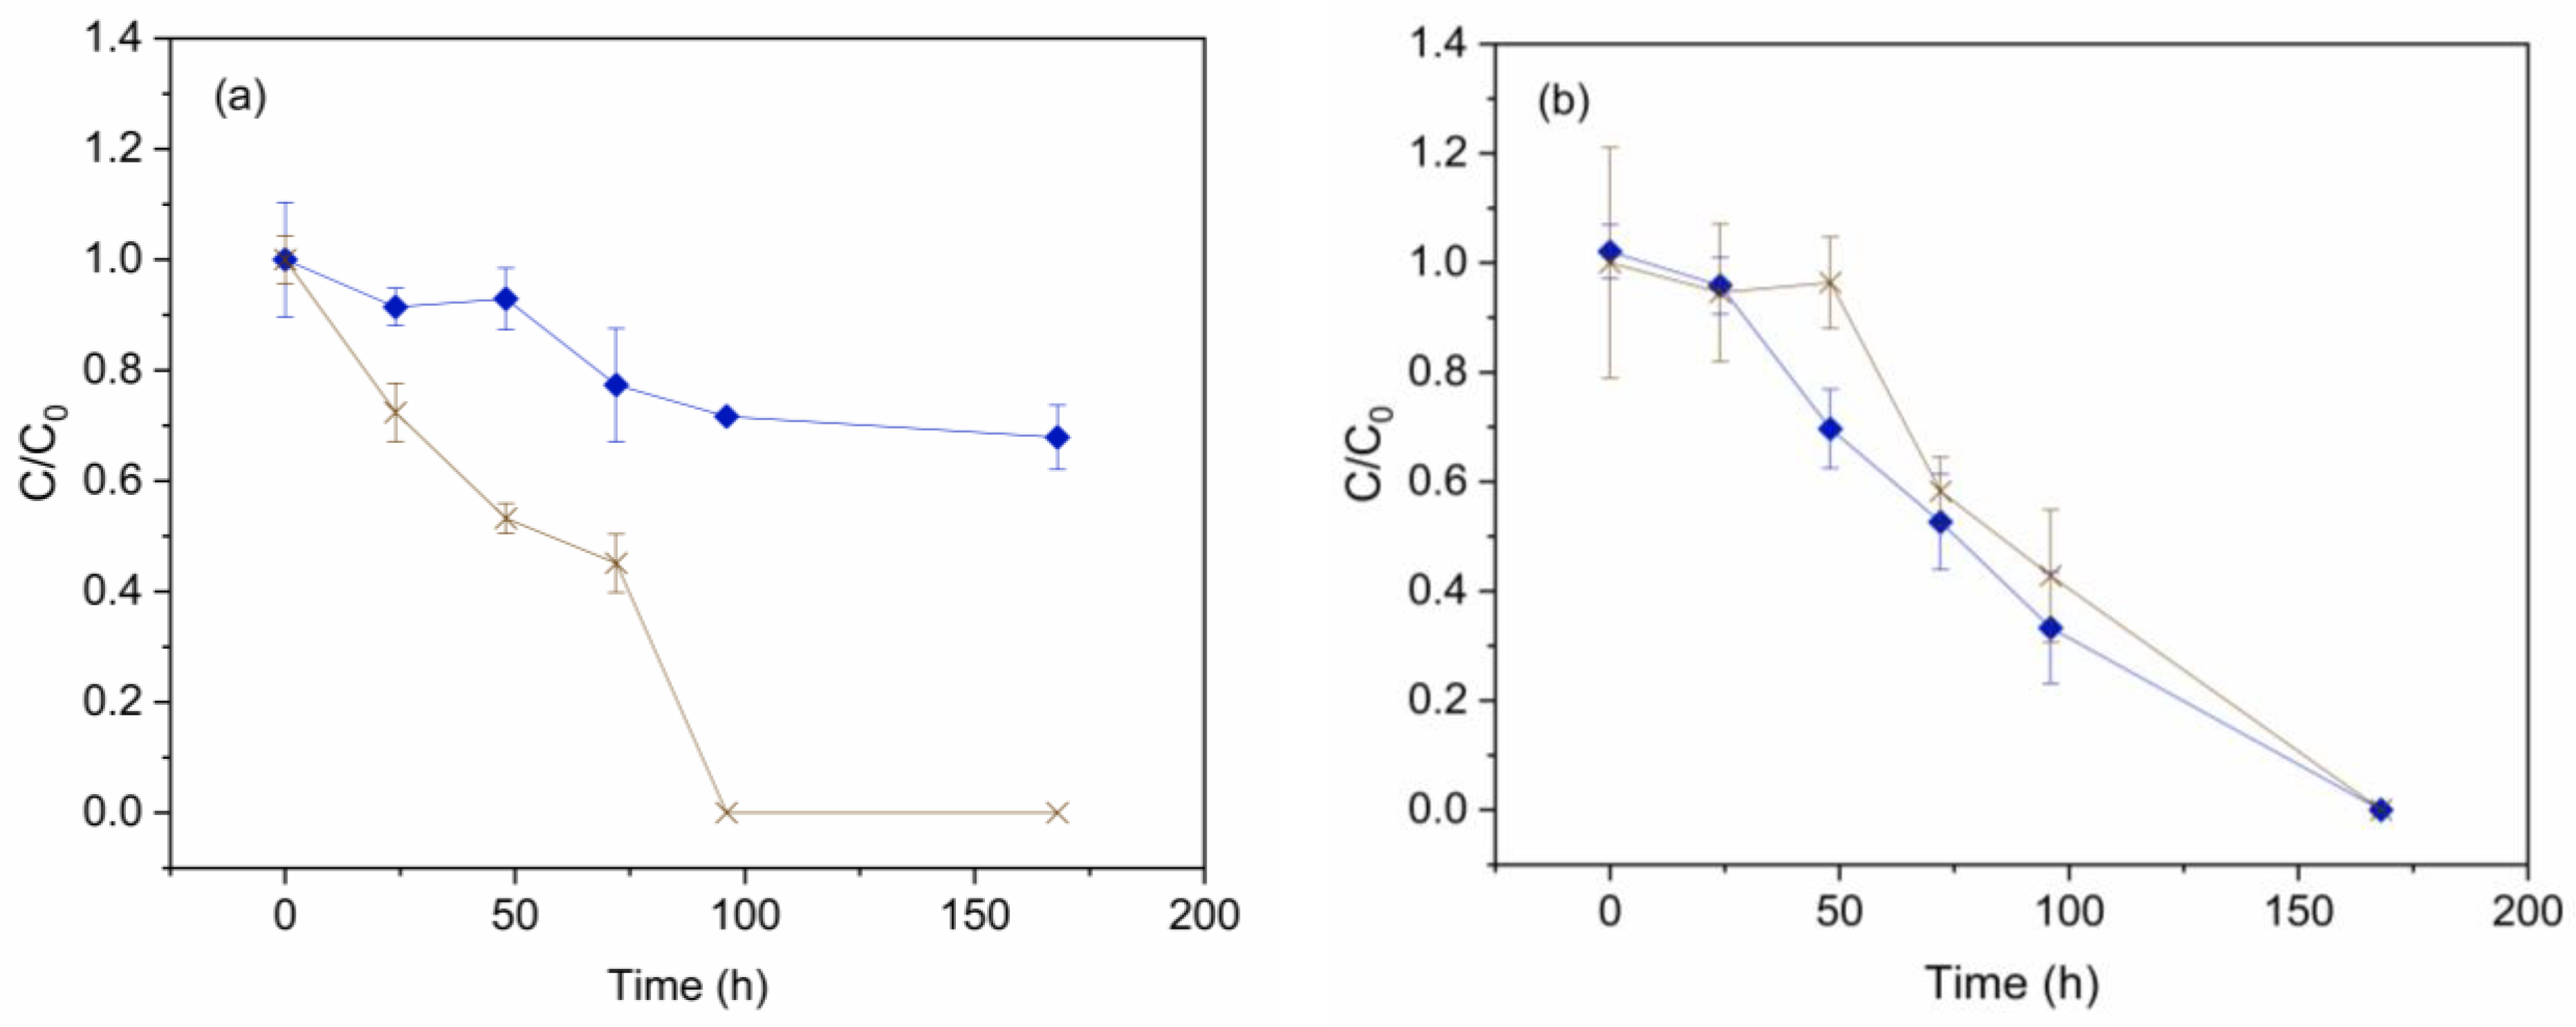
Figure 3.
EDC removal: O experiments (purple down triangle), LO experiments (red triangle), and LOM experiments with Scenedesmus sp. (green circle) or with C. vulgaris (orange square): (a) MeP, (b) PrP, (c) BuP, (d) BP (e) BPA and (f) E removal. Experiments were conducted for 7 days. Error bars represent ± standard error of the mean (n=3).
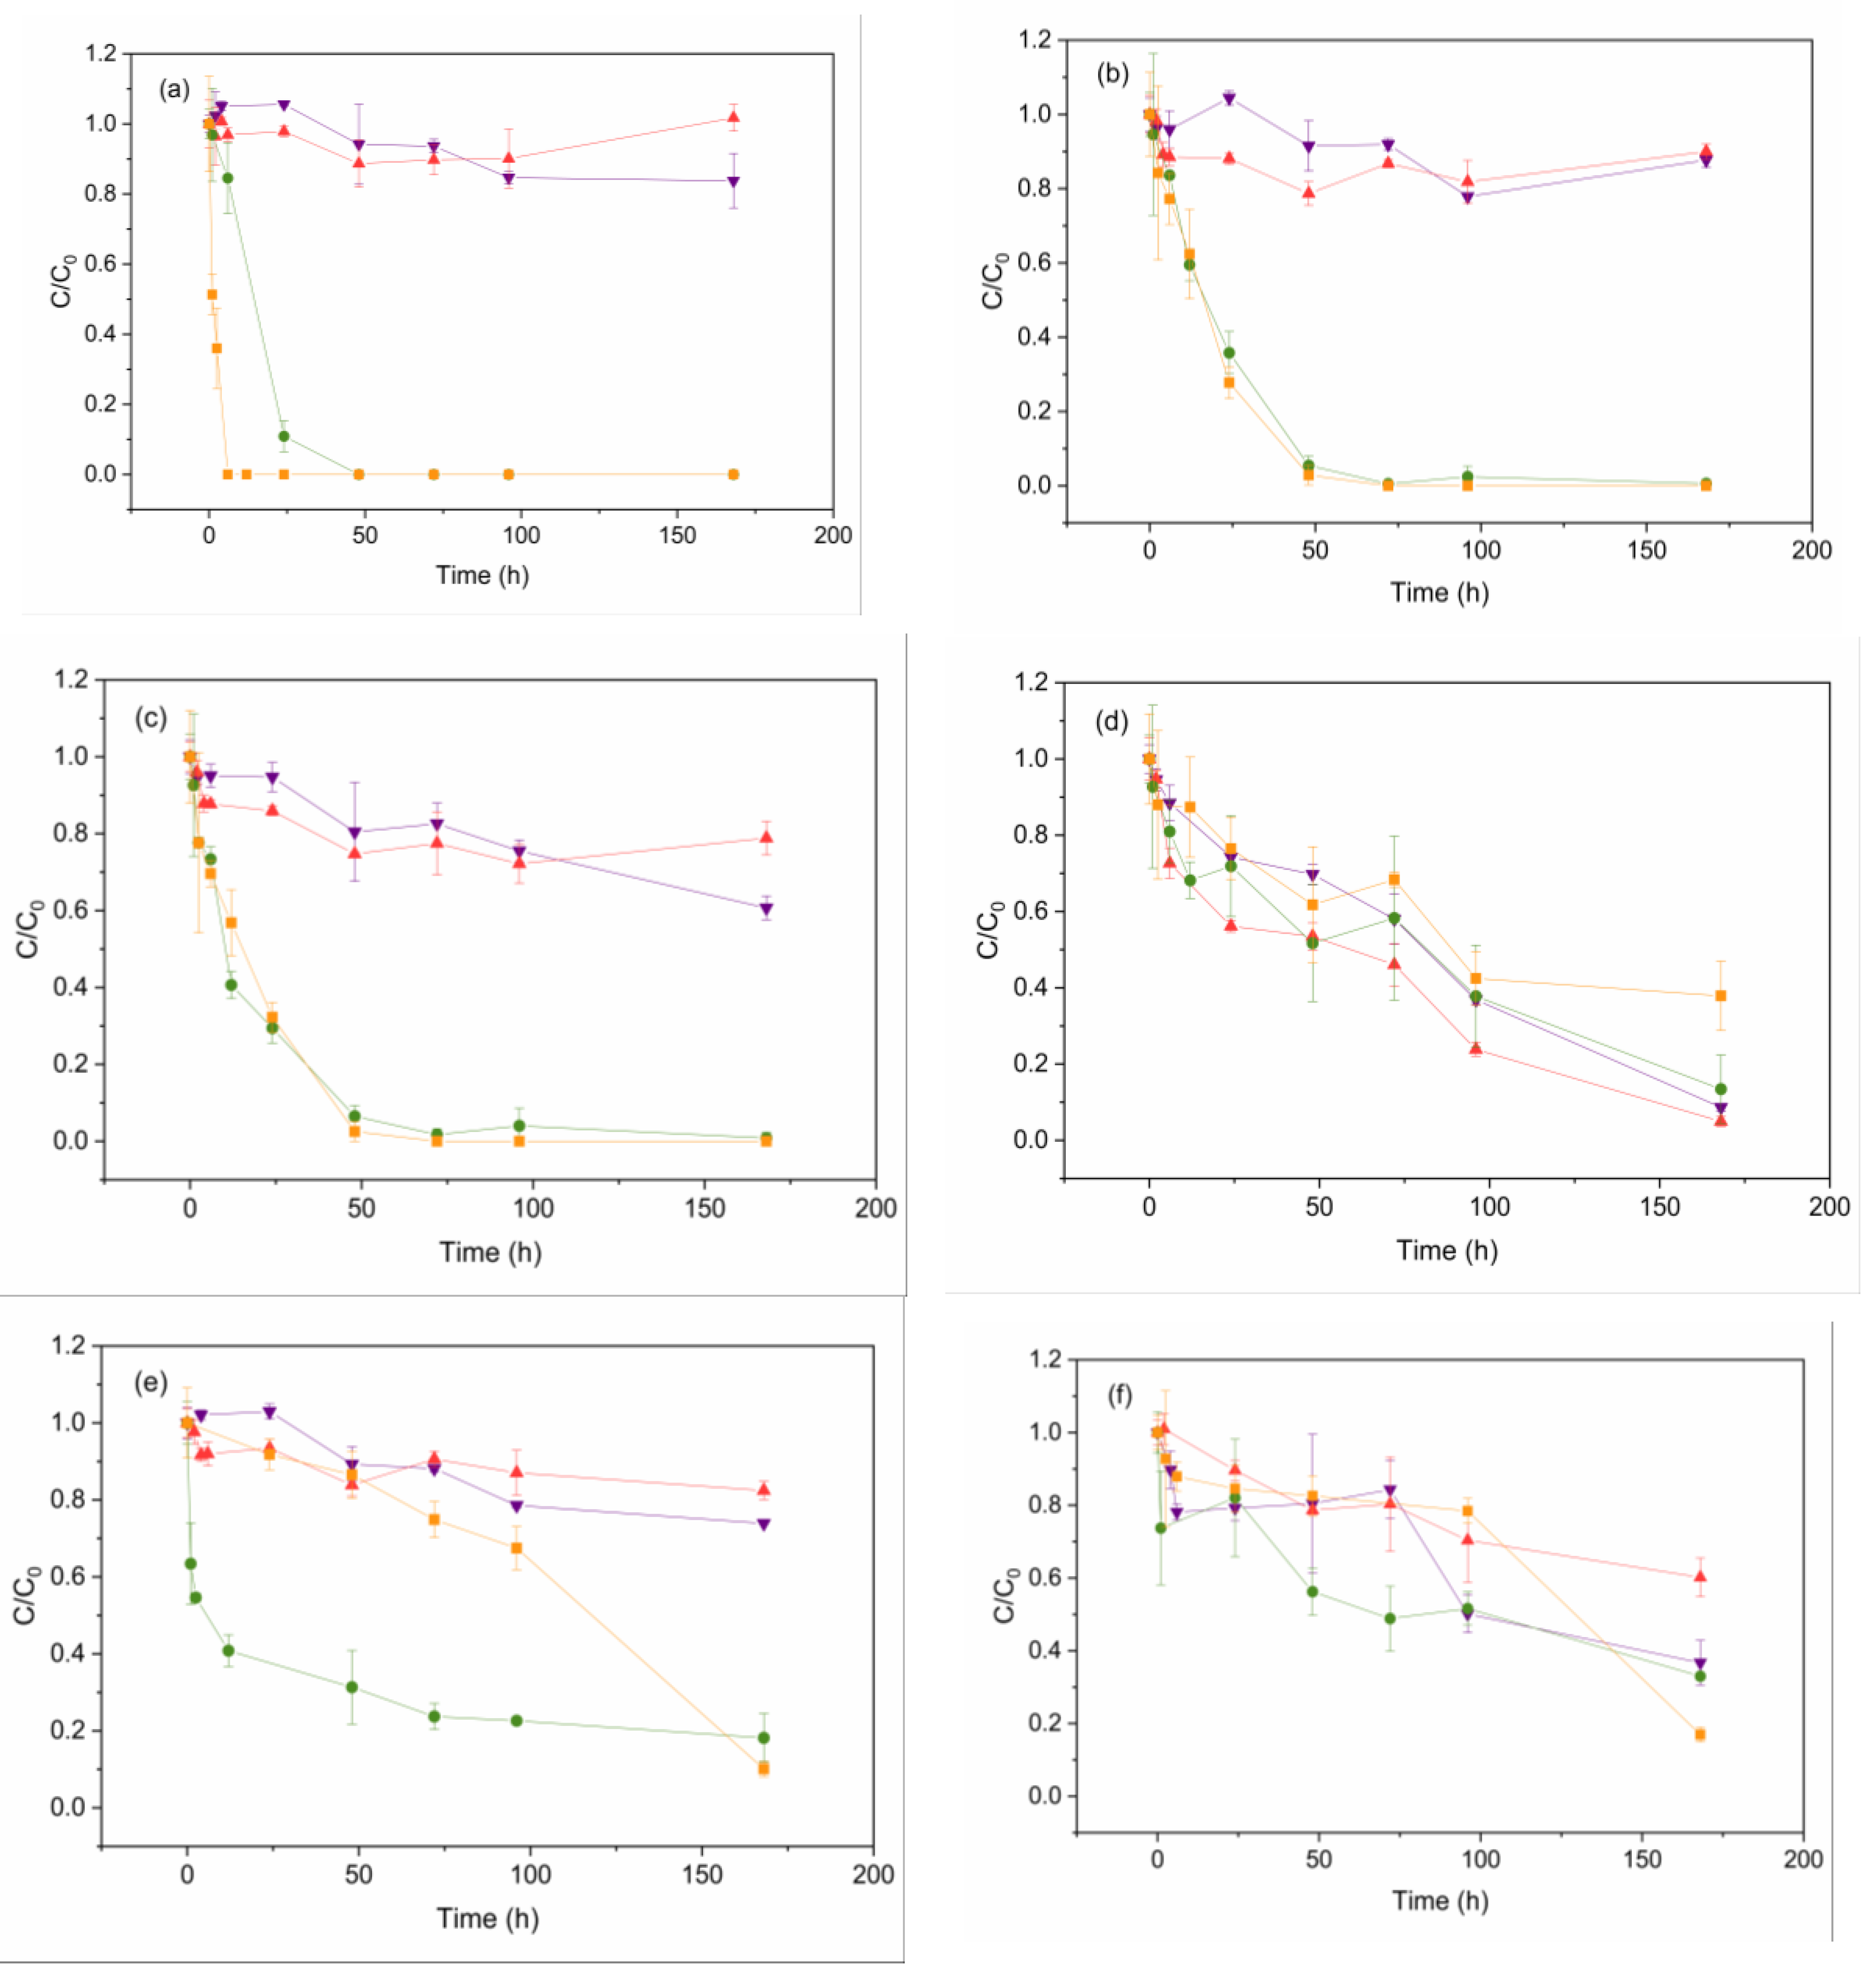
Figure 4.
Contribution (%) of abiotic degradation (yellow), biosorption (red), bioaccumulation (blue), and biodegradation (green Scenedesmus sp. and orange C. vulgaris) in MeP, PrP, and BuP removal by Scenedesmus sp. (a, c and e) and C. vulgaris (b, d, and f). Error bars represent ± standard error of the mean (n=3).

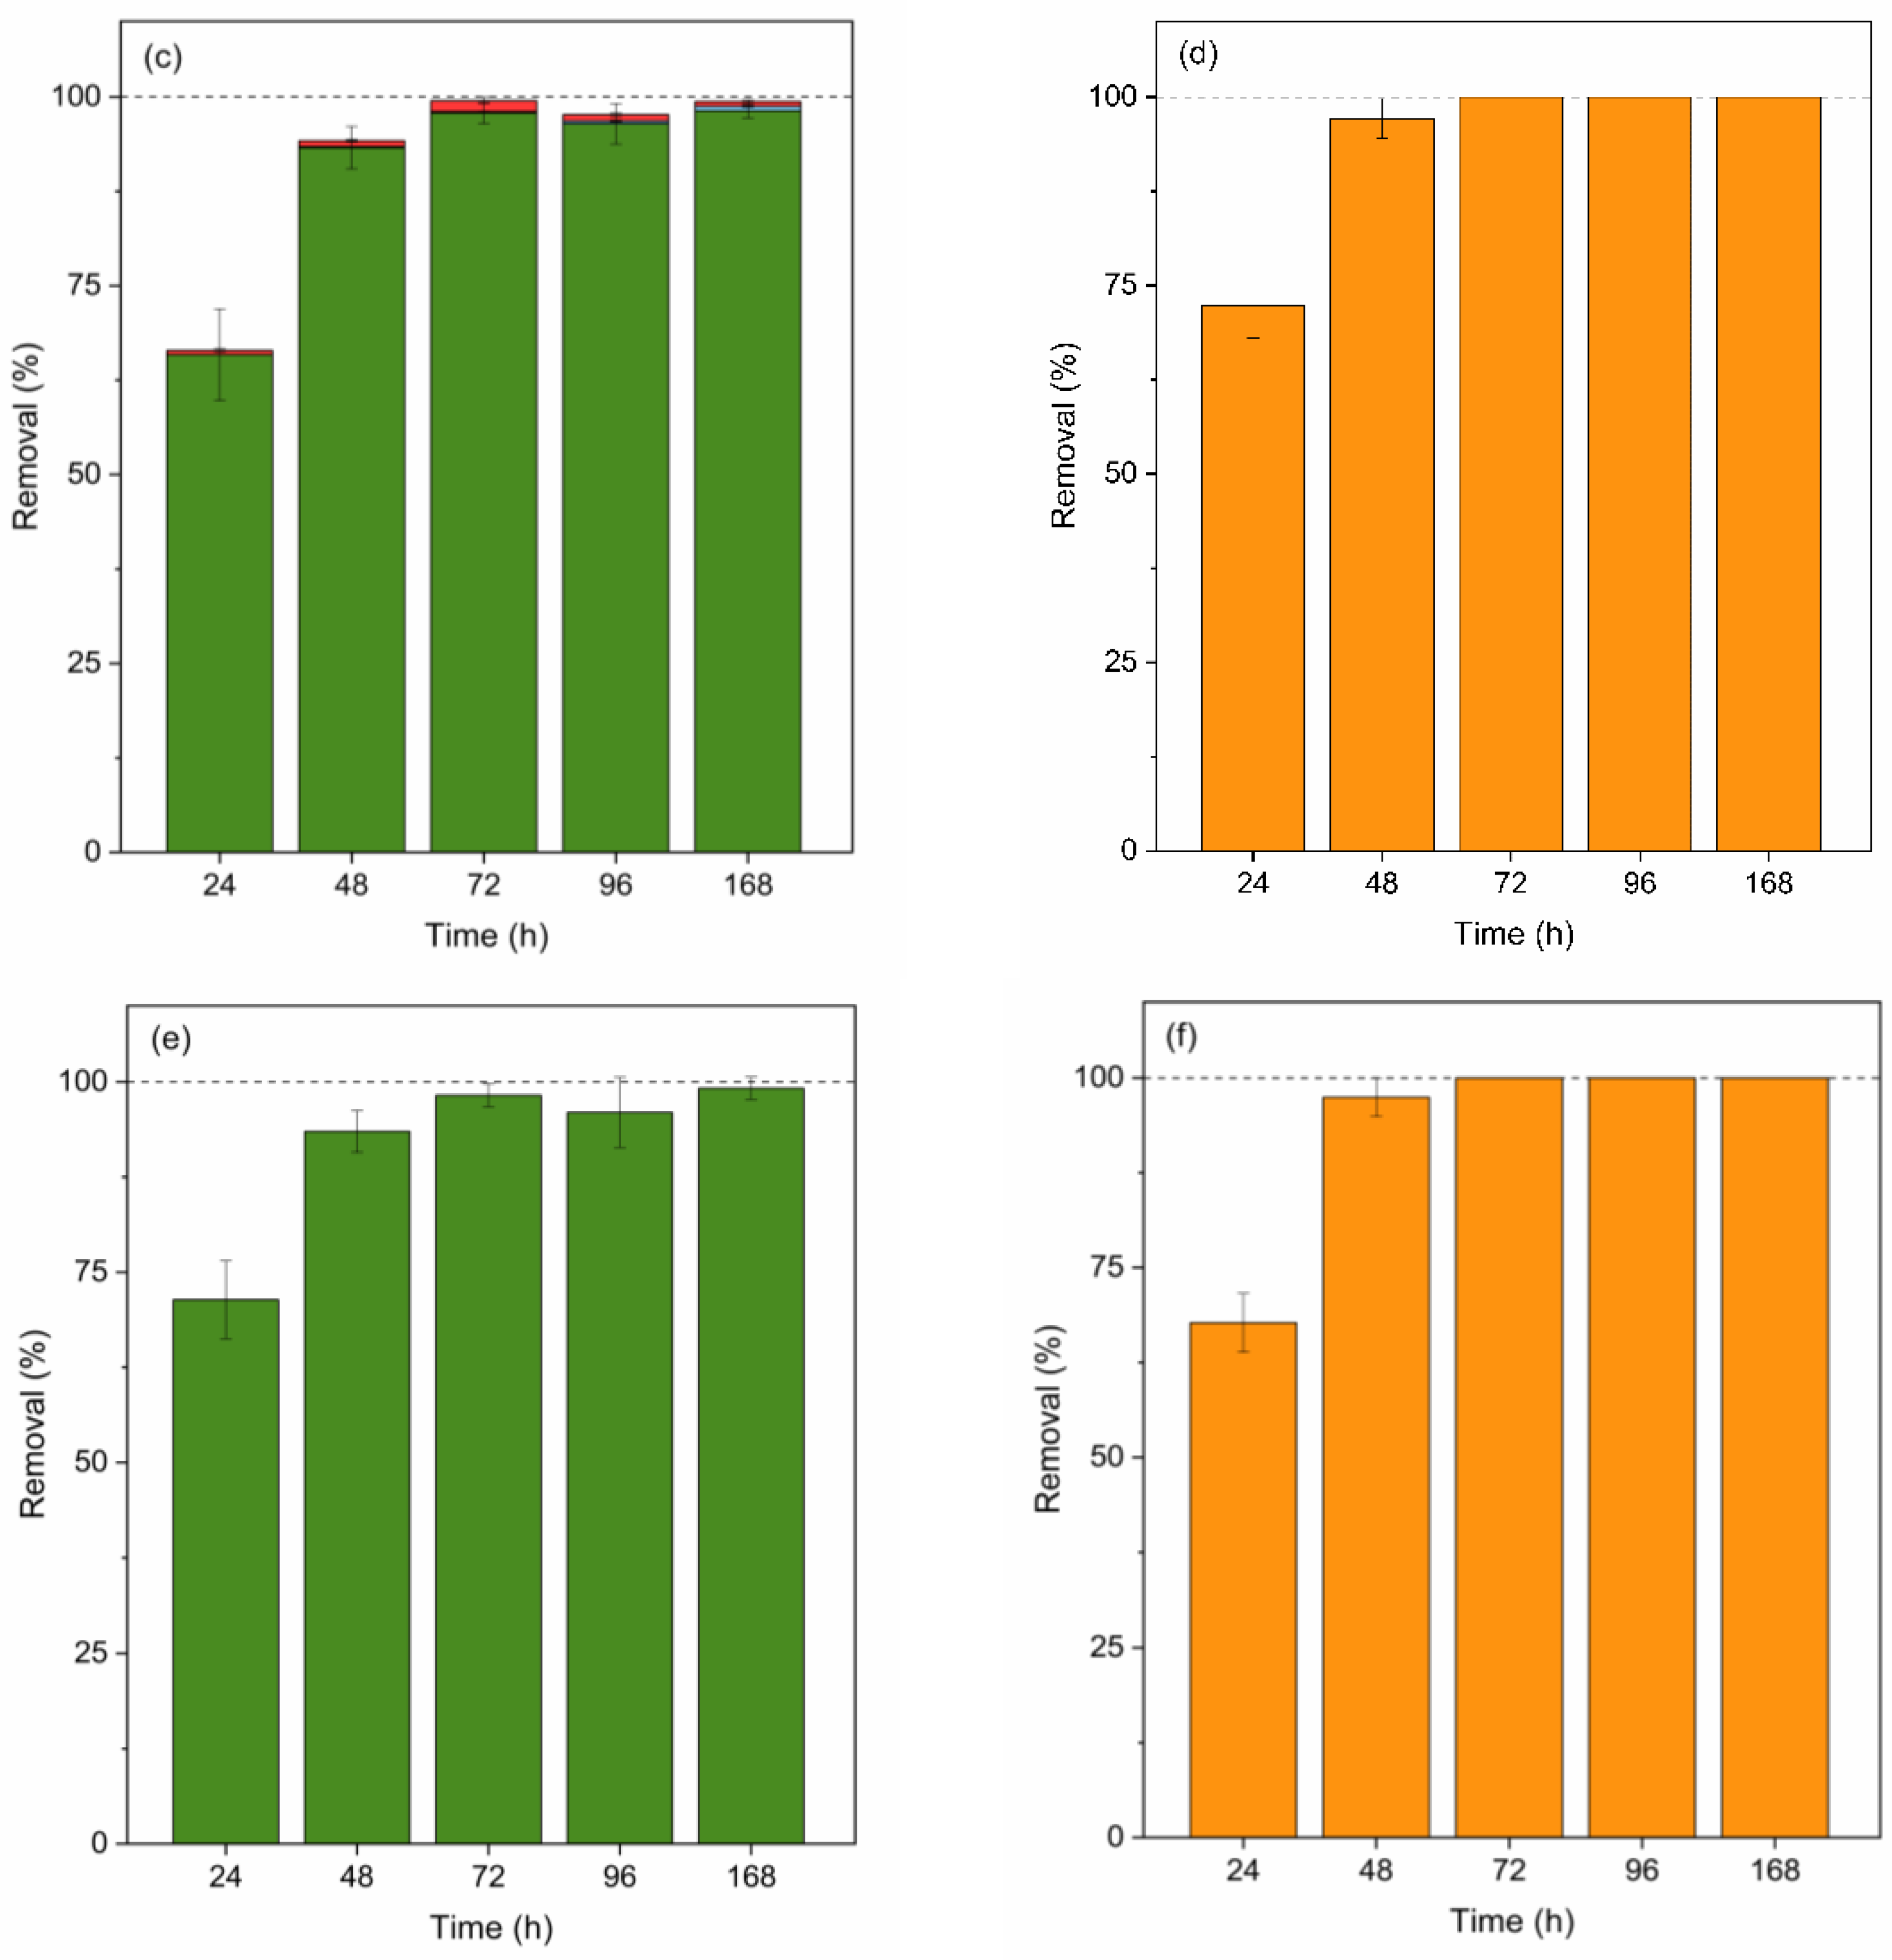
Figure 5.
Contribution (%) of abiotic degradation (yellow), biosorption (red), bioaccumulation (blue), and biodegradation (green Scenedesmus sp. and orange C. vulgaris) in BP removal by Scenedesmus sp. (a) and C. vulgaris (b). Error bars represent ± standard error of the mean (n=3).
Figure 5.
Contribution (%) of abiotic degradation (yellow), biosorption (red), bioaccumulation (blue), and biodegradation (green Scenedesmus sp. and orange C. vulgaris) in BP removal by Scenedesmus sp. (a) and C. vulgaris (b). Error bars represent ± standard error of the mean (n=3).
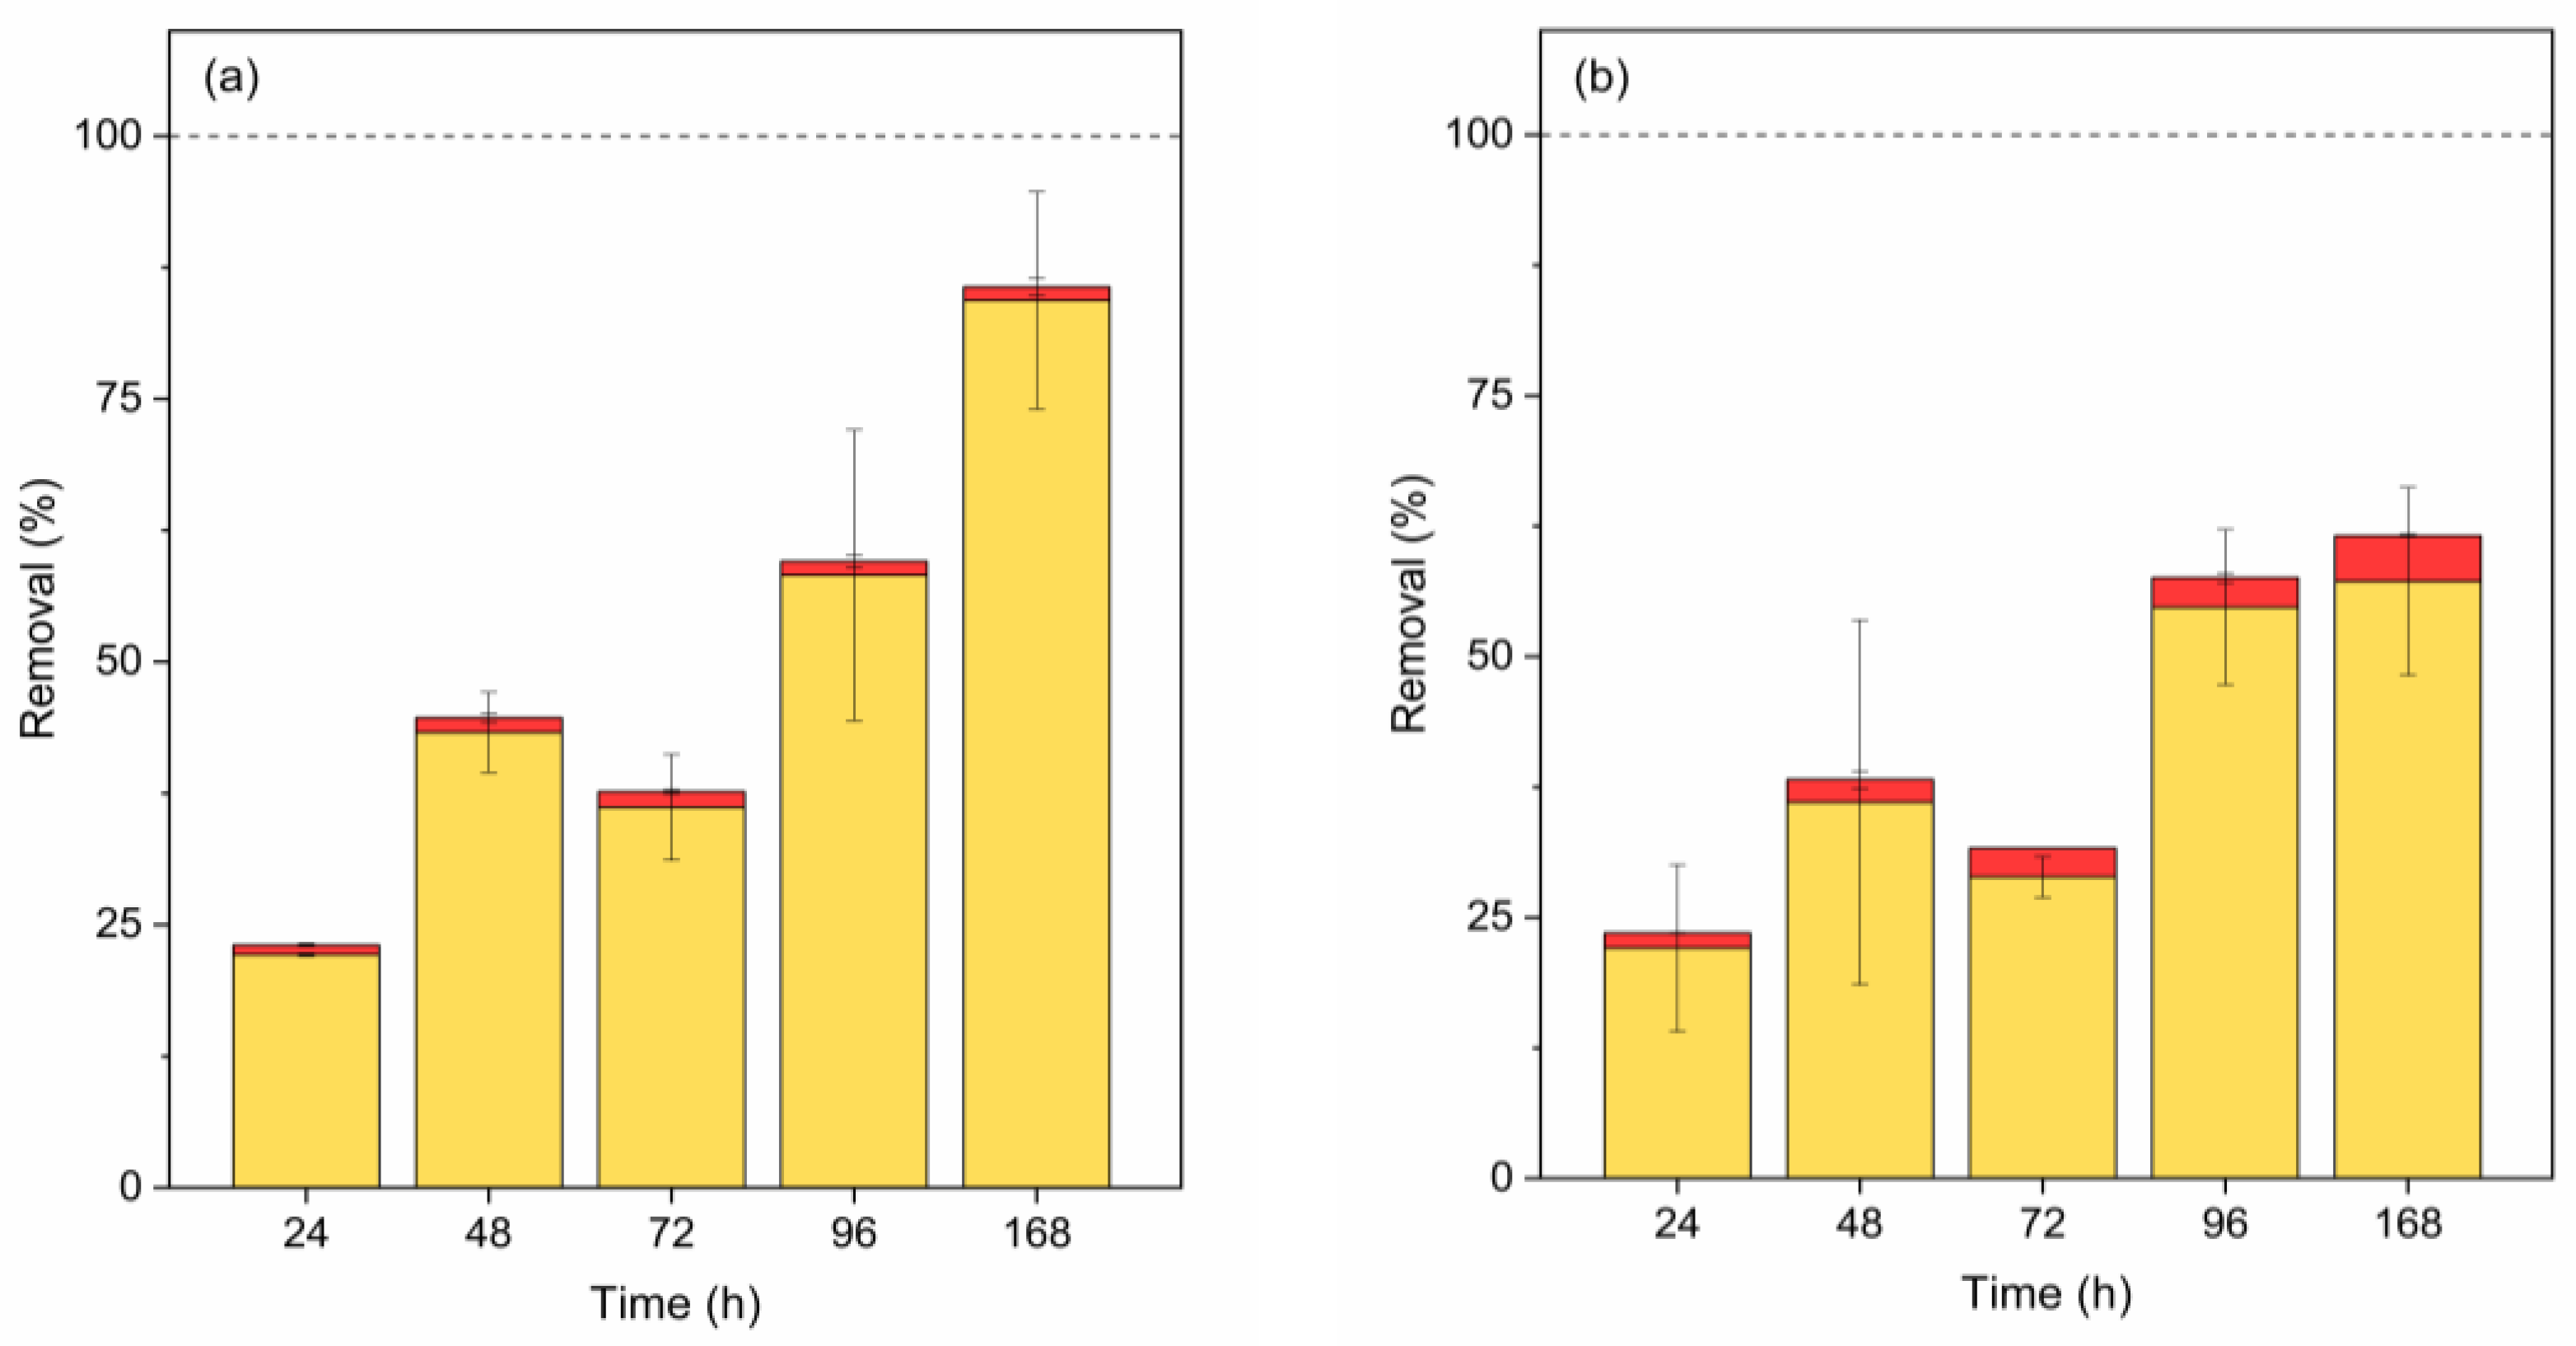
Figure 6.
Contribution (%) of abiotic degradation (yellow), biosorption (red), bioaccumulation (blue), and biodegradation (green Scenedesmus sp. and orange C. vulgaris) in BPA removal by Scenedesmus sp. (a) and C. vulgaris (b). Error bars represent ± standard error of the mean (n=3).
Figure 6.
Contribution (%) of abiotic degradation (yellow), biosorption (red), bioaccumulation (blue), and biodegradation (green Scenedesmus sp. and orange C. vulgaris) in BPA removal by Scenedesmus sp. (a) and C. vulgaris (b). Error bars represent ± standard error of the mean (n=3).
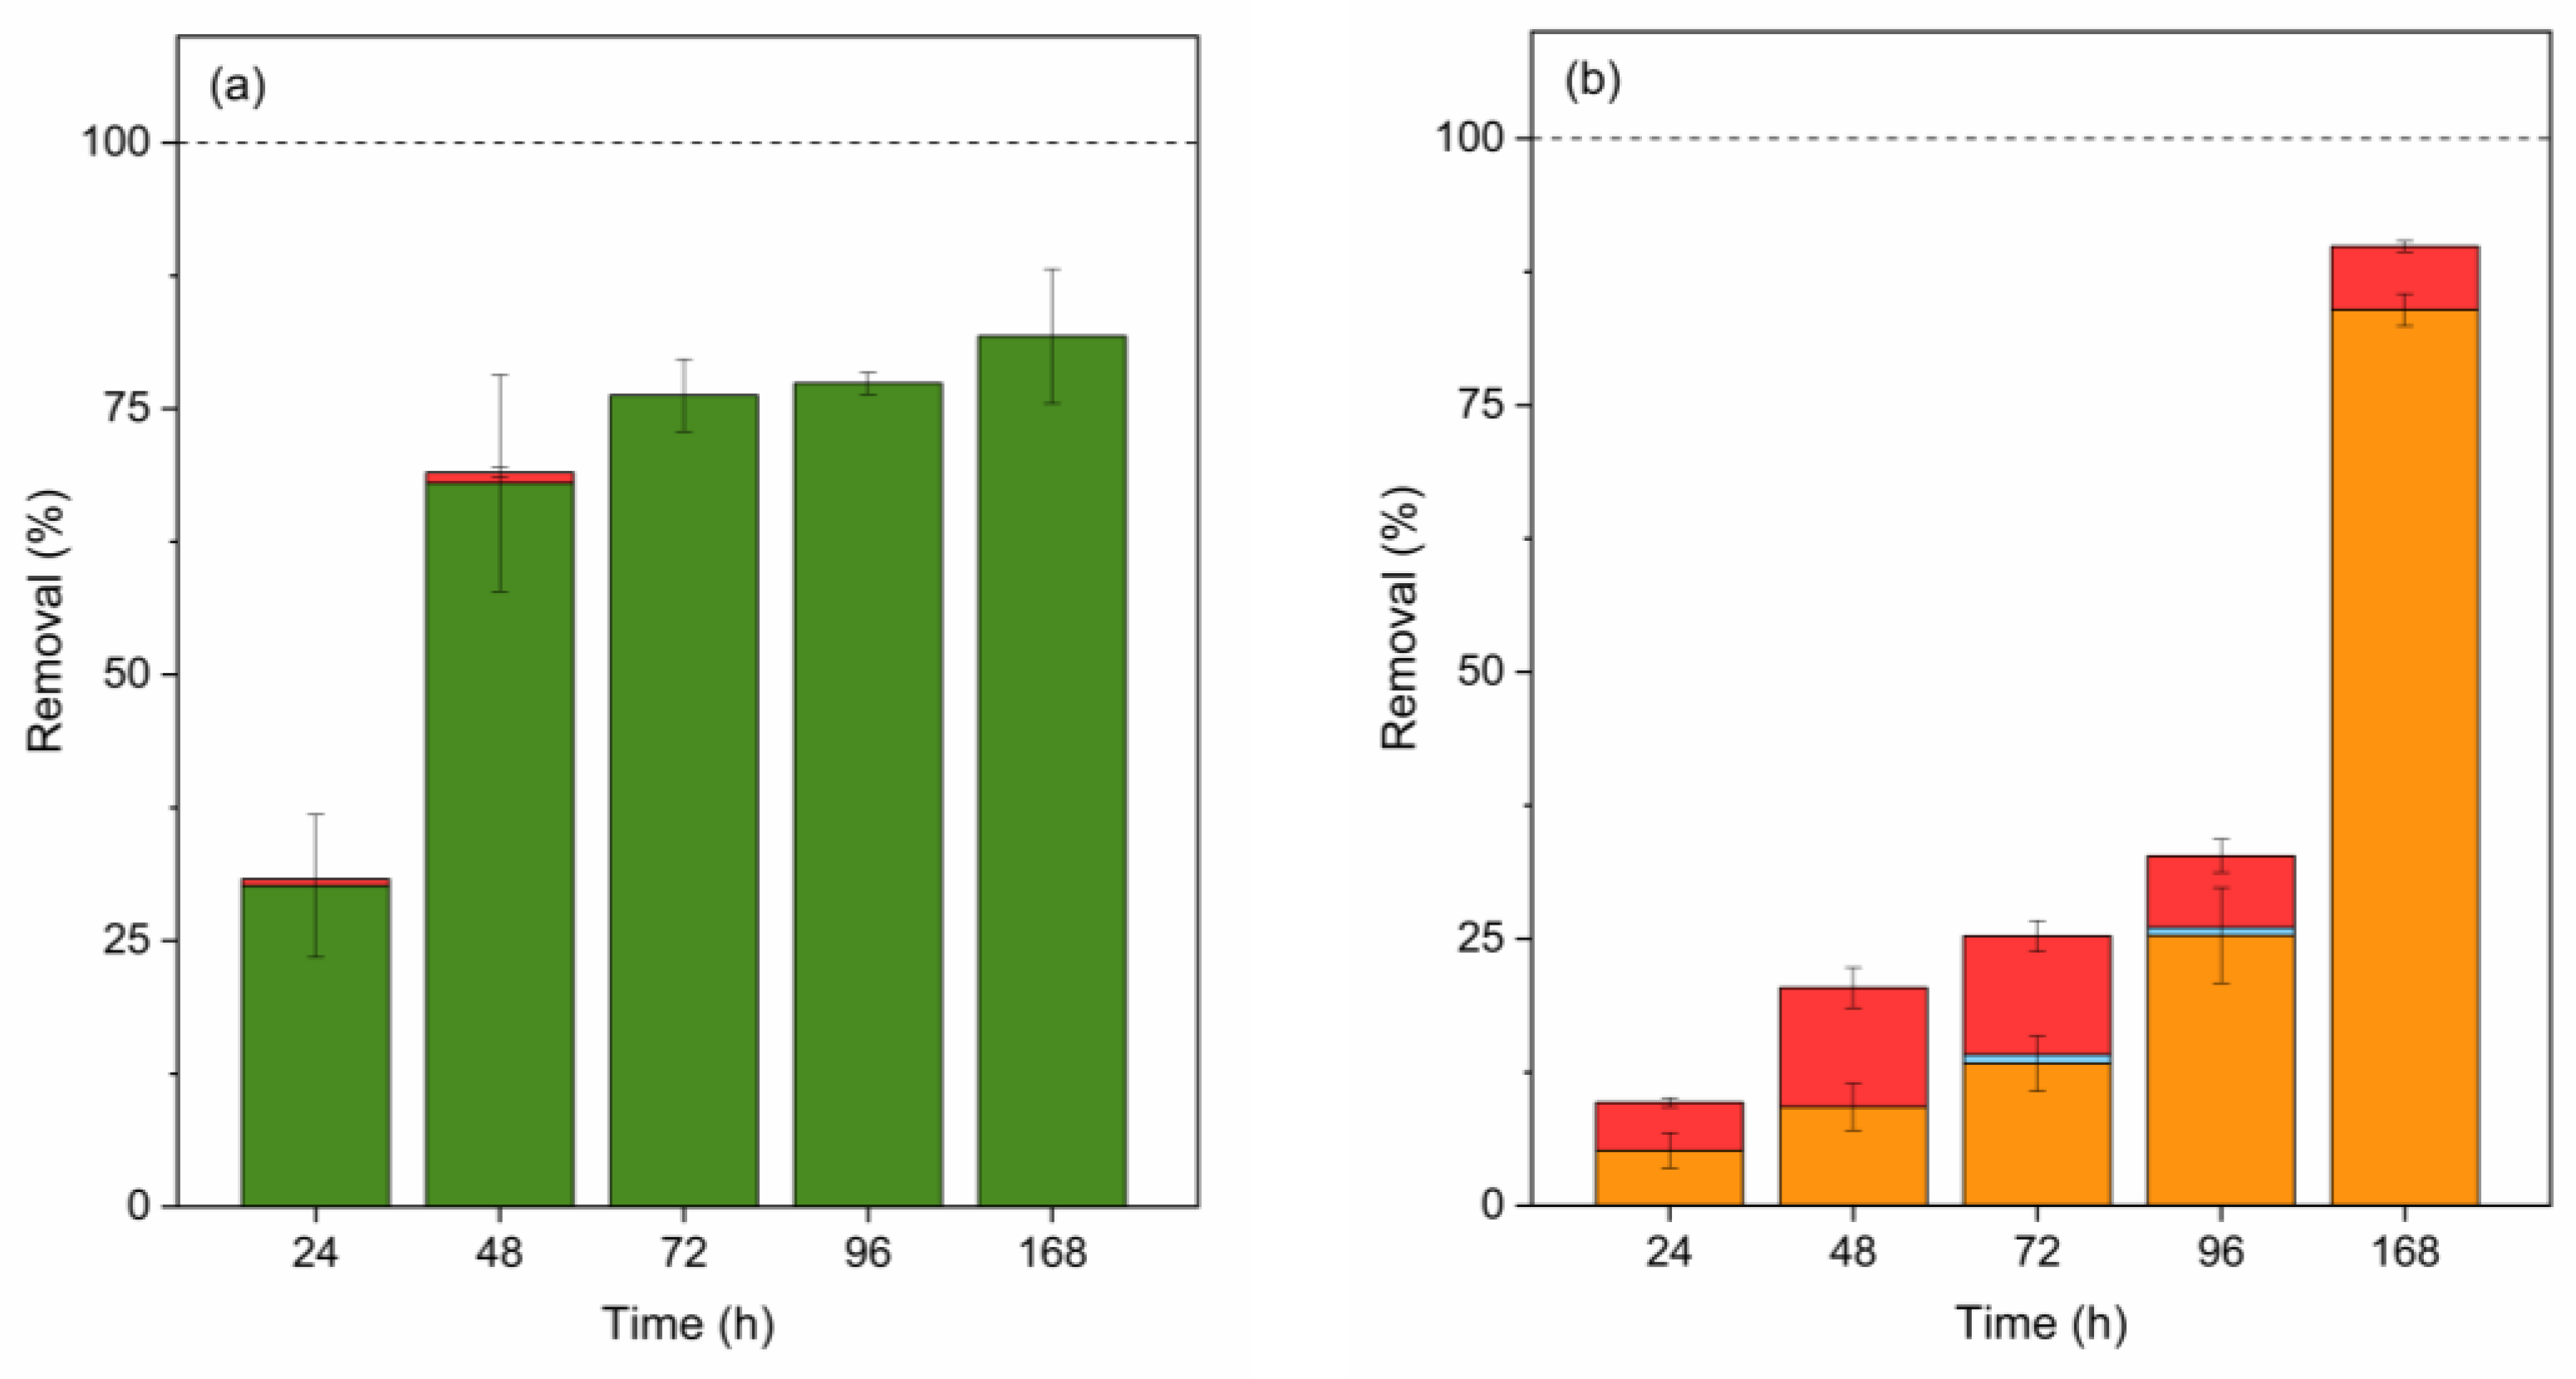
Figure 7.
Contribution (%) of abiotic degradation (yellow), biosorption (red), bioaccumulation (blue), and biodegradation (green Scenedesmus sp. and orange C. vulgaris) in E removal by Scenedesmus sp. (a) and C. vulgaris (b). Error bars represent ± standard error of the mean (n=3).
Figure 7.
Contribution (%) of abiotic degradation (yellow), biosorption (red), bioaccumulation (blue), and biodegradation (green Scenedesmus sp. and orange C. vulgaris) in E removal by Scenedesmus sp. (a) and C. vulgaris (b). Error bars represent ± standard error of the mean (n=3).
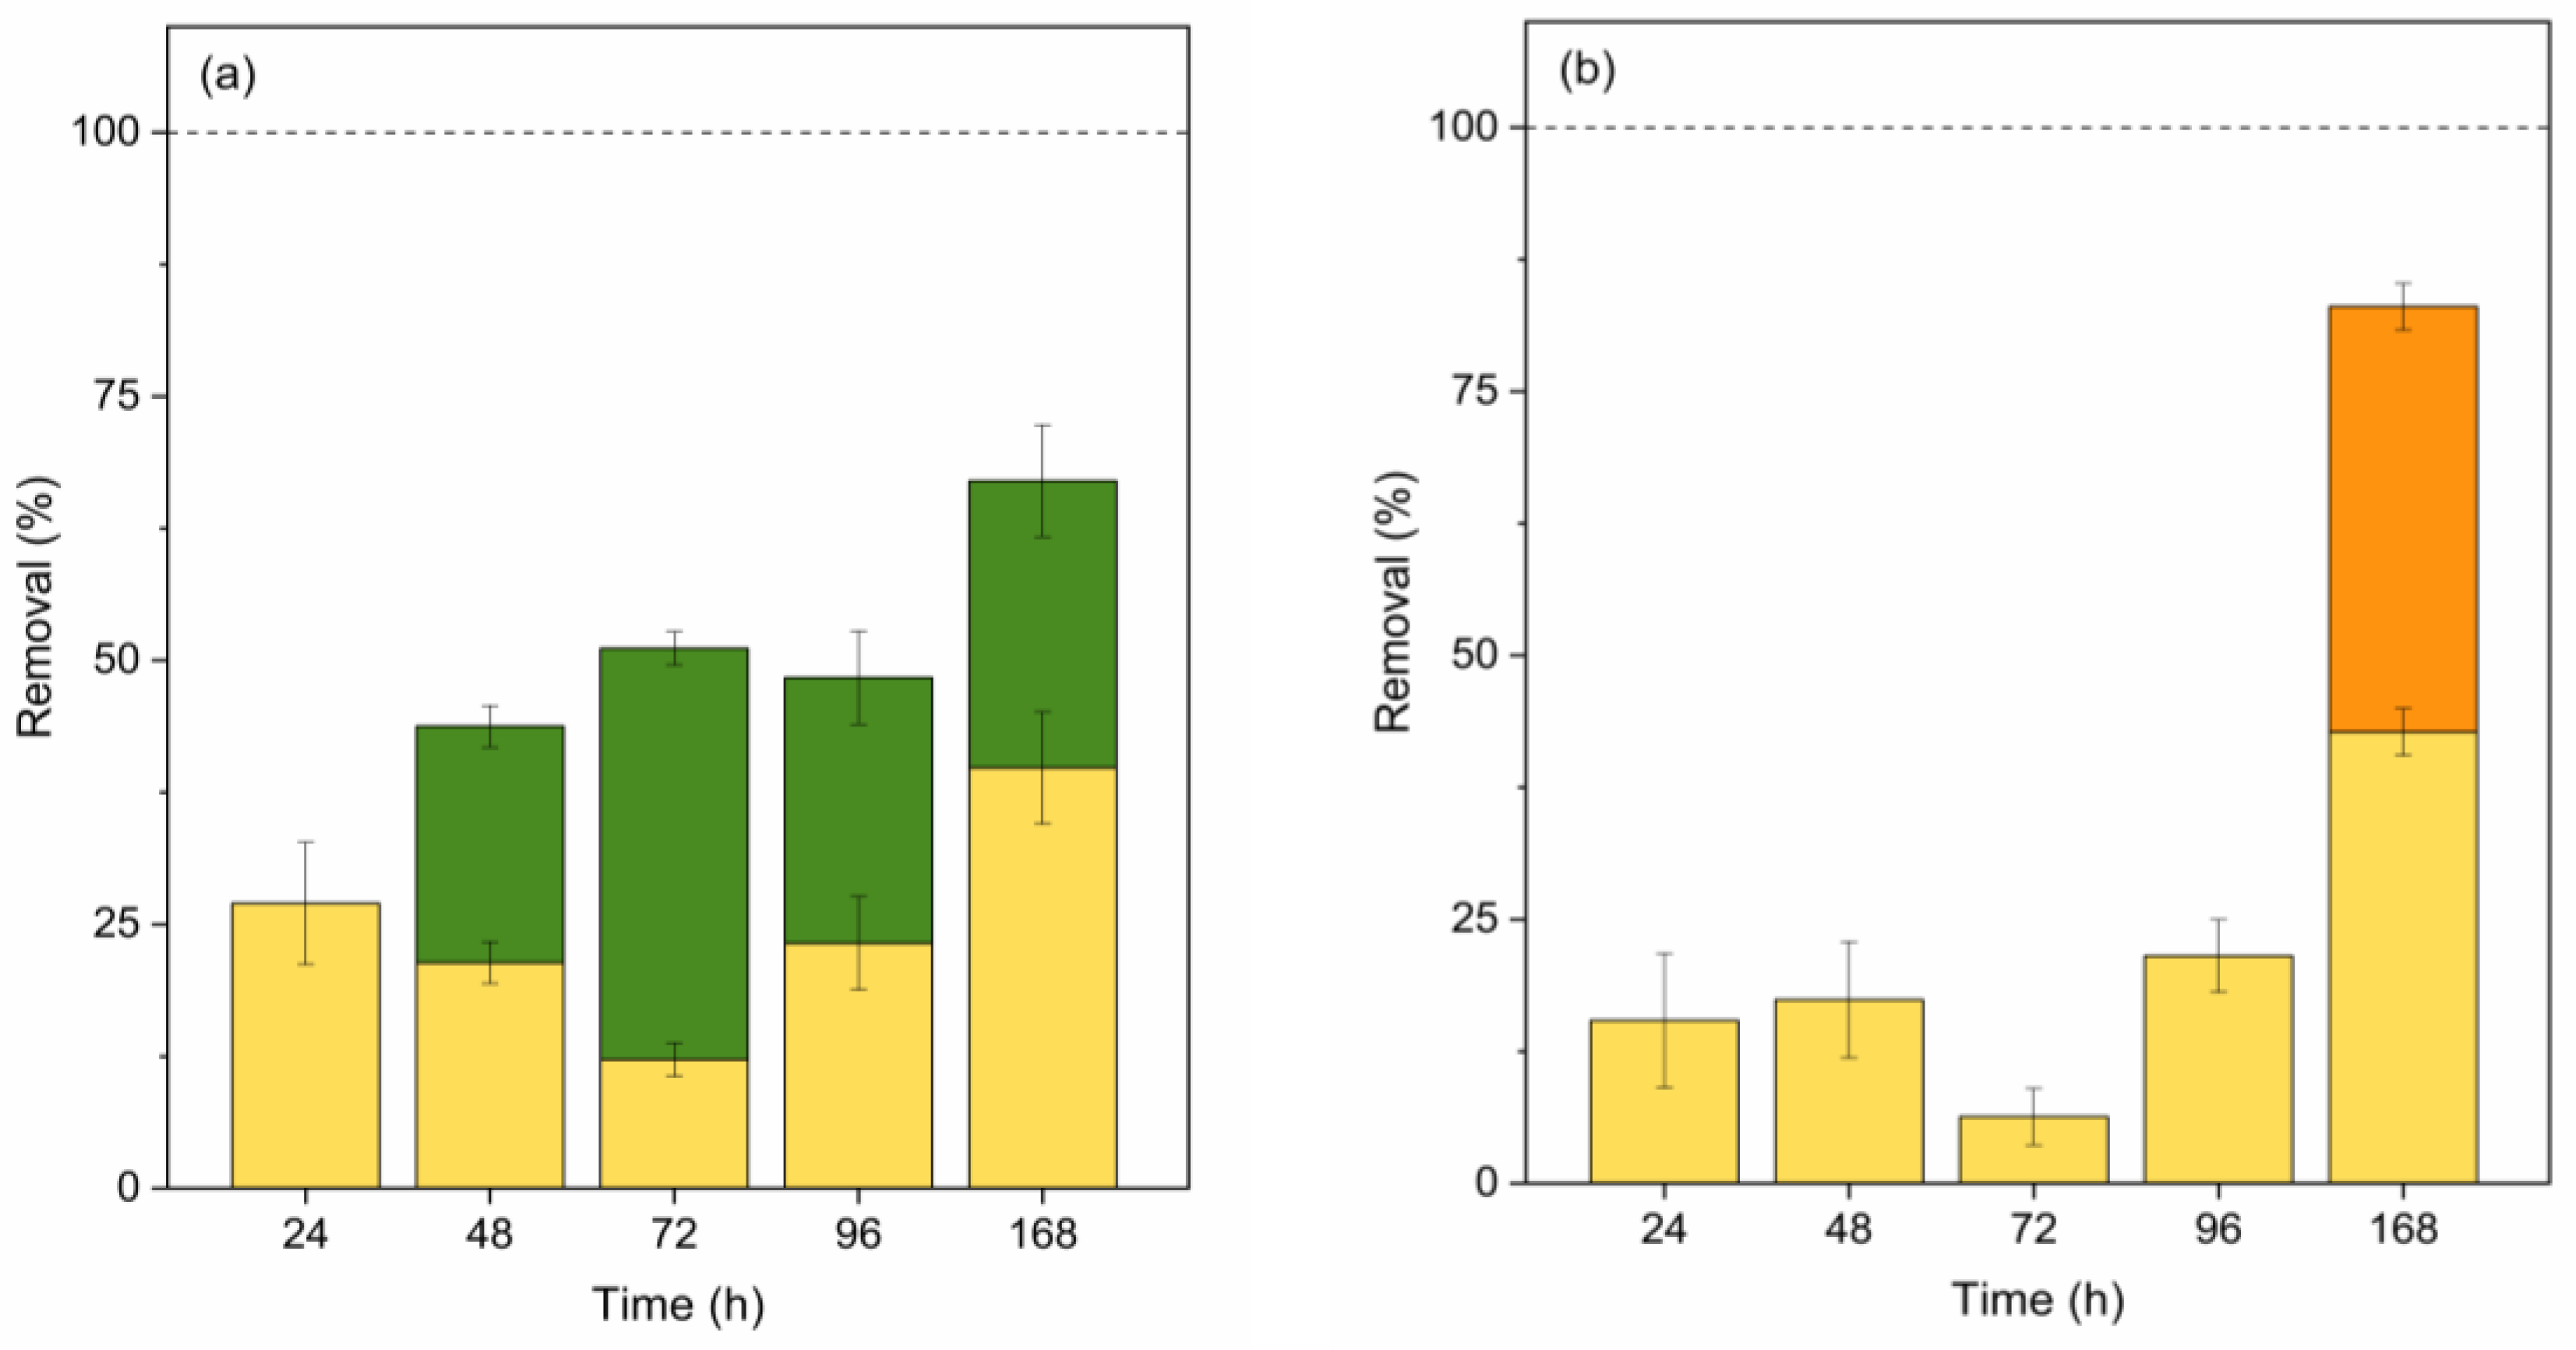

Table 1.
Final removal percentage rates at day 7 with Scenedesmus sp. and C. vulgaris and comparison with literature review. Errors are expressed as ± standard error of the mean (n=3).
Table 1.
Final removal percentage rates at day 7 with Scenedesmus sp. and C. vulgaris and comparison with literature review. Errors are expressed as ± standard error of the mean (n=3).
| Microalgae | MeP | PrP | BuP | BP | BPA | E | Ref. |
|---|---|---|---|---|---|---|---|
| Scenedesmus sp. | 100.0±0.0% | 99.4±1.1% | 99.2±1.5% | 85.6±9.0% | 81.8±6.3% | 67.0±0.6% | This study |
| C. vulgaris | 100.0±0.0% | 100.0±0.0% | 100.0±0.0% | 62.1±9.1% | 89.9±2.0% | 83.0±2.0% | |
| C. reinhardtii | 100.0% | 100.0% | [31] | ||||
| S. obliquus | 100.0% | 100.0% | |||||
| C. pyrenoidosa | 100.0% | 100.0% | |||||
| C. vulgaris | 100.0% | 100.0% | |||||
| Tetradesmus obliquus, C. vulgaris, Pseudanabaena sp., Scenedesmus sp. and Nitzscha sp. | 89.0% | [58] | |||||
| C. vulgaris | 33.0-14.0% | [59] | |||||
| S. obliquus | 23.3–28.5% 1 | [32] | |||||
| Chlamydomonas reinhardtii | 58.4% 1 | [60] | |||||
| C. vulgaris | 14.0% 2 | [61] | |||||
| Chlorella pyrenoidosa | 20.0-43.0% | [62] | |||||
| C. mexicana | 39.0% | [34] | |||||
| C. vulgaris | 28.0% | ||||||
| S. obliquus | 91.0% | [57] | |||||
| C. vulgaris | 52.0% |
1 BP-3 2 BP-4
Table 2.
Removal rate constants (k) estimated for abiotic EDC degradation and biodegradation using first-order kinetics.
Table 2.
Removal rate constants (k) estimated for abiotic EDC degradation and biodegradation using first-order kinetics.
| Compound | kO (h-1) (R2) | kLO (h-1) (R2) | kLOM (h-1) (R2) | |
|---|---|---|---|---|
| Scenedesmus sp. | C. vulgaris | |||
| MeP | 1.3·10-3 (0.868) | 1.1·10-3 (0.841) | 9.0·10-2 (0.983) | 3.8·10-1 (0.928) |
| PrP | 7.0·10-3 (0.831) | 4.0·10-3 (0.758) | 5.7·10-2 (0.968) | 7.4·10-2 (0.972) |
| BuP | 2.9·10-3 (0.951) | 2.8·10-3 (0.961) | 5.4·10-2 (0.982) | 7.5·10-2 (0.957) |
| BP | 1.3·10-2 (0.936) | 1.6·10-2 (0.958) | 1.1·10-2 (0.924) | 6.0·10-3 (0.901) |
| BPA | 2.0·10-3 (0.940) | 1.1·10-3 (0.956) | 2.1·10-2 (0.976) | 1.3·10-2 (0.815) |
| E | 5.9·10-3 (0.966) | 3.1·10-3 (0.954) | 5.2·10-3 (0.819) | 9.9·10-3 (0.805) |
Disclaimer/Publisher’s Note: The statements, opinions and data contained in all publications are solely those of the individual author(s) and contributor(s) and not of MDPI and/or the editor(s). MDPI and/or the editor(s) disclaim responsibility for any injury to people or property resulting from any ideas, methods, instructions or products referred to in the content. |
© 2024 by the authors. Licensee MDPI, Basel, Switzerland. This article is an open access article distributed under the terms and conditions of the Creative Commons Attribution (CC BY) license (http://creativecommons.org/licenses/by/4.0/).
Copyright: This open access article is published under a Creative Commons CC BY 4.0 license, which permit the free download, distribution, and reuse, provided that the author and preprint are cited in any reuse.


