Preprint
Article

This version is not peer-reviewed.

SiCTT.net: Satellite Image Clustering Transpose Transformation Deep neural network for Mixed Pixel Deforestation Analysis in Optical Satellite for Land Use Land Cover Application

Submitted:

13 November 2024

Posted:

15 November 2024

You are already at the latest version

Abstract

Deforestation monitoring in Brazil for Land use land cover application is the combination of up-to-date monitoring and accuracy. For detailed observation on time, need a Sentinel-2 multi-spectral satellite imagery which is a combination of multiple bands of different frequency for better analysis. Sentinel-2 Multispectral Images are the combination of high resolution and low-resolution images which create problem for classifying the object due to mixed pixel problem. Due to mixed pixel problem in optical satellite detection of the object is difficult which effects the accuracy. To identify the mixed pixel problem to combine multiple bands using Band Math to create a new band for detecting mixed pixel and to analyse the pixel using segmentation and clustering. To classify the Brazil Amazon Forest deforestation between 2019 and 2023 proposing a Satellite Image clustering Transpose Transformation Deep Neural Networking (SiCTT.net). To compare the CNN and Transpose CNN transformation with the help of accuracy and based on the results, proposed network gives better accuracy and helps to detect mixed pixel problem.

Keywords: 
;  ;  ;  ;  ;  ;  

1. Introduction:

The intricate relationships that exist between humans and their environment are frequently referred to as land cover (LC) and land usage (LU) [1]. Whereas LC refers to the real physical characteristics of the Earth's landscapes, LU refers to changes in land cover brought about by human activity [2]. Researchers are quite concerned about the rapid changes in land use and land cover that have resulted from the rapid urban growth in many cities. The dramatic shifts in land use in the 21st century have exacerbated the serious problems facing the local, regional, and global environments [3].
The multi-temporal and multi-spectral data that remote sensing provides is crucial for mapping land use and cover. Examination of land cover changes and its consequences can be done thoroughly and economically by combining GIS tools with data from remote sensing [4]. With its vital information on the physical characteristics of the land that dictate its management and distribution among various users, RS is an indispensable tool in land planning and management planning [5].
Due to the significant impact on the global system, Land Use and Cover Changes (LULC) have become an international issue in many ecosystems management [6]. Deforestation, environmental harm, altered weather and water cycles, a decline in land productivity, and the devastation of ecosystems are only a few of the problems brought on by these changes [7]. Effective land resource management and sustainable urban growth depend heavily on research on changes in land use and land cover (LULC). It is necessary to perform environmental research on current and forthcoming Land Use/Land Cover (LULC) studies to address the difficulties arising from fast urban growth in cities [8].
Monitoring deforestation in the tropics via remote sensing is essential to better understand changes in ecosystem services and global land use, as well as to inform governments and civil society on the efficacy of their forest protection measures.[9] Deforestation and the growth of farming and grazing systems, mostly in tropical forests, have been strongly correlated in Brazil. Since the Brazilian Amazon is the world's largest tropical rainforest and has up until recently had the highest rates of deforestation, Brazil has been a focal point of the dynamics surrounding worldwide deforestation. Brazil has been successful in reducing illicit deforestation overall and has been at the forefront of implementing environmental policies based on monitoring efforts to prevent the practice. [10,11] We check the result with global forest government organization, deforestation is Increase rapidly from 2001 to 2022.[12]
S2/MSI data is considered important for Land Use and Land Cover (LULC) and Land Use and Land Cover Change (LULCC) applications because of its interoperability, free availability, and capacity to monitor large regions. The European Space Agency (ESA) launched the Sentinel-2 (S2) satellites, S2A/MSI and S2B/MSI, in 2015 and 2017, respectively, as part of the European Union's Copernicus Earth Observation program. The Multispectral Instrument (MSI) is a piece of equipment aboard spacecraft that covers visible to shortwave infrared (SWIR) areas. It has 13 bands and a spatial resolution of 10 to 60 meters. data with a 290 km swath width, 16-bit radiometric resolution, and a 5-day return period are available from the S2/MSI mission [13].
The image acquisition of satellite images based on scattering of different objects and every object has different wavelength and frequency. The optical satellite uses electromagnetic spectrum and sun rays as a source of energy to capture the images [14]. With its three Red-edge bands and two SWIR bands, the mission's spectrum characteristics make it more useful for analysing deforestation.[15] When compared to Landsat data, these features may yield results that are more accurate since they make it possible to derive different band ratios and indices. Owing to its 16-day revisit cycle, cloud cover interference, and poorer spatial and spectral resolutions, Landsat data has limitations.[16]
Researchers focus on deforestation classification using optical satellite. Optical satellite like sentinel-2 provides hyperspectral and multispectral remote sensing dataset. Due to high spatial and spectral including temporal quality, optical satellite facing problem called mixed pixel. Now, researcher need to focus on mixed pixel deforestation classification between mixed pixel and pure pixel.[17] The below table 1 Literature Review to highlighted research gaps provide a comprehensive overview of the current state of research on mixed pixel problems in optical satellite imagery and emphasize areas requiring further investigation. By reducing mixed pixels, higher resolution can also aid in the reduction of thematic uncertainty. [18]
Table 1. Literature Review .
Ref Methods Performance Limitations
[19] Supervised classification (Neural Networks, Random Forest) Accurate identification of mixed pixels by merging pure and mixed pixels Unsupervised techniques struggle with pixel identification, reducing accuracy
[20] NDVI, simulation techniques Green-up-dates improved compared to traditional NDVI threshold methods Inconsistent results due to artifacts, observation geometry, and time composition issues
[21] Fuzzy clustering High accuracy and low computation time for mixed pixel classification Deep learning could be applied to incorporate spatial and spectral components for higher accuracy
[22] Fuzzy supervised classification Fuzzy classification handles mixed pixels well Does not define boundaries clearly; unsupervised clustering and discriminant analysis may improve results
[23] Fuzzy unsupervised clustering Membership function modifications improve fuzzy clustering results Challenges in computing similarity between observations and partitioning for clustering
[24] Biophysical parameter analysis Useful for mixed pixel detection through color composition and spectral unmixing High-resolution data not always available, leading to thematic uncertainty in results
[25] Latent Dirichlet variational autoencoder (LDVAE) Effective for solving spectral unmixing problems Suitable only for spectral datasets, not spatial datasets
[26] Shannon evenness index Effective for low-resolution datasets (e.g., Sentinel-2) Not suitable for high-resolution datasets such as Landsat-8
[27] Sensor-independent LAI/FAPAR/CDR Improves spatial and temporal data accuracy for mixed pixel correction Inconsistency in spatial-temporal images, accuracy issues remain
[28] Efficient mixed transform for super-resolution Enhances image quality using pixel mixer and transform network Struggles with scale mismatch using pixel mixer block in real-world problems
[29] Random Forest, MTMI-SMF algorithm Low computational cost, performs well for invader classification Invader classification challenging due to spectral band limitations, hyperspectral images recommended for future work
[30] Morphological operations Suitable for detecting mixed pixels in small-scale land-water area Not applicable for large-scale mixed pixel detection
[31] Spectral mixing with morphological operations Suitable for mixed pixel detection in land-water areas Deep neural networks provide more accurate analysis than machine learning
[32] Fuzzy clustering Accurate land-water mixed pixel classification using membership functions High model complexity

1.1. Research Gap Explanation

Mixed pixel classification is a key challenge in remote sensing and earth observation, especially when dealing with high-resolution datasets. Several methods have been proposed to tackle this issue, such as supervised classification using neural networks and random forests, fuzzy clustering, and spectral unmixing techniques. However, gaps remain in terms of achieving higher accuracy, computational efficiency, and applicability across various resolutions. Supervised classification methods, such as neural networks and random forests ([19]), have demonstrated good performance in identifying mixed pixels by merging pure and mixed pixel data. However, these methods suffer when applied to unsupervised techniques where pixel identification becomes more complex, and errors in classification often reduce accuracy. On the other hand, fuzzy clustering methods ([21,23]) show promise in handling mixed pixel classification with high accuracy and lower computation time. However, fuzzy clustering faces challenges related to determining similarity between observations and partitioning ([23]). Moreover, supervised fuzzy classification ([22]) struggles to clearly define boundaries, which limits its effectiveness in unsupervised settings. Techniques like the latent Dirichlet variational autoencoder (LDVAE) ([25]) have effectively solved spectral unmixing problems but are limited to spectral datasets, and do not generalize well to spatial data. Similarly, biophysical parameter analysis ([24]) provides a useful approach for detecting mixed pixels but suffers from thematic uncertainty when high-resolution data is unavailable. Approaches like the efficient mixed transform ([28]) and Shannon evenness index ([26]) are effective for low-resolution datasets (e.g., Sentinel-2), but face limitations with higher resolution datasets like Landsat-8. For example, pixel mixer blocks improve image quality but struggle with scale mismatch in real-world applications ([28]). There is a lack of integration of deep learning techniques that can handle both spatial and spectral components, especially for high-resolution data, where deep learning models can potentially outperform traditional methods. Random forest and MTMI-SMF algorithms ([29]) are efficient in classification tasks but struggle with spectral band limitations, making hyperspectral images necessary for improving accuracy. Morphological operations ([30,31]) work well for small-scale mixed pixel detection, such as in land-water boundary regions, but do not scale well to larger or more complex datasets. The identified gaps, a hybrid approach that integrates deep learning with unsupervised clustering techniques offers the most promising methodology to overcome existing limitations: Combining fuzzy clustering with deep learning models like convolutional neural networks (CNNs) or autoencoders could significantly enhance mixed pixel classification by leveraging the strengths of both techniques. Fuzzy clustering can deal with uncertainties and mixed pixels, while deep learning excels at capturing spatial and spectral relationships. Such integration could address the accuracy limitations seen in current clustering techniques ([21,22,23]). To improve the performance on high-resolution data, deep learning techniques like CNNs or transformers can be trained on both spatial and spectral data. This approach could overcome the limitations of traditional methods like NDVI ([20]) and Shannon evenness index ([26]), which perform well for low-resolution datasets but struggle with higher resolutions. Using transpose transformer could handle the complexities of high-dimensional, high-resolution data ([25]). Combining machine learning techniques such as clustering methods could offer a balance between computational efficiency and accuracy. For example, the MTMI-SMF algorithm can be further enhanced by incorporating hyperspectral data to resolve issues with spectral band limitations ([29]). Additionally, efficient transforms like the pixel mixer could be integrated with deep learning to reduce computation time while improving image quality in super-resolution tasks ([28]). The best approach to improve mixed pixel detection and classification, especially for high-resolution data, is to develop a hybrid methodology that combines deep learning (e.g., CNNs, Transpose Transformer) with fuzzy clustering and NDVI morphology segmentation. This hybrid approach can tackle both spectral and spatial complexities, improve classification boundaries, and enhance the performance for large-scale applications.
Addressing the mixed pixel problem in optical satellite imagery requires a multifaceted approach that focuses on several critical research gaps. First, there is an urgent need for robust methodologies that effectively integrate biophysical parameters, spectral unmixing techniques, and machine learning to enhance mixed pixel classification across diverse datasets and resolutions. Additionally, while some models perform well on spectral datasets, it is essential to adapt these methods for spatial datasets to improve their versatility and effectiveness. Many existing techniques also struggle with scalability, as their effectiveness often diminishes when transitioning from small-scale to larger area applications; therefore, developing scalable solutions applicable across various environments is crucial. Furthermore, the complexity of current models frequently impedes their real-world applicability; simpler, more effective models that can accommodate pixel mismatch scales are essential for practical implementation. Lastly, addressing temporal data consistency is vital for improving the accuracy of mixed pixel analysis, ensuring reliable data for ecosystem monitoring and facilitating informed decision-making in environmental management. By focusing on these areas, future research can significantly advance the field and enhance the utility of remote sensing technologies.

1.2. Motivation of Research Objective

In summary, the identified research gaps emphasize the necessity for hybrid methodologies that synergistically combine machine learning and deep learning to advance mixed pixel classification across various datasets and resolutions. Addressing these gaps will not only enhance the reliability of remote sensing applications but also improve the accuracy and utility of mixed pixel analysis in environmental monitoring and ecosystem management (Ref [21,26]). In light of this literature review, the author introduces this paper by presenting an innovative approach termed SiCTT.net, which stands for Satellite Image Clustering, Transpose Transformation, and Deep Neural Network. This cutting-edge methodology integrates segmentation concepts with advanced mathematical preprocessing techniques, establishing a robust framework for tackling the challenges identified in the study. The structure of the paper is meticulously organized, commencing with the underlying motivation and key contributions associated with the research, thereby setting the stage for a comprehensive exploration of the proposed methodology and its implications for addressing mixed pixel problems in optical satellite imagery.
The primary motivation driving this research is rooted in the capabilities of optical satellites, which offer high spatial and spectral resolution—critical features for the accurate analysis and classification of Earth observation data. Additionally, optical satellites are known for their excellent temporal resolution, a characteristic that significantly aids in the validation of ground truth observations. This temporal precision not only enhances the accuracy of data interpretation but also improves the overall efficiency of monitoring environmental changes, particularly in the context of deforestation.
In this study, Sentinel-2 Multispectral Images are utilized to address the mixed pixel problem, a common issue that arises due to the very high resolution of these images. The mixed pixel problem occurs when a single pixel represents multiple classes, making object recognition and pixel classification a challenging task. To tackle this, the satellite images undergo initial preprocessing steps, including resampling for geometric correction and image registration. Following this, a process known as Band Math Merging is applied to generate new bands that facilitate detailed pixel analysis. This step is crucial in preparing a comprehensive dataset, which is then used to train a model specifically designed for analysing deforestation and non-deforestation areas.
Once the preprocessing is complete, mixed pixel detection techniques are employed to segment the images, effectively removing unwanted noise and irrelevant pixels. The paper introduces a novel methodology called SiCTT.net, designed to classify time-series satellite images with high precision. This innovative approach leverages deep neural networks to classify deforested and non-deforested regions, employing colour thresholding segmentation to enhance the accuracy of the classification process. The results are then compared and analysed to ensure a thorough evaluation of the methodology’s effectiveness.
The paper’s structure is detailed in Figure 1 and is organized into several key sections. The first section is the introduction, which sets the stage for the study by outlining the research context and objectives. This is followed by the second section, which provides a comprehensive literature review focusing on the detection of the mixed pixel problem and the classification of deforestation. The third section delves into the materials and methods used in the study, explaining the datasets and techniques applied to identify and address the problems.
The third section is further subdivided into three critical subsections: Dataset and Tools, Methodology, and Outcomes. In the Dataset and Tools subsection, the paper provides an in-depth explanation of the datasets used, along with a detailed description of the tools selected for solving the identified problems. The Methodology subsection is also divided into three parts: preprocessing, mixed pixel identification, and deforestation analysis, each detailing the specific steps taken during the study. The Outcomes subsection mirrors the structure of the Methodology, presenting the results of the preprocessing, mixed pixel problem identification, and the deforestation and non-deforestation analysis.
This study presents a novel approach, SiCTT.net, that improves the classification of mixed pixels in high-resolution datasets by combining deep neural networks with advanced segmentation and clustering techniques. This is the first study to apply these methods to both high- and low-resolution mixed pixel problems in deforestation monitoring.
The Discussion section offers a critical examination of the study’s findings, highlighting both the advantages and limitations of the proposed approach, as well as outlining future research directions. Finally, the paper concludes with a summary of the key insights gained from the research, emphasizing the contributions and potential applications of the SiCTT.net approach in advancing the field of satellite image analysis and deforestation monitoring. The objective of this research is to develop a framework for accurately classifying mixed pixels in high-resolution deforestation data using SiCTT.net. This method aims to improve the resolution, reduce thematic uncertainty, and enhance classification accuracy compared to existing approaches.

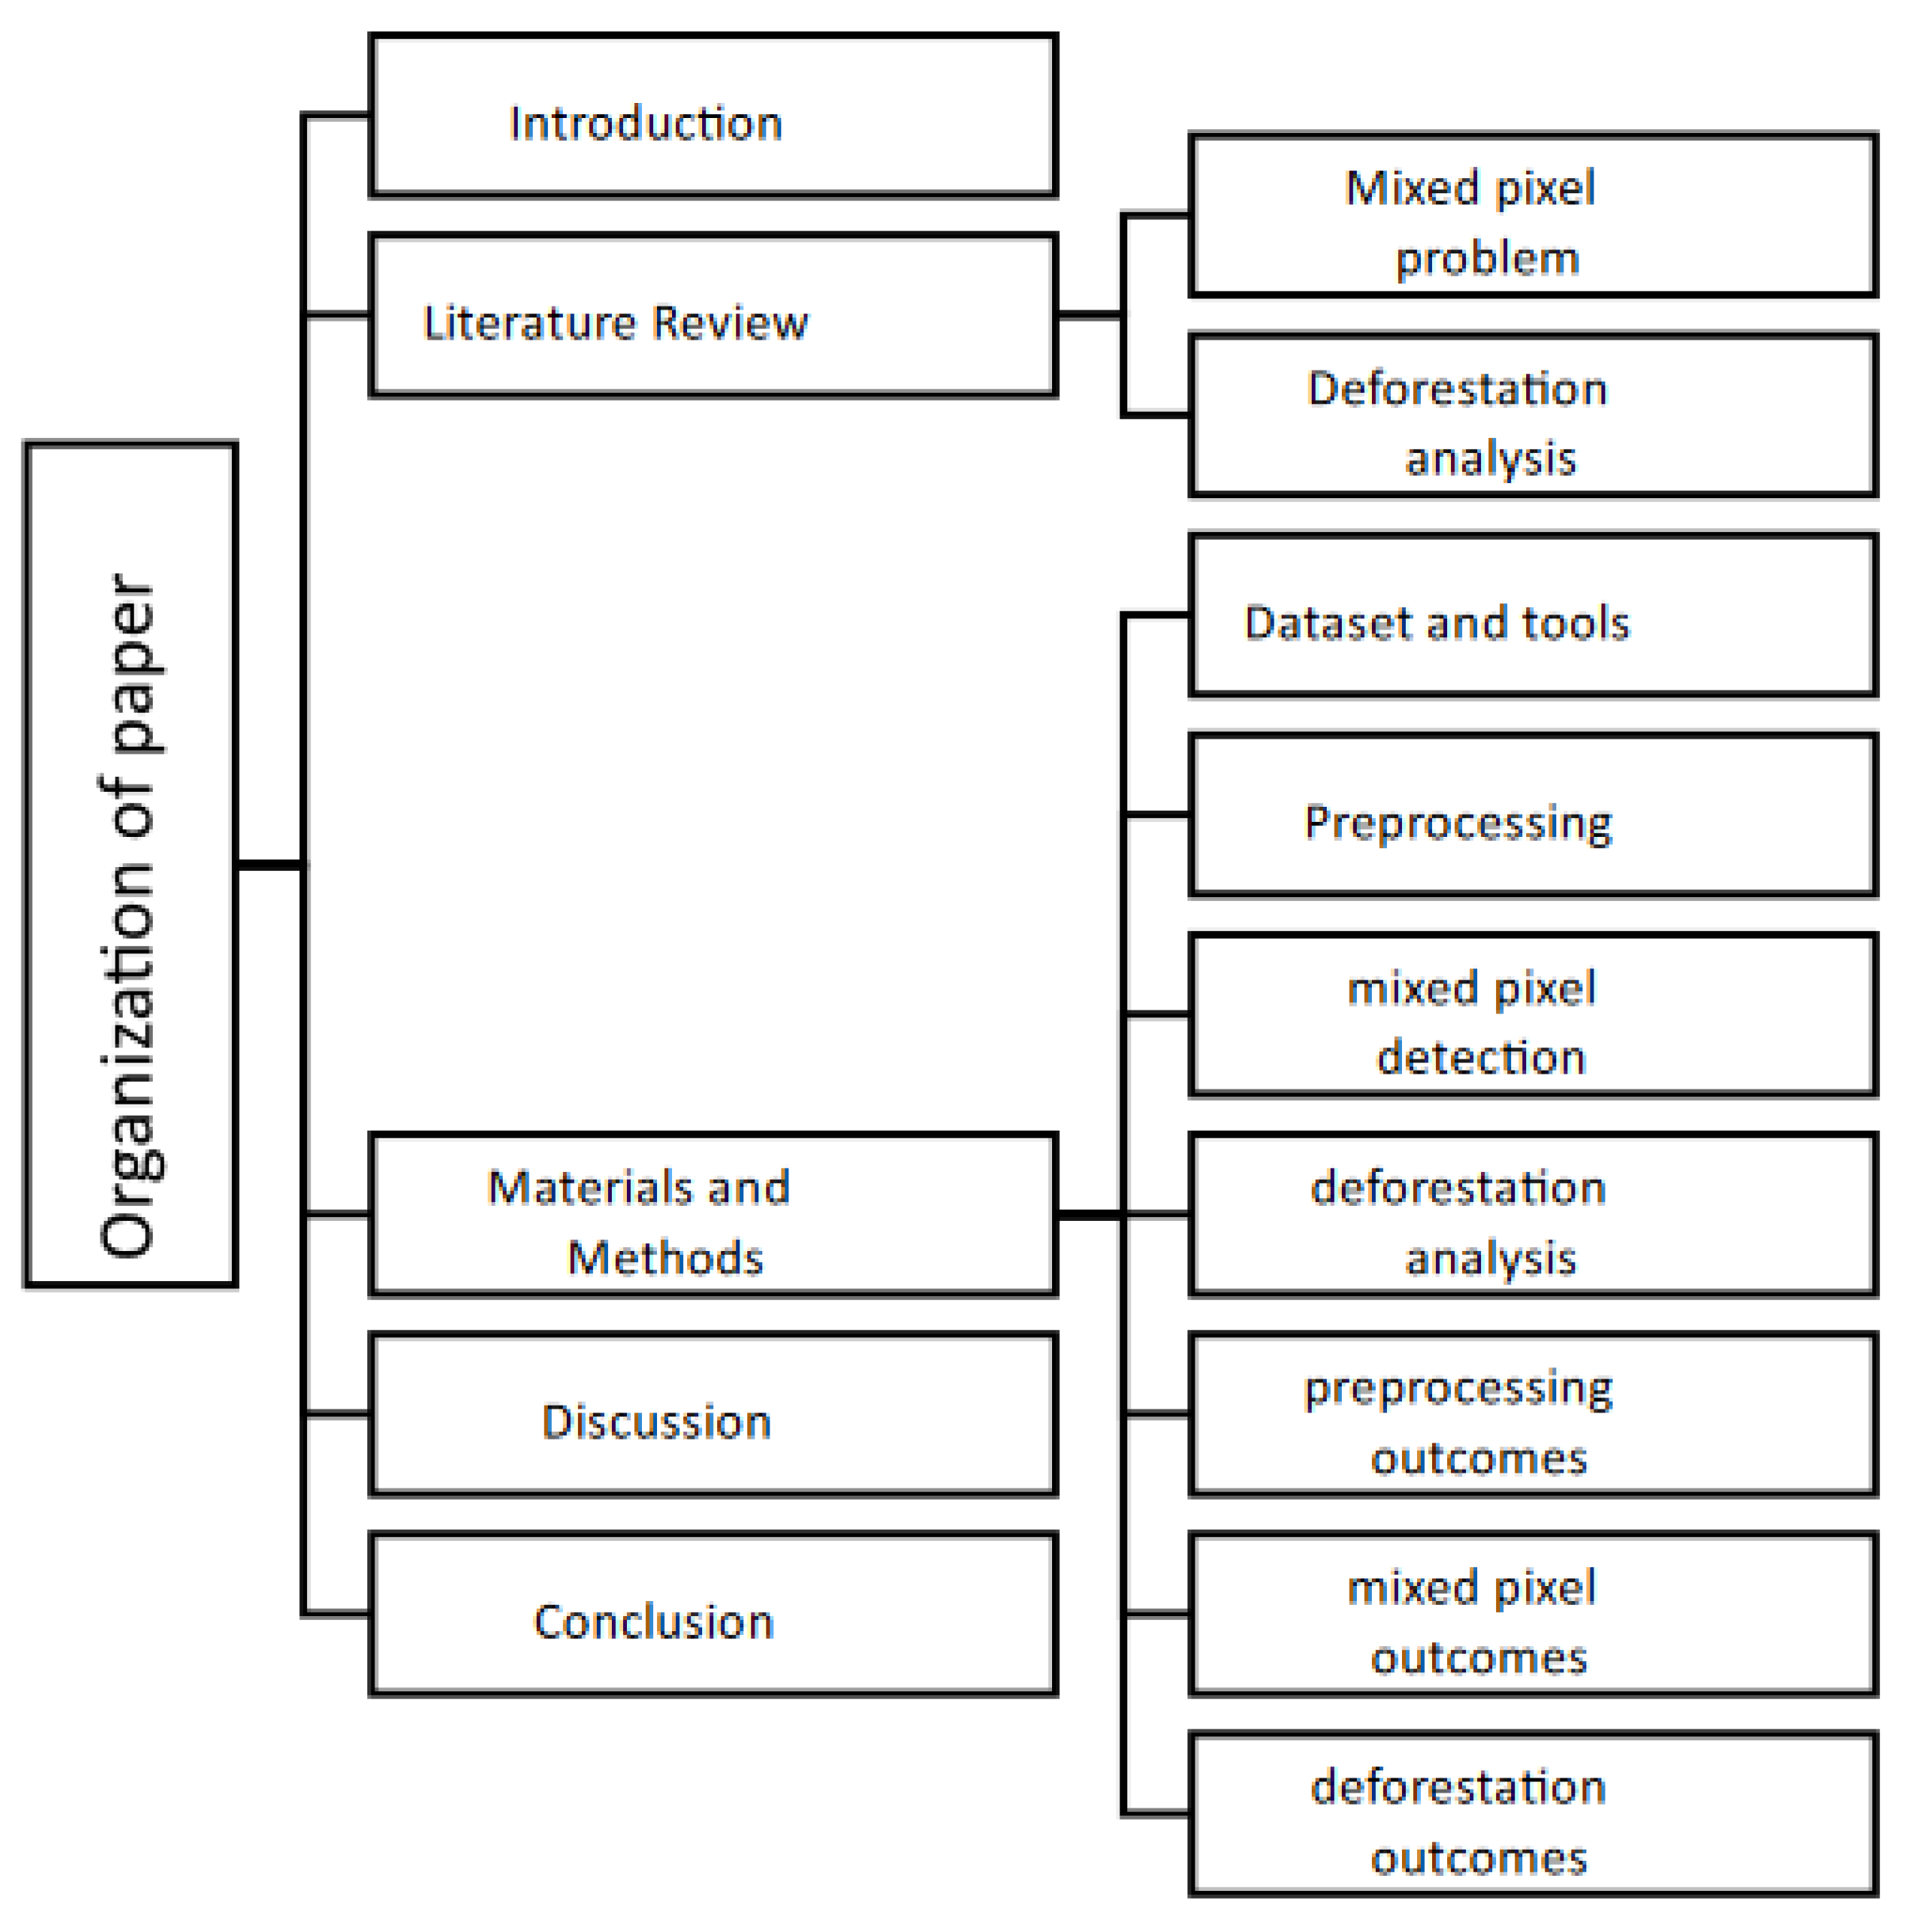
2. Materials and Methods:

The Materials and Methods section is the cornerstone of any original research paper, as it provides the foundation upon which the entire study is built. In this paper, the materials are represented by the datasets and tools utilized throughout the research. These resources are essential for the execution of the study and are meticulously selected to ensure that the research objectives can be effectively addressed.
The Methods portion of this section is thoughtfully divided into two main subsections: Methodology Analysis and Outcome Analysis. Each of these subsections is further subdivided into three specific categories to provide a detailed and structured approach to the research process.

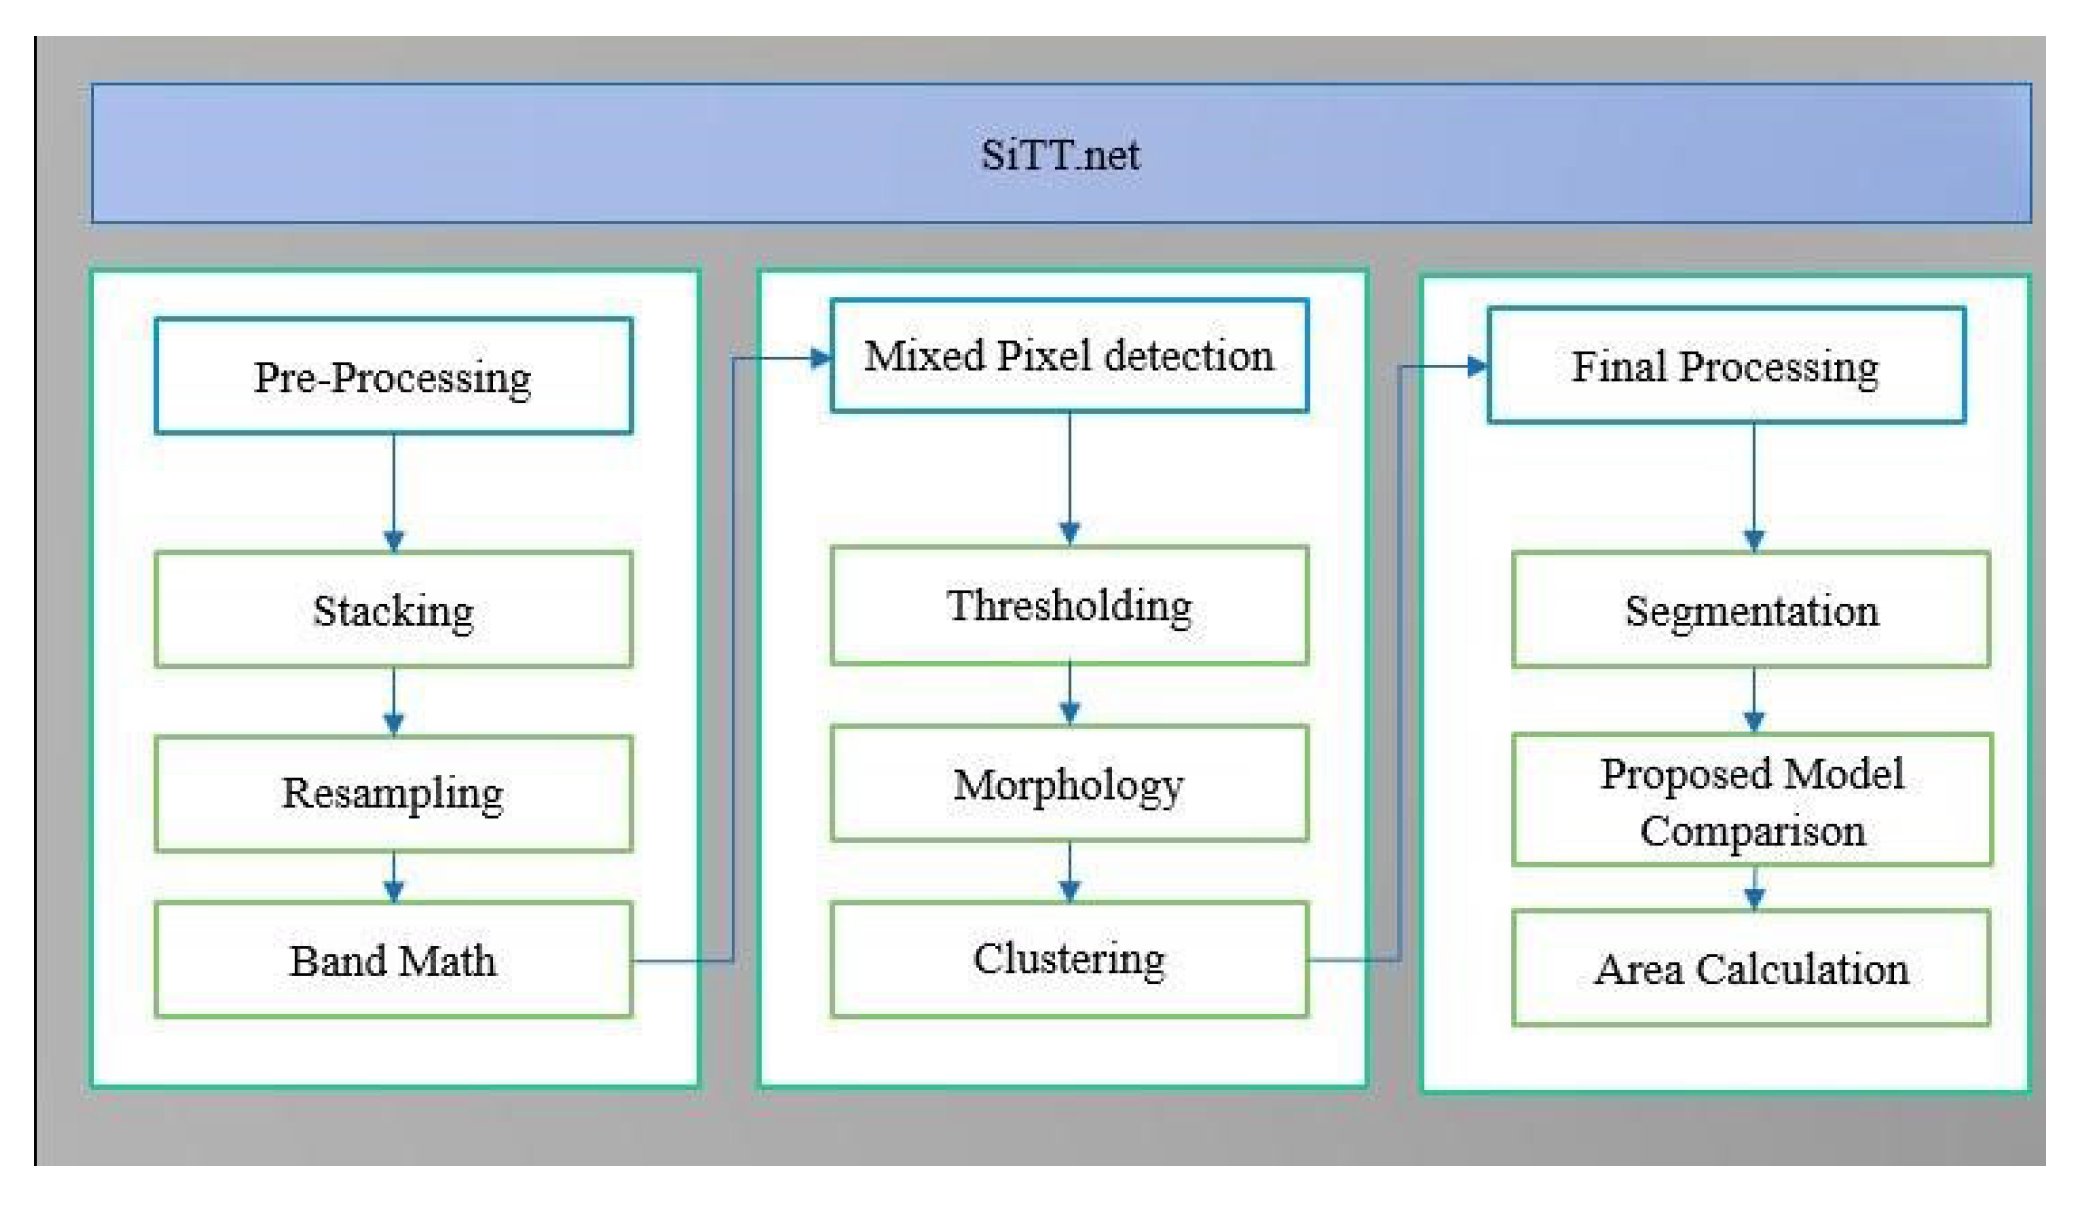
2.1. Methodology Analysis:

This subsection is dedicated to explaining the procedural steps and techniques applied during the research. It is divided into three critical parts:
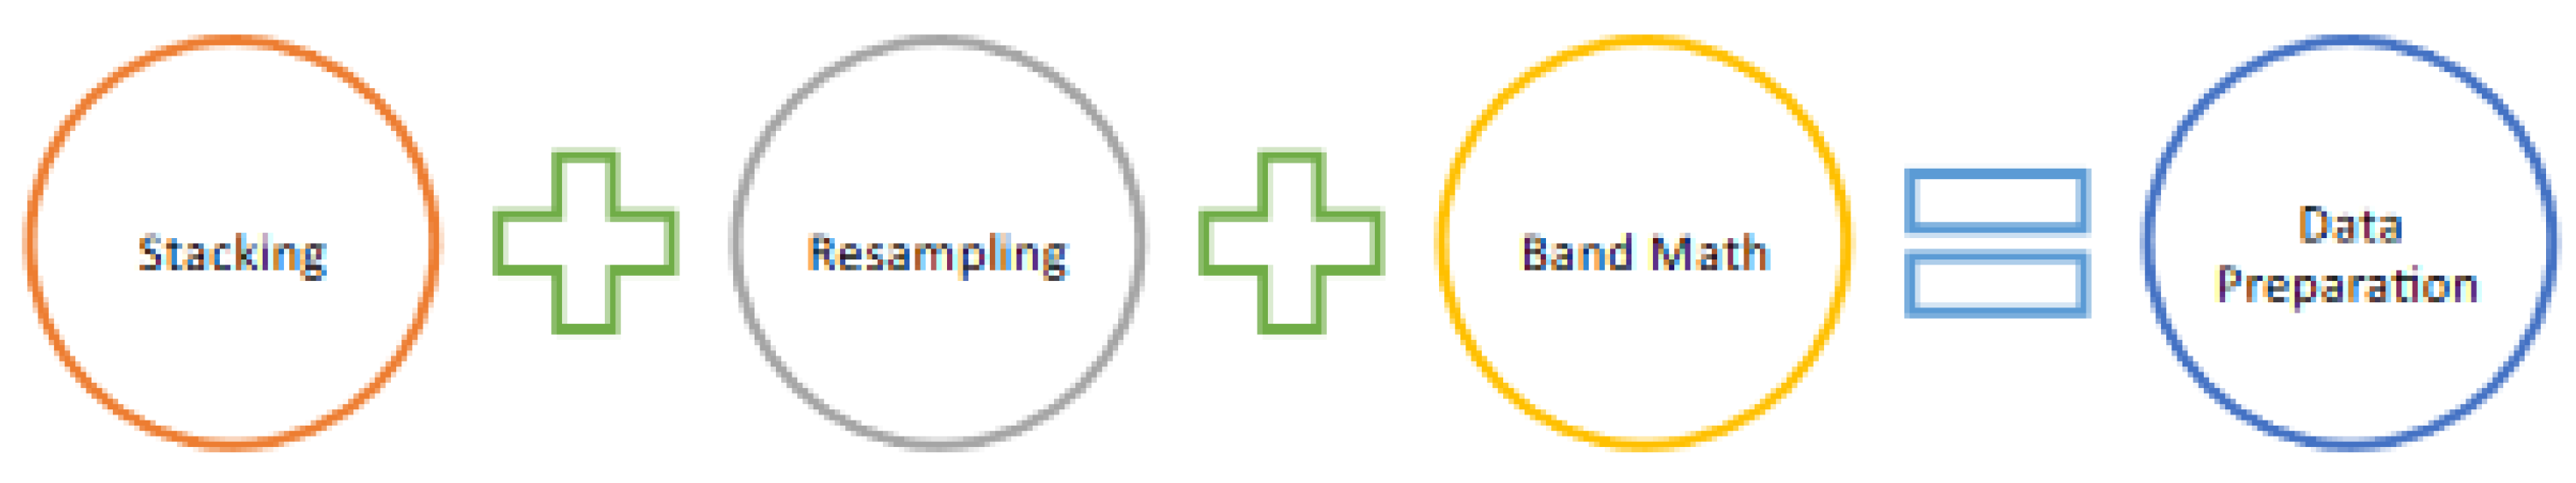
  • Preprocessing Analysis: In this part, the study delves into the initial steps of data preparation. Preprocessing is essential for ensuring that the raw satellite images are in the optimal condition for subsequent analysis. This includes tasks such as resampling, geometric correction, and image registration, which are crucial for aligning the images correctly and minimizing distortions.
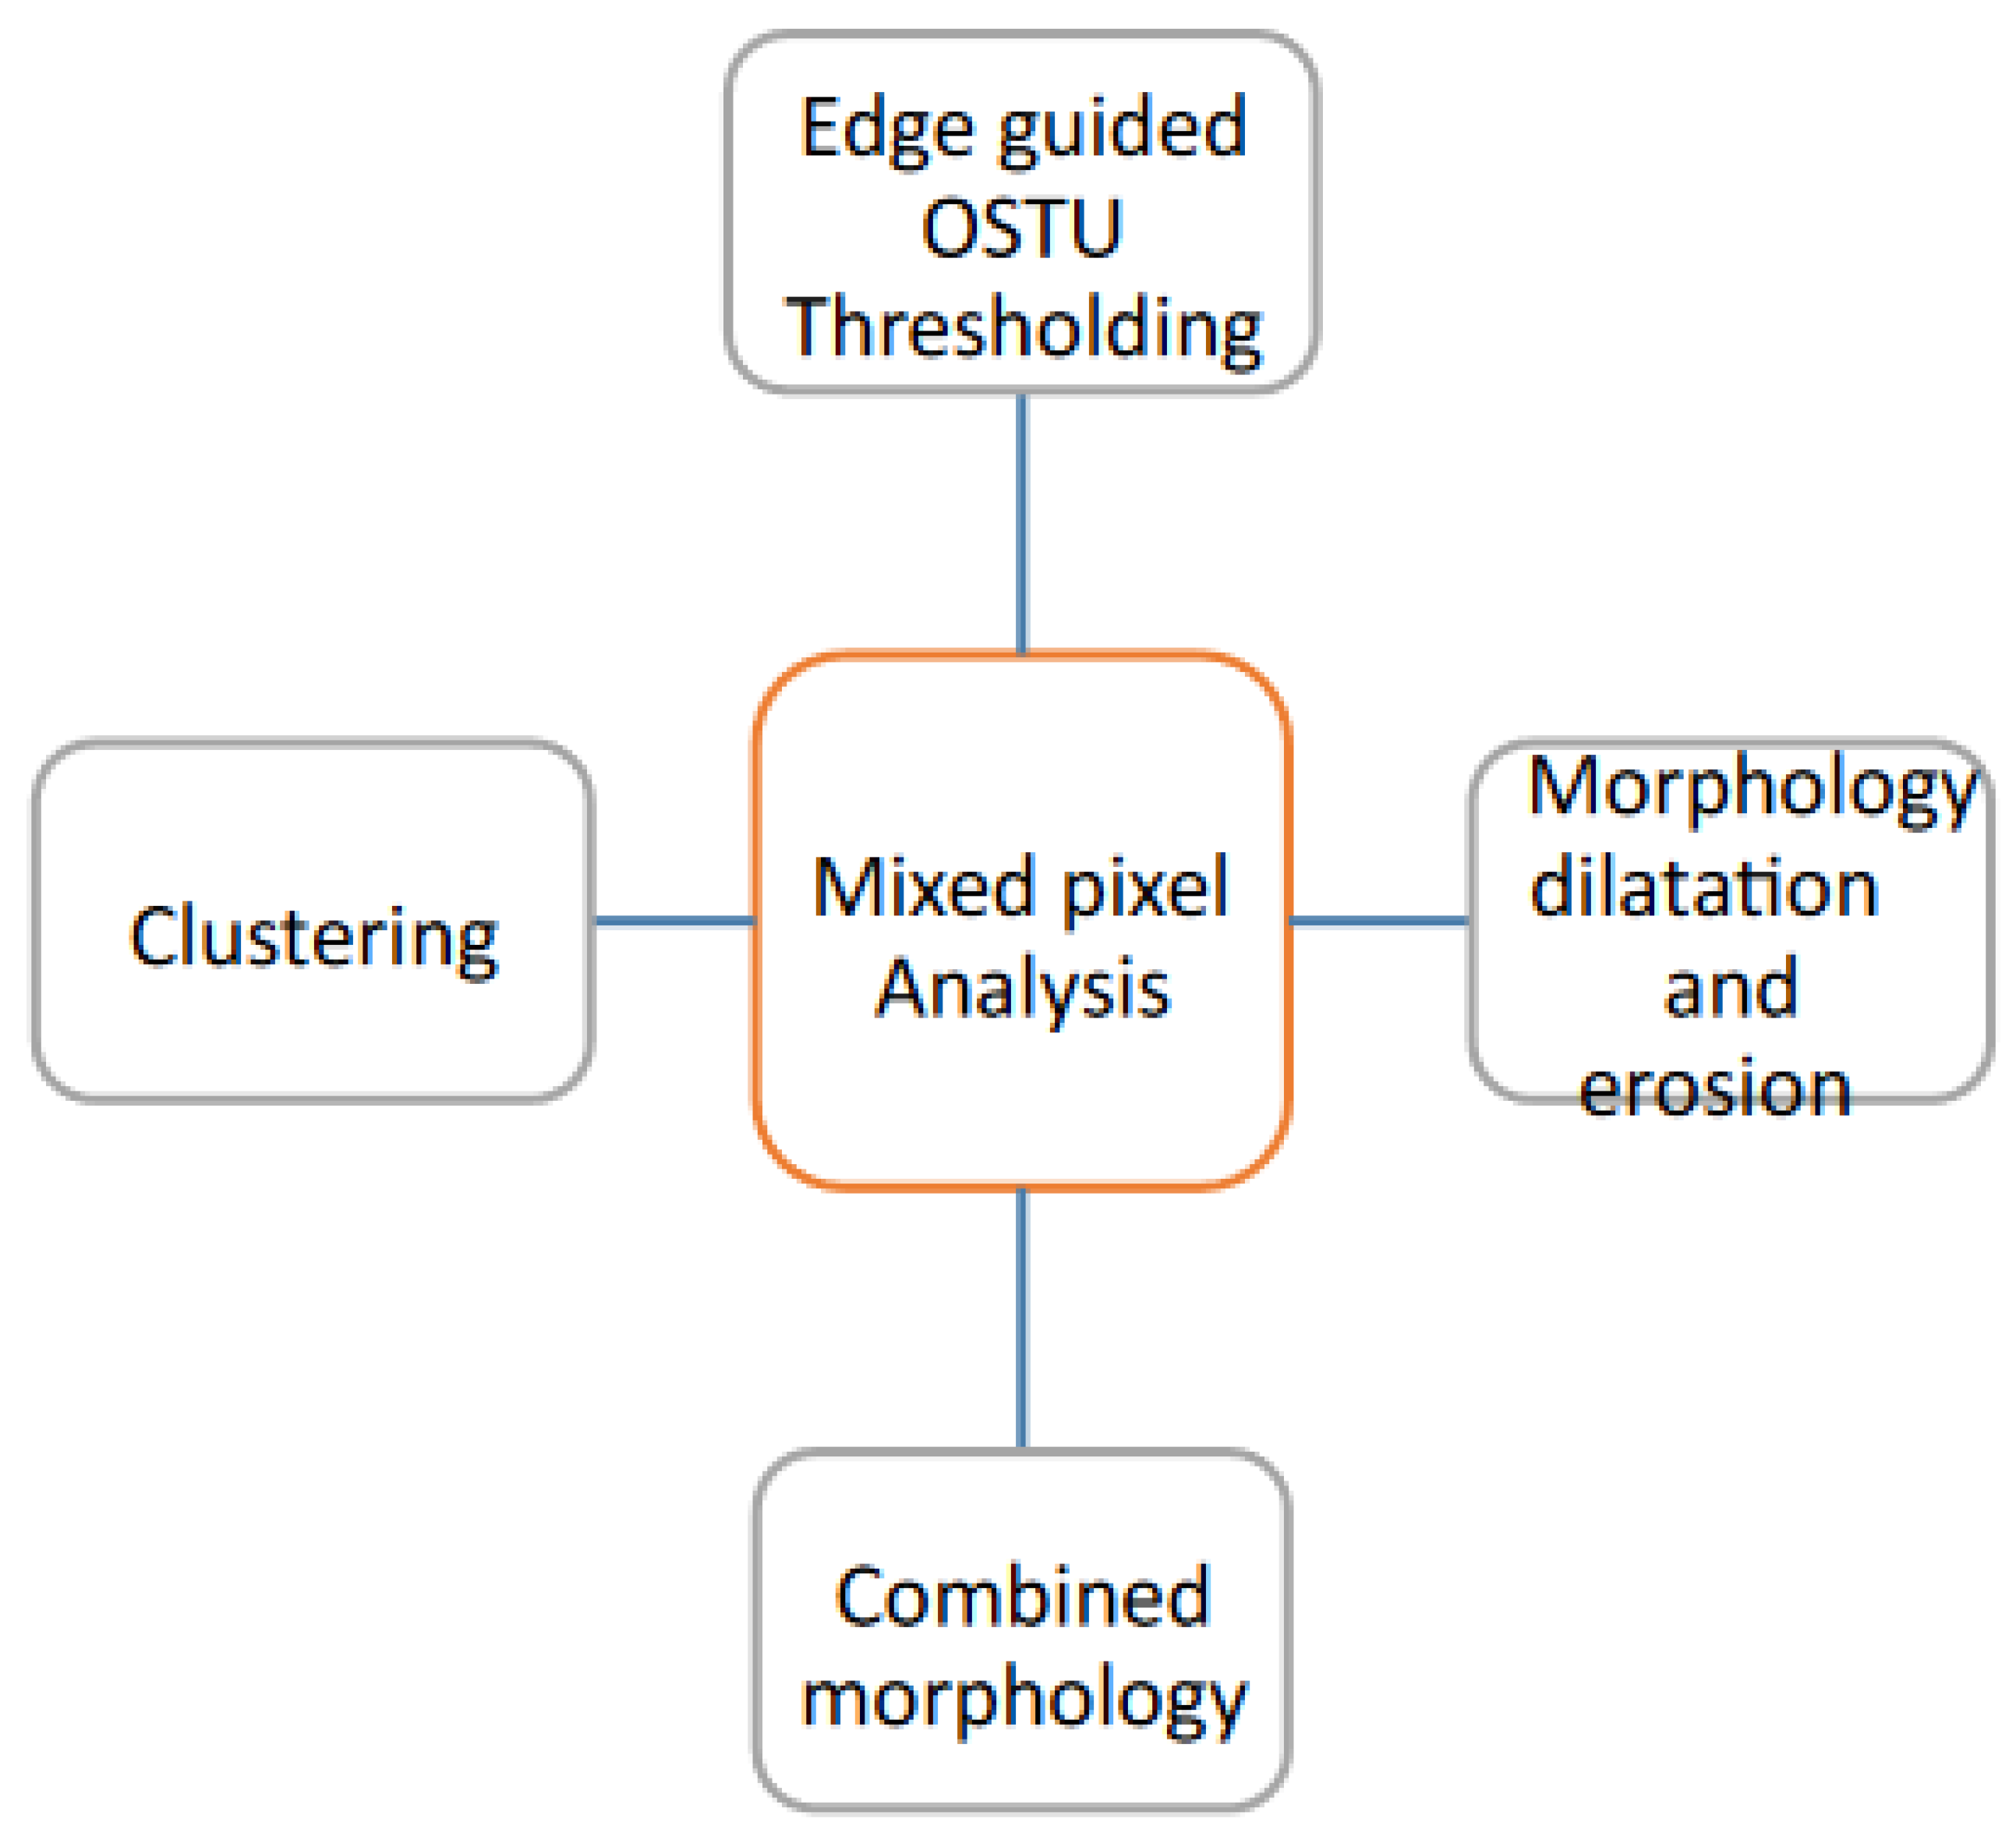
  • Mixed Pixel Analysis: Here, the focus shifts to addressing the mixed pixel problem, a significant challenge in high-resolution satellite imagery. This analysis involves applying various techniques to detect and manage mixed pixels, ensuring that the classification of pixels into distinct categories—such as deforested and non-deforested areas—is as accurate as possible. The methodology employed in this analysis is critical for overcoming the ambiguities associated with mixed pixels, thereby enhancing the reliability of the classification process.
  • Deforestation Analysis: This part of the methodology is dedicated to the specific challenge of deforestation detection. The study outlines the techniques used to classify areas of deforestation and non-deforestation, employing advanced methods like the SiCTT.net framework and deep neural networks. This analysis is pivotal in calculating the extent of deforestation accurately and comparing the results with existing methods to validate the effectiveness of the proposed approach.

2.2. Outcome Analysis:

Following the detailed explanation of the methodology, this subsection presents the results and findings derived from each step of the research. It is also divided into three corresponding parts:
  • Preprocessing Outcome: This section showcases the results of the preprocessing steps, highlighting how the raw data was transformed and prepared for analysis. The effectiveness of the preprocessing techniques is evaluated here, ensuring that the images are of sufficient quality for accurate further analysis.
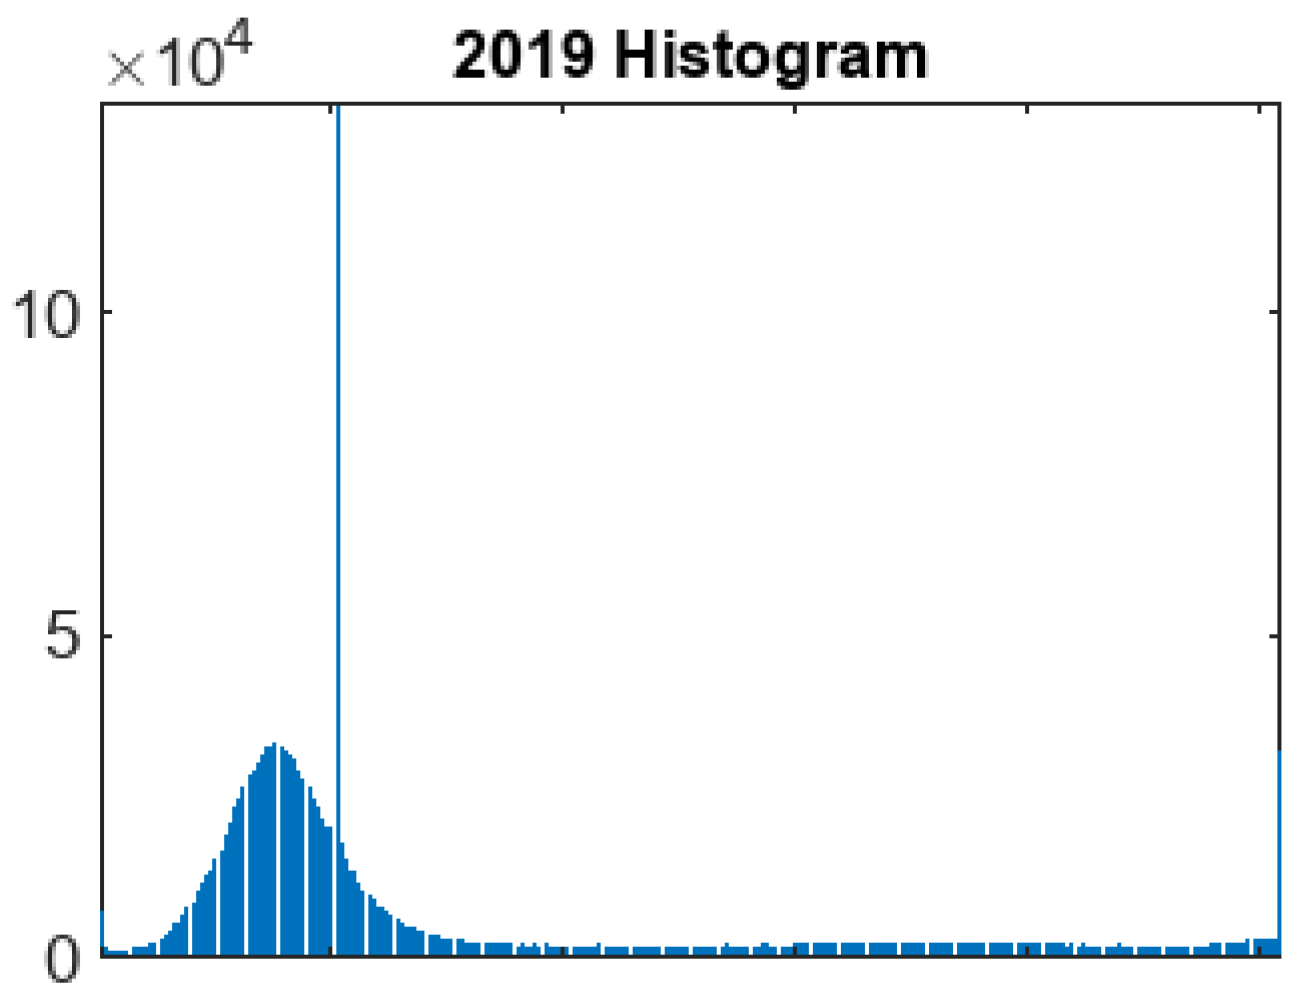
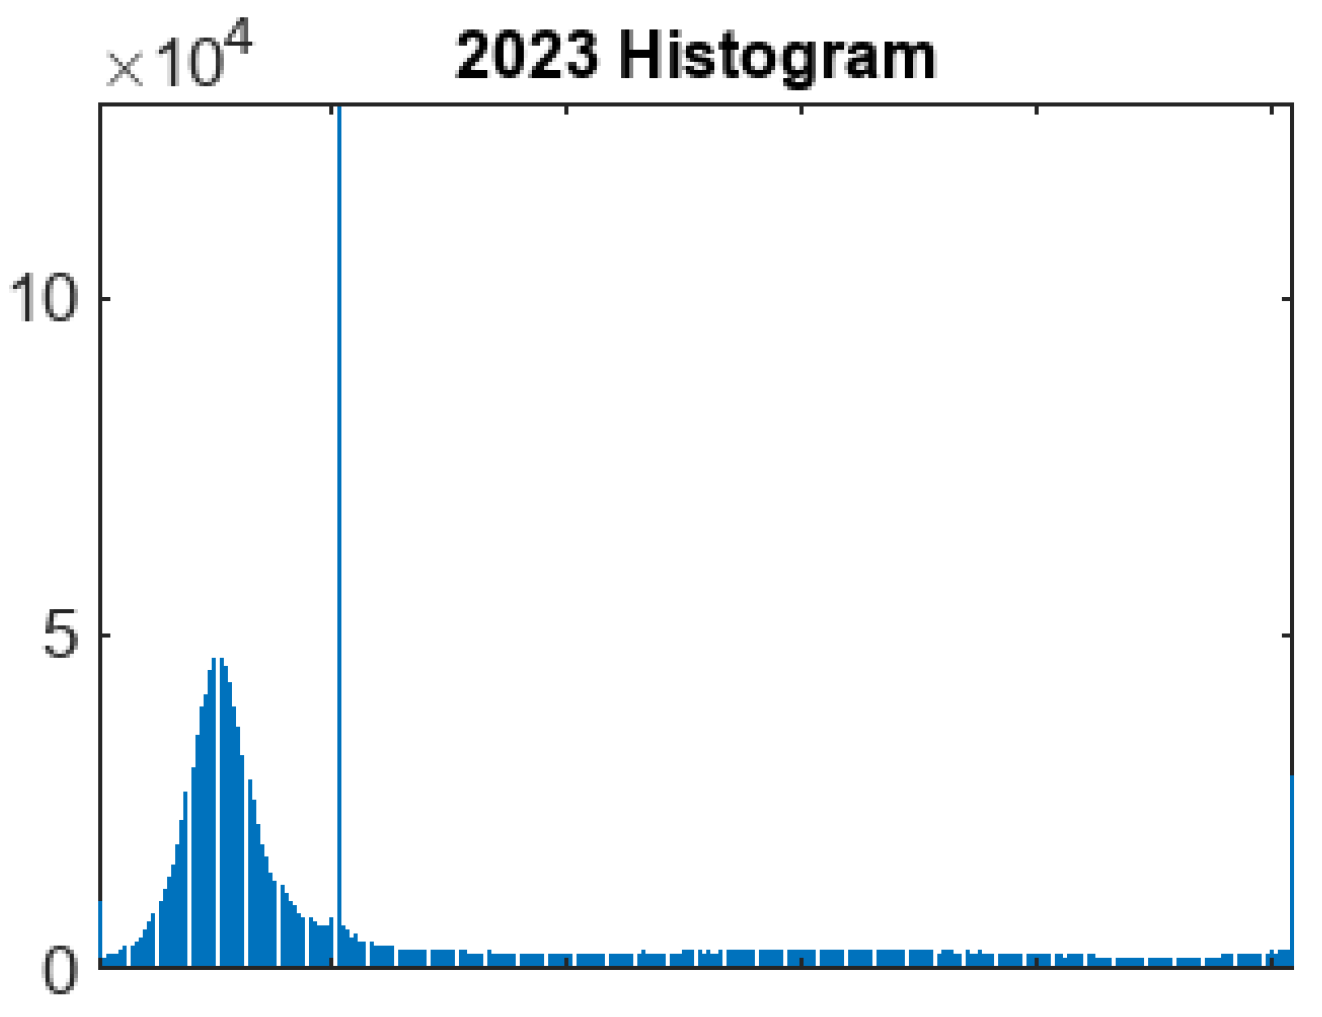
  • Mixed Pixel Outcome: The results of the mixed pixel analysis are presented in this part, demonstrating how the methodologies applied were able to identify and address the mixed pixel problem. This outcome is critical for validating the accuracy of the pixel classification and ensuring that the subsequent deforestation analysis is based on reliable data.
  • Deforestation Outcome: The final part of the Outcome Analysis presents the results of the deforestation analysis. It details the areas identified as deforested and non-deforested, the accuracy of the classification, and the overall effectiveness of the SiCTT.net approach. This outcome is compared with existing methods to highlight the improvements achieved by the new methodology.
By organizing the Materials and Methods section in this structured manner, the paper ensures that each aspect of the research is thoroughly documented and analysed. This approach not only provides clarity to the reader but also reinforces the rigor and reliability of the study’s findings.

2.3. Dataset and Tools:

From 2010 to 2022, Para in Brazil has been the most responsible area for tree loss. Novo Progresso has been roughly the third most responsible region in Para for the loss of trees between 2001 and 2022. Novo Progresso received numerous alerts of deforestation in October 2023, mostly because of fire [33]. The second-largest deforestation area in the Brazilian Amazon is Para, according to an analysis conducted by REDD (Reducing Emissions of Deforestation and Forest Degradation) over the past 15 years [34,35]. In accordance with the study above, the author decided to examine the suggested model for identifying the mixed pixel problem and classifying deforested area using data from the State of Para, Brazil. The Google Earth Pro visualizations of "Figure 2" and "Table 2" below show the dataset description.
The dataset from NASA and ESA Copernicus was used in this work. The author used 2019 and 2023 Sentinel-2 MSI pictures for the examination of the suggested model. With its 15 bands, the Sentinel-2 MSI can precisely observe Earth during the day.
For preprocessing of dataset SNAP tools is used. For identifying the mixed pixel problem Python3 Jyupter notebook 7.0.8v is used and deforested area classification and area calculation is done by MATLAB R2023b. Sentinel Application Platform is a software developed by ESA Copernicus. It is a toolbox suitable for earth observation processing. For Intermediate analysis tool is Python3 jyupter notebook 7.0.8v is used for better and faster analysis of pixels for identifying mixed pixels. The deforested area classification and area calculation using proposed model in MATLAB R2023b which provide fast processing of large dataset of satellite images at the same time.

2.4. Methodology Analysis:

The paper is focused on addressing two primary objectives: the mixed pixel problem in optical satellite imagery and the classification of deforestation. The proposed methodology is divided into three distinct phases, with each phase comprising three specific steps, as illustrated in Figure 3. Although optical satellite imagery provides high-resolution, clear images, the mixed pixel problem complicates the accurate identification of objects within the images, as depicted in Figure 4. The first objective of this study is to develop a comprehensive framework for detecting and resolving the mixed pixel issue in optical satellite data. This is achieved through the application of both pre-processing and intermediate processing techniques as outlined in the proposed methodology.
The second objective is to establish a robust framework for deforestation analysis. This involves comparing the newly proposed method with existing techniques to assess its accuracy and effectiveness in identifying deforested areas. The comparison aims to provide a clearer understanding of the methodology’s performance and to precisely calculate the extent of deforestation. By enhancing the accuracy of deforestation detection, the study seeks to contribute to more reliable monitoring and analysis of environmental changes over time.
The first objective of this paper is focused on identifying and addressing the mixed pixel problem, as illustrated in Figure 4. In Figure 4, image (a) represents the original satellite image from 2019, where the white areas correspond to deforested regions, and the black areas indicate non-deforested regions. In contrast, image (b) presents the NDVI (Normalized Difference Vegetation Index) image for the same year, where the black areas are now indicative of deforestation, while the white areas represent non-deforested regions. Moving to image (c), which shows a cropped NDVI image of the specific study area, the dark regions are prominently highlighted as deforested. However, a significant challenge arises here: some of the white areas within the NDVI study area are mixed with black regions, creating a complex situation that hinders the accurate detection of deforestation.
This blending of pixels—where deforested and non-deforested regions overlap—presents a significant challenge, as it complicates the precise identification and classification of land cover. The red circles in the images provide a clear visual reference, helping to pinpoint the study areas in both the original and NDVI images. The central aim of this paper is to develop a methodology that effectively identifies and addresses the mixed pixel problem, particularly as it manifests in image (c). By applying a range of advanced techniques, the study seeks to thoroughly investigate and resolve the issues caused by mixed pixels, ultimately leading to more accurate calculations of both deforested and non-deforested areas. This approach not only enhances the reliability of deforestation analysis but also contributes to more precise environmental monitoring and decision-making.

2.5. Preprocessing Analysis:

The Sentine-2 MSI has 13 spectral bands of 10m resolution four bands and 20m resolution six bands and 60m resolution three bands of spatial domain. The main motive of S2-MSI is two satellite revolve in same orbit of phase 180 degree to capture images in every 5 days revisit. Preprocessing is an important task of multi spectral images for data preparation to train the deep learning model to validate the accuracy and loss. The first step is stacking of number of bands for data preparation like in this paper only RGB, NIR and SWIR band are used and after that resampling is done using bilinear up sampling and mean down sampling to alter the image resolution to change the pixel value. [36]
Figure 5. Preprocessing steps.
Preprints 139448 g005
After applying the resampling method, the band math concept is used to create new band images for data preparation see below equations.
𝐴𝑑𝑑𝑏𝑎𝑛𝑑 = 𝑅 + 𝐺 + 𝐵
𝐴𝑑𝑑𝑏𝑎𝑛𝑑 = 𝑅 + 𝐺 + 𝑁𝐼𝑅8
𝑆𝑢𝑏𝑏𝑎𝑛𝑑 = 𝑆𝑊𝐼𝑅12 − 𝑆𝑊𝐼𝑅11
𝐴𝑑𝑑𝑏𝑎𝑛𝑑 = 𝑆𝑊𝐼𝑅12 + 𝑆𝑊𝐼𝑅11
𝑀𝑢𝑙𝑏𝑎𝑛𝑑 = 𝑆𝑊𝐼𝑅12 ∗ 𝑆𝑊𝐼𝑅11
D I V b a n d = S W I R 12 S W I R 11
N D V I = N I R 8 B 4 N I R 8 + B 4
Based on above equation, 2019 and 2023 data set is prepared for training and validation. With the help of arithmetic expression, the new bands give more clear visualization of the images and helps in better analysis. The band stacking and merging concept using multiple band math expression is used to understand the combination of different bands to create new band for analysis. The RGB band is used for better representation and for analysing vegetation and type of vegetation, Near Infrared band is helps to classify and detect vegetation, and Short Wave Near Infrared band is useful for providing contrast of vegetation types and has limited cloud penetration. [37,38]

2.6. Mixed Pixel Analysis:

As you can see in Figure 4, the second objective of paper is to analyse mixed pixel problem. For analysing the problem need to do four steps see in Figure 6. As we know, sentinel 2- MSI has 13 bands, but for analysing mixed pixel researcher used band 4 red image and band 8 near infrared image for better analysis of deforested mixed pixels.
The first step is to apply Edge guided OTSU thresholding. This technique is used for segmentation which helps to combine the intensity value with the information of the image edge detected. It helps to modify the image for better analysis. To create NDVI band, equation 7 with band 8 and band 4 is used. First convert NDVI image to GRAY image and apply edge detection using Sobel operator and combine the grey image with edged detected information, after that apply OSTU thresholding for better segmentation see in outcome Figure 9.
After applying OSTU thresholds, we can see lots of pixels are not clearly identified as deforested or non-deforested which create inaccuracy of analysis and create noise as well. That’s why needed to apply Morphological operation. First need to convert NDVI image into binary image to handle NAN value need to do normalization from 0 to 1 range. Apply dilation and Erosion using disk of radius 5 see in Figure 10.
Once morphology done, as you can see the clear difference in dilation image and erosion image. Lots of pixels are mixed and can’t analyse the appropriate number of deforested pixels for better calculations of deforestation area. The next step is to combine dilation and erosion morphology operation for better understanding of pixels see in Figure 11. The combined need more processing for better analysis to apply overlay of dilation with green channel and erosion with red channel see in Figure 12.
After applying combined overlay dilation-erosion image, the view of deforested area is much clear compared to binary and NDVI image. Need to analyse the appropriate pixels to apply clustering. Clustering is a technique of unsupervised machine learning. It helps to analyse the pixel belongs to which cluster for better understanding of complexity of mixed pixels detection. For applying K-mean clustering need to convert 2D image into flatten dataset of rows belongs to pixels and column belongs to bands and then apply clustering of 3 classes (deforested, non-deforested, water). After that, need to reshape the clustered label back into image dimensions to visualize the clustered results see in Figure 13.

2.7. Deforestation Analysis:

To analyse the deforestation, proposed model is used deep learning classification technique and compare the result with existing model. The existing model is used Convolutional layer and proposed model used Transpose Convolutional layer called SICTT.net see in Figure 12, Satellite Image Clustering using Transpose Transformation deep neural Networking. The proposed model is applied in 2019 and 2023 data set prepared by the Band Math new bands for deforestation analysis. The Table 3 gives description of proposed model and Figure 6 gives graphical view of proposed model see in below.
The Figure 3 workflow diagram helps us to understand the complete overview between pre-processing, intermediate processing and final processing. The proposed model analysed by their output results and images. In next section, we discussed about the outputs of pre-processed results of 2019 and 2023 dataset. And after applying the mixed pixel analysis approach in pre-processed images of 2019 for better visualization of pure pixel and mixed pixel.
The dataset preparation to train the proposed model using Band-Math equations in 2019 and 2023 images. After that, SiCTT.net processing analysis using accuracy and loss. For calculating the deforested area, we use segmentation of 100 thresholding for identifying the deforested pixels using binary images. To convert the segmented image into binary and create mask for identifying the deforested area. To calculate the deforested area, binary mask is used. For the area calculation, author convert number of pixels into kilometre per square.
Area   per   k m 2 = n u m b e r   o f   p i x e l s 0.001
Sentinel-2 imagery features multiple bands with varying spatial resolutions, crucial for different types of analysis. Specifically in this paper we use on RGB and NIR band and, the visible and near-infrared bands—Bands 2 (Blue), 3 (Green), 4 (Red), and 8 (Near-Infrared)—each have a spatial resolution of 10 meters per pixel. This means that each pixel in these bands corresponds to a 10-meter by 10-meter area on the ground. To convert the number of pixels from these bands into an area in square kilometres, use a conversion factor. Since each 10m x 10m pixel covers 100 square meters, which equals 0.0001 square kilometres, you multiply the number of pixels by 0.0001 to find the total area in square kilometres.

2.8. Outcomes Analysis:

The experimental analysis is based on four sections. The First section, discussed about pre-processed images as an input for further analysis based on Figure 5 and equation (1-7) of Band-Math for dataset preparation. The second section, discussed about the intermediate processing results based on Figure 6 to analyse the mixed pixel problem. And the third section, discussed about the proposed model results based on Table 3 and the comparison between two different datasets. The final Forth section, discussed about deforested and non-deforested area calculation based on “Equation (8)” and their difference analysis using graphs.

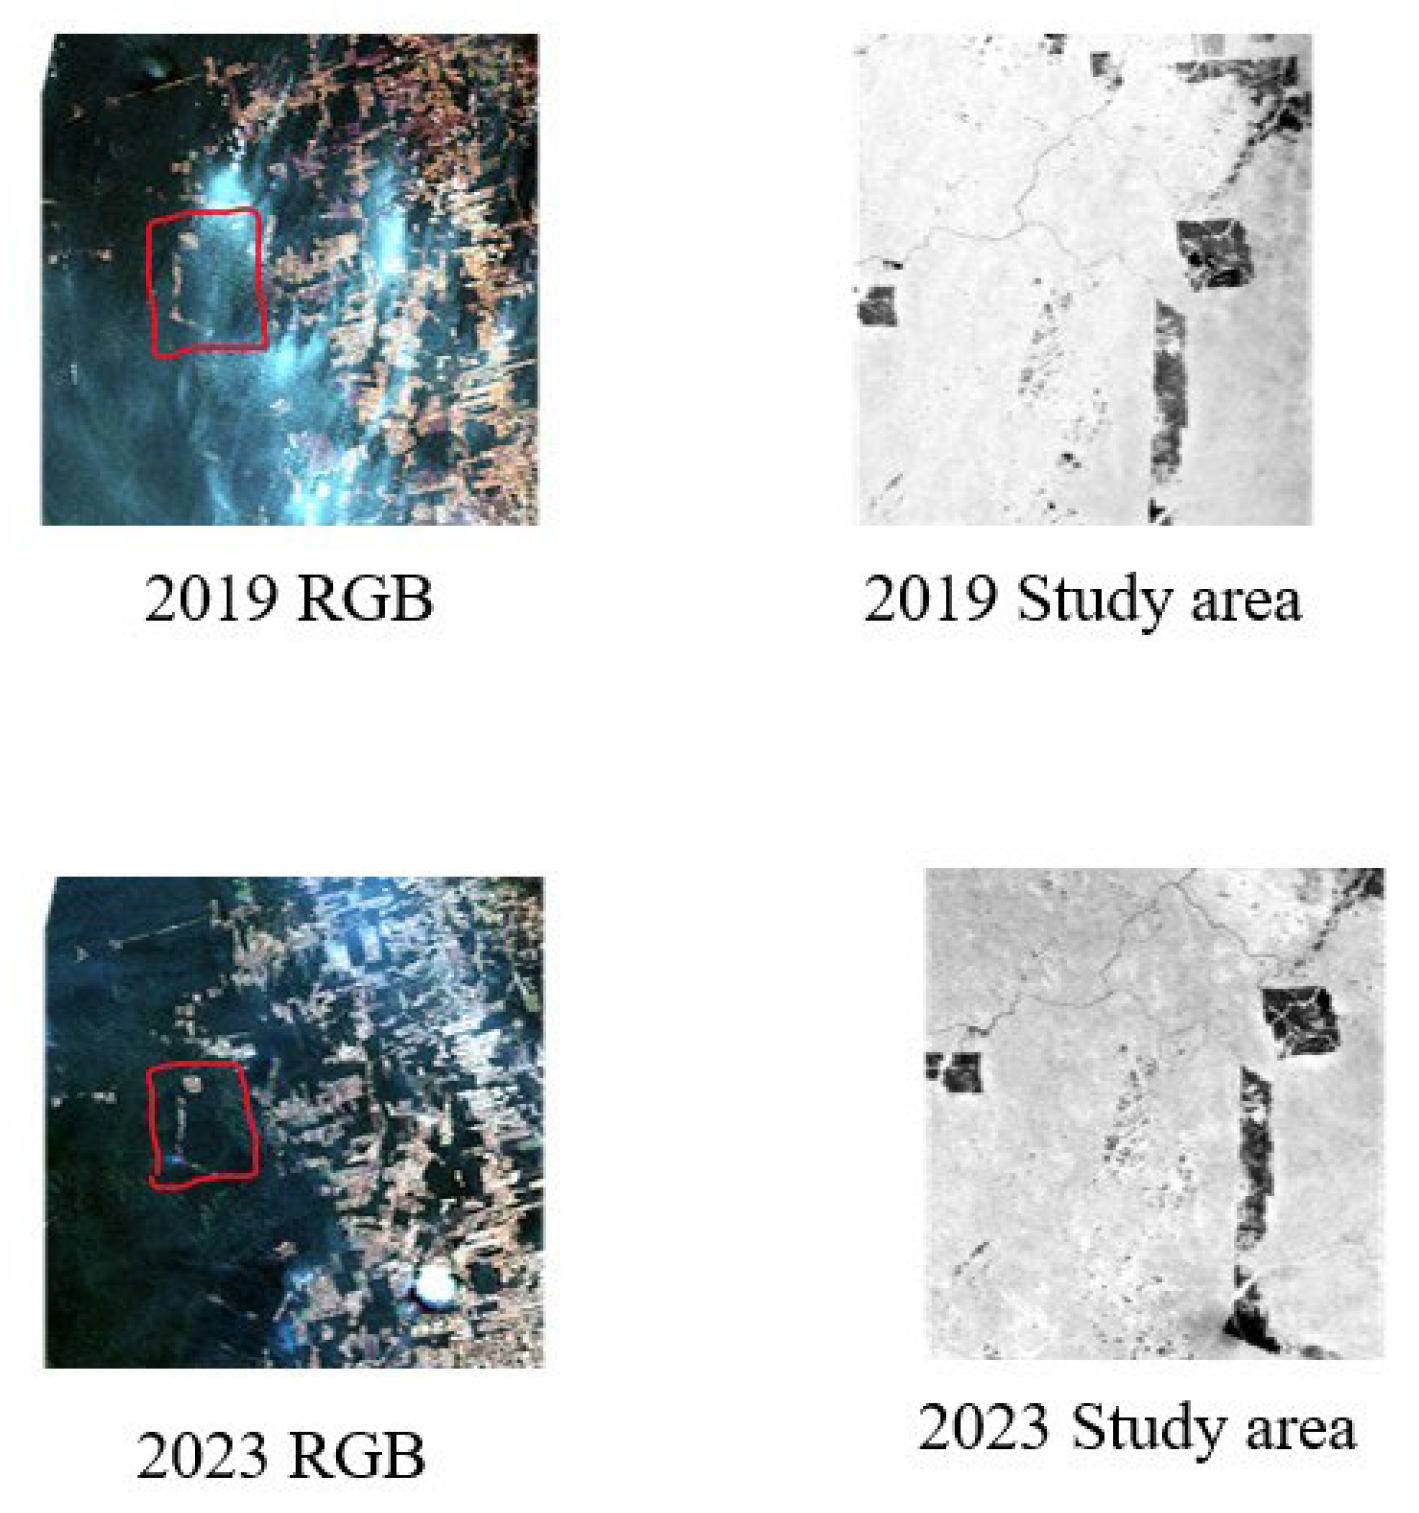
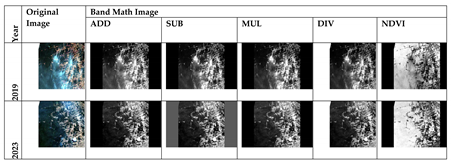
3. Preprocessing Band Math Images:

The preprocessing is based on resampling and Band-Math on 2019 and 2023 sentinel-2 MSI dataset see in below Table 4. As you can see, the difference between Add band, Sub band, Mul band and Div band is very similar only little bit different in visualization. With the help of Band Math, merging combination of red, green blue and near infrared band help to prepare dataset for training and validation purposes of Proposed model. For mixed pixel analysis NDVI image is used.
As you can see in above table 4, with the help of Band Math, visualization of deforested and non-deforested pixels is much clear. For better understanding of difference between 2019 and 2023 histogram analysis shown in Figure 7 and Figure 8 see below.
Figure 8: 2023 Histogram.

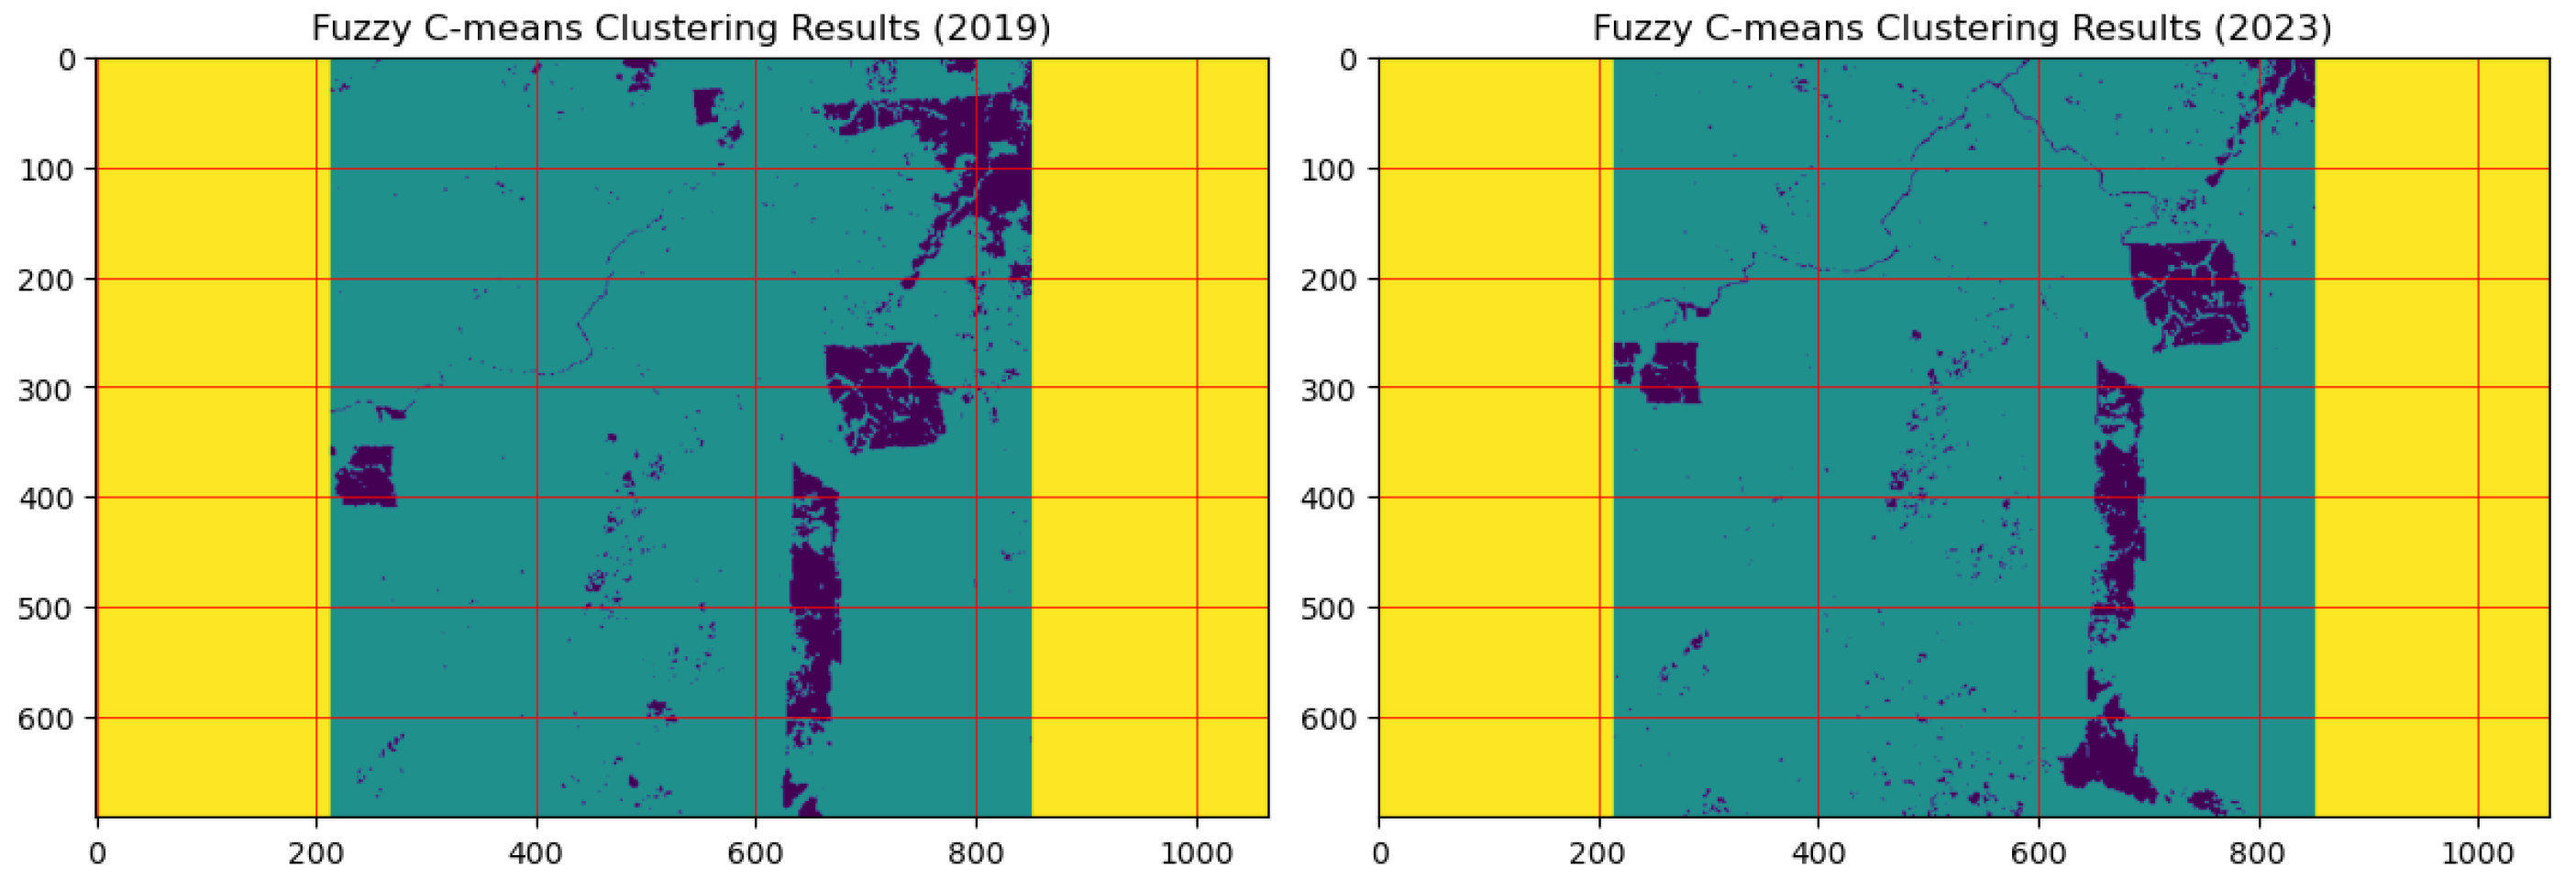
3.1. Mixed Pixel Analysis:

To analyse the pixels, belong to pure pixel or mixed pixel need to apply some strategy. For mixed pixel analysis based on Figure 6 needs four steps. The first step is to apply edge segmentation using OSTU thresholding for determining the boundary edges of the 2019 and 2023 NDVI image see in below Figure 9. NDVI of 2019 and 2023 image calculated by using Equation (7) with the help of using Band 4 (Red Band) and Band 8 (Near Infra-Red). As you can see, the clear boundary of edges in green in colour, but still lots of unwanted pixels are green which is bit difficult to analyse the deforestation. By applying Otsu’s thresholding, we effectively distinguished between vegetation and non-vegetation areas, facilitating further analysis. The thresholding process transforms the NDVI image into a binary image, where pixels above the threshold are classified as deforestation (white) and classified as non-deforestation (green). Otsu's method is a widely used technique that automatically determines the optimal threshold value to minimize intra-class variance and maximize inter-class variance.
Figure 9. Study area Edge detection using OTSU thresholding.
Preprints 139448 g009
For the analysis of unwanted pixels of above Figure 9, need to apply Morphological Dilation and Erosion operation see in Figure 10. The normalized NDVI is used for handling NaN values and then apply thresholding to create binary image. The next image in dark green colour shows the result of dilation using disk like shape of structure with radius 5 pixels. And the light green colour image represents the result of erosion using same disk-shaped structure with radius 5 pixels. As you can see the Figure 10, Dilation is very clear, but Erosion is still not that much clear. That’s why, both morphological operations are combined for better visualization see in Figure 11. With the help of combining morphological operation, for analysing mixed pixels. After combining the dilation and erosion need to apply overlay method. For highlighting the dilated area are coloured with green due green channel is considered and the eroded area are filled with colour red due to red channel is considered. As you can see in below Figure 12, the dark green represents Dilation and yellow represents to combined area of dilation and erosion. By applying morphological operations to refine the binary segmentation results. Morphological operations, including dilation and erosion, are used to remove noise and enhance the structure of the segmented image. Dilation operation expands the boundaries of the foreground pixels (vegetation) in the binary image, filling small holes and connecting fragmented regions. Dilation enhances the representation of the vegetation areas, ensuring that smaller patches are included in the analysis. Erosion removes small-scale noise from the binary image by shrinking the boundaries of the foreground pixels. This helps to eliminate small artifacts and refine the shape of the vegetation areas. The combination of dilation followed by erosion (also known as opening) effectively cleans up the binary image, making it more representative of actual vegetation cover. This step is crucial for ensuring the accuracy of subsequent clustering analyses.
Figure 10. Study area Normalized Morphology operation analysis.
Preprints 139448 g010
Figure 11. Study area Dilation-Erosion combined image analysis.
Preprints 139448 g011
Figure 12. Study area Overlay Dilation-Erosion combined image analysis.
Preprints 139448 g012
After combining the dilation-erosion, need to apply basic k-mean clustering. With the help of clustering, we can easily group into the classes. It helps to classify the inter pixels classes and intra pixels classes for better visualization see in Figure 13. The inter pixel clustering means pixel belongs to different classes. The intra pixel clustering means pixel belongs to same classes. The mixed pixel means pixel belongs to multiple classes. With the help of clustering, we can easily analyse the pixel classes. Once the NDVI values were segmented and refined through morphological operations, K-means clustering was applied to classify the pixels into distinct clusters based on their spectral characteristics. K-means is an unsupervised clustering algorithm that partitions data into K distinct clusters by minimizing the variance within each cluster. In our analysis, we selected three clusters, representing vegetation, water bodies, and urban areas. K-means clustering allows for a straightforward interpretation of land cover types based on spectral signatures, providing a quantitative method to classify the satellite imagery. The algorithm's efficiency and simplicity make it suitable for handling large datasets like satellite imagery. To mitigate the K-means clustering results and account for the inherent uncertainty in pixel classification, we also employed Fuzzy C-means clustering. This algorithm allows each pixel to belong to multiple clusters with varying degrees of membership, providing a more nuanced classification. For this study, we again utilized three clusters similar to K-means representing vegetation, water bodies, and urban areas.. The Fuzzy C-means approach is particularly beneficial in scenarios where land cover types exhibit spectral similarities. By allowing partial membership, we gain insight into the transitions between different land cover classes, leading to more robust classifications. This method improves the accuracy of vegetation assessments, as it captures the overlap between vegetation and other land cover types.
Fuzzy C-means (FCM) clustering is often considered superior to K-means clustering for pixel analysis in remote sensing and image processing due to several key characteristics that address the limitations of K-means, especially in scenarios involving spectral overlap, uncertainty, and complex land cover types. Here are some of the main reasons why FCM may be better suited for pixel analysis compared to K-means: In K-means clustering, each pixel is assigned to one and only one cluster, leading to hard classification. This can be problematic in cases where a pixel's spectral signature may belong to multiple land cover types (e.g., mixed pixels containing vegetation and soil). FCM allows each pixel to belong to multiple clusters with varying degrees of membership, represented by a membership value between 0 and 1. This means that a pixel can be partially classified as belonging to more than one class, capturing the inherent ambiguity present in remote sensing data. K-means struggles with spectral overlap among different land cover types, which can lead to misclassification. If two classes have similar spectral characteristics, K-means may assign pixels incorrectly to a single cluster. FCM's ability to assign membership values allows it to better accommodate pixels that fall on the boundary between two or more classes. This flexibility enhances the robustness of the classification process, especially in heterogeneous landscapes where different land cover types intermingle. There are many pros and cons in K-mean compared to FCM offers significant advantages over K-means for pixel analysis in remote sensing applications. Its ability to handle partial membership, spectral overlap, and noise, coupled with improved classification accuracy, makes FCM a valuable tool for analysing complex land cover types and assessing vegetation health. By allowing for uncertainty and variation in land cover classifications, FCM provides a more comprehensive understanding of the landscape, making it a preferred choice in many applications involving satellite imagery and environmental monitoring.
Figure 13. Study area K-mean clustering analysis.
Preprints 139448 g013

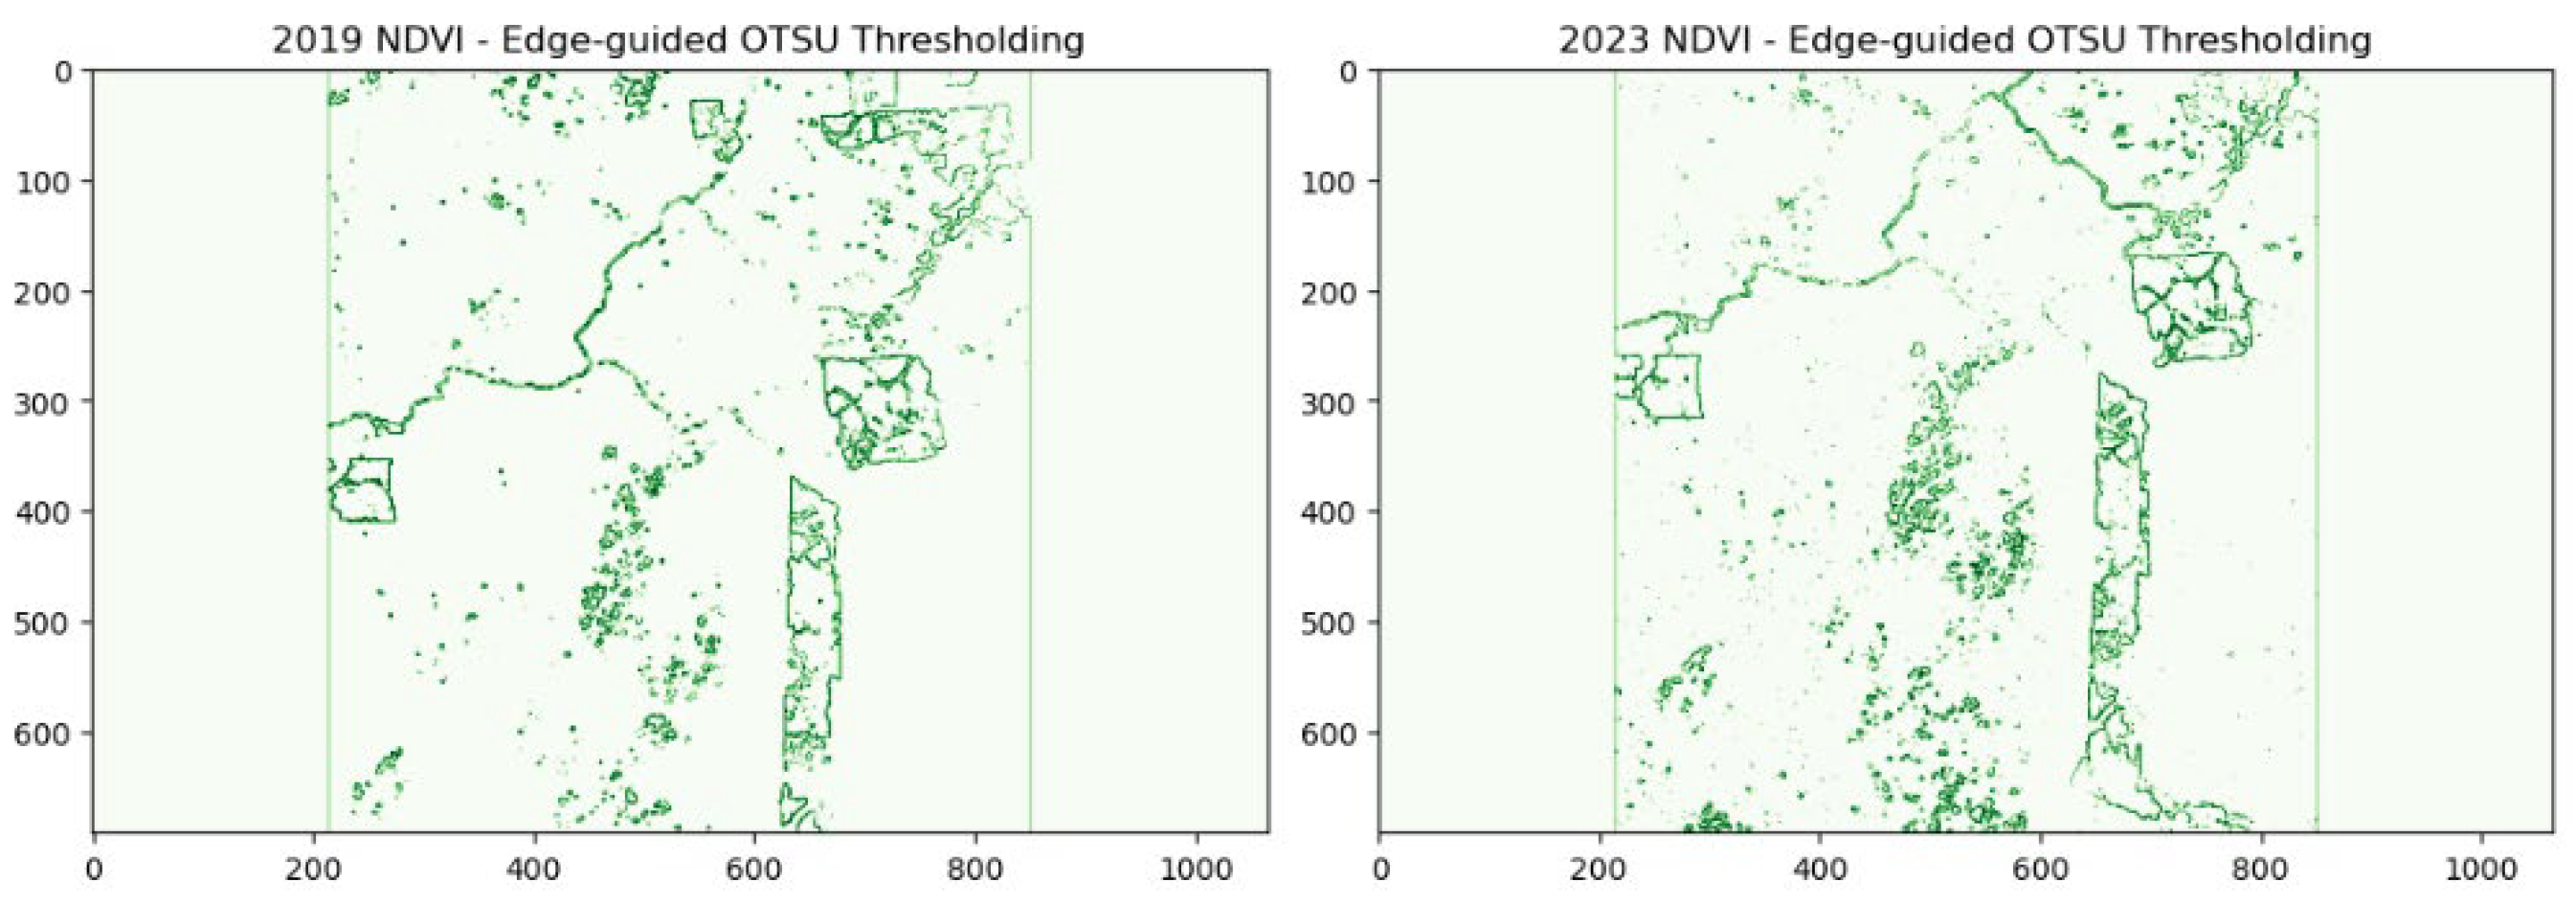
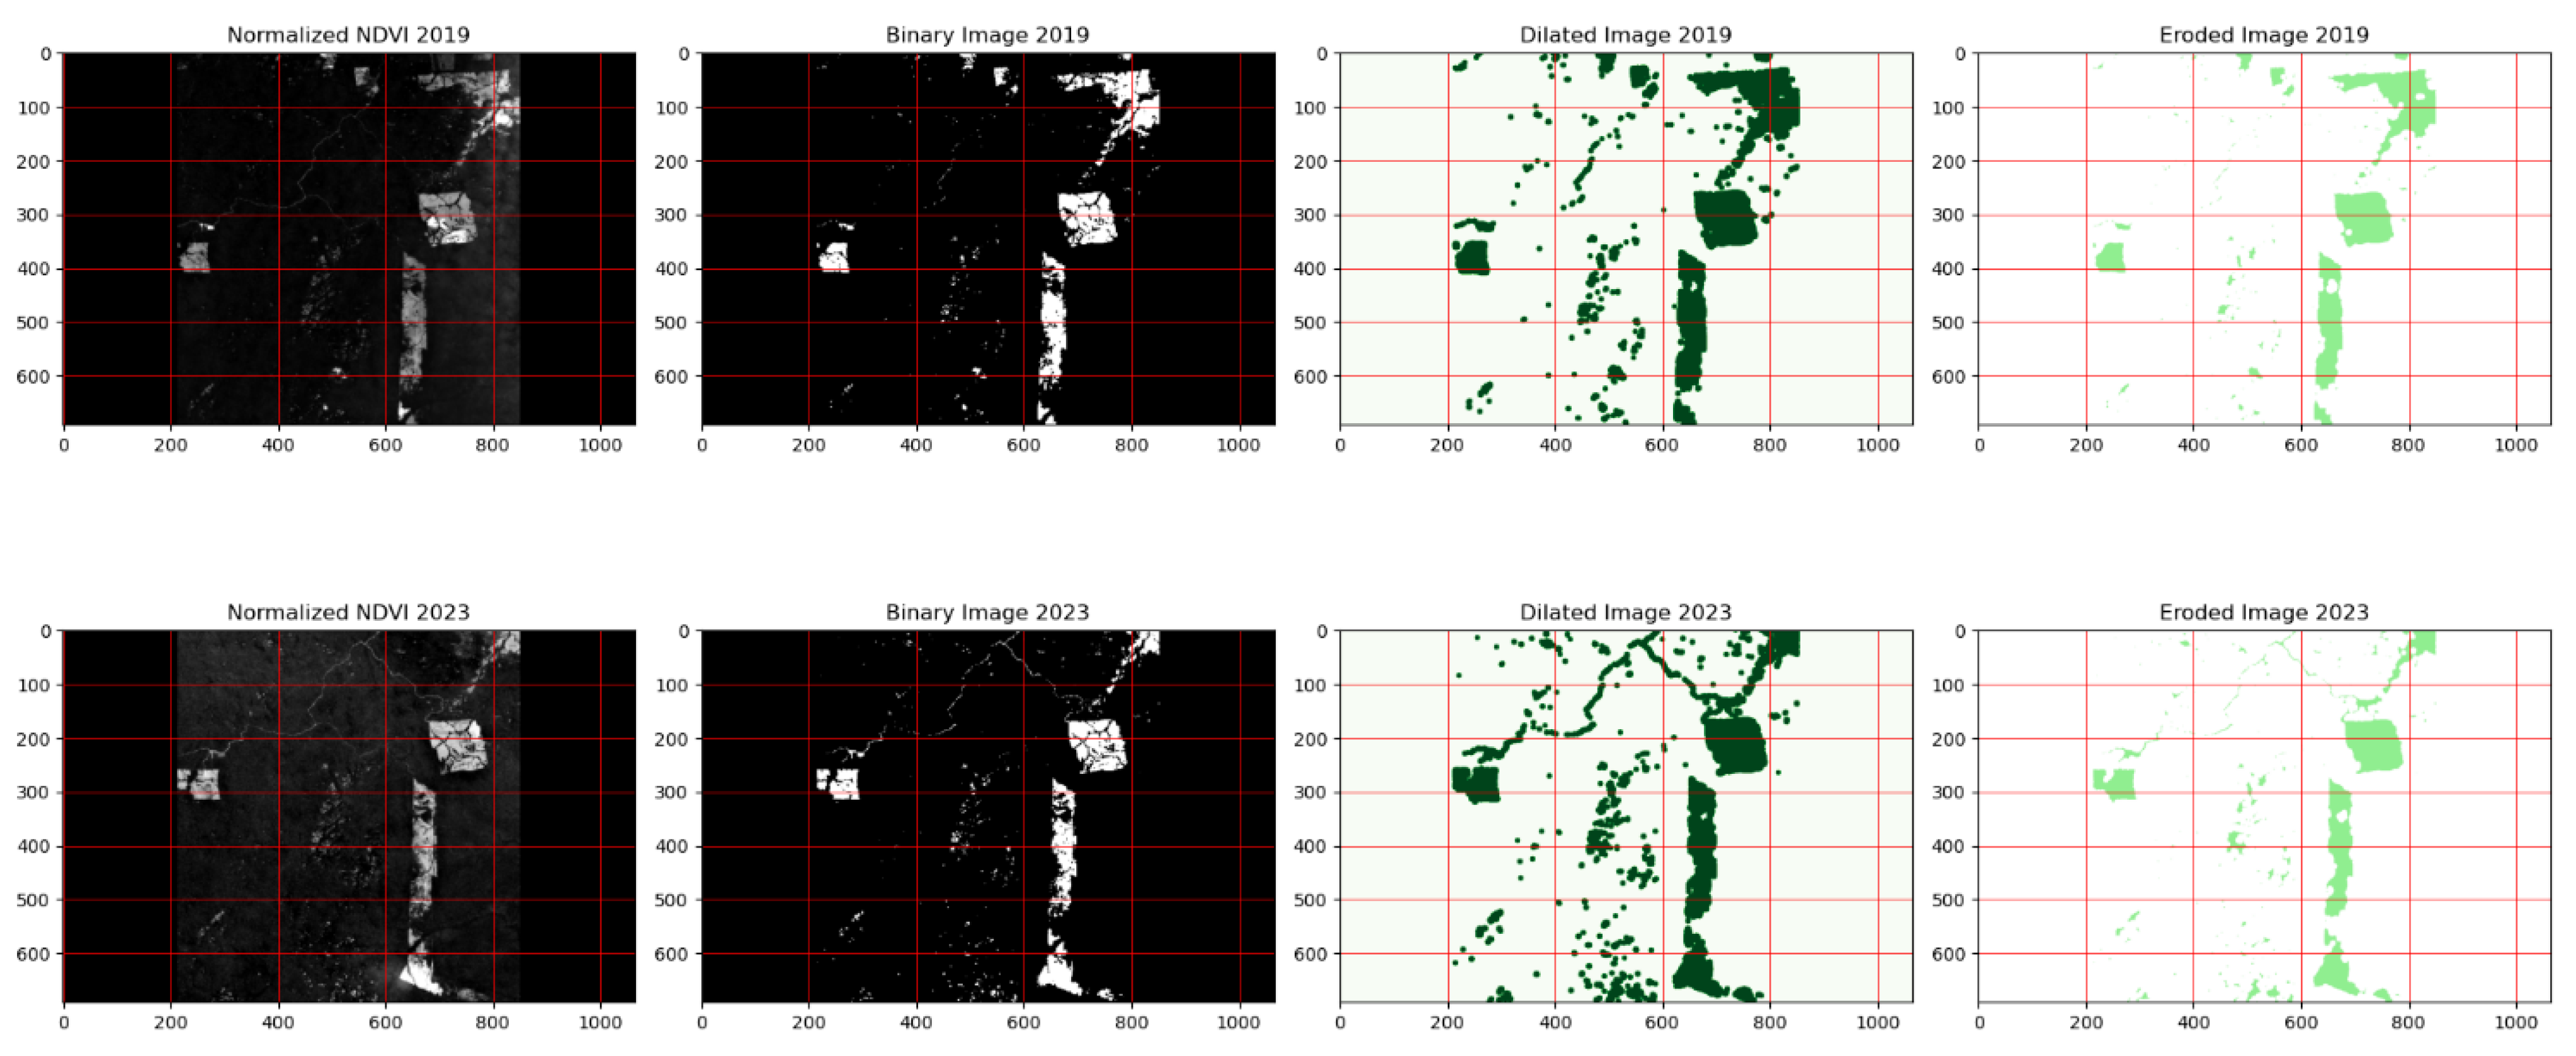
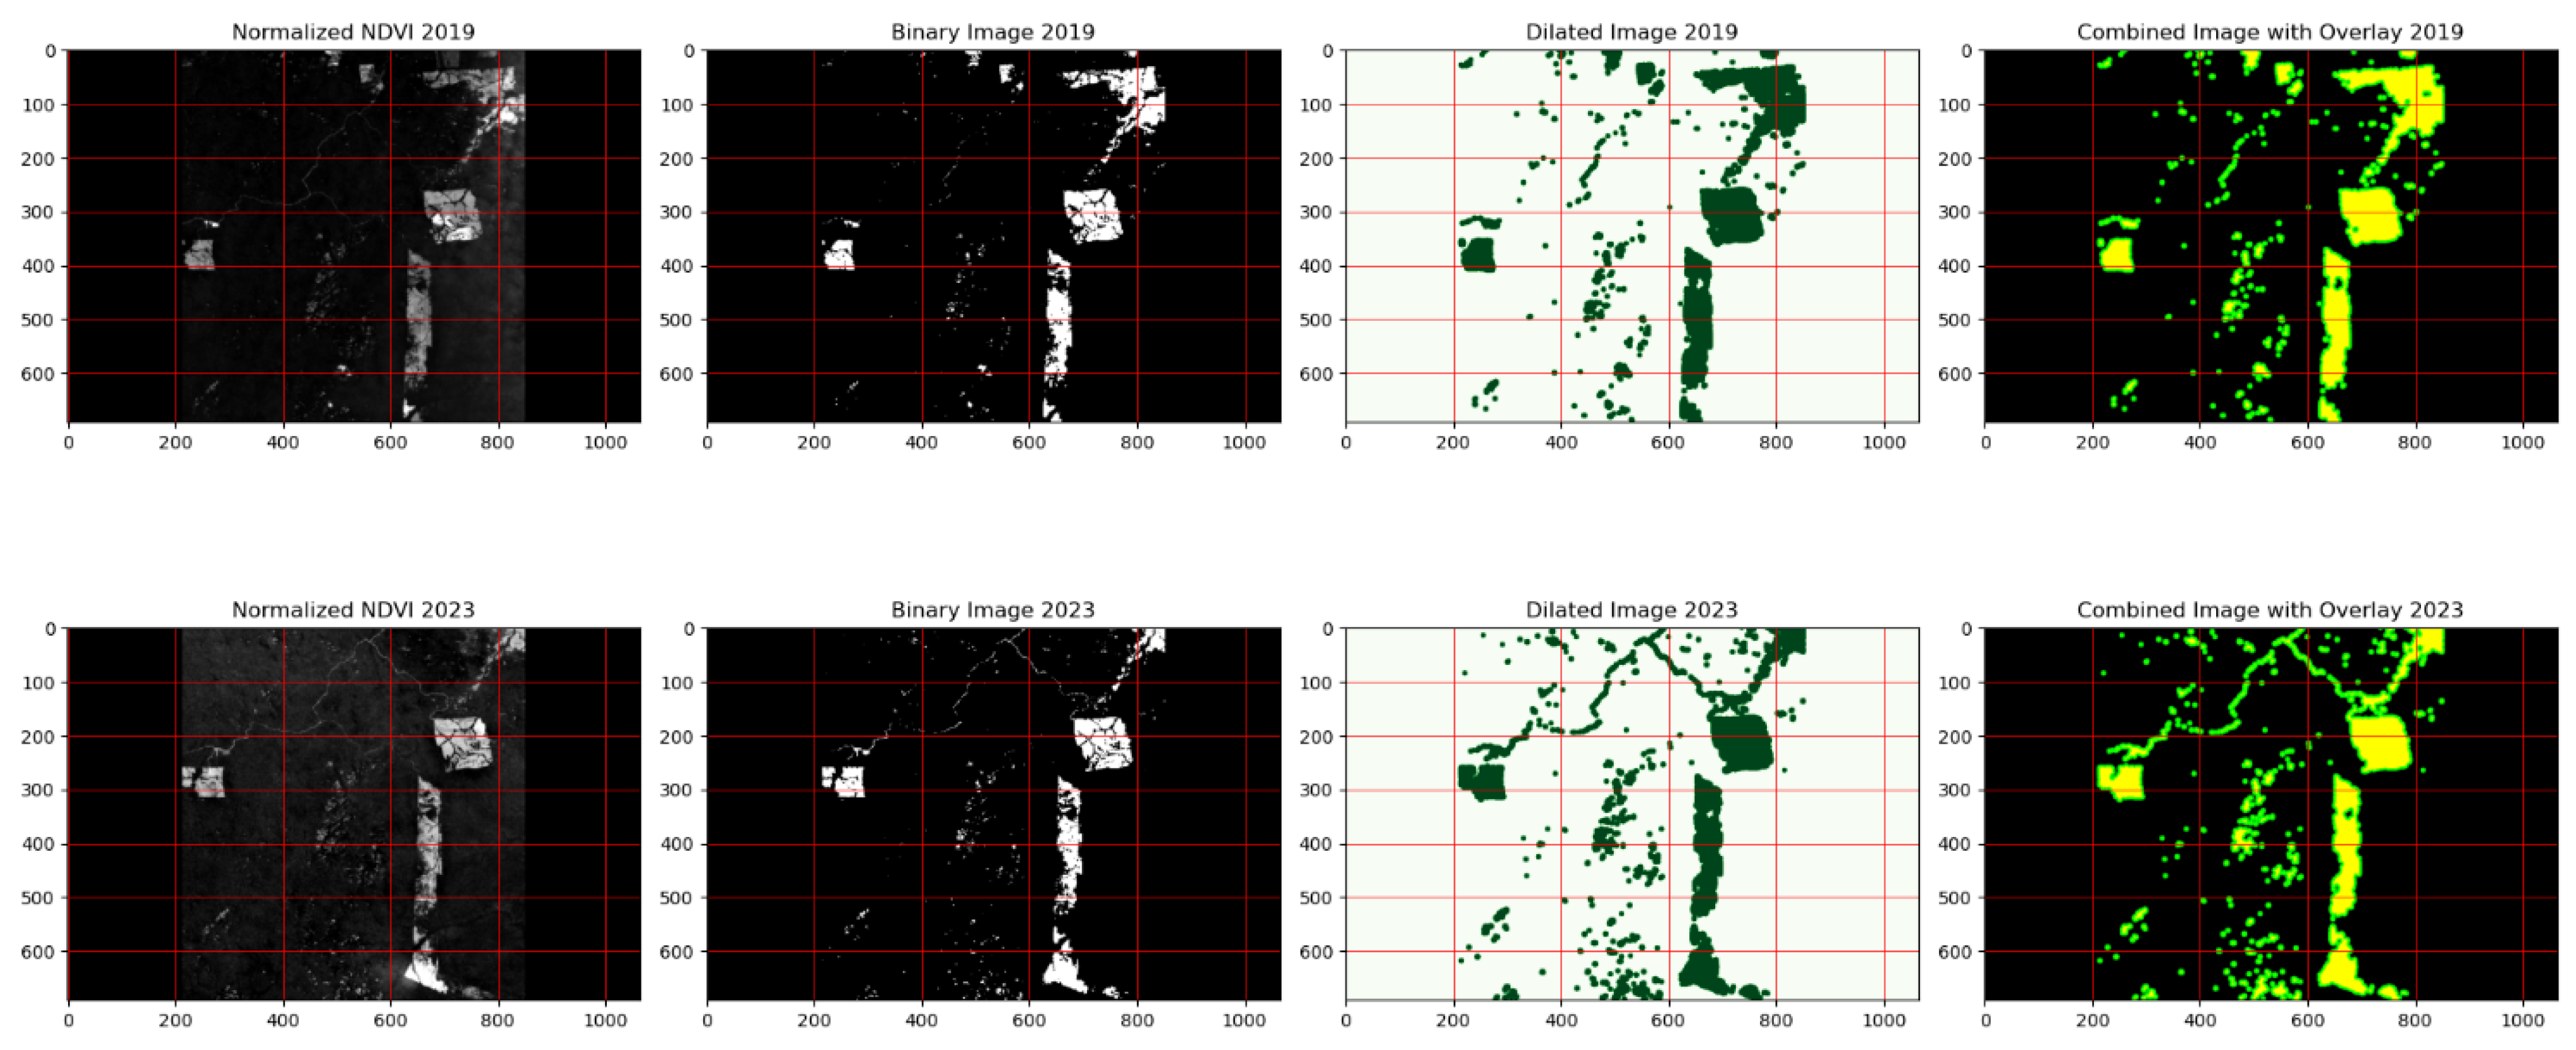
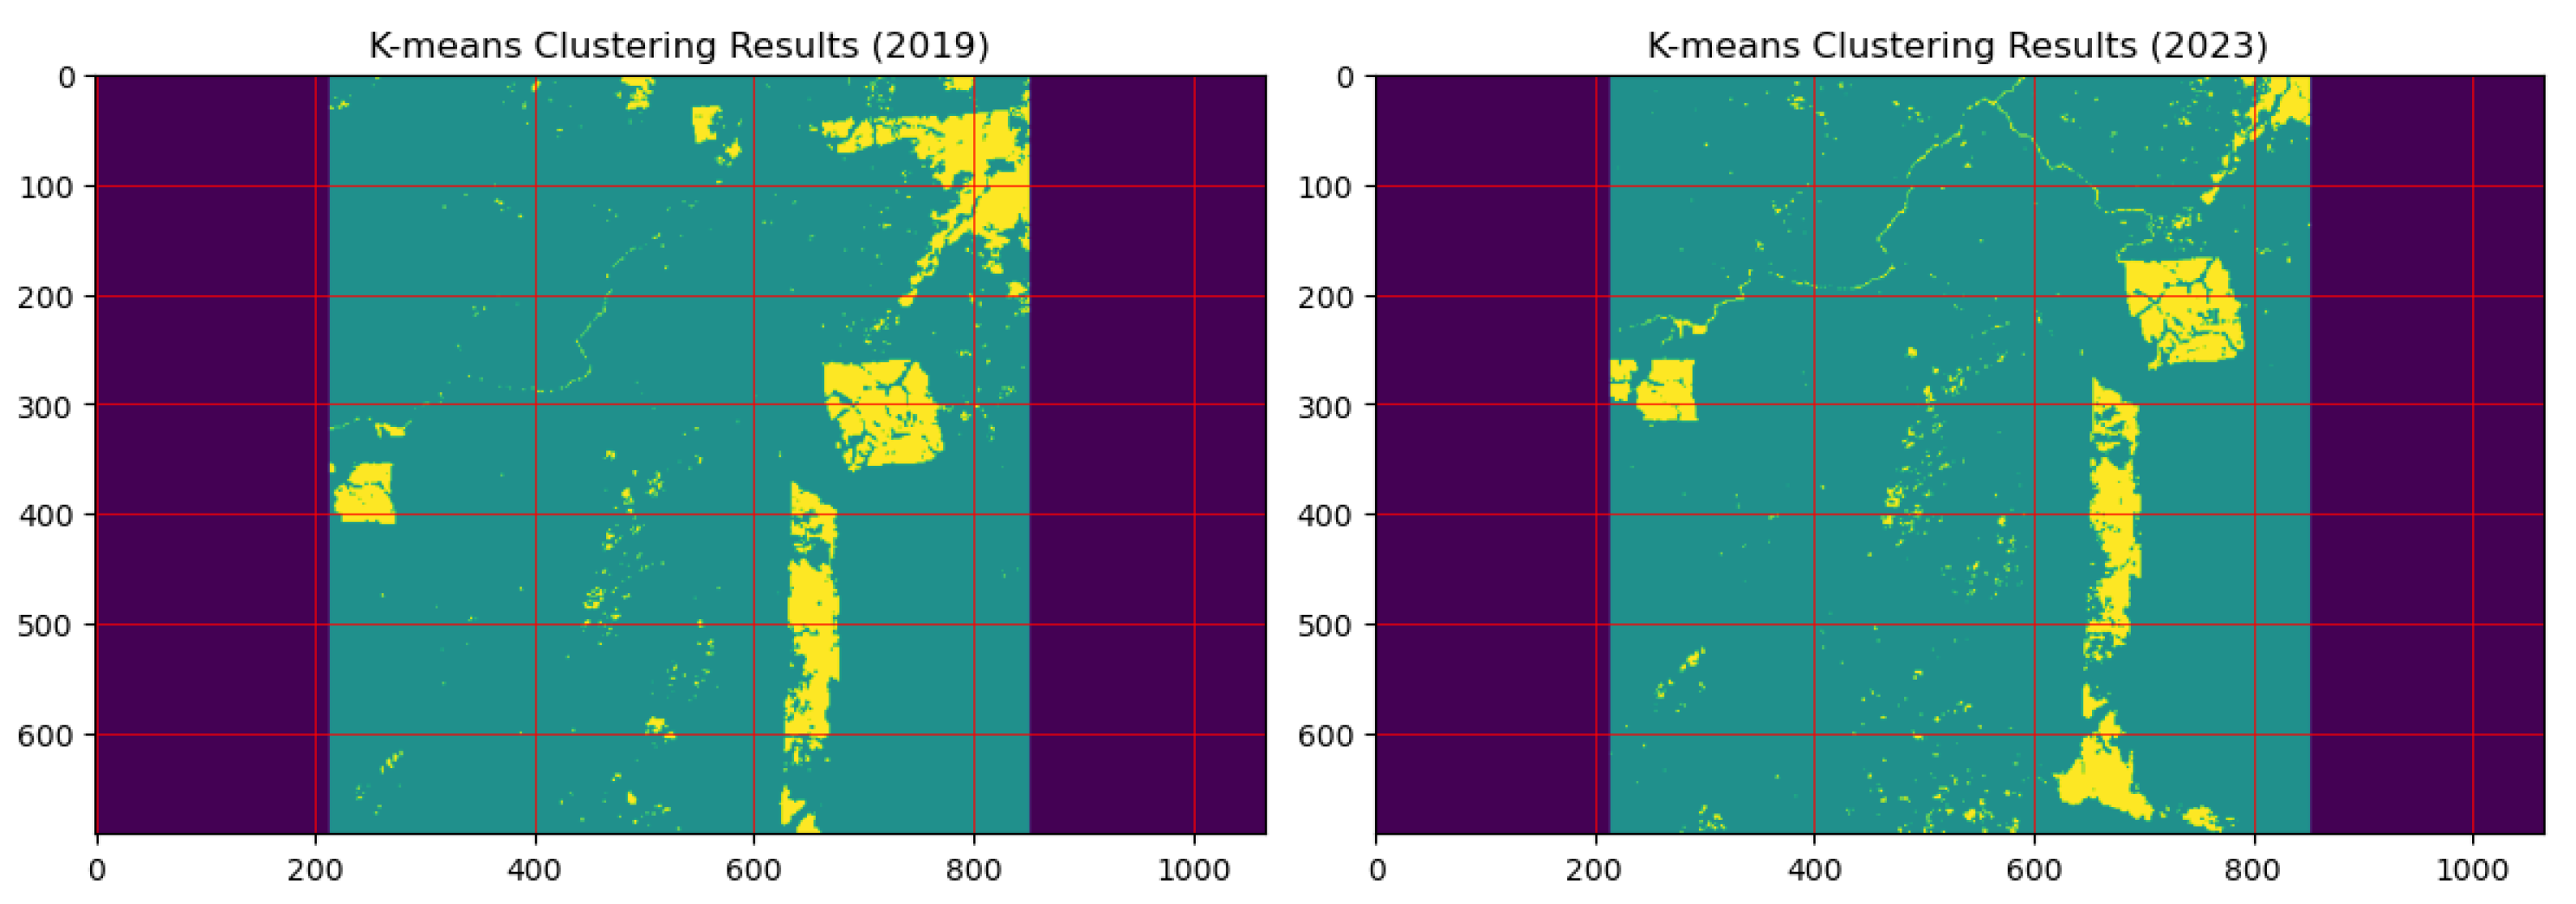
3.2. Deforested Area Analysis:
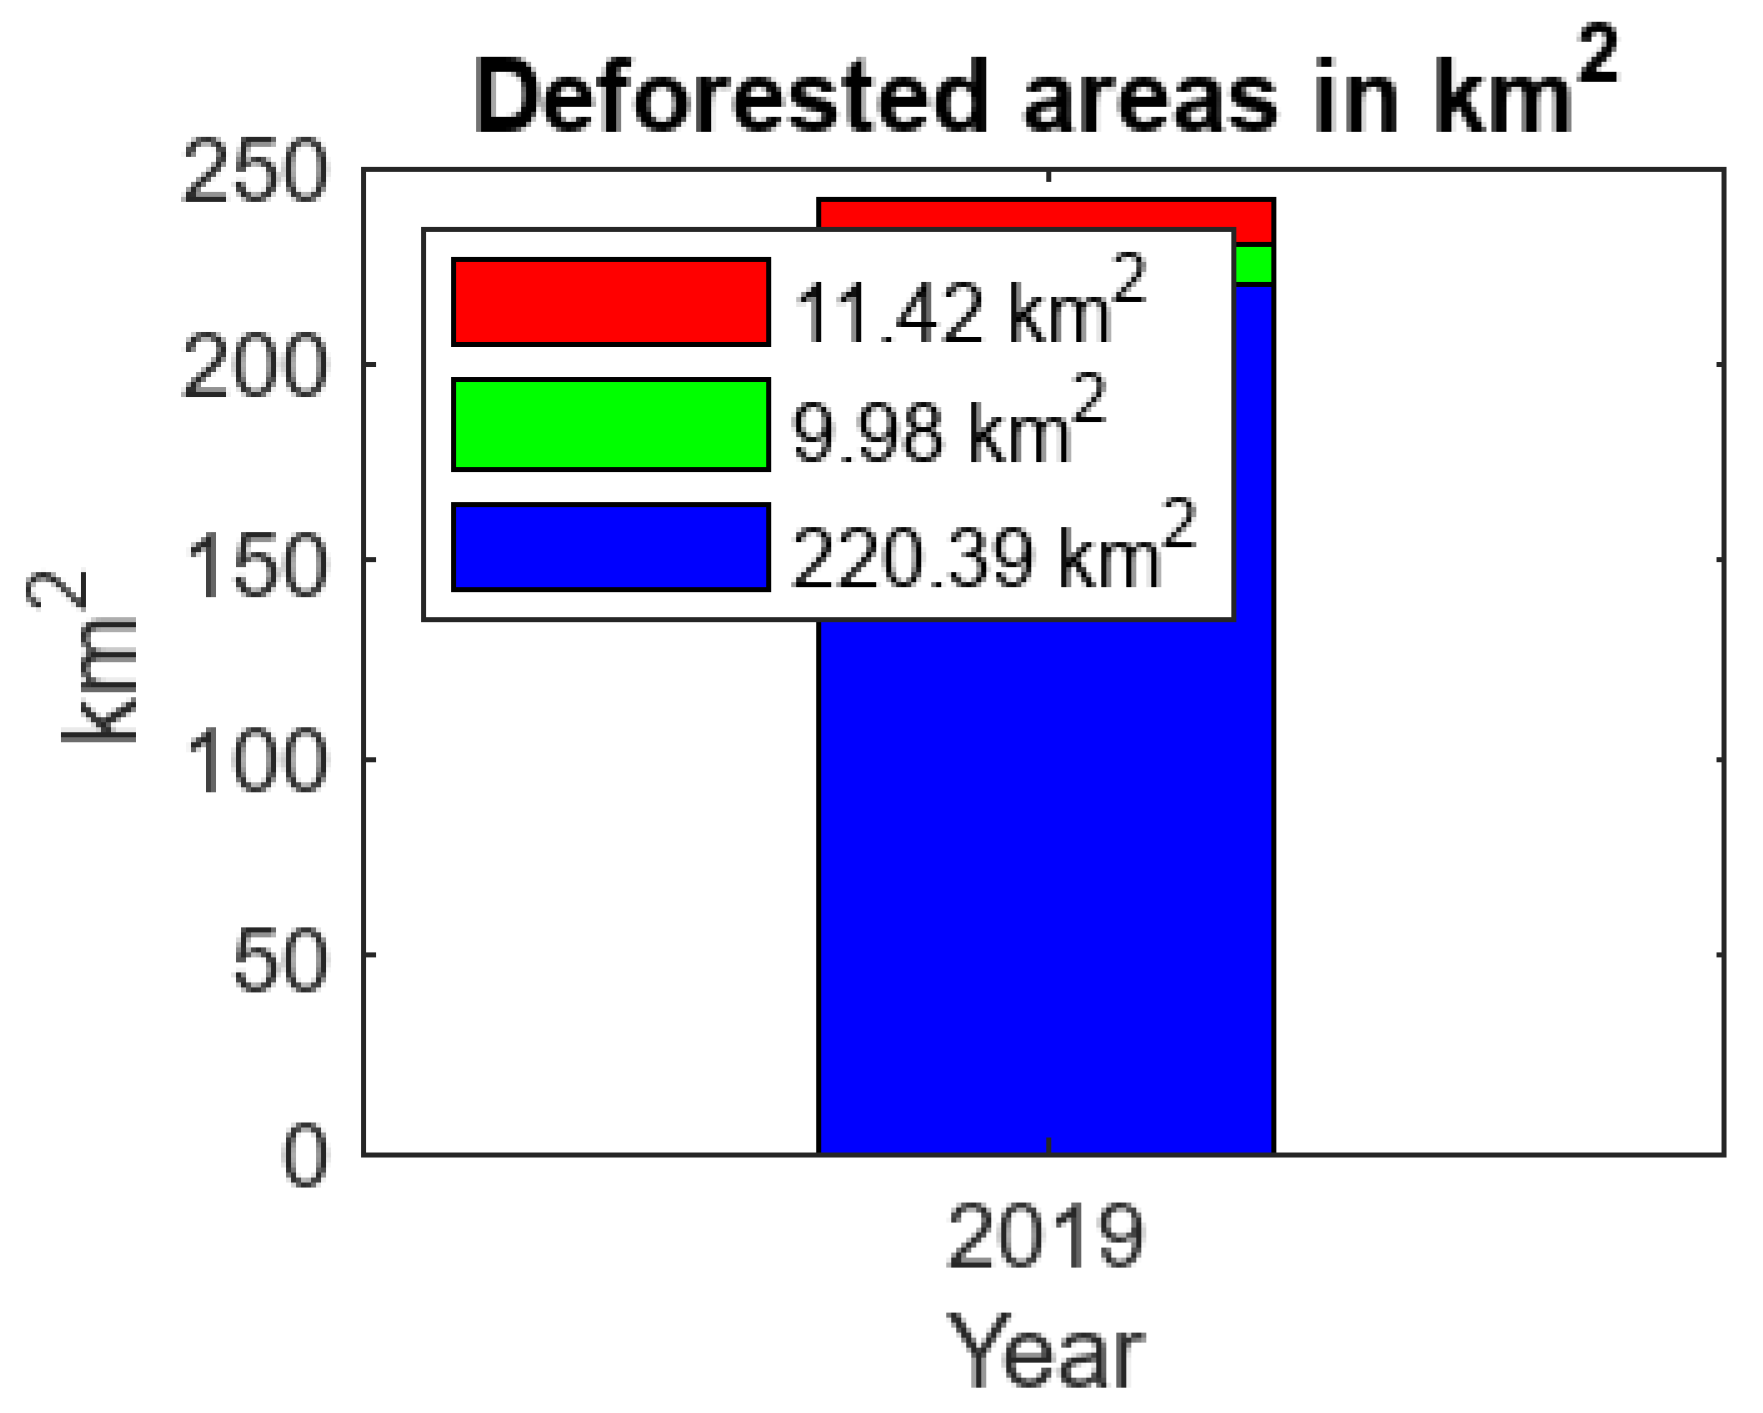
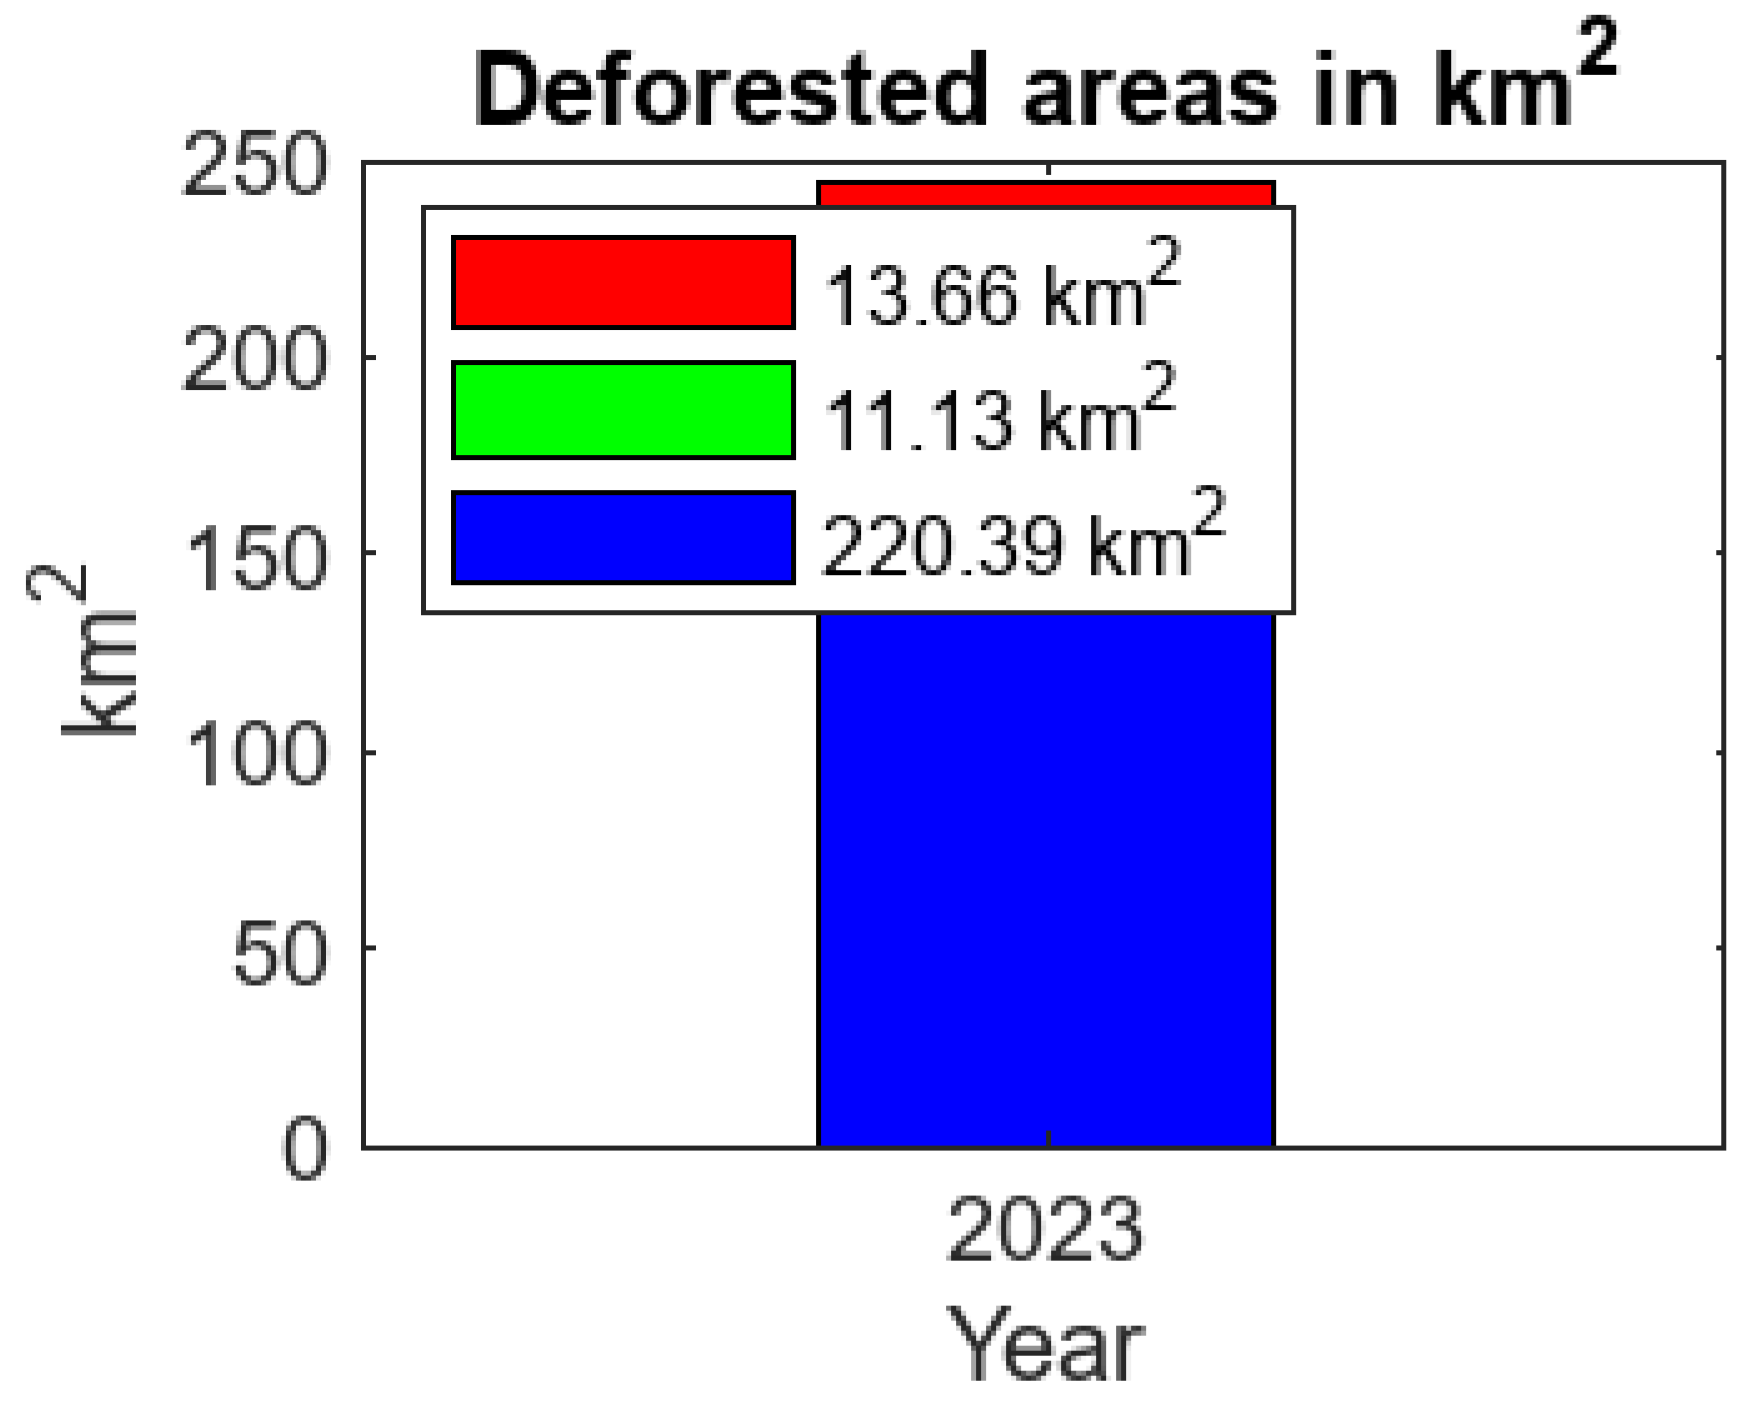
The next objective of the paper is to analyse the deforested area. As per workflow of paper, the third and final analysis is deforestation classification. For the analysis of deforestation, the proposed model SiCTT.net is applied. With the help of Band math equations (1-7) used for preparing dataset. After that dataset of 2019 and 2023 is trained and Validate by the SiCTt.net for calculating accuracy and loss see in Figure 14, Figure 15. To analyse the efficiency of proposed model, we compare the same dataset with simple CNN model see in Figure 16, Figure 17.
Preprints 139448 i002
Figure 14. SiCTT.net 2019 Accuracy and Loss.
Figure 15. SiCTT.net 2023 Accuracy and Loss.
Preprints 139448 g015
Figure 16. CNN 2019 Accuracy and Loss.
Preprints 139448 g016
Figure 17. CNN 2023 Accuracy and Loss.
Preprints 139448 g017
The proposed model efficiency shown in Table 5, the comparison of SiCTT.net with CNN with processing time included. We use 2019 and 2023 original images and band math images to train the model. Based on accuracy and loss to check the difference in proposed model and simple CNN performance. As you can see in below table 5, the efficiency and accuracy of proposed model is better than simple CNN.
The performance analysis of CNN and SiCTT.net models across different image types and years reveals notable trends. For original images in 2019, CNN achieved an accuracy of 50% with a processing time of 17 minutes 11 seconds, while SiCTT.net performed better with 60% accuracy and a slightly shorter processing time of 16 minutes 50 seconds. In 2023, the accuracy for original images improved for both models, with CNN at 57.14% and SiCTT.net at the same level, though SiCTT.net's processing time increased to 18 minutes. For band math images, CNN's accuracy improved from 57% in 2019 to 60% in 2023, with a comparable processing time, while SiCTT.net showed a more significant improvement from 71.43% to 80% but at the cost of increased processing time. This analysis indicates that while SiCTT.net consistently outperforms CNN in accuracy, it tends to require more processing time.
SiCTT.net's superior accuracy demonstrates its effectiveness in capturing and analysing the features of the images more comprehensively. The increased accuracy suggests that SiCTT.net is better suited to handle the complexities of the image data, making it a more reliable model for achieving high performance in image classification tasks, but the cost of increased computational time of SiCTT.net is bit more than CNN.
To analyse the deforestation with the help of graphs for better understanding. The graphs are divided into three sections: Original image deforestation, binary image deforestation and segmented image deforestation see in Figure 18a 2019 Deforestation area and Figure 18b 2023 Deforestation area. The blue colour represents non-deforestation, green colour represents binary image deforestation and red colour represents segmented image deforestation. The difference of deforestation and non-deforestation in 2019 and 2023 is clear.
Based on table 6, from 2019 to 2023, the total pixel area decreased slightly from 2,203,908 to 2,200,881 pixels, reflecting a reduction of 3,027 pixels. Despite this overall decrease, the number of deforested pixels increased, which means that the proportion of deforested land has grown relative to the total area. This shift highlights a trend of increasing deforestation within a slightly smaller study area, emphasizing the need to consider both the reduction in total area and the rise in deforested pixels when assessing land cover changes.
To analyse the changes between 2019 and 2023 in the binary image, we calculate the difference in pixel area for deforestation. In 2019, the binary image showed 99,751 pixels representing deforested land, while in 2023, this increased to 111,282 pixels. This results in a net increase of 11,531 pixels, indicating a significant expansion of deforested areas.
Similarly, for the segmented image, the analysis reveals a change from 114,185 pixels in 2019 to 136,608 pixels in 2023. This represents an increase of 22,423 pixels in the segmented deforested area, highlighting a notable rise in deforested land over the same period.
Table 6. Deforestation Area Analysis .
Metric Pixels (2019) Pixels (2023) Area (2019) km² Area (2023) km²
Total area Pixels 2,203,908 2,200,881 220.39 km² 220.09 km²
Binary area Pixels 99,751 111,282 9.98 km² 11.13 km²
Segmented area Pixels 114,185 136,608 11.42 km² 13.66 km²

4. Discussion:

Satellite images are widely used in applications such as land use and land cover (LULC) analysis, weather or environmental monitoring, and change detection. However, because these images are captured from long distances via sensors, they often lack clarity, which presents significant challenges during image processing. Based on a review of the literature, three key problems have been identified: Optical satellites provide clearer images compared to other types, but the presence of mixed pixels makes it difficult to accurately identify objects. A machine learning-based approach, specifically using unsupervised techniques, can be proposed to tackle the mixed pixel problem in optical satellite images. Unsupervised methods, such as fuzzy clustering, are particularly suited to address the mixed pixel issue, as these pixels often belong to multiple classes and are unlabelled. In this context, unsupervised techniques offer more effective solutions than supervised methods, which rely on predefined labels.
Optical Satellite play an important role in earth observation. It gives detailed information to monitor the vegetation, climate, deforestation, burned area, water bodies, weather monitoring etc. With the help of optical satellite, we can predict change detection for Land use Land cover applications. But optical satellite is not good enough to penetrate clouds and not suitable for all types of weather. Due to atmospheric effects and topography effects create problem called mixed pixel.
Mixed pixel problem means one pixel belongs to multiple classes which creates problem to identify the object and reduce accuracy. To increase the efficiency of optical satellite, need to identify and detect mixed pixel problem using band math and morphological segmentation. With the help of band math, researcher creates multiple bands like add, sub, mul, div and NDVI. For analysing mixed pixel NDVI image used for applying morphological dilation and erosion for better understanding of pure pixels and mixed pixels. Using clustering, easily create clusters of different types of pixels.
The proposed model gives better results compared to simple convolutional neural network. The main motive of using transpose transformation deep neural network is self-spatial dimension up sampling of better accuracy compared to CNN and SiCTT.net is suitable for both backpropagations as well. As researcher mentioned that optical satellite is good for detailed monitoring of earth but only in daytime due to active mode sensor, for night time monitoring need to use SAR satellite due to passive mode and SAR is good for penetrating clouds and suitable for all kind of weathers as well, that’s why researcher choose sentinel-2 dataset for analysing mixed pixel problem and researcher already analysed the sentinel-1 SAR satellite to resolve speckle noise[39]. In future, researcher planning to apply image fusion of sentinel-1 and sentinel-2 image for better analysis in both day and nighttime. [40]

5. Conclusions

Deforestation analysis is an important for ecological LULC development. The optical satellite gives good visualization in daytime but due mixed pixel problem bit hard to recognize the image. This paper focus on how to handle mixed pixel problem of optical satellite and then analyse the deforestation using proposed model. The proposed model gives better results using band math for deforestation analysis compared to simple CNN method. For preparing the dataset multiple bands are used using band math. For identifying the mixed pixel problem, differentiate between mixed pixel and pure pixel by applying OSTU thresholding with morphological operation combination including clustering to analyse pixels more accurately and gives better visualization. With the help of binary image and segmentation analysis gives better understanding of calculating deforested area analysis. For better monitoring the accurate deforestation, you can see the difference between binary image area, original image area and segmented image area. In Future, researcher can use harmonized Landsat 8 and Sentinel 2 to create large dataset and apply Fuzzy clustering for self-analysis of mixed pixel. Overall, the efficiency and accuracy of proposed methodologies of this paper is better than simple CNN.

Acknowledgments:

We appreciate the help and direction provided by GLA University for their support and giving me the chance to finish one more phase of my PhD.

Data Availability

The data supporting this study will be provided by the corresponding author upon reasonable request.

Conflicts of Interest

The authors declare that they have no conflict of interest.

References

  1. [1] Avtar, R., Tripathi, S., Aggarwal, A. K., & Kumar, P. (2019). Population–urbanization–energy nexus: a review. Resources, 8(3), 136. [CrossRef]
  2. [2] Chamling, M., & Bera, B. (2020). Spatio-temporal patterns of land use/land cover change in the Bhutan–Bengal foothill region between 1987 and 2019: study towards geospatial applications and policy making. Earth Systems and Environment, 4(1), 117-130. [CrossRef]
  3. [3] Waleed, M., & Sajjad, M. (2022). Leveraging cloud-based computing and spatial modeling approaches for land surface temperature disparities in response to land cover change: evidence from Pakistan. Remote Sensing Applications:. [CrossRef]
  4. Society and Environment, 25, 100665.
  5. [4] Trujillo-Jiménez, M. A., Liberoff, A. L., Pessacg, N., Pacheco, C., Díaz, L., & Flaherty, S. (2022). SatRed: New classification land use/land cover model based on multi-spectral satellite images and neural networks applied to a semiarid valley of Patagonia. Remote Sensing Applications: Society and Environment, 26, 100703. [CrossRef]
  6. [5] Atay Kaya, İ., & Kut Görgün, E. (2020). Land use and land cover change monitoring in Bandırma (Turkey) using remote sensing and geographic information systems. Environmental Monitoring and Assessment, 192(7), 430. [CrossRef]
  7. [6] Roy, P. S., Ramachandran, R. M., Paul, O., Thakur, P. K., Ravan, S., Behera, M. D., ... & Kanawade, V. P. (2022). Anthropogenic land use and land cover changes—A review on its environmental consequences and climate change. Journal of the Indian Society of Remote Sensing, 50(8), 1615-1640. [CrossRef]
  8. 7] Baig, M. F., Mustafa, M. R. U., Baig, I., Takaijudin, H. B., & Zeshan, M. T. (2022). Assessment of land use land cover changes and future predictions using CA-ANN simulation for selangor, Malaysia. Water, 14(3), 402. [CrossRef]
  9. [8] Gaur, S., & Singh, R. (2023). A comprehensive review on land use/land cover (LULC) change modeling for urban development: current status and future prospects. Sustainability, 15(2), 903. [CrossRef]
  10. Griffiths, P., Jakimow, B., & Hostert, P. (2018). Reconstructing long term annual deforestation dynamics in Pará and Mato Grosso using the Landsat archive. Remote sensing of environment, 216, 497-513. [CrossRef]
  11. Nepstad, D., Soares-Filho, B. S., Merry, F., Lima, A., Moutinho, P., Carter, J., ... & Stella, O. (2009). The end of deforestation in the Brazilian Amazon. Science, 326(5958), 1350-1351. 1350. [CrossRef]
  12. Griffiths, P., Jakimow, B., & Hostert, P. (2018). Reconstructing long term annual deforestation dynamics in Pará and Mato Grosso using the Landsat archive. Remote sensing of environment, 216, 497-513. [CrossRef]
  13. https://www.globalforestwatch.org/Sentinel 2 MSI-.
  14. European Space Agency. Sentinel-2: Resolution and Swath, 2020. Available online: https:// sentinel.esa.int/web/sentinel/missions/sentinel-2/instrument-payload/resolution-and-swath (accessed on 18 August 2020).
  15. Darbari, P., & Kumar, M. (2022, May). Satellite Image Enhancement Techniques: A Comprehensive Review.
  16. In Proceedings of International Conference on Communication and Artificial Intelligence: ICCAI 2021 (pp. 431-447). Singapore: Springer Nature Singapore.
  17. Roy, D.P.; Li, J.; Zhang, H.K.; Yan, L.; Huang, H.; Li, Z. Examination of Sentinel-2A multi-spectral instrument (MSI) reflectance anisotropy and the suitability of a general method to normalize MSI reflectance to nadir BRDF adjusted reflectance. Remote Sens. Environ. 2017, 199, 25–38. [Google Scholar] [CrossRef]
  18. Sánchez-Espinosa, A.; Schröder, C. Land use and land cover mapping in wetlands one step closer to the ground: Sentinel-2 versus Landsat 8. J. Environ. Manag. 2019, 247, 484–498. [Google Scholar] [CrossRef]
  19. Petrou, M. (1999). Mixed pixel classification: an overview. Information Processing for Remote Sensing, 69-83.Kaur, S. & Bansal, R.K.. (2017). Novel approach for mixed pixel extraction from remote sensing images. International Journal of Applied Engineering Research. 12. 12860-12871.
  20. Pandey, A. C., Kumari, N., Ahmad, S., Kumar, A., Saikia, P., Parida, B., ... & Lele, N. (2023). Evaluating biochemical and biophysical characteristics of tropical deciduous forests of eastern India using remote sensing and in-situ parameter estimation. Remote Sensing Applications: Society and Environment, 29, 100909. [CrossRef]
  21. Kaur, S. & Bansal, R.K.. (2017). Novel approach for mixed pixel extraction from remote sensing images. International Journal of Applied Engineering Research. 12. 12860-12871.
  22. Chen, X., Wang, D., Chen, J., Wang, C., & Shen, M. (2018). The mixed pixel effect in land surface phenology: A simulation study. Remote Sensing of Environment, 211, 338-344. [CrossRef]
  23. Kaur, S., Bansal, R.K., Mittal, M. et al. Mixed Pixel Decomposition Based on Extended Fuzzy Clustering for Single Spectral Value Remote Sensing Images. J Indian Soc Remote Sens 47, 427–437 (2019). [CrossRef]
  24. Sherwani, A.R., Ali, Q.M. Parametric Classification using Fuzzy Approach for Handling the Problem of Mixed Pixels in Ground Truth Data for a Satellite Image. Ann. Data. Sci. (2022). [CrossRef]
  25. A.R. Sherwani, Q.M. Ali, Irfan Ali, A modified fuzzy clustering approach in unsupervised classification for detecting the mixed pixels of satellite images, J. Math. Comput. Sci., 12 (2022), Article ID 97. [CrossRef]
  26. Nghiyalwa, H. S., Urban, M., Baade, J., Smit, I. P., Ramoelo, A., Mogonong, B., & Schmullius, C. (2021). Spatiotemporal mixed pixel analysis of savanna ecosystems: a review. Remote Sensing, 13(19), 3870. [CrossRef]
  27. Mantripragada, K., & Qureshi, F. Z. (2024). Hyperspectral pixel unmixing with latent dirichlet variational autoencoder. IEEE Transactions on Geoscience and Remote Sensing. [CrossRef]
  28. Kodl, G., Streeter, R., Cutler, N., & Bolch, T. (2024). Arctic tundra shrubification can obscure increasing levels of soil erosion in NDVI assessments of land cover derived from satellite imagery. Remote Sensing of Environment, 301, 113935. [CrossRef]
  29. Pu, J., Yan, K., Roy, S., Zhu, Z., Rautiainen, M., Knyazikhin, Y., & Myneni, R. B. (2023). Sensor-independent LAI/FPAR CDR: reconstructing a global sensor-independent climate data record of MODIS and VIIRS LAI/FPAR from 2000 to 2022. Earth System Science Data Discussions, 2023, 1-29.
  30. Zheng, L., Zhu, J., Shi, J., & Weng, S. (2024). Efficient mixed transformer for single image superresolution. Engineering Applications of Artificial Intelligence, 133, 108035. [CrossRef]
  31. Meerdink, S., Hiatt, D., Flory, S. L., & Zare, A. (2024). Dealing with imperfect data for invasive species detection using multispectral imagery. Ecological informatics, 79, 102432. [CrossRef]
  32. Jiang, L., Zhou, C., & Li, X. (2023). Sub-pixel surface water mapping for heterogeneous areas from Sentinel-2 images: A case study in the Jinshui Basin, China. Water, 15(8), 1446. [CrossRef]
  33. Nagaraj, R., Kumar, L.S. Extraction of Surface Water Bodies using Optical Remote Sensing Images: A.
  34. Review. Earth Sci Inform 17, 893–956 (2024). [CrossRef]
  35. J. Guo and S. Du, "Generating Fuzzy Membership Functions for Modeling Wetland Ecosystems From Multispectral Remote Sensing Images," in IEEE Journal of Selected Topics in Applied Earth Observations and Remote Sensing, vol. 17, pp. 7640-7654, 2024. [CrossRef]
  36. Jessica Ertel, Liz Goldman, Justine Spore and John Brandt, (June 6,.
  37. 2023)https://www.globalforestwatch.org/blog/data-and-research/tree-cover-data-comparison/.
  38. 38. Deanna Ramsay 12 Jan 2021https://forestsnews.cifor.org/70481/how-one-brazilian-state-is-tackling-deforestationwithin-its-borders?fnl=.
  39. 39. [35]WRM Bulletin 266 22 July 2023https://www.wrm.org.uy/bulletin-articles/redd-and-the-green-economy-exacerbateoppression-and-deforestation-in-para-brazil.
  40. [36] Phiri, D., Simwanda, M., Salekin, S., Nyirenda, V. R., Murayama, Y., & Ranagalage, M. (2020). Sentinel-2 data for land cover/use mapping: A review. Remote Sensing, 12(14), 2291.
  41. [37]Gurjar, S.B., Padmanabhan, N. Study of various resampling techniques for high-resolution remote sensing imagery. J .
  42. Indian Soc Remote Sens 33, 113–120 (2005). [CrossRef]
  43. [38]https://custom-scripts.sentinel-hub.com/custom-scripts/sentinel-2/bands/.
  44. [39] Darbari, P., Kumar, M., & Agarwal, A. (2024). SIT. net: SAR Deforestation Classification of Amazon Forest for Land Use Land Cover Application. Journal of Computer and Communications, 12(3), 68-83. https://doi.org/10.4236/jcc.2024.123005. [CrossRef]
  45. [40] Darbari, P., Kumar, M., & Agarwal, A. (2024). Satellite Image E[36nhancement Optical and Sar Image Fusion for Lulc Application: Comprehensive Review for State of Art. TuijinJishu/Journal of Propulsion TechnologyISSN: 10014055Vol. 45 No.1.
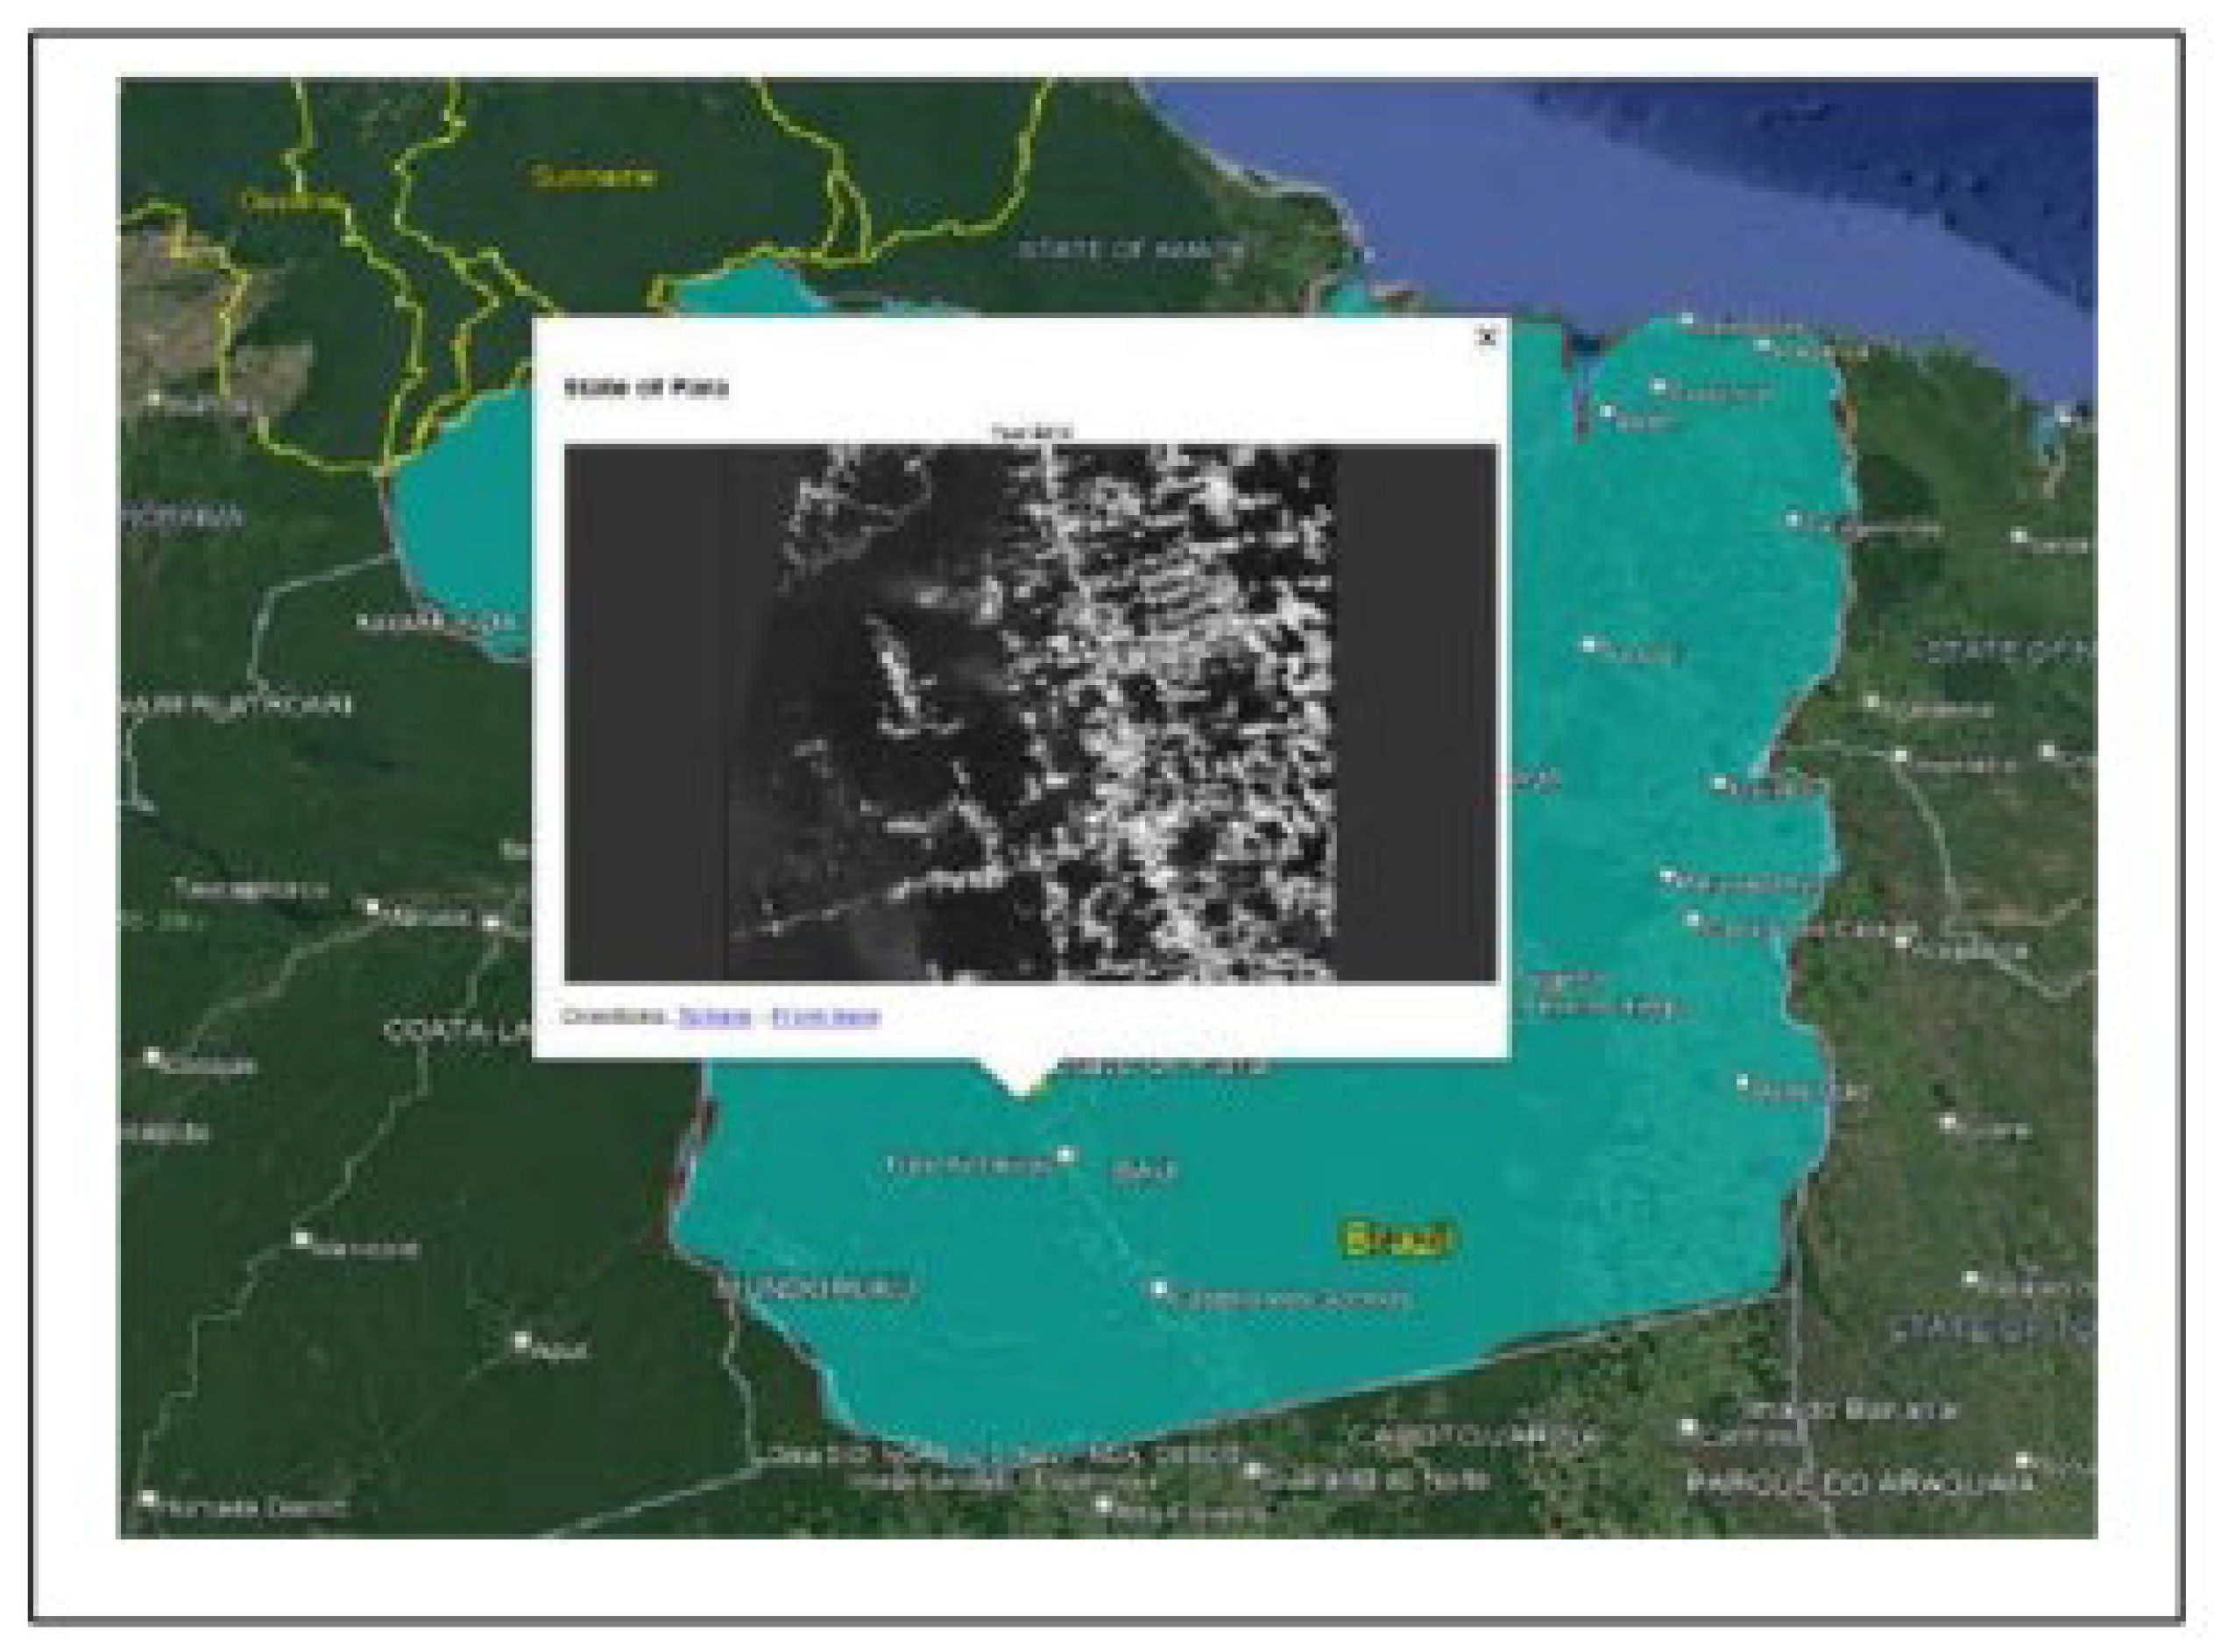
Figure 1. Structure of paper.
Preprints 139448 g001
Figure 2. Geographical View of Dataset.
Preprints 139448 g002
Figure 3. Workflow of Proposed Methodology.
Preprints 139448 g003
Figure 4. Study area view for Mixed pixel problem.
Preprints 139448 g004
Figure 6. Mixed Pixel Analysis Steps.
Preprints 139448 g006
Figure 7. 2019 Histogram
Preprints 139448 g007
Figure 8. 2023 Histogram.
Preprints 139448 g008
Figure 14. Study area Fuzzy C-mean clustering analysis.
Preprints 139448 g014
Figure 18. a: Deforested Area 2019.
Preprints 139448 g018
Figure 19. b: Deforested Area 2023.
Preprints 139448 g019
Table 2. Dataset Description.
Year Product Tile ID DOA Type Band
2019 S2B MSI T21MXN 30-08 L2A RGB, NIR, SWIR
2023 S2B MSI T21MXN 19-08 L2A RGB, NIR, SWIR
Table 3. SiCTT.net description.
Layers (L) SIT.net model Description
Name Description
L1 Image Input Layer Original Image sizes 695x1065x3(RGB) Processed image size 277x277x3(RGB)
L2 Transposed CNN Up sampling of picture features is done using filters with a size of 3x3, several filters, bias, and Strides-1 to preserve the exact image information to the end of the output images without any loss.
L3 Max pooling Procedure that creates a down sampled (using filter size 2x2) to extract feature map by calculating the maximum value for each patch.
L4 Dropout Layer Determines the likelihood (P-0.5) of removing nodes to avoid overfitting.
L5 Batch
Normalization Layer
To create a quick and reliable analysis between layers, define the mean and variance scale.
L6 Flatten Layer Enhances the neural network's ability to recognize more intricate patterns and improves prediction.
L7 Gru Layer Specifies the number of hidden units (sequence of 128) and the activation function to examine the dependence between various time series data.
L8 Fully Connected Layer To give flexibility, define the output size by connecting each neuron in one layer to the next.
L9 SoftMax layer Facilitates the conversion of the vector number scale into the vector probability scale for forecasting.
L10 Pixel
Classification Layer
To analyse computer loss and accuracy, use the probability of the layer above.
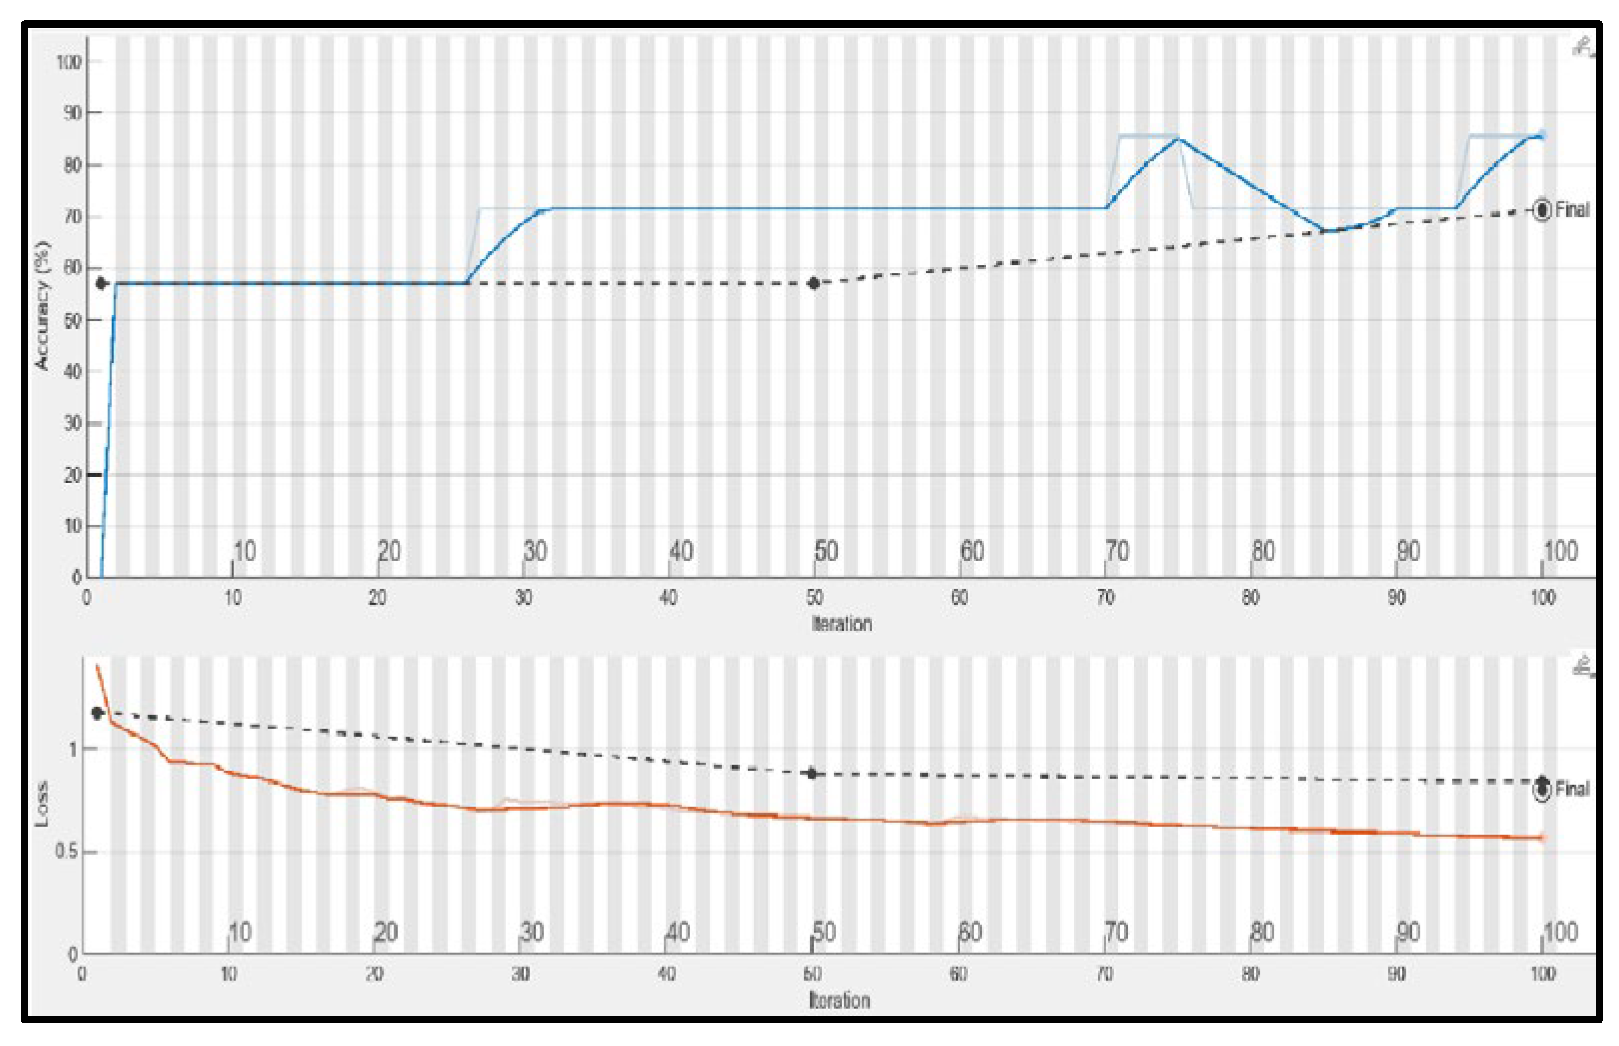
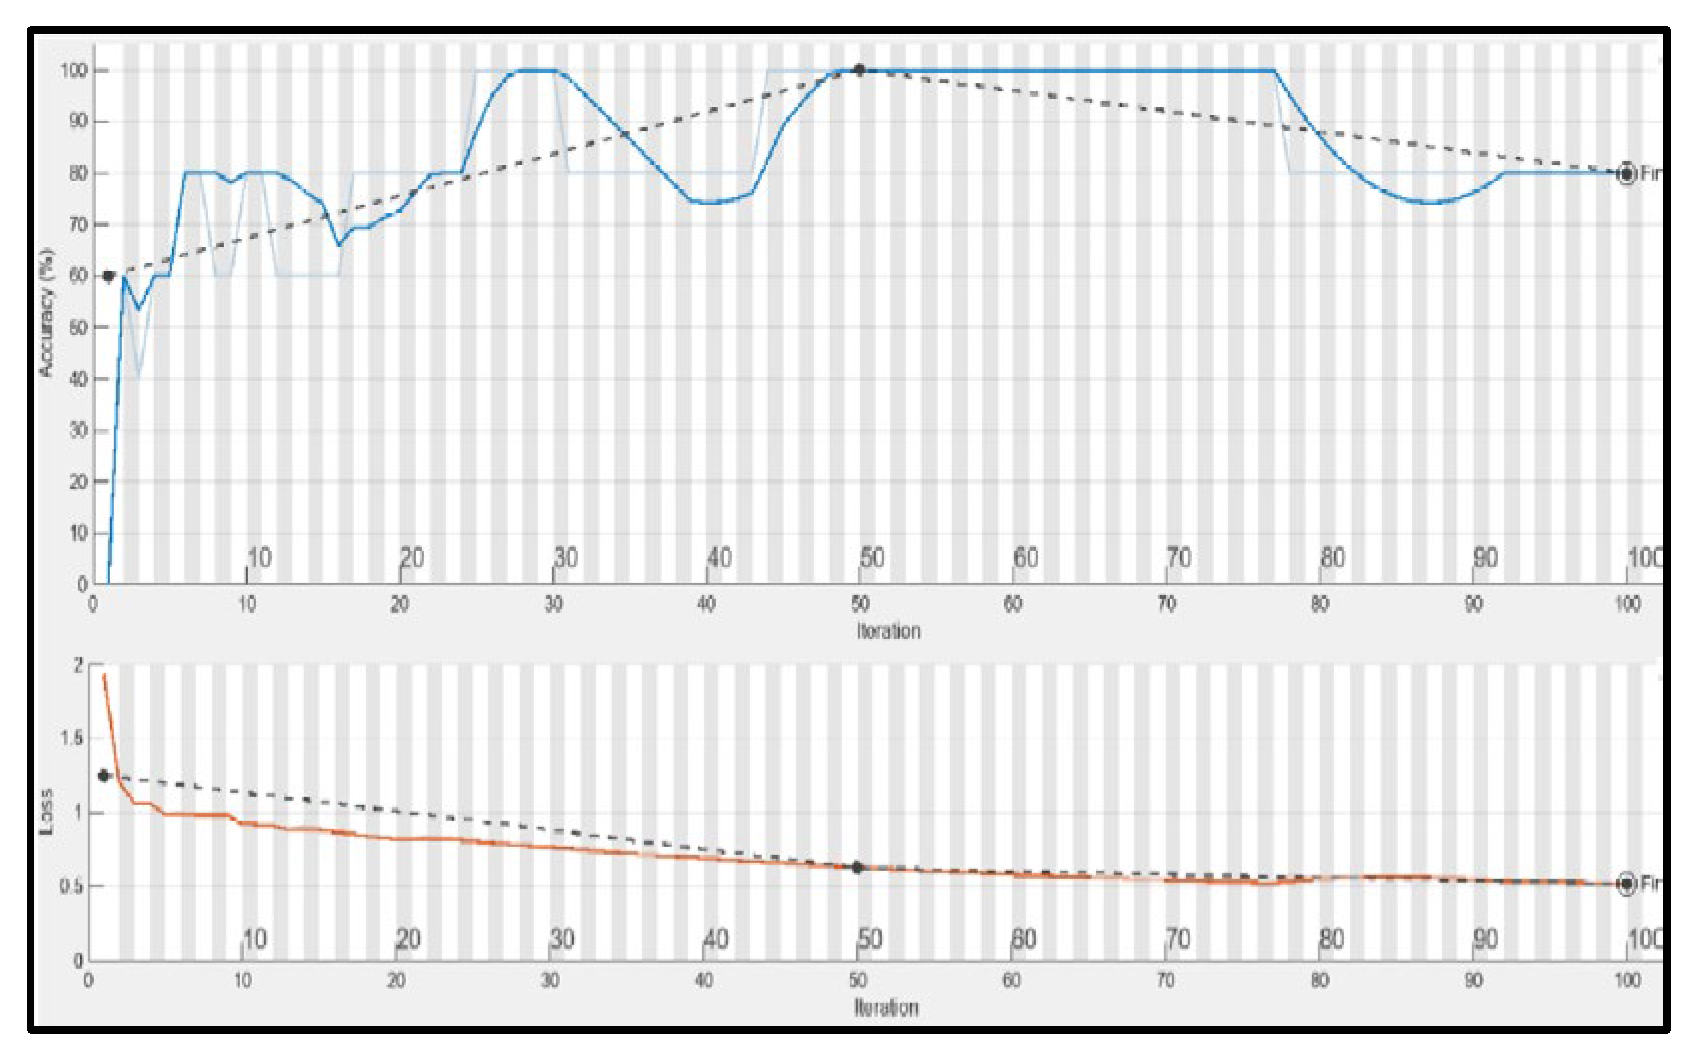
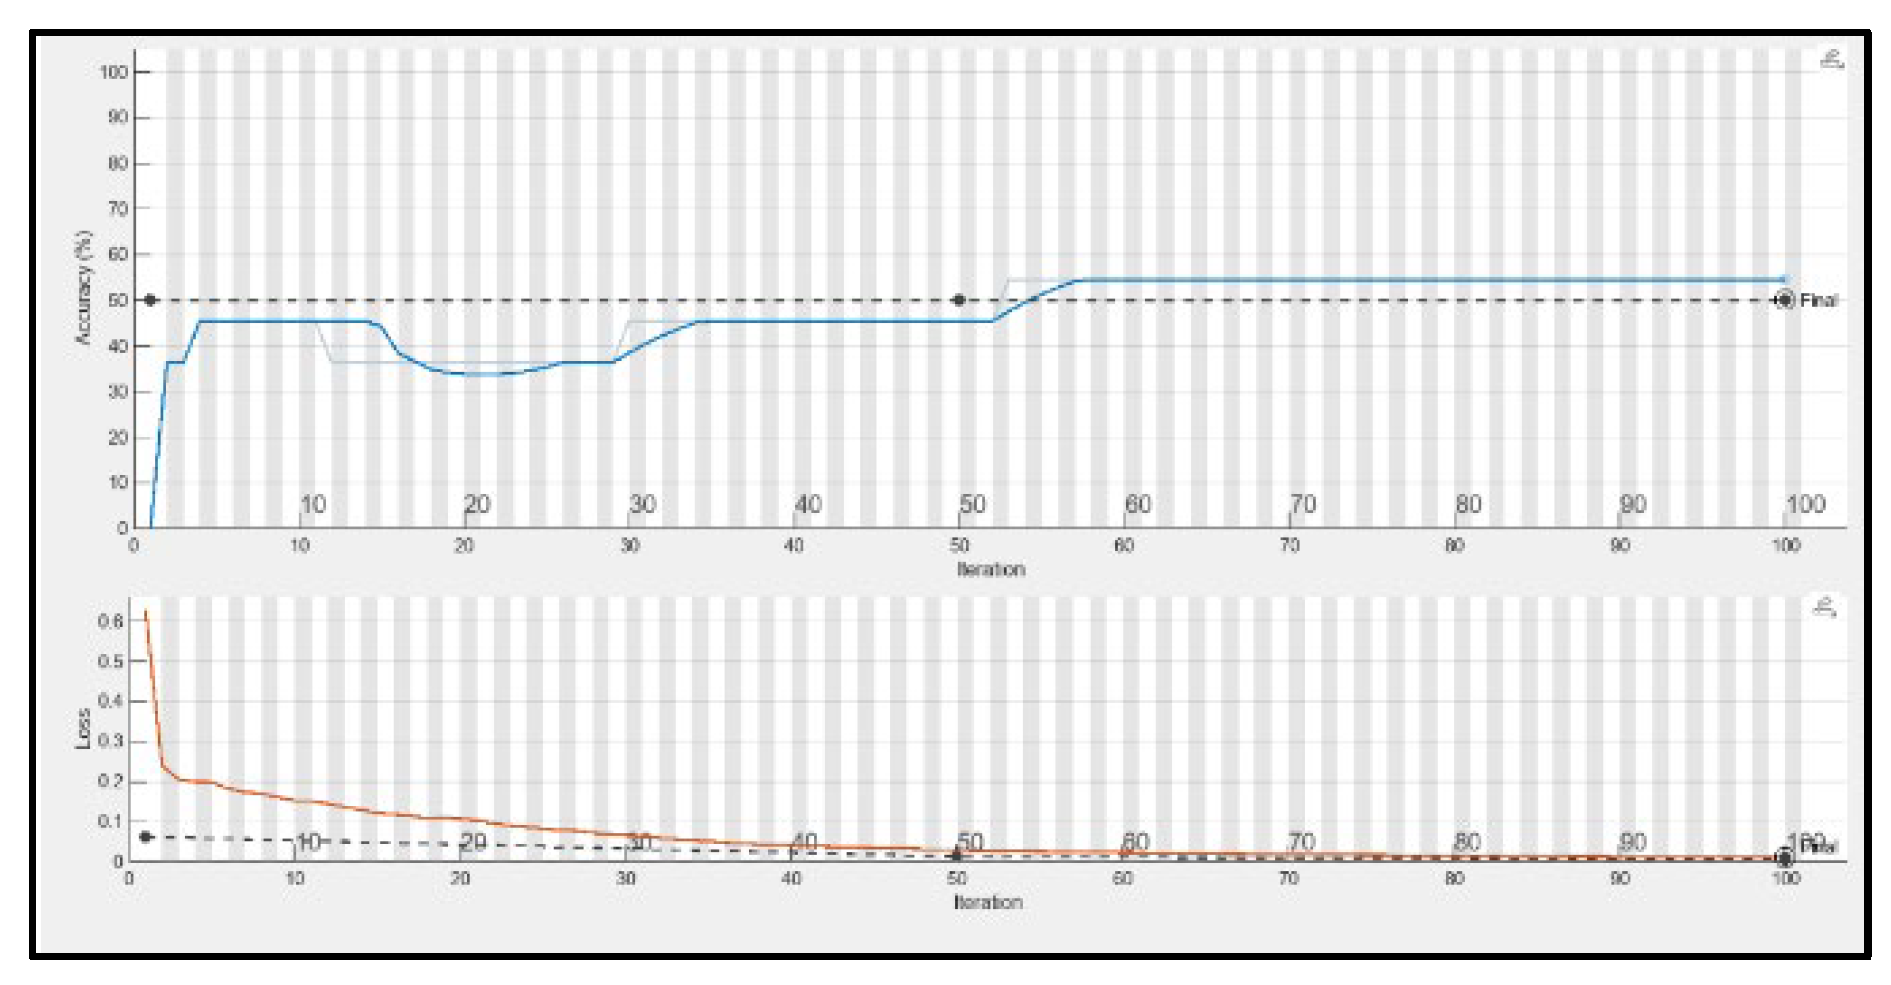
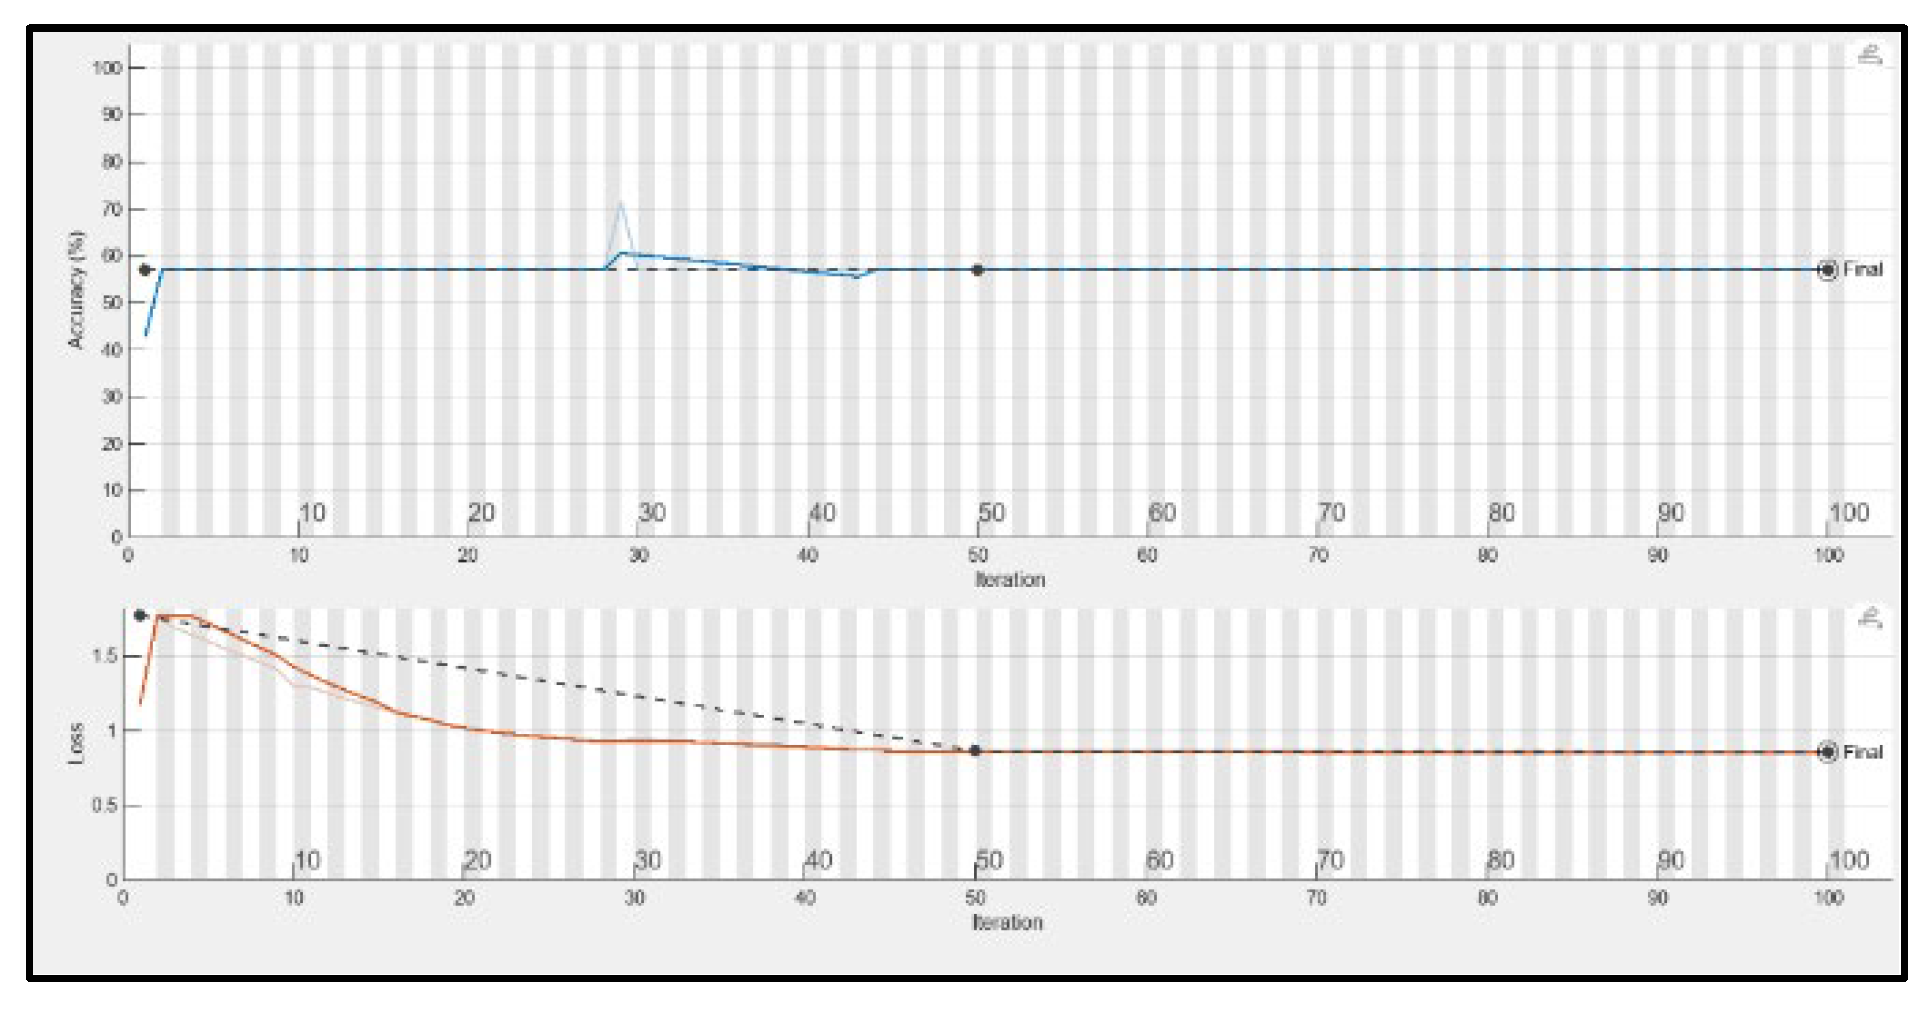
Table 4. Pre-processed Band-Math Analysis.
Preprints 139448 i001
Table 5. Performance Analysis.
Year Types of images Performance analysis No. of Images Epochs CNN Processing Time SiCTT.net Processing time
2019 Original Images Accuracy 15 100 50% 17 minutes 11 seconds 60% 16 minutes 50 seconds
Loss 100 0.35 1.2
2023 Accuracy 15 100 57.14% 17 minutes 8 seconds 57.14% 18 minutes
Loss 100 1.0 1.0
2019 Band Math Images Accuracy 15 100 57% 16 minutes 45 seconds 71.43% 17 minutes 12 seconds
Loss 100 0.50 0.50
2023 Accuracy 15 100 60% 16 minutes 47 seconds 80% 17 minutes 32 seconds
Loss 100 1.2 0.5
Disclaimer/Publisher’s Note: The statements, opinions and data contained in all publications are solely those of the individual author(s) and contributor(s) and not of MDPI and/or the editor(s). MDPI and/or the editor(s) disclaim responsibility for any injury to people or property resulting from any ideas, methods, instructions or products referred to in the content.
Copyright: This open access article is published under a Creative Commons CC BY 4.0 license, which permit the free download, distribution, and reuse, provided that the author and preprint are cited in any reuse.
Prerpints.org logo

Preprints.org is a free preprint server supported by MDPI in Basel, Switzerland.

Subscribe

Disclaimer

Terms of Use

Privacy Policy

Privacy Settings

© 2025 MDPI (Basel, Switzerland) unless otherwise stated