
Submitted:
06 November 2024
Posted:
07 November 2024
You are already at the latest version
Abstract
Biodiversity, as an important component of ecosystems, faces unprecedented decline due to factors such as habitat loss. Many ecosystem services depend on biodiversity and influence crop yield and quality. In viticulture, the importance of groundcover management, as cover crops or spontaneous grassing, is particularly important for the conservation of biodiversity and consequently, the preservation of ecosystem services. The integration of remote sensing technologies and artificial intelligence in this context remains limited, especially concerning groundcover classification in viticulture. In response to this challenge, our research focuses on developing a methodology for the identification and classification of groundcovers within vineyards inter-row. Employing an Unmanned Aerial Vehicle, equipped with RGB cameras, and advanced deep learning models, we categorize groundcovers into nine classes of which seven distinct cover crop communities groups. Our study aims to establish a method for identifying vineyard inter-row groundcover, with the ultimate goal of creating a comprehensive groundcover map. The results demonstrate that using the UNet model with backbone architectures significantly enhances classification performance. Specifically, the model with an EfficientNetB0 backbone achieved an accuracy of 85.4%, a mean IoU of 59.8%, and a Jaccard score of 73.0%. This study validates the capabilities remote sensing and deep learning technologies in supporting the monitoring of biodiversity in vineyards, laying the groundwork for future researches to allow the model to monitor larger surface with time and cost advantages and expanding the dataset to encompass a broader range of vineyard types, soil conditions, and geographic.
Keywords:
Cover crop communities
; Vineyard biodiversity
; Ecosystem services
; Deep learning
; Unmanned Aerial Vehicle
1. Introduction
First introduced in the late 1980s, “biodiversity” encompasses the diversity of ecosystems, species, and genes in space and time, as well as the interactions among these organizational levels [1,2]. The different levels (genes, species, ecosystems) and dimensions (elements, structures, and processes) of biodiversity directly and indirectly contribute to ecosystem services. Ecosystem services referrer to the value (monetary or otherwise) of ecosystems; they provide, humanity with goods and services for well-being and contribute to agricultural development [3], Contrasting with the loss of habit and biodiversity caused by agricultural intensification [4,5]. In viticulture, the loss of biodiversity can lead to a decrease in both the quality and quantity of grape production [6]. In this context, the viticultural sector should implement vineyard management strategies aimed at conserving biodiversity and promoting sustainable agricultural practices. Some viticultural practices, such as presence of spontaneous vegetation or cover crops between vine rows can increase populations of beneficial insects [7] and provide ecosystem services, including reduced soil erosion, leaching of pesticides, and improved soil structure and biological activity [8,9]. Cover crops can be either sown or spontaneous: according to Vandermeer and Perfecto’s definition, sown crops contribute to planned biodiversity as they are directly introduced by the farmer, while both types support associated biodiversity [10].
Remote sensing, using both unmanned aerial vehicles (UAVs) and satellite sensors, is increasingly prevalent in ecological studies. Its applications range widely, encompassing biodiversity monitoring, assessment of biodiversity-related properties, and employing diverse data, methods, and study areas [11]. Remote sensing also contributes to the quantification and mapping of ecosystem services [12,13], commonly involving the classification of herbaceous plants using RGB [14] and hyperspectral imagery [15,16]. Machine learning (ML), a subset of artificial intelligence (AI), employs algorithms to learn from data and create predictive models [17]. Deep learning (DL), a specialized type of ML, excels at extracting complex features from large datasets through multiple layers of processing [18]. Recent advances in DL, such as those demonstrated by Zhang et al. (2016), show considerable promise for classifying and segmenting landscape features from remote sensing data.
Viticulture increasingly utilizes remote sensing (e.g., UAVs, and satellites such as Sentinel-2 [19]) and AI for vineyard monitoring. These technologies aid in assessing vine health by detecting canopy variations [20] and identifying diseases like Esca [21,22] and flavescence dorée [23]. Applications also include monitoring vine vigor, yield [24], and soil electrical conductivity [25] or soil electrical conductivity [26]. However, the application of remote sensing and AI to characterize ground cover biodiversity in vineyards remains relatively unexplored.
The U-Net [27] is a DL architecture designed for pixel-wise image segmentation. This study employs U-Net for semantic segmentation of UAV RGB imagery. U-Net’s symmetrical encoder-decoder structure, incorporating skip connections, preserves spatial information, enabling the capure of both local and global features, ideal for object detection and boundary delineation. When implementing DL semantic segmentation models, two approaches could be taken, using or not a backbone architecture. The use of a backbone architecture leverage pretrained networks derived from established architectures. The aim of this paper is to develop a DL model that would categorize the pixels into nine classes: vine, soil, and seven cover crop communities. This classification provides a tool for mapping cover crops communities composition of vineyard laying the groundwork for future studies on how cover crops may contribute to the ecological balance and sustainability of vineyard ecosystems through ecosystem services provision. With this aim the discrimination among the main cover crop communities is crucial due to the differing phenology and morphology and different contributions to ecosystem services with which these groups are associated. Future researches are needed to encompass a broader range of vineyard types, soil conditions, and geographic locations and to replicate the use of the DL model on images with a much lower resolution, allowing a considerable reduction of costs and time of imaging acquisition by UAV.
2. Materials and Methods
2.1. Study Site
This study was conducted in a 2-hectare vineyard belonging to Azienda Agricola Ricci Curbastro in Capriolo, Brescia, Italy (Figure 1). The vineyard is situated in the Franciacorta wine region, known for its high-quality sparkling wine, scenic landscapes, and rich history.
2.2. Cover Crop Communities Classification
In this study, in addition to classifying the land cover of vine and soil, we distinguished seven cover crop communities: graminoids, legumes (Fabaceae), mustards (Brassicaceae), composites (Asteraceae), Polygonaceae, Plantaginaceae, and other forbs. These cover crop communities are distinguished by their phenological and morphological differences and play a crucial role in providing various ecosystem services due to their distinct characteristics. Graminoids [27] are represented by Poaceae (grasses in the strict sense), Cyperaceae (sedges), and Juncaceae (rushes), but, are mainly characterized by narrow leaves and fasciculate root systems play an important role in combating soil erosion and weed competition [28]. Legumes (Fabaceae) are widely recognized for the numerous important functions they provide, including nitrogen fixation and the enhancement of soil health and biological fertility [29,30]. The existing literature highlights the biofumigant effects of mustards (Brassicaceae), which demonstrate the suppression of soil-borne pathogens in vineyards and nurseries [31]. Composites (Asteraceae) play an important ecological role by supporting natural enemies [32]. Among the Polygonaceae, one of the main species is buckwheat, which can suppress weeds due to its rapid growth and allelopathic effects, while also hosting many arthropods that contribute to pest control [33]. Mixtures of cover crops containing Plantaginaceae show significant suppression of weeds [34]. Generally, forbs, with their tap root systems, contribute to soil structure improvement and, compared to graminoids, also differ in terms of impact on the dynamics of organic carbon in the soil [35].
2.3. Image Acquisition
A flight was conducted on September 21, 2023, using an M300 RTK UAV with a flight autonomy of up to 55 minutes. The drone was autonomously operated using Litchi software (version 4.25.0, released July 4, 2022, by VC Technology Ltd., London), which enabled a comprehensive photogrammetry mission. Flight parameters, including an 8-meter altitude above ground level, four ground control points (GCPs) with precise coordinates, and image resolution, were configured to ensure complete coverage of the study area. A total of 24 images were acquired.
2.4. Data Preprocessing for Cover Groups Segmentation
The study utilized 24 RGB images (8192 x 5460 pixels), each representing 40 square meters, for a total analyzed area of 960 square meters. While DL offers advantages over traditional ML for plant species mapping by handling complex data, the large image size presents computational challenges. To address this, the images underwent preprocessing (Figure 2) as follows:
- A plant expert manually annotated masks for each training image using Roboflow software.
- The high-resolution images and their corresponding masks were partitioned into 256 x 256-pixel patches for training a U-Net segmentation model. This facilitated efficient image segmentation and feature identification. The trained model was then saved.
- The saved model was used for the prediction and mapping of the full-size images.
Different types of ground cover (cover crops, vines, and soil) were manually labeled by an experienced botanist with in-depth knowledge of vineyard ecosystems. The expert classified each polygon in the mask image, which had dimensions of 8192 x 5460 pixels, assigning labels for the established reference categories when at least 60% of the category was recognized based on vegetative morphological characteristics [36]. Subsequently, the image was divided into patches of 256 x 256 pixels, and the classification was verified by the same expert to ensure accuracy and consistency. This study addressed the challenges posed by the large size (8192 x 5460 pixels) of the original images, which caused high memory requirements and slow training times in DL models. A Python script was developed to efficiently process these images. The script iterated through image and mask file directories, resizing each image and mask to the nearest size divisible by 256 pixels (Figure 3). The patchify library (TensorFlow) then segmented the resized images and masks into non-overlapping 256 x 256-pixel patches. These patches were saved individually, maintaining their association with corresponding masks. Finally, the splitfolders library (TensorFlow) split the patches into training (75%) and validation (25%) datasets, resulting in 11,700 training and 3,900 validation images. This preprocessing enabled efficient model training and evaluation.
2.5. Semantic Segmentation Model
A UNet semantic segmentation model [37], implemented in Keras (Python), was designed for pixel-wise classification of UAV RGB imagery. This architecture, illustrated in Figure 4, comprises encoder and decoder pathways with skip connections to preserve spatial information and effectively capture both local and global features. The model outputs a segmented mask classifying each pixel into one of nine classes: seven cover crop communities (graminoids, legumes, mustards, composites, Polygonaceae, Plantaginaceae, and other forbs), vine, and soil. The training involved minimizing a loss function (measuring the discrepancy between predicted and ground truth masks), with performance evaluated using Intersection over Union (IoU) [38], accuracy, and Mean IoU. We compared semantic segmentation with and without backbone architectures. The “no backbone” approach trained the UNet from scratch, relying solely on its inherent architecture for feature extraction. This was contrasted against models incorporating four popular backbone architectures: ResNet [39], a deep convolutional network utilizing residual connections to mitigate vanishing gradients; InceptionV3 [40], known for its computational efficiency and multi-scale feature extraction via inception modules; EfficientNet [41], distinguished by its compound scaling method for optimal resource utilization; and DenseNet [42], characterized by dense connections between layers promoting feature reuse and efficient gradient propagation.
3. Results
Our UNet semantic segmentation model was trained on a dataset comprising 15,600 image patches. These patches were derived from 24 high-resolution RGB images (8192x5460 pixels) by dividing them into smaller 256x256 pixel sections. To ensure rigorous evaluation, the dataset was divided into a training set (70%), a validation set (15%), and a test set (15%).
Each image is annotated with one of nine classes: seven cover crop communities, vine, and soil. Initially, the images and their corresponding masks are loaded from the specified directories and pre-processed accordingly. The masks are encoded using label encoding and then split into training and testing datasets. Next, the model is configured with specific parameters, including the DensNet121, ResNet34, InceptionV3, and EfficientNet backbone architecture, and a combination of Dice loss and Categorical Focal loss as the optimization objective. The model is trained over 100 epochs, and the training progress is visualized using plots for loss and IOU score. After training, the model is saved for future use. Performance metrics such as accuracy, precision, recall, F1 score, Jaccard score, and Mean IoU are computed using the trained model on the test dataset. Finally, the results are printed to evaluate the segmentation model’s performance.
3.1. Class Imbalance and Data Augmentation
To address the class imbalance evident in Table 1, where certain classes (e.g., mustards, Polygonaceae, and Plantaginaceae) have significantly lower coverage areas than others, we implemented a class-balanced data augmentation strategy. This involved selectively augmenting the training data by creating new image patches that focused on the under-represented classes. Specifically, we modified the existing masks to temporarily ignore highly represented classes, effectively creating new masks where the under-represented classes became the dominant features. This process increased the number of training samples for the under-represented classes without altering the original dataset. New image patches were then generated from these modified masks, thus enriching the training data with a more balanced representation of all classes. This targeted approach ensured that the model received sufficient training examples for even the least prevalent classes, improving its ability to accurately segment these features.
3.2. Overfitting Prevention Strategies
To mitigate overfitting, we implemented early stopping. Training was halted when the validation loss stopped decreasing for a specified number of epochs (e.g., 10 epochs), ensuring that training continued only as long as the model was improving its performance on unseen data. Additionally, batch normalization was employed to stabilize and accelerate training, and class weighting in the loss function helped manage class imbalances. These strategies collectively contributed to preventing overfitting and enhancing the model’s generalization ability.
3.3. Model Performance
The comparison of semantic segmentation models with different backbone architectures reveals nuanced differences in performance metrics (Table 2). Across all models, including ResNet34, EfficientNet, InceptionV3, DenseNet, and a model without a specified backbone, there is a notable consistency in accuracy, precision, recall, and F1 score, with variations typically within a range of 1-2 percentage points. However, when assessing metrics more tailored to semantic segmentation tasks, such as mean IOU and Jaccard score, subtle disparities emerge. EfficientNet and DenseNet exhibit slightly higher mean IOU and Jaccard scores compared to ResNet34 and InceptionV3, highlighting their marginally superior ability to accurately segment objects in images. For instance, EfficientNet achieves an accuracy of 85.4%, while DenseNet reaches 83.6%, both with corresponding mean IOU scores of 59.8% and 52.1%, respectively. These results underscore the importance of selecting an appropriate backbone architecture, as models with dedicated architectures designed for image segmentation tasks demonstrate enhanced performance, particularly in terms of mean IOU and Jaccard score, compared to models without a specified backbone.
After loading the trained model, we generate a batch of test images and masks using the validation data generator. Next, we compute predictions for the test images using the loaded model and convert the predicted masks from categorical to integer format for visualization and IoU calculation. Finally, we visualize a randomly selected test image along with its corresponding ground truth mask and predicted mask for a qualitative assessment of the model’s performance (Figure 5).
Finally, the trained model was loaded to apply it to a large image, where it was segmented into patches of appropriate size for processing. The prediction process was conducted on each patch, and the resulting segmented patches were then stitched together to reconstruct the predicted mask for the entire large image, facilitating the application of the model to images beyond the validation dataset (see Figure 6).
4. Discussion
Our study aims to establish a method for identifying vineyard inter-row groundcover, with the ultimate goal of creating a comprehensive groundcover map and supporting decision-making for soil and cover crops management in viticulture. In this work, the potential of DL techniques applied to RGB images was evaluated in a vineyard with an extension of about 2 hectares located in the Franciacorta wine-growing area. The main focus of the study was to distinguish between nine classes of groundcover. Beyond the two classes vine and soil, other seven different groups of cover crops communities were distinguished: graminoids, composite, mustards, legumes, Polygonaceae, Plantaginaceae, and other forbs. These groups, differentiated by phenology and morphology, play a crucial role in providing various ecosystem services. specifically, graminoids, thanks to their fasciculate root system, contribute to the improvement of the structure of the upper soil layers and to the limitation of soil erosion. Whereas the different forb groups, contribute to a variety of services to the vineyard, such as improving soil structure at a greater depth, nitrogen fixation, among others [28,35].
Using a total of 24 RGB images, taken with a done at 8 m height, five different artificial intelligence models based on the UNet architecture [37] were trained and tested to assess their accuracy in predicting the observed soil cover. By employing a UNet architecture, which excels in pixel-wise classification tasks through its symmetrical encoder-decoder structure and skip connections, the model effectively segments UAV RGB images into predefined classes such as vine, soil, and various vegetation types. The integration of advanced DL techniques, such as semantic segmentation with backbones, offers a notable improvement in accuracy over methods without backbones, as evidenced by performance metrics. The use of backbones like EfficientNet [41], ResNet [39], InceptionV3 [40] and DenseNet [42] provided a robust foundation for feature extraction, enhancing the model’s ability to capture hierarchical features and spatial relationships within the images. Even though all the architectures analyzed showed high performance, exceeding an accuracy of 70%, the UNet model with an EfficientNet backbone stood out above the rest, achieving an accuracy of 85.4%, with a precision of 84.97 %. Unlike generalized datasets, ours is tailored to the unique ecological conditions and management practices of vineyards, making direct comparisons with other segmentation benchmarks difficult. To assess our UNet model, we therefore had compared it to relevant studies in agricultural image segmentation using aerial imagery. While many studies, like those by Zuo and Li [43] on weed segmentation in corn fields and Shai et al. [44] on weed detection using UAV images, focus on different crop types and scales, our dataset’s emphasis on vineyard cover crops necessitates a more granular analysis. Our UNet architecture aligns with common practices in image segmentation, as exemplified by [45,46].
The results of this study highlight the potential of DL models, particularly those utilizing advanced backbone architectures, to enhance the precision and efficiency of groundcover classification in vineyards. This advancement in technology provides valuable insights into the spatial distribution and ecological roles of different groundcover types, which can significantly aid vineyard management practices. Specifically, this study represents a first step in applying DL to the classification of cover crop communities in vineyard agroecosystems. The results demonstrate that innovative application of these technologies can address complex, long-standing challenges such as monitoring vineyard biodiversity. Moreover, results obtained in the present study, provides the groundwork for future studies on how cover crops may contribute to the ecological balance and sustainability of vineyard ecosystems through ecosystem services provision. However, some limitation has to be underlined. A first key limitation is the potential for bias arising from class imbalance in the dataset. While class-balancing techniques (targeted data augmentation and class weighting) were employed, under-represented classes may still bias predictions, particularly with unseen data. Future research should address this by expanding the dataset to encompass a broader range of vineyard types, soil conditions, and geographic locations. In terms of outputs obtained, although the DL model developed is able to automatically discriminated among nine classes of groundcover, it needs to be evolved in order to generate a real operational tool. Specifically, the results obtained with the DL model on high resolution images, must be replicated on images with a much lower resolution, allowing the automatic identification on a much larger surface (hectares). This represents an interesting perspective of future development of the research, allowing a considerable reduction of costs and time of imaging acquisition by UAV.
5. Conclusions
This study highlights the potential of using remote sensing and artificial intelligence for mapping of groundcovers within vineyards inter-rows, in order to monitor the cover crops communities in vineyard agroecosystems. The comparative analysis conducted in this study shows that the Unet model, with the efficientNET backbone architecture outruns the other architectures highlighting its utility for groundcovers within vineyards inter-rows classification. This study validates the capabilities of the described methodology to create a DL model capable of classify cover crops communities, with the aim of monitoring biodiversity in vineyards, in order to be used in decision-making for soil and cover crops management. Further research are needed to allow the model to monitor larger surface with time and cost advantages and expanding the dataset to encompass a broader range of vineyard types, soil conditions, and geographic locations.
Author Contributions
Conceptualization, Isabella Ghiglieno, Girma Tariku, Gianni Gilioli; methodology, Isabella Ghiglieno, Girma Tariku, Fulvio Gentilin, Salvatore Mangiapane; software, Girma Tariku, Andres Sanchez Morchio, Luca Facciano, Celine Birolleau and Anna Simonetto; validation, Isabella Ghiglieno, Andres Sanchez Morchio, Luca Facciano, Celine Birolleau; formal analysis, Isabella Ghiglieno, Girma Tariku and Anna Simonetto; investigation, Isabella Ghiglieno, Girma Tariku, Fulvio Gentilin, Salvatore Mangiapane; resources, Gianni Gilioli and Anna Simonetto; data curation, Girma Tariku, Andres Sanchez Morchio, Luca Facciano, Celine Birolleau; writing—original draft preparation, Isabella Ghiglieno, Girma Tariku, Andres Sanchez Morchio, Luca Facciano, Celine Birolleau; writing—review and editing, Isabella Ghiglieno, Andres Sanchez Morchio and Anna Simonetto; visualization, Isabella Ghiglieno and Gianni Gilioli; supervision, Gianni Gilioli; project administration, Isabella Ghiglieno, Anna Simonetto Gianni Gilioli. All authors have read and agreed to the published version of the manuscript.
Funding
This work has been partially supported by “Fondazione Cariplo” (Italy) and “Regione Lombardia” (Italy) under the project: Progetto “Biodiversità, suolo e servizi ecosistemici: Metodi e tecniche per food system robusti, resilienti e sostenibili”—Bando Emblematici Maggiori
Acknowledgments
the authors would like to thank Azienda Agricola Ricci Curbastro for the support and availability during the development of this research
Conflicts of Interest
The authors declare no conflicts of interest.
References
- Sarkar, S. Origin of the Term Biodiversity. BioScience 2021, 71, 893. [CrossRef]
- Swingland, I.R. BIODIVERSITY, DEFINITION OF.
- Sandhu, H.S.; Wratten, S.D.; Cullen, R. Organic Agriculture and Ecosystem Services. Environmental Science & Policy 2010, 13, 1–7. [CrossRef]
- Outhwaite, C.L.; McCann, P.; Newbold, T. Agriculture and Climate Change Are Reshaping Insect Biodiversity Worldwide. Nature 2022, 605, 97–102. [CrossRef]
- Raven, P.H.; Wagner, D.L. Agricultural Intensification and Climate Change Are Rapidly Decreasing Insect Biodiversity. Proceedings of the National Academy of Sciences 2021, 118, e2002548117. [CrossRef]
- Landscape Simplification Increases Vineyard Pest Outbreaks and Insecticide Use—Paredes—2021—Ecology Letters—Wiley Online Library Available online: https://onlinelibrary.wiley.com/doi/full/10.1111/ele.13622 (accessed on 31 October 2024).
- Influence of Vineyard Inter-Row Groundcover Vegetation Management on Arthropod Assemblages in the Vineyards of North-Eastern Italy Available online: https://www.mdpi.com/2075-4450/12/4/349 (accessed on 31 October 2024).
- Delabays, N.; Pétremand, G.; Fleury, D. Comparaison de Six Mélanges Pour l’enherbement Viticole Dans l’arc Lémanique. Revue suisse Viticulture, Arboriculture, Horticulture 2016, 48, 322–329.
- Garcia, L.; Celette, F.; Gary, C.; Ripoche, A.; Valdés-Gómez, H.; Metay, A. Management of Service Crops for the Provision of Ecosystem Services in Vineyards: A Review. Agriculture, Ecosystems & Environment 2018, 251, 158–170. [CrossRef]
- J.h, V.; I, P. Breakfast of Biodiversity: The Truth about Rain Forest Destruction.; 1995; ISBN 978-0-935028-66-9.
- Petrou, Z.I.; Manakos, I.; Stathaki, T. Remote Sensing for Biodiversity Monitoring: A Review of Methods for Biodiversity Indicator Extraction and Assessment of Progress towards International Targets. Biodivers Conserv 2015, 24, 2333–2363. [CrossRef]
- Ayanu, Y.; Conrad, C.; Nauss, T.; Wegmann, M.; Koellner, T. Quantifying and Mapping Ecosystem Services Supplies and Demands: A Review of Remote Sensing Applications. Environmental science & technology 2012, 46, 8529–8541. [CrossRef]
- del Rio, T.; Willemen, L.; Tesfamariam, G.; Beukes, O.; Nelson, A. Remote Sensing for Mapping Ecosystem Services to Support Evaluation of Ecological Restoration Interventions in an Arid Landscape. Ecological Indicators 2020. [CrossRef]
- Sandino, J.; Wooler, A.; Gonzalez, F. Towards the Automatic Detection of Pre-Existing Termite Mounds through UAS and Hyperspectral Imagery. Sensors 2017, 17, 2196. [CrossRef]
- Burai, P.; Deák, B.; Valkó, O.; Tomor, T. Classification of Herbaceous Vegetation Using Airborne Hyperspectral Imagery. Remote Sensing 2015, 7, 2046–2066. [CrossRef]
- Hall, E.C.; Lara, M.J. Multisensor UAS Mapping of Plant Species and Plant Functional Types in Midwestern Grasslands. Remote Sensing 2022, 14, 3453. [CrossRef]
- Chollet, F. Deep Learning with Python, Second Edition; Simon and Schuster, 2021; ISBN 978-1-63835-009-5.
- LeCun, Y.; Bengio, Y.; Hinton, G. Deep Learning. Nature 2015, 521, 436–444. [CrossRef]
- Giovos, R.; Tassopoulos, D.; Kalivas, D.; Lougkos, N.; Priovolou, A. Remote Sensing Vegetation Indices in Viticulture: A Critical Review. Agriculture 2021, 11, 457. [CrossRef]
- Campos, J.; García-Ruíz, F.; Gil, E. Assessment of Vineyard Canopy Characteristics from Vigour Maps Obtained Using UAV and Satellite Imagery. Sensors 2021, 21, 2363. [CrossRef]
- Bendel, N.; Kicherer, A.; Backhaus, A.; Klück, H.-C.; Seiffert, U.; Fischer, M.; Voegele, R.T.; Töpfer, R. Evaluating the Suitability of Hyper- and Multispectral Imaging to Detect Foliar Symptoms of the Grapevine Trunk Disease Esca in Vineyards. Plant Methods 2020, 16, 142. [CrossRef]
- Unmanned Aerial Vehicle (UAV)-Based Remote Sensing to Monitor Grapevine Leaf Stripe Disease within a Vineyard Affected by Esca Complex on JSTOR Available online: https://www.jstor.org/stable/44809332?casa_token=E6qm3pbj_rcAAAAA%3AkzEQ07pm7Xc_rCH0UbQ1lBtXF3xV9Ttk3Dy4HVepH1fJTq7aL0vwP4raaK9Cggu5R1cdXhdUy-MPrk0MJ-A99XFMVvmMERzcTkLTlJzprBMkoDsxIuQblw (accessed on 31 October 2024).
- Al-Saddik, H.; Simon, J.C.; Cointault, F. Assessment of the Optimal Spectral Bands for Designing a Sensor for Vineyard Disease Detection: The Case of ‘Flavescence Dorée.’ Precision Agric 2019, 20, 398–422. [CrossRef]
- Ferrer, M.; Echeverría, G.; Pereyra, G.; Gonzalez-Neves, G.; Pan, D.; Mirás-Avalos, J.M. Mapping Vineyard Vigor Using Airborne Remote Sensing: Relations with Yield, Berry Composition and Sanitary Status under Humid Climate Conditions. Precision Agric 2020, 21, 178–197. [CrossRef]
- Santesteban, L.G.; Guillaume, S.; Royo, J.B.; Tisseyre, B. Are Precision Agriculture Tools and Methods Relevant at the Whole-Vineyard Scale? Precision Agric 2013, 14, 2–17. [CrossRef]
- Diamond, D.D.; Elliott, L.F. Use of Abiotic Setting Surrogates for Reserve Selection and Design. In Reference Module in Earth Systems and Environmental Sciences; Elsevier, 2017 ISBN 978-0-12-409548-9.
- Van Sundert, K.; Arfin Khan, M.A.S.; Bharath, S.; Buckley, Y.M.; Caldeira, M.C.; Donohue, I.; Dubbert, M.; Ebeling, A.; Eisenhauer, N.; Eskelinen, A.; et al. Fertilized Graminoids Intensify Negative Drought Effects on Grassland Productivity. Global Change Biology 2021, 27, 2441–2457. [CrossRef]
- Vandvik, V.; Althuizen, I.; Jaroszynska, F.; Krüger, L.; Lee, H.; Goldberg, D.; Klanderud, K.; Olsen, S.; Telford, R.; Östman, S.; et al. The Role of Plant Functional Groups Mediating Climate Impacts on Carbon and Biodiversity of Alpine Grasslands. Scientific Data 2022, 9. [CrossRef]
- Perrone, S.; Grossman, J.; Liebman, A.; Wells, S.; Sooksa-nguan, T.; Jordan, N. Legume Cover Crop Contributions to Ecological Nutrient Management in Upper Midwest Vegetable Systems. Front. Sustain. Food Syst. 2022, 6. [CrossRef]
- Muhammad, I.; Wang, J.; Sainju, U.M.; Zhang, S.; Zhao, F.; Khan, A. Cover Cropping Enhances Soil Microbial Biomass and Affects Microbial Community Structure: A Meta-Analysis. Geoderma 2021, 381, 114696. [CrossRef]
- Cover Crop Diversity as a Tool to Mitigate Vine Decline and Reduce Pathogens in Vineyard Soils Available online: https://www.mdpi.com/1424-2818/12/4/128 (accessed on 31 October 2024).
- Sáenz-Romo, M.G.; Veas-Bernal, A.; Martínez-García, H.; Campos-Herrera, R.; Ibáñez-Pascual, S.; Martínez-Villar, E.; Pérez-Moreno, I.; Marco-Mancebón, V.S. Ground Cover Management in a Mediterranean Vineyard: Impact on Insect Abundance and Diversity. Agriculture, Ecosystems & Environment 2019, 283, 106571. [CrossRef]
- Using a Buckwheat Cover Crop for Maximum Weed Suppression after Early Vegetables in: HortTechnology Volume 23 Issue 5 (2013) Available online: https://journals.ashs.org/horttech/view/journals/horttech/23/5/article-p575.xml (accessed on 31 October 2024).
- Miglécz, T.; Valkó, O.; Török, P.; Deák, B.; Kelemen, A.; Donkó, Á.; Drexler, D.; Tóthmérész, B. Establishment of Three Cover Crop Mixtures in Vineyards. Scientia Horticulturae 2015, 197, 117–123. [CrossRef]
- Lundholm, J.T. Green Roof Plant Species Diversity Improves Ecosystem Multifunctionality. Journal of Applied Ecology 2015, 52, 726–734. [CrossRef]
- High-resolution Spectral Data Predict Taxonomic Diversity in Low Diversity Grasslands—Hayden—2024—Ecological Solutions and Evidence—Wiley Online Library Available online: https://besjournals.onlinelibrary.wiley.com/doi/10.1002/2688-8319.12365 (accessed on 4 November 2024).
- Ronneberger, O.; Fischer, P.; Brox, T. U-Net: Convolutional Networks for Biomedical Image Segmentation. In Proceedings of the Medical Image Computing and Computer-Assisted Intervention—MICCAI 2015; Navab, N., Hornegger, J., Wells, W.M., Frangi, A.F., Eds.; Springer International Publishing: Cham, 2015; pp. 234–241.
- Rezatofighi, H.; Tsoi, N.; Gwak, J.; Sadeghian, A.; Reid, I.; Savarese, S. Generalized Intersection Over Union: A Metric and a Loss for Bounding Box Regression.; 2019; pp. 658–666.
- He, K.; Zhang, X.; Ren, S.; Sun, J. Deep Residual Learning for Image Recognition.; 2016; pp. 770–778.
- Szegedy, C.; Vanhoucke, V.; Ioffe, S.; Shlens, J.; Wojna, Z. Rethinking the Inception Architecture for Computer Vision.; 2016; pp. 2818–2826.
- Tan, M.; Le, Q. EfficientNet: Rethinking Model Scaling for Convolutional Neural Networks. In Proceedings of the Proceedings of the 36th International Conference on Machine Learning; PMLR, May 24 2019; pp. 6105–6114.
- Huang, G.; Liu, Z.; van der Maaten, L.; Weinberger, K.Q. Densely Connected Convolutional Networks.; 2017; pp. 4700–4708.
- Zuo, Y.; Li, W. An Improved UNet Lightweight Network for Semantic Segmentation of Weed Images in Corn Fields. CMC 2024, 79, 4413–4431. [CrossRef]
- Shahi, T.B.; Dahal, S.; Sitaula, C.; Neupane, A.; Guo, W. Deep Learning-Based Weed Detection Using UAV Images: A Comparative Study. Drones 2023, 7, 624. [CrossRef]
- Wang, Y.; Gu, L.; Jiang, T.; Gao, F. MDE-UNet: A Multitask Deformable UNet Combined Enhancement Network for Farmland Boundary Segmentation. IEEE Geoscience and Remote Sensing Letters 2023, 20, 1–5. [CrossRef]
- Zhao, X.; Yuan, Y.; Song, M.; Ding, Y.; Lin, F.; Liang, D.; Zhang, D. Use of Unmanned Aerial Vehicle Imagery and Deep Learning UNet to Extract Rice Lodging. Sensors 2019, 19, 3859. [CrossRef]
Figure 1.
a) In yellow the Italian region of Lombardia. B) T in blue the viticole region of Franciacorta and in red the municipality of Capriolo. c) A close-up of the study area.
Figure 1.
a) In yellow the Italian region of Lombardia. B) T in blue the viticole region of Franciacorta and in red the municipality of Capriolo. c) A close-up of the study area.
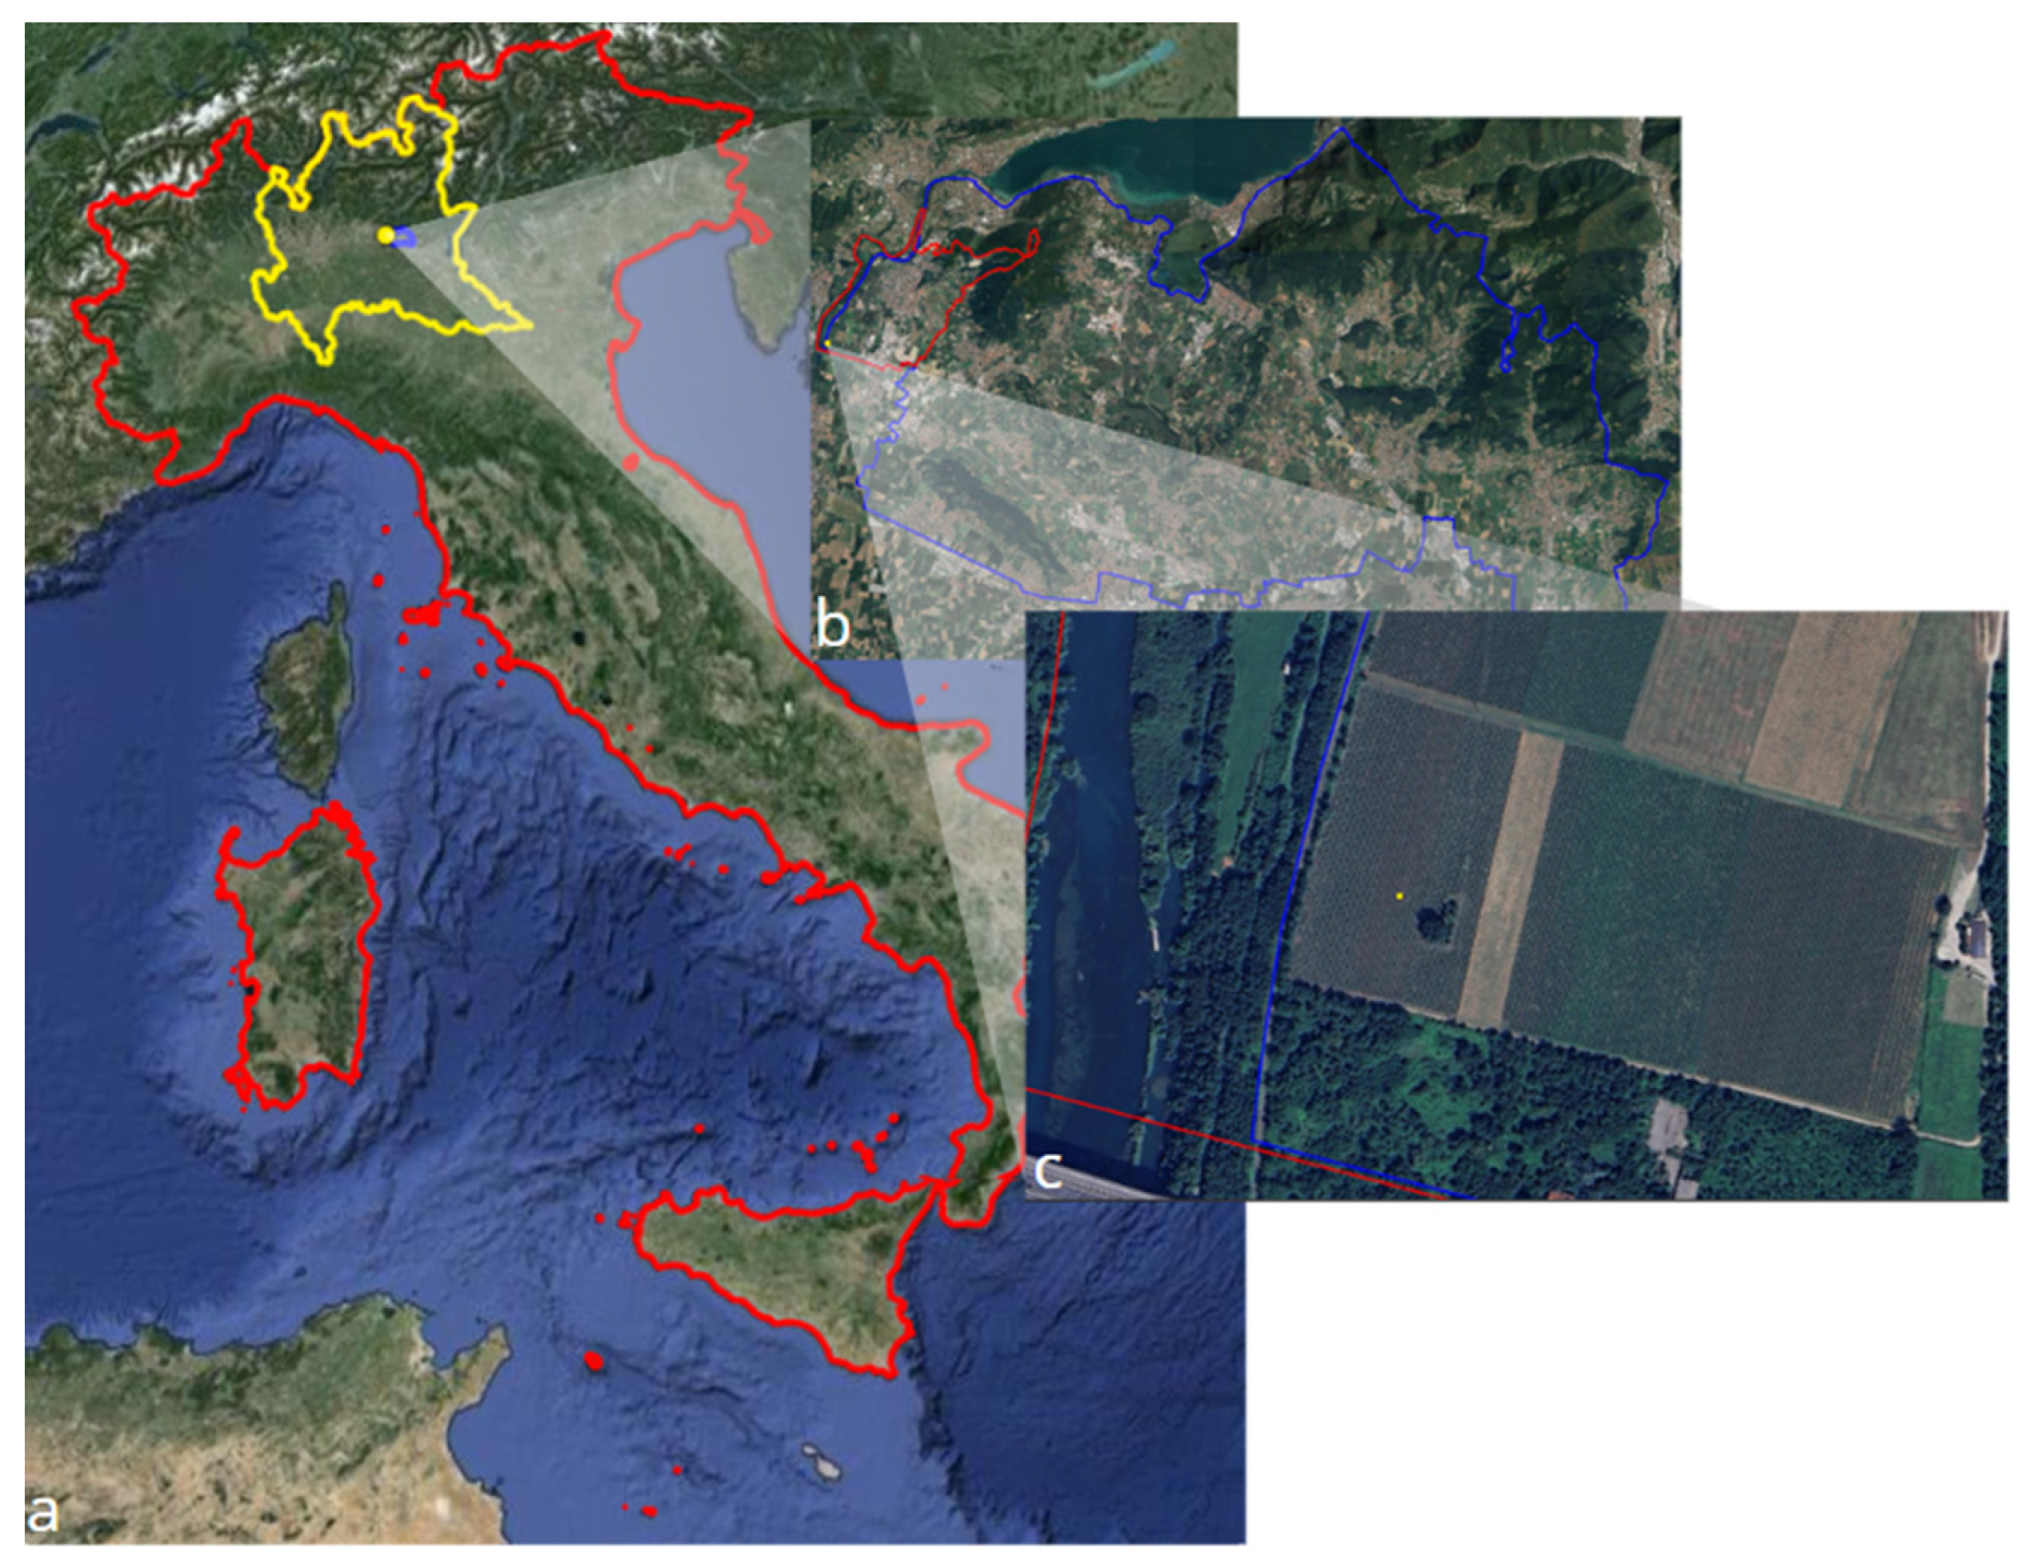
Figure 2.
Illustrates the General Workflow of Semantic Segmentation for Large Images.
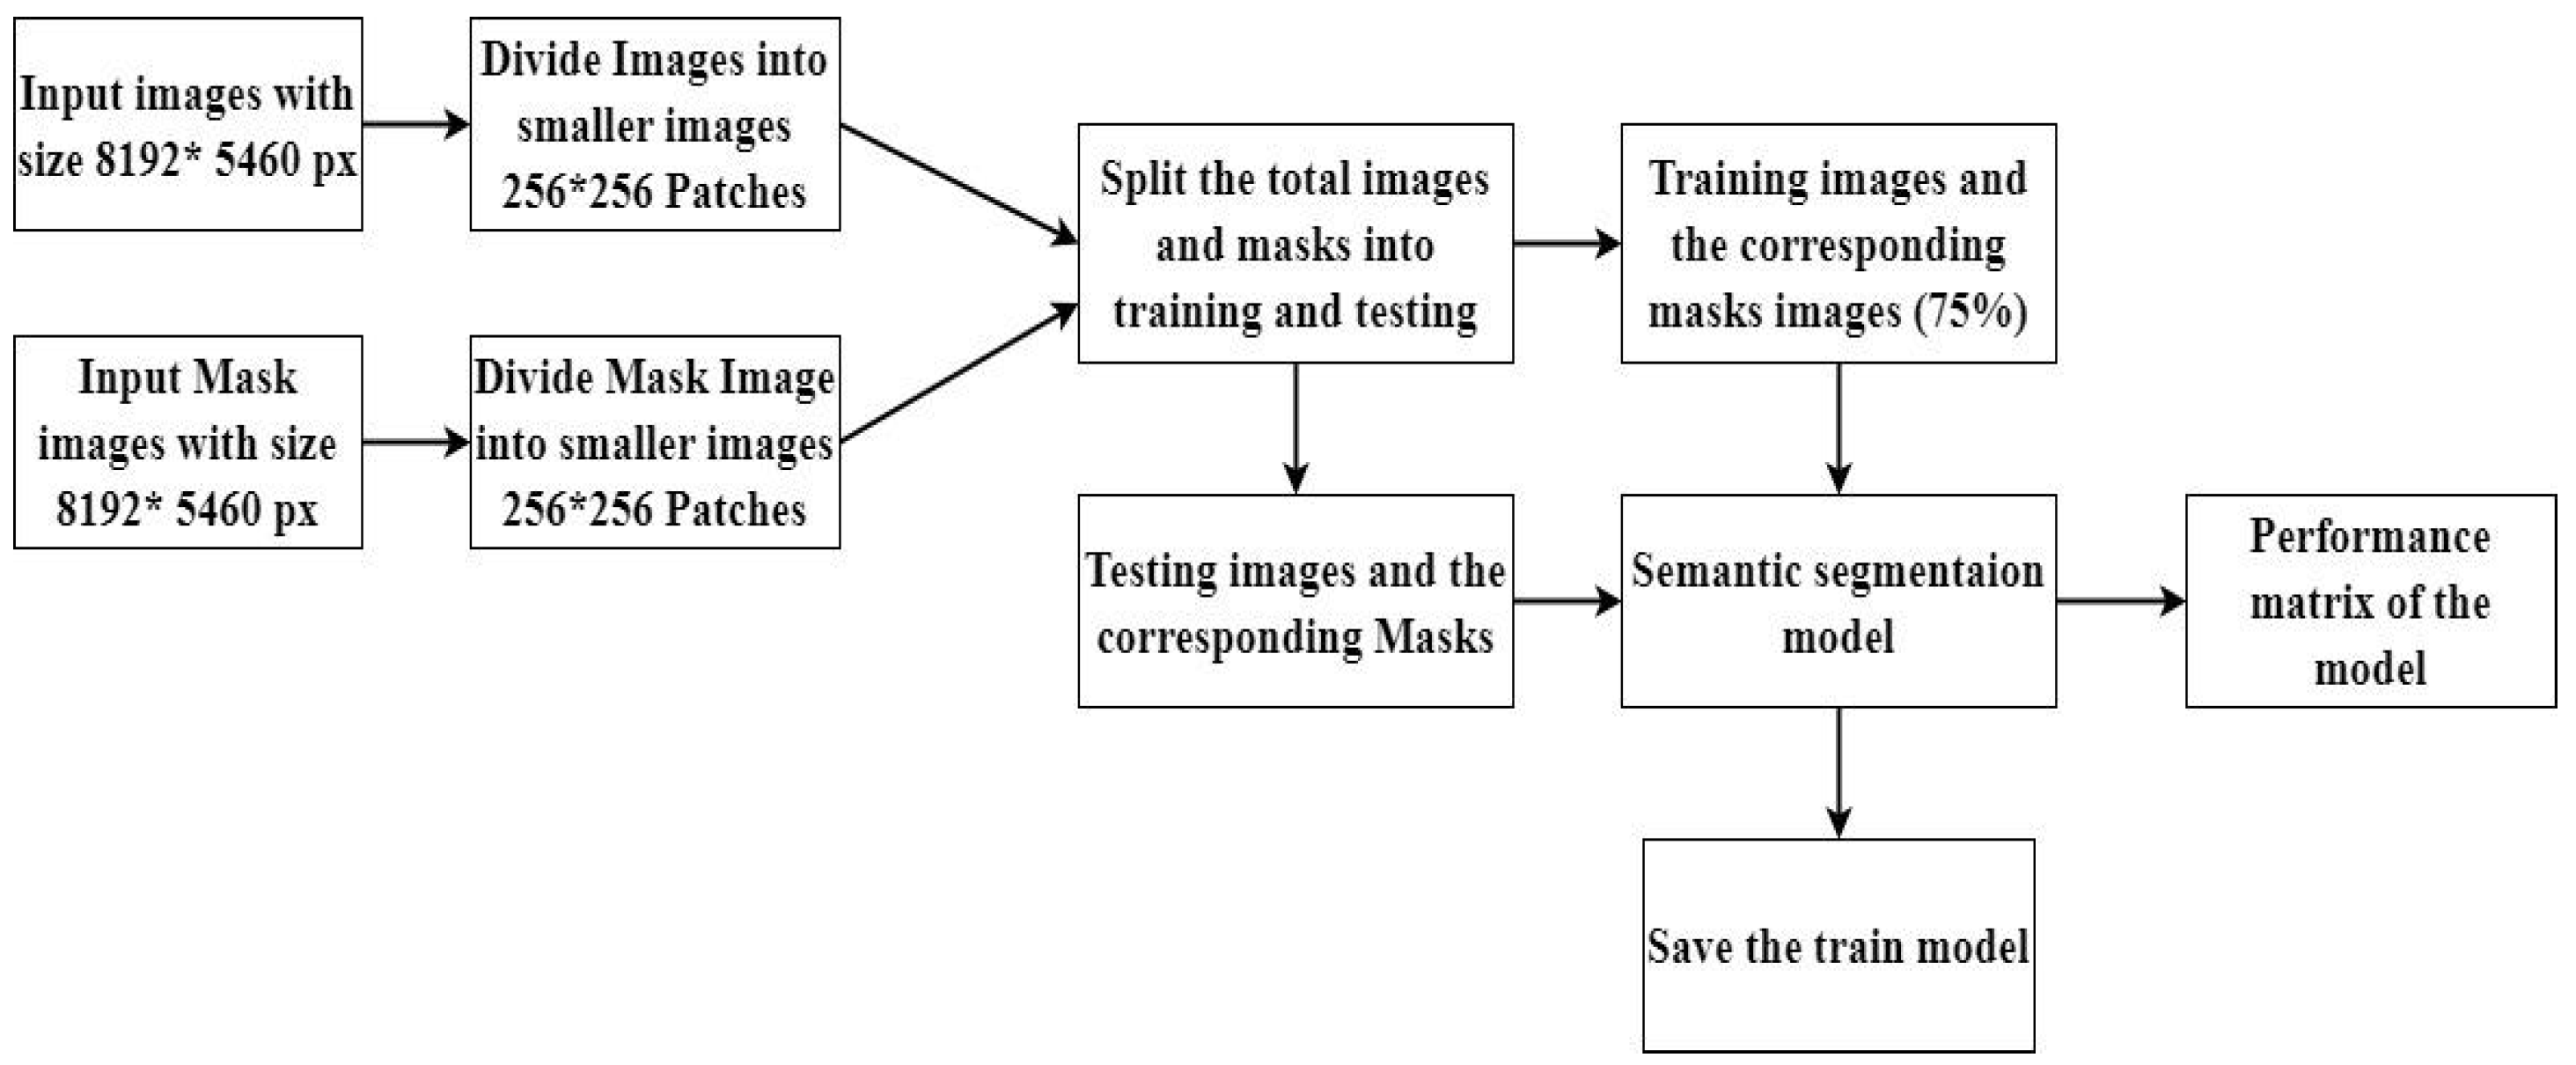
Figure 3.
Illustration of four randomly selected image patches (A, B, C, D) of size 256x256 pixels, extracted from the original vineyard images along with their corresponding ground truth masks. These patches are used to train and evaluate a deep-learning model. The legend describes the color representing each class.
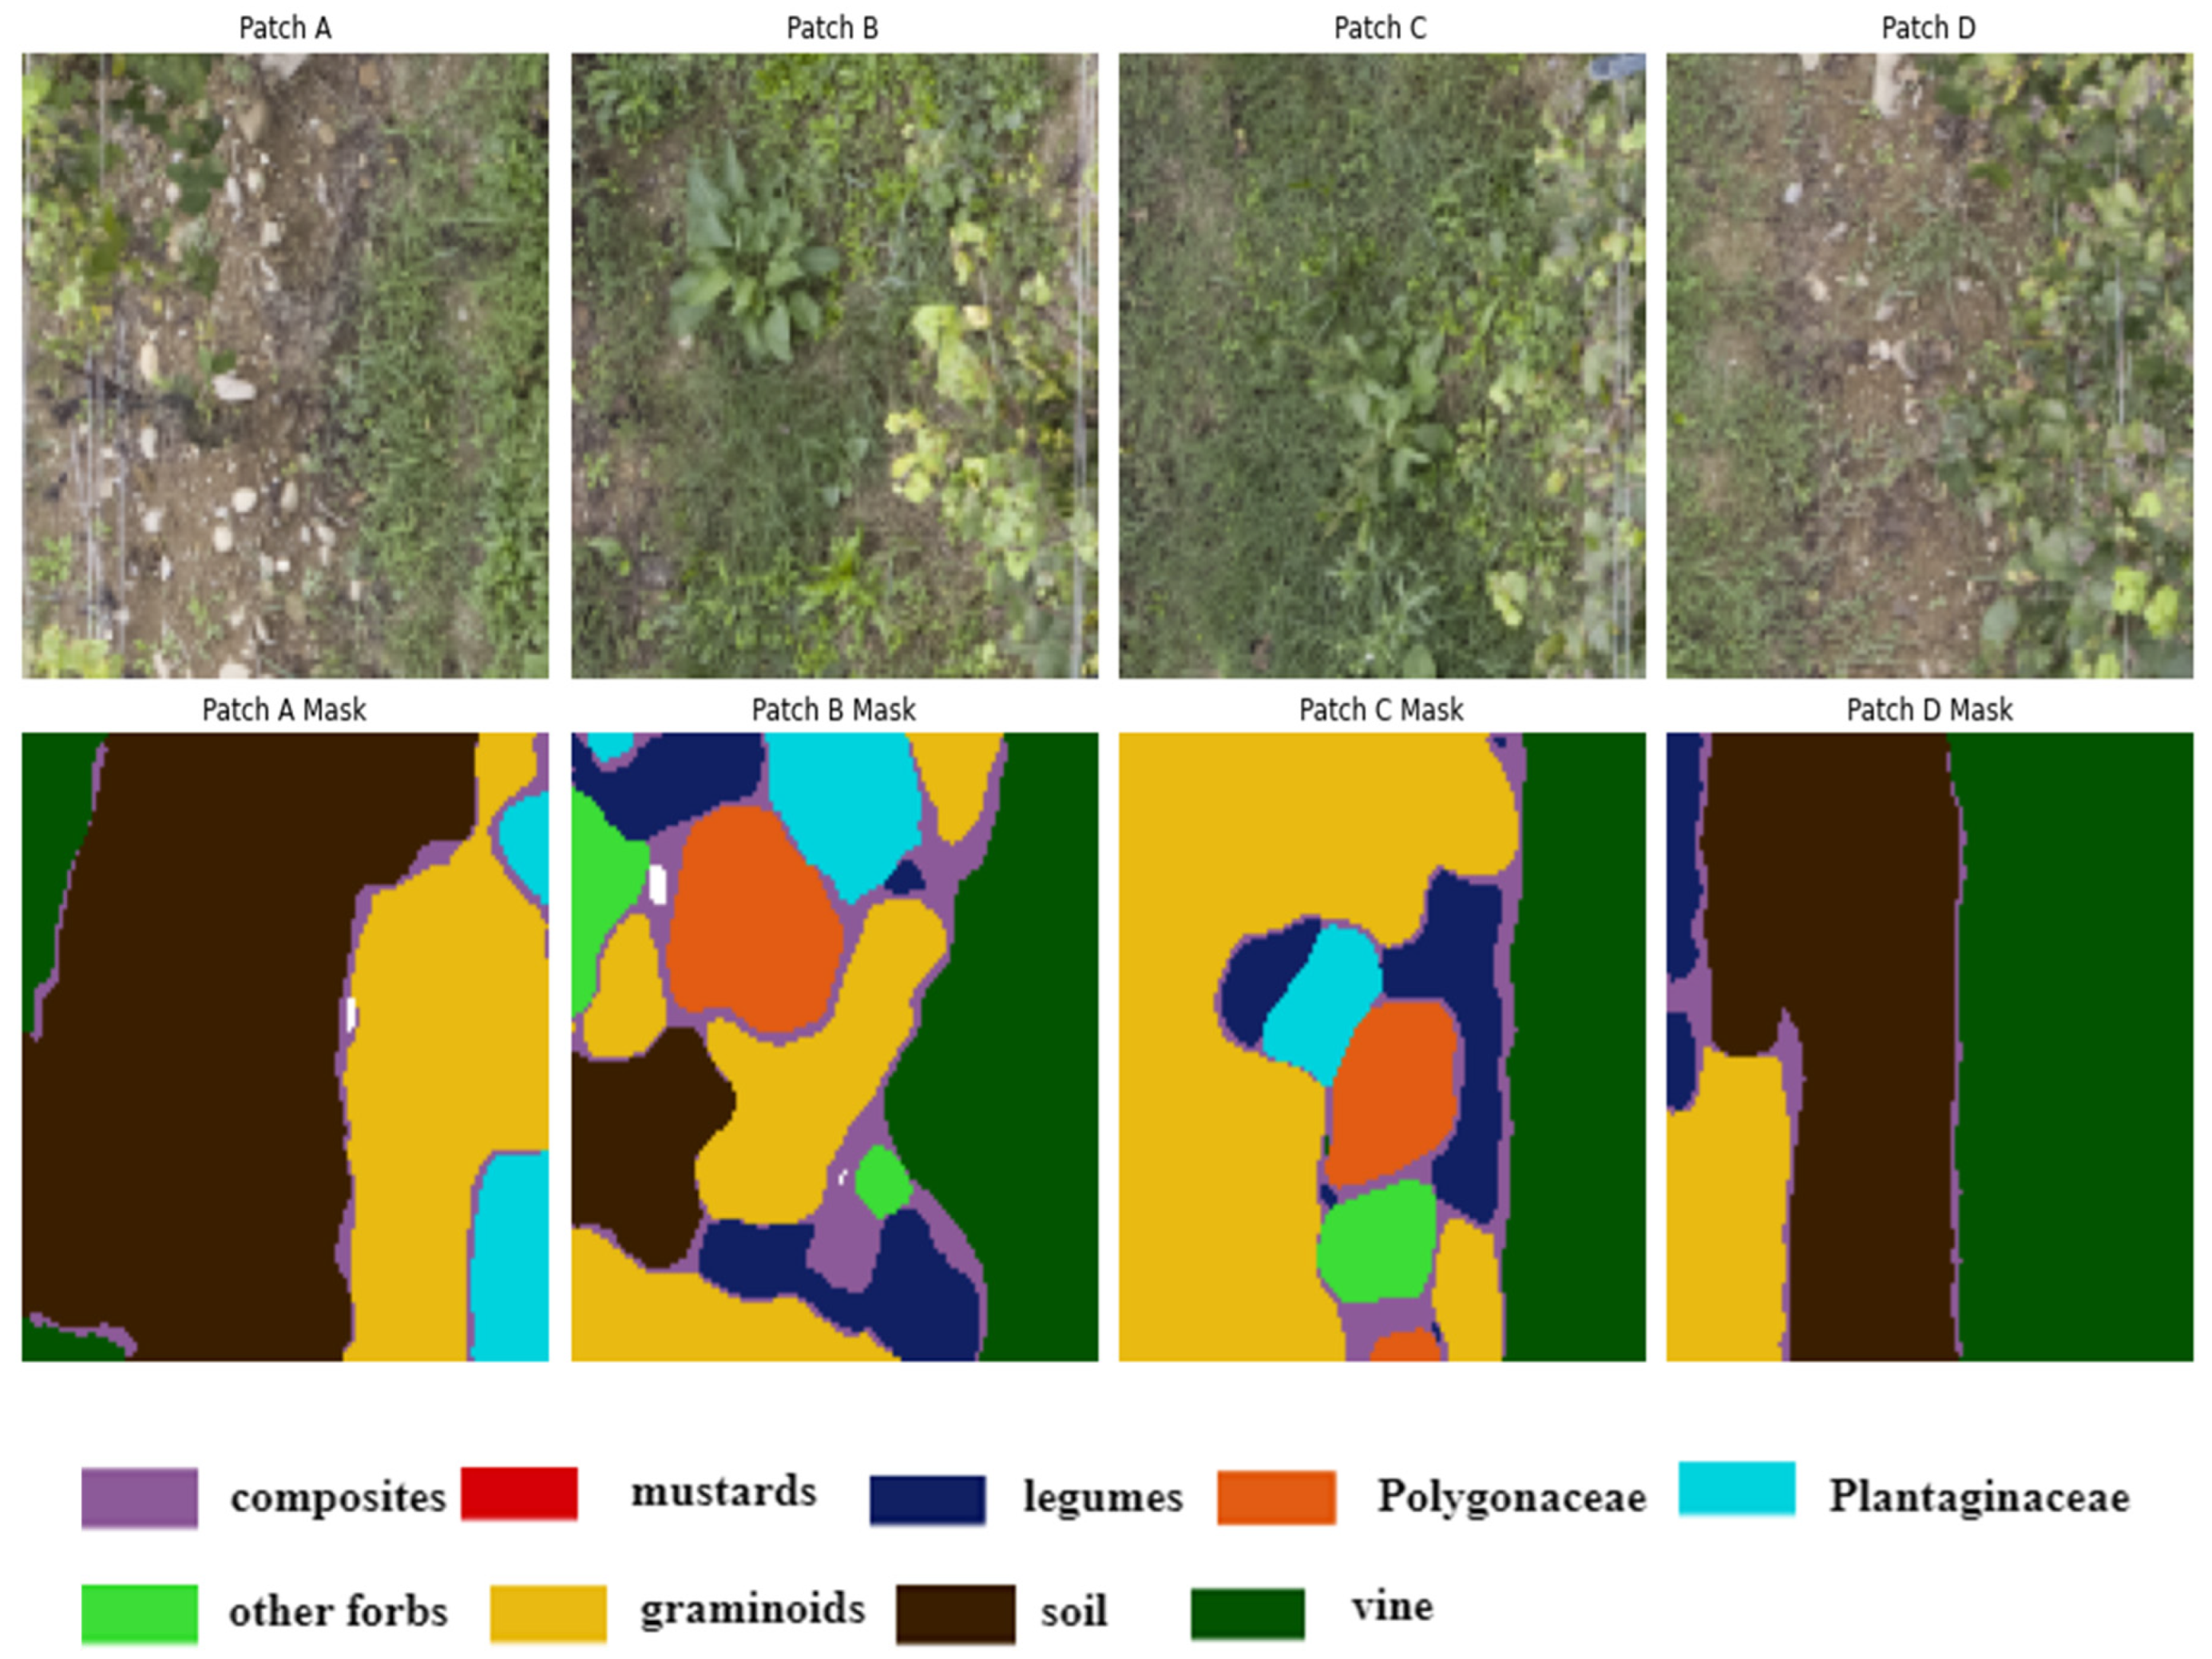
Figure 4.
The architecture of the UNet Semantic Segmentation Model.
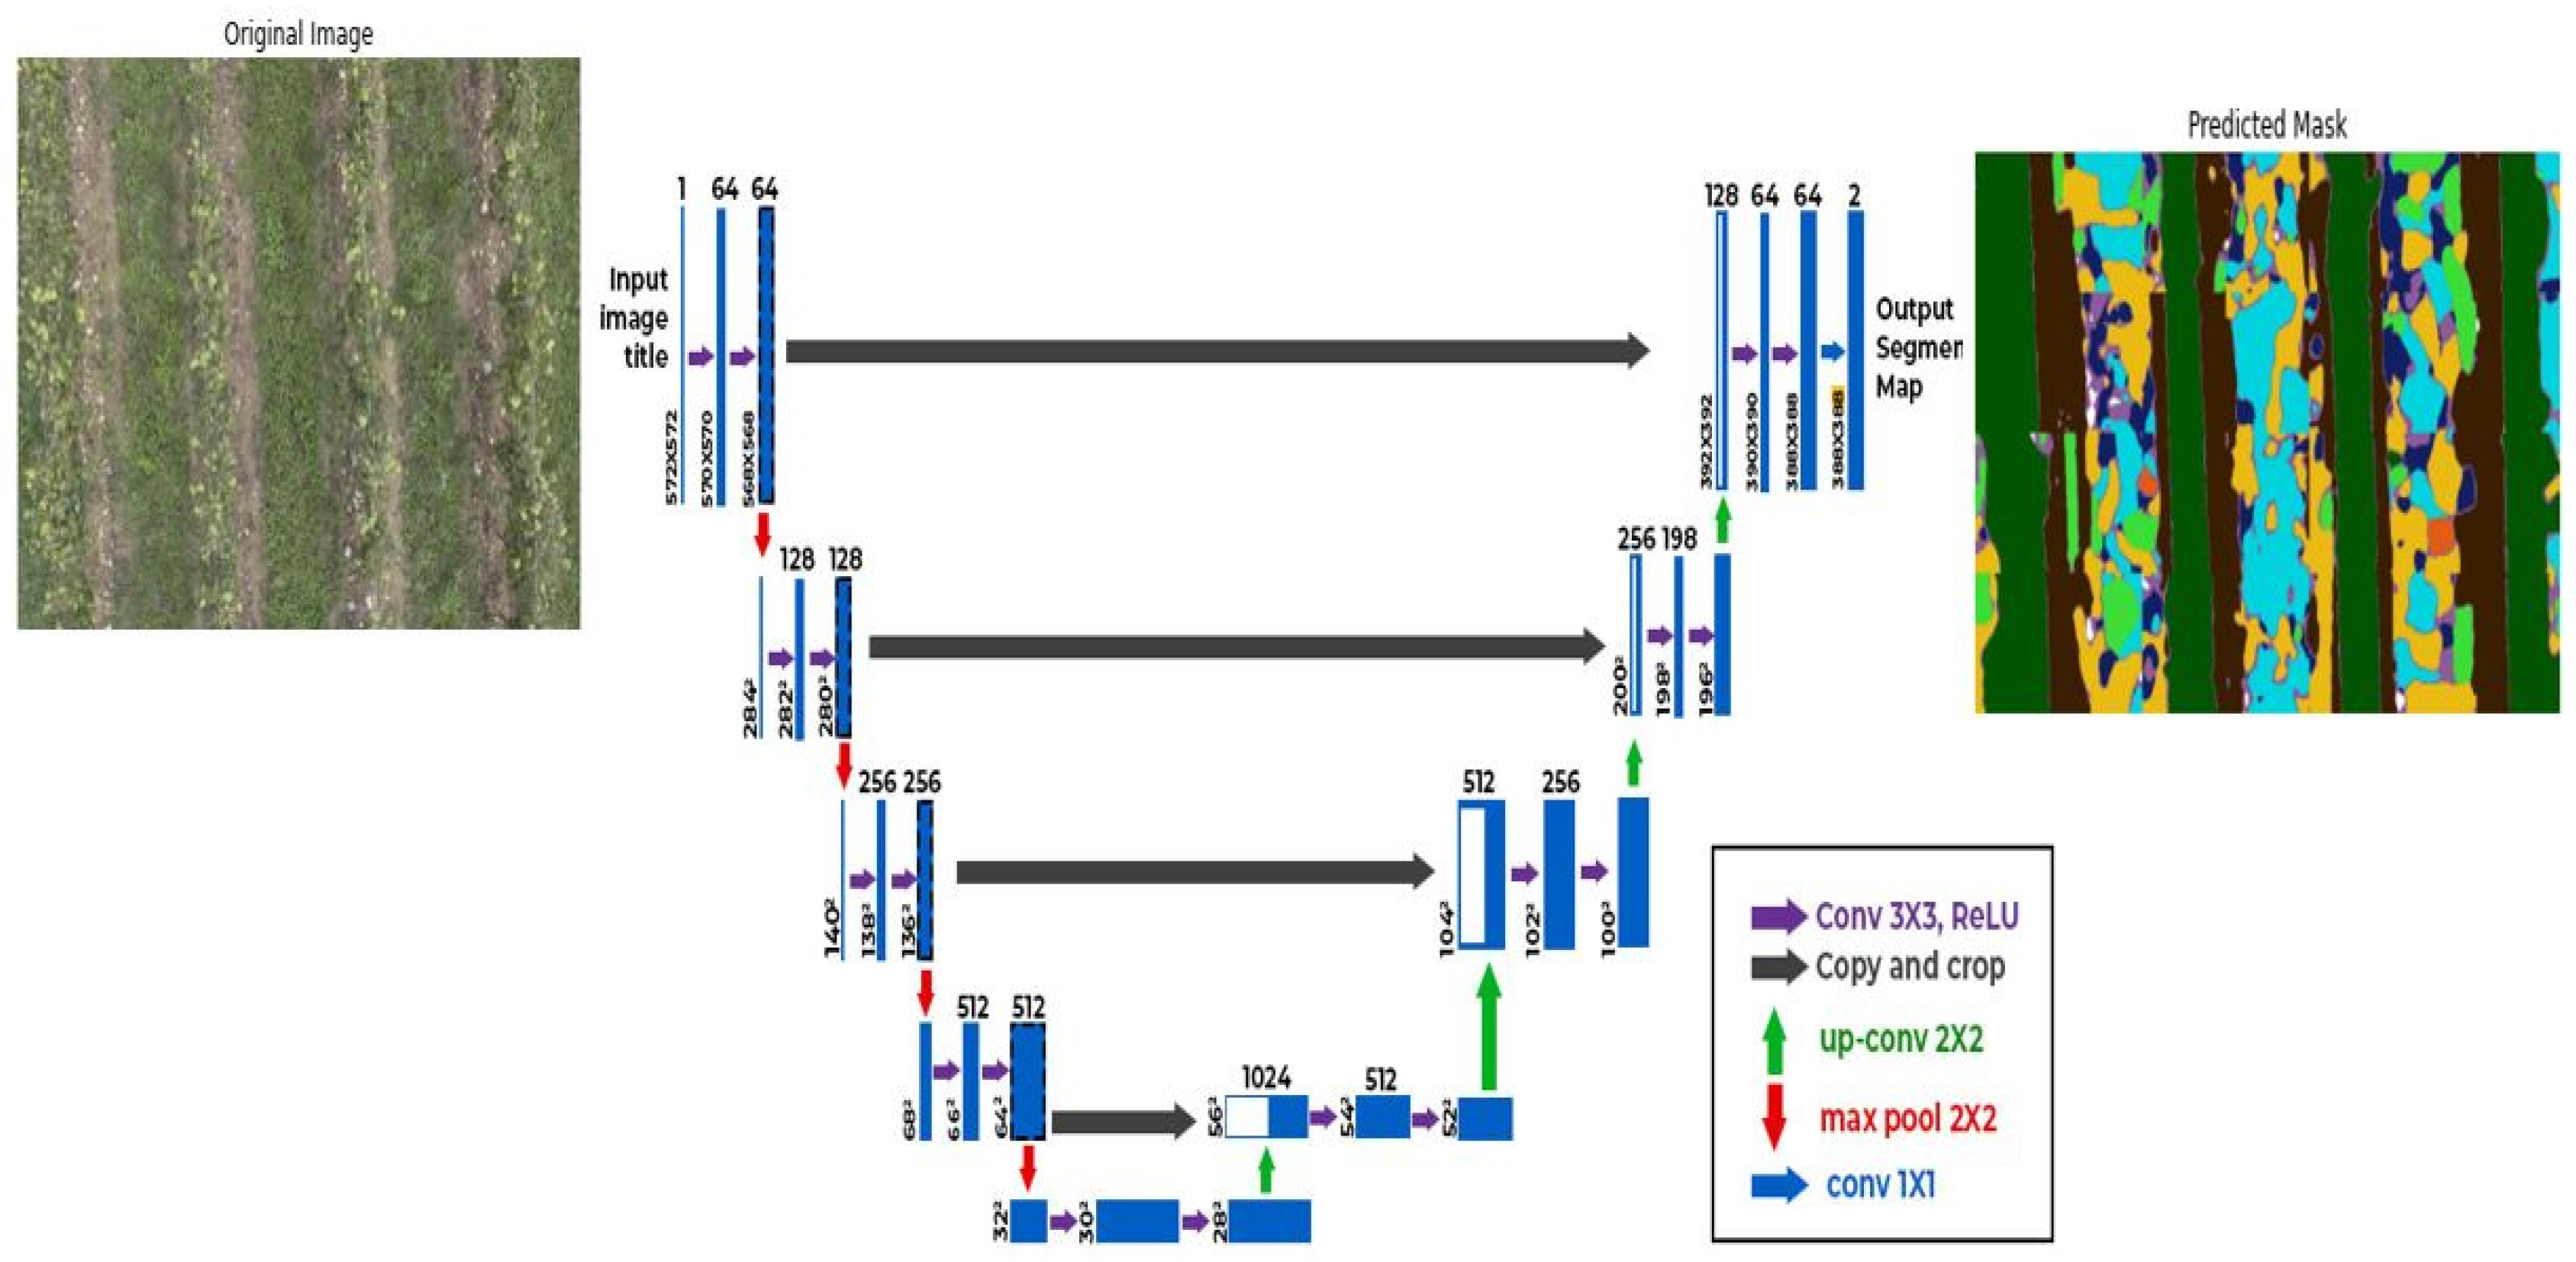
Figure 5.
Visualization of a randomly selected test image, ground truth mask, and predicted mask. The figure illustrates the qualitative assessment of the model’s performance, comparing the original test image to its corresponding ground truth and predicted masks. The legend describes the color representing each class.
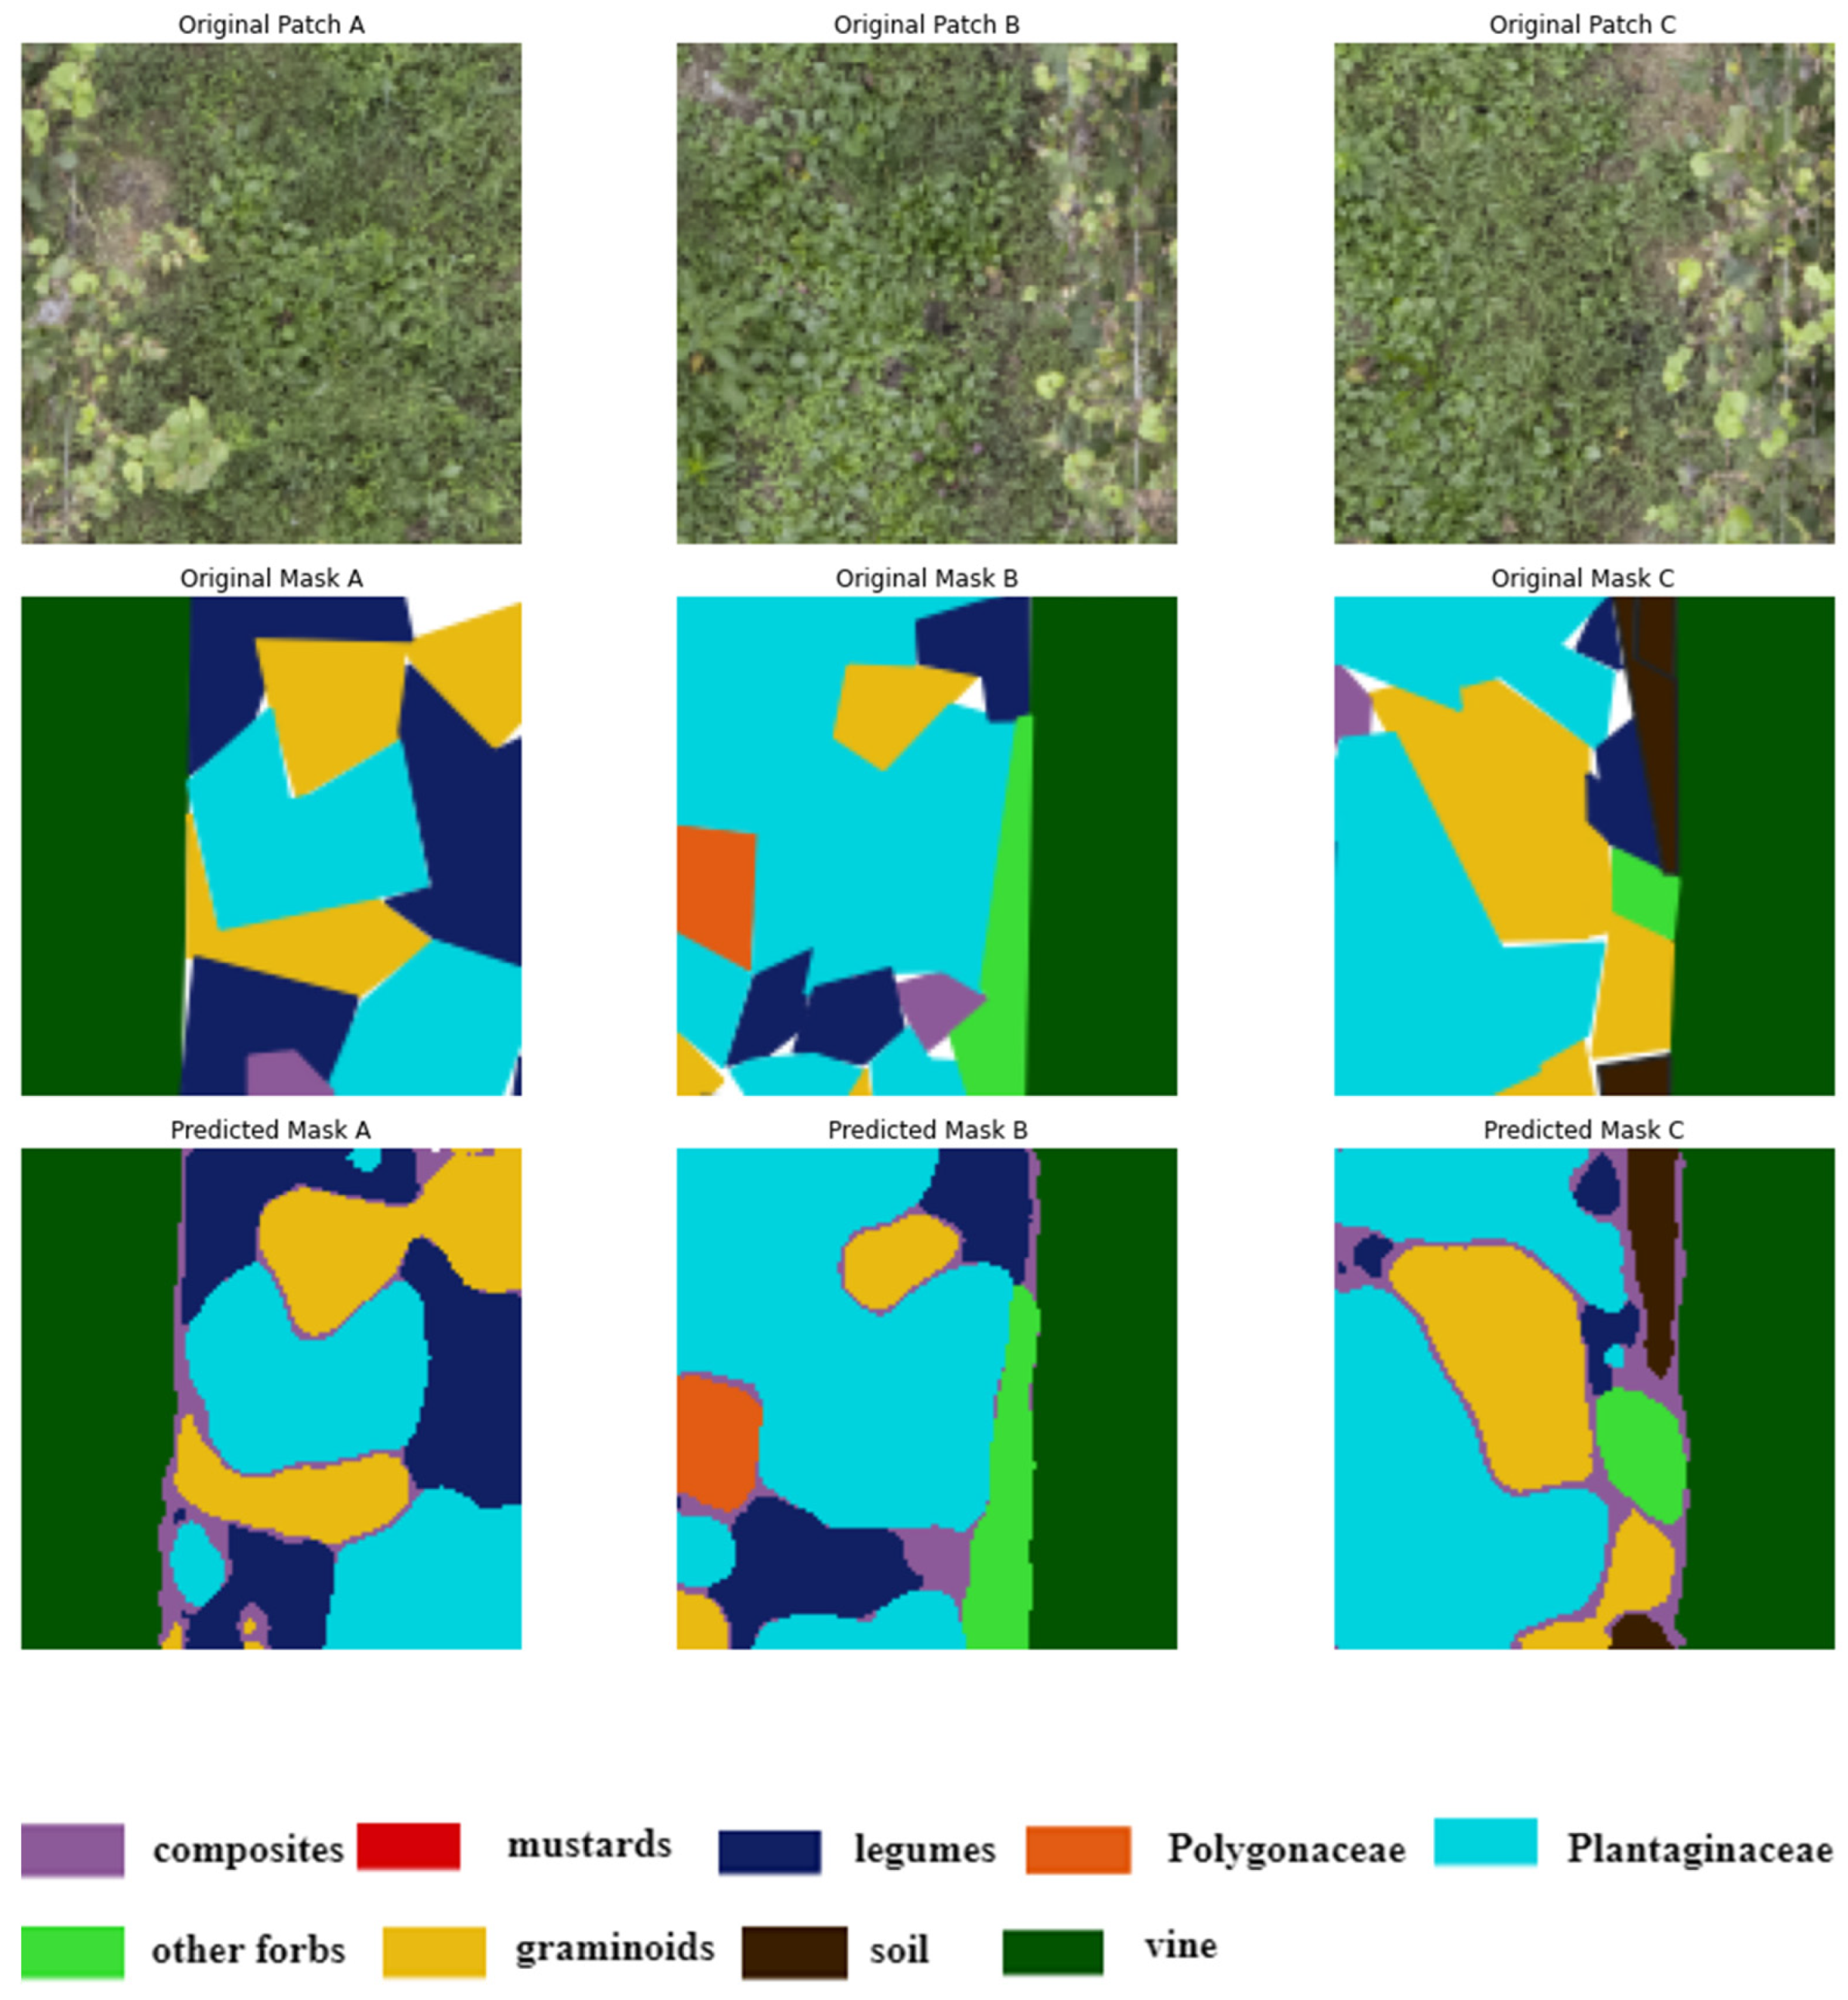
Figure 6.
Illustrates the original image, ground truth mask, and the final segmented image mask obtained by applying a trained model. The model segments the large image into patches for processing, generates predictions for each patch, and seamlessly stitches together the resulting segmented patches to reconstruct the predicted mask for the entire large image. The legend describes the color representation of each class.

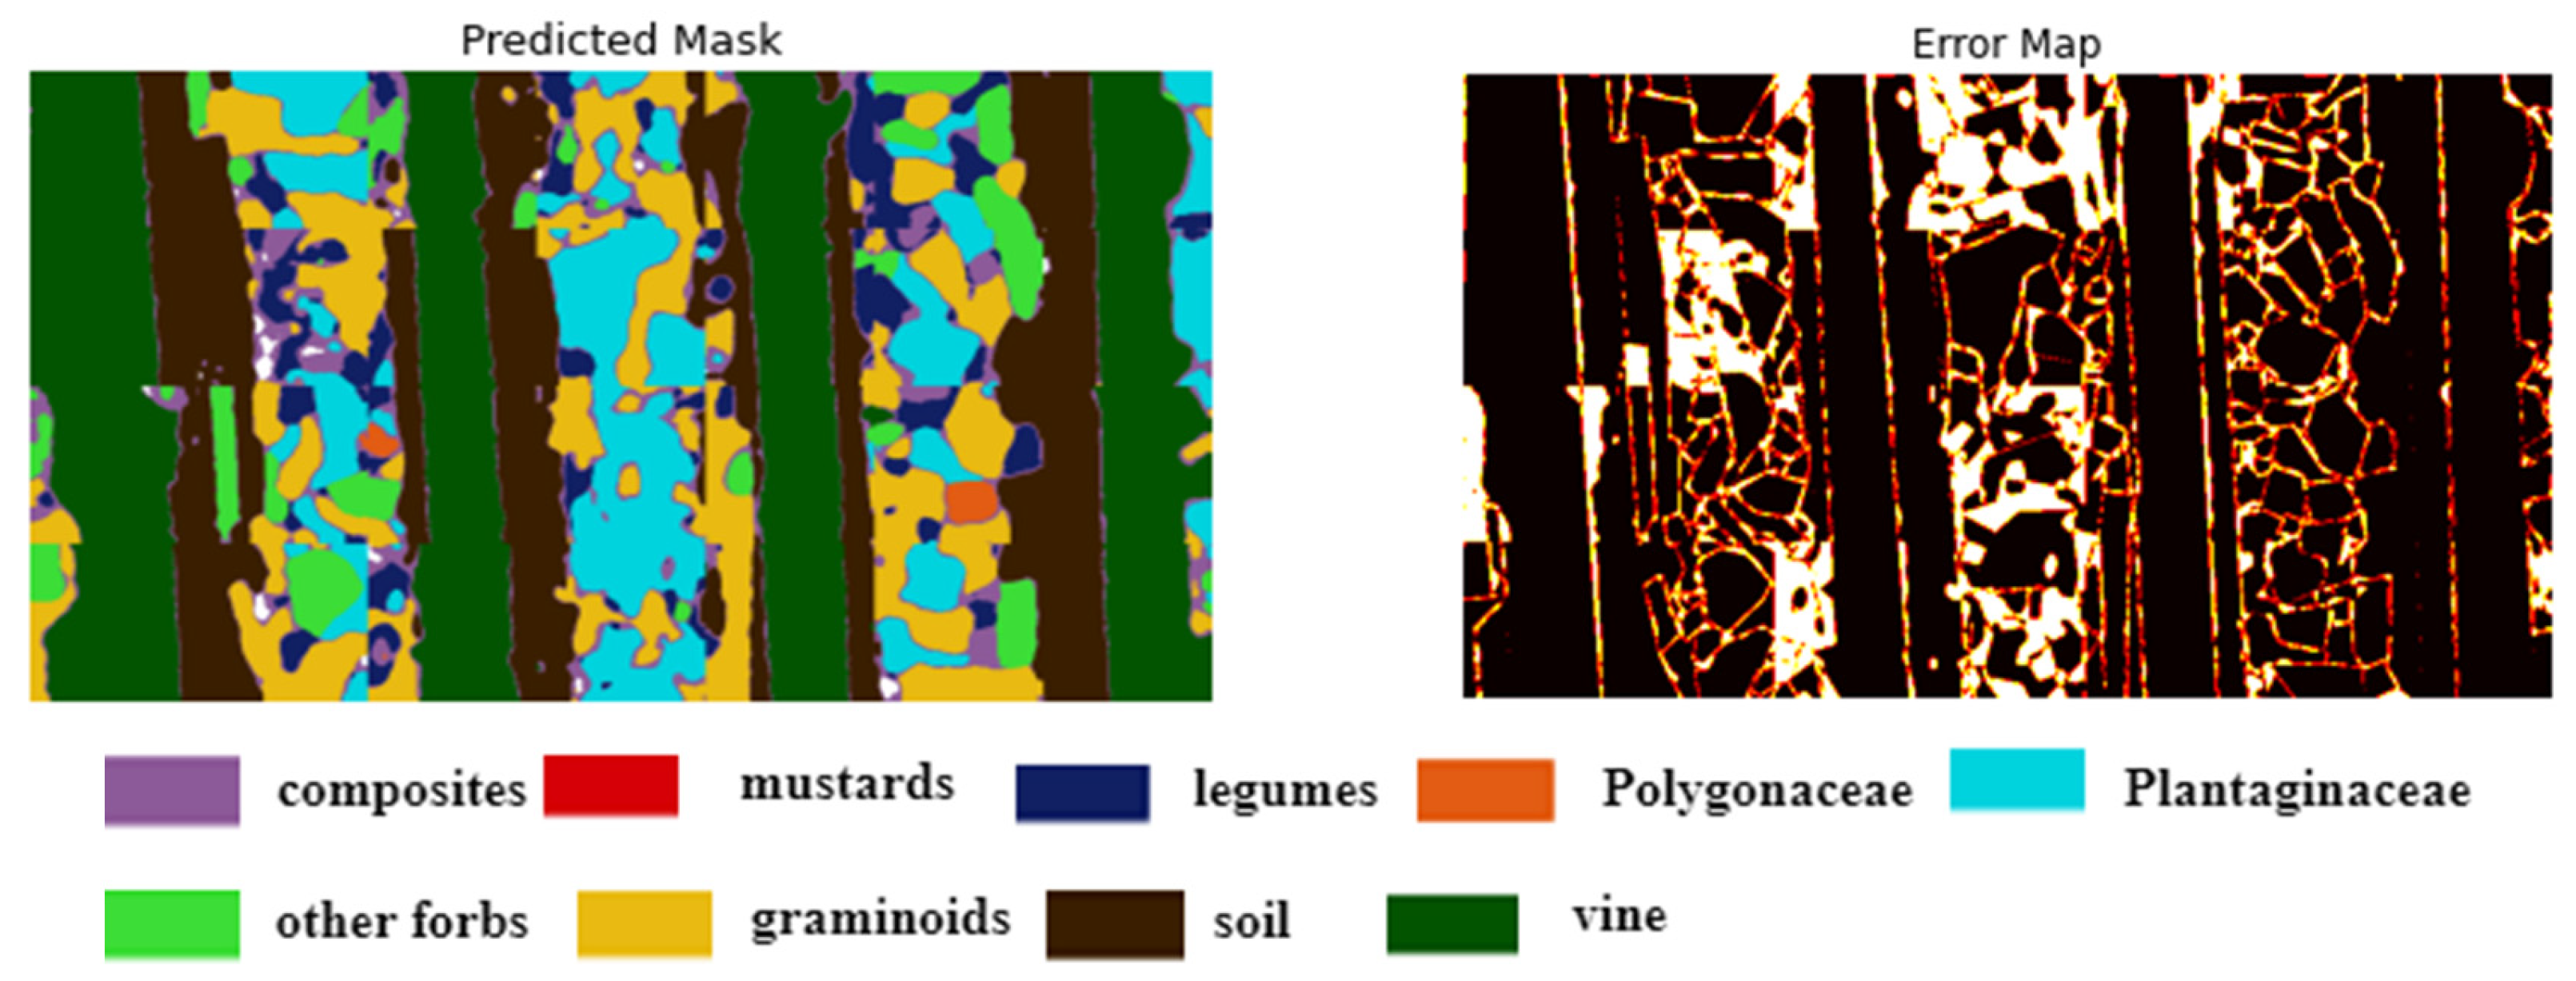

Table 1.
Presents the coverage area distribution for various classes in different images, measured as a percentage. Each row represents a distinct image, while the columns indicate the coverage area percentage for different classes, including graminoids, forbs (composite, mustards, legumes, Polygonaceae, Plantaginaceae, and other forbs), vine, and soil respectively.
| Image | composite (%) | mustards (%) | legumes (%) | Polygonaceae (%) | Plantaginaceae (%) | other forbs (%) | graminoids (%) | soil (%) | vine (%) |
| 1 | 14.56 | 0.18 | 0.54 | 0.38 | 0.62 | 20.06 | 3.09 | 9.92 | 29.18 |
| 2 | 7.12 | 0.11 | 0.27 | 1.50 | 0.37 | 1.03 | 6.44 | 8.85 | 25.54 |
| 3 | 7.07 | 0.00 | 7.54 | 1.91 | 18.42 | 7.73 | 15.25 | 16.44 | 25.32 |
| 4 | 8.23 | 0.04 | 6.39 | 5.47 | 12.10 | 2.90 | 13.95 | 19.68 | 28.29 |
| 5 | 7.07 | 0.00 | 7.54 | 1.91 | 18.42 | 7.73 | 15.25 | 16.44 | 25.32 |
| 6 | 8.22 | 0.04 | 6.39 | 5.47 | 12.10 | 2.90 | 13.95 | 19.68 | 28.29 |
| 7 | 4.30 | 0.01 | 0.19 | 0.11 | 6.18 | 12.94 | 24.22 | 4.75 | 21.69 |
| 8 | 11.32 | 0.02 | 7.09 | 6.90 | 6.86 | 7.84 | 11.97 | 15.91 | 31.06 |
| 9 | 7.64 | 0.00 | 3.69 | 0.87 | 11.68 | 15.48 | 19.85 | 16.77 | 23.76 |
| 10 | 14.56 | 0.18 | 0.54 | 0.38 | 0.62 | 20.06 | 3.09 | 9.92 | 29.18 |
| 11 | 5.60 | 0.01 | 2.51 | 2.81 | 10.70 | 9.98 | 21.69 | 17.73 | 28.39 |
| 12 | 5.72 | 0.00 | 3.81 | 3.67 | 10.71 | 4.19 | 16.06 | 21.83 | 33.90 |
| 13 | 24.56 | 0.00 | 1.64 | 0.29 | 0.95 | 15.70 | 20.71 | 0.92 | 24.24 |
| 14 | 8.14 | 0.00 | 5.25 | 0.30 | 12.59 | 4.98 | 14.86 | 23.11 | 30.42 |
| 15 | 12.87 | 0.05 | 1.71 | 1.207 | 1.52 | 23.50 | 3.65 | 7.76 | 19.29 |
| 16 | 4.31 | 0.01 | 0.19 | 0.11 | 6.18 | 12.94 | 24.22 | 4.75 | 21.69 |
| 17 | 8.98 | 0.26 | 0.25 | 2.45 | 0.04 | 11.97 | 7.64 | 13.33 | 27.78 |
| 17 | 7.37 | 0.22 | 0.25 | 0.11 | 1.46 | 2.98 | 4.60 | 20.64 | 29.31 |
| 18 | 12.87 | 0.05 | 1.71 | 1.20 | 1.52 | 23.50 | 3.65 | 7.76 | 19.29 |
| 19 | 8.98 | 0.26 | 0.25 | 2.46 | 0.05 | 11.97 | 7.64 | 13.33 | 27.78 |
| 20 | 7.07 | 0.00 | 7.54 | 1.91 | 18.42 | 7.73 | 15.25 | 16.44 | 25.32 |
| 21 | 8.23 | 0.04 | 6.39 | 5.47 | 12.10 | 2.90 | 13.95 | 19.68 | 28.29 |
| 22 | 11.32 | 0.03 | 7.09 | 6.90 | 6.86 | 7.84 | 11.97 | 15.91 | 31.06 |
| 23 | 5.60 | 0.02 | 2.51 | 2.81 | 10.70 | 9.98 | 21.69 | 17.73 | 28.39 |
| 24 | 5.72 | 0.00 | 3.81 | 3.67 | 10.71 | 4.19 | 16.06 | 21.83 | 33.90 |
Table 2.
Performance Metrics of UNet Semantic Segmentation Models with Different Backbone Architectures and without.
Table 2.
Performance Metrics of UNet Semantic Segmentation Models with Different Backbone Architectures and without.
| Backbone | Accuracy | Precision | Recall | F1 Score | Mean IOU | Jaccard Score |
|---|---|---|---|---|---|---|
| ResNet | 80.0 | 79.8 | 79.3 | 72.1 | 50.5 | 63.1 |
| EfficientNet B0 | 85.4 | 84.97 | 75.9 | 85.4 | 59.8 | 73.0 |
| Inception V3 | 82.9 | 82.3 | 82.6 | 82.8 | 53.8 | 66.4 |
| DenseNet | 83.6 | 83.9 | 83.4 | 83.7 | 52.1 | 65.1 |
| Without Backbone | 78.0 | 77.9 | 77.8 | 78.5 | 48.9 | 61.2 |
|
Accuracy: This metric measures the overall correctness of the segmentation by calculating the ratio of correctly predicted pixels to the total number of pixels. Precision: Precision quantifies the model’s ability to correctly identify positive predictions among all predicted positives. It’s calculated as the ratio of true positives to the sum of true positives and false positives. Recall: Recall, also known as sensitivity, measures the ability of the model to detect all relevant instances of the class in the image. It’s calculated as the ratio of true positives to the sum of true positives and false negatives. F1 Score: The F1 score is the harmonic mean of precision and recall. It provides a balanced measure between precision and recall and is calculated as 2 * (precision * recall) / (precision + recall). Mean IoU: Mean IoU calculates the average IoU across all classes. It’s a popular metric for semantic segmentation tasks as it provides an overall measure of segmentation accuracy across different classes. Jaccard Score (IoU): The Jaccard score, or Intersection over Union (IoU), measures the ratio of the intersection of the predicted and ground truth segmentation masks to their union. It evaluates the overlap between the predicted and ground truth regions. | ||||||
Disclaimer/Publisher’s Note: The statements, opinions and data contained in all publications are solely those of the individual author(s) and contributor(s) and not of MDPI and/or the editor(s). MDPI and/or the editor(s) disclaim responsibility for any injury to people or property resulting from any ideas, methods, instructions or products referred to in the content. |
© 2024 by the authors. Licensee MDPI, Basel, Switzerland. This article is an open access article distributed under the terms and conditions of the Creative Commons Attribution (CC BY) license (https://creativecommons.org/licenses/by/4.0/).
Copyright: This open access article is published under a Creative Commons CC BY 4.0 license, which permit the free download, distribution, and reuse, provided that the author and preprint are cited in any reuse.


