
Submitted:
05 January 2024
Posted:
08 January 2024
You are already at the latest version
Abstract
As urbanization has accelerated, China has started to build smart cities, which have formed smart city clusters. It is critical to coordinate development within smart city clusters to enhance the efficiency of city cluster construction. From the perspective of demographic economics, this study innovatively constructed an evaluation system for the coordinated development of smart city clusters and utilized the coupled coordination degree model to conduct an in-depth study of smart city clusters in Jiangsu Province. The results show that there are clear differences in the development between the three regions of Jiangsu Province: Southern Jiangsu, Central Jiangsu, and Northern Jiangsu. The development within Jiangsu Province is imbalanced, where the overall development trend is high in the southern region and low in the northern region. The main driving factors include geography, the Matthew effect, game thinking, and industrial structure. Accordingly, the results suggest the following recommendations for the coordinated development of smart city clusters: strengthening cross-regional cooperation, promoting data sharing and interoperability, deepening synergistic industrial development, and expanding innovation capacity.
Keywords:
smart city cluster
; coordinated development
; evaluation index system
; coupled coordination degree model
; Jiangsu Province
1. Introduction
With the accelerating pace of urbanization in China, the demographic, economic, social, ecological[1], and environmental elements of cities are undergoing rapid transformation. With the rapid development of new-generation information technology, China started constructing pilot smart cities as early as 2012 to better cope with the new challenges brought about by such transformations[2]. At present, there is no consensus among scholars on the definition of smart cities[3], and there are various perspectives from which to define the term, including technology, urban development[4], "humanism"[5], and systems engineering[6]. However, scholars agree that smart cities are inevitable products of urbanization and a path to achieve high-quality urban development. Building smart cities can help planners intelligently manage and optimize all aspects of the city, improve the efficiency of urban operation, and improve the quality of life for urban residents[7]. Since 2019, cities in Jiangsu Province have introduced plans to transform themselves into smart cities. After several years of construction, relatively well-functioning smart city clusters were established. However, the development among these smart city clusters is imbalanced, which is not in line with China’s goal of coordinated regional development.
China has been promoting coordinated regional development in recent years, focusing on equity and efficiency to achieve the goal of balanced and high-quality development across all regions[8]. In 2010, Jiangsu Province proposed a strategy for coordinated regional development in 2010 to narrow the regional development gap[9]. In regional balanced development1, the local population, economy, and social development[10] are important factors and measurement indices. Therefore, this study constructs an evaluation index system from these three perspectives2, which includes a development index [11]and a degree of coordination index[12], to judge whether regional development is balanced. In the case of Jiangsu Province, factors such as the industrial structure, location, economic structure, and differences in domestic and foreign asset inputs lead to significant differences in development between urban agglomerations[13]. Therefore, this study takes Jiangsu Province as an example to study the balanced development of smart city clusters in the region. This study aims to scientifically assess regional development, which provides a basis for domestic and foreign government departments to formulate regional development policies in a scientific and reasonable manner and theoretical references for academic research on balanced regional development.
2. Review of evaluation studies on balanced regional development
An important objective of balanced regional development is the balance between regional coordination [14]and regional development. While there is no common definition of regional coordinated development in academia, its connotation has evolved with social practice. The focus of regional coordinated development in China lies in coordinating economic development. A report from the Twentieth National Congress of the CPC noted that "the state ensures that the national economy can realize coordinated development in proportion to its size through the auxiliary role of market regulation and the comprehensive balance of economic planning." With the deepening of reform and opening up, the economic and social development of China has become unbalanced and the level of development between different regions has gradually widened[15]. These disparities have led to many social problems, pushing the balanced development of regions to be one of the important goals on the government’s agenda. Quantitative evaluation of the level of regional coordinated development is an important part of applying theoretical research to social practice[16]. To create an index system[17], Chinese scholars mainly adopt three methods: theoretical analysis, frequency statistics, and principal component analysis[18]. Such an index system usually takes on the form of either a hierarchical index system or a comprehensive index system[19,20]. From a spatial perspective, researchers have analyzed at the country, geographic region, urban agglomeration, and administrative region levels, considering a variety of factors[21,22,23,24]. To evaluate the coordinated development of regions in China, Xu Yingzhi and Wu Haiming used the "four-point method," by constructing four evaluation subsystems of society, economy, ecology, and science and technology, covering ten levels of criteria and a total of 27 evaluation indices[25]. Zhang Chao constructed a regional coordinated development evaluation index system that encompassed five components, namely, public services, infrastructure, economic development, the ecological environment, and quality of life, and measured the regional coordinated development level of 30 provinces in China from 1996 to 2017[26]. Song Shengnan constructed eight first-level indices and 27 second-level indices of industrial structure, spatial connection, market development, infrastructure, public service, environmental protection, urban-rural integration, and development mechanisms to evaluate the regional coordinated development level of the Hefei Metropolitan Area[27]. These studies constructed different evaluation index systems depending on their study area and purpose, but the selection of the all the indices commonly reflect the concepts of hierarchy, diversity, and complexity. Population mobility highlights the comparative advantages of regional development[28], while economic development provides the material conditions for coordinated regional development[29]. However, studies on coordinated regional development have not considered the influence of demographic and economic factors in designing an index system[30].
The idea of a demographic economy originated with the emergence of mercantilists in the 16th century. Classical economists, including François Quesnay and William Peddie, considered demographic factors in the field of economics. These authors first discussed the relationship between wealth and population[31]. In subsequent studies, scholars such as David Ricardo, Thomas Robert Malthus, and Adam Smith proposed the theory of demographic economics based on the law of diminishing land harvest and the theory of value of labor[32]. After the 20th century, the study of Western demographic economics formed a neoclassical economic theoretical framework based on macroeconomics and microeconomics, which included the theory of neoclassical economics[33], the push-pull model, the quadratic exponential model[34], and Lee's migration theory[35]. Compared with those in Western countries, research on population economics in China began much later. After the reform and opening up, Chinese researchers and scholars systematically studied population economics theory by drawing on relevant theories from Western population economics[36]. Many scholars have studied regional coordinated development from the perspectives of the economy, population, resources, and the environment[37]. However, most studies focus on regional sustainable development from the perspective of the environmental sciences[38], and few studies address regional coordinated development by combining demographic and economic factors from the perspective of the social sciences[39]. Therefore, this study attempts to construct an evaluation framework for the population-economic-social development system and explore whether interregional development is balanced by comparing the coordination index with the development indices of cities in these regions[40].
3. Research methods and data sources
3.1. Construction of the evaluation index system
Building an index system is a core component of systematic evaluation and thus affects the reliability of the evaluation results. The regional population-economic-social development evaluation index system constructed in the study follows the following four principles[41]: 1)Representativeness: The selected indices must reflect the situation and characteristics of regional population-economic-social development to the maximum extent possible; 2)Operability: The indices should be selected in a simple and clear way in which the data are easy to collect and calculate; 3) Scientific Rigor: The indices must adopt scientific calculation methods; (4) Systematicity: There should be a certain degree of logic between indices that reflects the main characteristics of the demographic-economic-social subsystems from different aspects.
3.1.1. Construction of the evaluation index system for the population development subsystem
The population development subsystem is complex and contains many elements[42]. Under the primary index of the population development subsystem, this study constructed three secondary indices: population size, population quality, and population structure. The demographic factor itself has both natural and social attributes, corresponding to both the quantity and quality of the population. Population scale is then divided into four three-level indices: the number of births, the number of deaths, the household population at the end of the year, and the resident population at the end of the year. The quality of the population refers to the education level of the population, which is captured by three tertiary indices: the illiteracy and semi-illiteracy rate, the percentage of people with a bachelor's degree or higher, and the percentage of people with a high school education or lower. The population structure usually includes gender structure, age structure, and urban-rural structure, and encompassed six three-level indices: sex ratio at birth, ratio of 0-14 years old, ratio of 15-64 years old, ratio of 65 years old and above, population density, and ratio of the urban population. The results of the construction of the evaluation index system for the population development subsystem are shown in Table 1.
3.1.2. Construction of an evaluation index system for the economic development subsystem
Regional economic development includes both the quantitative and qualitative aspects of economic development of regions[43]. Under the first-level index of the economic development subsystem, the study constructs three second-level indices: economic scale, economic quality, and economic structure. Three third-level indices are divided under the second-level index of economic scale: year-end gross domestic product, general public budget revenue, and total industrial output value. These indices were selected to reflect the dimension of social activities and public life in a region from an economic perspective. Four tertiary indices were selected under the second-level index of economic quality: per capita GDP, GDP growth rate, per capita local financial revenue, and per capita gross industrial output value. The evaluation index system for the economic development subsystem are shown in Table 2.
3.1.3. Construction of an evaluation index system for social development subsystems
Social development generally includes many elements, such as politics, culture, ecology, and economy[44]. In this study, the elements of social development exclude the other two factors of the population and economy[45]. Under the first-level index of the social development subsystem, there are four second-level indices: infrastructure, culture and education, the medical system, and the ecological environment. Under the second-level index infrastructure, there are four third-level indices: road area per capita, public transportation vehicles per 10,000 people, Liquefied petroleum gas supply per 10,000 people, and water supply per capita. Under the second-level index culture and education, there are four tertiary indices: per capita financial expenditure on education, total number of students at each stage of schooling, total number of teachers at each stage of schooling, and number of books in public libraries per capita. There are five tertiary indices under the secondary index of healthcare: total number of hospitals and health centers, number of hospital beds per 10,000 people, percentage of people enrolled in basic medical insurance, percentage of people enrolled in work-related injury insurance, and percentage of people enrolled in worker's unemployment insurance. The ecological environment is captured by three tertiary indices: sewage treatment rate, amount of domestic garbage removal, and per capita green space in parks. The results of constructing the evaluation index system for the social development subsystem are shown in Table 3.
3.2. Construction of the coupled and coordinated development evaluation model
3.2.1. Determination of weights using the entropy weight method
When choosing methods to measure the level of coordinated development of a region, we chose to use the entropy weight method[46], which is relatively accurate and objective. The steps involved in this method are as follows.
Step 1: Construct the initial judgment matrix. The evaluation target of region n for year r is s, and there are a total of m evaluation indices; then, there is a judgment matrix.
Step 2: Conduct dimensionless quantization of indices. Since the selected indices contain positive and negative indices, each index has a different magnitude and unit. To facilitate uniform calculation, the indices are made dimensionless using the method of polarity transformation. A new matrix is obtained:
Step 3: Calculate the entropy weight of the j-th index in the q-th year (0≤<1). is the weight of the j-th index, k=1/ln(m), k>0, and m is the number of indices
Step 4: Calculate the coefficient of variation () for index (column) j.
Step 5: Calculate the weight of the j-th index (column).
Step 6: Calculate the final evaluation target weights for region i
3.2.2. Modeling the degree of coordination of coupled demographic-economic-social systems
The coupling coordination degree model is used to analyze the level of coordinated development[47]. The coupling degree refers to the degree of mutual influence between two or more systems and can reflect the degree of connection between systems. The degree of benign coupling development between coordination degree subsystems can reflect the degree of coordination between systems. The study constructs the coupling coordination degree model of the population-economy-society (PES) integrated system to judge the coordination level status of social development in district cities. The standardized population, economic, and social system indices and the multiplication of the weights of each index can be accumulated to obtain the score of each subsystem, which is denoted as α, β and λ, respectively.
PES (population-economy-society) system development coupling index:
To measure the degree of coordination between subsystems, a development index T and a coordination index D are introduced.
Calculation of the PES Development Index () and coordination index (named ):
Development indices:
Coordination index:
3.3. Study area and data sources
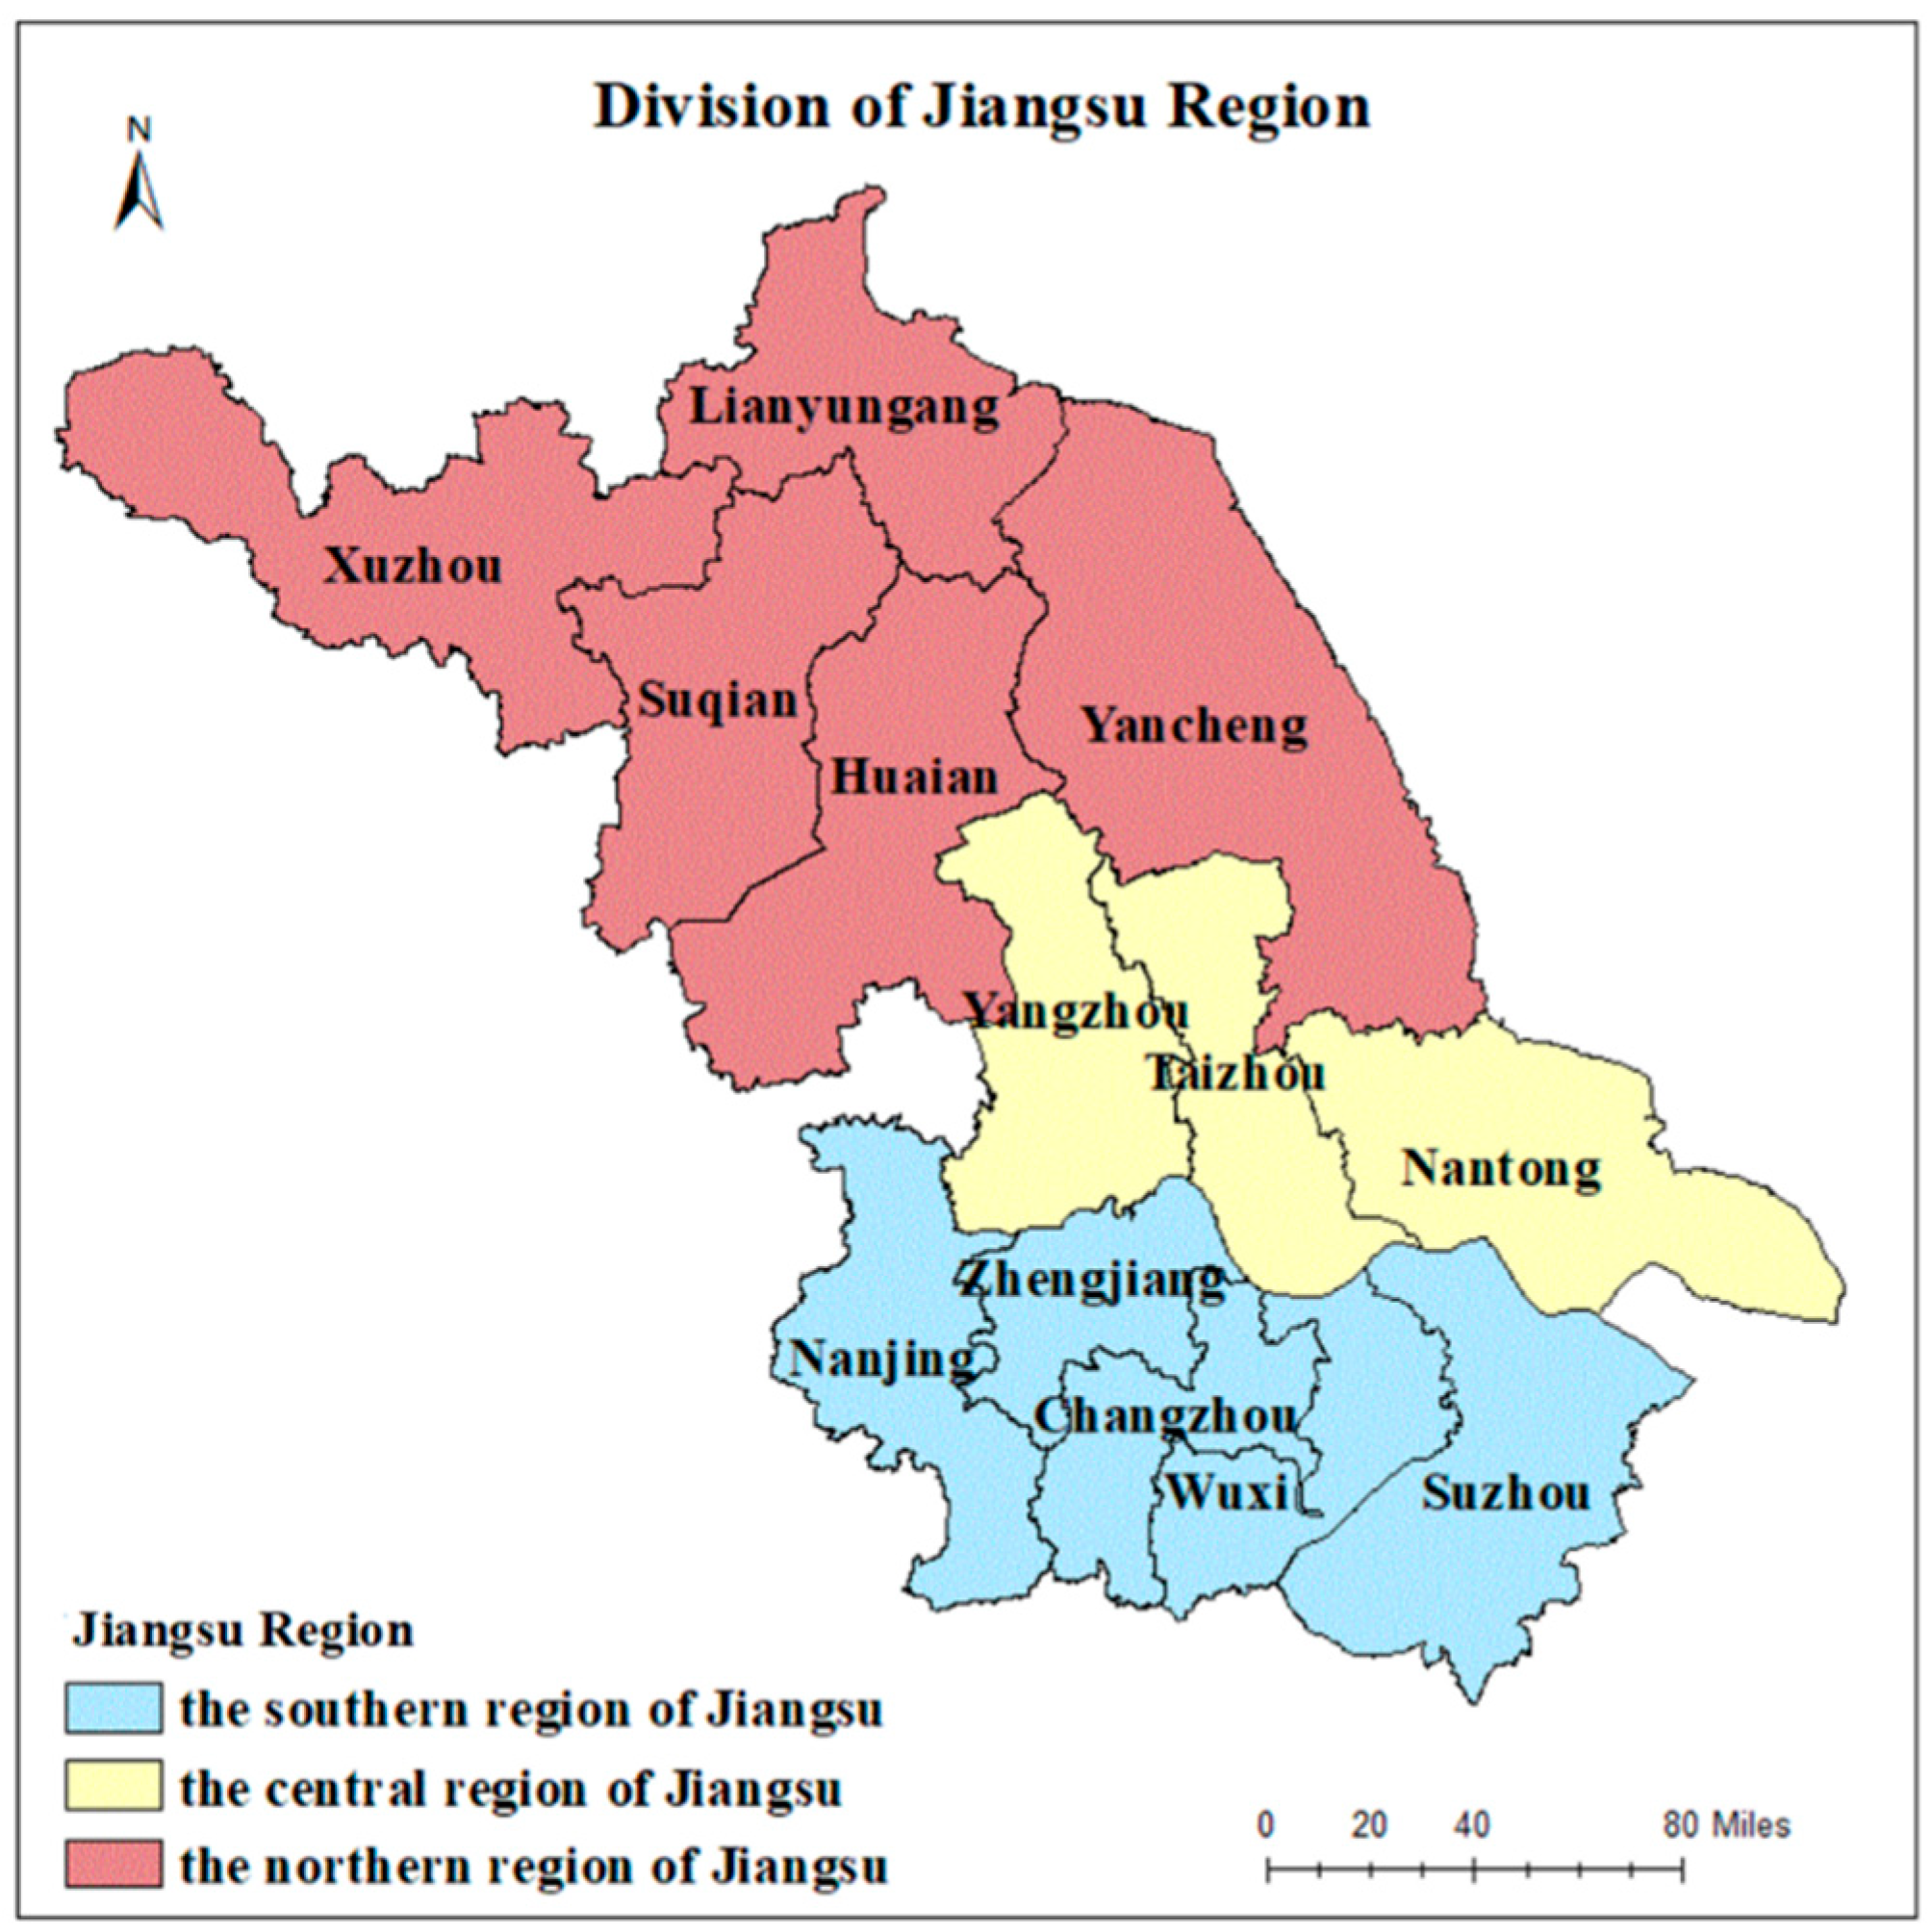
Jiangsu Province is located in the center of the eastern coast of mainland China, with an area of approximately 107,200 square kilometers, which accounts for 1.12% of the country's total area. The province also has the smallest per capita land area in China. The terrain of Jiangsu Province is dominated by plains, with the proportion of plains is the highest in the country. Jiangsu Province governs a total of 13 district cities. According to the geographical location of its district-level cities, Jiangsu Province can be divided into three regions: Southern Jiangsu, Central Jiangsu, and Northern Jiangsu. South of the Yangtze River is the Southern Jiangsu region, north of the Huai River is the Northern Jiangsu region, and between the Yangtze River and the Huai River is the Central Jiangsu region. The Southern Jiangsu region includes the five cities of Nanjing, Suzhou, Wuxi, Changzhou, and Zhenjiang; the Jiangsu region includes the three cities of Yangzhou, Taizhou, and Nantong; and the Northern Jiangsu region includes the five cities of Xuzhou, Lianyungang, Suqian, Huai'an, and Yancheng. These three regions are characterized not only by geographical and cultural differences but also by significant differences in their levels of economic development. Therefore, Jiangsu Province is selected as the research object for regional coordinated development because it is diverse and representative. This research provides some reference and guidance for research on regional coordinated development strategies in Jiangsu Province, in China and even worldwide.
The research data come from the annual statistical yearbooks published on the official website of the Jiangsu Provincial Bureau of Statistics. To study the balanced regional development of Jiangsu Province during the 12th and 13th Five-Year Plan periods, the statistical data from 2010, 2015, and 2020 were selected for analysis.
Figure 1.
Location map of Jiangsu Province divided into southern, central and northern Jiangsu Province.
Figure 1.
Location map of Jiangsu Province divided into southern, central and northern Jiangsu Province.
4. Analysis of results
4.1. Index weighting values
The final results of the weight values of the indices for the demographic, economic, and social systems for 2010, 2015, and 2020 were calculated using the entropy weighting method and are shown in Table 6.
4.2. Development indices
According to the formula of the development index, the PES development indices of the 13 cities in Jiangsu Province in 2010, 2015, and 2020 were obtained. According to the classification criteria of the development indices in Table 4, the development levels of the 13 cities in Jiangsu Province in the corresponding years were determined, as shown in Table 7. Combined with the spatial-temporal evolution of the development indices of the PES system in Jiangsu Province (Figure 2), the following conclusions can be drawn.
In 2010, Suzhou had the highest level of development at 0.71, which indicates medium-high development. The second and third ranked cities were Nanjing and Wuxi, with values of 0.65 and 0.63, respectively, which indicate high development levels. Moreover, all three of these cities are located in Southern Jiangsu. In Central Jiangsu, except for the city of Taizhou, which has an extremely low development level, Nantong and Yangzhou have medium-low and lower development levels, respectively. In Northern Jiangsu, except for Xuzhou, which is at the medium-low development level, the remaining four cities have an extremely low level of development. In 2010, the development of the three regions was extremely uneven, with a large development gap. Generally, Southern Jiangsu has a significantly higher level of development than that of the Central Jiangsu and Northern Jiangsu.
During the 12th Five-Year Plan period, Jiangsu Province proposed the development goal of “promoting scientific development and building a better Jiangsu.” After the 12th Five-Year Plan period, the city with the highest level of development according to the PES system was still Suzhou in 2015, with a score of 0.77, which was six percentage points higher than that of 2010 and remains at the middle-high development level. Nanjing had a score of 0.70, which is five percentage points higher than its score in 2010, taking it from the higher development level to the middle-high development level. Wuxi had a score of 0.60, which is three percentage points lower than that of its score 2010 but is still within the middle-high development level. Overall, the development level of Southern Jiangsu Province is higher than that of other areas within Jiangsu. The development level in cities in Central and Northern Jiangsu is the same as that in 2010, which was not high overall. Thus, during the 12th Five-Year Plan period, while Jiangsu Province grew overall, the level of economic development within the province was still unbalanced due to the strong level of development in Southern Jiangsu but the relatively weak development in Central and Northern Jiangsu. In particular, four cities with extremely low development levels exist in Northern Jiangsu.
During the 13th Five-Year Plan period, Jiangsu Province proposed the “Strong, Rich, Beautiful, and High” development agenda, which specifically refers to “Strong Economy,” “Rich People,” “Beautiful Environment,” and “High Social Civilization.” After the development of the 13th Five-Year Plan period, the city with the highest development level in the PES system was still Suzhou, and the city with the next highest development level was Nanjing in 2020; both of these cities had medium-high development. Taizhou in the central region of Jiangsu Province has risen from an extremely low level of development to a medium-low level of development, which means that there are no remaining cities in Central Jiangsu with an extremely low level of development. In addition, in Northern Jiangsu, there remains four cities with extremely low levels of development. Overall, the spatial distribution of the PES development indices in Jiangsu Province is somewhat stable. The areas with higher levels of development are mainly in Southern Jiangsu. The number and spatial distribution of cities with an extremely low level of development, which are mainly concentrated in Northern Jiangsu, remained relatively consistent over the 2010-2020 period.
4.3. Coordination indices
According to the system coupling coordination degree calculation formula, the PES coupling coordination degree values of 13 cities in Jiangsu Province in 2010, 2015, and 2020 were derived, and the rankings are shown in Table 8. Combined with the distribution map of the PES system coupling coordination degree indices of each city in Jiangsu Province from 2010 to 2020 (Figure 3), it can be seen that the coupling coordination degree value of Suzhou was the highest in 2010, at 0.84, which is within the well-coordinated development stage. Therefore, Nanjing and Wuxi were both in the intermediate coordinated stage of development. In Southern Jiangsu, one city is in the stage of well-coordinated development, two cities are in the stage of intermediate coordinated development, and two cities are in the stage of basic coordinated development. In Central Jiangsu, one city is in the stage of basic coordinated development (Nantong), and two cities are in the stage of barely coordinated development. In Northern Jiangsu, one city is in the stage of barely coordinated development (Xuzhou), and four cities are in the stage of fragile coordinated development. Accordingly, the coupled coordination of population, economic, and social development systems in a city is strongly and positively related to the city's overall development level. After the 12th and 13th Five-Year Plans, Suzhou had the highest coupling coordination degree of 0.87 in 2020, which was three percentage points greater than that in 2010, and was in a well-coordinated development stage. The coupling coordination degree value of Nanjing is 0.85. Compared with 2010, it improved by six percentage points and is in the stage of well-coordinated development. In Central Jiangsu, Nantong is still at the primary coordination stage, with a coupling coordination value of 0.63, while Taizhou and Yangzhou are at the barely coordinated stage. Nantong benefited from the influence of the Shanghai Economic Circle, and the coordinated development of population, economy, and society was better than that of the other two cities. In Northern Jiangsu, Xuzhou is in the barely coordinated stage, and Yancheng improved from the fragile coordinated stage in 2010 to the barely coordinated stage in 2020, which was the result of rapid development within the city in the past few years. The remaining cities in Northern Jiangsu (Huai'an, Lianyungang, and Suqian), are still in the fragile coordination stage.
Achieving balanced regional development in Jiangsu Province faces two problems. First, the regional development of Jiangsu Province is unbalanced, and there are clear coordinated development blocks in Southern Jiangsu around Suzhou and Nanjing, barely coordinated development clusters in Central Jiangsu, and fragile coordinated development centers in Northern Jiangsu. Second, progress in closing the development gap in Jiangsu Province has been slow. Only Nanjing progressed from the intermediate coordination stage in 2010 to the well-coordinated coordination stage in 2020, and Yancheng improved from the fragile coordination stage to the barely coordinated stage over the same period. Otherwise, there was no change in the coupled coordination status of the remaining cities in the region.
5. Discussion
Balanced and high-quality development of urban agglomerations is an important component and the foundation for building a new development pattern[51]. Thus, it is crucial to explore the reasons for the uneven development of urban agglomerations and discover countermeasures to establish new high-quality development patterns. The present study showed that the uneven development of city clusters in Jiangsu Province is mainly due to the following four reasons:
5.1. Geographic differences
Southern Jiangsu belongs to the core of the Yangtze River Delta Economic Circle. Influenced by the Shanghai area, from the 1980s, Southern Jiangsu vigorously developed township and village enterprises, established development zones, and attracted foreign investment[52]. These changes led to industrial and technological transfer throughout the Shanghai area, which was a major catalyst for economic development in Southern Jiangsu. This is a significant driving factor that enabled Southern Jiangsu to be in the leading position in the province in terms of economic development. Central Jiangsu has also achieved a certain degree of development under the influence of the Nanjing Metropolitan Area and the Yangtze River Delta Economic Belt[53]. However, compared with Southern Jiangsu, there remains room for improvement in terms of economic development. Northern Jiangsu is far from Shanghai, Nanjing, and other economic centers, so geographic is a disadvantage. There are no large and thriving cities to drive development[54], and development is lagging behind that of other cities. Geographic differences are a significant factor in the uneven regional development in Jiangsu Province.
5.2. The Matthew Effect
The Matthew effect is a theory of accumulation of dominance that is used to describe the phenomenon of "the strong becoming stronger and the weak becoming weaker"[55]. This theory has been widely applied to research in various disciplines[56]. The "Matthew effect," when applied to regional development, refers to the fact that regions with a high level of regional development will continue to grow, which means that the level of development in Southern Jiangsu will always be higher than that in Central Jiangsu and Northern Jiangsu[57]. Since the reform and opening up, Southern Jiangsu has accumulated wealth that is incomparable to that of Central Jiangsu and Northern Jiangsu and has formed a solid economic foundation of technology, capital, and talent. This solid good foundation provides the necessary conditions for all kinds of innovation[58], which then attracts more resources, creating a "siphon" phenomenon where Southern Jiangsu absorbs more advanced technology, talented people, and high-quality capital, accelerating further development[59]. The economic foundation of Northern Jiangsu has always been inferior to that of Southern Jiangsu. Therefore, this area is unable to attract production factors; thus, its development continues to lag behind. The difference in economic foundations has led to the Matthew effect in regional development, which exacerbates the unevenness of regional development.
5.3. Game thinking
Economic development is, to some extent, linked to the performance of local governments. In practice, local authorities tend to maximize their own interests[60], and economically developed regions may believe that “gaming” is preferable to “mutual benefit" [61]. This leads to a lack of mobility of production factors and inter-regional links are weak, which hinders the formation of effective cooperation mechanisms. Thus, these inter-regional barriers make it difficult to achieve balanced development within Jiangsu Province. Game thinking is one plausible explanation for unbalanced regional development in Jiangsu Province[62].
5.4. Differences in industrial structure
Industrial structure refers to the proportional relationship between industries in the national economy and the connections between them[63]. According to data from the Jiangsu Provincial Statistical Yearbook, the proportion of the output value of primary and secondary industries in each region of Jiangsu Province from 2010 to 2020 decreased over time while the proportion of the output value of tertiary industry increased. However, in terms of industrial structure, the proportion of the output value of primary and secondary industries in Southern Jiangsu is much smaller than that in Central and Northern Jiangsu, while the proportion of the output value of tertiary industry is much greater than other areas[64]. The difference in industrial structure has caused different speeds of economic development between the three major regions of Jiangsu Province[65], which have resulted in unbalanced regional economic development.
6. Conclusions and Recommendations
The development and coordination indices of the three regions in Jiangsu Province were analyzed in depth. There are clear differences in the development levels of the three regions, with the overall development level of Southern Jiangsu being higher than that of Central and Northern Jiangsu. In terms of the degree of coupling and coordination, the overall development of Southern Jiangsu is better than that of Central and Northern Jiangsu. Throughout the history of economic and social development in China and the West, due to different factors, such as location, resource endowment, productivity level, and social system, the problem of uneven regional development has existed for a long time. This problem should be addressed in a scientific manner[66]. Given the context of smart cities developing worldwide, smart city clusters will ultimately form. To increase the efficiency of such development [67], it is important to balance the development between city clusters. To foster coordinated development among smart cities and city clusters within a region, this study proposes the following recommendations:
6.1. Strengthen cross-regional cooperation
Strengthening regional cooperation is important to ensure balanced development between city clusters[68]. Therefore, it is necessary to clearly define and plan development strategies for each city, breakdown geographical barriers, and deepen cooperation among cities in the region. By facilitating the flow of production factors and effectively integrating various types of resources, each region can leverage their respective comparative advantages and maximize their benefits through an optimal division of labor. Moreover, deepening cross-regional cooperation between city clusters can solve common problems in building smart cities[69]. Smart cities should share their successful experiences and best practices, specify the goals and areas of cooperation, and collectively explore the common challenges and solutions in the construction of smart cities. By strengthening cooperation among cities, duplication of resources and waste can be avoided, raising the overall efficiency of smart city construction, respective development capacities, and mutual benefits[70].
6.2. Promote data sharing and interoperability
The construction of smart cities involves the collection and processing of a large amount of data [71], including transportation data, environmental data, and energy data. Thus, data sharing and interoperability are important components of creating smart cities. Cities can establish a data sharing platform to achieve data interoperability and sharing. The data sharing platform can include functions such as data collection, storage, processing, and visualization[72]. Cities can share their data resources with other cities through this platform, improving the efficiency of data utilization. In addition, data sharing can promote exchanges and cooperation between cities and foster synergistic development[73]. This approach can better utilize data resources and improve the efficiency of urban management and decision-making.
6.3. Deepen industrial synergistic development
The synergistic development of industries among city clusters is important for the construction of smart cities, which involves the integrated development of several industries, including transportation, energy, and the environmental. City clusters within the same region can strengthen cooperation in these sectors to create industrial synergy[74]. For example, in transportation, cities can jointly develop intelligent traffic management systems to share traffic information and improve the efficiency of traffic management[75]. In energy, cities can collectively promote clean energy to reduce energy consumption and pollution emissions[76]. In environmental protection, cities can work together to carry out environmental monitoring and pollution control[77]. The competitiveness of smart city construction can be enhanced through collaborative industrial development.
6.4. Foster innovation capacity
Enhancing urban innovation capacity is key to the construction of smart cities[78], which requires innovative thinking and technology[79]. Thus, city clusters within the same region can create and strengthen innovation mechanisms and institutions to cultivate innovation capacity. Specifically, cities should increase their investment in science and technology innovation to support the relevant enterprises and scientific research institutions. Cities should also strengthen the development of talent, establish a knowledge base for smart city construction, and cultivate a group of smart city construction professionals with innovative mindsets and practical skills. In addition, cities should adopt a healthy talent management system to absorb and retain talent. Furthermore, cities should increase cooperation with international advanced science and technology enterprises and research institutions as doing so can enhance urban innovation capacity[80].
Author Contributions
Bing Liang and Guoqing Shi contributed to the study conception and design. Material preparation, data collection and analysis were performed by Taotao Ye and Kexin Zhou. The first draft of the manuscript was written by Bing Liang . All authors read and approved the final manuscript.
Funding
This work was Supported bye the Fundamental Research Funds for the Central Universities :Climate Migration Types and Risk Management in Coastal Areas. (grant number B230205032); &Postgraduate Research & Practice Innovation Program of Jiangsu Province :Climate Migration Types and Risk Management in Coastal Areas. (grant number: 422003151); and The Key Research Project of the National Foundation of Social Science of China:Community Governance and Post-relocation Support in Cross District Resettlement [grant number 21&ZD183].
Institutional Review Board Statement
The local Ethics Committee of Hohai University approved the consent form.
Data Availability Statement
The data and materials are available from the corresponding author on reasonable request.
Conflicts of Interest
The authors declare no conflict of interest.
| 1 | Regional balanced development in this study refers to the balance between regional coordination and regional development. For the purpose of this study, regional balanced development refers to the balance of inter-regional development, and regional coordinated development refers to the coordination of demographic, economic, and social development factors within cities, and the balance of regional development is measured through the development index of urban development and the degree of coupled coordination. |
| 2 | There are various studies on the connotation of social development. In this paper, social development refers to the ecological environment, infrastructure, social security system, scientific and educational development of the whole society, excluding population development and economic development. Essentially, social development is the social attributes of the environment and resources. The study of population-economic-social development system in this paper belongs to the research subfield of population economics. |
References
- Jiang Changliu, X.Y., Jiang Chengtao, Analysis of the Promoting Effect of New Urbanization Innovation with Inclusive Connotation. Finance and Accounting Monthly, 2020. 2020, (23): p. 124-133.
- Xiang Yuqiong, J.Y., From Technological Transformation to Value Co creation: The Development and Evolutionary Logic of Smart Communities: A Diachronic Study Based on the "Palm Cloud Community" in Qixia District, Nanjing. Administrative Forum, 2023. 30 (06): p. 142-149.
- Wen, G., Digital Retina, Evolving Smart Cities from "Clear" to "Understanding" Science China, 2020. (12): p. 30-31.
- Wang Bo, L.P., Zhen Feng, Urban Geography Research in a Smart Society from the Perspective of Resident Activities Geography Research, 2018. 37 (10): p. 2075-2086.
- Del Bo, C., Smart Cities: Is It Just a Fad? [electronic resource]. Scienze regionali : Italian Journal of regional Science, 2018. 19(1).
- Wu Zhiqiang, P.Y., Ye Qiming, Kong Lingyu, Intelligent City Evaluation Index System: Development Process and Application. Engineering geology, 2016. 2 (02): p. 105-137.
- Dongqi, B., Empowering High Quality Development of Commercial and Logistics Enterprises with Smart Cities: Analysis of Effects and Mechanisms. Price Theory and Practice, 2023. (05): p. 188-191.
- Deng Xiangzheng, L.L., Wu Feng, Wang Zhenbo, He Shujin, Regional Balanced Development in China from the Perspective of Development Geography. Journal of Geography, 2021. 76 (02): p. 261-276.
- Zeng Mingxing, C.L., Ding Jinhong, Regional Equilibrium Issues and Solutions in Population Development in China. Ningxia Social Sciences, 2019. No.214 (02): p. 101-108.
- Zhou Lei, S.N., Miao Yefeng, Polarization and Diffusion: The Role of the Yangtze River Delta in Regional Balanced Development: Evidence from the Yangtze River Delta and Urban Agglomeration in the Middle Reaches of the Yangtze River Resources and Environment of the Yangtze River Basin, 2021. 30 (04): p. 782-795.
- Hickel, J., The sustainable development index: Measuring the ecological efficiency of human development in the anthropocene. Ecological economics, 2020. 167: p. 106331. [CrossRef]
- Shi, T., et al., Coupling coordination degree measurement and spatiotemporal heterogeneity between economic development and ecological environment----Empirical evidence from tropical and subtropical regions of China. Journal of Cleaner Production, 2020. 244: p. 118739. [CrossRef]
- Mingguang, H., Differences in Regional Models of Vocational Education from the Perspective of Economic Development Imbalance: A Case Study of Jiangsu's "North South Cooperation" Vocational Education Model Social Scientist, 2008. No.135 (07): p. 127-129.
- Meng Yuenan, X.C., Theory and Practice of Regional Coordinated Balanced Development in China. Gansu Social Sciences, 2020. (04): p. 188-195.
- Xia Wanjun, Y.G., Research on the Imbalance of Regional Economic Development in China. Journal of Anhui Normal University (Humanities and Social Sciences Edition), 2018. 46 (04): p. 111-121.
- Li Yuwen, C.H., Xu Zhongmin, Research on Integrated Water Resource Management Theory and Quantitative Evaluation Application: A Case Study of the Heihe River Basin. China Industrial Economy,, 2010. No.264 (03): p. 139-148.
- Li Jin, C.Y., Sun Changqing, Research on Regional Economic Differences and Coordinated Development in Henan Province. Economic Journal, 2018. 35 (02): p. 20-26.
- Xiong Ying, W.K., Guo Xian, Comprehensive Evaluation and Zoning of Economic Differences in Hunan Province Regional Research and Development, 2004. (03): p. 37-40.
- Wu Yuming, Z.Y., Research on the Coupling and Coordinated Development of Regional Economic Growth and Environment in China. Resource Science, 2008. (01): p. 25-30.
- Xiaolin, L., Quantitative evaluation of coordinated development of regional population, resources, environment, and economic systems. Statistics and Decision Making, 2007. No.229 (01): p. 64-65.
- Wang Siwei, L.Y., Measurement of Regional Coordinated Development Level from the Perspective of High Quality Development Statistics and Decision Making, 2023. 39 (02): p. 99-104.
- Chenghong, X., Research on Regional Differences and Coordinated Development Based on Regional Economic Competitiveness. Ecological Economy, 2008. No.192 (01): p. 46-51+157.
- Liu Qiang, L.Z., Industrial Structure Upgrading and Regional Economic Coordinated Development: Empirical Evidence from Provinces and Urban Agglomerations. Economist, 2022. (08): p. 53-64.
- Wang Zhonghui, F.Y., Zhang Fei, Comprehensive evaluation of the high-quality economic development capacity of coastal provinces in China. Statistics and Decision Making, 2022. 38 (09): p. 114-118.
- Xu Yingzhi, W.H., Empirical Study on the Comprehensive Efficiency of Regional Coordinated Development under Environmental Constraints. China Industrial Economy,, 2010. (8): p. 34-44.
- Zhang Chao, Z.C., Jiang Tianying, Li Xingyuan, Spatial and temporal differentiation of regional coordinated development in China and its influencing factors. Economic Geography, 2020. 40 (09): p. 15-26.
- Shengnan, S., Performance Evaluation of Regional Coordinated Development under Urban Circle Integration. Jianghuai Forum, 2021. (03): p. 61-68.
- Deng Zhongliang, Z.C., Population mobility and regional coordinated development under the background of domestic circulation Economic Review, 2022. No. 443 (10): p. 54-64.
- Liu Bingsickle, F.X., Theoretical Logic and Path Selection of Regional Coordination Centered on Economic Construction Beijing Social Sciences, 2023. No.239 (03): p. 24-34.
- Yu, X. and P. Wang, Economic effects analysis of environmental regulation policy in the process of industrial structure upgrading: Evidence from Chinese provincial panel data. Science of the Total Environment, 2021. 753: p. 142004. [CrossRef]
- Lewis., A., Theory of Dual Economy. 1989: Beijing Institute of Economics Press.
- Zhongsheng, L., Population Economics. 2013, Beijing: Tsinghua University Press.
- A, L.W., Economic development with unlimited supplies of labo. The manchester school of economic and social studies, 1954. 22(2): p. 139-191.
- E, N.B., The spatial variation of urban population densities. Geographical review, 1969. 59(2): p. 242-252.
- S, L.E., A theory of migration. Demographic Research, 1966. 3(1): p. 47-57.
- Jiansong, P., The Formation and Development of Contemporary Western Demographic Economics. Population and Economy, 1987. (5): p. 55-60.
- Liu, J., et al., A new framework of land use efficiency for the coordination among food, economy and ecology in regional development. Science of the Total Environment, 2020. 710: p. 135670. [CrossRef]
- Grennfelt, P., et al., Acid rain and air pollution: 50 years of progress in environmental science and policy. Ambio, 2020. 49: p. 849-864. [CrossRef]
- Cai, J., et al., Coupling and coordinated development of new urbanization and agro-ecological environment in China. Science of The Total Environment, 2021. 776: p. 145837. [CrossRef]
- Li, W. and P. Yi, Assessment of city sustainability—Coupling coordinated development among economy, society and environment. Journal of Cleaner Production, 2020. 256: p. 120453.
- Qiu, M., et al., Evaluation on the relevance of regional urbanization and ecological security in the nine provinces along the Yellow River, China. Ecological Indicators, 2021. 132: p. 108346. [CrossRef]
- Kvint, V., Theoretical basis and methodology of strategizing of the private and public sectors of the Kuzbass region as a medial subsystem of the national economy. Russian Journal of Industrial Economics, 2020. 13(3). [CrossRef]
- Malizia, E., et al., Understanding local economic development. 2020: Routledge.
- Wezel, A., et al., Agroecological principles and elements and their implications for transitioning to sustainable food systems. A review. Agronomy for Sustainable Development, 2020. 40: p. 1-13. [CrossRef]
- Duong, V.C. and B. Sung, Examining the role of luxury elements on social media engagement. Journal of Global Fashion Marketing, 2021. 12(2): p. 103-119. [CrossRef]
- Zhu, Y., D. Tian, and F. Yan, Effectiveness of entropy weight method in decision-making. Mathematical Problems in Engineering, 2020. 2020: p. 1-5. [CrossRef]
- Li, J., et al., Coupling coordination degree of production, living and ecological spaces and its influencing factors in the Yellow River Basin. Journal of cleaner production, 2021. 298: p. 126803. [CrossRef]
- Feng Chaolin, H.Y., Luo Yuyan, A Study on the Coupling and Coordination of EEET Systems in Western Resource Based Cities: A Case Study of Three Cities in Guangxi. Ecological Economy, 2020. 36 (02): p. 104-110.
- Zhao Tao, Y.C., Pan Hui, Research on the Coupling Coordination Degree of Low Carbon City 3E1S System. Statistics and Decision Making, 2019. 35 (22): p. 131-135.
- Li Jiufeng, Y.H., Fu Yingchun, Zhao Yaolong, The spatiotemporal changes and clustering model of "population economy land society ecology" urbanization co scheduling in Guangdong Province. Progress in Geographic Science, 2018. 37 (02): p. 287-298.
- Yao Shujie, Z.F., Balanced and high-quality development of regional economy and the new development pattern of "dual circulation". Macro Quality Research, 2021. 9 (06): p. 1-16.
- Cai Anning, Z.L., Liang Jinshe, Measurement and Analysis of Regional Economic Differences in Jiangsu Province: Based on Gini Coefficient Decomposition Economic Geography, 2011. 31 (12): p. 1995-2000.
- Xu, X., et al., Eco-efficiency evaluation model: a case study of the Yangtze River Economic Belt. Environmental monitoring and assessment, 2021. 193(7): p. 457. [CrossRef]
- Rodríguez-Pose, A. and M. Storper, Housing, urban growth and inequalities: The limits to deregulation and upzoning in reducing economic and spatial inequality. Urban Studies, 2020. 57(2): p. 223-248. [CrossRef]
- Zhang Heping, T.F., Xiong Yu, Measurement of Matthew Effect: A New Method and Application. Statistics and Decision Making, 2021. 37 (03): p. 36-40.
- Kümpel, A.S., The Matthew Effect in social media news use: Assessing inequalities in news exposure and news engagement on social network sites (SNS). Journalism, 2020. 21(8): p. 1083-1098.
- Pavolini, E. and W. Van Lancker, The Matthew effect in childcare use: a matter of policies or preferences?, in The Future of the Social Investment State. 2020, Routledge. p. 78-93.
- Linde, L., et al., Dynamic capabilities for ecosystem orchestration A capability-based framework for smart city innovation initiatives. Technological Forecasting and Social Change, 2021. 166: p. 120614. [CrossRef]
- Zhang, Y., et al., Human capital quality and the regional economic growth: Evidence from China. Journal of Asian Economics, 2023. 86: p. 101593. [CrossRef]
- Song, Y., X. Zhang, and M. Zhang, The influence of environmental regulation on industrial structure upgrading: Based on the strategic interaction behavior of environmental regulation among local governments. Technological Forecasting and Social Change, 2021. 170: p. 120930. [CrossRef]
- Woodall, L.C., et al., Co-development, co-production and co-dissemination of scientific research: a case study to demonstrate mutual benefits. Biology Letters, 2021. 17(4): p. 20200699. [CrossRef]
- Chen, Y., et al., Impact of unconventional natural gas development on regional water resources and market supply in China from the perspective of game analysis. Energy Policy, 2020. 145: p. 111750. [CrossRef]
- Zhou Xuan, T.C., Horizontal Knowledge Spillover, Technology Embedded Innovation, and Industrial Structure Coordination: Taking China's Manufacturing Industry as an Example. Scientific Research Management, 2021. 42 (07): p. 126-136.
- Hao, Y., et al., Reexamining the relationships among urbanization, industrial structure, and environmental pollution in China—New evidence using the dynamic threshold panel model. Energy Reports, 2020. 6: p. 28-39.
- Ding Renzhong, W.H., Economic Differences in Urban Agglomeration, Industrial Structure, and North South Economic Differentiation. Finance and Trade Economics, 2022. 43 (12): p. 128-143.
- Li Erling, C.Z., Coupling and Coordination Analysis of Regional Innovation Capability and Economic Development Level in China. Geographic Science, 2018. 38 (09): p. 1412-1421.
- Deng Juanjuan, S.Q., The Impact of Industrial Agglomeration on the Efficiency of Green Development of Logistics Industry: An Empirical Analysis Based on the Yangtze River Economic Belt. Business Economics Research, 2023. (23): p. 176-180.
- Hengshan, F., Several Thoughts on Deepening Regional Cooperation. Comparison of Economic and Social Systems, 2013. No.168 (04)(1-10).
- Southern, S.Y., Han Bingyang, Analysis of the Funding Performance, Situation, and Inspiration Suggestions of the China Europe Joint Funding Program. Science and Technology Management Research, 2023. 43 (10): p. 43-49.
- Hengshan, F., Deepening the opening-up and regional cooperation of the central region in all aspects. Macroeconomic Management, 2013. No.353 (05): p. 26-29.
- Xiang, Z., How Creative Execution by Local Governments Is Possible - A Case Analysis Based on the Implementation Process of the "Smart T City" Project China Administrative Management, 2023. 39 (09): p. 124-131.
- Moorthy, V., et al., Data sharing for novel coronavirus (COVID-19). Bulletin of the World Health Organization, 2020. 98(3): p. 150. [CrossRef]
- Yu, L., Ethical issues and regulations of scientific research data in the era of big data. Library, 2023. (07): p. 75-81.
- Yuan Jun, Z.Y., Huang Xujia, Research on the Coupled and Coordinated Development of Sports Industry and Tourism Industry in Urban Agglomeration of Guangdong Hong Kong Macao Greater Bay Area. Resource Development and Market, 2023: p. 1-12.
- Ke, Z., Has the construction of smart cities promoted energy conservation and emission reduction—— Based on the Experience Analysis of 141 Districts and Counties in the Yangtze River Delta Urban Agglomeration. Financial Research, 2023. (07): p. 134-153.
- Tang Jun, G.Y., Li Penglin, Can smart cities promote the achievement of the "dual carbon" goal through smart energy construction—— Experimental evidence based on synthetic control method. Soft Science,, 2023. 37 (07): p. 90-96+133.
- Li Xinru, Z.M., Mi Yidong, The Application of Smart Environmental Protection Systems in Environmental Governance. Journal of Environmental Engineering Technology, 2021. 11 (05): p. 992-1003.
- Fan, F., H. Lian, and S. Wang, Can regional collaborative innovation improve innovation efficiency? An empirical study of Chinese cities. Growth and Change, 2020. 51(1): p. 440-463. [CrossRef]
- Ramírez-Montoya, M.S., et al., Complex thinking in the framework of Education 4.0 and Open Innovation—A systematic literature review. Journal of Open Innovation: Technology, Market, and Complexity, 2022. 8(1): p. 4.
- Zhu Yanjun, S.K., Exploring the influencing factors of enterprise participation in school enterprise patent cooperation: An empirical analysis based on structural equation. Chinese University Science and Technology, 2023. (11): p. 90-96.
Figure 2.
Distribution of the PES system development indices of each prefecture-level city in Jiangsu Province from 2010 to 2020.
Figure 2.
Distribution of the PES system development indices of each prefecture-level city in Jiangsu Province from 2010 to 2020.
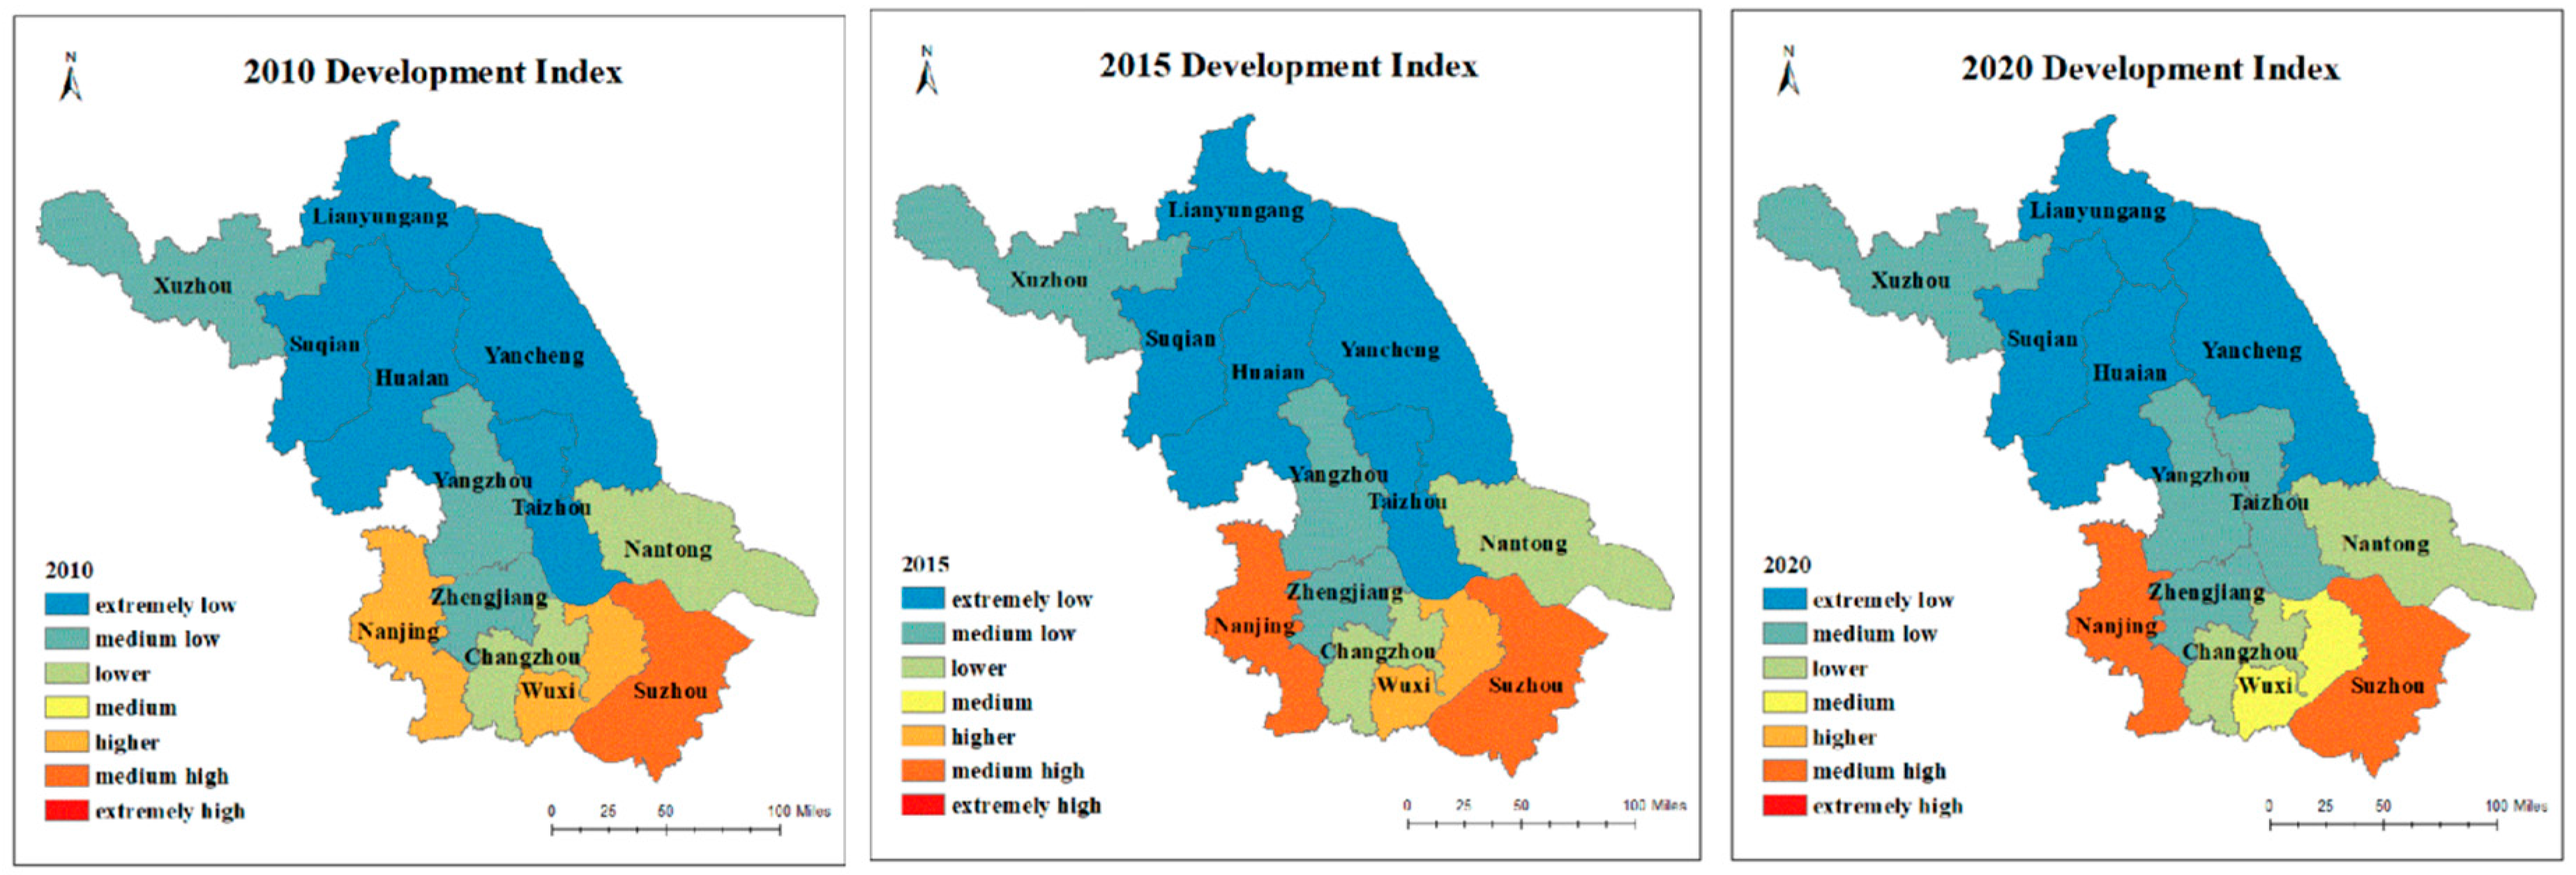
Figure 3.
Distribution of the PES system coupling and coordination indices of each district-level city in Jiangsu Province from 2010 to 2020.
Figure 3.
Distribution of the PES system coupling and coordination indices of each district-level city in Jiangsu Province from 2010 to 2020.
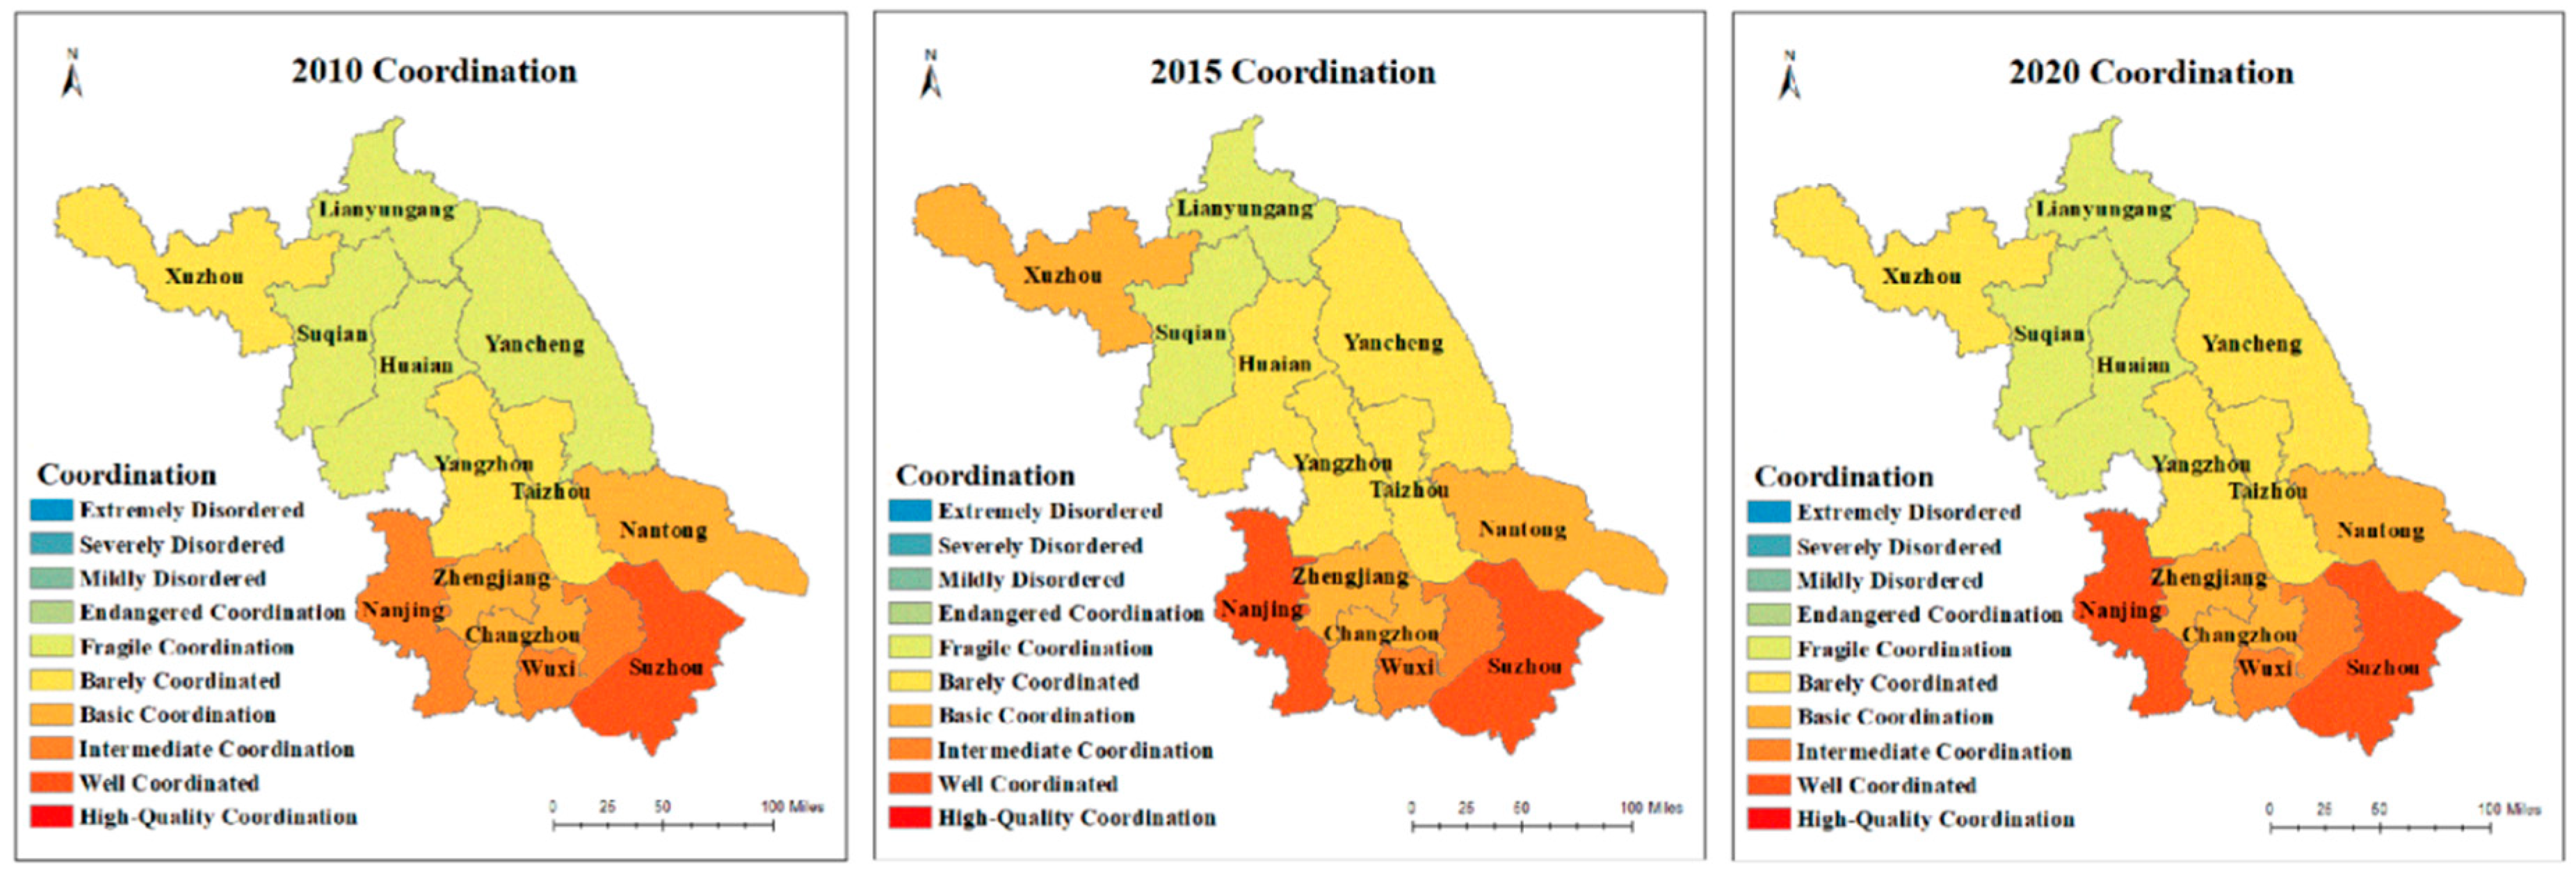

Table 1.
System of indices for evaluating the population development subsystem.
| Target Level | Standardized Layer | Serial Number | Index Layer | Index Properties |
|---|---|---|---|---|
| Population development subsystem indices | Size of population | A1 | Number of births (persons) | ﹢ |
| A2 | Number of deaths (persons) | - | ||
| A3 | Household population at the end of the year (10,000) | ﹢ | ||
| A4 | Year-end resident population (10,000) | ﹢ | ||
| Quality of population | A5 | Illiteracy and semi-illiteracy (%) | - | |
| A6 | Percentage of people with bachelor's degree or above (%) | ﹢ | ||
| A7 | Percentage of people with high school education or less (%) | - | ||
| Population structure | A8 | Sex ratio at birth | - | |
| A9 | Percentage of 0-14 year olds (%) | ﹢ | ||
| A10 | Percentage of 15-64 year olds (%) | ﹢ | ||
| A11 | Percentage of persons aged 65 and over (%) | ﹢ | ||
| A12 | Population density (persons/km2) | ﹢ | ||
| A13 | Percentage of urban population (%) | ﹢ |
Table 2.
System of indices for evaluating the economic development subsystem.
| Target Level | Standardized Layer | Serial Number | Index Layer | Index Properties |
|---|---|---|---|---|
| Economic development subsystem indices | Size of economy | B1 | Year-end gross domestic product GDP (billions of yuan) | ﹢ |
| B2 | General public budget revenue (billions of yuan) | ﹢ | ||
| B3 | Gross industrial output (billions of yuan) | + | ||
| Quality of the economy | B4 | GDP per capita ($) | + | |
| B5 | GDP growth rate (%) | + | ||
| B6 | Per capita local fiscal revenue (million yuan) | + | ||
| B7 | Per capita gross industry output (yuan) | + | ||
| Economic structure | B8 | Share of primary production value (%) | + | |
| B9 | Share of secondary production value (%) | + | ||
| B10 | Share of output value of the third sector (%) | + |
Table 3.
System of indices for evaluating the social development subsystem.
| Target Level | Standardized Layer | Serial Number | Index Layer | Index Properties |
|---|---|---|---|---|
| Social development subsystem indices | Infrastructure | C1 | Road area per capita (square meters) | + |
| C2 | Public transportation vehicles for 10,000 people (standard units) | + | ||
| C3 | Supply of liquefied petroleum gas per 10,000 people (tons) | + | ||
| C4 | Water supply per capita (tons) | + | ||
| Cultural Education | C5 | Per capita financial expenditure on education (yuan) | + | |
| C6 | Total number of students enrolled in school at all levels (10,000) | + | ||
| C7 | Total number of teachers at all levels (10,000) | + | ||
| C8 | Public library holdings per capita (volumes) | + | ||
| Medical System | C9 | Total number of hospitals, health centers | + | |
| C10 | Number of hospital beds per 10,000 persons (sheets) | + | ||
| C11 | Percentage of persons covered by basic health insurance (%) | + | ||
| C12 | Percentage of employees insured against work-related injuries (%) | + | ||
| C13 | Unemployment insurance participation (%) | + | ||
| Ecological Environment | C14 | Sewage treatment rate (%) | + | |
| C15 | Volume of domestic waste removed (tons) | + | ||
| C16 | Green space per capita in parks (square meters) | + |
Table 4.
Criteria for classifying development indices.
| Development Index | [0-0.3) | [0.3-0.4) | [0.4-0.5) | [0.5-0.6) | [0.6-0.7) | [0.7-0.8) | [0.8-1] |
|---|---|---|---|---|---|---|---|
| Level of development | Extremely low | Medium low | Lower | Medium | Higher | Medium high | Extremely high |
| Low | Medium | High | |||||
Table 5.
Classification of the coupling coordination degree.
| Coordination index | Coordination phase | Degree of coordinated development |
|---|---|---|
| [0-0.1) | Disordered type | Extremely disordered |
| [0.1-0.2) | Severely disordered | |
| [0.2-03) | Mildly disordered | |
| [0.3-0.4) | Transition type | Endangered coordination |
| [0.4-0.5) | Fragile coordination | |
| [0.5-0.6) | Barely coordinated | |
| [0.6-0.7) | Basic coordination | |
| [0.7-0.8) | Coordinated development | Intermediate coordination |
| [0.8-0.9) | Well-coordinated | |
| [0.9-1.0] | High-quality coordination |
Table 6.
Weights of demographic-economic-social system indices (2010, 2015, 2020).
| Level 1 indices | Secondary indices | Tertiary indices | W2010 | W2015 | W2020 |
|---|---|---|---|---|---|
| Population development subsystem indices | Size of population | Number of births (persons) | 0.09 | 0.08 | 0.07 |
| Number of deaths (persons) | 0.05 | 0.06 | 0.05 | ||
| Household population at the end of the year (10,000) | 0.06 | 0.06 | 0.06 | ||
| Year-end resident population (10,000) | 0.08 | 0.07 | 0.09 | ||
| Quality of population | Illiteracy and semi-illiteracy (%) | 0.07 | 0.10 | 0.06 | |
| Undergraduate education and above (%) | 0.07 | 0.10 | 0.06 | ||
| High school education and below (%) | 0.08 | 0.06 | 0.07 | ||
| Population Structure | sex ratio at birth | 0.08 | 0.08 | 0.05 | |
| Percentage of 0-14-year-olds (%) | 0.08 | 0.07 | 0.07 | ||
| Percentage of 15-64-year-olds (%) | 0.12 | 0.10 | 0.12 | ||
| Percentage of persons aged 65 and over (%) | 0.04 | 0.05 | 0.07 | ||
| Population density (persons/km2) | 0.07 | 0.09 | 0.11 | ||
| Percentage of urban population (%) | 0.10 | 0.09 | 0.11 | ||
| Economic development subsystem indices | Size of economy | Year-end GDP (billions of yuan) | 0.11 | 0.13 | 0.12 |
| Public budget revenue (billions of yuan) | 0.12 | 0.14 | 0.15 | ||
| Gross industrial output (billions of yuan) | 0.11 | 0.12 | 0.12 | ||
| Quality of the economy | GDP per capita ($) | 0.09 | 0.10 | 0.08 | |
| GDP growth rate (%) | 0.05 | 0.05 | 0.07 | ||
| Per capita local fiscal revenue (ten thousand yuan) | 0.09 | 0.09 | 0.11 | ||
| Gross industrial output per capita (million yuan) | 0.10 | 0.12 | 0.10 | ||
| Economic Structure | Share of primary production value (%) | 0.11 | 0.12 | 0.11 | |
| Share of secondary production value (%) | 0.10 | 0.05 | 0.04 | ||
| Share of output value of the third sector (%) | 0.12 | 0.06 | 0.10 | ||
| Social development subsystem indices | Infrastructure | Road area per capita (square meters) | 0.05 | 0.05 | 0.08 |
| Public transportation vehicles for 10,000 people (standard units) | 0.06 | 0.04 | 0.07 | ||
| Oil and gas supply for 10,000 people (tons) | 0.05 | 0.06 | 0.04 | ||
| Water supply per capita (tons) | 0.07 | 0.08 | 0.07 | ||
| Cultural Education | Per capita financial expenditure on education (yuan) | 0.06 | 0.06 | 0.06 | |
| Total number of students in school (10,000) | 0.04 | 0.06 | 0.07 | ||
| Total number of teachers at all stages (10,000) | 0.05 | 0.05 | 0.06 | ||
| Public library holdings per capita (volumes) | 0.06 | 0.07 | 0.06 | ||
| Medical Protection | Total number of hospitals, health centers (number) | 0.04 | 0.04 | 0.04 | |
| Number of beds per 10,000 people (beds) | 0.07 | 0.06 | 0.03 | ||
| Number of people enrolled in basic health insurance (%) | 0.06 | 0.07 | 0.06 | ||
| Number of persons insured against work-related injuries (%) | 0.08 | 0.09 | 0.09 | ||
| Number of participants in unemployment insurance (%) | 0.07 | 0.07 | 0.08 | ||
| Ecological Environment | Sewage treatment rate (%) | 0.08 | 0.03 | 0.07 | |
| Volume of domestic waste removed (tons) | 0.11 | 0.12 | 0.09 | ||
| Per capita green space in parks (square meters) | 0.05 | 0.03 | 0.04 |
Table 7.
List of PES Comprehensive Population-Economic-Social Development Indices for Prefectural-level Cities in Jiangsu Province.
Table 7.
List of PES Comprehensive Population-Economic-Social Development Indices for Prefectural-level Cities in Jiangsu Province.
| Regions | 2010 | 2015 | 2020 | |||||||
| Index | Rankings | Leve | Index | Rankings | Leve | Index | Rankings | Leve | ||
| Southern Jiangsu | Suzhou | 0.71 | 1 | Medium High | 0.77 | 1 | Medium High | 0.76 | 1 | Medium High |
| Nanjing | 0.65 | 2 | Higher | 0.70 | 2 | Medium High | 0.72 | 2 | Medium High | |
| Wuxi | 0.63 | 3 | Higher | 0.60 | 3 | Higher | 0.59 | 3 | Higher | |
| Changzhou | 0.45 | 4 | Lower | 0.45 | 4 | Lower | 0.46 | 4 | Lower | |
| Zhenjiang | 0.36 | 6 | Medium Low | 0.39 | 6 | Medium Low | 0.37 | 6 | Medium Low | |
| Central Jiangsu | Nantong | 0.40 | 5 | Lower | 0.42 | 5 | Lower | 0.40 | 5 | Lower |
| Yangzhou | 0.35 | 7 | Medium Low | 0.34 | 8 | Medium Low | 0.33 | 8 | Medium Low | |
| Taizhou | 0.29 | 9 | Extremely Low | 0.28 | 10 | Extremely Low | 0.30 | 9 | Medium Low | |
| Northern Jiangsu | Xuzhou | 0.33 | 8 | Medium Low | 0.36 | 7 | Medium Low | 0.32 | 7 | Medium Low |
| Yancheng | 0.26 | 10 | Extremely Low | 0.29 | 9 | Extremely Low | 0.27 | 10 | Extremely Low | |
| Huai'an | 0.24 | 11 | Extremely Low | 0.28 | 11 | Extremely Low | 0.25 | 11 | Extremely Low | |
| Lianyungang | 0.22 | 12 | Extremely Low | 0.24 | 12 | Extremely Low | 0.23 | 12 | Extremely Low | |
| Suqian | 0.21 | 13 | Extremely Low | 0.23 | 13 | Extremely Low | 0.22 | 13 | Extremely Low | |
Table 8.
Ranking of PES System Coupling Coordination Degrees of Various Cities in Jiangsu Province.
| Regions | 2010 | 2015 | 2020 | |||||||
| Value | Level | Rankings | Value | Level | Rankings | Value | Level | Rankings | ||
| Southern Jiangsu | Suzhou | 0.84 | Well | 1 | 0.87 | Well | 1 | 0.87 | Well | 1 |
| Nanjing | 0.79 | Intermediate | 2 | 0.83 | Well | 2 | 0.85 | Well | 2 | |
| Wuxi | 0.79 | Intermediate | 3 | 0.77 | Intermediate | 3 | 0.77 | Intermediate | 3 | |
| Changzhou | 0.67 | Basic | 4 | 0.67 | Basic | 4 | 0.67 | Basic | 4 | |
| Zhenjiang | 0.60 | Basic | 6 | 0.62 | Basic | 6 | 0.60 | Basic | 6 | |
| Central Jiangsu | Nantong | 0.63 | Basic | 5 | 0.65 | Basic | 5 | 0.63 | Basic | 5 |
| Yangzhou | 0.59 | Barely | 7 | 0.58 | Barely | 8 | 0.57 | Barely | 7 | |
| Taizhou | 0.53 | Barely | 9 | 0.53 | Barely | 10 | 0.55 | Barely | 8 | |
| Northern Jiangsu | Xuzhou | 0.57 | Barely | 8 | 0.60 | Basic | 7 | 0.55 | Barely | 9 |
| Yancheng | 0.49 | Fragile | 10 | 0.54 | Barely | 9 | 0.51 | Barely | 10 | |
| Huai’an | 0.48 | Fragile | 11 | 0.52 | Barely | 11 | 0.49 | Fragile | 11 | |
| Lianyungang | 0.45 | Fragile | 12 | 0.48 | Fragile | 12 | 0.47 | Fragile | 12 | |
| Suqian | 0.45 | Fragile | 13 | 0.48 | Fragile | 13 | 0.46 | Fragile | 13 | |
Disclaimer/Publisher’s Note: The statements, opinions and data contained in all publications are solely those of the individual author(s) and contributor(s) and not of MDPI and/or the editor(s). MDPI and/or the editor(s) disclaim responsibility for any injury to people or property resulting from any ideas, methods, instructions or products referred to in the content. |
© 2024 by the authors. Licensee MDPI, Basel, Switzerland. This article is an open access article distributed under the terms and conditions of the Creative Commons Attribution (CC BY) license (http://creativecommons.org/licenses/by/4.0/).
Copyright: This open access article is published under a Creative Commons CC BY 4.0 license, which permit the free download, distribution, and reuse, provided that the author and preprint are cited in any reuse.


