
Submitted:
25 December 2025
Posted:
26 December 2025
You are already at the latest version
Abstract
Based on 402 micro-survey data from water conservancy, environmental protection and other departments in the middle reaches of the Yangtze River Basin, the characteristics of digital technology are identified from three dimensions: tools, power and capacity. Combined with factor analysis and mediating effect model, the impact and mechanism of digital technology on inter-provincial ecological coordination in the basin are empirically tested. Research shows that: (1) Digital technology has a significant positive driving effect on inter-provincial ecological coordination in the middle reaches of the Yangtze River. After robustness tests such as re-measurement by digital technology and elimination of interference from smart water conservancy pilot projects, the conclusion still holds. (2) The mechanism path shows that central government support and public participation play a partial mediating role in the impact of digital technology on inter-provincial ecological coordination, and both have a masking mediating effect on the sustainability of inter-provincial ecological coordination-digital technology indirectly enhances the level of inter-provincial ecological coordination by strengthening central policy and financial support and broadening public participation channels. (3) In empirical tests, the dependent variable mostly relies on subjective scores, lacking cross-validation of objective indicators, and the logical chain of mechanism transmission is not clear enough. Based on this, targeted suggestions such as improving the policy system for digital collaboration in river basins and building a digital and intelligent public participation platform are put forward, providing practical references for the ecological collaborative governance of the Yangtze River Basin.
Keywords:
digital technology
; inter-provincial ecological collaboration
; central government support
; public environmental participation
; middle reaches of the Yangtze River Basin
MSC: 90B50; 90C27; 91-10; 91B86
1. Introduction
The “Fourteenth Five-Year Plan for National Economic and Social Development of the People’s Republic of China and the Outline of Long-term Goals for 2035” clearly states that “promoting cross-regional watershed collaborative management and improving the quality of water environment in the watershed”, and the “National Water Network Construction Plan (2023)” further emphasizes “building digital twin water networks and improving the intelligent level of watershed ecosystem protection and management.” As the core section of the Yangtze River Economic Belt, the middle reaches of the Yangtze River Basin have 360 lakes with an area of more than 1 km2, accounting for 12% of the country’s total lake area. It plays an irreplaceable role in maintaining the country’s freshwater ecological security and ensuring the coordinated economic and social development of the basin. However, the basin involves the three provinces of Hubei, Hunan, and Jiangxi. Problems such as “governance fragmentation” and “information islands” caused by the division of administrative boundaries still restrict the in-depth advancement of inter-provincial ecological collaboration - such as the delayed response to joint prevention and control of cross-provincial pollution, inconsistent ecological compensation standards, and difficulty in interoperating governance data. There is an urgent need to explore new governance paths empowered by digital technology. Digital technology provides a new paradigm for solving the dilemma of cross-regional collaboration in river basins.
In current practice, technical tools such as digital twin watersheds and river (lake) length information management systems have been initially applied in the governance of the middle reaches of the Yangtze River. However, there are still three gaps in academic research: First, most studies focus on the impact of digital technology on single governance entities (such as local governments and enterprises), and lack of understanding of “digital technology-intergovernmental interaction-public participation” “Systematic analysis of multi-agent collaborative mechanisms; second, the dimensional division of digital technology is relatively vague, and it fails to conduct detailed research from the levels of tool application, power reconstruction, and capacity improvement based on watershed governance scenarios; third, the dependent variables in empirical tests mostly rely on subjective ratings, lack cross-validation of objective indicators, and the logical chain of mechanism transmission is not clear enough. Based on this, this article takes the middle reaches of the Yangtze River Basin as the research object, obtains government staff questionnaire data through micro surveys, constructs a theoretical framework of “digital technology - intermediary variables (central government support, public participation) - inter-provincial ecological synergy”, and uses factor analysis and regression models to verify the research hypothesis. The research value of this article lies in: in theory, it clarifies the three-dimensional dimensions and intermediary paths of digital technology’s impact on inter-provincial ecological collaboration, enriches the academic system of digital technology empowering watershed governance, and in practice, provides operational policy solutions for digital collaborative governance of the middle reaches of the Yangtze River Basin, helping to build a “Beautiful Yangtze River” and “Happy Yangtze River”.
Among the United Nations Sustainable Development Goals (SDGs), the implementation of SDG6 (clean drinking water and sanitation), SDG13 (climate action) and SDG17 (partnership) has always been limited by the contradiction between “ecological integrity and governance fragmentation” across administrative boundary watersheds. Based on 402 microscopic data from the middle reaches of the Yangtze River Basin, this study reveals the “digital technology-central government support/public participation-inter-provincial ecological collaboration” mechanism, which provides a key reference for countries at different development stages around the world to solve the dilemma of watershed governance and promote sustainable development.
For developing countries, their transnational river basins (such as the Mekong River and the Nile River) generally face the problems of “information islands” and shortage of funds. The World Bank pointed out in the “Mekong River Basin Water Resources Management Report” [1] that the core bottlenecks in transnational river basin governance in developing countries are poor information sharing and inefficient resource allocation; the “2022 Nile Basin Status Report” released by the United Nations Environment Program (UNEP) also confirmed this conclusion [2], emphasizing that innovation in technical tools and optimization of financial mechanisms are the key to breaking through the governance dilemma. The lightweight digital tools such as the river (lake) length information management system and the real-time pollution reporting APP verified in this study can compress cross-domain pollution response time from “weekly level” to “hourly level”, directly supporting the SDG6 goals; and the conclusion that “the central government supports the intermediary effect” provides a basis for designing a “central coordination-local implementation” fund sharing mechanism (such as referring to the “central-provincial-municipal” three-level cost model) to avoid weakening governance efficiency due to resource misallocation.
For developed countries, although their river basin management systems (such as the Rhine River and Danube River) are complete, there is a problem of “insufficient collaborative sustainability”. It is mentioned in the 2021-2027 River Basin Management Plan of the International Commission for the Protection of the Rhine (ICPR) that even in river basins with mature governance systems, insufficient synergy between technology application and public participation will still restrict sustainable governance effects [3]. The “International Commission for the Protection of the Danube River (ICPDR) 2022 River Basin Management Plan” also points out that the multi-agent interaction mechanism needs to be further optimized to enhance collaborative stability [4].
The “public participation masking intermediary effect” found in this study suggests that it needs to optimize the digital and intelligent participation platform (such as adding a “cross-provincial collaborative suggestion” module) and upgrade public participation from “supervision and feedback” to “co-construction and co-governance”; and the robustness testing method of “eliminating interference from policy pilots” can help it avoid “pilot islands” in digital governance, ensure the universality of technology promotion, and improve the collaboration efficiency of SDG17. In addition, this study’s methodological framework of “micro-survey + factor analysis” solves the problem of “scarcity of data and subjective assessment” in global watershed governance, and provides a replicable tool for countries to construct localized monitoring indicators for SDGs (such as quantifying the degree of ecological synergy). In summary, this research not only enriches the theoretical system of digital technology empowering watershed governance, but also promotes the transformation of global watershed governance into “diversified collaboration” through the logic of “problem-mechanism-solution” and assists the implementation of the global 2030 agenda.
Based on the “resource-technology synergy theory”, this article believes that digital technology, as a key governance resource, can optimize the resource allocation efficiency of inter-provincial ecological synergy in river basins through tool embedding, power reconstruction and capacity improvement. Compared with existing research, the marginal contribution of this article is mainly reflected in three aspects: (1) Dimension refinement: Divide digital technology into three dimensions: tools, power, and capabilities, and design specific measurement items based on watershed governance scenarios, which makes up for the lack of vague division of digital technology dimensions in existing research. (2) Mechanism expansion: Introduce central government support and public participation as intermediary variables, build a theoretical framework of “digital technology-intermediary variables-inter-provincial ecological synergy”, and reveal the impact of digital technology on inter-provincial ecological synergy. The indirect path deepens the discussion of the “technology-subject-collaboration” interaction mechanism. (3) Method optimization: Obtain the subjective rating data of government workers through micro surveys, combine with factor analysis to reduce the dimensionality of variables, and use the two-stage instrumental variable method to deal with endogeneity issues. Robustness testing (re-measurement with digital technology, elimination of interference from policy pilots) was conducted, and the Bootstrap method was used to further verify the intermediary effect, ensuring the reliability of the empirical results and enhancing the persuasiveness of the research conclusions.
The rest of this paper are organized as follows. The second part presents the literature review. The third establishes the theoretical assumptions and mechanism framework. The fourth details the research design. The fifth conducts the mediation effect analysis. The sixth provides the conclusion and policy suggestions.
2. Literature Review
2.1. Related Research on Digital Technology and Public Governance
The profound transformative role of digital technology in public governance has become a widespread consensus in the academic circle. Digital technology plays a core role in public governance. It is not only a fundamental tool for achieving government modernization, enhancing economic efficiency, and increasing citizen participation, but also a key driving force for transforming government decision-making, promoting innovation and transparency [5]. Dawes [6] further proposed that digital technology promotes the transformation of governance models from “hierarchical” to “networked” by reconstructing government governance processes. At the same time, Astrid [7] emphasized that digital technology not only shapes people’s imagination and expectations of the future society, but also redefines privacy and the essence of the self through its functions and features. Digital technology platforms expand their “technological territory” by leveraging future imagination, transcending geopolitical and cultural boundaries, and better serving social public governance. Digital technology, by leveraging cross-system and cross-platform data sharing mechanisms, has effectively broken down the long-standing “information silos” [8], providing a data foundation for holistic governance. Meanwhile, digital technology platforms have facilitated continuous communication and collaboration among multiple stakeholders such as the government, enterprises, social organizations, and the public [9], promoting the interaction among governance subjects. Biao [10] systematically expounds that digital technologies represented by big data are not only tools for enhancing government efficiency, but also key forces for reconstructing the collaborative production model of public services. However, this vertical and horizontal integration also brings new challenges [11], including issues such as coordination mechanisms, division of rights and responsibilities, and resource allocation. Despite this, digital platforms still demonstrate the potential to transcend departmental and hierarchical limitations, effectively integrating previously scattered governance resources [12] and promoting collaboration among multiple entities around common goals [13]. Emerging digital technologies represented by big data, cloud computing, the Internet of Things, and artificial intelligence are continuously injecting new impetus into the modernization of social governance [14]. Digital tools have significantly enhanced the breadth and depth of citizens’ participation in environmental governance [15], while cutting-edge technologies such as digital twins can simulate the operational status of river basins, thereby improving the accuracy and efficiency of overall river basin governance [16]. Overall, the increasingly complex systematic interaction between the digital society and government governance is giving rise to a new paradigm of digital public administration characterized by integration, collaboration, and intelligence [17].
Nonetheless, existing research still has limitations: First, it focuses more on the impact of digital technology on a single region or a single department, and lacks pertinence in cross-administrative region watershed governance; second, the division of the role dimensions of digital technology is relatively general, and fails to conduct detailed analysis based on the actual needs of “tool application-power allocation-capacity improvement” in watershed governance; third, there is a lack of discussion of the interaction mechanism between digital technology and other governance entities (such as the central government, the public), and it is difficult to explain the complex role of digital technology in cross-domain collaboration.
2.2. Related Research on Inter-Provincial Ecological Synergy in River Basins
The core contradiction in inter-provincial ecological coordination in the river basin lies in the conflict between “administrative boundaries” and “ecosystem integrity” [18]. Lucie et al. [19] pointed out that in the two major river basin governance in France, collaborative governance cannot guarantee the sustainable management of natural resources in the basin, Fente et al. [20] found that the restoration of the Rhine River ecosystem faces challenges such as slow decision-making, ambiguous responsibilities and limited financial incentives, Dare et al. [21] took the governance of groundwater in the Indus River Basin as an example, using Ostrom’s institutional design principles of public pond resources and stakeholder participation theory, and proposed six policy principles to enhance governance coordination, monitoring, innovation and local participation, Li et al. [22] revealed the key interactions between water resources and key socioeconomic and ecological determinants in the Sri Lanka Mahaweli River watershed , Chen et al. [23] taking the Nile River as an example, it is believed that in transboundary basin management, there is a gap between regional-level policy formulation and local-level policy implementation. It is advocated that effective and sustainable management of transboundary basin systems requires coordinated actions between governments. Product market competition and ecological compensation games between regions within the basin have increased [24]. In order to better promote the collaborative governance of cross-domain ecological environment, it is necessary to continuously improve the coordination mechanism of cross-domain ecological environment collaborative governance, improve the participation mechanism of multiple subjects to improve the degree of coordination, establish an information sharing platform and improve the supervision mechanism [25]. Empirical research on the ecological management of China’s Taihu Lake explained by Huang et al. shows that due to the publicity and externality of watershed governance, collaborative governance between cities has become an inevitable choice to improve the governance performance of Taihu Lake Basin in China and promote the sustainable development of the watershed [26]. Zhang et al. [27], through intelligent water management and air pollution early warning digital models, elaborated on the practical application effect of digitalization in ecological governance systems. At the public participation level, Carrie et al. [28] pointed out that farmers and ranchers participated in water conservation work and improved water resource utilization efficiency in the Colorado River Basin (CRB) in the western United States, The attitude of the public in participating in ecological and environmental protection affects the allocation of local government attention [29], digital technology expands public participation channels [30], and decentralized, participatory and consensus-oriented multi-party governance forms are replacing the traditional state-centered environmental governance form [31], Perkins [32] discussed the operation mode, importance, and ecological potential of public participatory water area decision-making. Partnerships are often considered to be able to achieve more collaborative and holistic governance of complex social and ecological systems in watersheds, and can make up for the lack of government governance resources [33]. Dong et al. [18] have verified the constraining effect of public participation on corporate pollution reduction through evolutionary game models.
However, there are still gaps in existing research: First, the measurement of inter-provincial ecological synergy relies mostly on macro statistical data (such as pollution emissions, governance investment), and lacks subjective collaborative willingness and collaborative ability assessment based on micro surveys; second, less attention is paid to the “bridging role” of digital technology in inter-provincial ecological synergy. It fails to reveal how digital technology forms a synergy for collaborative governance by connecting the central government, local government and the public. Third, empirical tests of collaborative mechanisms mostly focus on “direct effects” and ignore the conductive role of intermediary variables, making it difficult to fully explain the internal logic of digital technology’s impact on inter-provincial ecological collaboration.
3. Theoretical Assumptions and Mechanism Framework
3.1. The Direct Impact of Digital Technology on Inter-Provincial Ecological Coordination in the River Basin
Based on the three-dimensional dimensions of digital technology (tools, power, capabilities), this article proposes a hypothesis of the direct impact of digital technology on inter-provincial ecological collaboration:
Hypothesis 1.
Digital technology has a significant positive impact on inter-provincial ecological coordination in the river basin.
Tool level: digital tools such as the River (Lake) Chang APP and information management system can monitor cross-provincial pollution status in real time, quantify the effects of river patrols, reduce information distortion and moral risks, and promote inter-provincial joint formulation of governance policies [34], thereby improving the degree of ecological synergy; power level: digital platforms clearly understand the situation through information sharing and public supervision. Clarify inter-provincial governance rights and responsibilities, optimize inter-government interaction mechanisms, reduce the phenomenon of “fighting independently”, and promote the stable maintenance of inter-provincial collaborative relationships; Capability level: Digital technology improves the accuracy and execution efficiency of inter-provincial decision-making by integrating governance resources and reducing communication costs. At the same time, it strengthens collaborative capabilities through digital training to provide support for the sustainability of ecological collaboration. Inter-provincial ecological synergy is further subdivided into “synergy degree” (reflecting the current synergy status) and “synergy sustainability” (reflecting the ability to maintain synergy relationships), and a subdivision hypothesis is proposed:
Hypothesis 1a.
Digital technology has a significant positive impact on the degree of inter-provincial ecological synergy in the river basin.
Hypothesis 1b.
Digital technology has a significant positive impact on the sustainability of inter-provincial ecological collaboration in the river basin.
3.2. The Direct Impact of Digital Technology on Inter-Provincial Ecological coordination in the River Basin3.2. 1The Intermediary Role of Central Government Support
The application and promotion of digital technology requires the central government to provide policy, financial and technical support: on the one hand, the central government provides institutional guarantee and resource support for inter-provincial digital collaboration by issuing special policies (such as digital twin water network construction plans) and arranging special funds for governance; on the other hand, the central government promotes provincial governments to implement digital collaboration measures through supervision and assessment to avoid “policy idling”. Shen et al. [35] pointed out that provincial governments lack motivation in cross-domain collaboration and the central government needs to promote inter-provincial cooperation through “vertical intervention”. Based on this, it is proposed:
Hypothesis 2.
Central government support plays an intermediary role in the impact of digital technology on inter-provincial ecological coordination in river basins - digital technology positively enhances the level of inter-provincial ecological coordination by obtaining central government policy, funding and supervision support.
3.2.2. The Intermediary Role of Public Participation
Digital technology provides new channels for the public to participate in watershed governance: through WeChat public accounts, supervision platforms and other tools, the public can obtain cross-provincial pollution information in real time and provide feedback on governance issues, and at the same time constrain the behavior of local governments and enterprises through public opinion supervision [36]. In addition, public participation can build social consensus, reduce conflicts of interest in inter-provincial collaboration, and provide a social foundation for the sustainability of collaborative relationships. The attitude of the public in participating in protecting the environment affects the allocation of local government attention [29]. The narrow channels for public participation under the traditional governance model restrict the sustainability of inter-provincial collaboration, and digital technology can break this restriction [30]. Based on this, it is proposed:
Hypothesis 3.
Public participation plays a mediating role in the impact of digital technology on inter-provincial ecological coordination in river basins - digital technology positively enhances the level of inter-provincial ecological coordination by broadening public participation channels, strengthening public supervision and consensus building.
3.3. Mechanism Framework
Based on the above hypothesis, a mechanism framework for digital technology to drive inter-provincial ecological synergy in the river basin is constructed (see Figure 1), in which digital technology is the core independent variable, inter-provincial ecological synergy (including the degree of synergy and sustainability of synergy) is the dependent variable, central government support and public environmental participation are intermediary variables, and variables such as personal attributes (gender, age, education, working years) and regional attributes (river pollution status, river importance) are controlled at the same time.
4. Research Design
4.1. Data Source
The data for this article comes from a micro-survey in the middle reaches of the Yangtze River Basin (Hubei, Hunan, and Jiangxi) from July to October 2023. The survey targets were staff involved in watershed governance in the water conservancy, environmental protection, agriculture, urban construction, and planning departments of the three provinces. Questionnaires were distributed using the method of “research team invitation + local government assistance + email questionnaire”. A total of 402 valid questionnaires were recovered, with an effective recovery rate of 89.3%. The sample distribution is in line with the actual composition of participants in inter-provincial governance in the middle reaches of the Yangtze River Basin and is representative.
4.2. Variable Selection
4.2.1. Dependent Variable: Inter-Provincial Ecological Collaboration
Referring to the practices of Sáez-Ardura et al. [37], it is mainly measured from two dimensions: “degree of synergy” and “sustainability of synergy”. The degree of synergy: reflects the actual status of inter-provincial ecological synergy, and is measured from the three items of “collaborative strategy formulation”, “collaborative fund allocation” and “collaborative agency establishment”, of which item 2 “sufficient funds” is defined as “the amount of funds required to meet the annual plan for inter-provincial collaborative governance in the river basin, and there is no delay or stagnation of governance projects due to funding gaps”; Collaborative sustainability: reflects the ability to maintain inter-provincial collaborative relationships, measured from the three items of “collaborative power enhancement”, “collaborative field expansion” and “collaborative model survival expectations”. The dimensionality of the six items was reduced through factor analysis, and the “degree factor” (variance contribution rate 52.36%) and “sustainability factor” (variance contribution rate 31.72%) were extracted. Bartlett’s standardized score was used to calculate the degree and sustainability of collaboration respectively, and then the inter-provincial ecological synergy (Cooperativity) was obtained by taking the weighted average of the variance contribution rates of the two factors. Factor analysis test showed that KMO=0.807, Bartlett’s test of sphericity χ2=857.615 (p<0.01), reliability α=0.808 (p<0.01), and the scale has good reliability and validity. The meaning and value assignment of inter-provincial ecological synergy indicators are shown in Table 1.
4.2.2. Key Independent Variable
Digital technology. Referring to the dimension division of Gao [21], combined with the watershed governance scenario, 9 items are designed from the three dimensions of tools, power, and capabilities; tool level: “Reporting lake patrol status with the help of APP”, “Pay attention to water control public accounts”, “Use river (lake) length information management system” ; Power level: “Digital technology shares water control information”, “Digital platform introduces public participation”, “Digitalization enables cross-level reporting of river-related matters”; Capability level: “Digital platform provides water control training”, “Digital infrastructure meets water control needs”, “Digital technology enhances precise governance capabilities”. Referring to existing research [43], a common factor (variance contribution rate 68.45%) was extracted through factor analysis as a measurement index of digital technology (DG). The test shows that KMO=0.884, Bartlett’s test of sphericity χ2=1696.136 (p<0.01), reliability α=0.864 (p<0.01), and the scale’s reliability and validity are qualified. The meanings and assignments of digital technical indicators are shown in Table 1.
4.2.3. Mediating Variable: Central Government Support (Government)
Referring to the research of Murray et al. [38], from the 4-item measurement of “policy support”, “financial support”, “technical support” and “supervisory support”, factor analysis extracted 1 common factor (variance contribution rate 62.18%), KMO=0.733, reliability α=0.701 (p<0.01); public participation ( Public): Referring to the research of Murray et al. [38], from the four-item measurement of “Importance of Public Participation”, “Importance of Public Supervision”, “Importance of Public Attention” and “Media Supervision Role”, factor analysis extracted 1 common factor (variance contribution rate 60.35%), KMO=0.729, reliability α=0.702 (p<0.01). The meanings and values assigned to the central government support and public participation indicators are shown in Table 2.
4.2.4. Control Variables
In order to avoid estimation bias caused by omitted variables, this article will introduce control variables in terms of personal attributes and regional attributes of the survey respondents. Combined with existing research [39,40], two types of control variables are selected such as personal attributes: gender (Gender, male=1, female=2), age (Age, 35 years old and below=1, 36-40 years old=2, 41-45 years old =3, 46-50 years old = 4, over 50 years old = 5), education (Education, junior high school and below = 1, high school/technical secondary school = 2, junior college = 3, undergraduate = 4, master’s degree and above = 5), working experience (Seniority, 5 years and below = 1, 6-10 years = 2, 11-15 years = 3, 16-20 years = 4, 20 years and above = 5); regional attributes: river pollution status (Pollution, severe pollution = 1, relatively Major pollution = 2, some pollution = 3, no obvious pollution = 4, no pollution = 5), river importance (Importance, not important = 1, dispensable = 2, average = 3, relatively important = 4, very important = 5).
4.3. Model Settings
4.3.1. Baseline Regression Model (Testing Hypotheses 1, 1a, 1b)
In the process of verifying hypothesis 1, the dependent variable inter-provincial ecological synergy and the key independent variable digital technology are both continuous variables. Referring to the practices of Song et al. [41], in order to test the direct impact of digital technology on inter-provincial ecological synergy, a linear regression model is constructed:
In the above model, i represents the region number in the sample; Degree i represents the degree of inter-provincial ecological synergy in region i, Sustainability i represents the sustainability of inter-provincial ecological synergy in region i, and cooperation i represents the inter-provincial ecological synergy in region i; Xi represents other control variables that may affect inter-provincial ecological synergy; coefficient β1 represents the impact of digital technology on inter-provincial ecological synergy; δ represents the regression coefficient of the control variable; εi is the residual term of the model.
4.3.2. Mediating Effect Model (Testing Hypotheses 2 and 3)
In order to explore the intrinsic mechanism of digital technology in promoting inter-provincial ecological synergy through obtaining central government support and public participation, this article refers to the intermediary effect testing method proposed by relevant studies [42,43,44] and constructs a three-step model:

In the above model, γi represents inter-provincial ecological collaboration, Medatiori is the mechanism variable, DGi represents digital technology, and Xi is the control variable. β1 in formula (4) represents the total effect of digital technology on inter-provincial ecological synergy, α1 in formula (1-5) represents the impact of digital technology on mechanism variables, and γ2 in formula (6) reflects the direct impact of mechanism variables on inter-provincial ecological synergy. Substituting formula (5) into formula (6) can obtain the indirect impact of mechanism variables on inter-provincial ecological synergy.
5. Empirical Analysis
5.1. Descriptive Statistics and Multicollinearity Testing
The descriptive statistical results of the main variables are shown in Table 3. It can be seen from the table that the mean value of inter-provincial ecological collaboration (Cooperativity) is 0 and the standard deviation is 0.730, indicating that there are certain differences in the level of inter-provincial collaboration in the sample; the mean value of digital technology (DG) is 0 and the standard deviation is 1, and the score of items within the dimension is relatively balanced; the mean values of the items of central government support (Government) and public participation (Public) are both above 3.5, indicating that the survey respondents generally recognize the role of the two in inter-provincial collaboration. The multicollinearity test shows that the maximum value of the variance inflation factor (VIF) of all variables is 4.50 (less than the critical value 10), indicating that there is no serious multicollinearity problem between variables and regression analysis can be performed.
5.2. Baseline Regression Results on the Impact of Digital Technology on Inter-Provincial Ecological Synergy in River Basins (Test of Hypotheses 1, 1a, 1b)
Taking the degree of inter-provincial ecological synergy, sustainability, and ecological collaborative governance as dependent variables, and the key independent variable is digital technology, this study uses Stata 18.0 and SPSS 25.0 statistical software for analysis, and estimates the parameters of models (1)-(3) through the ordinary least squares regression method. In order to improve the robustness of the estimation results, the correction method of heteroscedasticity-robust standard errors is used in the regression process.
Table 4 and Table 5 report the baseline regression results. As can be seen from Table 4, after controlling for personal and regional attributes: the impact coefficient of digital technology on the degree of collaboration is 0.5388 (p<0.01), hypothesis 1a is established; the impact coefficient of digital technology on the sustainability of collaboration is 0.8008 (p<0.01), hypothesis 1b is established. It can be seen from Table 5 that the impact coefficient of digital technology on inter-provincial ecological collaboration is 0.6363 (p<0.01), and hypothesis 1 is established. This result shows that digital technology has significantly improved the level of inter-provincial ecological coordination in the middle reaches of the Yangtze River basin through tool embedding (such as real-time monitoring), power restructuring (such as clarifying rights and responsibilities), and capability improvement (such as resource integration). Looking at the control variables, the impact coefficient of education (Education) on inter-provincial ecological collaboration is 0.0763 (p<0.05), indicating that highly educated staff are more receptive to digital technology and are more likely to promote collaborative governance; the impact coefficient of age (Age) is -0.0520 (p< 0.05), reflecting that young staff have greater advantages in the use of digital tools and willingness to collaborate; the impact coefficient of river importance (Importance) is -0.0277 (p<0.1), which may be due to the fact that areas with high river importance have more complex interest demands and need to further optimize the collaboration mechanism.
5.3. Endogeneity Treatment
There is a potential bidirectional causal relationship between digital technology and inter-provincial ecological collaboration: on the one hand, the in-depth application of digital technology can significantly improve the efficiency of inter-provincial ecological collaborative governance; on the other hand, the improvement of inter-provincial ecological collaborative governance efficiency can not only improve the effectiveness of regional water environment governance, but also promote the improvement of the professionalism of relevant cadres. In order to maintain a healthy development pattern of the water environment, administrative departments at all levels such as water conservancy, ecological environment, housing, and urban and rural construction generally show a policy tendency to deeply integrate digital technology. This bidirectional causal relationship can easily lead to endogeneity bias, thereby damaging the consistency and validity of model parameter estimates.
In addition to the endogeneity bias caused by bidirectional causation, the benchmark model may also face the problem of omitted variables. For example, the basic conditions of water environment governance in each province have significant time-varying characteristics, and such dynamic variables that are not included in the model may interfere with the validity of the estimation results. There is significant regional heterogeneity in the application effect of digital technology in watershed governance - there is a significant difference in the effectiveness of ecological collaborative governance between areas with well-established water environment governance infrastructure and relatively lagging areas. This heterogeneity essentially stems from the dynamic evolution of the initial governance conditions in each region, and such omitted variables are often correlated with the level of digital technology application and other explanatory variables. If not effectively controlled, it will directly destroy the unbiasedness and consistency of the model estimation results.
In order to effectively alleviate the endogeneity bias caused by bidirectional causality and omitted variables, this paper treats “digital technology” as an endogenous variable and corrects the model parameters by selecting appropriate instrumental variables (IV) to obtain consistent and unbiased estimation results. The selection of instrumental variables needs to meet two core conditions: first, it is highly correlated with the endogenous variable (digital technology) (correlation condition), and second, it is not correlated with the disturbance term (exogenous condition). Referring to the research design of Gao [35]. In order to improve the reliability of the estimation results, this paper uses the two-stage least squares method (2SLS) for empirical estimation, and the results are shown in Table 6. After using instrumental variables, the estimated coefficients of digital technology (DG) on the degree of ecological synergy, sustainability of ecological synergy and inter-provincial ecological synergy are all significantly positive at the 1% statistical level. The Hausman test results show that the test statistic is significant at the 1% statistical level (p<0.01), rejecting the null hypothesis that the explanatory variables are exogenous. The results of instrumental variable regression (IV Regression) show that after effectively controlling the two-way causality and the endogeneity bias caused by omitted variables, the promotion effect of digital technology on the degree of inter-provincial ecological synergy, the sustainability of ecological synergy and the promotion of inter-provincial ecological synergy are still robust. Hypotheses 1a, 1b and 1 have been further verified.
5.4. Robustness Test of the Impact of Digital Technology on Inter-Provincial Ecological Synergy in the River Basin
5.4.1. Re-Measurement of Digital Technology
In order to solve the impact on regression results due to measurement bias of key independent variables, a new measurement method is used to measure digital technology indicators. Referring to the discussion of scale processing methods by Wen et al. [45], the variables of the nine items of digital technology were processed and integrated, unqualified items were deleted, and all fit indicators in the factor model were adjusted until all the fit indicators in the factor model met the standard requirements. Then the arithmetic average processing was performed on the variable values of each item to obtain the scale score of digital technology. Exploratory factor analysis was used to eliminate items with factor loadings lower than 0.6 (the original item 6, “Digital technology has enabled cross-level reporting of river-related matters in the application of water pollution control”, was eliminated because of a loading of 0.582). Eight items were retained for arithmetic average and digital technology (DG_new) was re-measured. The regression results are shown in Table 7. The impact coefficients of digital technology on the degree of collaboration, sustainability of collaboration, and inter-provincial ecological collaboration are 0.1893 (p<0.1), 1.3467 (p<0.01), and 0.3824 (p<0.01) respectively, which are consistent with the baseline regression conclusion, indicating that the results are robust.
5.4.2. Eliminate Interference from Smart Water Conservancy Policy Pilot Projects
“Policy pilot” is a unique policy testing method in Chinese government management practice. Based on the practical exploration of the “Smart Water Conservancy” pilot project of the Ministry of Water Resources, the implementation of the project has significantly improved the digital and intelligent level of river basin management, effectively strengthened the execution efficiency of the river chief system in grassroots governance, and provided important support for the construction of a modern water conservancy system. Pilot areas have obvious first-mover advantages in terms of resource allocation and policy support, and their successful experience is actually the result of the joint effect of “policy dividends” and “pilot demonstration effect”. In order to control the potential bias of the policy pilot on the empirical results, this article adopts the sample screening method to eliminate the interference from the smart water conservancy policy pilot and remove the samples of cities in the middle reaches of the Yangtze River basin that are included in the “smart water conservancy” pilot of the Ministry of Water Resources (such as Wuhan, Changsha, and Nanchang), and the remaining 360 samples are returned. The results in Table 8 show that the impact coefficients of digital technology on the degree of collaboration, sustainability of collaboration, and inter-provincial ecological collaboration are 0.5749 (p<0.01), 0.7968 (p<0.01), and 0.6575 (p<0.01) respectively, which are still significantly positive, eliminating the interference of policy pilots and further verifying the reliability of the benchmark regression.
6. Mediation Effect Analysis (Test of Hypotheses 2 and 3)
In order to test Hypothesis 2 and Hypothesis 3, regression estimation was performed on formula (4). The total effect of digital technology on inter-provincial ecological synergy is shown in Table 9. The estimated coefficients of digital technology are all significantly positive, indicating that digital technology has a significant promoting effect on inter-provincial ecological synergy. Regression estimation was performed on formulas (5) and (6) respectively, and the test results are shown in Table 10 and Table 11.
6.1. The Mediating Role of Central Government Support (Test of Hypothesis 2)
Table 10 reports the results of the mediating effect of central government support. It can be seen from Table 10: 1. The impact coefficient of digital technology on central government support is 0.4720 (p<0.01), indicating that digital technology can attract central government policies, funds and technology by improving the digital level of watershed governance. 2. After including central government support, the impact coefficients of digital technology on the degree of collaboration and inter-provincial ecological collaboration are 0.4491 (p<0.01) and 0.6075 (p<0.01) respectively. The impact of central government support is The numbers are 0.1902 (p<0.01) and 0.0610 (p<0.01) respectively, indicating that central government support plays a partial mediating effect in the relationship between the two; 3. The impact coefficient of central government support on collaborative sustainability is -0.1567 (p<0.01), showing a masking mediating effect-it may be due to the “vertical intervention” of the central government that enhances the degree of collaboration in the short term, but it needs to be combined with local independent consultation in the long term to avoid excessive intervention that weakens collaborative sustainability. In summary, Hypothesis 2 is established, and central government support is an important mediating variable for digital technology to affect inter-provincial ecological collaboration.
6.2. The Mediating Role of Public Participation (Test of Hypothesis 3)
Table 11 reports the results of the mediating effect of public participation. It can be seen from Table 11: 1. The impact coefficient of digital technology on public participation is 0.5255 (p<0.01), indicating that digital platforms have significantly improved public participation by broadening participation channels (such as supervision feedback, information inquiry); 2. After including public participation, the impact coefficient of digital technology on the degree of collaboration and inter-provincial ecological collaboration are 0.4183 (p<0.01) and 0.5997 (p<0.01) respectively. The impact of public participation The coefficients are 0.2292 (p<0.01) and 0.0697 (p<0.01) respectively, indicating that public participation plays a partial mediating effect; 3. The impact coefficient of public participation on collaborative sustainability is -0.1992 (p<0.01), which also shows a masking mediating effect—it may be due to the “short-term pressure” of public supervision to promote the implementation of collaborative measures, but long-term consensus building (such as the cultivation of ecological values) is needed to maintain collaborative relationships. In summary, Hypothesis 3 is established, and public participation is the key mediating variable for digital technology to affect inter-provincial ecological collaboration. Table 11 Test of the mechanism of digital technology and inter-provincial ecological synergy (public participation).
6.3. Further Test of Mediation Effect
In order to further test the mediating effect, this paper uses the Bootstrap method to conduct 1,000 repeated samplings to test the mediating role of central government support and public participation in the impact of digitalization on inter-provincial ecological collaboration. The test results are shown in Table 12. The results show that in the context of central government support as the key intermediary path, in the path of “digital technology →central government support →ecological synergy degree”, “digital technology →central government support → ecological synergy sustainability” and “digital technology → central government support → inter-provincial ecological synergy”, their indirect effect confidence intervals are [0.039,0.150], [-0.135,-0.030], [0.012,0.053], the confidence interval does not include 0, and the corresponding P values are 0.002, 0.008, and 0.005 respectively, indicating that the indirect impact is significant, further verifying that central government support plays a mediating effect between digital technology and inter-provincial ecological collaboration. When public participation is used as the mechanism variable, in the path of “digital technology→ public participation→ecological synergy degree”, “digital technology→public participation→ecological synergy sustainability” and “digital technology→public participation→inter-provincial ecological synergy”, their indirect effect confidence intervals are [0.061, 0.194] and [-0.170, -0.050], [0.017, 0.061], the confidence interval does not include 0, and the corresponding P values are 0.000, 0.001, and 0.001 respectively, indicating that the indirect effects are significant. This indicates that public participation plays a mediating effect between digital technology and inter-provincial ecological synergy, which is consistent with the test results using the stepwise regression method.
7. Conclusions and Policy Suggestions
7.1. Research Conclusions and Discussion
This study takes the middle reaches of the Yangtze River Basin as the research object, and based on 402 micro-survey data from water conservancy, environmental protection and other departments, deconstructs the characteristics of digital technology from the three-dimensional dimensions of tools, power, and capabilities. Through factor analysis, mediation effect models, and a series of robustness tests, it systematically reveals the impact mechanism of digital technology on inter-provincial ecological synergy in the basin, and provides new theoretical and empirical support for solving the contradiction between “ecological integrity and governance fragmentation” in cross-regional watersheds.
The primary conclusion of the study shows that digital technology has a significant positive driving effect on inter-provincial ecological coordination in the middle reaches of the Yangtze River Basin, and this conclusion is highly robust. The benchmark regression results show that the total impact coefficient of digital technology on inter-provincial ecological collaboration reaches 0.6363 (p<0.01), of which the impact coefficients on the degree of collaboration and sustainability of collaboration are 0.5388 (p<0.01) and 0.8008 (p<0.01) respectively. This effect still holds true after robustness tests such as re-measurement with digital techniques (eliminating items with factor loadings lower than 0.6) and elimination of interference from smart water conservancy pilot cities. Moreover, after the two-stage least squares (2SLS) method is used to deal with the endogeneity problems caused by bidirectional causality and omitted variables, the estimation results are more reliable. Digital technology enables real-time sharing of cross-domain information through tool embedding (such as the river chief information management system, real-time pollution reporting APP), uses power reconstruction to clarify inter-provincial governance rights and responsibilities, and relies on capabilities to improve and optimize resource allocation and decision-making efficiency, effectively breaking down “information islands” and easing governance barriers brought by administrative boundaries.
Secondly, central government support and public participation play a partial mediating effect in the process of digital technology affecting inter-provincial ecological synergy. The impact coefficient of digital technology on central government support is 0.4720 (p<0.01), and the impact coefficient on public participation is 0.5255 (p<0.01), indicating that digital transformation can effectively leverage central policy preferences, financial investment and technical support, while broadening public supervision, feedback and participation channels. The intermediary effect test shows that central government support and public participation indirectly improve the degree and overall level of inter-provincial ecological synergy through policy guarantees, fund supply, social supervision and consensus building. The confidence intervals of the indirect effects do not include 0, which verifies the significance of the intermediary path.
It is worth noting that central government support and public participation have a masking intermediary effect on inter-provincial ecological collaborative sustainability. The impact coefficients of the two on the sustainability of collaboration are -0.1567 (p<0.01) and -0.1992 (p<0.01) respectively, which means that although the central government’s vertical intervention can promote the implementation of collaborative policies in the short term, excessive intervention may inhibit local independent negotiation space; short-term pressure brought by public supervision can accelerate governance response, but a participation model that lacks consensus and cohesion is difficult to maintain long-term collaboration. This discovery reveals the complexity of digital technology empowering inter-provincial ecological collaboration, and also provides a key entry point for optimizing governance mechanisms.
The theoretical contribution of this study is to refine the three-dimensional dimension of digital technology in the watershed governance scenario, expand the analysis of the interactive mechanism of “technology-subject-synergy”, and optimize the research method that combines micro-investigation and factor analysis. At the practical level, the research conclusions provide an operational path for digital collaborative governance in the middle reaches of the Yangtze River Basin, and at the same time provide Chinese experience for countries at different development stages around the world to solve the dilemma of cross-basin watershed governance and promote the implementation of SDGs.
The study still has limitations. The sample focuses on the middle reaches of the Yangtze River. The universality of the conclusions needs to be further verified. Moreover, the data are mainly based on subjective ratings and lack cross-confirmation of objective monitoring data. In the future, the sample coverage can be expanded, a longitudinal research design can be used to track the dynamic evolution of collaborative mechanisms, and multi-source data can be integrated to improve the comprehensiveness and accuracy of the research.
7.2. Policy Recommendations
Combining the empirical conclusions with the governance practices of the middle reaches of the Yangtze River Basin, the following targeted recommendations are put forward.
Build a digital collaborative policy support system for the basin and strengthen the “top-level design” role of the central government. The first is to establish an inter-ministerial watershed coordination agency: led by deputy national-level leaders, coordinating the central ministries and commissions such as water conservancy, ecological environment, and natural resources and the three provinces of Hubei, Hunan, and Jiangxi, and holding regular inter-provincial collaboration meetings to coordinate and resolve issues such as “inconsistent data standards” and “ambiguous division of rights and responsibilities” in the application of digital technology; second, the establishment of a special fund for digital collaboration: the central finance arranges a special fund for digital collaboration in the middle reaches of the Yangtze River Basin, focusing on support The construction of digital twin river basins and cross-domain data sharing platforms, while formulating a three-level cost-sharing mechanism of “central-provincial-municipal”, to prevent local governments from giving up on digital transformation due to funding gaps; third, unifying river basin data standards: Led by the Yangtze River Water Conservancy Commission, the “Data Sharing Specifications for Ecological Governance in the Middle Reaches of the Yangtze River Basin” was formulated to clarify the format and sharing scope of data such as water quality monitoring, pollution emissions, and river patrol records, and break “data silos”.
Build a digital and intelligent public participation platform and optimize the “government-public” interaction mechanism. The first is to improve the public participation functional module: add “cross-provincial supervision” and “collaborative suggestions” columns to the existing He (Lake) Chang APP, allowing the public to upload cross-provincial pollution clues, and the platform will automatically push them to the relevant provincial governance departments and provide real-time feedback on the processing progress; the second is to carry out digital training for the public: train the public through online courses, offline lectures, etc. Use digital tools to obtain watershed management information, participate in supervision, and improve the public’s digital literacy and participation ability; third, establish an incentive mechanism for public participation: public members who provide effective pollution clues and make reasonable collaborative suggestions will be given ecological points (can be exchanged for scenic spot tickets, public transportation discounts, etc.) to stimulate public enthusiasm for long-term participation and alleviate the masking intermediary effect.
Promote the in-depth integration of digital technology and watershed governance to enhance collaborative sustainability. The first is to strengthen the empowerment of digital technology capabilities: use big data to analyze weak links in inter-provincial collaboration (such as the delayed response to cross-domain pollution prevention and control) to provide data support for inter-provincial negotiations; use artificial intelligence to simulate the effects of different collaboration plans to improve the accuracy of decision-making; the second is to optimize the central government’s intervention methods: the central government reduces direct intervention in the details of local collaboration and instead guides local independent collaboration through “performance evaluation” Business - Incorporate the application level of digital technology and public participation satisfaction into the inter-provincial collaborative assessment indicators to promote the transformation of collaboration from “administrative promotion” to “endogenous drive”; the third is to cultivate a collaborative culture in the river basin: promote the concept of ecological community in the middle reaches of the Yangtze River Basin through digital platforms, organize the three provinces to jointly carry out “Yangtze River Ecological Protection” themed activities, enhance the public and government’s river basin identity, and provide a cultural foundation for collaborative sustainability.
References
- Group I E. Water and Development: An Evaluation of World Bank Support, 1997-2007, Volume 2. Appendixes. World Bank Publications 2010, 2, 3226. [Google Scholar]
- Kebede, T.S. The influence of domestic politics on the transboundary water interactions in the Eastern Nile. International Environmental Agreements: Politics, Law and Economics 2025, 25, 1–20. [Google Scholar] [CrossRef]
- Krapesch, M; Klösch, M; ten Brinke, W; et al. The Rhine Catchment: A Review of Sediment-Related Knowledge, Monitoring, and a Future Research Perspective. Water 2024, 16, 1121. [Google Scholar] [CrossRef]
- Sommerwerk, N; Hein, T; Schneider-Jakoby, M; et al. The Danube river basin. Rivers of Europe 2009, 68, 59–112. [Google Scholar]
- Alvarenga, A.; Matos, F.; Godina, R.; Matias, J. Digital Transformation and Knowledge Management in the Public Sector. Sustain. 2020, 12, 5824. [Google Scholar] [CrossRef]
- Dawes, S S. The Evolution and Continuing Challenges of E-Governance. Public Adm. Rev. 2008, 68, S86–S102. [Google Scholar] [CrossRef]
- Mager, A.; Katzenbach, C. Future Imaginaries in the Making and Governing of Digital Technology: Multiple, Contested, Commodified. New Media Soc. 2021, 23, 223–236. [Google Scholar] [CrossRef]
- Cenci, K.; Fillottrani, P.; Ardenghi, J. Government Data Interoperability: A Case Study from Academia; 2017. [Google Scholar]
- Langley, P.; Leyshon, A. Platform capitalism: The intermediation and capitalisation of digital economic circulation. Financ. Soc. 2017, 3, 11–31. [Google Scholar] [CrossRef]
- Huang, B.; Yu, J.X. Leading Digital Technologies for Coproduction: The Case of “Visit Once” Administrative Service Reform in Zhejiang Province, China. J. Chin. Polit. Sci. 2019, 24, 513–532. [Google Scholar] [CrossRef]
- Klenk, T. Towards Digital Era Governance? Examining Health Policy through the Lens of Public Administration. Mod. Staat 2025, 17, 263–282. [Google Scholar]
- Alméstar, M.; Romero-Muñoz, S.; Mestre, N. Breaking Silos: A Systemic Portfolio Approach and Digital Tool for Collaborative Urban Decarbonisation. Sustain. 2025, 17, 1545. [Google Scholar] [CrossRef]
- Aksoy, C. Digital Business Ecosystems: An Environment of Collaboration, Innovation, and Value Creation in the Digital Age. J. Bus. Res. 2023, 158, 113–124. [Google Scholar] [CrossRef]
- Hou, M.; Dou, T.; Huang, X.; Yang, Z. Techno-Structural Disconnects in Digital Governance: Mechanisms, Challenges and Adaptive Pathways for Social Governance Innovation - A Case Study of Mengzi’s Comprehensive Law Enforcement Platform. Human. Soc. Sci. Res. 2025, 8, 176–190. [Google Scholar]
- Berigüete, F.E.; Santos, J.S.; Rodriguez Cantalapiedra, I. Digital Revolution: Emerging Technologies for Enhancing Citizen Engagement in Urban and Environmental Management. Land. 2024, 13, 1921. [Google Scholar] [CrossRef]
- Liu, H.; Su, H.; Li, H. Study on Digital Twin Technologies for Watershed Information Modeling (WIM): A Systematic Literature Review and Bibliometric Analysis. Arch. Comput. Methods Eng. 2024, 31, 263–289. [Google Scholar] [CrossRef]
- Sidorenko, E.L.; Bartsits, I.N.; Khisamova, Z.I. The efficiency of digital public administration assessing: Theoretical and applied aspects. Public Adm Issues 2019, 2, 93–114. [Google Scholar]
- Dong, F.G.; Shi, M.X.; Li, W.Y. Research on Ecological Protection Mechanisms in Watersheds Based on Evolutionary Games-Inter-provincial and Intra-provincial Perspectives. Water. Resour. Manag. 2024, 38, 2377–2397. [Google Scholar] [CrossRef]
- Baudoin, L.; Gittins, J.R. The ecological outcomes of collaborative governance in large river basins: Who is in the room and does it matter? J. Environ. Manage 2021, 281, 111836. [Google Scholar] [CrossRef] [PubMed]
- Fenten, T.; Dieperink, C. Governance Conditions for a Successful Restoration of Riverine Ecosystems, Lessons from the Rhine River Basin. Water 2024, 16, 2983. [Google Scholar] [CrossRef]
- Hasan, F.U.; Dare, L.; Sinclair, D. Governing groundwater in the Indus Basin: Barriers to effective groundwater management and pathways for reform. Environ. Sci. Policy 2025, 173, 104247. [Google Scholar] [CrossRef]
- Liu, M.; You, L.; Ye, X.; Hu, C.M. Optimizing regional water resources management considering ecological water demand priority for Mahaweli River watershed, Sri Lanka. Water Sci. Technol. 2025, 92, 991–1020. [Google Scholar] [CrossRef] [PubMed]
- Chen, S.L. From Community-based Management to Transboundary Watershed Governance. Development 2008, 51, 83–88. [Google Scholar] [CrossRef]
- Yi, Y.X.; Ding, C.N.; Fu, C.Y.; Li, Y.Q. Transboundary watershed pollution control and product market competition with ecological compensation and emission tax: a dynamic analysis. Environ. Sci. Pollut. Res. 2022, 29, 41037–41052. [Google Scholar] [CrossRef] [PubMed]
- Wei, Q.S.; Yang, S.T. Logical Route, Realistic Dilemma and Promotion Path of Cross-domain Ecological Environment Collaborative Governance. Acad. J. Manag. Soc. Sci. 2025, 12, 12–17. [Google Scholar] [CrossRef]
- Huang, X.F.; Qiu, W.J.; Dai, X.; Hua, W. Evaluation of the Synergy Degree of Watershed Collaborative Governance: A Case Study of Taihu Basin, China. Water 2022, 14, 2981. [Google Scholar] [CrossRef]
- Zhang, T.; Zhang, K. Establishment and Application of Modern Ecological Governance Systems from the Perspective of Digital Empowerment. Sustain. 2025, 17, 456–470. [Google Scholar] [CrossRef]
- Fleming, C.S.; Brown, A.; Gerlak, A.K.; Bieber, K. Engaging farmers in water governance in the Western United States: lessons from the Colorado River Basin. Socio-Ecol. Pract. Res. 2024, 6, 397–409. [Google Scholar] [CrossRef]
- Wu, Z.Z.; Zhang, Y.; Chen, Q.H.; Wang, H. Attitude of Chinese public towards municipal solid waste sorting policy: A text mining study. Sci. Total Environ. 2021, 756, 142674. [Google Scholar] [CrossRef]
- Wilson, A.; Tewdwr-Jones, M.; Comber, R. Urban planning, public participation and digital technology: App development as a method of generating citizen involvement in local planning processes. Environ. Plan. B Urban Anal. City Sci. 2019, 46, 286–302. [Google Scholar] [CrossRef]
- Blühdorn, I.; Deflorian, M. The Collaborative Management of Sustained Unsustainability: On the Performance of Participatory Forms of Environmental Governance. Sustain. 2019, 11, 1189. [Google Scholar] [CrossRef]
- Perkins, P.E. Public participation in watershed management: International practices for inclusiveness. Phys. Chem. Earth 2011, 36, 204–212. [Google Scholar] [CrossRef]
- Waylen, K.A.; Blackstock, K.L.; Marshall, K.; Juarez-Bourke, A. Navigating or adding to complexity? Exploring the role of catchment partnerships in collaborative governance. Sustain. Sci. 2023, 18, 2533–2548. [Google Scholar] [CrossRef]
- Feroz, A.K.; Zo, H.J.; Chiravuri, A. Digital Transformation and Environmental Sustainability: A Review and Research Agenda. Sustain. 2021, 13, 1530. [Google Scholar] [CrossRef]
- Gao, X.; Shen, J.Q.; He, W.J.; Sun, F.H.; Zhang, Z.F.; Zhang, X.; Yuan, L.; An, M. Multilevel Governments’ Decision-Making Process and Its Influencing Factors in Watershed Ecological Compensation. Sustain. 2019, 11, 1990. [Google Scholar] [CrossRef]
- Dai, J.; Yang, Y.H.; Zeng, Y.; Yang, P.S.; Liu, Y. The Evolutionary Game Analysis of Public Opinion on Pollution Control in the Citizen Journalism Environment. Water 2022, 14, 3902. [Google Scholar] [CrossRef]
- Sáez-Ardura, F.; Parra-Salazar, M.; Vallejos-Romero, A. Exploring the Socio-Environmental Regulation of Water-A Systematic Review of Sustainable Watershed Management. Sustain. 2025, 17, 1588. [Google Scholar] [CrossRef]
- Morehead, H.U. Rural health network effectiveness: An analysis at the network level. Ph.D, 2008. [Google Scholar]
- Cordes, C.L.; Dougherty, T.W. A Review and Integration of Research on Job Burnout. Acad. Manage. Rev. 1993, 18, 621–656. [Google Scholar] [CrossRef]
- Xie, L.L.; Yang, L.H. The Influence of Perceptions of Promotion Opportunities on Job Performance and its Mechanisms: A Case Study of Chinese Junior Civil Servants. J. Contemp. China 2021, 30, 118–135. [Google Scholar] [CrossRef]
- Song, C.Z.; Liu, Q.F.; Song, J.P.; Ma, W. Impact path of digital economy on carbon emission efficiency: Mediating effect based on technological innovation. J. Environ. Manage 2024, 358, 120940. [Google Scholar] [CrossRef]
- Li, Y.; Dai, J.; Cui, L. The impact of digital technologies on economic and environmental performance in the context of industry 4.0: A moderated mediation model. Int. J. Prod. Econ. 2020, 229, 107777. [Google Scholar] [CrossRef]
- Cao, W.B.; Wang, H.; Ying, H.H. The Effect of Environmental Regulation on Employment in Resource-Based Areas of China-An Empirical Research Based on the Mediating Effect Model. Int. J. Environ. Res. 2018, 14, 1598. [Google Scholar] [CrossRef] [PubMed]
- Yang, G.L.; Zha, D.L.; Wang, X.J.; Chen, Q. Exploring the nonlinear association between environmental regulation and carbon intensity in China: The mediating effect of green technology. Ecol. Indic. 2020, 114, 106309. [Google Scholar] [CrossRef]
- Wen, Z.L.; Huang, B.B.; Tang, D.D. Preliminary Work for Modeling Questionnaire. Data.J. Psychol. Sci. 2018, 41, 204–210. [Google Scholar]
Figure 1.
Mechanism framework of inter-provincial ecological collaboration driven by digital technology in river basins.
Figure 1.
Mechanism framework of inter-provincial ecological collaboration driven by digital technology in river basins.
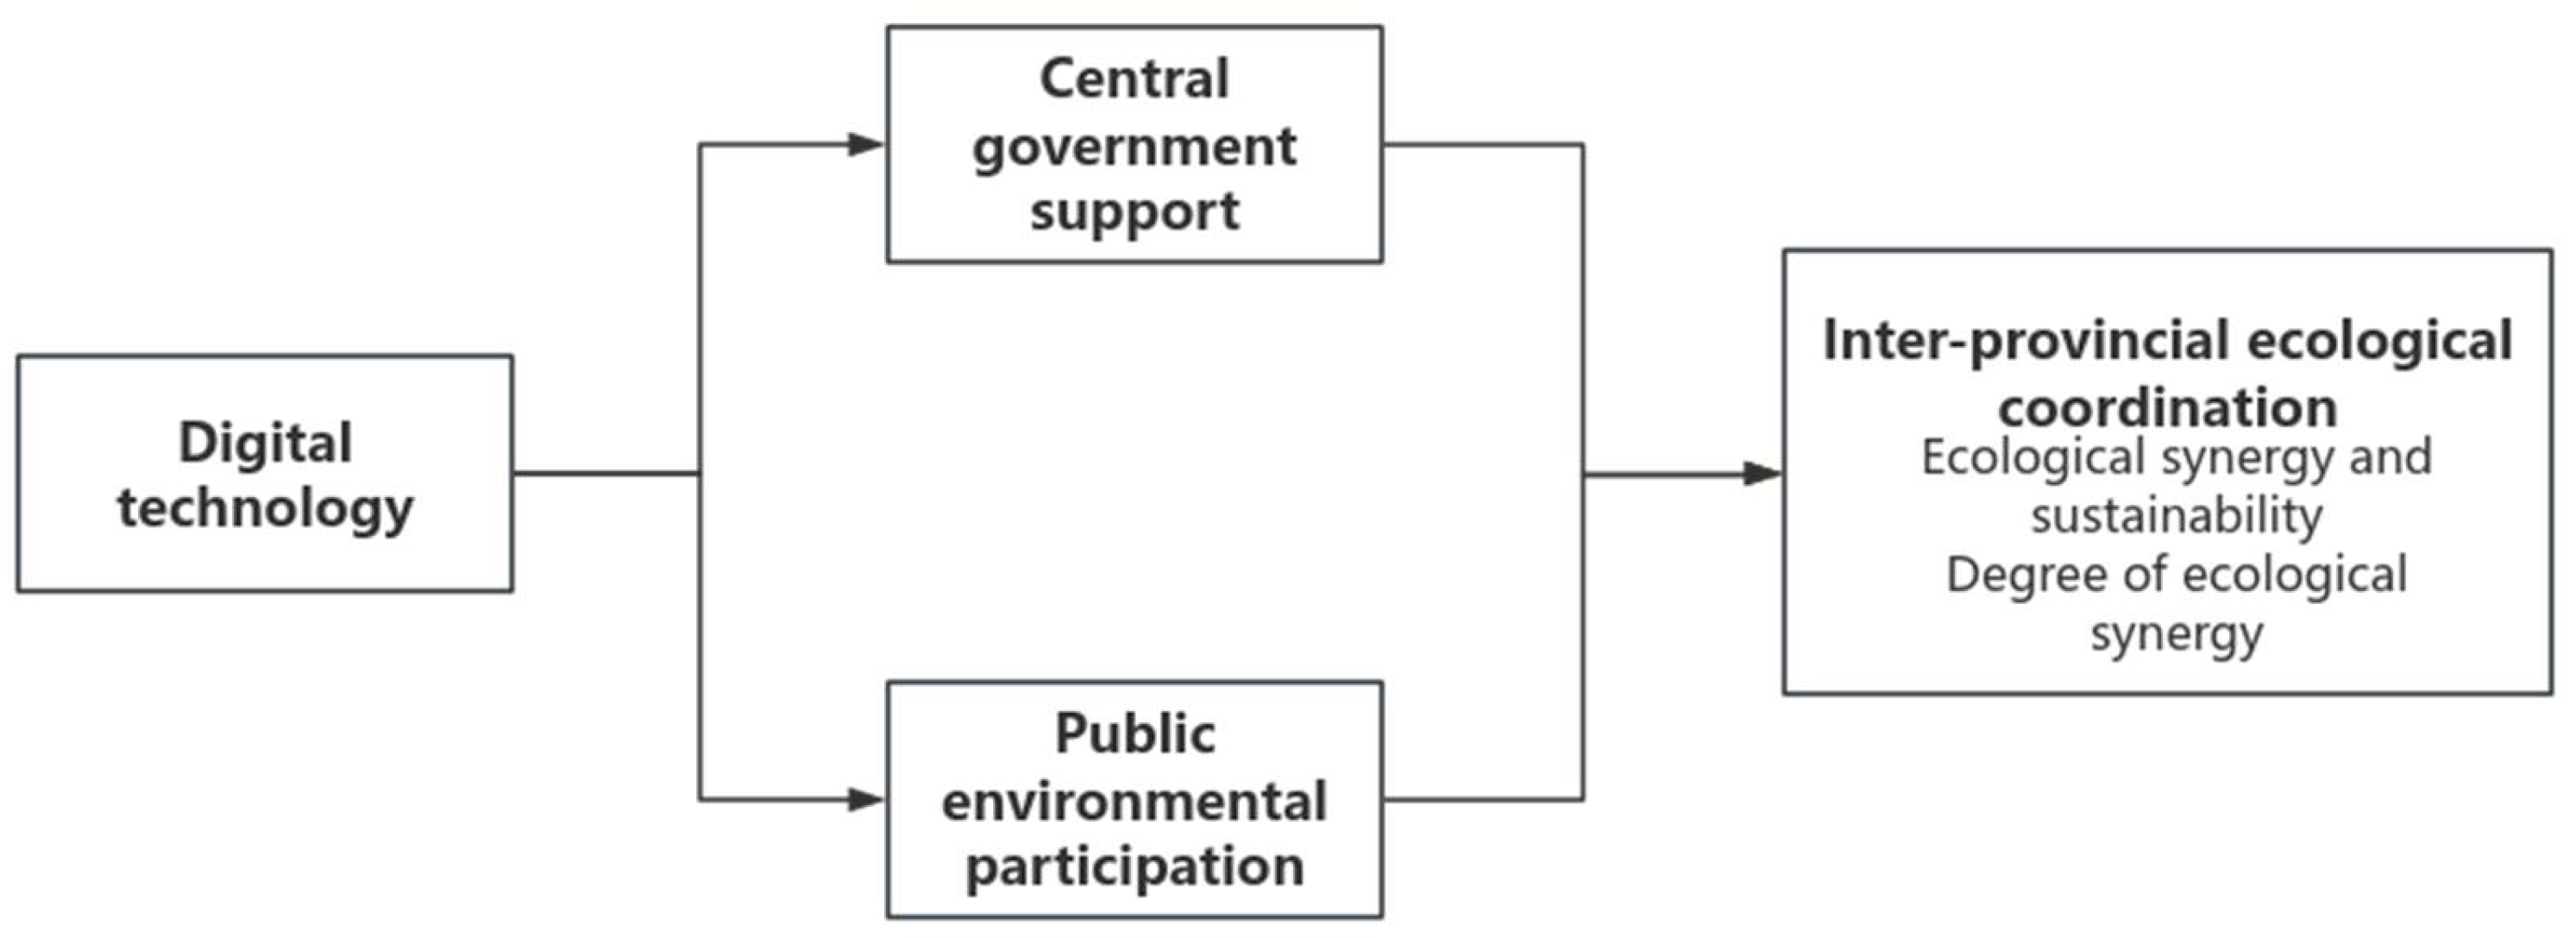

Table 1.
The meaning and value assignment of inter-provincial ecological collaboration and digital technology variables.
Table 1.
The meaning and value assignment of inter-provincial ecological collaboration and digital technology variables.
| Variable | Variable description and assignment | Mean | Standard deviation |
| Degree of ecological synergy | ① We have jointly formulated corresponding water pollution control strategies and industrial adjustment plans with neighboring provinces: completely non-compliant =1; It doesn't quite conform to =2; Uncertainty =3; It basically conforms to =4; It fully conforms to =5 | 3.42 | 1.109 |
| ② We have jointly allocated funds with other cities specifically for water pollution control, and the funds are sufficient: completely not in line with =1; It doesn't quite conform to =2; Uncertainty =3; It basically conforms to =4; It fully conforms to =5 | 3.42 | 1.123 | |
| ③ We have established cooperative relations with other cities and have formed corresponding cooperation frameworks and institutions: completely inconsistent =1; It doesn't quite conform to =2; Uncertainty =3; It basically conforms to =4; It fully conforms to =5 | 3.37 | 1.173 | |
| Ecological synergy sustainability | ① The motivation for mutual collaboration between us and the river chief offices and relevant functional departments of neighboring provinces has been enhanced: completely inconsistent =1; It doesn't quite conform to =2; Uncertainty =3; It basically conforms to =4; Fully in line with =5③ : completely does not conform to =1; It doesn't quite conform to =2; Uncertainty =3; It basically conforms to =4; It fully conforms to =5 | 3.45 | 1.154 |
| ② The cooperation areas between us and the river chief offices and relevant functional departments of neighboring provinces have been expanded, providing more cooperation opportunities for both sides: completely non-in line with =1; It doesn't quite conform to =2; Uncertainty =3; It basically conforms to =4; We expect that such a cooperative governance model can continue to develop in a way that fully conforms to =5 | 3.35 | 1.16 | |
| ③ We expect such a cooperative governance model to continue to develop: completely inconsistent with =1; It doesn't quite conform to =2; Uncertainty =3; It basically conforms to =4; It fully conforms to =5 | 3.37 | 1.116 | |
| Digital technology | I often use the APP to report my lake patrol status and provide feedback and handle various matters related to the river: Completely non-compliant =1; It doesn't quite conform to =2; Uncertainty =3; It basically conforms to =4; Completely in line with =5 | 3.42 | 1.109 |
| ② I often follow and browse public accounts related to water management: Completely not in line with =1; It doesn't quite conform to =2; Uncertainty =3; It basically conforms to =4; It fully complies with =5 | 3.42 | 1.123 | |
| ③ I often use the river (lake) Chief information management system platform: It completely does not comply with =1; It doesn't quite conform to =2; Uncertainty =3; It basically conforms to =4; It fully complies with =5 | 3.37 | 1.173 | |
| ④ The local river chief office or its relevant functional department uses digital technology means (such as information release management platforms) to share relevant information on water management with the local river chief office of neighboring provinces: It completely does not comply with =1; It doesn't quite conform to =2; Uncertainty =3; It basically conforms to =4; It fully complies with =5 | 3.45 | 1.154 | |
| ⑤ The local river chief office or its relevant functional departments have introduced functions such as public opinion analysis, public participation, and public supervision on the digital platform: it completely does not comply with =1; It doesn't quite conform to =2; Uncertainty =3; It basically conforms to =4; It fully complies with =5 | 3.34 | 1.135 | |
| ⑥ The application of digital technology in water pollution control has achieved the reporting of river-related matters beyond higher levels: It completely does not comply with =1; It doesn't quite conform to =2; Uncertainty =3; It basically conforms to =4; It fully complies with =5 | 3.37 | 1.116 | |
| ⑦ Local river chief offices and relevant functional departments often use digital platforms and other means to provide professional work training services for the public involved in water management: It completely does not comply with =1; It doesn't quite conform to =2; Uncertainty =3; It basically conforms to =4; Fully in line with =5 | 3.39 | 1.168 | |
| ⑧ The digital technology infrastructure in this region can well meet the demands of water control work: completely not in line with =1; It doesn't quite conform to =2; Uncertainty =3; It basically conforms to =4; | 3.35 | 1.16 | |
| ⑨Digital technology has enhanced the precise governance capabilities of local river chief offices and relevant functional departments: completely inconsistent with =1; It doesn't quite conform to =2; Uncertainty =3; It basically conforms to =4; It fully conforms to =5 | 3.39 | 1.198 |
Table 2.
Meaning and assignment of central government support and public participation variables.
| Mechanism variable | Variable description and assignment | Mean | Standard deviation |
|---|---|---|---|
| Central government support | ① The central government attaches great importance to the coordinated governance of pollution in river basins and has issued relevant notices or official documents: completely non-compliant =1; It doesn’t quite conform to =2; Uncertainty =3; It basically conforms to =4; It fully conforms to =5 | 3.66 | 1.043 |
| ② The central government has allocated special funds for pollution control in river basins: completely inconsistent =1; It doesn’t quite conform to =2; Uncertainty =3; It basically conforms to =4; It fully conforms to =5 | 3.66 | 1.025 | |
| ③ The central government has allocated special funds for pollution control in river basins: completely inconsistent =1; It doesn’t quite conform to =2; Uncertainty =3; It basically conforms to =4; It fully conforms to =5 | 3.63 | 1.080 | |
| ④ The continuous supervision of the central government has played a significant role: complete non-compliance =1; It doesn’t quite conform to =2; Uncertainty =3; It basically conforms to =4; It fully conforms to =5 | 3.57 | 1.088 | |
| Public participation indicators | ① Public participation is a key factor in promoting effective pollution control in river basins: completely inconsistent =1; It doesn’t quite conform to =2; Uncertainty =3; It basically conforms to =4; Full compliance =5 | 3.70 |
0.987 |
| ② Public supervision is a key factor in promoting effective pollution control in river basins: Complete non-compliance =1; It doesn’t quite conform to =2; Uncertainty =3; It basically conforms to =4; Full compliance =5 | 3.69 | 0.977 | |
| ③ Public concern is an important factor in promoting effective pollution control in river basins: complete non-compliance =1; It doesn’t quite conform to =2; Uncertainty =3; It basically conforms to =4; Full compliance =5 | 3.69 | 1.006 | |
| ④ Newspapers and news media have played a significant role in supervision: completely non-compliant =1; It doesn’t quite conform to =2; Uncertainty =3; It basically conforms to =4; It fully conforms to =5 | 3.62 | 0.995 | |
| The code for the central government support variable: “government” is calculated through factor analysis | 0.00 | 1 | |
| The public participation variable code: public is calculated through factor analysis | 0.00 | 1 | |
Table 3.
Variable definitions and descriptive statistics.
| Variable | Variable code | Variable description and assignment | Mean | Standard deviation |
| Dependent variable | ||||
| Degree of ecological synergy | Degree | The Bartlett standardized score of the “degree factor” | 0.00 | 1 |
| Ecological synergy and sustainability | Sustainability | The Bartlett standardized score of the “Sustainability factor” | 0.00 | 1 |
| Inter-provincial ecological coordination | Cooperativity | The “degree factor” and the “sustainability factor” are obtained by weighted averaging the variance contribution rate | 0.00 | 0.730 |
| Key independent variable | ||||
| Digital technology | DG | It is calculated by factor analysis | 0.00 | 1 |
| Control variable | ||||
| Gender | Gender | Your gender: Male =1; Female =2 | 1.51 | 0.500 |
| Educational background | Education | Your educational background: Junior high school or below =1; High school or technical secondary school =2; Junior college =3; Undergraduate degree =4; Master’s degree or above =5 | 3.16 | 0.899 |
| Age | Age | Your age: 35 and under =1; 36 to 40 years old =2; 41 to 45 years old =3; 46 to 50 years old =4; Over 50 years old =5 | 3.39 | 0.773 |
| The Importance of rivers | Importance | How important are rivers in the economic and social development of this region: unimportant =1; Optional =2; Generally =3; Relatively important =4; Very important =5 | 3.32 | 1.147 |
| Years of working experience | Seniority | Five years or less =1; 6 to 10 years =2; 11 to 15 years =3; 16 to 20 years =4; 20 years or more =5 | 2.61 | 1.321 |
| The pollution status of rivers | Pollution | The degree of water environment pollution in the area where it is located: Severe pollution =1; Greater pollution =2; Some pollution =3; There is no pollution =4; No pollution at all =5 | 2.74 | 1.096 |
Table 4.
Benchmark regression results on the impact of digital technology on inter-provincial ecological synergy and sustainability.
Table 4.
Benchmark regression results on the impact of digital technology on inter-provincial ecological synergy and sustainability.
| Variable | Model One: Degree of Ecological Synergy | Model Two: Ecological Synergistic Sustainability | ||
| (1) | (2) | (3) | (4) | |
| DG | 0.6455*** (0.0290) |
0.5388*** (0.0846) |
0.7223*** (0.0265) |
0.8008*** (0.0764) |
| Gender | 0.0835 (0.0763) |
-0.0729 (0.0691) |
||
| Education | 0.2451** (0.0979) |
-0.2084** (0.0892) |
||
| Age | -0.2029*** (0.0577) |
0.2025*** (0.0543) |
||
| Importance | -0.0609 (0.0436) |
0.0283 (0.0382) |
||
| Seniority | 0.0001 (0.0305) |
0.0108 (0.0277) |
||
| Pollution | 0.0202 (0.0423) |
-0.0193 (0.0380) |
||
| N | 402 | 402 | 402 | 402 |
| R2 | 0.4166 | 0.4468 | 0.5217 | 0.5478 |
| F-Value | 496.76*** | 72.74*** | 741.93*** | 116.45*** |
Note: The ones in parentheses are robust standard errors; ***, **, and * represent that the regression results are significant at the 1%, 5%, and 10% statistical levels respectively.
Table 5.
Benchmark regression results on the impact of digital technology on inter-provincial ecological collaboration.
Table 5.
Benchmark regression results on the impact of digital technology on inter-provincial ecological collaboration.
| Variable | Model Three: Inter-provincial Ecological Synergy | |
| (1) | (2) | |
| DG | 0.6741*** (0.0110) |
0.6363*** (0.0321) |
| Gender | 0.0253 (0.0279) |
|
| Education | 0.0763** (0.0361) |
|
| Age | -0.0520** (0.0208) |
|
| Importance | -0.0277* (0.0162) |
|
| Seniority | 0.0041 (0.0111) |
|
| Pollution | 0.0055 (0.0157) |
|
| N | 402 | 402 |
| R2 | 0.8530 | 0.8581 |
| F-Value | 3770.29*** | 562.79*** |
Note: The ones in parentheses are robust standard errors; ***, **, and * represent that the regression results are significant at the 1%, 5%, and 10% statistical levels respectively.
Table 6.
Estimation results of instrumental variables (2SLS).
| Variable | Degree of ecological synergy | Ecological synergy and sustainability | Inter-provincial ecological coordination |
| (1)2SLS | 2SLS | 2SLS | |
| DG | 0.7244*** (0.0854) |
0.6565*** (0.0779) |
0.6991*** (0.0322) |
| Control variable | YES | YES | YES |
| N | 402 | 402 | 402 |
| R2 | 0.4413 | 0.5445 | 0.8570 |
Note: The ones in parentheses are robust standard errors; ***, **, and * indicate significance at the 1%, 5%, and 10% statistical levels respectively; control variables have been included in the regression but the results are not listed.
Table 7.
Robustness Check: Remeasurement of Digital Technology.
| Variable | Degree of ecological synergy | Ecological synergy and sustainability | Inter-provincial ecological coordination |
| DG | 0.1893* (0.1110) |
1.3467*** (0.0748) |
0.3824*** (0.0513) |
| Control variable | YES | YES | YES |
| N | 402 | 402 | 402 |
| R2 | 0.4050 | 0.6815 | 0.7722 |
| F-Value | 51.98*** | 163.59*** | 265.68*** |
| Degree of ecological synergy | Ecological synergy and sustainability | Inter-provincial ecological coordination |
Note: The ones in parentheses are robust standard errors; ***, **, and * represent that the regression results are significant at the 1%, 5%, and 10% statistical levels respectively.
Table 8.
Robustness test: eliminating interference from smart water conservancy policy pilots.
| Variable | Degree of ecological synergy | Ecological synergy and sustainability | Inter-provincial ecological coordination |
| DG | 0.5749*** (0.0915) |
0.7968*** (0.0842) |
0.6575*** (0.0346) |
| Control variable | YES | YES | YES |
| N | 360 | 360 | 360 |
| R2 | 0.4427 | 0.5462 | 0.8552 |
| F-Value | 68.75*** | 110.58*** | 531.81*** |
Note: The ones in parentheses are robust standard errors; ***, **, and * represent that the regression results are significant at the 1%, 5%, and 10% statistical levels respectively.
Table 9.
Stepwise regression method test results (total effect).
| Variable | Degree of ecological synergy | Ecological synergy and sustainability | Inter-provincial ecological coordination |
| DG | 0.5388*** (0.0846) |
0.8008*** (0.0764) |
0.6363*** (0.0321) |
| Control variable | YES | YES | YES |
| N | 402 | 402 | 402 |
| R2 | 0.4468 | 0.5478 | 0.8581 |
| F-Value | 72.74*** | 116.45*** | 562.79*** |
Table 10.
Test of the mechanism of digital technology and inter-provincial ecological synergy (supported by the central government).
Table 10.
Test of the mechanism of digital technology and inter-provincial ecological synergy (supported by the central government).
| Variable | Central government support | Degree of ecological synergy | Ecological synergy and sustainability | Inter-provincial ecological coordination |
| DG | 0.4720*** (0.1001) |
0.4491*** (0.0851) |
0.8748*** (0.0773) |
0.6075*** (0.0323) |
| Central government support | 0.1902*** (0.0464) |
-0.1567*** (0.0440) |
0.0610*** (0.0171) |
|
| Control variable | YES | YES | YES | YES |
| N | 402 | 402 | 402 | 402 |
| R2 | 0.3733 | 0.4694 | 0.5632 | 0.8625 |
| F-Value | 45.98*** | 70.03*** | 103.27*** | 489.06*** |
Note: The ones in parentheses are robust standard errors; ***, **, and * represent that the regression results are significant at the 1%, 5%, and 10% statistical levels respectively.
Table 11.
Test of the mechanism of digital technology and inter-provincial ecological synergy (public participation).
Table 11.
Test of the mechanism of digital technology and inter-provincial ecological synergy (public participation).
| Variable | Central government support | Degree of ecological synergy | Ecological synergy and sustainability | Inter-provincial ecological coordination |
| DG | 0.5255*** (0.0998) |
0.4183*** (0.0876) |
0.9055*** (0.0792) |
0.5997*** (0.0330) |
| Public participation | 0.2292*** (0.0466) |
-0.1992*** (0.0444) |
0.0697*** (0.0166) |
|
| Control variable | YES | YES | YES | YES |
| N | 402 | 402 | 402 | 402 |
| R2 | 0.3817 | 0.4793 | 0.5723 | 0.8638 |
| F-Value | 46.41*** | 73.83*** | 105.09*** | 501.62*** |
Note: The ones in parentheses are robust standard errors; ***, **, and * represent that the regression results are significant at the 1%, 5%, and 10% statistical levels respectively.
Table 12.
Bootstrap method test analysis results.
| Action path | Mediating effect | 95% confidence interval | P value |
| Mediating effect | Upper limit and lower limit | ||
| digital technology→central government support→ecological synergy degree | 0.090 0.029 | 0.039 0.150 | 0.002 |
| digital technology→central government support→ecological synergy sustainability | -0.074 0.028 | -0.135-0.030 | 0.008 |
| digital technology→central government support→inter-provincial ecological synergy | 0.029 0.010 | 0.012 0.053 | 0.005 |
| digital technology→public participation→ecological synergy degree | 0.120 0.034 | 0.061 0.194 | 0.000 |
| digital technology→public participation→ecological synergy sustainability | -0.105 0.031 | -0.170-0.050 | 0.001 |
| digital technology→public participation→inter-provincial ecological synergy | 0.037 0.011 | 0.017 0.061 | 0.001 |
Disclaimer/Publisher’s Note: The statements, opinions and data contained in all publications are solely those of the individual author(s) and contributor(s) and not of MDPI and/or the editor(s). MDPI and/or the editor(s) disclaim responsibility for any injury to people or property resulting from any ideas, methods, instructions or products referred to in the content. |
© 2025 by the authors. Licensee MDPI, Basel, Switzerland. This article is an open access article distributed under the terms and conditions of the Creative Commons Attribution (CC BY) license (http://creativecommons.org/licenses/by/4.0/).
Copyright: This open access article is published under a Creative Commons CC BY 4.0 license, which permit the free download, distribution, and reuse, provided that the author and preprint are cited in any reuse.


