
Submitted:
11 December 2025
Posted:
12 December 2025
You are already at the latest version
Abstract
CD80 and CD86 molecules are key costimulatory ligands expressed primarily on the surface of antigen-presenting cells (APCs). However, the presence of these molecules on T cells is currently uncommon and may be associated with various immunopathologies, such as allergic diseases. Literature data demonstrate that the presence of these molecules on T cells can polarize the immune response toward Th2, thereby enhancing inflammation. In our study, we found that all Type 2-dependent diseases we examined (atopic dermatitis, bronchial asthma) were associated with increased CD80 expression by immune cells. One of the modern and effective treatments for these diseases is genetically engineered biological therapy (GEBT). In this study, we found that in patients with severe allergy pathology, GEBT-associated cells exhibit changes in the percentage of cells expressing CD80 and CD86 on both monocytes and T cells.
Keywords:
allergy
; bronchial asthma
; atopic dermatitis
; type 2 immunity
; genetically engineered biological therapy
1. Introduction
Currently, the number of patients with bronchial asthma (BA) worldwide is approximately 348 million people [1]. The mechanisms underlying the allergic phenotype of asthma (bronchospasm, mucus hypersecretion, bronchial mucosal edema) significantly reduce the quality of life of patients and require constant symptom monitoring. Unfortunately, targets for therapy that can prevent bronchial hyperreactivity and achieve complete recovery in patients have not yet been sufficiently defined. Another multifactorial chronic allergic disease, atopic dermatitis (AD), is also characterized by dysfunction of the immune system. The prevalence of AD reaches 25–30% among children and up to 7–10% among adults [2], which leads to increased interest in this pathology. The development of the disease is associated with the risk of progression of atopy and the gradual transformation of clinical manifestations: the development of allergic rhinoconjunctivitis and BA [3], which increases the percentage of disability in the population.
It is known that in allergic diseases, the main participants in immunological reactions are Th2, which, under conditions of sensitization of the body, produce cytokines such as IL4, IL5, IL13 [4], and contribute to the attraction of other immunocompetent cells, activation of B-lymphocytes and mast cells. Allergy development is based on a specific immune response to allergens, initiated by the interaction of the T-cell receptor (TCR) on T lymphocytes and major histocompatibility complex class II (MHC II) molecules on antigen-presenting cells (APCs). This immunological synapse is formed with the participation of costimulatory molecules (CD80 and CD86) and leads to the proliferation of type 2 helper T lymphocytes (Th2) followed by the development of the effector phase of the humoral immune response.
The interaction of the T cell receptor (TCR) with the antigen-peptide-MHC complex initiates the first signal for cellular activation. However, the subsequent signal is no less important; it requires the presence of costimulatory molecules on the cell, which amplify the initial signal and then activate T cells [5]. One of the most significant costimulatory molecules is CD80/86. This pair of molecules belongs to the immunoglobulin superfamily and is found on various types of cells. The main pool of cells expressing CD80 and CD86 molecules are APCs such us dendritic cells, monocytes/macrophages, and B lymphocytes). It has also been shown that CD80 molecules were found on thymic medulla epithelial cells [6]. There are also reports of possible endogenous expression of molecules on T lymphocytes. In a study by Soskic B at al [7], it was shown that some T lymphocytes capable of secreting IFN-γ expressed CD86 and had a higher level of proliferative activity compared to another subpopulation, Tregs, expressing the CD80 molecule on their surface. It is believed that CD80 and CD86 are constitutively expressed on the surface of APCs; however, the expression level of the CD86 molecule is significantly higher and exhibits rapid regulation after cell activation. CD80 and CD86 are ligands for competing binding co-receptors expressed on T cells, namely CD28, interaction with which is considered activating, and CTLA-4, contact with which is associated with the onset of inhibition of the immune response.
It is known that the kinetics of CD80 and CD86 molecules on APC differ: at earlier stages of the formation of an immunological contact, the main role belongs to CD86. Due to the constitutive expression of CD86 on antigen-presenting cells, the level of the molecule on the cell surface reaches its peak significantly earlier, which can be observed by the end of the second day [8,9]. On days 4-5 after stimulation, its homologue, CD80, also reaches its peak expression [9]. Additionally, there is another signal to increase the expression of CD80 and CD86 molecules from another group of interacting costimulatory molecules: CD40 and CD40L [10]. T cells begin to express CD40L on days 3–4 of the immune response, and upon interaction with the corresponding CD40 receptor, trimerization of the latter occurs to transmit a signal into the cell. The resulting signal as a result of this interaction induces the expression of CD80/86 molecules on APCs. Thus, CD80/86 molecules can serve as a marker for activated APCs.
T lymphocyte activation requires dual stimulation: binding of MHC on APCs to the TCR on naive T cells and binding of CD28 to CD80/86, respectively. If either of these two conditions is not met, activation is insufficient and T cells become anergic. Also, in the absence of costimulatory signals from the interaction of CD28 with CD80/86, T cells can switch to the Treg phenotype [11]. Studies have shown that conformational changes induced by MHC binding to the TCR result in CD28 acquiring a greater affinity for the CD80 molecule [12]. Despite its greater affinity for CD80, another study demonstrated that a more effective signal is transmitted through the CD28 receptor when interacting with the CD86 molecule [11].
Increased CD28 ligation may shift the polarization of the immune response toward a Th2 response, which may be critical in allergic diseases. For example, in the work [13] it was shown that murine T cells with increased CD28 ligation secreted higher levels of IL-4 and IL-5. Also, induction of IL-4 production and Th2 differentiation by naive T cells is highly dependent on CD80 and CD86 molecules, whereas IL-4 production by previously activated T cells is CD80/86 independent [14]. There are also differences in the involvement of CD80/86 in the activation of various T-lymphocyte subsets. Thus, the CD4+ T-helper subset can be equally activated by costimulation involving both the CD80 molecule and CD86. Tregs, on the other hand, are typically stimulated by CD86 [6].
At present, the functions of costimulatory molecules on APCs during stimulation of T cells have been widely studied, and sufficient research has been conducted on the CD80/CD86 -CD28 pathway in this interaction, however, it has been shown in the literature that these molecules can also be located on the surface of T cells themselves [15]. T cells can have CD80 and CD86 molecules on their surface both as a result of the trogocytosis process and due to endogenous expression [16]. For example, in the work [7], it was shown that CD80 expressed on T is expressed to a greater extent on the surface of cells that have the features of induced Tregs CTLA4+FoxP3+, but have a lower proliferation potential. And the cells bearing CD86 represented a population of IFN-γ+ T cells and have a higher proliferation potential, thereby maintaining inflammation. Additionally, the presence of the CD80 molecule on a T cell can regulate the level of IL-4 production. Schweitzer and his colleagues showed [17] that CD80+ on T cells suppresses the production of IL-4, which is a beneficial effect in allergic pathologies, since one of the key cytokines that supports inflammation is blocked.
Studies aimed at investigating the role of costimulatory molecules in bronchial asthma have reported the involvement of CD80/86 in the activation of Th2 cells upon allergen-specific stimulation of peripheral blood monocytes. Data presented by Chen et al. show that patients with an allergic phenotype have higher expression of CD86 on activated B lymphocytes and macrophages in the peripheral blood. The expression level also increases under experimental conditions upon introduction of an allergen in patients with bronchial asthma [4]. It is the CD86 molecule that is considered key in switching the phenotype to Th2. However, costimulation involving CD80 may be more important for the development of eosinophilia [4]. Also, despite comparable stimulation of T cells by both CD80 and CD86 to produce IL-2 and IFNγ by T cells, the CD86 molecule was of decisive importance for the production of IL-4, while CD80 was of decisive importance for GM-CSF [18]. Another mechanism of response polarization is considered to be trogocytosis, which switches the T cell response to Th2. In the work of Sasaki et al., it was shown that CD4+ trogocytic cells secreted IL-4 to a greater extent than suppressed the Th1 response [19].
Furthermore, the use of monoclonal antibodies to CD80 and CD86 molecules effectively suppressed cytokine production by lymphocytes [18]. These data are also confirmed by a study with the administration of immunoglobulins against CD86, which led to a decrease in IL-4 production and, accordingly, a decrease in eosinophilia and IgE secretion [19]. Inhibition of the CD80 molecule by a monoclonal antibody reduced the secretion of specific Th-2 cytokines, but did not affect the number of eosinophils or the level of IgE.
V. Lombari reported increased expression of CD80/86 molecules on alveolar macrophages in patients with asthma. In addition, an increase in the level of soluble CD86 in subjects with allergies and a correlation with the severity of the disease were described [20]. A study of peripheral blood monocytes from patients with asthma showed a more significant secretion of soluble CD86, which correlated with the severity of the disease. At the same time, the concentration of soluble CTLA-4 was also higher in the patient group [18].
In other allergic diseases, such as allergic conjunctivitis, suppression of the interaction of costimulatory molecules CD80/86 with CD28 led to a decrease in IL-5 production by Th2 lymphocytes [21], which could subsequently reduce eosinophilic infiltration.
Continued study of this group of diseases remains relevant. Moreover, the impact of existing treatments, particularly biologic agents (BIAs), on the immunological profile of patients remains important. For example, an article [22] showed that after 16 weeks of treatment of severe asthma with the monoclonal antibody against IgE, omalizumab, the expression of CD80 and CD86 molecules on eosinophils significantly decreased, which may influence antigen presentation and reduce the development of inflammation. Thus, it was shown that omalizumab can alter the ability of eosinophils to present antigen.
2. Materials and Methods
The study material was composed of peripheral blood mononuclear cells (PBMCs) from patients with allergic diseases treated at the Immunopathology Clinic of the Research Institute of Fundamental and Clinical Immunology and somatically healthy volunteers who had signed an informed consent. The group of patients with bronchial asthma (BA) included 17 patients and was divided into subgroups based on their asthma phenotype. One group included individuals with a non-allergic asthma phenotype (nBA) with a Type 2 (T2)-dependent course (aspirin-responsive asthma, eosinophilic asthma), while the other included individuals with an allergic and mixed phenotype (aBA). The nBA group consisted of nine patients with bronchial asthma, with an average age of 54.33 ± 3.54 years. The аBA group included 8 patients with an average age of 44 ± 5.33 years. According to the asthma control level (ACT) questionnaire for individuals in group 2, 100% of patients had an uncontrolled course of asthma before initiation of therapy. A group of 12 patients with established atopic dermatitis (AD). The average age of the group was 33.67 ± 2.93 years. The control group was the same as for patients with bronchial asthma. Ninety-two percent of patients had a severe course of the underlying disease. The average score on the SCORAD index for assessing the severity of atopic dermatitis manifestations was 73.45 points, which corresponded to the established severity level, with none of the patients scoring less than 40 points. Fourteen healthy volunteers with an average age of 34.46 ± 3.73 years were recruited as a control group.
The criteria for exclusion from the study were as follows: simultaneous participation in other clinical trials, pregnancy, lactation, the presence of an acute infectious disease, the administration of any vaccines in the 3 months preceding the collection of material, the presence of severe infectious diseases in the 3 months preceding the collection of material, a severe condition due to somatic pathology, the presence of malignant neoplasms at the time of collection of material or in the 5 years preceding collection.
Most patients with AD and aBA demonstrated sensitization to household allergens (house dust mites), epidermal allergens (dog and cat hair), pollen allergens (weeds, cereals, trees), and fungal allergens.
As a targeted therapy for patients with AD, dupilumab (monoclonal antibodies to the IL-4Rα subunit, blocks signaling from IL-4 and IL-13) was prescribed at a dosage of 300 mg and 600 mg, for patients with BA—benralizumab (monoclonal antibodies to the IL-5Rα subunit, reduces eosinophilic inflammation) at a dosage of 30 mg, as well as omalizumab (monoclonal antibody against IgE) at a dosage of 300 mg in one of the patients with BA. In the atopic dermatitis group, one year after the start of therapy, the mean SCORAD score was 20.9 points, considered mild atopic dermatitis. One patient had a score of 42.5 points, which corresponds to severe disease.
PBMCs from donors and patients were isolated from peripheral blood by centrifugation in a Ficoll-urografin density gradient (1.077 g/ml). Cells were counted in a Goryaev chamber using the standard method. The cells were then stained with monoclonal antibodies conjugated to fluorochromes: anti-CD3-APC, anti-CD4-APC-C7, anti-CD8-PE/Cy7, anti-CD14-FITC, anti-CD86-PerCP/Cy5.5 and anti-CD80-PE. Cell phenotype was analyzed using a LongCyte flow cytometer (Challenbio, China). Analysis was performed using GraphPad Prism 9.3.1, using the Wilcoxon and Mann-Whitney tests, with a p value of <0.05 considered the minimum criterion for statistical significance.
3. Results
First, we assessed the relative abundance of monocytes expressing CD80 and CD86 molecules on their surface in patients with AD, aBA, non-allergic AD, and healthy controls. Both AD and AD (both allergic and non-allergic) were shown to have significantly increased proportions of cells expressing CD80, while CD86 expression was statistically significantly increased only in patients with AD, regardless of its type (Figure 1). No significant differences were observed between the groups of patients with different pathologies.
Therefore, patients with Type 2 (T2) immune-mediated disease have increased expression of costimulatory molecules by monocytes, which, in turn, will lead to increased costimulation of T lymphocytes during antigen presentation.
It is known that the costimulatory molecules CD80 and CD86 are primarily expressed on antigen-presenting cells, including monocytes. However, as noted above, there are a number of studies demonstrating the expression of these molecules by T lymphocytes. Therefore, in our next step, we assessed the expression of CD80 and CD86 on CD4+ T helper cells (Figure 2) and CD8+ cytotoxic T lymphocytes (Figure 3).
In the case of T-helpers, it was found that the proportion of CD80+ cells increases in allergic diseases, but not in non-allergic asthma, while the proportion of CD86+ cells, on the contrary, decreases in AD and nBA.
When assessing the expression of costimulatory molecules by cytotoxic T lymphocytes, it was shown that the proportion of CD8+CD80+ lymphocytes increased in all diseases studied, but the proportion of CD8+CD86+ lymphocytes decreased in nAD compared to aAD.
Consequently, in patients with Type 2 (T2) immune-mediated disease, expression of CD80+ T cells is increased, while the proportion of CD86 cells either decreases or remains unchanged. Furthermore, expression of both CD80 and CD86 was increased in monocytes in these diseases.
It is known that CD80 and CD86 molecules, despite their similar roles, do not completely duplicate each other’s functions. Furthermore, there is evidence of different onset times for the expression of these molecules on the cell. Therefore, we next assessed the proportions of monocytes and T lymphocytes with different phenotypes: CD80-CD86+, CD80+CD86+, CD80-CD86-, and CD80+CD86- (Figure 4).
We found that all patient groups had a reduced number of CD80-CD86- monocytes, which do not express costimulatory molecules and are incapable of activating T cells. In ABA, the proportion of monocytes expressing CD80 increases, namely CD80+CD86+ and CD80+CD86-. In AD, only the relative number of CD80+CD86- monocytes increases.
In the case of T lymphocytes, the proportion of cells with the CD80-CD86- phenotype predominates and remains virtually unchanged in patients compared to healthy donors. Thus, the majority of T lymphocytes, in both donors and patients, do not express CD80 and CD86 molecules. Changes in CD80 and CD86 expression in patients compared to donors occur proportionally between the proportions of cells expressing at least one type of costimulatory molecule.
All patient groups show a decrease in CD4+CD80-CD86+ cells compared to the control group of healthy individuals. In aBA, the proportion of CD4+CD80+CD86+ cells increases, both compared to the control group and compared to AD, as does CD4+CD80+CD86- cells; that is, in this case, cells with phenotypes demonstrating CD80 expression also increase. In AD, the proportion of only CD4+CD80+CD86- cells increases. Consequently, in allergic diseases (aBA and AD), the number of CD4+CD80+CD86- T-helper cells increases.
The opposite is true for cytotoxic T lymphocytes: the proportion of CD8+CD80+CD86- cells decreases in patients with aBA and AD. The proportion of CD8+CD80+CD86+ cells increases in all patient groups. Therefore, the observed increase in CD80 expression on killer T cells in patients is due solely to cells with dual CD80+CD86+ expression, against a background of a decreased proportion of cells with the CD80+CD86- phenotype. Furthermore, an increase in CD8+CD80-CD86+ is observed in aBA compared to other patient groups.
We next assessed changes in the expression of CD80 and CD86 molecules by monocytes and T lymphocytes during ongoing biologic therapy one year after the start of treatment. First, we assessed the effect of biologic therapy on the expression of these molecules in patients’ monocytes (Figure 5).
It was found that in AD patients, the number of monocytes with the CD80+CD86+ phenotype (that is, those expressing both molecules simultaneously) decreased after therapy, while the percentage of CD14+CD80-CD86- increased. Consequently, therapy reduces the number of monocytes capable of activating T lymphocytes through interaction with CD28, which will lead to a decreased response to the antigen and promote the development of tolerance.
In the case of aBA, a year after the start of therapy, a decrease in the proportion of monocytes expressing CD80 was noted, along with a decrease in both the relative number of CD14+CD80+CD86+ cells and CD14+CD80+CD86-. As noted above, the proportion of these cells was increased in patients with aBA before therapy. Consequently, in patients with GIBT, the expression of CD80 and CD86 by monocytes becomes similar to that of donors, indicating a beneficial effect of GIBT on monocytes.
In the case of non-alcoholic asthma, we did not observe similar positive changes as in allergic diseases. In patients with aBA, the number of CD14+CD80-CD86+ cells increased while the number of CD14+CD80-CD86- cells that did not express costimulatory molecules decreased, indicating monocyte activation during therapy.
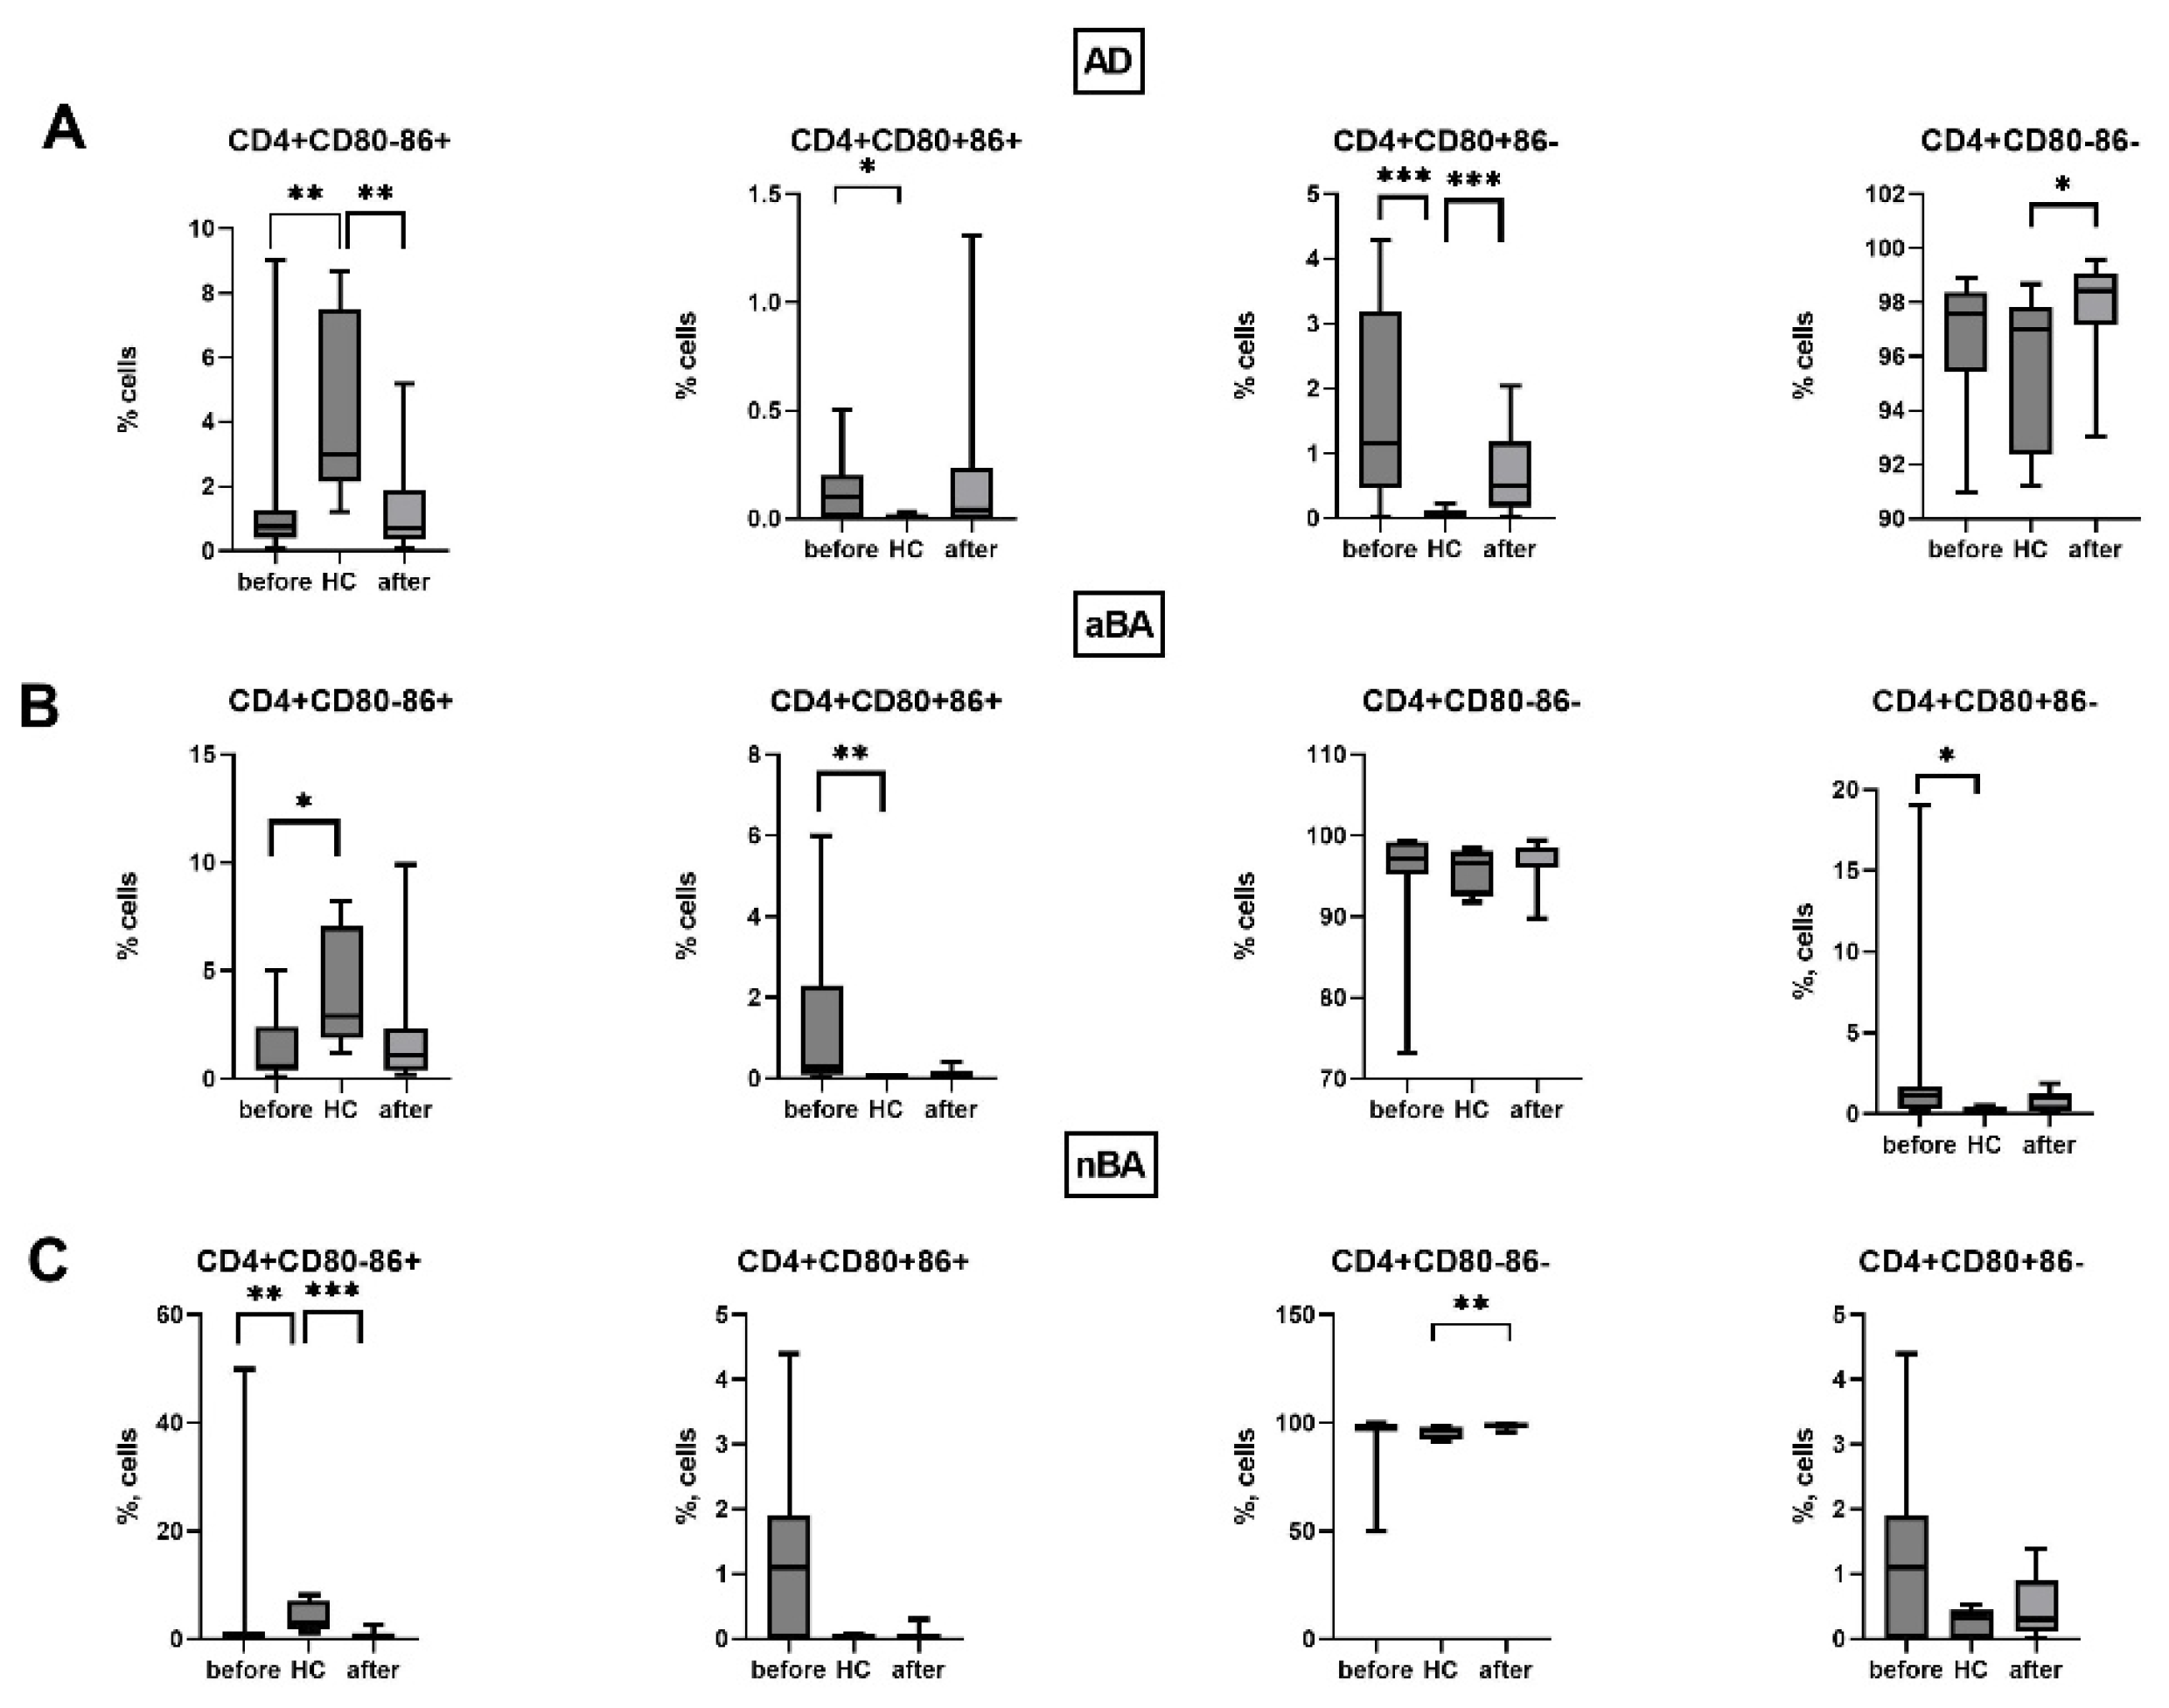
We did not detect changes in the expression of CD80 and CD86 on T helper cells during therapy with non-alcoholic asthma when comparing patients before and after 1 year of therapy (Figure 6). However, after 1 year of therapy, a slight increase in the proportion of CD4-CD80-CD86- cells was observed in patients with AD compared to healthy donors.
We also assessed the effect of biologic therapy on the expression of CD80 and CD86 by cytotoxic T lymphocytes in patients. It was shown that in patients with AD, the percentage of CD8+CD80-CD86- cells decreased during therapy, while the number of cells with the CD8+CD80+CD86+ and CD8+CD80+CD86- phenotypes increased.
Consequently, during biologic therapy, the expression of CD80 and CD86 molecules changes predominantly in monocytes and cytotoxic T lymphocytes and remains virtually unchanged in T helper cells.
Figure 7.
Expression of CD80 and CD86 on cytotoxic T cells in patients with T2-immune-mediated disease before and after therapy and healthy volunteers; HC—healthy control group, AD- atopic dermatitis, aBA—allergic bronchial asthma, nBA- non-allergic bronchial asthma; Data are presented as box-and-whisker plots, with boxes extending from the 25th to the 75th percentile, with a horizontal line at the median, while the whiskers extend to the lowest and highest data points. * Indicates a significant difference (p < 0.05). ** Indicates a significant difference (p < 0.01). *** Indicates a significant difference (p < 0.001).
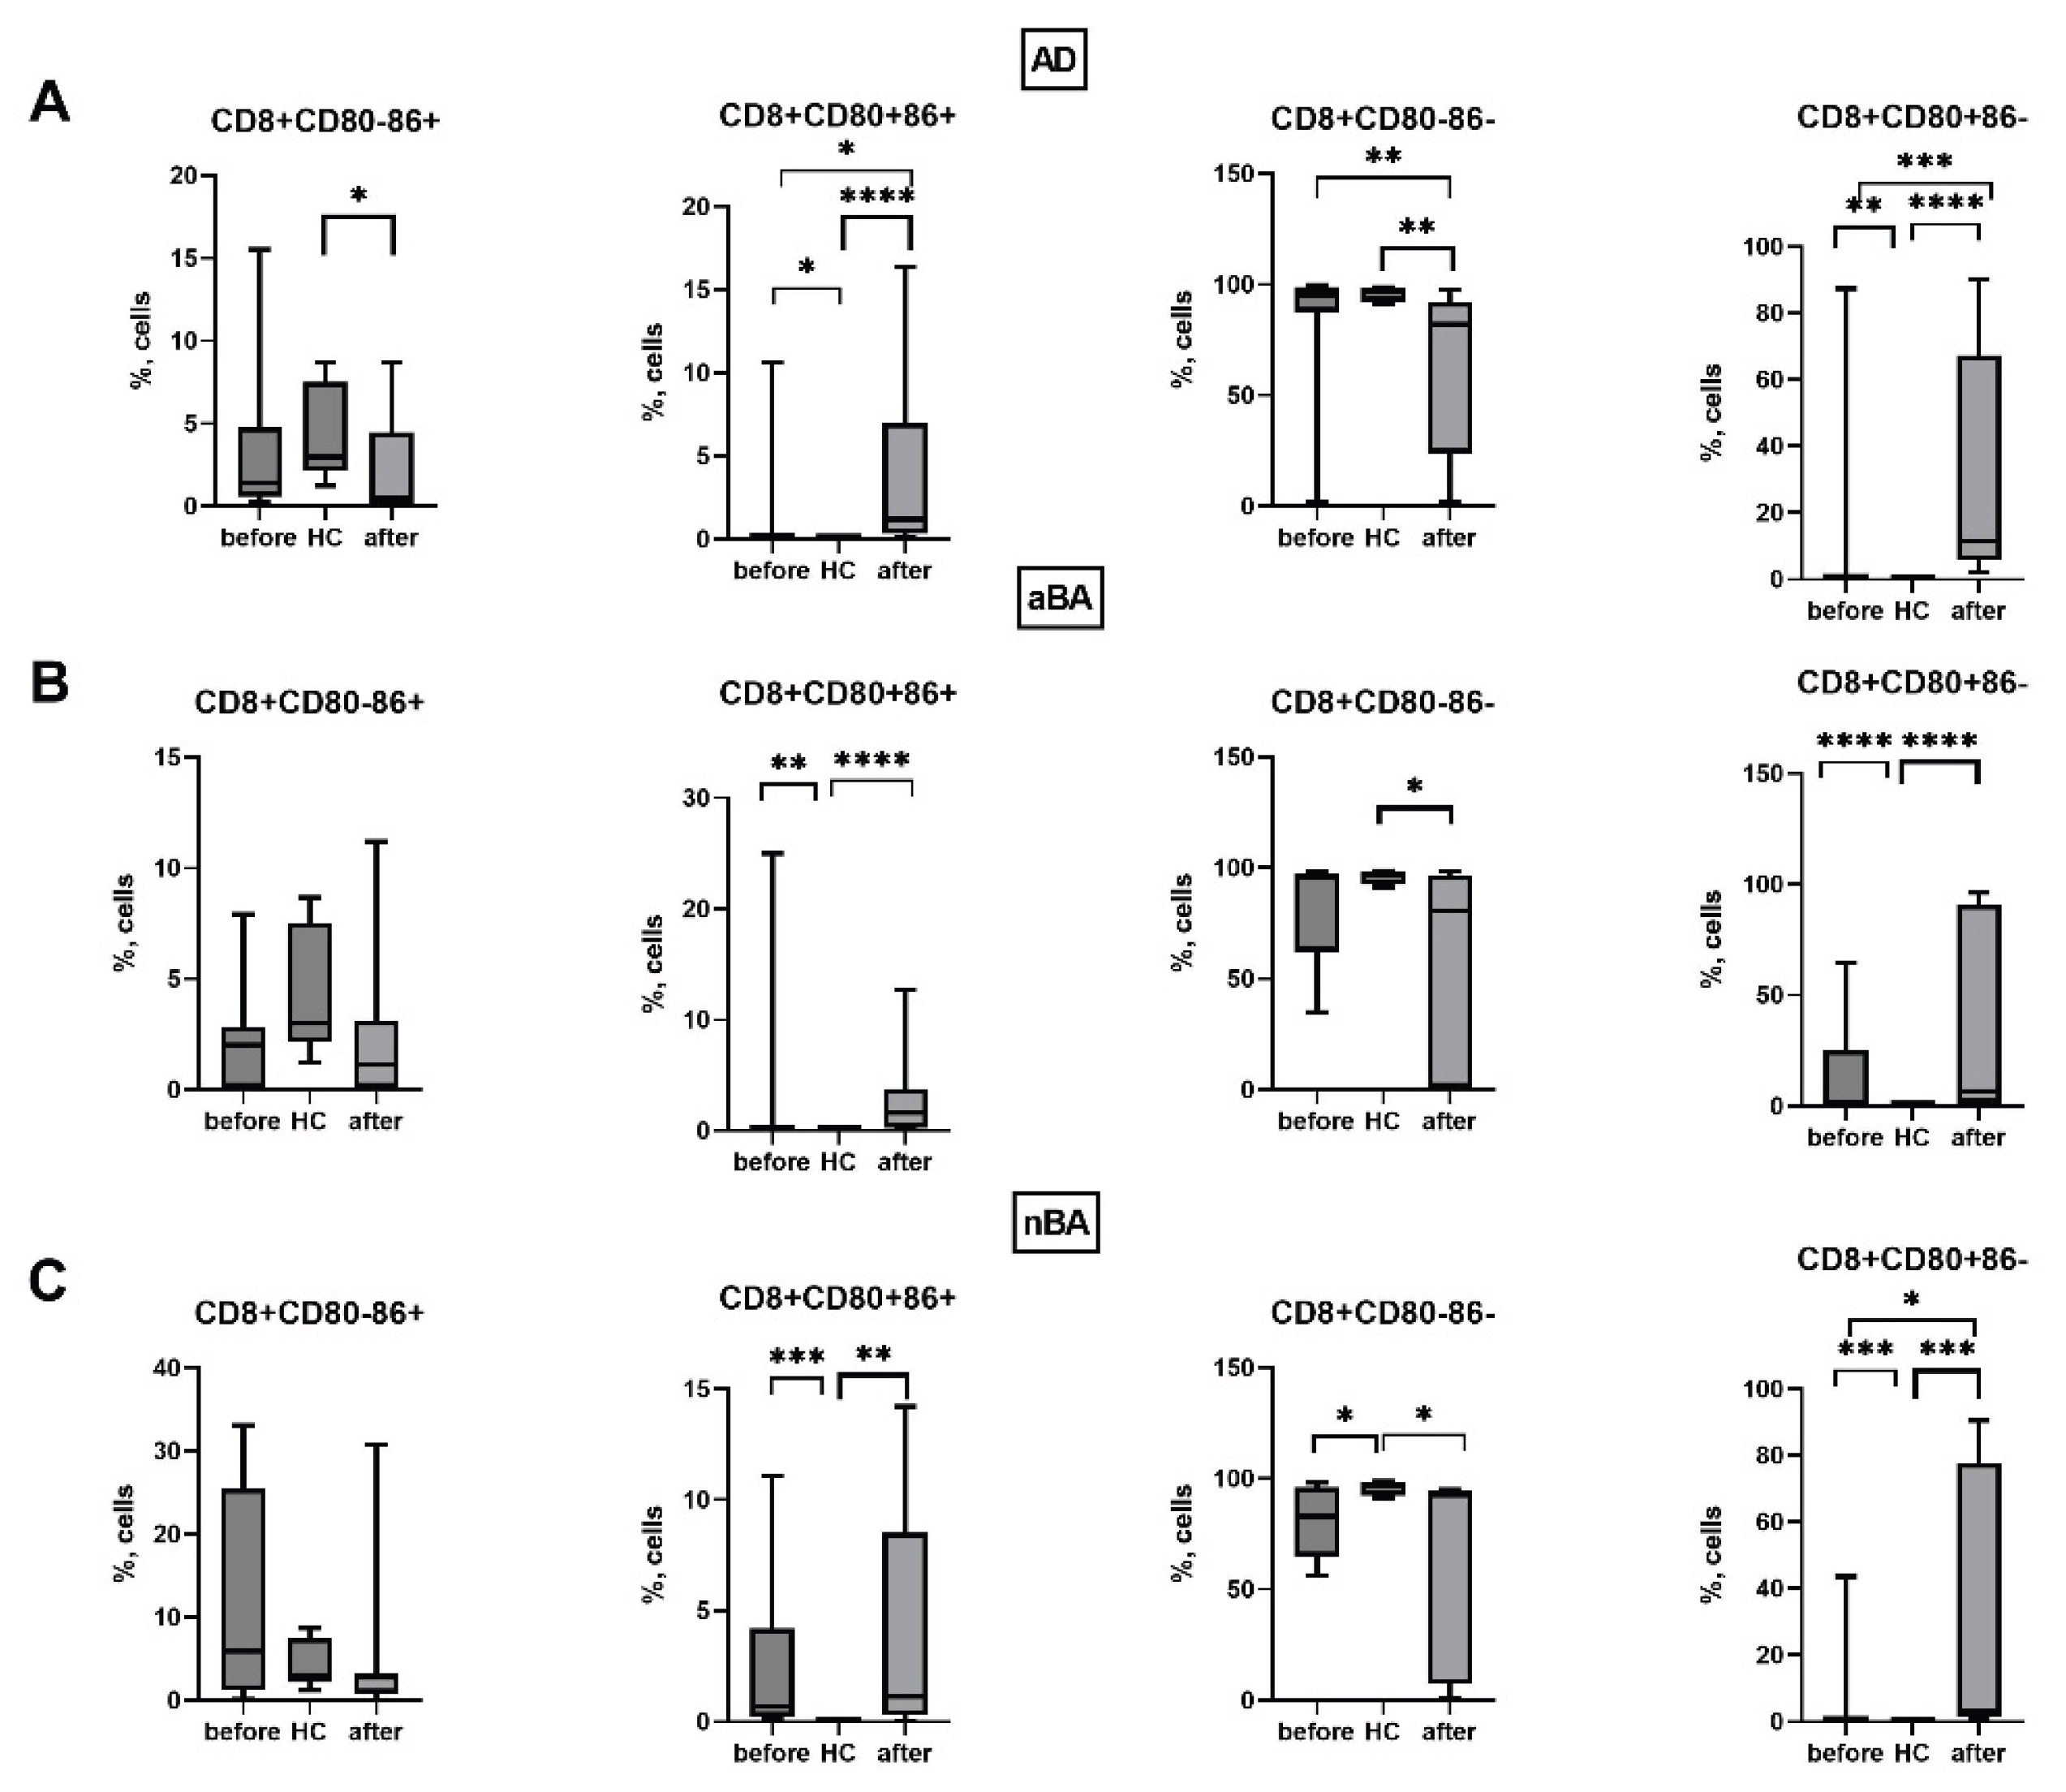
Thus, in all the T2 immune-mediated diseases studied by us, the expression of CD80 and CD86 molecules by immune cells, monocytes and T lymphocytes, is altered. In all patient groups, the proportion of CD80+ monocytes and cytotoxic T lymphocytes increases, the number of CD80-CD86- monocytes, which do not carry costimulatory molecules and are unable to activate T cells, decreases, in addition, the proportion of CD4+CD80-CD86+ cells decreases and the proportion of CD8+CD80+CD86+ cells increases compared to the control group of conditionally healthy individuals. During the therapy, after one year from the start of treatment with GEBP, the expression of CD80 and CD86 changes on monocytes and cytotoxic T lymphocytes of patients, while most of the changes in the expression of CD80 and C86 in patients remain similar to the level before the start of therapy.
4. Discussion
According to the literature, in allergic diseases the percentage of cells such as T lymphocytes, monocytes and alveolar macrophages carrying the costimulatory molecules CD80 or CD86 is higher than in the control group [23,24]. In various studies, an increase in only one of these two molecules can be found, which is most likely due to the fact that the expression of CD80 on alveolar macrophages [23], on T cells [25] and on monocytes [26] appears earlier than the CD86 molecule. However, other sources, on the contrary, show that the CD86 molecule appears earlier on immune cells and the peak of its expression corresponds to the end of the second day [8,9].
Monocytes are classic antigen-presenting cells, carrying the costimulatory molecules CD80 and CD86 on their membrane surface. We demonstrated that in patients with T2 immune-mediated disease, the proportion of monocytes carrying the CD80 molecule on their membrane increases, consistent with published data. Furthermore, the number of CD14+CD80-CD86- cells, which do not carry costimulatory molecules, decreases in all patient groups studied. Consequently, the proportion of cells carrying at least one costimulatory molecule increases proportionally, which, in turn, will lead to increased costimulation of T lymphocytes during antigen presentation.
T-lymphocytes can acquire CD80 and CD86 molecules both as a result of trogocytosis and in the case of endogenous expression [7,27,28,29]. The main roles of these molecules on conventional T-cells are considered to be stimulatory (activated T-lymphocytes can act as antigen-presenting cells, and in this case, CD80 and CD86 molecules will provide costimulation during T-T interaction) and immunoregulatory, since the molecules carrying these molecules will undergo apoptosis when the signal through the T-cell receptor increases. T-regulatory cells, in turn, are also capable of trogocytizing CD80 and CD86, but mainly with the aim of decreasing the level of these molecules on dendritic cells, which will lead to a decrease in the activation of naive T-cells [30]. In a mouse model, it was shown that expression of CD80 and CD86 on T helper cells promotes their survival and proliferation [31]. However, another study showed that CD80+ T cells have iTreg features, expressing Foxp3 and having higher levels of CTLA-4, while division in this cell population is less intense compared to T cells carrying the CD86 molecule. At the same time, the number of soluble forms of CD86 (sCD86) can also increase, which was demonstrated in previous studies [4,20] and also correlated with the severity of the disease. Moreover, activation of CD4+ T cells with the participation of CD86 costimulation promotes their proliferation and differentiation into various subtypes, including the subpopulation of regulatory T cells (Treg) [27,32]. We have shown that in allergic diseases (aBA and AD), the number of CD4+CD80+CD86- T-helpers increases, while in patients with T2-dependent diseases, the number of CD80-CD86+ cells decreased, and in patients with aBA and AD, the proportion of CD4+CD80+CD86- T-helpers increased. The role of the increase in CD4+CD80+CD86- cells in T2-dependent diseases remains unclear.
We showed that the proportion of CD8+CD80+CD86+ cells increased in all patient groups compared to healthy controls. On the one hand, this may promote the survival of killer T cells. According to the literature, upregulation of CD80 on primed T cells helps effector CD8+T cells survive the contraction phase and consequently generate optimal protective immunity [27]. At the same time, the B7.2 (CD86) molecule on CD8+ T cells can perform a suppressive function, maintaining the survival of one of the key suppressor populations, Tregs. In a study of colorectal cancer, B7.2 on CD8+ T was a prognostic marker and was associated with a poor outcome with increased expression in this population [33]. In a study of skin cells, it was also demonstrated that the B7.2 (CD86) molecule, which is expressed on CD8+ T cells, is necessary for maintaining the survival of Tregs [32,34]. However, there is other data indicating that CD80, which is expressed on CD8+ T cells, can bind PDL-1 [35]. Thus, this may be an alternative mechanism maintaining tolerance.
It should be noted that in most cases of all the T2-dependent diseases studied, changes in CD80 and CD86 expression by immune cells of patients were observed compared to healthy individuals. However, differences between the various pathologies were much less common, which may indicate a unidirectional change in the expression of costimulatory molecules in these diseases.
Furthermore, we found that the increase in costimulatory molecule expression on all studied cells was more pronounced for CD80 than for CD86. Consequently, in all the studied pathologies, the number of CD80+CD86- cells increased among all the studied immune cell populations. This imbalance may lead to disruption of regulatory processes in the body.
Biologics are among the most effective classes of drugs for T2-dependent diseases. Biologics act on specific targets, but the indirect effect has not been studied. For example, in the article [36] it was shown that after 16 weeks of treatment of severe asthma with the monoclonal antibody against IgE, omalizumab, the expression of CD80 and CD 86 molecules on eosinophils was significantly reduced, which can affect antigen presentation and reduce the development of inflammation. Thus, it was shown that omalizumab can alter the ability of eosinophils to present antigen. Therefore, GIBT leads to significant immunological changes, suppressing pro-inflammatory stimuli, while activating tolerogenic mechanisms. In our study, we found an increase in cells with the CD14+CD80-CB86+ phenotype in nBA, a decrease in CD14+CD80+CB86 in aBA and CD14+CD80-CB86- in AD, which may indicate a change in the phenotype of monocytes in allergic diseases towards inactivated monocytes. CD8+CD80+СВ86- levels increase during therapy in both ABA and AD, with an increase in CD8+CD80+СВ86+ and a decrease in CD8+CD80-СВ86 observed in AD. Thus, we demonstrated that changes in molecules expressed on T lymphocytes and monocytes are observed during HIBT in AD and various forms of BA, primarily with the formation of phenotypes associated with anergy or suppression of the immune response. However, the ratio of cells with different phenotypes in CD80 and CD86 expression during therapy does not become similar to that in donors, indicating that immune dysregulation persists in patients even after successful monoclonal antibody therapy.
Thus, in T2-dependent diseases, the expression of CD80 and CD86 by monocytes and peripheral blood T lymphocytes is altered. The proportion of CD80-expressing cells predominantly increases. In the case of GIBT, the expression of CD80 and CD86 is altered in monocytes and cytotoxic T lymphocytes of patients with T2-dependent diseases. The exact mechanisms leading to these changes are currently unclear.
Author Contributions
Conceptualization, V.A.K.. and E.A.P.; writing—original draft preparation, O.S.B., B.V.I. and E.A.P; investigation—O.S.B., V.I.B., V.S.A, D.V.D., V.M.N and M.I.L..; writing—review and editing, E.A.P; funding acquisition, V.A.K. All authors have read and agreed to the published version of the manuscript.
Funding
This study was funded by the Russian Science Foundation according to research project No.24-15-00409.
Institutional Review Board Statement
The study was conducted according to the guidelines of the Declaration of Helsinki and approved by the Institutional Local Ethical Committee of Research Institute of Fundamental and Clinical Immunology (protocol No. 147, 22 November 2024).
Informed Consent Statement
Informed consent was obtained from all subjects involved in the study.
Conflicts of Interest
The authors declare no conflicts of interest. The funders had no role in the design of the study; in the collection, analyses, or interpretation of data; in the writing of the manuscript; or in the decision to publish the results.
Abbreviations
The following abbreviations are used in this manuscript:
| APC | antigen-presenting cells |
| GEBT | genetically engineered biological therapy |
| BA | Bronchial asthma |
| aBA | Allergic bronchial asthma |
| AD | Atopic dermatitis |
References
- Global Initiative for Asthma. Global Strategy for Asthma Management and Prevention. 2020. Available online: http://www.ginasthma.org.
- Potekaev, N.N.; Tereshchenko, G.P.; Khanferyan, R.A.; Savastenko, A.L. Immune mechanisms of atopic dermatitis and new.
- approaches to targeted biological therapy. Meditsinskiy Sovet (In Russ.). 2022, 16(3), 130–136. [CrossRef]
- Thyssen, JP; Halling, AS; Schmid-Grendelmeier, P; Guttman-Yassky, E; Silverberg, JI. Comorbidities of atopic dermatitis-what does the evidence say? J Allergy Clin Immunol 2023, 151(5), 1155–1162. [Google Scholar] [CrossRef]
- Chen, YQ; Shi, HZ. CD28/CTLA-4--CD80/CD86 and ICOS--B7RP-1 costimulatory pathway in bronchial asthma. Allergy 2006, 61(1), 15–26. [Google Scholar] [CrossRef]
- Sharpe, AH. Mechanisms of costimulation. Immunol Rev 2009, 229(1), 5–11. [Google Scholar] [CrossRef] [PubMed] [PubMed Central]
- Halliday, N; Williams, C; Kennedy, A; Waters, E; Pesenacker, AM; Soskic, B; Hinze, C; Hou, TZ; Rowshanravan, B; Janman, D; Walker, LSK; Sansom, DM. CD86 Is a Selective CD28 Ligand Supporting FoxP3+ Regulatory T Cell Homeostasis in the Presence of High Levels of CTLA-4. [CrossRef]
- Soskic, B.; Jeffery, L. E.; Kennedy, A.; Gardner, D. H.; Hou, T. Z.; Halliday, N.; Williams, C.; Janman, D.; Rowshanravan, B.; Hirschfield, G. M.; Sansom, D. M. CD80 on Human T Cells Is Associated With FoxP3 Expression and Supports Treg Homeostasis. Frontiers in immunology 2021, 11, 577655. [Google Scholar] [CrossRef]
- Brzostek, J; Gascoigne, NR; Rybakin, V. Cell Type-Specific Regulation of Immunological Synapse Dynamics by B7 Ligand Recognition. Front Immunol 2016, 7, 24. [Google Scholar] [CrossRef] [PubMed]
- Sahoo, NC; Rao, KV; Natarajan, K. CD80 expression is induced on activated B cells following stimulation by CD86. Scand J Immunol 2002, 55(6), 577–84. [Google Scholar] [CrossRef] [PubMed]
- Elgueta, R; Benson, MJ; de Vries, VC; Wasiuk, A; Guo, Y; Noelle, RJ. Molecular mechanism and function of CD40/CD40L engagement in the immune system. Immunol Rev 2009, 229(1), 152–72. [Google Scholar] [CrossRef]
- Vackova, J; Polakova, I; Johari, SD; Smahel, M. CD80 Expression on Tumor Cells Alters Tumor Microenvironment and Efficacy of Cancer Immunotherapy by CTLA-4 Blockade. Cancers (Basel) 2021, 13(8), 1935. [Google Scholar] [CrossRef]
- Beyersdorf, N; Kerkau, T; Hünig, T. CD28 co-stimulation in T-cell homeostasis: a recent perspective. Immunotargets Ther 2015, 4, 111–22. [Google Scholar] [CrossRef]
- Rulifson, I.K.; Sperling, A.I.; Fields, P.E.; Fitch, F.W.; Bluestone, J.A. CD28 costimulation stimulates Th2 cytokine production. Journal of Immunology 1997, 158, 658–665. [Google Scholar] [CrossRef]
- Schweitzer, AN; Sharpe, AH. Studies using antigen-presenting cells lacking expression of both B7-1 (CD80) and B7-2 (CD86) show distinct requirements for B7 molecules during priming versus restimulation of Th2 but not Th1 cytokine production. J Immunol. 1998, 161(6), 2762–71. [Google Scholar] [CrossRef] [PubMed]
- Kipp, B.; Bar-Or, A.; Gausling, R.; Oliveira, E. M.; Fruhan, S. A.; Stuart, W. H.; Hafler, D. A. A novel population of B7-1+ T cells producing intracellular IL-4 is decreased in patients with multiple sclerosis. European journal of immunology 2000, 30(7), 2092–2100. [Google Scholar] [CrossRef] [PubMed]
- Trzupek, D.; Dunstan, M.; Cutler, A.J.; et al. Discovery of CD80 and CD86 as recent activation markers on regulatory T cells by protein-RNA single-cell analysis. Genome Med 2020, 12, 55. [Google Scholar] [CrossRef]
- Schweitzer, A. N.; Sharpe, A. H. Mutual regulation between B7-1 (CD80) expressed on T cells and IL-4. Journal of immunology 1999, 163(9), 4819–4825. [Google Scholar] [CrossRef]
- Chapoval, S. P.; Chapoval, A. I.; Chapoval, S. P. Costimulation in Allergic Asthma: The Roles of B7 and Semaphorin Molecules. In Recent Advances in Asthma Research and Treatments, S. P. Chapoval; IntechOpen, 2022. [Google Scholar] [CrossRef]
- Sasaki, T; Minagawa, M; Yamamoto, T; Ichihashi, H. A case of the Rett syndrome with acute encephalopathy induced during calcium hopantenate treatment. Brain Dev. 1991, 13(1), 52–5. [Google Scholar] [CrossRef]
- Lombardi, V; Singh, AK; Akbari, O. The role of costimulatory molecules in allergic disease and asthma. Int Arch Allergy Immunol. 2010, 151(3), 179–89. [Google Scholar] [CrossRef]
- Niederkorn, JY. Immune regulatory mechanisms in allergic conjunctivitis: insights from mouse models. Curr Opin Allergy Clin Immunol 2008, 8(5), 472–6. [Google Scholar] [CrossRef] [PubMed]
- Wang, H; Kinet, JP; Weller, PF. Humanized FcεRI Expressed on Mouse Eosinophils Mediates IgE-Facilitated Eosinophil Antigen Presentation. Cells 2025, 14(4), 301. [Google Scholar] [CrossRef]
- Balbo, P; Silvestri, M; Rossi, GA; Crimi, E; Burastero, SE. Differential role of CD80 and CD86 on alveolar macrophages in the presentation of allergen to T lymphocytes in asthma. Clin Exp Allergy 2001, 31(4), 625–36. [Google Scholar] [CrossRef]
- Burastero, SE; Magnani, Z; Confetti, C; Abbruzzese, L; Oddera, S; Balbo, P; Rossi, GA; Crimi, E. Increased expression of the CD80 accessory molecule by alveolar macrophages in asthmatic subjects and its functional involvement in allergen presentation to autologous TH2 lymphocytes. J Allergy Clin Immunol 1999, 103(6), 1136–42. [Google Scholar] [CrossRef]
- Nakada, M; Nishizaki, K; Yoshino, T; Okano, M; Yamamoto, T; Masuda, Y; Ohta, N; Akagi, T. CD80 (B7-1) and CD86 (B7-2) antigens on house dust mite-specific T cells in atopic disease function through T-T cell interactions. J Allergy Clin Immunol 1999, 104(1), 222–7. [Google Scholar] [CrossRef]
- Fleischer, J; Soeth, E; Reiling, N; Grage-Griebenow, E; Flad, HD; Ernst, M. Differential expression and function of CD80 (B7-1) and CD86 (B7-2) on human peripheral blood monocytes. Immunology 1996, 89(4), 592–8. [Google Scholar] [CrossRef] [PubMed]
- Pulko, V; Harris, KJ; Liu, X; Gibbons, RM; Harrington, SM; Krco, CJ; Kwon, ED; Dong, H. B7-h1 expressed by activated CD8 T cells is essential for their survival. J Immunol. 2011, 187(11), 5606–14. [Google Scholar] [CrossRef] [PubMed]
- Sabzevari, H; Kantor, J; Jaigirdar, A; Tagaya, Y; Naramura, M; Hodge, J; Bernon, J; Schlom, J. Acquisition of CD80 (B7-1) by T cells. J Immunol 2001, 166(4), 2505–13. [Google Scholar] [CrossRef] [PubMed]
- Kim, YH; Panda, AK; Shevach, EM. Treg Control of CD80/CD86 Expression Mediates Immune System Homeostasis. Eur J Immunol 2025, 55(5), e202551771. [Google Scholar] [CrossRef]
- Tekguc, M; Wing, JB; Osaki, M; Long, J; Sakaguchi, S. Treg-expressed CTLA-4 depletes CD80/CD86 by trogocytosis, releasing free PD-L1 on antigen-presenting cells. Proc Natl Acad Sci U S A 2021, 118(30), e2023739118. [Google Scholar] [CrossRef]
- Mukherjee, S; Maiti, PK; Nandi, D. Role of CD80, CD86, and CTLA4 on mouse CD4(+) T lymphocytes in enhancing cell-cycle progression and survival after activation with PMA and ionomycin. J Leukoc Biol. 2002, 72(5), 921–31. [Google Scholar] [CrossRef]
- Fu, Y; Yang, J; Xiong, N. Cutting Edge: Skin CCR10+ CD8+ T Cells Support Resident Regulatory T Cells through the B7.2/Receptor Axis To Regulate Local Immune Homeostasis and Response. J Immunol 2016, 196(12), 4859–64. [Google Scholar] [CrossRef] [PubMed]
- Cao, Y; Cao, T; Zhao, W; He, F; Lu, Y; Zhang, G; Hu, H; Wang, Z. Expression of B7-H2 on CD8+ T cells in colorectal cancer microenvironment and its clinical significance. Int Immunopharmacol 2018, 56, 128–134. [Google Scholar] [CrossRef]
- Rollins, M. R.; Gibbons Johnson, R. M. CD80 Expressed by CD8+ T Cells Contributes to PD-L1-Induced Apoptosis of Activated CD8+ T Cells. Journal of immunology research 2017, 2017, 7659462. [Google Scholar] [CrossRef]
- Greenfield, EA; Howard, E; Paradis, T; Nguyen, K; Benazzo, F; McLean, P; Höllsberg, P; Davis, G; Hafler, DA; Sharpe, AH; Freeman, GJ; Kuchroo, VK. B7.2 expressed by T cells does not induce CD28-mediated costimulatory activity but retains CTLA4 binding: implications for induction of antitumor immunity to T cell tumors. J Immunol. 1997, 158(5), 2025–34. [Google Scholar] [CrossRef] [PubMed]
- Wang, H.; Kinet, J.-P.; Weller, P.F. Humanized FcεRI Expressed on Mouse Eosinophils Mediates IgE-Facilitated Eosinophil Antigen Presentation. Cells 2025, 14, 301. [Google Scholar] [CrossRef] [PubMed]
Figure 1.
Relative number of CD14+CD80+ and CD14+CD86+ cells in patients with T2-immune-mediated disease and healthy volunteers; HC—healthy control group, AD- atopic dermatitis, aBA—allergic bronchial asthma,nBA- non-allergic bronchial asthma; (a) relative number of CD14+CD80+, (b) relative number of CD14+CD86+. Data are presented as box-and-whisker plots, with boxes extending from the 25th to the 75th percentile, with a horizontal line at the median, while the whiskers extend to the lowest and highest data points. * Indicates a significant difference (p < 0.05). ** Indicates a significant difference (p < 0.01). *** Indicates a significant difference (p < 0.001).
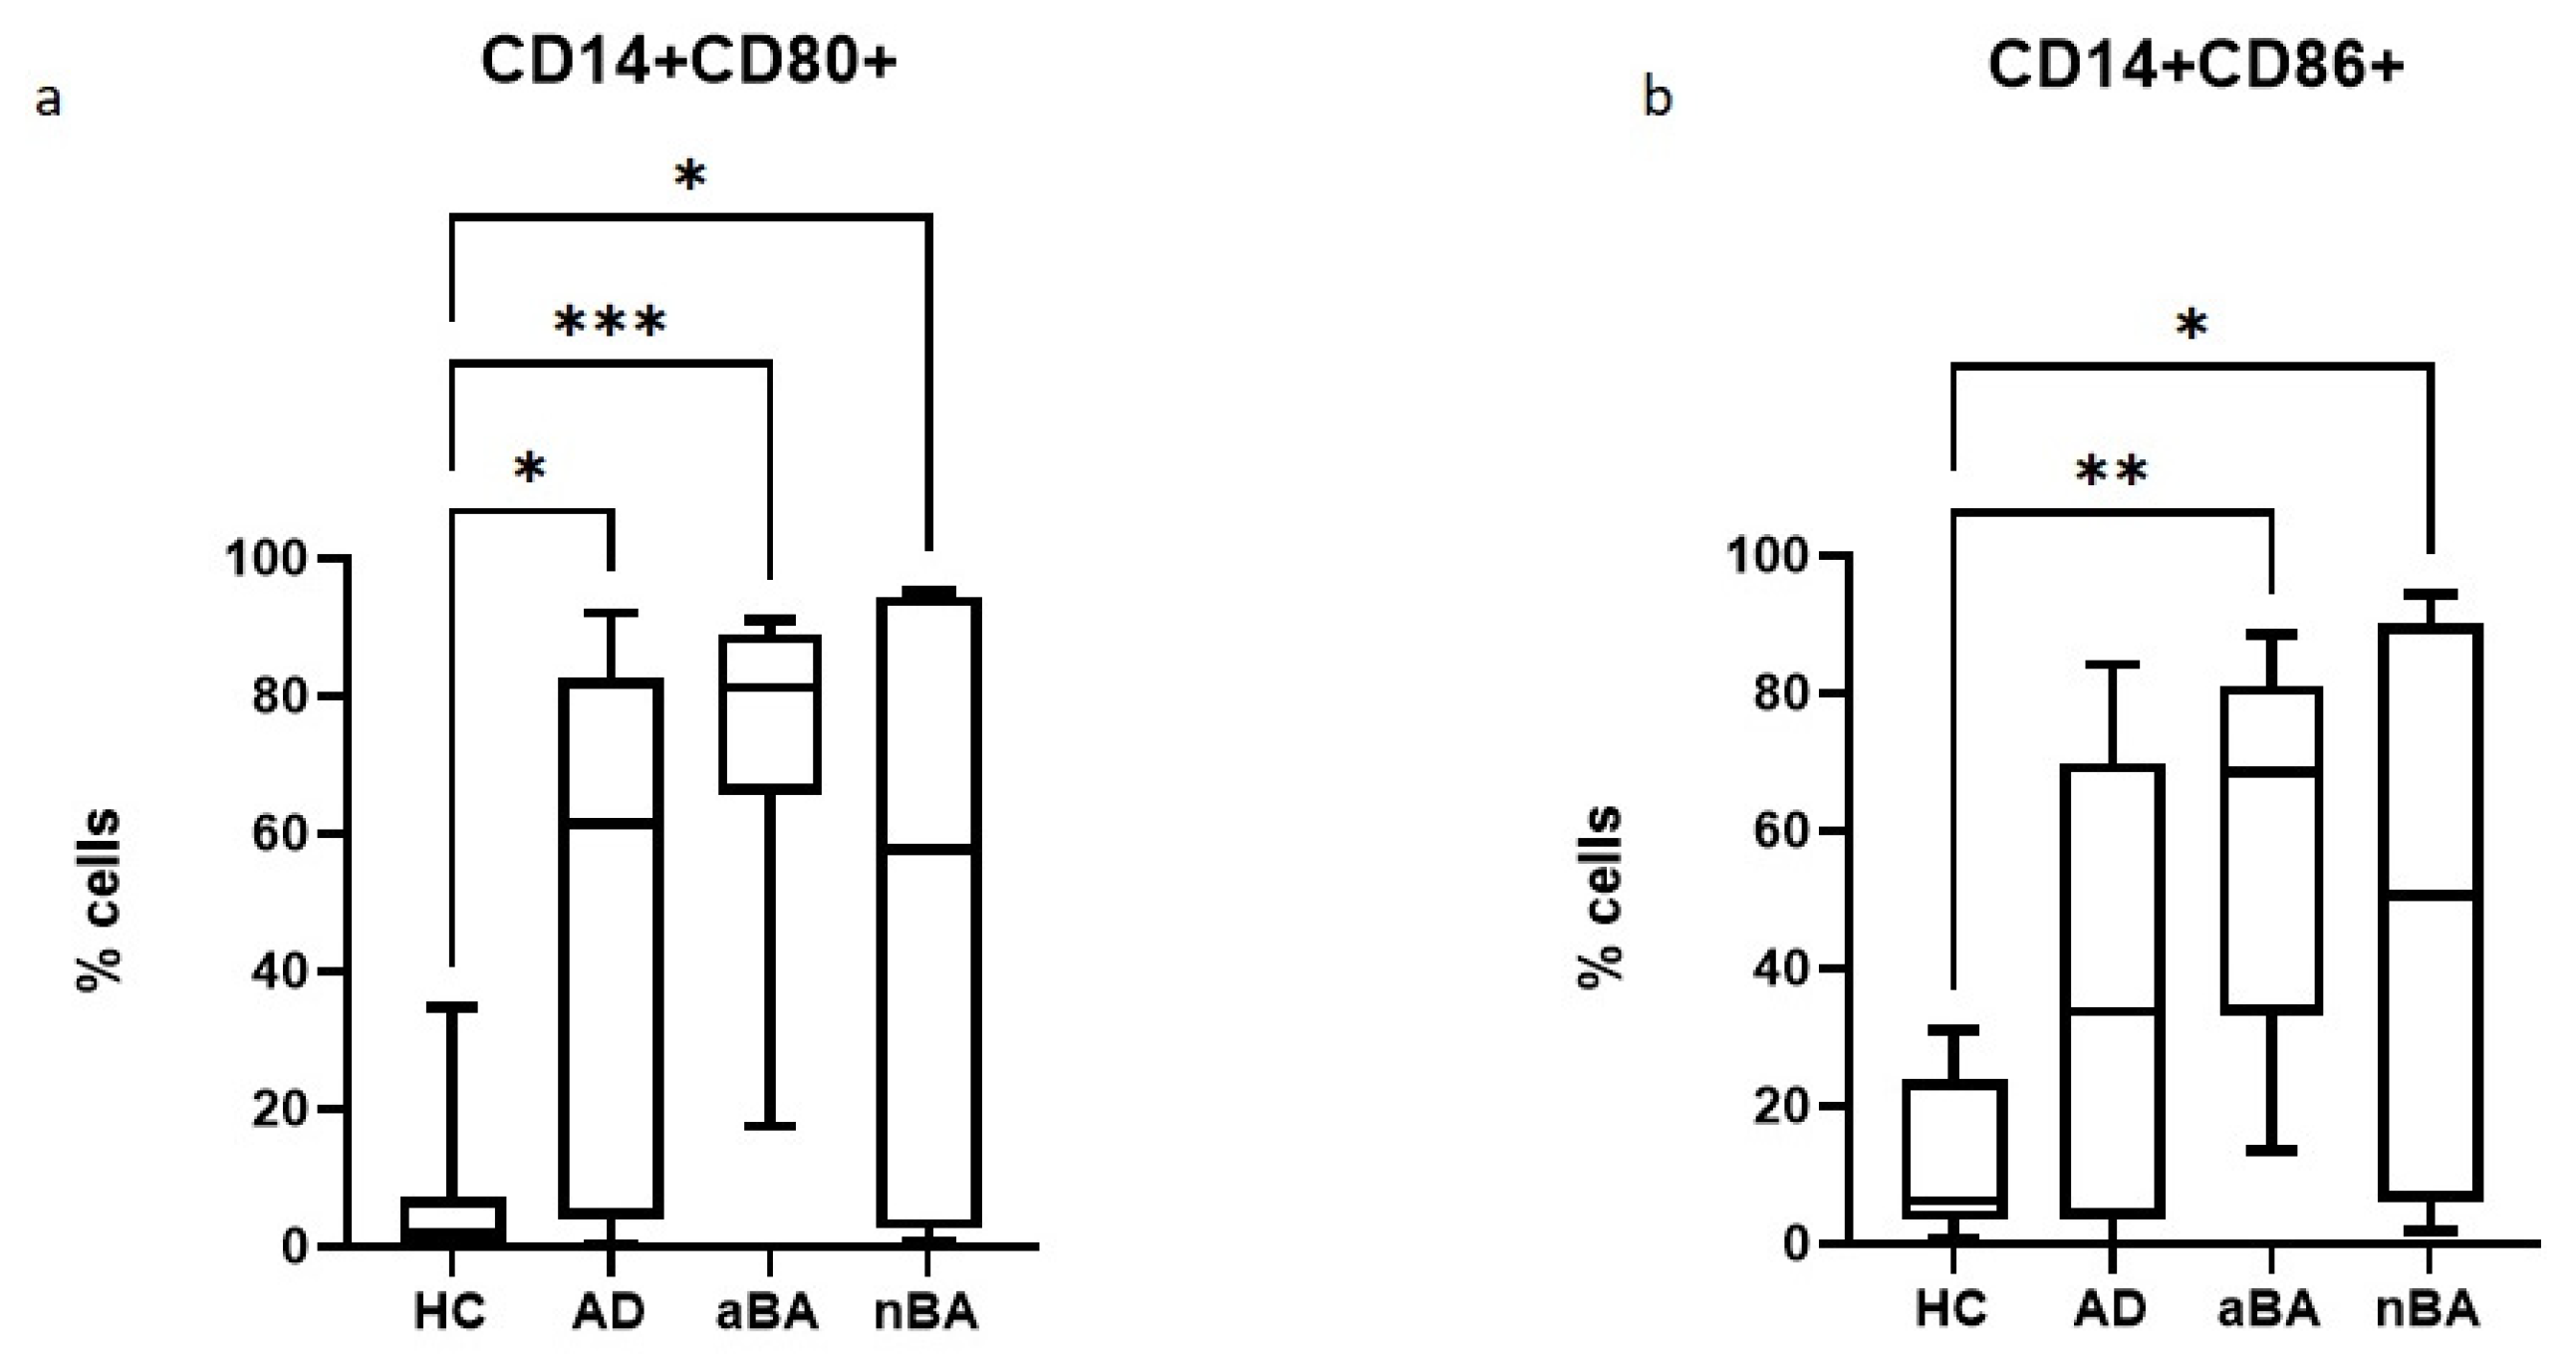
Figure 2.
Relative number of CD4+CD80+ and CD4+CD86+ cells in patients with T2-immune-mediated disease and healthy volunteers; HC—healthy control group, AD- atopic dermatitis, aBA—allergic bronchial asthma,nBA- non-allergic bronchial asthma; (a) relative number of CD4+CD80+, (b) relative number of CD4+CD86+. Data are presented as box-and-whisker plots, with boxes extending from the 25th to the 75th percentile, with a horizontal line at the median, while the whiskers extend to the lowest and highest data points. * Indicates a significant difference (p < 0.05). ** Indicates a significant difference (p < 0.01).
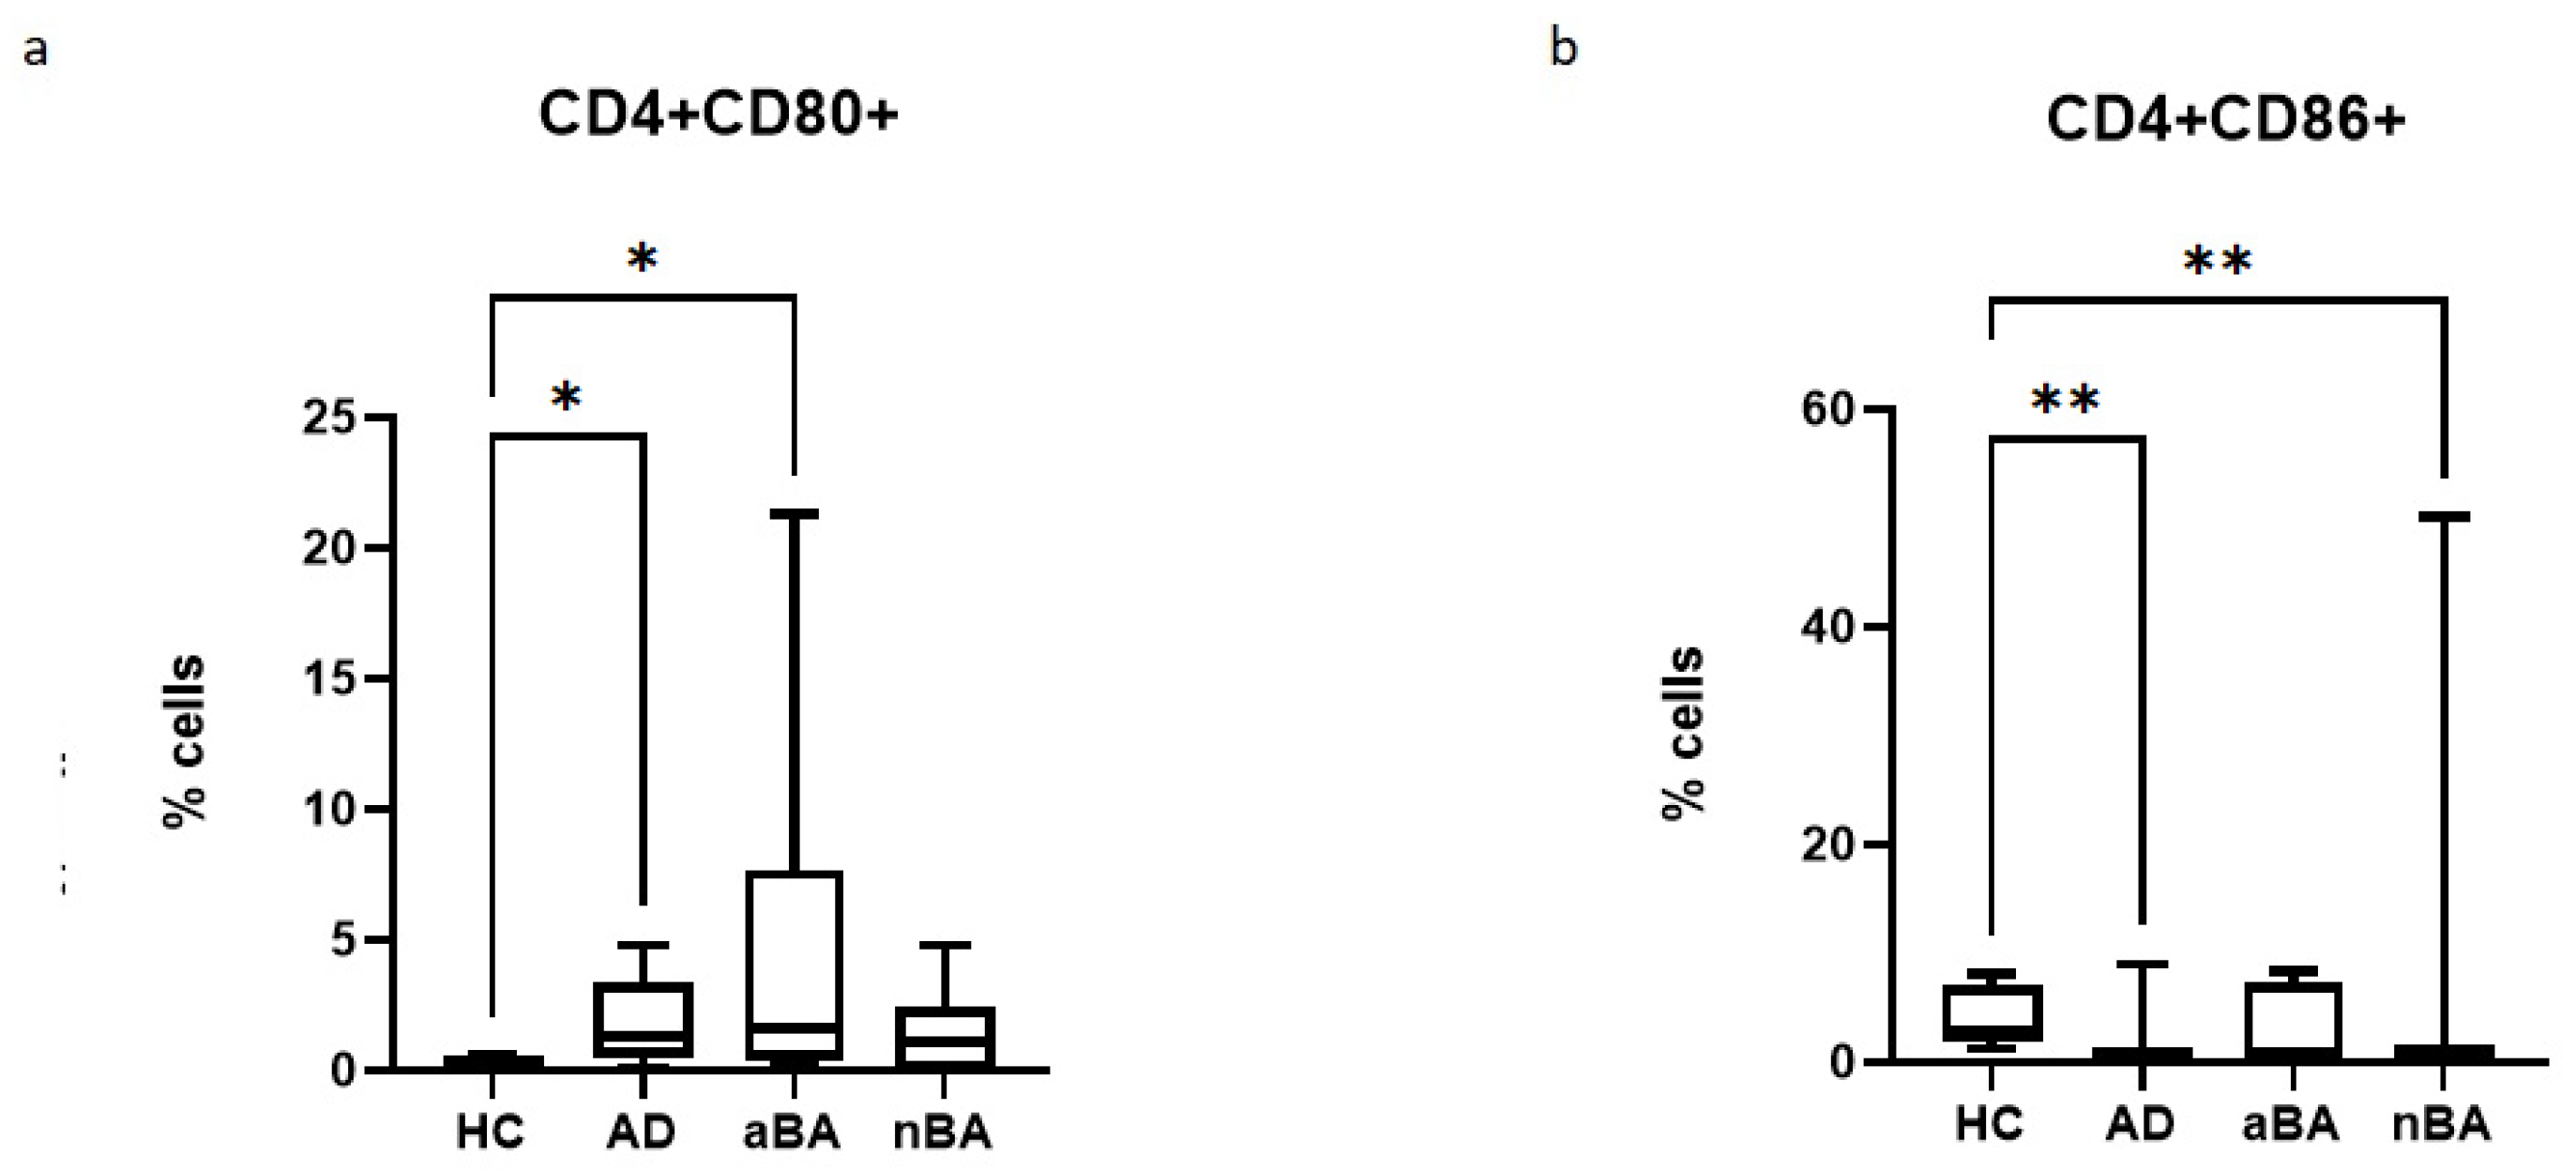
Figure 3.
Relative number of CD8+CD80+ and CD8+CD86+ cells in patients with T2-immune-mediated disease and healthy volunteers; HC—healthy control group, AD- atopic dermatitis, aBA—allergic bronchial asthma,nBA- non-allergic bronchial asthma; (a) relative number of CD8+CD80+, (b) relative number of CD8+CD86+. Data are presented as box-and-whisker plots, with boxes extending from the 25th to the 75th percentile, with a horizontal line at the median, while the whiskers extend to the lowest and highest data points. * Indicates a significant difference (p < 0.05). ** Indicates a significant difference (p < 0.01). *** Indicates a significant difference (p < 0.001).
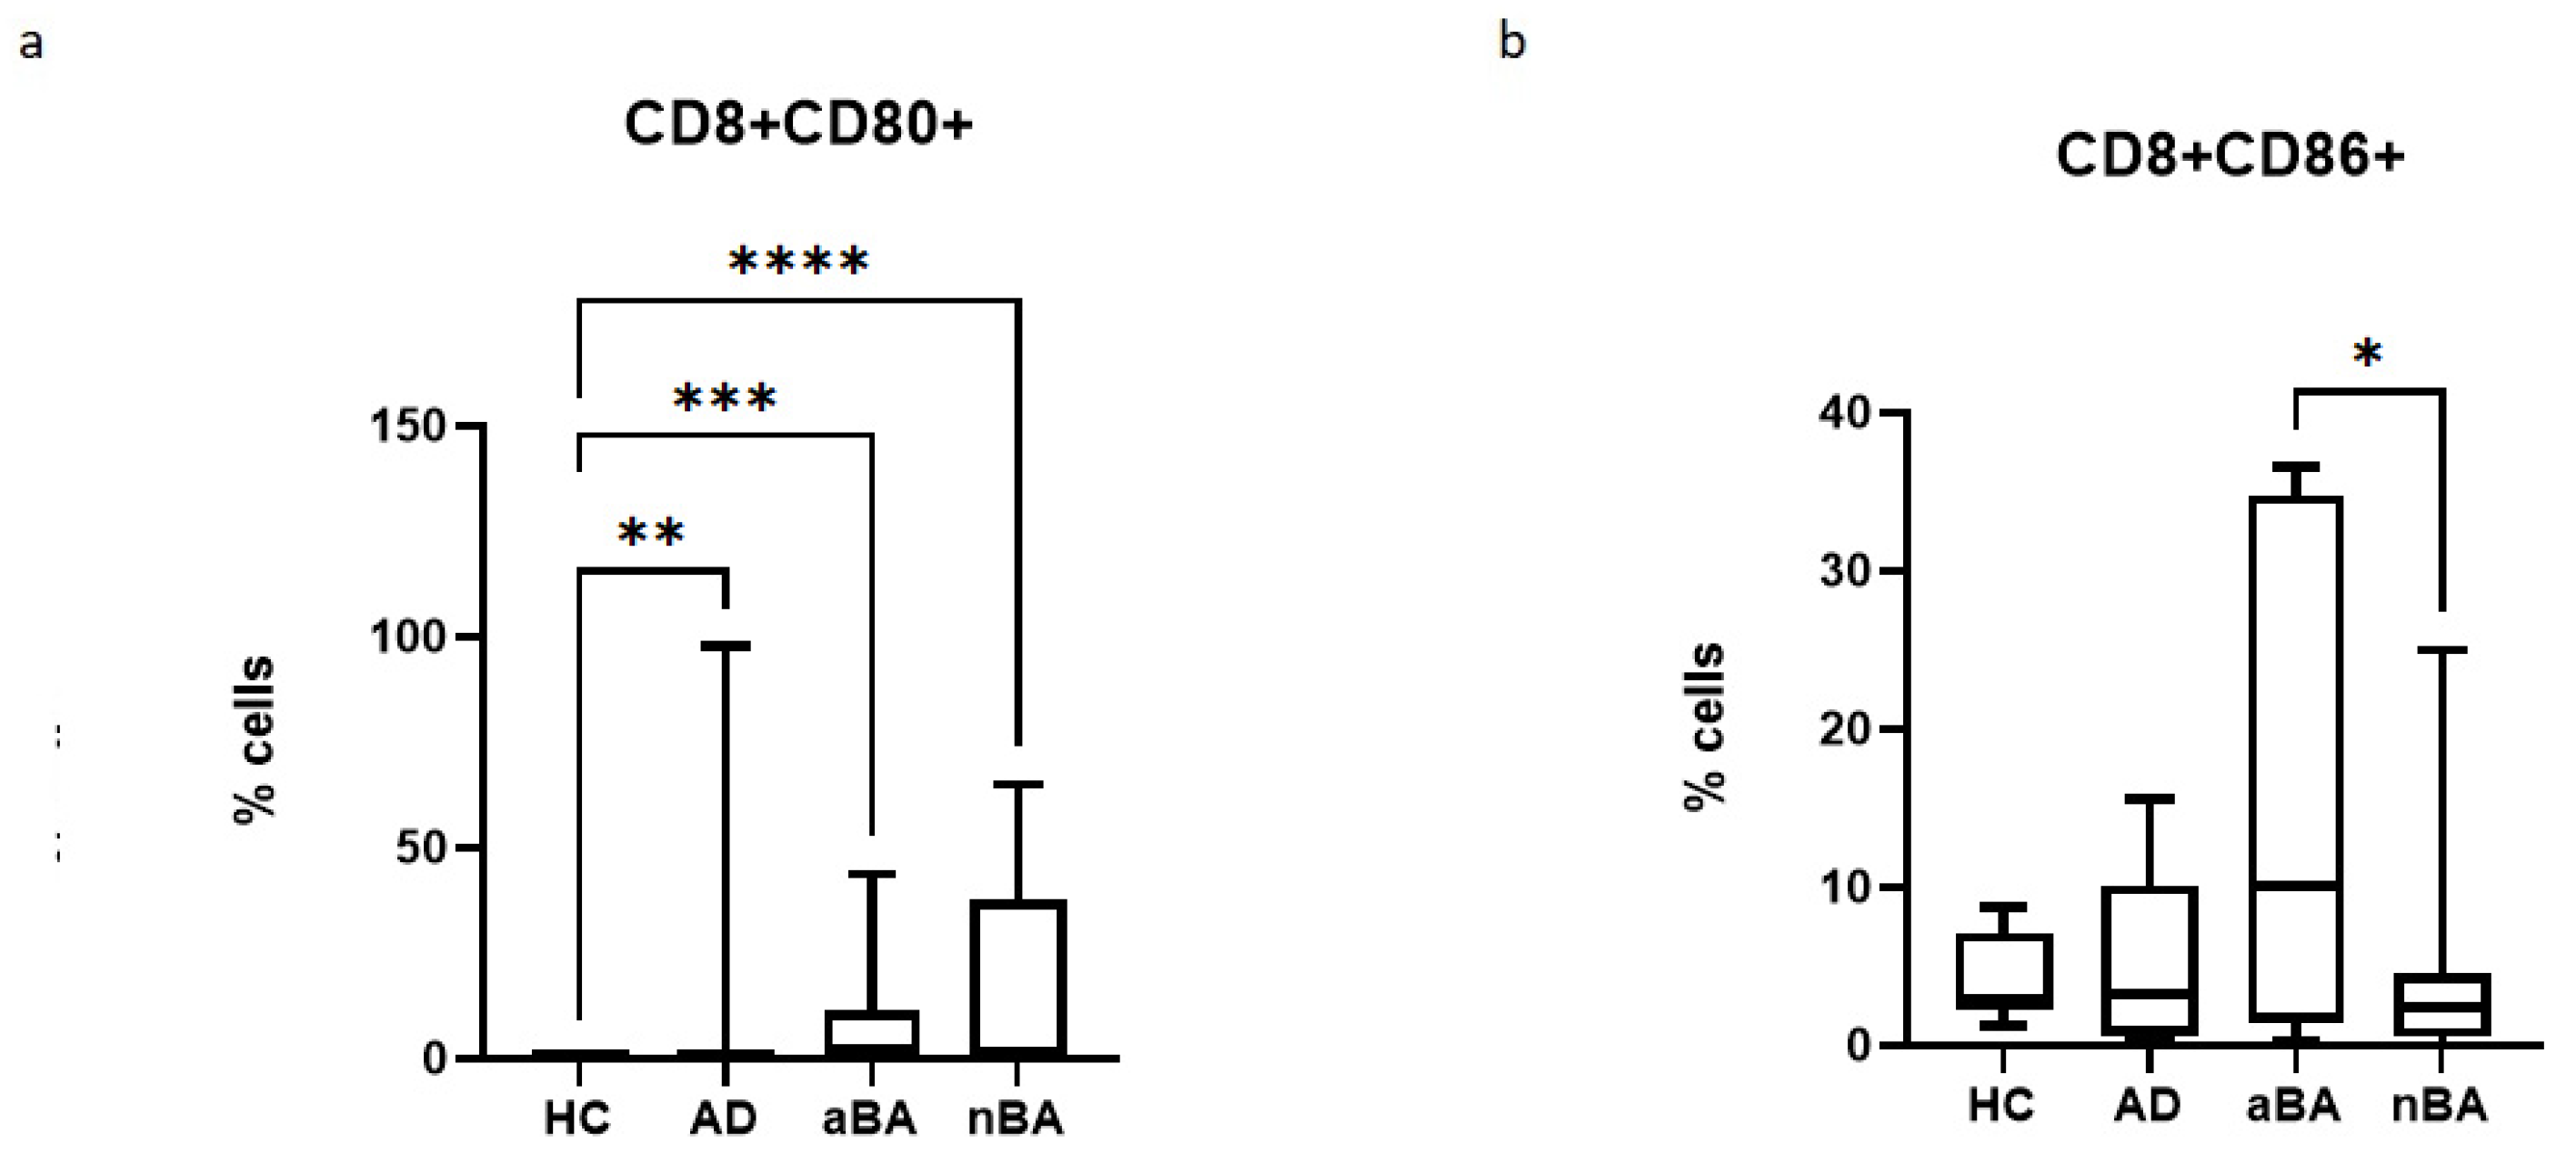
Figure 4.
Expression of CD80 and CD86 on different cells in patients with T2-immune-mediated disease and healthy volunteers; HC—healthy control group, AD- atopic dermatitis, aBA—allergic bronchial asthma,nBA- non-allergic bronchial asthma; Data are presented as box-and-whisker plots, with boxes extending from the 25th to the 75th percentile, with a horizontal line at the median, while the whiskers extend to the lowest and highest data points. * Indicates a significant difference (p < 0.05). ** Indicates a significant difference (p < 0.01). *** Indicates a significant difference (p < 0.001).
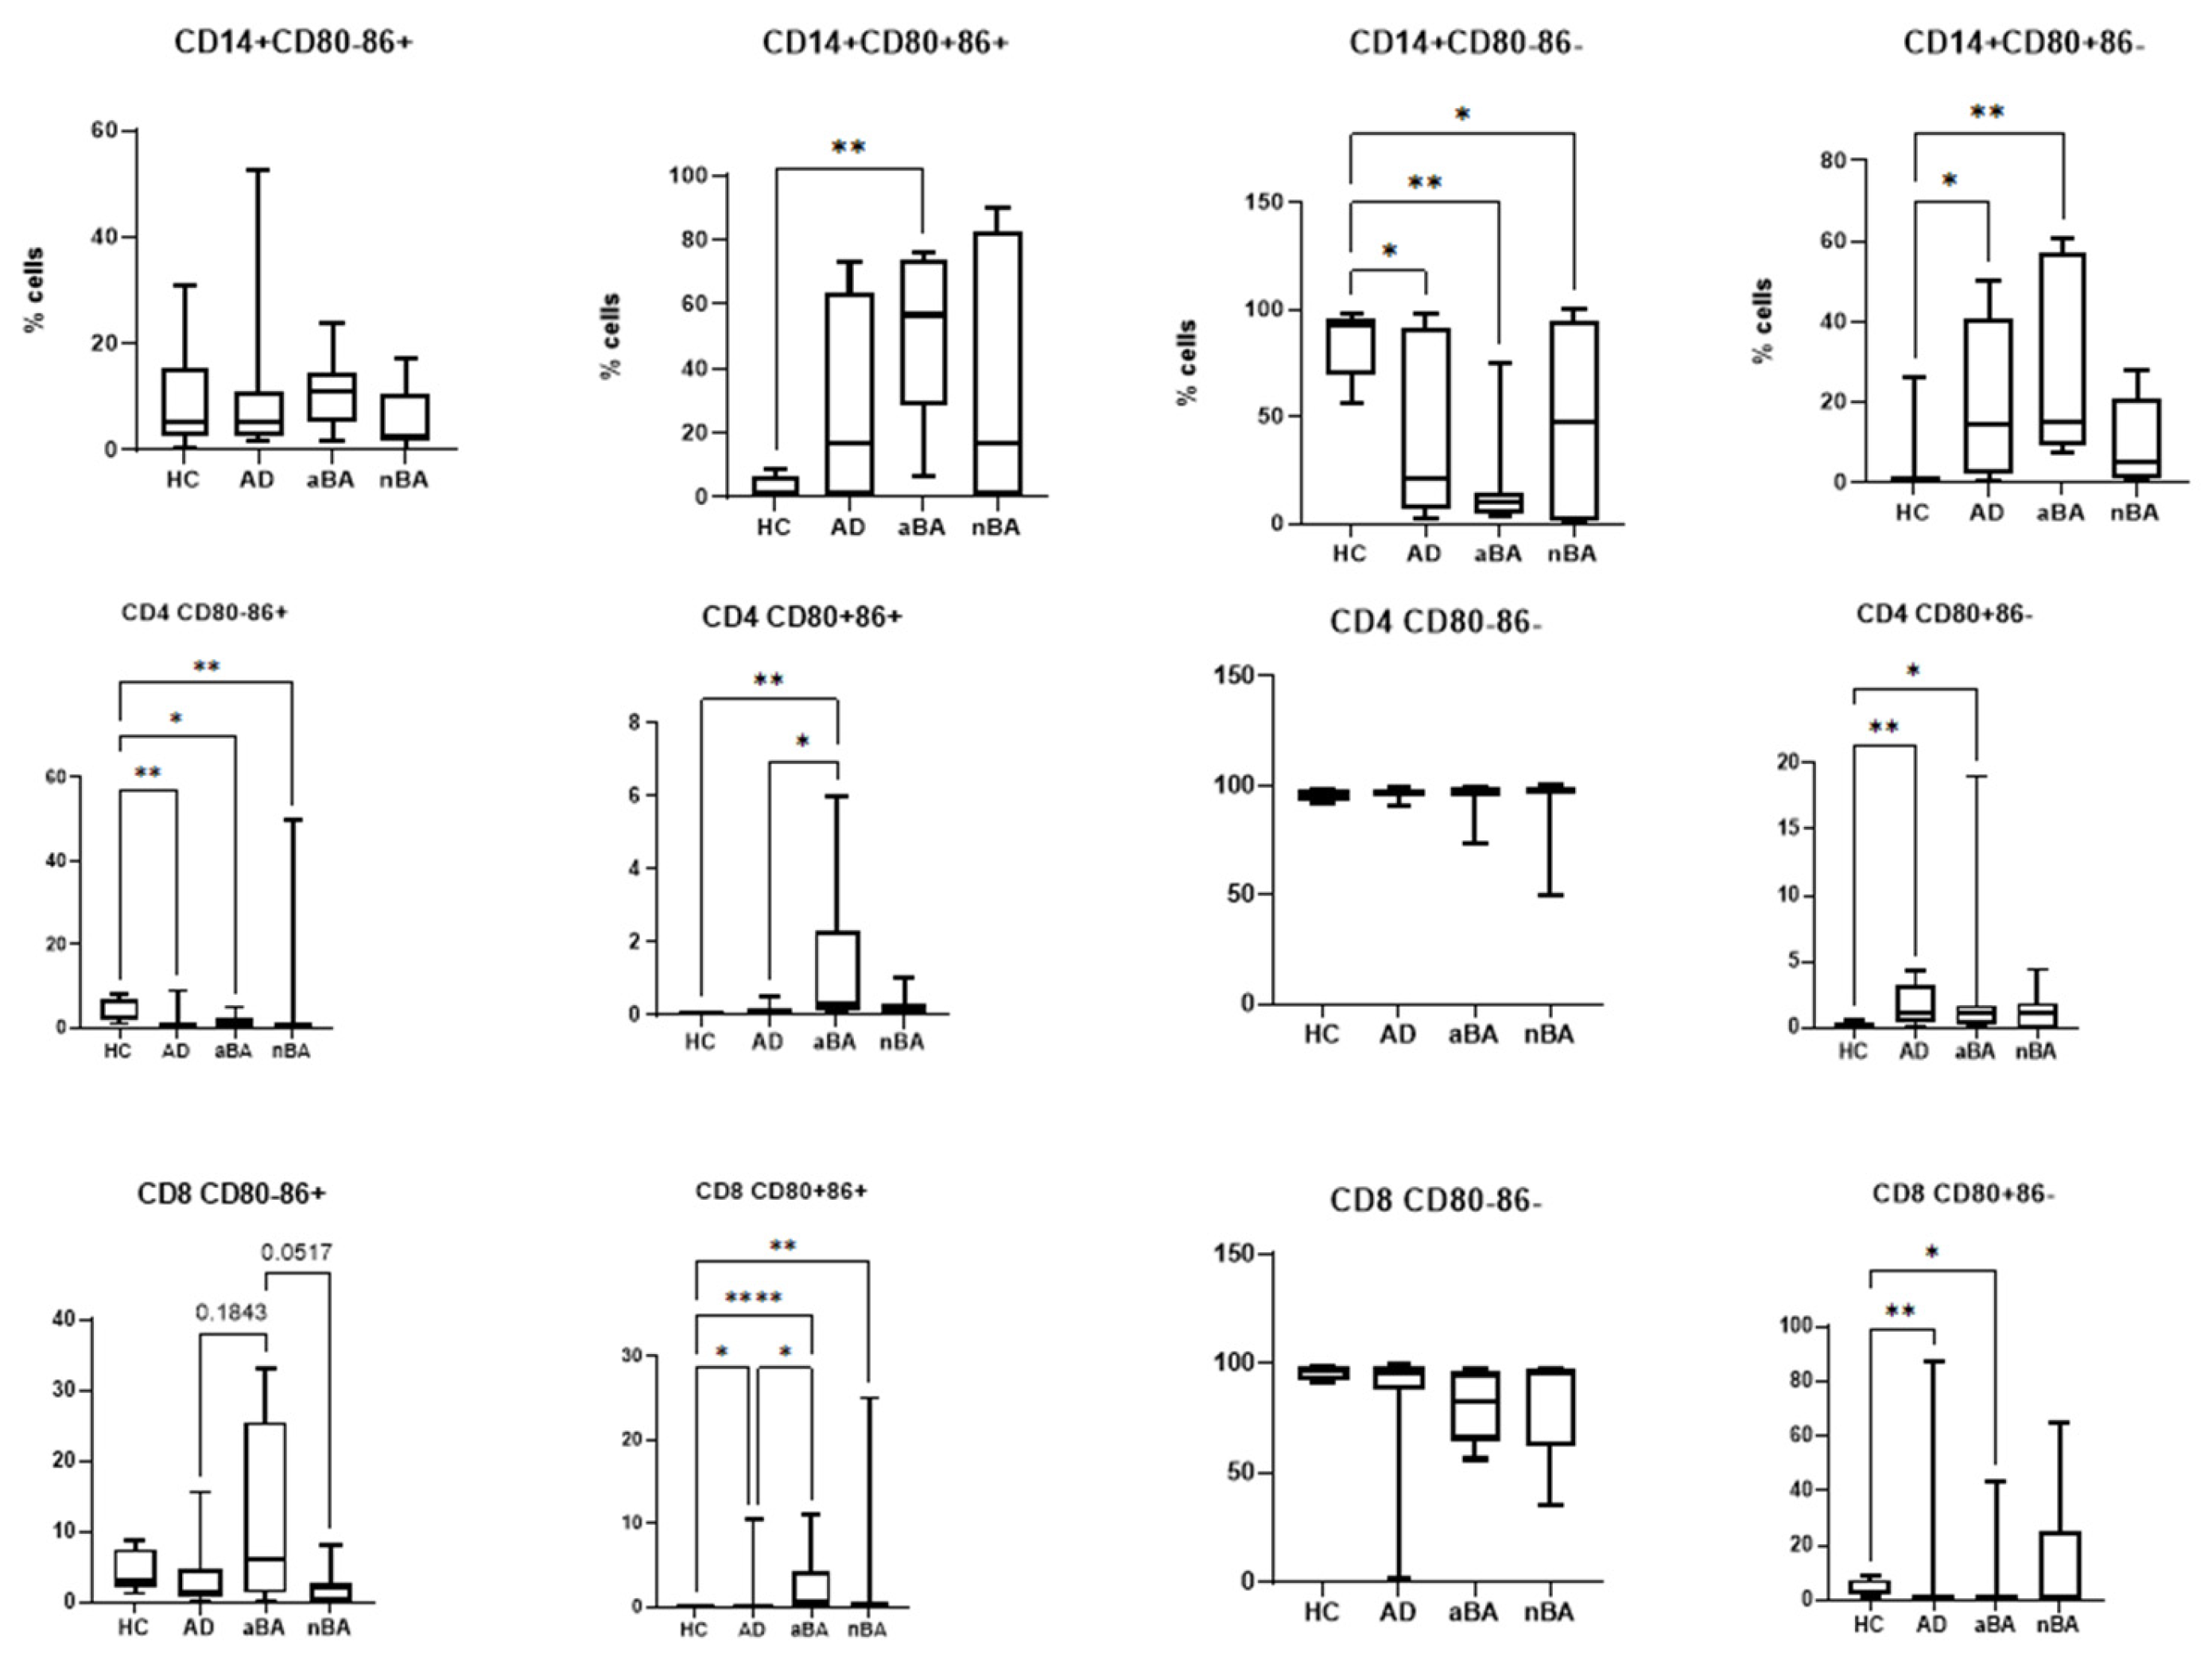
Figure 5.
Expression of CD80 and CD86 on monocytes in patients with T2-immune-mediated disease before and after therapy and healthy volunteers; HC—healthy control group, AD- atopic dermatitis, aBA—allergic bronchial asthma,nBA- non-allergic bronchial asthma; Data are presented as box-and-whisker plots, with boxes extending from the 25th to the 75th percentile, with a horizontal line at the median, while the whiskers extend to the lowest and highest data points. * Indicates a significant difference (p < 0.05). ** Indicates a significant difference (p < 0.01) . *** Indicates a significant difference (p < 0.001).
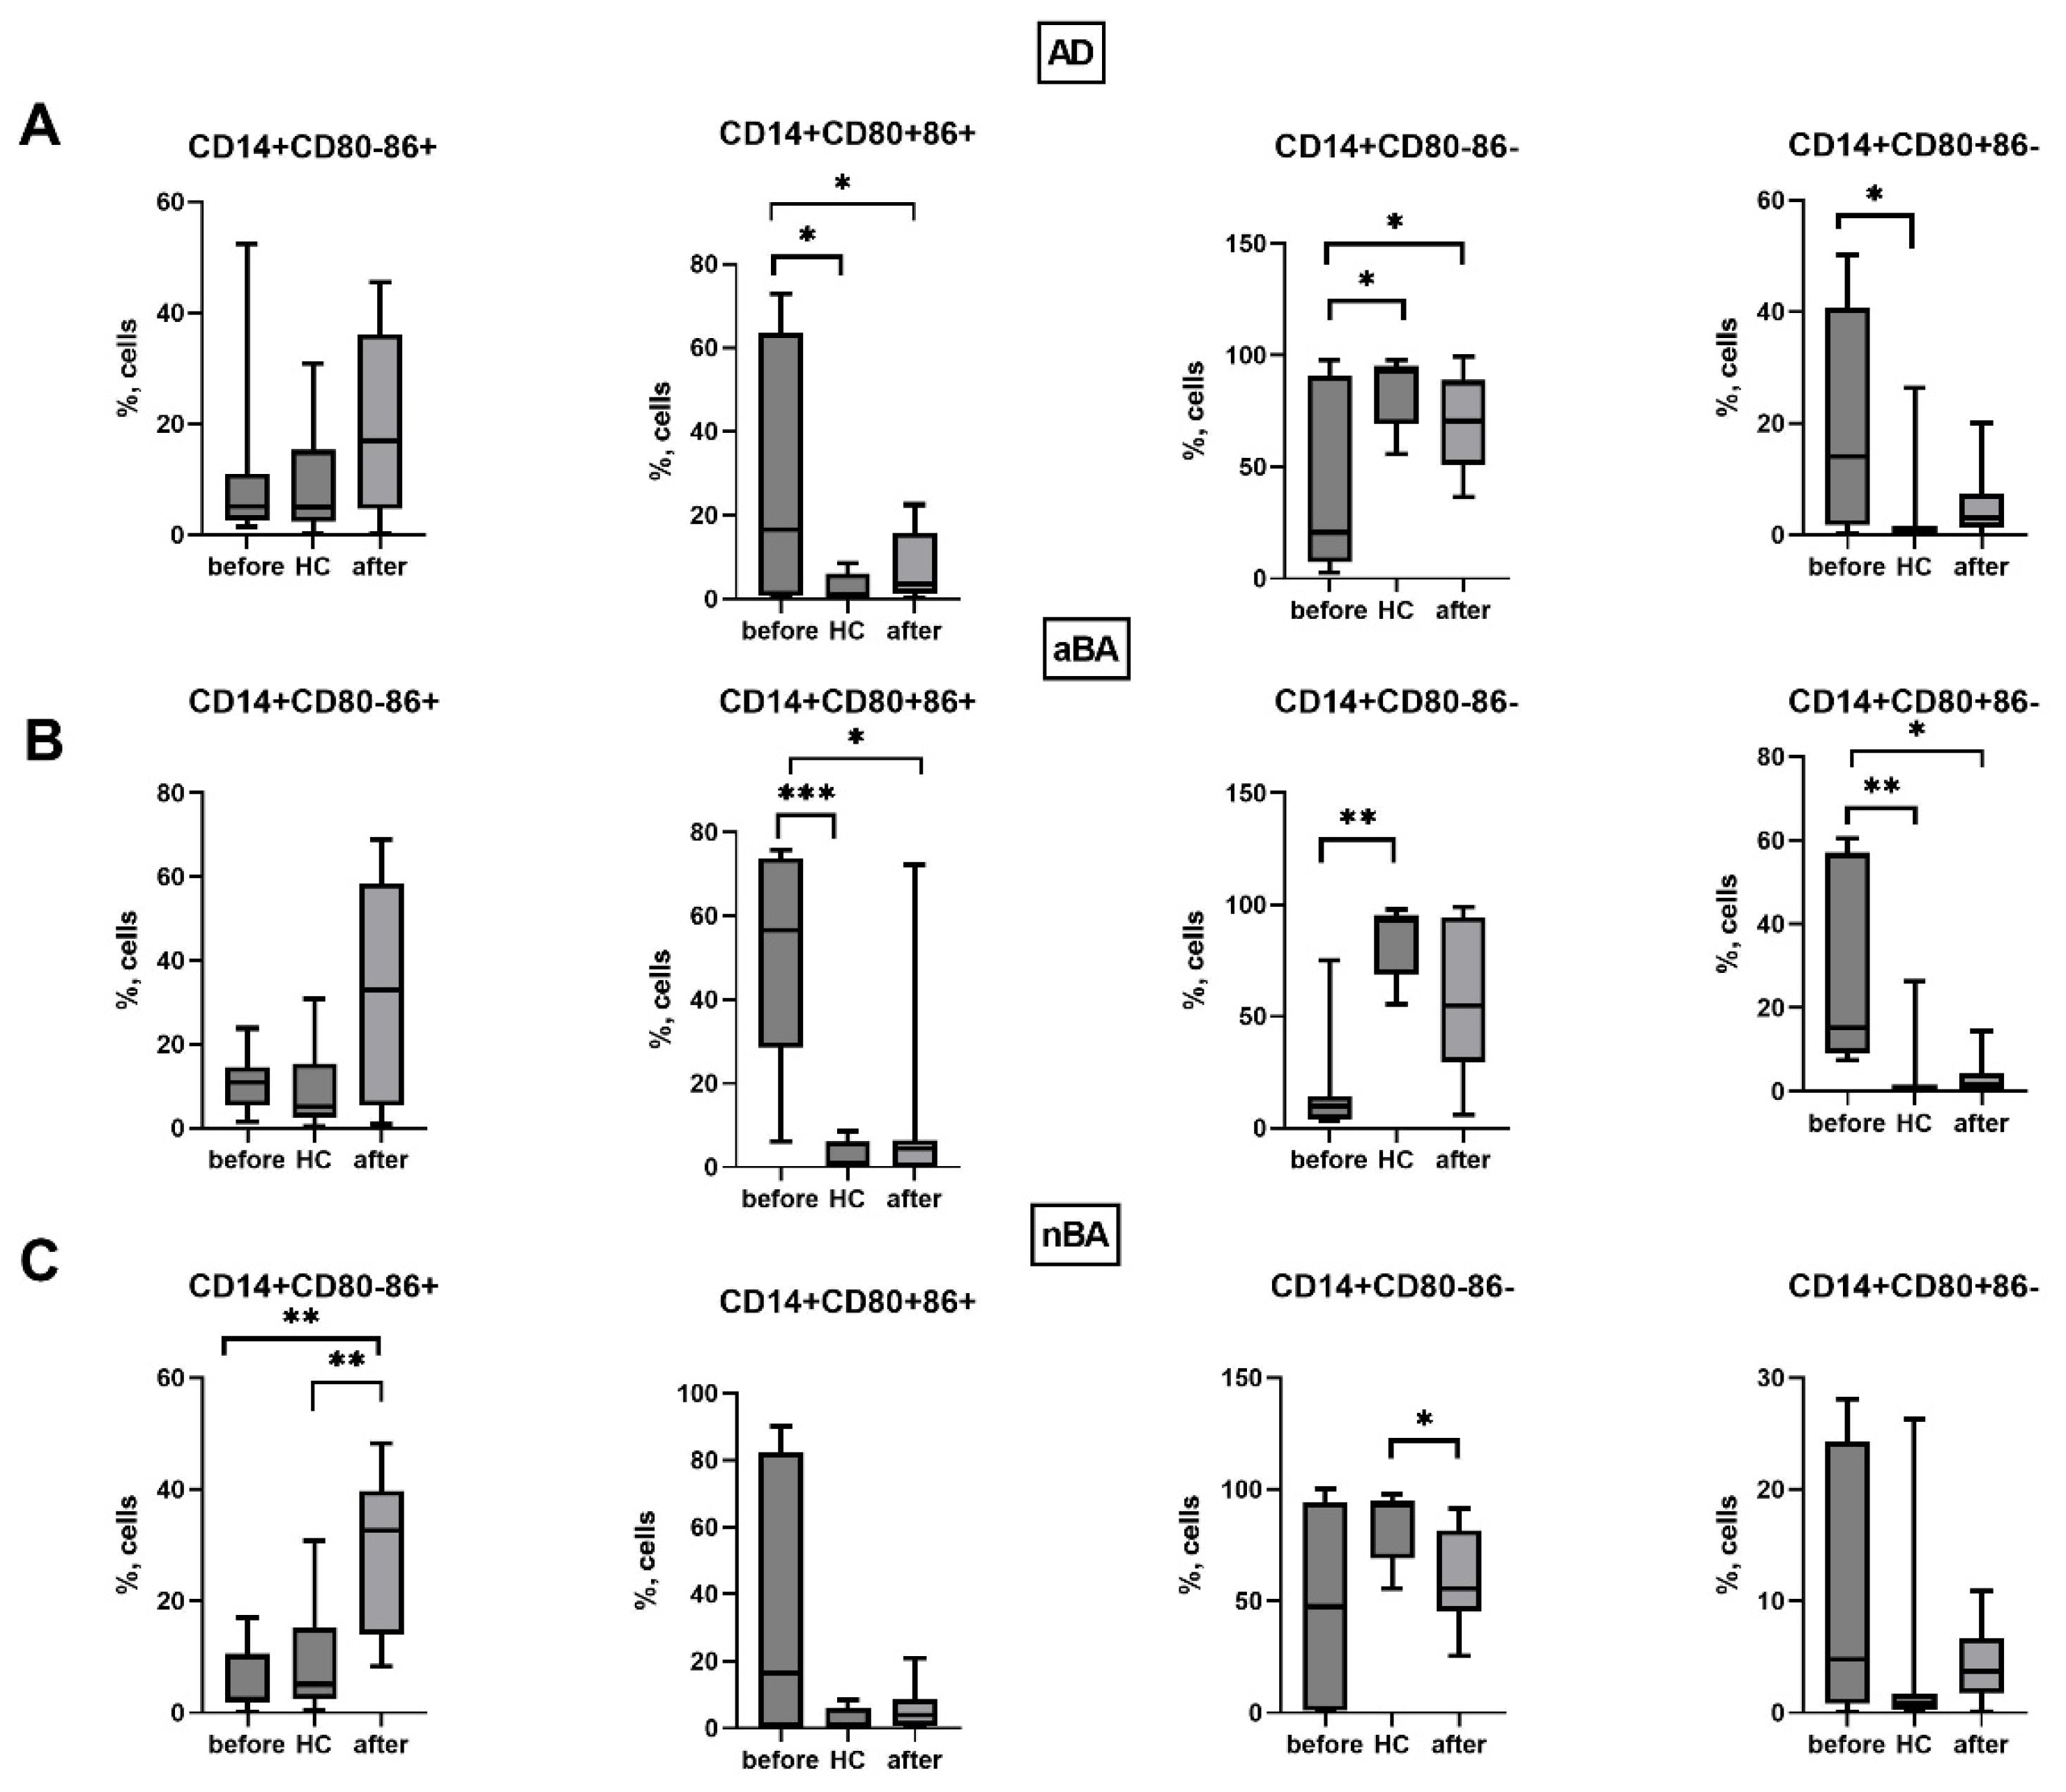
Figure 6.
Expression of CD80 and CD86 on T helpers in patients with T2-immune-mediated disease before and after therapy and healthy volunteers; HC—healthy control group, AD- atopic dermatitis, aBA—allergic bronchial asthma,nBA- non-allergic bronchial asthma; Data are presented as box-and-whisker plots, with boxes extending from the 25th to the 75th percentile, with a horizontal line at the median, while the whiskers extend to the lowest and highest data points. * Indicates a significant difference (p < 0.05). ** Indicates a significant difference (p < 0.01). *** Indicates a significant difference (p < 0.001).
Disclaimer/Publisher’s Note: The statements, opinions and data contained in all publications are solely those of the individual author(s) and contributor(s) and not of MDPI and/or the editor(s). MDPI and/or the editor(s) disclaim responsibility for any injury to people or property resulting from any ideas, methods, instructions or products referred to in the content. |
© 2025 by the authors. Licensee MDPI, Basel, Switzerland. This article is an open access article distributed under the terms and conditions of the Creative Commons Attribution (CC BY) license (http://creativecommons.org/licenses/by/4.0/).
Copyright: This open access article is published under a Creative Commons CC BY 4.0 license, which permit the free download, distribution, and reuse, provided that the author and preprint are cited in any reuse.


